Introduction
Jatropha curcas L. is a Euphorbiaceae plant that is considered native to Mexico (Souza et al., 2022; Steinmann et al., 2026) and nowadays widely distributed in the tropic zones (Neupane et al., 2021); it has gained interest because of the high oil content in its seeds, suitable for conversion into biofuels (Ovando-Medina et al., 2011; Zhou et al., 2025). However, the oil content in J. curcas seeds has shown high variation among accessions, for example, the Mesoamerican germplasm contains (in dry weight basis) between 8 - 54 % (Martínez-Herrera et al., 2010), while Asia and Africa accessions accumulate between 28 - 38.8 % (Kaushik et al., 2007), although other authors mention that the range is between 18.9 - 38.34 % (Ginwal et al., 2004; Naresh et al., 2012; Borah et al. 2021). In terms of seed oil composition, it has been found that the most prevalent fatty acids are: oleic (18:1), linoleic (18:2), stearic (18:0) and palmitic (16:0) (Martínez-Herrera et al., 2006; Booranasrisak et al., 2013; Wu et al., 2013; Borah et al., 2021). The high variation of oil content is regulated at several levels (genetic and environmental); however, the genetic effect is of greater importance (Wei et al., 2025). In order to take advantage of this high variation in seed oil content, it is important to analyze the molecular mechanisms of fatty acid biosynthesis and the accumulation of lipids during seed development (Voelker and Kinney, 2001).
Angiosperms store oil in the seeds as an energy source for embryo development during germination (Voelker and Kinney, 2001). The biosynthesis of fatty acids in the seeds is performed in the plastids of the endosperm cells, where carbon chains of fatty acids are lengthened by increments of two carbons (Liu et al., 2013; Wei et al., 2025). Previous studies have been carried out on the diversity of key enzymes in fatty acid biosynthesis in many plants, including J. curcas (Costa et al., 2010; Xu et al., 2011; Gu et al., 2012; Liu et al., 2013), although most of available information has been generated on Arabidopsis thaliana (Baud et al., 2009; Wu and Xue, 2010; Wei et al., 2025). The enzymes β-ketoacyl-acyl carrier protein (ACP) synthase I, II and III (from genes called KAS), are involved in the elongation of the acyl chain (Voelker and Kinney, 2001; Li et al., 2008; Wei et al., 2012; Liu et al., 2013). It has been reported that KAS genes exhibit differential expression during the course of seed oil development (Baud and Lepiniec, 2010; Xu et al., 2011; Gu et al., 2012).
In J. curcas has been showed that both oil content and fatty acid composition have high heritability (Kaushik et al., 2007; Gohil and Pandya, 2009; Ovando-Medina et al., 2011), having clearly differentiated chemotypes for these variables. The differential accumulation of oils in J. curcas chemotypes could be result of genetic rather than environmental factors, for that reason the objective of this study was to determine the relationship between KAS gene expression and the content and composition of seed oil in different J. curcas chemotypes.
Material and Methods
Study Site
Plants were obtained from the Germplasm Bank of Jatropha of the Instituto de Biociencias (IBC) of the Universidad Autonóma de Chiapas, located in the municipality of Tapachula, in Chiapas, Mexico (14.4976 N, 92.4774 W; 58 meters above sea level) in a soil type andosol containing 2.5 % of organic matter, with no crop management. The average temperature of the site is 34 °C, ranging from 28 to 38 °C) and the mean precipitation is of 1618 mm.
Biological Material
We analyzed five cloned plants of each of three chemotypes of J. curcas collected in Chiapas, Mexico: CAC-3, COM-1 and MAP-2. All are monoecious and accumulate different amounts of seed oil: 10 %, 30 % and 54 %, respectively. Seed oil accumulation has been stable during at least ten annual productive cycles and this characteristic is a strongly heritable trait in all three chemotypes (Ovando-Medina et al. 2011). The plants were manually self-pollinated by placing mature anthers onto the pistil of the female flowers of the same panicle at anthesis. Pollinated flowers were bagged with net bags (of 1 mm mesh), which were removed following confirmation of fertilization. Fruits were collected at six different stages of development (12, 18, 24, 30, 40 and 50 days after pollination (dap)), transferred to the laboratory on ice, washed with water and 70 % ethanol and stored at -30 °C until processing. Representative samples were taken to determine the moisture content, size and sphericity of fruits and seeds. To calculate sphericity this formula was used: S = (Lm x Lp1 x Lp2)0.333 x Lm-1, where S: sphericity, Lm: length (cm), Lp1: equatorial thickness (cm), Lp2: 2 equatorial width (cm) (Karaj and Müller, 2010).
RT-PCR of KAS Genes
Conversion of RNA to cDNA was performed by RT-PCR (reverse transcription in polymerase chain reaction) in one step, using specific primers for partial sequences of
KASI,
KASII and
KASIII genes. The constitutive gene
18S rRNA was used as a normalizer for the level of expression (
Table 1). The RT-PCRs were individual, that is, one for each gene/chemotype/stage of development. In all cases, the 5' oligonucleotide was labeled at the 5' end with the fluorescent molecule WellRed® D3 or D4 (Beckman Coulter®, USA). The reaction protocol consisted in mixing 100 ng of RNA template (measured with a NanoDrop® equipment), 25 U of reverse transcriptase M-MLV (200 U mm
-3 in 50 mM Tris-HCl buffer with 0.025mM of oligo (dT) and 0.25mM of poly(A); Promega®, USA), 2.5 mm
3 of ViBuffer® PCR buffer 10X (pH 9.1; Vivantis®, USA), 1.25 mm
3 of MgCl
2 (25 mM), 1 mm
3 of a dNTPs mix (10 mM each), 1 U of Taq DNA polymerase (GoTaq® Flexi DNA Pol, Promega®, USA), and 10 pmol of each oligonucleotide for
KAS genes (
Table 1). This was completed to 25 mm
3 with milli-Q® sterile water and placed in a thermocycler (Techne® TC 3000, UK), with the following protocol: 50 °C 2 min and 95 °C for 10 min, followed by 30 cycles of 95 °C for 15 s, 59 °C for 15 s and 72 °C for 32 s, followed by a final extension at 72 °C for 10 min and cooling at 4 °C.
Resolution of Amplicons
Detection of amplification products was performed using electrophoresis in polyacrylamide gel at 14% (80 V, 2 h). The gel was stained with ethidium bromide (10 min in 1 ng cm
-3 solution) and visualized on a Gel Doc® EZ Imager transilluminator (BioRad®, USA;
Figure 1). Amplified products were desalted by two precipitations with cold ethanol in the presence of 0.25 mm
3 of glycogen (20 mg cm
-3; Boehringer-Mannheim®, Germany). The samples were re-suspended in SLS (Sample Loading Solution, Beckman Coulter®, USA) buffer. The amplicons (the three
KAS genes and the
18S rRNA gene for each stage of development/chemotype) were subsequently resolved together by capillary electrophoresis on acrylamide. For this, 0.5 mm
3 of each of the amplified were mixed with 0.25 mm
3 of standard molecular size marker DNA 400 bp (Beckman Coulter®, USA), which contains fragments of between 60 bp and 400 bp labeled with fluorogenic Wellred® D1 (
Figure 2).
This was placed in the well of a plate, adjusted to 25 mm3 with SLS buffer and a drop of mineral oil added. The resolution of fragments was performed on a CEQ8000® (Beckman Coulter®, USA) equipment, with the following conditions: capillary temperature 35 °C, denaturation temperature of 90 °C, injection at 2.0 KV and separation for 60 min at 7.5 KV. Electropherograms obtained were analyzed with the program CEQ®8000 Genetic Analysis System version 9.0.25 (Beckman Coulter®, USA).
Extraction and Analysis of Seed Oil
The seeds (at least three seeds per replication) collected from the six stages of development were weighed and dried at 40 oC for 24 h. Then the seeds were homogenized and analyzed for oil content (% m/m), by Soxhlet method (920.39, AOAC 1997). Fatty acid composition was analyzed by preparing fatty acid methyl esters (FAMEs) and analyzing these by gas chromatography/mass spectrometry (Ovando-Medina et al., 2011).
Data Analysis
Both genetic and chemical studies were performed with five replicates. A replicate consisted of 1 g of seeds of each chemotype at each stage of development from an independent inflorescence. Based on the molecular size of each amplicon the control and
KAS genes were identified in the electropherograms generated (
Figure 2) and the area of each peak as an indicator of the level of gene expression was determined. The expression of each
KAS gene was calculated in percentage relationship to the
18S rRNA gene (semi-quantitative). The data for content of seed oil and for size and sphericity of the fruit and seeds were processed through of
ANOVA and mean comparison (Tukey α 0.05).
Correlation analyses were performed between the dynamics of KAS genes expression and the dynamics of seed oil accumulation in each chemotype. Considering the non-normality of the variables we use a Spearman test (α = 0.05; McDonald 2009). For these analyses, the data were matched in a de-phased approach: i.e., the genes expressions at 12 dap with the oil content to 18 dap, and so forth. In addition, we performed correlation analyses between the average gene expression data and the quantity and final composition of oil.
All statistical analyses were carried out with the software XLStat©.
Results
Fruit Development and Seed
Fruits were visible 12 days after pollination (dap). Fruit formation dynamics were similar in the MAP-2 and COM-4 accessions, while the CAC-3 had slower growth (
Figure 3). Fruit sphericity differed significantly among the chemotypes (
P = 0.038), with the CAC-3 accession showing a sphericity index close to 1 (0.972). MAP-2 produced ovoid fruits with sphericity of 0.882 and COM-4 had elongated fruits with sphericity of 0.881. Likewise, the chemotypes differed significantly in fruit equatorial diameter (
P = 0.008), with MAP-2 and COM-4 exhibit the highest value (3.54 cm and 3.52 cm, respectively) and CAC-3 the smallest (2.91 cm).
Although the ovaries of the three accessions have three locules with one ovule each, 90 % of CAC-3 fruits had only two seeds. The other two accessions usually formed three seeds per fruit.
Differences in the shape of the seeds (
P = 0.002) among chemotypes were found, as the MAP-2 and COM-4 accessions had elongated-ovoid seeds (sphericities of 0.608 and 0.620, respectively), while CAC-3 had ovobate seeds (sphericity of 0.693) due to greater equatorial diameter (
Figure 3). Accession CAC-3 also differed from the other two in the length of the seed, being significantly shorter (1.97 cm, compared to 2.22 cm for MAP-2 and 2.12 cm for COM-4;
P <0.0001). Notwithstanding the foregoing, the fresh mass of CAC-3 accession seeds (1.423 g each seed) was statistically the same (
P > 0.05) as those of the MAP-2 accession (1.358 g) and different (
P = 0.002) from those of COM-4 (1.182 g).
De-phased growth of locules in the ovary and seeds in the COM-4 accession was observed, since the fruit lengthened from the 24 dap, while the seeds completely occupied the locular cavity until 40 dap. In the other two accessions the dephased growth mentioned did not exist. Seed development began in the three accessions with the formation of liquid endosperm (90 % water), associated with a translucent white seed (
Figure 3). However, the MAP-2 accession endosperm became semi-solid (50 % moisture) from 24 dap, associated with a rapid increase in volume and testa development. The seed of this accession acquired solid consistency (30 % moisture) and a brown seed coat at 40 dap, completing its development at 50 dap (25 % moisture). Seeds of COM-4 accession acquired semi-solid (58 % moisture) consistency at 30 dap and, from that stage, the endosperm started becoming solid until culminating with 29 % water and black hard seed coat (50 dap). Seeds of CAC-3 accession maintained liquid consistency until 24 dap and at 30 dap humidity was 80 %; from this stage seed volume increased rapidly and the color changed to yellow so that at 40 dap the seed had 30 % water and 50 dap seed was fully developed with only 13 % water.
Pattern of Oil Accumulation in the Seed
The dynamics of oil accumulation in the studied chemotypes is shown in
Figure 4. Only MAP-2 presented sigmoidal dynamics with substantial increase from 24 dap. In the case of COM-4 the largest accumulation of oil was between 40 dap and 50 dap, without reaching a stationary phase during the study period. For CAC-3 gradual increase of oil content from 24 dap was observed, without exceeding the 10 % oil (w/w). For this variable, highly significant differences between chemotypes was found (
P = 0.0001) especially at end of seed development.
Relationship of KAS Gene Expression and Oil Content
The expression of
KASI,
KASII and
KASIII genes was found during all the time of seed development of all the chemotypes. In the MAP-2 and COM-4 chemotypes the highest expression of genes was found at 40 dap (
KASI of COM-4, at 50 dap), whereas for the chemotype CAC-3 this value reached 50 dap (
Figure 5). Respect to
18S rRNA expression level, the relative maximum values for
KASI,
KASII and
KASIII in the MAP-2 accession were 62.8 %, 63.5 % and 75.7 %, respectively, all at 40 dap; for accession COM-4 it was 61.3 %, 26.4 % and 71.3 %, the first at 50 dap and the remaining at 40 dap; and for the accession CAC-3 they were 34.4 %, 27.6 % and 82.5 %, all at 50 dap.
Spearman´s correlation analyses showed that, in MAP-2, the transcription profiles of the three KAS genes correlated significantly (P < 0.0001) to seed oil accumulation, as well as to each other. In COM-4, the transcription profiles of KASI and KASIII, but not that of KASII (P = 0.083), correlated with seed oil accumulation (P < 0.0001). The transcript profiles of the three KAS genes did not correlate among themselves in COM-4. In CAC-3, oil accumulation was correlated with the transcript levels of KASII and KASIII (P < 0.0001), but not with that of KASI (P = 0.133). The transcript profiles of the three genes did not correlate among themselves in CAC-3.
The transcript levels of
KASI and
KASII, among chemotypes, correlated positively and significantly (
P < 0.05) to the final amount of seed oil, but not to its composition.
KASIII correlated positively and significantly (
P < 0.0001) to the amount of palmitic acid (16:0), oleic acid (18:1) and saturated fatty acids, but not with the total amount of seed oil (
Table 2). The seed oil composition in the three chemotypes is shown in
Figure 6.
Discussion
The purpose of establishing J. curcas as a new crop is the production of oil in adequate quantities and with proportions of lipids suitable for the production of biofuels. Studies of the dynamics of fruit formation and on lipid biosynthesis and accumulation are therefore of great importance in the search for varieties that are best suited for planting.
The dynamics of COM-4 fruit development, in terms of size and shape were similar to that reported by Jiang et al. (2012) and Liu et al. (2013). The fruits of CAC-3 developed more slowly, were smaller and their seeds were more spherical, while the MAP-2 fruit developed rapidly were large and both fruits and seeds were ovoid. This fruit and seed phenotype had not previously described for J. curcas. There have been several recent studies on the synthesis of fatty acids, triglycerides assembly and the structure of oleosomes in J. curcas using germplasm collected in Asia, (Xu et al., 2011; Gu et al., 2012; Liu et al., 2013) where this species was introduced from America centuries ago. However, the lack of specific enzymes mutant and low genetic variability reported in Asian accessions, of J. curcas has limited studies on the dynamics of oil accumulation. The pattern of seed oil accumulation in MAP-2 chemotype was similar to that reported by Jiang et al. (2012), who reported up to 55 % oil at 39 dap in seeds without seed coat, this value would correspond to approximately 38% oil based on the whole seed, considering that the testa represents about 30 % of the seed weight (Martínez-Herrera et al., 2010). Similarly, Liu et al. (2013) reported 36 % oil at 40 days after flowering. The dynamics of accumulation of oil found in COM-4 and CAC-3, featuring a long latent period before accumulation have not been reported previously in J. curcas.
Our study had some technological limitations, for example, the samples were not freezed immediately after the collection, which allowed changes in the expression of genes during the transfer from the field to the laboratory. One of the most important and crucial issues is the use of semiquantitative RT-PCR for measuring levels of gene expression, because the use 40 cycles of PCR could have saturated the reaction. However, the experimental design ensured that all samples were treated in the same way, so the differences found are due to the differences among samples and not to their experimental handling. Transcript levels of
KASI,
KASII and
KASIII in MAP-2, COM-4 and CAC-3 (
Figure 6) at least partly explain the differential oil accumulation among the three chemotypes. It has previously been reported that
KAS genes are encoded at a single locus in the nuclear genome (González-Mellado
et al., 2010; Li
et al., 2008). Therefore, the difference in transcript levels among the three chemotypes (significant lower transcript levels of
KASII in COM-4 and CAC-3 that in MAP-2 and significantly lower transcript levels of
KASI in CAC-3 than in MAP-2 and COM-4) are not the results of differences in the gene copy number among the chemotypes. It is also assumed that the post-maturation processes of the mRNA of each gene (export, translation, post-translation and protein half-life) are similar, and are not altered among the studied chemotypes. The relative transcript level of
KASIII was similar in the three chemotypes studied, although its accumulation was delayed in CAC-3. This leads us to speculate that regulation and/or processing of the primary transcript (immature mRNA) is similar among the three chemotypes. The fact that final amount of seed oil did not correlate significantly with the transcript levels of
KASIII in the three chemotypes (only with its composition) suggests that the amount of the
KASIII gene product is not a limiting factor in oil accumulation.
There were much lower transcript levels of KASII in COM-4 and CAC-3 than in MAP-2, and much lower transcript levels of KASI in CAC-3 than in MAP-2 and COM-4. These differences could be the result of differential regulation of transcription and/or processing of the primary transcript among the chemotypes. Scarce studies have focused on the processes regulating the expression of genes involved in oil synthesis in plants. Several authors speculated that the transcriptional control could be similar to that of the yeast Saccharomyces cerevisiae (Schuller et al., 1992; Ohlrogge and Eccleston, 1996). In this sense, Lloyd et al. (1992) and Ohlrogge and Jaworski (1997) suggested the existence of global transcriptional signals that control expression. Recently, Jiang et al. (2012) demonstrated that the presence of transcription factors FUSCA2 (FUS2), INSENSITIVE-ABSCISIC ACID 3 and 4 (ABI3 and ABI4) and WRINKLED1 (WRI1), detected during the filling stage of J. curcas seeds were homologs of genes expressed during the synthesis of fatty acids in A. thaliana. Based on these findings, we proposed that the lower concentration of oil in COM-4 and CAC-3 chemotypes may be related to the positive or negative control of fatty acid synthesis by transcription factors. This notion is supported by a study of the A. thaliana mutant wriI, which presented drastically decreased fatty acids synthesis (Baud et al., 2009). Similarly results reported by Tai and Jaworski (1993), who found no increase in the accumulation of oil in KASIII gene over-expression in tobacco, show that in this plant (where KAS gene expression is similar) the excess mature transcript of KASIII protein or its reaction product are not regulators of subsequent stages in fatty acid synthesis.
The possibility that post-transcriptional processing (maturation) of the mRNA in KASII and KASI may be differential in chemotypes where less oil is accumulated is not discarded, although the knowledge of this phenomenon seems not to lead to such a case (Jiang et al., 2012).
Finally, the results of this study could be valuable for designing biotechnological strategies to improve the properties of this plant. For example, KASI and KASII could be over-expressed in low-seed oil content genotypes in order to explore cause-and-effect relationship between gene expression and oil accumulation in a more controlled manner.
Conflicts of Interest
Authors declare no conflicts of interest.
References
- Achten, WMJ; Verchot, L; Franken, YJ; Mathijs, E; Singh, VP; Aerts, R; Muys, B. Jatropha bio-diesel production and use. Biomass Bioenerg 2008, 32, 1063–1084. [Google Scholar] [CrossRef]
- Baud, S; Lepiniec, S. Physiological and developmental regulation of seed oil production. Prog Lipid Res 2010, 49, 235–249. [Google Scholar] [CrossRef] [PubMed]
- Baud, S; Wuillème, S; To, A; Rochat, C; Lepiniec, L. Role of WRINKLED1 in the transcriptional regulation of glycolytic and fatty acid biosynthetic genes in Arabidopsis. Plant J 2009, 60, 933–947. [Google Scholar] [CrossRef] [PubMed]
- Berchmans, HJ; Hirata, S. Biodiesel production from crude Jatropha curcas L. seed oil with a high content of free fatty acids. Bioresour Technol 2008, 99, 1716–1721. [Google Scholar] [CrossRef] [PubMed]
- Booranasrisak, T; Phaonakrop, N; Jaresitthikunchai, J; Virunanon, C; Roytrakul, S; Chulalaksananukul, W. Proteomic evaluation of free fatty acid biosynthesis in Jatropha curcas L. (physic nut) kernel development. Afr J Biotechnol 2013, 12, 3132–3142. [Google Scholar]
- Borah, N; Mapelli, S; Pecchia, P; Mudoi, K; Chaliha, B; Gogoi, A; Doley, A; Kotoky, R; Saikia, S. Variability of growth and oil characteristics of Jatropha curcas L. in North-east India. Biofuels 2021, 12(3), 327–337. [Google Scholar] [CrossRef]
- Costa, GLG; Cardoso, KC; Bem, LEV; Lima, AC; Cunha, MAS; Campos-Leite, L; Vicentine, R; Papes, F; Moreira, RC; Yunes, JA; Campos, FAP; Da-Silva, MJ. Transcriptome analysis of the oil-rich seed of the bioenergy crop Jatropha curcas L. BMC Genomics 2010, 11, 462. [Google Scholar] [CrossRef]
- Ginwal, BHS; Rawat, PS; Srivastava, RL. Seed source variation in growth performance and oil yieldof Jatropha curcas Linn. in Central India. Silvae Genet 2004, 53, 186–192. [Google Scholar] [CrossRef]
- Gohil, RH; Pandya, JB. Genetic evaluation of Jatropha (Jatropha curcas Linn.) genotypes. J Agric Res 2009, 47, 221–228. [Google Scholar]
- González-Mellado, D; Knowles, P; Garcés, I; Martínez-Force, E. The role of B-ketoacyl-acyl carrier protein synthase III in the condensation steps of fatty acid biosynthesis in sunflower. Planta 2010, 231, 1277–1289. [Google Scholar] [CrossRef]
- Gu, K; Yi, C; Tian, D; Sangha, JS; Hong, Y; Yin, Z. Expression of fatty acid and lipid biosynthetic genes in developing endosperm of Jatropha curcas. Biotechnol Biofuels 2012, 5, 47. [Google Scholar] [CrossRef] [PubMed]
- Heller, J. Physic Nut. Jatropha curcas L. Promoting the conservation and use of underutilized and neglected crops.1; Institute of Plant Genetics and Crop Plant Research: Rome, Italy, 1996; pp. 1–60. [Google Scholar]
- Jiang, H; Wu, P; Sheng, Z; Song, C; Chen, Y; Li, M; Jia, Y; Fang, X; Fan, C; Wu, G. Global analysis of gene expression profiles in developing physic nut (Jatropha curcas L.) seeds. PLOS ONE 2012, 7, e52803. [Google Scholar] [CrossRef] [PubMed]
- Karaj, S; Müller, J. Determination of physical, mechanical and chemical properties of seeds and kernels of Jatropha curcas L. Ind Crop Prod 2010, 32, 129–138. [Google Scholar] [CrossRef]
- Kaushik, N; Kumar, K; Kumar, S; Kaushik, N; Roy, S. Genetic variability and divergence studies in seed traits and oil content of Jatropha (Jatropha curcas L.) accessions. Biomass Bioenerg 2007, 31, 497–502. [Google Scholar] [CrossRef]
- Kumar, A; Sharma, S. An evaluation of multipurpose oil seed crop for industrial uses (Jatropha curcas L.): A review. Ind Crop Prod 2008, 28, 1–10. [Google Scholar] [CrossRef]
- Li, J; Li, MR; Wu, PZ; Tian, CE; Jiang, HW; Wu, GJ. Molecular cloning and expression analysis of a gene encoding a putative b-ketoacyl-acyl carrier protein (ACP) synthase III (KAS III) from Jatropha curcas. Tree Physiol 2008, 28, 921–927. [Google Scholar] [CrossRef]
- Li, H; Tsuchimoto, S; Harada, K; Yamasaki, M; Sakai, H; Wada, N; Alipour, A; Sasai, T; Tsunekawa, A; Tsujimoto, H; Ando, T; Tomemori, H; Sato, S; Hirakawa, H; Quintero, V; Zamarripa, A; Santos, P; Hegazy, A; Ali, A; Fukui, K. Genetic tracing of Jatropha curcas L. from its Mesoamerican origin to the World. Front Plant Sci 2017, 8, 1539. [Google Scholar] [CrossRef]
- Liu, H; Wang, C; Komatsu, S; He, M; Liu, G; Shen, S. Proteomic analysis of the seed development in Jatropha curcas: From carbon flux to the lipid accumulation. J. Proteomics 2013, 91, 23–40. [Google Scholar] [CrossRef]
- Lloyd, AM; Walbot, V; Davis, RW. Arabidopsis and Nicotiana anthocyanin production activated by maize regulators R and C1. Science 1992, 258, 1773–1775. [Google Scholar] [CrossRef]
- McDonald, JH. Handbook of biological statistics; Sparky House Publishing: Baltimore, MD, 2009; Vol. 2. [Google Scholar]
- Makkar, HPS; Becker, K; Schmook, B. Edible provenances of Jatropha curcas from Quintana Roo state of Mexico and effect of roasting on antinutrient and toxic factors in seeds. Plant Foods Hum Nutr 1998, 52, 31–36. [Google Scholar] [CrossRef]
- Martínez-Herrera, J; Martínez-Ayala, AL; Makkar, H; Francis, G; Becker, K. Agroclimatic conditions, chemical and nutritional characterization of different provenance of Jatropha curcas L. from Mexico. Eur. J. Sci. Res 2010, 39, 396–407. [Google Scholar]
- Martínez-Herrera, J; Siddhuraju, P; Francis, G; Dávila-Ortíz, G; Becker, K. Chemical composition, toxic/antimetabolic constituents, and effects of different treatments on their levels, in four provenances of Jatropha curcas L. from Mexico. Food Chem 2006, 96, 80–89. [Google Scholar] [CrossRef]
- Najafpanah, MJ; Sadeghi, M; Bakhtiarizadeh, MR. Reference genes selection for quantitative real-time PCR using RankAggreg method in different tissues of Capra hircus. PLOS ONE 2013, 8, e83041. [Google Scholar] [CrossRef] [PubMed]
- Naresh, B; Reddy, MS; Vijayalakshmi, P; Reddy, V; Devi, P. Physico-chemical screening of accessions of Jatropha curcas for biodiesel production. Biomass Bioenerg 2012, 40, 155–161. [Google Scholar] [CrossRef]
- Neupane, D.; Bhattarai, D.; Ahmed, Z.; Das, B.; Pandey, S.; Solomon, J.; Quin, R.; Adhikari, P. Growing Jatropha (Jatropha curcas L.) as a potential second-generation biodiesel feedstock. Inventions 2021, 6(4), 60. [Google Scholar] [CrossRef]
- Ohlrogge, JB; Eccleston, VS. Coordinate induction of pathways for both fatty acid biosynthesis and fatty acid oxidation in Brassica napus seeds expressing lauroyl- ACP thioesterase. Presented at Int. Symp. Plant Lipids, Toronto1996; 1996; 12th. [Google Scholar]
- Ohlrogge, JB; Jaworski, JG. Regulation of fatty acid synthesis. Annu Rev Plant Physiol Plant Mol Bio 1997, 48, 109–136. [Google Scholar] [CrossRef]
- Openshaw, K. A review of Jatropha curcas: an oil plant of unfulfilled promise. Biomass Bioenerg 2000, 19, 1–15. [Google Scholar] [CrossRef]
- Ovando-Medina, I.; Espinosa-García, F.; Núñez-Farfán, J.; Salvador-Figueroa, M. Genetic variation in mexican Jatropha curcas L. estimated whith seed oil fatty acids. Journal of Oleo Science 2011, 60, 301–311. [Google Scholar] [CrossRef]
- Ranade, SA; Srivastava, AP; Rana, TS; Srivastava, J; Tuli, R. Easy assessment of diversity in Jatropha curcas L. plants using two single-primer amplification reaction (SPAR) methods. Biomass Bioenerg 2008, 32, 533–540. [Google Scholar] [CrossRef]
- Riayatsyah, T; Sebayang, A; Silitonga, A; Padli, Y; Fattah, I.; Kusumo, F; Ong, H; Mahlia, T. Current progress of Jatropha curcas commoditisation as biodiesel feedstock: a comprehensive review. Frontiers in Energy Research 2022, 9, 815416. [Google Scholar] [CrossRef]
- Schuller, HJ; Hahn, A; Troster, F; Schutz, A; Schweizer, E. Coordinate genetic control of yeast fatty acid synthase genes FAS1 and FAS2 by an upstream activation site common to genes involved in membrane lipid biosynthesis. EMBO J 1992, 11, 107–114. [Google Scholar] [CrossRef] [PubMed]
- Souza, A.; Santos, A.; Laviola, B.G.; Teodoro, L.P.R.; Teodoro, P.E.; Rodrigues, E.V. Genetic diversity and population structure in Jatropha (Jatropha curcas L.) based on molecular markers. Genetic Resources and Crop Evolution 2022, 69(1), 245–254. [Google Scholar]
- Steinmann, V.W.; Gordillo, M.M.; Amezcua, Y.R.; Ramírez, J.J.; Cervantes, A. Euphorbiaceae: a jewel of Mexican biodiversity. Botanical Sciences 2026, 104(1), 257–294. [Google Scholar] [CrossRef]
- Tai, H; Jaworski, JG. β-Ketoacyl-acyl carrier protein synthase III from spinach (Spinacia oleracea) is not similar to other condensing enzymes of fatty acid synthase. Plant Physiol 1993, 103, 1361–1367. [Google Scholar] [CrossRef]
- Voelker, T; Kinney, AJ. Variations in the biosynthesis of seed-storage lipids. Annu Rev Plant Physiol Plant Mol Biol 2001, 52, 335–361. [Google Scholar] [CrossRef]
- Wei, Q; Li, J; Zhang, L; Wu, P; Chen, Y; Li, M; Jiang, H; Wu, G. Cloning and characterization of a b-ketoacyl-acyl carrier protein synthase II from Jatropha curcas. J. Plant Physiol 169, 816–824. [CrossRef]
- Wei, W; Wang, L; Tao, J; Zhang, W; Chen, S; Song, Q; Zhang, J. The comprehensive regulatory network in seed oil biosynthesis. Journal of Integrative Plant Biology 2025, 00, 1–20. [Google Scholar] [CrossRef]
- Wu, GZ; Xue, HW. Arabidopsis b-Ketoacyl-[Acyl Carrier Protein] Synthase I is crucial for fatty acid synthesis and plays a role in chloroplast division and embryo development. Plant Cell 22, 3726–3744. [CrossRef]
- Wu, P; Zhang, S; Zhang, L; Chen, Y; Li Jiang, H; Wu, G. Functional characterization of two microsomal fatty acid desaturases from Jatropha curcas L. J. Plant Physiol 2013, 170, 1360–1366. [Google Scholar] [CrossRef]
- Xu, R; Wang, R; Liu, A. Expression profiles of genes involved in fatty acid and triacylglycerol synthesis in developing seeds of Jatropha (Jatropha curcas L.). Biomass Bioenerg 2011, 35, 1683–1692. [Google Scholar] [CrossRef]
- Zhou, Y.; Fan, P.; Chen, S.; Wang, Z. Future Prospects for Jatropha curcas L. as a Bioenergy Crop: Assessing Land Suitability under Varying Climate Scenarios. Energy Nexus 2025, 100628. [Google Scholar] [CrossRef]
Figure 1.
Pattern of KAS gene expression (β-ketoacyl-acyl carrier protein synthase I, II and III) in a representative sample of Jatropha curcas MAP-2 chemotype at 40 days after pollination, obtained by RT-PCR. The reference gene was 18S rRNA. Samples were resolved on a 12% polyacrylamide gel. Molecular size marker is GeneRuler™ Low Range DNA Ladder (Fermentas™, Hanover, MD, USA).
Figure 2.
Electropherogram showing gene transcript levels in a representative sample of Jatropha curcas CAC-3 accession obtained by capillary electrophoresis using an automated fluorescence sequencer. Amplified cDNA fragments shown in green represent transcripts KAS genes (β-ketoacyl-acyl carrier protein synthase I, II, and III) involved in fatty acid biosynthesis. Fragment shown in blue represents the reference gene 18S rRNA. Standard molecular size markers (60-400 bp) are shown in red.
Figure 3.
Development of fruits and seeds in Jatropha curcas MAP-2, COM-4, and CAC-3 chemotypes after manual self-pollination using male and female flowers from the same inflorescence.
Figure 3.
Development of fruits and seeds in Jatropha curcas MAP-2, COM-4, and CAC-3 chemotypes after manual self-pollination using male and female flowers from the same inflorescence.
Figure 4.
Oil accumulation during seed development in three Jatropha curcas chemotypes. Different letters beside curves denote statistical differences among means (Tukey’s test, α = 0.05). Before the day 30 there were not differences among chemotypes.
Figure 4.
Oil accumulation during seed development in three Jatropha curcas chemotypes. Different letters beside curves denote statistical differences among means (Tukey’s test, α = 0.05). Before the day 30 there were not differences among chemotypes.
Figure 5.
Transcript profiles of KASI, II, and III encoding β-ketoacyl-acyl carrier protein synthase I, II, and III, respectively, during seed development in Jatropha curcas chemotypes MAP-2, COM-4, and CAC-3. Gene transcript levels are relative to that of 18S rRNA. Data are means of five biological replicates. DAP: days after pollination.
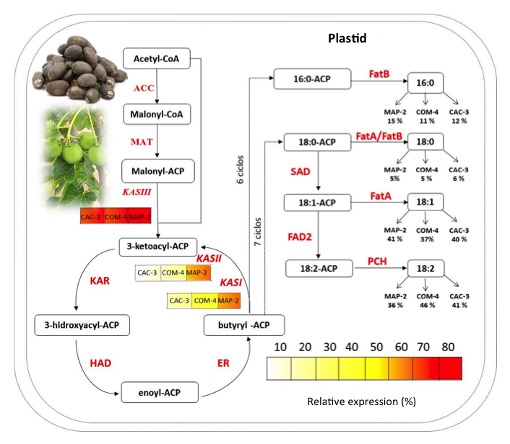
Figure 6.
Simplified scheme of fatty acid synthesis pathway in plants. Legends under KASI, KASII, and KASIII represent their respective transcript levels in three Jatropha curcas chemotypes at 40 days after pollination (DAP). Values under fatty acids show their percentage in seed oil at 50 dap in each chemotype. Abbreviations: ACC, acetyl-CoA carboxylase; MAT, malonyl-CoA transacylase; KAS III, β-ketoacyl-acyl carrier protein synthase III; KAR, keto-acyl-ACP reductase; HAD, hydroxyacyl-ACP dehydratase; ER, enoyl-ACP reductase; KASI, β-keto-acyl-ACP synthase; KASII, β-keto-acyl-ACP synthase; FatA, acyl-ACP thioesterase A; FatB, acyl-ACP thioesterase B; SAD, stearoyl-ACP desaturase; FAD2, Oleoyl desaturase 2; PCH, palmitoyl-CoA hydrolase. The pathway is modified from Costa et al. (2010).
Table 1.
Sequences of oligonucleotides used to amplify KAS and 18S rRNA genes cDNAs from Jatropha curcas seeds.
Table 1.
Sequences of oligonucleotides used to amplify KAS and 18S rRNA genes cDNAs from Jatropha curcas seeds.
| Gene Name |
Abbreviation |
Forward Primer
(5′ → 3′) |
Reverse Primer
(5′ → 3′) |
GenBank Accession Number |
| β-ketoacyl-acyl carrier protein synthase I* |
KASI |
GCCCTCCAATCCCCATCTAT |
TTTTAGTTGGAGGTTTCGTTGCA |
DQ987699 |
| β-ketoacyl-acyl carrier protein synthase II* |
KASII |
ACGTGCGCCAAGGAGAAC |
GCCCAGCGACTGAGTCTGTT |
DQ987700 |
| β- ketoacyl-acyl carrier protein synthase III* |
KASIII |
GCGGTTCGAAGTGGGAAA |
CCCAAGTTAGACCAGCTCCAAA |
DQ987701 |
|
18S ribosomal RNA** |
18SrRNA |
AGAAACGGCTACCACATC |
CCAAGGTCCAACTACGAG |
AY823528 |
*KAS gene primers were synthesized based on sequences reported by Xu et al., 2011.
**18S rRNA gene primers were synthesized based sequences reported by Najafpanah et al., 2013. |
Table 2.
Correlation matrix (Spearman) of KAS genes transcripts levels and five seed oil variables in three chemotypes of Jatropha curcas L.
Table 2.
Correlation matrix (Spearman) of KAS genes transcripts levels and five seed oil variables in three chemotypes of Jatropha curcas L.
| Variables |
KASI |
KASII |
KASIII |
Oil content |
Palmitic acid (16:0) |
Stearic acid (18:0) |
Oleic acid (18:1) |
Linoleic acid (18:2) |
| KASI |
- |
0.479 |
-0.416 |
0.828 |
0.461 |
-0.470 |
0.172 |
-0.349 |
| KASII |
0.072 |
- |
0.243 |
0.871 |
0.136 |
-0.139 |
0.300 |
-0.346 |
| KASIII |
0.124 |
0.378 |
- |
-0.471 |
0.839 |
0.346 |
0.632 |
-0.857 |
| Oil content |
0.000 |
0.050 |
0.078 |
- |
0.611 |
-0.529 |
0.293 |
-0.446 |
| Palmitic acid (16:0) |
0.084 |
0.625 |
< 0.0001 |
0.017 |
- |
-0.257 |
0.629 |
-0.793 |
| Stearic acid (18:0) |
0.079 |
0.621 |
0.204 |
0.045 |
0.354 |
- |
0.082 |
0.089 |
| Oleic acid (18:1) |
0.536 |
0.274 |
0.013 |
0.286 |
0.014 |
0.768 |
- |
-0.739 |
| Linoleic acid (18:2) |
0.203 |
0.206 |
< 0.0001 |
0.097 |
0.001 |
0.748 |
0.002 |
- |
|
Disclaimer/Publisher’s Note: The statements, opinions and data contained in all publications are solely those of the individual author(s) and contributor(s) and not of MDPI and/or the editor(s). MDPI and/or the editor(s) disclaim responsibility for any injury to people or property resulting from any ideas, methods, instructions or products referred to in the content. |
© 2026 by the authors. Licensee MDPI, Basel, Switzerland. This article is an open access article distributed under the terms and conditions of the Creative Commons Attribution (CC BY) license (http://creativecommons.org/licenses/by/4.0/).