
Submitted:
30 June 2025
Posted:
30 June 2025
You are already at the latest version
Abstract
Sea buckthorn is a vital woody oil species valued for soil conservation and bioactive seed oil rich in unsaturated fatty acids and other compounds. However, low oil content in the seeds and small seeds are the main bottleneck restricting the development and utilization of sea buckthorn. In this study, we tested seed traits of 12 sea buckthorn cultivars and identified the key genes and transcription factors involving in seed development and lipid biosynthesis by integration of UID RNA-seq (Unique Identifiers, UID), WGCNA and qRT-PCR analysis. Results identified five cultivars (CY02, CY11, CY201309, CY18, CY21) with significantly higher oil contents and five cultivars (CY10, CY201309, CY18, CY21, CY27) with significantly heavier seeds. A total of 10873 genes were significantly differentially expressed between S1 and S2 seed developmental stages of 12 cultivars. Response regulator (RRS-6), auxin response factor (ARF-7 and ARF-20) in the KEGG pathway of “Circadian rhythm – plant” and “Plant hormone signal transduction” were related to seed development. GPAT family, DGAT family and PDAT family in the KEGG pathway of “Glycerolipid metabolism” were related to lipid biosynthesis. WGCNA identified five modules related to seed oil content and seed weight/size, and 417 candidate genes were screened from these modules. In which, multiple hub genes and transcription factors were identified, such as ATP synthase, ATP synthase subunit D and Acyl carrier protein 1 were related to seed development; plastid-lipid-associated protein, acyltransferase-like protein, and glycerol-3-phosphate 2-O-acyltransferase 6 were involved in lipid biosynthesis, and transcription factors of Dof1.2, bHLH137 and ERF4 were associated with seed enlargement and development. These findings provide crucial insights into the genetic regulation of seed traits in sea buckthorn, offering targets for future breeding efforts aimed at improving oil yield and quality.
Keywords:
sea buckthorn
; seed development
; lipid biosynthesis
; UID RNA-seq
; WGCNA
Abstract
1. Introduction
Sea buckthorn (Hippophae rhamnoides L.), a perennial shrub or small tree belonging to the Elaeagnaceae family, mainly distributes in the temperate regions of the Eurasian continent [1]. As an important woody plant for soil and water conservation and desertification control, it could grow on marginal land such as sandy land, barren mountains and saline-alkali land, which can avoid land competition with field oil crops [2]. Sea buckthorn seed oil contains more than 140 bioactive components including unsaturated fatty acids, flavonoids, organic acids, alkaloids, sterols, triterpenes and various vitamins, which has high medicinal and edible value [3]. With the increase of global consumption of sea buckthorn seed oil, the demand gap is widening. The main reason of the low yield of seed oil of sea buckthorn is from its small seed and low seed oil content [4]. There are significant differences in seed size, grain weight, and seed oil content among different cultivars of sea buckthorn [5]. The mining and comparative analysis of key genes during the seed development of different cultivars of sea buckthorn may be helpful to understand the regulatory mechanism of seed development and lipid biosynthesis, which is of great significance to improve the yield and quality of its seed oils.
Seed size and oil content are crucial indexes in the evaluation of yield and quality in plants. To date, the genes regulating seed size and oil content have been identified in various plants, including Arabidopsis, soybean, maize and peanut. For example, through genome-wide association studies (GWAS) of over 1,800 soybean materials, GmST05 was identified; its overexpression and knockout in soybean significantly increased and decreased seed size, respectively [6]. Overexpression of GmAP2-1 and GmAP2-4 in soybeans could increase seed size and weight [7]. Overexpression of the AtSHB1 gene in Canadian rapeseed produced larger seeds [8]. Overexpression OsFBN1 increased the tiller number but decreased the panicle length, grain-filling percent and JA levels compared to the wild type and RNAi silencing lines under heat stress [9].
Transcription factors play a crucial role in regulating seed size and oil content. A zinc-finger transcriptional regulator overlapping with several seed weight quantitative trait loci (QTLs), known as GmPLATZ, was discovered to be essential in promoting seed weight/size in soybeans, and its overexpression obviously enhanced seed weight/size [10]. bHLH proteins were specifically expressed in seeds 5-20 days after flowering, leading to a maximum increase of 13.81% in grain weight in wheat and 18.55% in rice [11]. The expression patterns of the rice 16 Dof gene during seed development were different, indicating that the Dof gene might be involved in the ethylene and JA signaling pathways, thereby affecting grain filling and quality [12]. Overexpression of LuWRI1a increased seed weight/size, oil content in Arabidopsis and also increased seed oil reserves in transgenic flax [13]. The transcription factor inhibited the expression of downstream auxin genes, regulating silique cell wall development and seed weight in rapeseed [14].
Weighted gene co-expression network analysis (WGCNA) is an efficient method to analyze and mine high-throughput sequencing data, which can accurately identify hub genes, co-expression modules and regulatory networks that are essential for seed development and lipid metabolism [15]. In the WGCNA analysis, the genes between the samples were divided into modules according to a certain group of co-expressed genes, and then these modules and phenotype data were used to cluster and find the hub genes in the module. In soybean, 946 protein-related and 4,815 fatty acid-associated hub genes were identified by the WGCNA analysis, including known regulators like VPS35, ABI3b, and LEC1d homologs, as well as novel candidates potentially bridging WRI1 and LEAF networks for oil/protein accumulation [16]. Similarly, in peanut and maize, WGCNA linked seed weight/size traits to modules containing auxin-responsive ZmARF12 (a cell division repressor) and ribosomal/transcription factor (TF) hubs, demonstrating its power to uncover conserved and species-specific regulatory mechanisms governing seed composition and morphology [17,18].
High-throughput sequencing technology has been applied to identify key genes involved in seed development and lipid metabolism in sea buckthorn [19]. High-throughput RNA sequencing revealed dynamic gene expression patterns during sea buckthorn seed development, identifying 1,737 lipid metabolism-related unigenes and key regulators, such as delta9-desaturases (ACP-Δ9D), DGAT1, and WRI1 that orchestrate fatty acid biosynthesis and triacylglycerol accumulation [5,20]. Integrated small RNA and transcriptome sequencing further uncovered miRNA-transcription factor co-regulatory networks, including 27 miRNAs and 31 transcription factors linked to lipid synthesis and seed development, with critical hubs like miR164d-ARF2 and novelmiRNA-58-GPD1 modulating lipid precursors and seed oil content [21]. However, the genes associated with seed development and oil accumulation in sea buckthorn have yet to be systematically explored, and there is a paucity of research employing WGCNA to investigate genes associated with seeds development and oil accumulation in sea buckthorn.
In this study, seeds from 12 sea buckthorn cultivars at two developmental stages were collected, then UID RNA-seq and WGCNA analysis were performed to identify the key genes and transcription factors regulating seed development and lipid biosynthesis. Furthermore, candidate hub genes were identified through quantitative real-time PCR analysis. The detailed functional investigation of the networks and hub genes and transcription factors could further improve the understanding of the key genes that control seed development and lipid biosynthesis, which were significant for quality and yield improvement of sea buckthorn.
2. Results
2.1. Seed Traits
At the S1 developmental stage of seeds, the oil contents of ‘CY02’, ‘CY32’, ‘CY10’, ‘CY11’, ‘CY201309’, ‘CY18’ and ‘CY27’ were relatively higher than those of the other five cultivars (0~S1 vs. S1~S2), while the seed oil contents of ‘CY02’, ‘CY11’, ‘CY201309’, ‘CY18’ and ‘CY21’ were relatively higher than those of the other seven cultivars at the S2 stage (0~S1 vs. S1~S2) (Figure 1A). Compared to the S1 stage, the seed oil contents increased 1.05 to 1.51-fold for all the cultivars at S2 stage.
At the S1 stage, the values of TSW of ‘CY10’, ‘CY201309’, ‘CY18’, ‘CY21’ and ‘CY27’ were significantly higher than those of the other seven cultivars, while the values of TSW of ‘CY04’, ‘CY10’, ‘CY201309’, ‘CY18’, ‘CY21’ and ‘CY27’ were relatively higher than those of the other six cultivars at the S2 stage. From S1 to S2 stage, the values of TSW of each cultivars increased 1.02- to 1.81-fold (Figure 1B). The TD and LD values of ‘CY10’, ‘CY201309’, ‘CY18’, ‘CY21’ and ‘CY27’ seeds were larger than those of the other seven cultivars (Figure. 1C-D). The TD and LD values had a similar expression trend with thousand grain weight at developing seeds, namely higher TSW showed larger TD and LD.
2.2. Analysis of UID Transcriptome Data
In total, about 4.2 billion raw reads were generated, with an average of 59 million reads per sample. After removing adapter sequences, duplicated sequences, ambiguous reads and low-quality reads, a total of 492.01 Gb clean data were generated; 98.34-99.11 % of bases had a Q of ≥20, 94.08-96.40 % of bases had a Q of ≥30, and the reads had a 43.58–46.92% GC content. Genes with normalized reads lower than 0.5 RPKM were removed from the analysis. There were 10,662 unigenes (98.06%) annotated in the uniprotAc database, 6,749 unigenes (62.08%) annotated in the Refseq database, 6,759 unigenes (62.16%) annotated in the Pfam database, 9,649 unigenes (88.74%) annotated in the interpro database, 1325 unigenes (6.84%) annotated in the eggNOG database, 7,992 unigenes (73.50%) annotated in the Gene Ontology (GO) database and 1035 unigenes (9.52%) annotated in the KEGG database.
2.3. Identification of Differentially Expressed Genes and Functional Annotation
Differential expression analysis showed that 10873 DEGs were screened between S1 and S2 stages for 12 cultivars, which included 6,830 up- and 4,043 down regulated genes. The GO terms of DEGs related pathways belong to three categories: biological process (BP), cellular component (CC), and molecular function (MF) (Figure 2). For the BP ontology, the representational enriched terms were photosynthesis, monocarboxylic acid biosynthetic process and monocarboxylic acid metabolic process. For the MF ontology, the representational enriched terms were cofactor binding, oxidoreductase activity and lyase activity.
DEGs were mapped to the KEGG database and the enriched KEGG data were filtered (p < 0.05). According to the KEGG annotations, 26 KEGG pathways were significantly enriched in upregulated and downregulated, the DEGs were mapped to the reference canonical pathways in the KEGG database (Figure 3). As a result, a total of 1990 upregulated DEGs were enriched into 15 pathways. The upregulated DEGs significantly enriched in the pathway of “Stilbenoid, diarylheptanoid and gingerol biosynthesis”, “Photosynthesis - antenna proteins”, “Other types of O-glycan biosynthesis”, “Thiamine metabolism” and “Phenylalanine, tyrosine and tryptophan biosynthesis” (Figure 3A). A total of 354 downregulated DEGs were enriched into 11 pathways. The downregulated DEGs significantly enriched in the pathways of Spliceosome, Galactose metabolism, Carotenoid biosynthesis and Biosynthesis of unsaturated fatty acids (Figure 3B).
2.4. Differentially Expressed Genes (DEGs) Involved in Seed Development
A total of 99 DEGs associated with seed development were identified, including two abscisic acid (ABA) genes, two brassinosteroid insensitive 1 (BRI1) genes, five choline ethanolamine kinase (CEK) genes, two cellulose synthase A (CESA) genes, three cytokinin oxidase (CKX) genes, three DA1-related protein (DA1) genes, two fertilization independent endosperm (FIE) genes, three GRAS genes, four histone deacetylase (HDA) genes, five haiku (IKU) genes, four histidine phosphotransfer (HPT) genes, seven methyltransferase (MET) genes, 16 response regulators (RRS) genes, 10 scarecrow-like (SCL) genes, one shatterppoof (SHP) genes, two target of rapamycin (TOR) genes and 28 ubiquitin specific protease (UBP) genes, and the total RPKM of each transcript for these genes was greater than 20 (Supplementary Table S1). The heatmap of candidate genes related to seed development showed that most of these genes were highly expressed in both S1 and S2 stages of 12 cultivars (Figure 4). For five higher TSW cultivars (‘CY10’, ‘CY201309’, ‘CY18’, ‘CY21’ and ‘CY27’), the genes of RRS-6, MET-3 and HPT-2 highly expressed at the S1 stage, the SCL-5, HPT-4 and HAIKU-5 genes highly expressed at the S2 stage, and the genes of GRAS-2, GRAS-3, ABA-1, UBP-19, FIE-2, UBP-22, SCL-10, UBP-8 and UBP-24 highly at the S1 and S2 stages. The expression levels of above candidate genes appeared to have a similar trend for TD and LD in most cultivars.
A total of 31 transcription factors associated with seed development were identified, including 20 auxin response factor (ARF), one leafy cotyledon (LEC), eight nac transcription factor (NAC) and two transparent testa 1 (TT1). The heatmap of transcription factors related to seed development showed that most of these genes were expressed in both developmental stage S1 and S2 of 12 cultivars (Figure 4). For five higher TSW cultivars (‘CY10’, ‘CY201309’, ‘CY18’, ‘CY21’ and ‘CY27’), the ARF-7, ARF-18, NAC-4, ARF-9, ARF-20 and LEC highly at the S1 stage, the NAC-3 and ARF-1 highly expressed at the S2 stage, and the ARF-8, NAC-1 and ARF-17 highly expressed at the S1 and S2 stages. The above DEGs expression appeared to have a similar trend for TD and LD in most cultivars.
2.5. Differentially Expressed Genes (DEGs) Involved in Lipid Biosynthesis
A total of 78 DEGs associated with seed lipid biosynthesis were identified, including seven glycerol-3-phosphate dehydrogenase (GPD1) genes, 17 glycerol-3-phosphate acyltransferase (GPAT) genes, one lysophosphatidylcholine acyltransferase (LPCAT) gene, one lysocardiolipin and lysophospholipid acyltransferase (LCLAT) gene, three diacylglycerol acyltransferase 1 (DGAT1) genes, three phospholipid diacylglycerol acyltransferase (PDAT) genes, rive lecithin-cholesterol acyltransferase (LCAT) genes, two threonine-protein kinase BAM (BAM) genes, one phosphoglycerate mutase (PGAM) gene, seven oleosin (OLE) genes, 11 long chain acyl-CoA synthetase (ACSL) genes, six acyl carrier protein (ACP) genes and 14 ketoacyl-CoA synthase (KCS) genes (Figure 5). The total RPKM of each transcript for these genes was greater than 20 (Supplementary Table S2). The expression levels of OLE family genes exhibited significant differences between the S1 and S2, with a marked surge in expression levels at the S2 stage. The increase was particularly pronounced in some cultivars, for example, for the higher OC cultivars (‘CY11’ and ‘CY201309’), OLE-6 exhibited significant stage-specific expression differences, particularly in the CY11 and CY201309, in which its expression level at the S2 stage was 201-fold and 104-fold higher than that at the S1 stage.
The expression levels of GPD1-6 were the highest among GPD1 family genes, showing significantly higher values in most cultivars at the S1 stage, compared to S2. GPD1-2 exhibited significant stage-specific expression differences, particularly in the high oil content cultivar CY11, in which its expression level at the S1 satge was 40-fold higher than that at the S2 stage. Both GPAT-4 and GPAT-8 demonstrated elevated expression at the S1 stage, with their expression levels in CY11 being 46- and 47-times higher in S1 than in S2, respectively. In contrast, the DGAT gene family showed significantly higher expression at S2 compared to S1. ACSL2-2, ACSL4-1, and ACSL4-3 displayed relatively high expression levels at the S1 stage, and markedly decreased at the S2 stage. KCS-17 exhibited exceptionally high expression at the S1 stage, reaching levels 26-fold greater than those observed at the S2 stage. Conversely, KCS-10 and KCS-14 showed increased expression at the S2 stage in some cultivars. Notably, for the CY11 cultivar, the expression levels of ACP1-1 and ACP1-2 were dramatically reduced by 20-fold at the S2, compared to S1.
A total of 102 differentially expressed TFs were identified between S1 and S2 seed developmental stages of 12 cultivars. 12 transcription factors of LEC1-1, Dof-11, Dof-14, WRI1-3, FOXO-7, SPT6-1, AP2/ERF-3, Dof-3, AP2/ERF-1, WRI1-5, Dof-7 and FUS3 were upregulated in high oil content cultivars relative to other cultivars at the S1 stage. A total of eight transcription factors of SPT5-1, SPT5-2, SPT16-1, Dof-19, FOXO-8, FOXO-11, ABI4-1 and ABI4-2 were upregulated in high oil content cultivars relative to other cultivars at the S2 stage (Figure 6, Supplementary Table S3).
2.6. Co-Expression Network Analysis of DEGs by WGCNA
WGCNA analysis showed that the gene numbers of different modules varied greatly, ranging from 48 to 2389. A total of 17 different modules were identified (marked with different colors) (Figure 7), five of which was significantly associated with OC, TSW, TD and LD. The thistle1 module was significantly positively correlated with TSW (correlation coefficient r = 0.92), TD (r = 0.88) and LD (r = 0.73), the yellow4 module was significantly positively correlated with TD (r = 0.83), and the darkmagenta module was significantly positively correlated with TD (r = 0.80) (Figure 8).
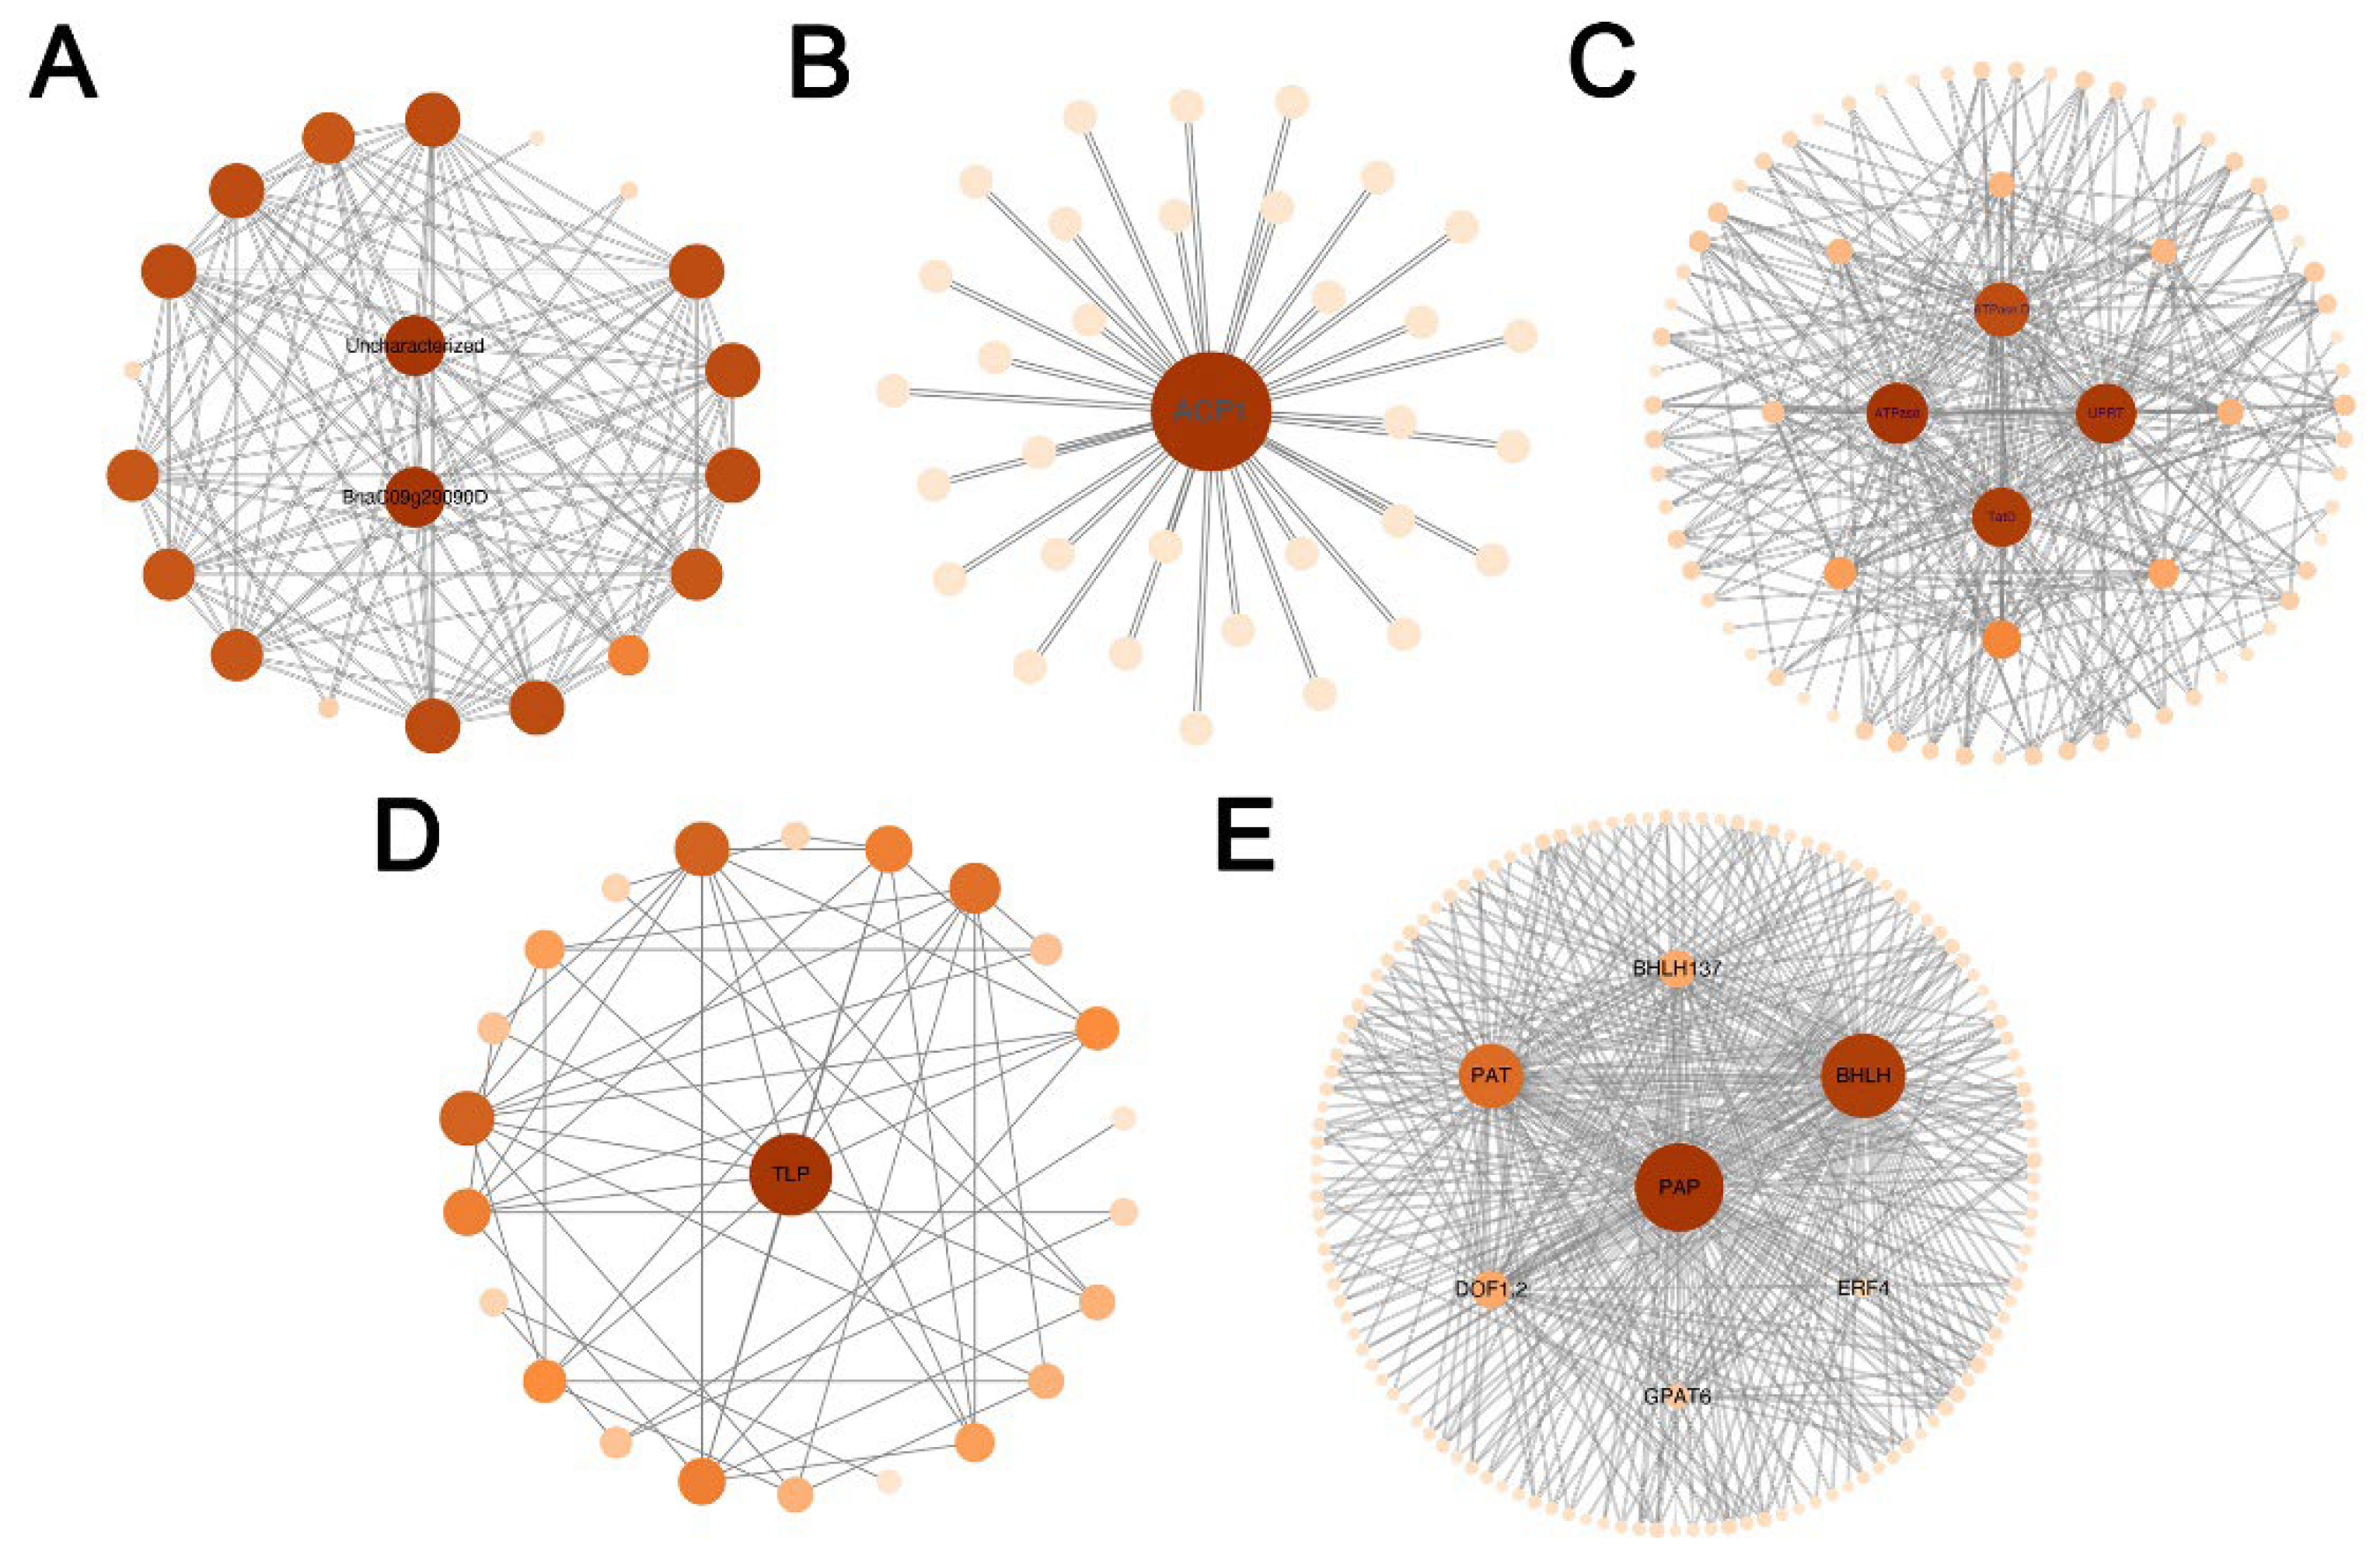
In the co-expression network of DEGs, 177 hub genes with the highest kme values (kME > 0.95) were screened in five modules (Figure 9). In which, some hub genes were involved in lipid metabolism, such as ACP1 (Hic_asm_3.979), PAP (Hic_asm_12.1324), PAT (Hic_asm_0.74), GPAT6 (Hic_asm_3.866) and transcription factors of DOF1.2 (Hic_asm_12.3128), bHLH (Hic_asm_0.1283), bHLH137 (Hic_asm_22.1742) and ERF4 (Hic_asm_3.2216) were associated with seed development.
2.7. qRT-PCR of key DEGs
According to the results of qRT-PCR analysis, the changes in the expression of selected 12 genes related to lipid biosynthesis and seed development showed a similar tendency, compared to the RNA-seq data (Figure.S1, S2), indicating that UID transcriptomic profiling data were highly reliable.
3. Discussion
3.1. Key Genes Associated with Seed Development
ATP enzymes play an important role in promoting plant growth and development, it is a key membrane protein responsible for maintaining the proton gradient and ion balance within cells, thus affecting cell expansion and growth [22]. ATPase boosts plant growth by improving photosynthesis via stomatal control [23], enhancing stress resilience (salt/drought) [24], modulating hormone signals [25], and increasing adaptation in transgenic plants [26]. In this study, ATPase (Hic_asm_12.2935) and ATPase D (hic_asm_22.1085) were identified as both DEGs and hub genes in “MEnavajowhite” module. The correlation coefficient with TSW, TD and LD were 0.68, 0.67 and 0.5, respectively. Our findings revealed up-regulation of ATPase (Hic_asm_12.2935) and ATPase D (hic_asm_22.1085) genes during S2 development, with heightened expression levels observed at CY10, indicating that ATP enzymes contribute to cell enlargement and seed development of sea buckthorn.
ACP protein plays an important role in seed oil and fatty acid metabolism, and affects seed development and maturation by regulating fatty acid synthesis and desaturation process. Overexpression of the ACP gene in Arabidopsis significantly alters the fatty acid profile in seeds, increasing the proportion of unsaturated fatty acids, thereby enhancing the quality of seed oils [27]. Studies have shown that ACP in Arabidopsis can regulate the metabolism of long-chain fatty acids, thereby affecting the plant’s response to low-oxygen conditions and seed development and maturation [28]. During the S1 stage of sea buckthorn seed development, expression level of ACP1 (Hic_asm_3.979) showed gradual upward trends, decreasing rapidly after the S2 stage. In the S1 stage of seed development, the expression of the ACP1 gene in CY02, CY201309 and CY18 were rapidly upregulated, which was consistent with the trends of TSW, TD, and LD increasing gradually at this stage. Our findings indicated that ACP contributes to seed development of sea buckthorn.
3.2. Key Genes Associated with Lipid Metabolism
The GPAT gene family plays an important role in lipid biosynthesis, in which GPAT6 primarily facilitates triacylglycerol (TAG) synthesis, a process critical for energy storage and membrane integrity [29,30]. The knockout mutant, gpat6, caused a massive reduction in seed production. The knockout mutant, gpat6, caused a massive reduction in seed production [31]. Secondly, GPAT6 acts in concert with other acyltransferases to regulate lipid components and affect the fatty acid profile of the plant (Chen et al., 2016). In this study, GPAT6 (Hic_asm_3.866) associated with lipid metabolism were identified as both DEGs and hub genes in module “MEthistle1”, its rapid increase was particularly pronounced in the higher OC cultivars (CY11, CY201309, CY18 and CY21). These indicated GPAT6 promote lipid synthesis and accumulation during sea buckthorn seed development.
The PDAT gene is involved in TAG synthesis and shows different substrate specificities in different plants, which further affects the quality and composition of oil [32]. In Brassica napus [33] and Gossypium [34], it was found that the content of oils and the proportion of specific fatty acids were significantly increased by overexpressing PDAT1 genes from other plants. Through functional studies of different acyltransferases, the scientists found that their interaction and substrate selectivity in vegetable oil synthesis have a significant impact on the final oil composition [35]. Certain acyltransferases exhibit a diversity of substrates during catalysis, which allows plants to synthesize a variety of different fatty acid derivatives, thus enriching the chemical composition of vegetable oils [36]. During the S1 stage of sea buckthorn seed development, expression level of PAT (Hic_asm_0.74) showed gradual upward trends, decreasing rapidly after the S2 stage. In the S1 stage of seed development, the expression of the PAT gene in CY10, CY201309, CY18 and CY21 were rapidly upregulated, which was consistent with the trends of TSW, TD, and LD increasing gradually at this stage. These suggests that PAT gene contributes the lipid biosynthesis in sea buckthorn seeds.
3.3. Key Genes Associated with Lipid Metabolism
Transcription factors (TFs) play pivotal roles in orchestrating seed development and grain weight determination. Among these, members of the bHLH family emerge as central regulators, governing seed size, shape, and developmental timing through stage-specific gene expression modulation and protein complex formation [37,38,39,40]. In our study, bHLH and bHLH137 showed significantly higher expression in CY201309. bHLH137 were upregulated in high TSW cultivars (CY201309 and CY27) relative to other cultiavars at the S1 stage. Notably, bHLH137 exemplified this functional significance in this study. Previous reports have found that its heterologous expression in Pyrus bretschneideri promoted cell expansion [41], while interactions with partners like PbGIF1 amplified its transcriptional activation capacity. Furthermore, bHLHs integrated hormonal signaling particularly auxin and gibberellin pathways to fine-tune seed development [42,43]. These multifaceted roles make bHLH proteins a major target for genetic improvement of seed traits.
ERF family transcription factors regulate seed size by interacting with stress-response networks and growth signals [44]. ERF4 embodied these two functions: It regulated fruit ripening by inhibiting ethylene biosynthesis genes (ACS1/ACO1) through JAZ-MYC2 interaction [45], while its overexpression induced cell expansion, a mechanism directly implicated in its role in seed development [46]. Thus, ERF proteins link environmental adaptation and developmental programs and may have enhanced seed weight under complex conditions. In summary, ERF4 may play multiple roles in regulating seed size and weight, involving transcriptional regulation and interactions with other growth factors.
The Dof zinc finger protein family plays an important role in plant growth and development [47,48]. They exhibit tissue-specific expression patterns linked to growth and stress resilience [49,50]. Studies on rice, soybean, and wheat have revealed their effects on root structure and abiotic stress tolerance [51,52], while transgene overexpression enhanced biomass and environmental adaptability [53,54,55]. The elevated expression of Dof1.2 in specific genotypes such as CY02 and CY201309 in this study highlights its potential role in pathways related to seed size and oil synthesis. Dof protein might be the hub for integrating cell expansion and oil accumulation. The results provide a new strategy for improving the seed traits of sea buckthorn.
4. Materials and Methods
4.1. Plant Materials
Twelve sea buckthorn cultivars (Hippophae rhamnoides L.) with different phenotypes in seed weight/size and oil content were selected in 2022 in an experimental field of Dryland Agriculture and Forestry Research Institute (N41°29’, E120°22’) in Liaoning province of China, including ‘CY04’, ‘CY03’, ‘CY02’, ‘CY32’, ‘CY10’, ‘CY11’, ‘CY201309’, ‘CY13’, ‘CY18’, ‘CY21’, ‘CY27’, and ‘SQH’. We collected the fruits of sea buckthorn at 30 and 60 days after flowering, considered as S1 and S2 development stage.
4.2. Determination of Seed Traits
The chloroform–methanol method was used to determine the oil content of sea buckthorn seed at two stages [56]. Five g freeze-dried seed powder (M1) was extracted with methanol and chloroform (v/v 1:2), then followed with vortexing or ultrasonication for 20 min. After three times of extraction, 1/5 volume of KCl solution (m/m: 0.9%) was added to the pooled extract. The mixture was vortexed for three minutes, then the solution was allowed to delaminate for 5 minutes. The bottom layer solution was collected into new glass sample bottles (M2) and evaporated to a constant weight (M3). Oil content (OC) was calculated by using the formula: oil content (%)=(M3-M2)/M1×100%. Three biological replicates were performed for each sample to determine oil content.
A total of 1000 intact seeds were randomly selected to measure thousand-seed weight (TSW), with visual inspection to exclude damaged or underdeveloped individuals. To ensure operational accuracy, seeds were divided into 10 subgroups of 100 seeds each. Each subgroup was weighed individually, and the total weight was calculated as the sum of all subgroups. Seed weight was determined using an analytical balance (Sartorius CPA225D, accuracy ±0.0001 g), calibrated daily with standard weights. TSW was calculated using the formula: TSW (g) = (Total weight of subgroups / Number of subgroups) × 10. Data were expressed as mean ± standard deviation (SD) from three independent replicates subgroup. The coefficient of variation (CV) was calculated to assess seed weight heterogeneity.
longitudinal diameters (LD) and transverse diameters (TD) were measured using a digital caliper (Mitutoyo 500-196-30, accuracy ±0.01 mm). LD was defined as the maximum longitudinal axis and TD as the maximum transverse axis perpendicular to length. Each seed was measured three times by the same operator, and the mean value was calculated to minimize operational error.
4.3. Total RNA Extraction, Library Preparation and UID Transcriptome Sequencing
Total RNA was extracted from developing seeds harvested at S1 and S2 stages using the Spin Column Plant Total RNA Purification Kit (Sangon Biotech, Shanghai, China). The extracted RNA was subsequently purified with the Dynabeads TM Oligo (dT) 25 mRNA kit (Thermo Fisher Scientific Baltics, UAB). The integrity of the RNA was verified through 1.5% agarose gel electrophoresis. Quantification of the qualified RNA samples was conducted using the Qubit 3.0 fluorometer with the Quant-iT RNA Assay Kit, Broad Range (Thermo Fisher, Q10213). For the preparation of stranded RNA sequencing libraries, 2 μg of total RNA was utilized, employing the KC-Digital Stranded mRNA Library Prep Kit for Illumina® (Catalog No. DR08502, Wuhan Seqhealth Co.). The kit mitigates duplication bias during PCR and sequencing processes by employing unique identifiers consisting of 8 random bases to label pre-amplified cDNA molecules. Library products ranging from 200 to 500 base pairs were subsequently enriched, quantified, and sequenced using the DNBSEQ-T7 sequencer (MGI Tech Co., Ltd., China) with the PE150 model.
The initial raw sequencing data underwent quality control using Trimmomatic (version 0.36), whereby low-quality reads were removed, and adaptor-contaminated reads were trimmed. Subsequently, the resulting clean reads were processed with proprietary scripts to mitigate duplication bias introduced during library preparation and sequencing. Specifically, the clean reads were initially clustered based on UID sequences, grouping reads with identical UID sequences into the same cluster. Within each cluster, reads were subjected to pairwise alignment, and those exhibiting sequence identity exceeding 95% were extracted into a new sub-cluster. Following the generation of all sub-clusters, multiple sequence alignment was conducted to derive a consensus sequence for each sub-cluster. Subsequently, any errors and biases introduced by PCR amplification or sequencing were mitigated. Functional annotation of unigene sequences was performed through comprehensive BLASTX (version 2.6.0+) alignment analyses against four major biological databases: the NCBI non-redundant protein database (Nr, release 2023-08) using an E-value threshold of 1e-5, the manually curated Swiss-Prot protein database (release 2023_07), the Kyoto Encyclopedia of Genes and Genomes pathway database (KEGG, version 102.0), and the evolutionary classification system of the Cluster of Orthologous Groups database (COG, updated 2023).
4.4. RNA-seq Data Analysis
Transcript or gene expression levels were quantified using RPKM (Reads per Kilobase per Million Reads) values, which normalize the counts of short sequences by accounting for read depth and transcript length. A pairwise transcriptome comparison was then performed between the control and experimental groups. DEGs (Differentially Expressed Genes) were conducted utilizing the Edge software. Genes exhibiting a false discovery rate (FDR) of less than 0.01 and a fold change of 2.0 or greater were deemed significantly differentially expressed between the control and experimental groups.
4.5. Kyoto Encyclopedia of Genes and Genomes (KEGG) Pathway Enrichment Analysis
The identified DEGs were subsequently annotated using the KEGG database [57], a prominent public resource for metabolic pathways and functional information on gene products (http://www.genome.jp/kegg). Pathway analysis was performed by comparing pathways significantly associated with DEGs to the genomic background. This comparison was achieved by calculating a P-value via the hypergeometric distribution, with adjustments for multiple testing accomplished through FDR correction. Concurrently, MapMan software was employed to enhance the intuitive visualization of DEGs within the metabolic pathway.
4.6. Weighted Gene Co-expression Network Analysis (WGCNA)
Utilizing input files containing RPKM values for all genes and phenotypic data from 24 samples, the WGCNA package in R software (Version 3.4.4) was applied to identify modules of highly correlated genes [58]. The resulting data were visualized using Cytoscape software (Version 3.6.1). The Pick Soft Threshold function was utilized to determine the optimal soft power, culminating in the construction of the co-expression network at a soft power of β=10. We designated a merge CutHeight parameter of 0.25 to consolidate distinct modules exhibiting a similarity exceeding 75%. Combining the transcriptomic and phenotypic data of 24 samples, WGCNA analysis of the modules was performed using r software. A cluster tree was plotted against the expression of genes, with high correlation among genes within the same cluster. Gene division modules were performed using a dynamic programming algorithm. Subsequently, genes demonstrating analogous expression patterns were amalgamated into the same module. We computed the kME (Module Eigengene) value to assess the effective connectivity among hub genes. In this investigation, modules with a kME value greater than 0.7 were selected, as these genes more accurately represent the overall expression trend of the module. Ultimately, hub genes and transcription factors within the module were identified based on the kME value and the degree of connectivity of the genes within the network.
4.7. Quantitative Real-Time PCR (qRT-PCR) Analysis
Total RNA was extracted from frozen developing seeds at S1 and S2 from 12 cultivars. Complementary DNA (cDNA) synthesis was conducted using 1 μg of total RNA with the HiScript II QRT SuperMix Kit (Vazyme, China), following the manufacturer’s protocol. qRT-PCR was performed in triplicate for three biological replicates. The expression levels of the target genes were normalized using the sea buckthorn genes UBQ5, as reference genes. Relative expression levels were determined using the 2−ΔΔCt comparative threshold cycle (Ct) method. All gene-specific primers utilized in this study are listed in Supplementary Table S4.
5. Conclusions
The seed oil yield of seabuckthorn depends on seed development and lipid biosynthesis. A total of 10873 genes were significantly differentially expressed between S1 and S2 seed developmental stages of 12 cultivars. RRS-6, ARF-7 and ARF-20 in the KEGG pathway of “Circadian rhythm – plant” and “Plant hormone signal transduction” were related to seed development. GPAT family, DGAT family and PDAT family in the KEGG pathway of “Glycerolipid metabolism” were related to lipid biosynthesis. WGCNA identified five modules related to seed oil content and seed weight/size, and 417 candidate genes were screened from these modules. In which, multiple hub genes and transcription factors were identified, such as ATPase, ATPase D and ACP1 of hub genes related to seed development, PAP, PAT, and GPAT6 of hub genes involved in lipid biosynthesis, as well as DOF1.2, bHLH137 and ERF4 of transcription factors associated with seed growth and development.
Supplementary Materials
The following supporting information can be downloaded at the website of this paper posted on Preprints.org. Figure S1: The quantitative real time polymerase chain reaction verification of twelve genes related to seed development and lipid biosynthesis. Figure S2: The quantitative real time polymerase chain reaction verification of twelve genes related to seed development and lipid biosynthesis. Table S1: The candidate genes involved in seed development. Table S2: The candidate genes involved in lipid biosynthesis. Table S3: The candidate genes involved in transcription factors. Table S4: Information of all primer sequence in qRT-PCR.
Author Contributions
Chengjiang Ruan designed the research. Siyang Zhao performed the experiments, analyzed the data, and wrote the manuscript. All the authors contributed to the article and approved the submitted version.
Funding
This research was supported by the International (Regional) Collaborative Research Project of NSFC-RSF (32261133521; 23-46-00026), the National Natural Science Foundation of China (32071799), the International (Regional) Cooperation and Exchange Project of NSFC-NRF (32111540255), the International Cooperation Plan Project of Liaoning Province (2023JH2/10700016), and the Project of Sea buckthorn Development and Management Center of the Ministry of Water Resources (2025-kj-020).
Acknowledgments
We thank Seqhealth Co. Ltd. (Wuhan, China) for the efficiently high throughput sequencing project.
Conflicts of Interest
The authors declare no conflicts of interest.
References
- Ruan, C.J.; Rumpunen, K.; Nybom, H. Advances in improvement of quality and resistance in a multipurpose crop: sea buckthorn. Crit Rev Biotechnol 2013, 33, 126–144. [Google Scholar] [CrossRef] [PubMed]
- Mei, D.; Ma, X.; Fu, F.; Cao, F. Research Status and Development Prospects of Sea buckthorn (Hippophae rhamnoides L.) Resources in China. Forests 2023, 14, 2461. [Google Scholar] [CrossRef]
- Yang, B.; Kalimo, K.O.; Tahvonen, R.L.; Mattila, L.M.; Katajisto, J.K.; Kallio, H.P. Effect of dietary supplementation with sea buckthorn (Hippophaë rhamnoides) seed and pulp oils on the fatty acid composition of skin glycerophospholipids of patients with atopic dermatitis. J Nutr Biochem 2000, 11, 338–340. [Google Scholar] [CrossRef] [PubMed]
- Ding, J.; Ruan, C.; Guan, Y.; Li, H.; Du, W.; Lu, S.; Wen, X.; Tang, K.; Chen, Y. Nontargeted metabolomic and multigene expression analyses reveal the mechanism of oil biosynthesis in sea buckthorn berry pulp rich in palmitoleic acid. Food Chem 2022, 374, 131719. [Google Scholar] [CrossRef]
- Ding, J.; Ruan, C.; Guan, Y.; Krishna, P. Identification of microRNAs involved in lipid biosynthesis and seed size in developing sea buckthorn seeds using high-throughput sequencing. Sci Rep 2018, 8, 4022–4036. [Google Scholar] [CrossRef]
- Duan, Z.; Zhang, M.; Zhang, Z.; Liang, S.; Fan, L.; Yang, X.; Yuan, Y.; Pan, Y.; Zhou, G.; Liu, S.; et al. Natural allelic variation of GmST05 controlling seed size and quality in soybean. Plant Biotechnol J 2022, 20, 1807–1818. [Google Scholar] [CrossRef]
- Jiang, W.; Zhang, X.; Song, X.; Yang, J.; Pang, Y. Genome-Wide Identification and Characterization of APETALA2/Ethylene-Responsive Element Binding Factor Superfamily Genes in Soybean Seed Development. Front Plant Sci 2020, 11, 566647. [Google Scholar] [CrossRef]
- Zhang, H.; Cheng, F.; Xiao, Y.; Kang, X.; Wang, X.; Kuang, R.; Ni, M. Global analysis of canola genes targeted by SHORT HYPOCOTYL UNDER BLUE 1 during endosperm and embryo development. Plant J 2017, 91, 158–171. [Google Scholar] [CrossRef]
- Li, J.; Yang, J.; Zhu, B.; Xie, G. Overexpressing OsFBN1 enhances plastoglobule formation, reduces grain-filling percent and jasmonate levels under heat stress in rice. Plant Sci 2019, 285, 230–238. [Google Scholar] [CrossRef]
- Hu, Y.; Liu, Y.; Lu, L.; Tao, J.J.; Cheng, T.; Jin, M.; Wang, Z.Y.; Wei, J.J.; Jiang, Z.H.; Sun, W.C.; et al. Global analysis of seed transcriptomes reveals a novel PLATZ regulator for seed size and weight control in soybean. New Phytol 2023, 240, 2436–2454. [Google Scholar] [CrossRef]
- Guo, X.; Fu, Y.; Lee, Y.J.; Chern, M.; Li, M.; Cheng, M.; Dong, H.; Yuan, Z.; Gui, L.; Yin, J.; et al. The PGS1 basic helix-loop-helix protein regulates Fl3 to impact seed growth and grain yield in cereals. Plant Biotechnol J 2022, 20, 1311–1326. [Google Scholar] [CrossRef] [PubMed]
- Gaur, V.S.; Singh, U.S.; Kumar, A. Transcriptional profiling and in silico analysis of Dof transcription factor gene family for understanding their regulation during seed development of rice Oryza sativa L. Mol Biol Rep 2011, 38, 2827-2848. Mol Biol Rep 2011, 38, 2827–2848. [Google Scholar] [CrossRef] [PubMed]
- Rey, P.; Gillet, B.; Römer, S.; Eymery, F.; Massimino, J.; Peltier, G.; Kuntz, M. Over-expression of a pepper plastid lipid-associated protein in tobacco leads to changes in plastid ultrastructure and plant development upon stress. The Plant Journal : For Cell and Molecular Biology 2000, 21, 483–494. [Google Scholar] [CrossRef] [PubMed]
- Liu, J.; Hua, W.; Hu, Z.; Yang, H.; Zhang, L.; Li, R.; Deng, L.; Sun, X.; Wang, X.; Wang, H. Natural variation in ARF18 gene simultaneously affects seed weight and silique length in polyploid rapeseed. Proc Natl Acad Sci U S A 2015, 112, 5123–5132. [Google Scholar] [CrossRef]
- Tang, Y.; Yang, Y.; Luo, F.; Luo, J.; Hu, J.; Yu, H.; Li, W.; Gao, J.; Fu, F. Identification of novel natural anti-browning agents based on phenotypic and metabolites differences in potato cultivars. Food Chem 2025, 463, 141450. [Google Scholar] [CrossRef]
- Qi, Z.; Zhang, Z.; Wang, Z.; Yu, J.; Qin, H.; Mao, X.; Jiang, H.; Xin, D.; Yin, Z.; Zhu, R.; et al. Meta-analysis and transcriptome profiling reveal hub genes for soybean seed storage composition during seed development. Plant Cell Environ 2018, 41, 2109–2127. [Google Scholar] [CrossRef]
- Wang, Y.; Nie, L.; Ma, J.; Zhou, B.; Han, X.; Cheng, J.; Lu, X.; Fan, Z.; Li, Y.; Cao, Y. Transcriptomic Variations and Network Hubs Controlling Seed Size and Weight During Maize Seed Development. Front Plant Sci 2022, 13, 828923–828936. [Google Scholar] [CrossRef]
- Yang, L.; Yang, L.; Ding, Y.; Chen, Y.; Liu, N.; Zhou, X.; Huang, L.; Luo, H.; Xie, M.; Liao, B.; et al. Global Transcriptome and Co-Expression Network Analyses Revealed Hub Genes Controlling Seed Size/Weight and/or Oil Content in Peanut. Plants (Basel) 2023, 12, 3144–3161. [Google Scholar] [CrossRef]
- Fatima, T.; Snyder, C.L.; Schroeder, W.R.; Cram, D.; Datla, R.; Wishart, D.; Weselake, R.J.; Krishna, P. Fatty acid composition of developing sea buckthorn (Hippophae rhamnoides L.) berry and the transcriptome of the mature seed. PLoS One 2012, 7, e34099. [Google Scholar] [CrossRef]
- Ding, J.; Ruan, C.; Du, W.; Guan, Y. RNA-seq data reveals a coordinated regulation mechanism of multigenes involved in the high accumulation of palmitoleic acid and oil in sea buckthorn berry pulp. Bmc Plant Biol 2019, 19, 207. [Google Scholar] [CrossRef]
- Li, J.B.; Ding, J.; Yu, X.; Li, H.; Ruan, C.J. Identification and expression analysis of critical microRNA-transcription factor regulatory modules related to seed development and oil accumulation in developing seeds. Ind Crop Prod 2019, 137, 33–42. [Google Scholar] [CrossRef]
- Wang, Y.; Noguchi, K.; Ono, N.; Inoue, S.; Terashima, I.; Kinoshita, T. Overexpression of plasma membrane H+-ATPase in guard cells promotes light-induced stomatal opening and enhances plant growth. Proc Natl Acad Sci U S A 2014, 111, 533–538. [Google Scholar] [CrossRef] [PubMed]
- Toh, S.; Takata, N.; Ando, E.; Toda, Y.; Wang, Y.; Hayashi, Y.; Mitsuda, N.; Nagano, S.; Taniguchi, T.; Kinoshita, T. Overexpression of Plasma Membrane H(+)-ATPase in Guard Cells Enhances Light-Induced Stomatal Opening, Photosynthesis, and Plant Growth in Hybrid Aspen. Front Plant Sci 2021, 12, 766037. [Google Scholar] [CrossRef] [PubMed]
- Liang, C.; Zhang, B. Effect of exogenous calcium on growth, nutrients uptake and plasma membrane H+-ATPase and Ca2+-ATPase activities in soybean (Glycine max) seedlings under simulated acid rain stress. Ecotoxicol Environ Saf 2018, 165, 261–269. [Google Scholar] [CrossRef]
- Tromas, A.; Paque, S.; Stierlé, V.; Quettier, A.-L.; Muller, P.; Lechner, E.; Genschik, P.; Perrot-Rechenmann, C. Auxin-binding protein 1 is a negative regulator of the SCF(TIR1/AFB) pathway. Nat Commun 2013, 4, 2496. [Google Scholar] [CrossRef]
- Xia, L.; Mar Marques-Bueno, M.; Bruce, C.G.; Karnik, R. Unusual Roles of Secretory SNARE SYP132 in Plasma Membrane H(+)-ATPase Traffic and Vegetative Plant Growth. Plant Physiol 2019, 180, 837–858. [Google Scholar] [CrossRef]
- Huang, J.; Xue, C.; Wang, H.; Wang, L.; Schmidt, W.; Shen, R.; Lan, P. Genes of ACYL CARRIER PROTEIN Family Show Different Expression Profiles and Overexpression of ACYL CARRIER PROTEIN 5 Modulates Fatty Acid Composition and Enhances Salt Stress Tolerance in Arabidopsis. Front Plant Sci 2017, 8, 987. [Google Scholar] [CrossRef]
- Xie, L.J.; Yu, L.J.; Chen, Q.F.; Wang, F.Z.; Huang, L.; Xia, F.N.; Zhu, T.R.; Wu, J.X.; Yin, J.; Liao, B.; et al. Arabidopsis acyl-CoA-binding protein ACBP3 participates in plant response to hypoxia by modulating very-long-chain fatty acid metabolism. Plant J 2015, 81, 53–67. [Google Scholar] [CrossRef]
- Gully, K.; Berhin, A.; De Bellis, D.; Herrfurth, C.; Feussner, I.; Nawrath, C. The GPAT4/6/8 clade functions in Arabidopsis root suberization nonredundantly with the GPAT5/7 clade required for suberin lamellae. Proc Natl Acad Sci U S A 2024, 121, e2314570121. [Google Scholar] [CrossRef]
- Yuan, L.X.; Mao, X.; Zhao, K.; Ji, X.J.; Ji, C.L.; Xue, J.N.; Li, R.Z. Characterisation of phospholipid: diacylglycerol acyltransferases (PDATs) from and their roles in stress responses. Biology Open 2017, 6, 1024–1034. [Google Scholar]
- Li, X.C.; Zhu, J.; Yang, J.; Zhang, G.R.; Xing, W.F.; Zhang, S.; Yang, Z.N. Glycerol-3-phosphate acyltransferase 6 (GPAT6) is important for tapetum development in Arabidopsis and plays multiple roles in plant fertility. Mol Plant 2012, 5, 131–142. [Google Scholar] [CrossRef] [PubMed]
- Hu, Z.H.; Ren, Z.H.; Lu, C.F. The Phosphatidylcholine Diacylglycerol Cholinephosphotransferase Is Required for Efficient Hydroxy Fatty Acid Accumulation in Transgenic Arabidopsis. Plant Physiology 2012, 158, 1944–1954. [Google Scholar] [CrossRef] [PubMed]
- Pellaud, S.; Bory, A.; Chabert, V.; Romanens, J.; Chaisse-Leal, L.; Doan, A.V.; Frey, L.; Gust, A.; Fromm, K.M.; Mene-Saffrane, L. WRINKLED1 and ACYL-COA:DIACYLGLYCEROL ACYLTRANSFERASE1 regulate tocochromanol metabolism in Arabidopsis. New Phytol 2018, 217, 245–260. [Google Scholar] [CrossRef] [PubMed]
- Bradley, R.M.; Duncan, R.E. The lysophosphatidic acid acyltransferases (acylglycerophosphate acyltransferases) family: one reaction, five enzymes, many roles. Curr Opin Lipidol 2018, 29, 110–115. [Google Scholar] [CrossRef]
- Aizouq, M.; Peisker, H.; Gutbrod, K.; Melzer, M.; Hölzl, G.; Dörmann, P. Triacylglycerol and phytyl ester synthesis in Synechocystis sp. PCC6803. Proc Natl Acad Sci U S A 2020, 117, 6216–6222. [Google Scholar] [CrossRef]
- Ma, Z.; Onorato, J.M.; Chen, L.; Nelson, D.W.; Yen, C.-L.E.; Cheng, D. Synthesis of neutral ether lipid monoalkyl-diacylglycerol by lipid acyltransferases. Journal of Lipid Research 2017, 58, 1091–1099. [Google Scholar] [CrossRef]
- Chen, J.; Nolan, T.M.; Ye, H.; Zhang, M.; Tong, H.; Xin, P.; Chu, J.; Chu, C.; Li, Z.; Yin, Y. Arabidopsis WRKY46, WRKY54, and WRKY70 Transcription Factors Are Involved in Brassinosteroid-Regulated Plant Growth and Drought Responses. Plant Cell 2017, 29, 1425–1439. [Google Scholar] [CrossRef]
- Jo, L.; Pelletier, J.M.; Harada, J.J. Central role of the LEAFY COTYLEDON1 transcription factor in seed development. J Integr Plant Biol 2019, 61, 564–580. [Google Scholar] [CrossRef]
- Zumajo-Cardona, C.; Gabrieli, F.; Anire, J.; Albertini, E.; Ezquer, I.; Colombo, L. Evolutionary studies of the bHLH transcription factors belonging to MBW complex: their role in seed development. Annals of Botany 2023, 132, 383–400. [Google Scholar] [CrossRef]
- Foreman, J.; White, J.; Graham, I.; Halliday, K.; Josse, E.M. Shedding light on flower development: phytochrome B regulates gynoecium formation in association with the transcription factor SPATULA. Plant Signal Behav 2011, 6, 471–476. [Google Scholar] [CrossRef]
- Sha, G.; Cheng, J.; Wang, X.; Xue, Q.; Zhang, H.; Zhai, R.; Yang, C.; Wang, Z.; Xu, L. PbbHLH137 interacts with PbGIF1 to regulate pear fruit development by promoting cell expansion to increase fruit size. Physiol Plant 2024, 176, e14451. [Google Scholar] [CrossRef] [PubMed]
- Varaud, E.; Brioudes, F.; Szecsi, J.; Leroux, J.; Brown, S.; Perrot-Rechenmann, C.; Bendahmane, M. AUXIN RESPONSE FACTOR8 regulates Arabidopsis petal growth by interacting with the bHLH transcription factor BIGPETALp. Plant Cell 2011, 23, 973–983. [Google Scholar] [CrossRef] [PubMed]
- Chen, J.N.; Yin, Y.H. WRKY transcription factors are involved in brassinosteroid signaling and mediate the crosstalk between plant growth and drought tolerance. Plant Signaling & Behavior 2017, 12. [Google Scholar]
- Li, M.Y.; Liu, J.X.; Hao, J.N.; Feng, K.; Duan, A.Q.; Yang, Q.Q.; Xu, Z.S.; Xiong, A.S. Genomic identification of AP2/ERF transcription factors and functional characterization of two cold resistance-related AP2/ERF genes in celery (Apium graveolens L.). Planta 2019, 250, 1265–1280. [Google Scholar] [CrossRef]
- Hu, Y.A.; Sun, H.L.; Han, Z.Y.; Wang, S.; Wang, T.; Li, Q.Q.; Tian, J.; Wang, Y.; Zhang, X.Z.; Xu, X.F.; et al. ERF4 affects fruit ripening by acting as a JAZ interactor between ethylene and jasmonic acid hormone signaling pathways. Horticultural Plant Journal 2022, 8, 689–699. [Google Scholar] [CrossRef]
- Ding, A.M.; Xu, C.T.; Xie, Q.; Zhang, M.J.; Yan, N.; Dai, C.B.; Lv, J.; Cui, M.M.; Wang, W.F.; Sun, Y.H. ERF4 interacts with and antagonizes TCP15 in regulating endoreduplication and cell growth in Arabidopsis. J Integr Plant Biol 2022, 64, 1673–1689. [Google Scholar] [CrossRef]
- Zhao, T.T.; Wu, T.R.; Zhang, J.; Wang, Z.Y.; Pei, T.; Yang, H.H.; Li, J.F.; Xu, X.Y. Genome-Wide Analyses of the Genetic Screening of CH-Type Zinc Finger Transcription Factors and Abiotic and Biotic Stress Responses in Tomato (Solanum lycopersicum) Based on RNA-Seq Data. Frontiers in Genetics 2020, 11, 540–556. [Google Scholar] [CrossRef]
- Liu, Y.; Liu, N.; Deng, X.; Liu, D.; Li, M.; Cui, D.; Hu, Y.; Yan, Y. Genome-wide analysis of wheat DNA-binding with one finger (Dof) transcription factor genes: evolutionary characteristics and diverse abiotic stress responses. BMC Genomics 2020, 21, 276. [Google Scholar] [CrossRef]
- Cheng, Z.; Hou, D.; Liu, J.; Li, X.; Xie, L.; Ma, Y.; Gao, J. Characterization of moso bamboo (Phyllostachys edulis) Dof transcription factors in floral development and abiotic stress responses. Genome 2018, 61, 151–156. [Google Scholar] [CrossRef]
- Kang, W.H.; Kim, S.; Lee, H.A.; Choi, D.; Yeom, S.I. Genome-wide analysis of Dof transcription factors reveals functional characteristics during development and response to biotic stresses in pepper. Sci Rep 2016, 6, 33332. [Google Scholar] [CrossRef]
- Chang, H.; Chen, D.; Kam, J.; Richardson, T.; Drenth, J.; Guo, X.; McIntyre, C.L.; Chai, S.; Rae, A.L.; Xue, G.P. Abiotic stress upregulated TaZFP34 represses the expression of type-B response regulator and SHY2 genes and enhances root to shoot ratio in wheat. Plant Sci 2016, 252, 88–102. [Google Scholar] [CrossRef] [PubMed]
- Kang, Z.; Qin, T.; Zhao, Z. Overexpression of the zinc finger protein gene OsZFP350 improves root development by increasing resistance to abiotic stress in rice. Acta Biochim Pol 2019, 66, 183–190. [Google Scholar] [CrossRef] [PubMed]
- Zheng, K.; Lv, M.; Qian, J.; Lian, Y.; Liu, R.; Huo, S.; Rehman, O.U.; Lin, Q.; Zhou, Z.; Liu, X.; et al. Identification and Characterization of the DOF Gene Family in Phoebe bournei and Its Role in Abiotic Stress-Drought, Heat and Light Stress. Int J Mol Sci 2024, 25, 11147–11166. [Google Scholar] [CrossRef] [PubMed]
- Liu, Y.; Xu, Y.; Xiao, J.; Ma, Q.; Li, D.; Xue, Z.; Chong, K. OsDOG, a gibberellin-induced A20/AN1 zinc-finger protein, negatively regulates gibberellin-mediated cell elongation in rice. J Plant Physiol 2011, 168, 1098–1105. [Google Scholar] [CrossRef]
- Chen, W.; Cheng, Z.; Liu, L.; Wang, M.; You, X.; Wang, J.; Zhang, F.; Zhou, C.; Zhang, Z.; Zhang, H.; et al. Small Grain and Dwarf 2, encoding an HD-Zip II family transcription factor, regulates plant development by modulating gibberellin biosynthesis in rice. Plant Sci 2019, 288, 110208. [Google Scholar] [CrossRef]
- Yang, B.; Kallio, H.P. Fatty acid composition of lipids in sea buckthorn (Hippophae rhamnoides L.) berries of different origins. J Agric Food Chem 2001, 49, 1939–1947. [Google Scholar] [CrossRef]
- Kanehisa, M.; Furumichi, M.; Sato, Y.; Kawashima, M.; Ishiguro-Watanabe, M. KEGG for taxonomy-based analysis of pathways and genomes. Nucleic Acids Res 2023, 51, D587–D592. [Google Scholar] [CrossRef]
- Langfelder, P.; Horvath, S. WGCNA: an R package for weighted correlation network analysis. BMC Bioinformatics 2008, 9, 559. [Google Scholar] [CrossRef]
Figure 1.
The oil content, thousand-seed weight (TSW) and size of developing sea buckthorn seeds. (A) Oil contents in seeds from twelve cultivars ‘CY04’, ‘CY03’, ‘CY02’, ‘CY32’, ‘CY10’, ‘CY11’, ‘CY201309’, ‘CY13’, ‘CY18’, ‘CY21’, ‘CY27’, and ‘SQH’ at two development stages. (B) TSW in seeds from twelve cultivars at two development stages. (C) The transverse diameters from twelve cultivars at two development stages. (D) The longitudinal diameters from twelve cultivars at two development stages. Error bars indicate standard deviations of three biological replicates. *Indicate significant differences of data between the two cultivars at the same developmental stage at the level of 0.05.
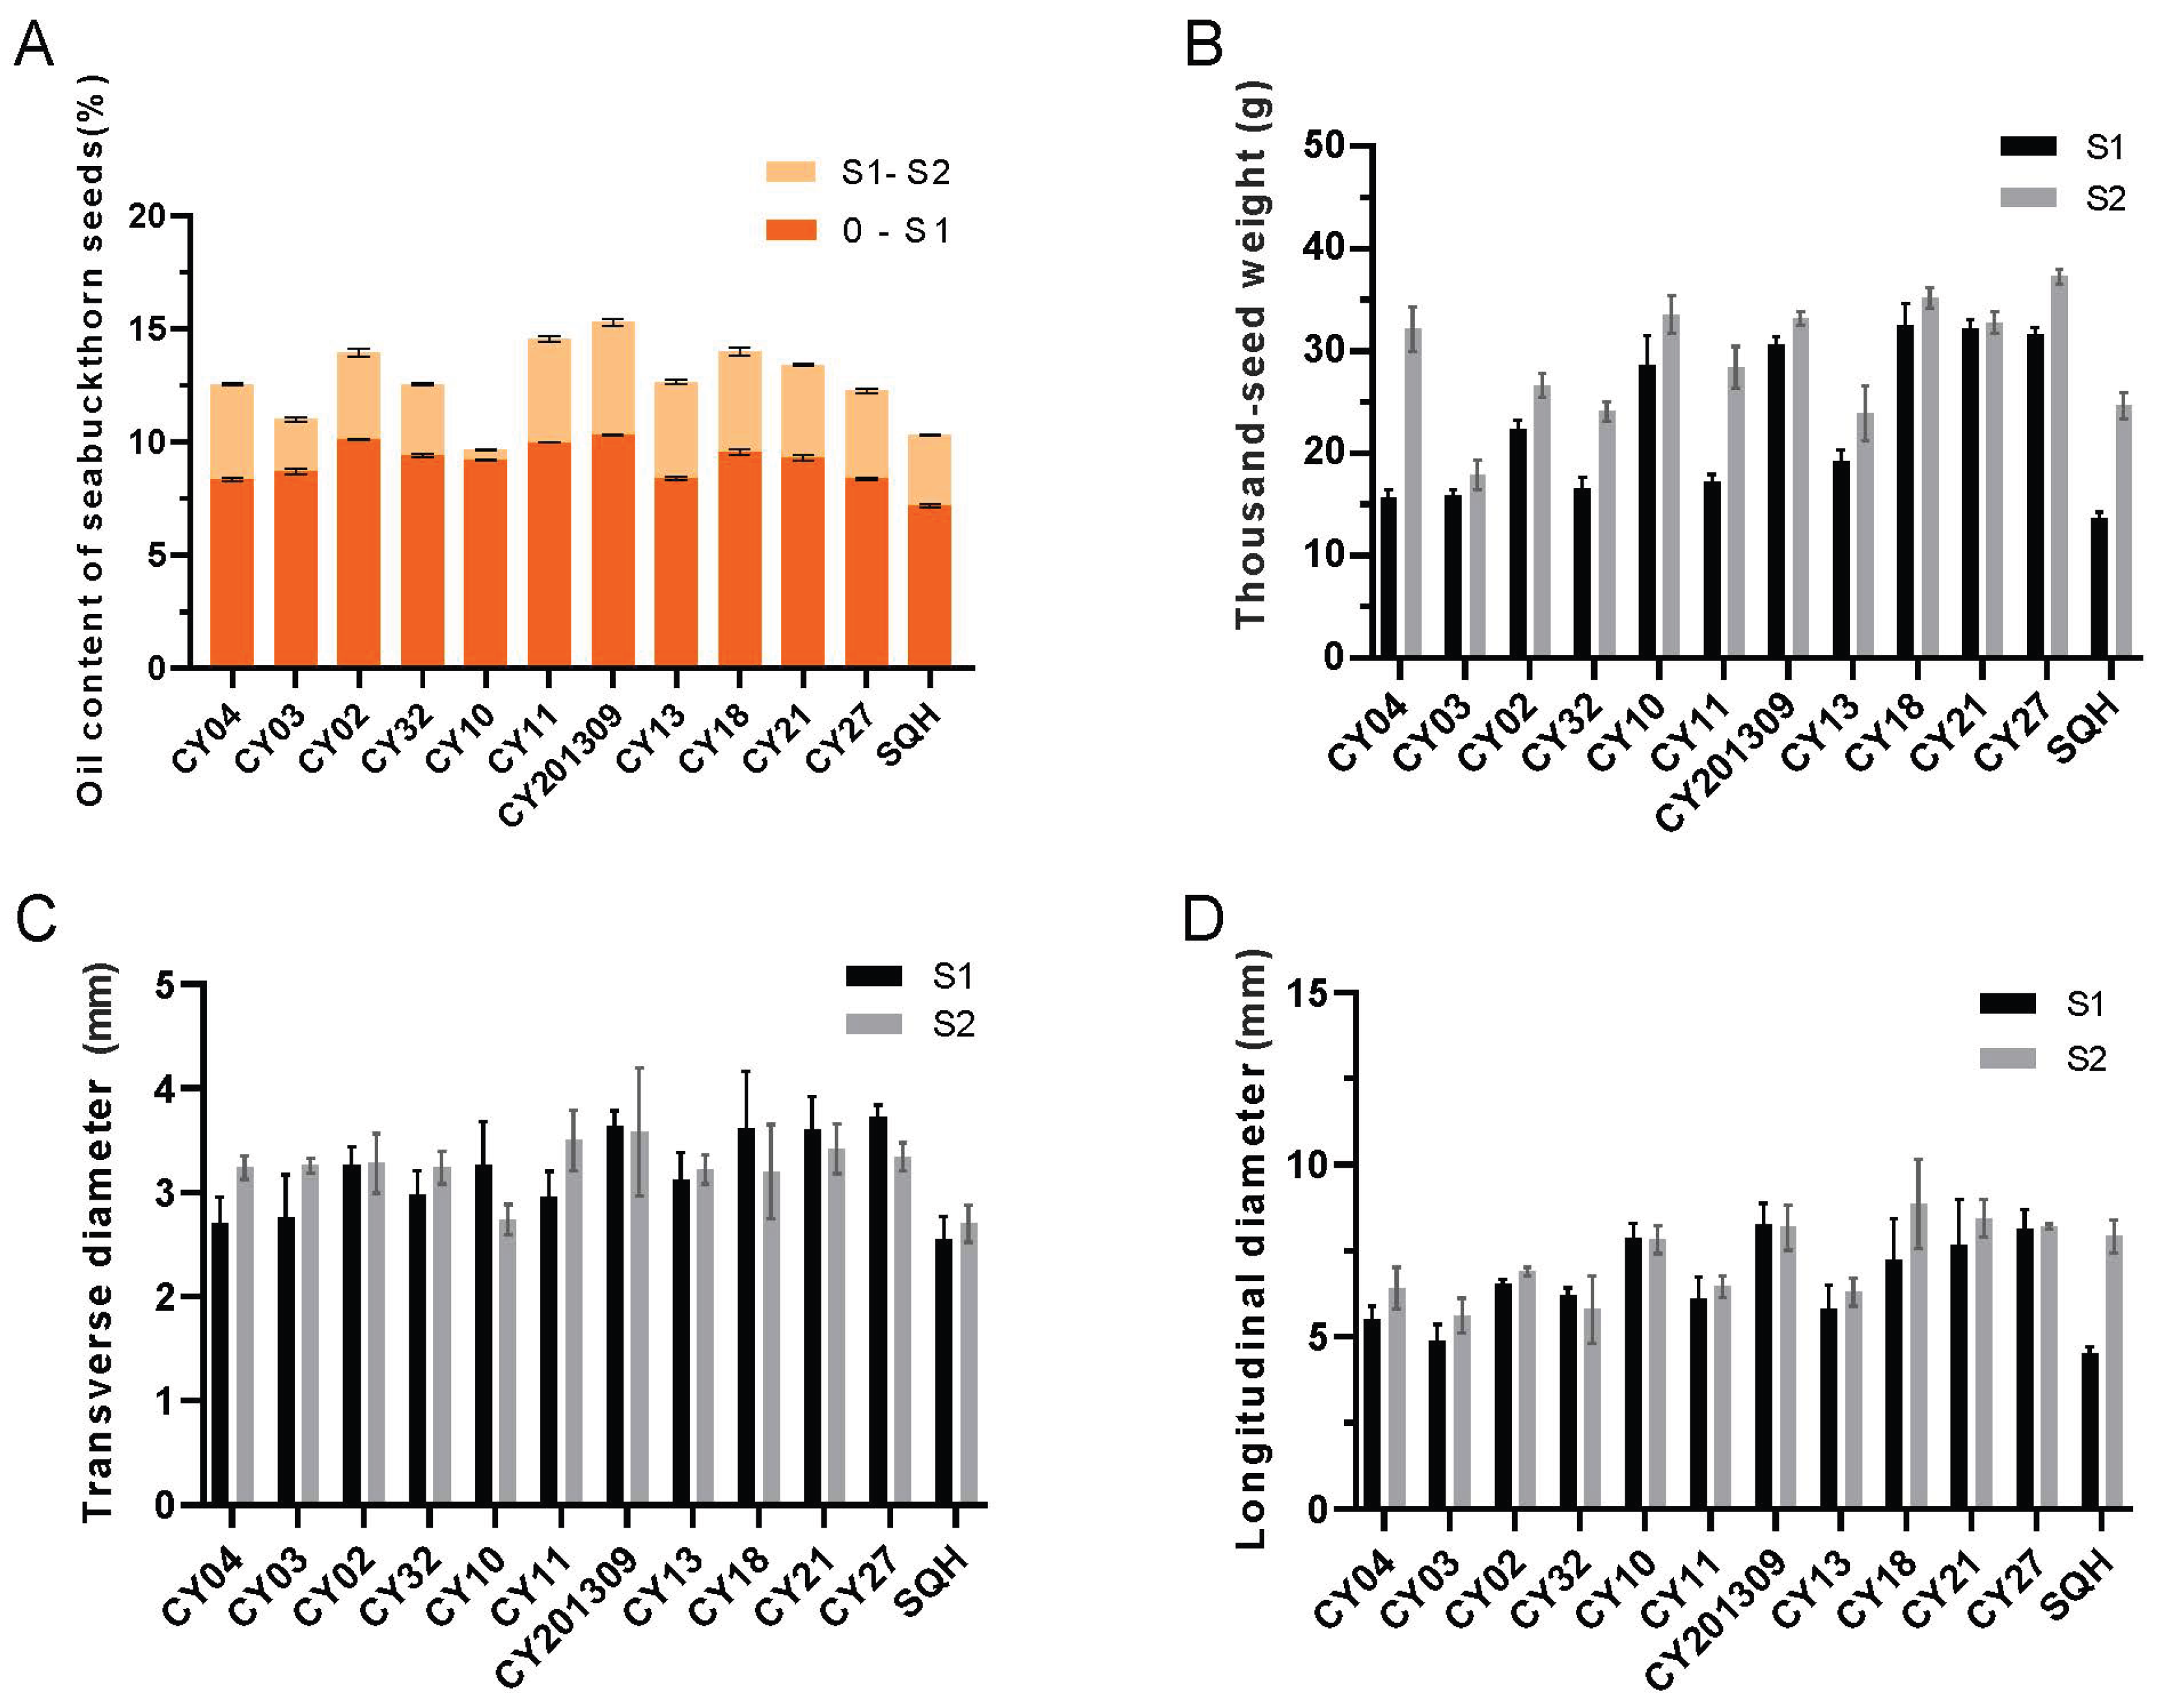
Figure 2.
Gene Ontology analysis of DEGs.
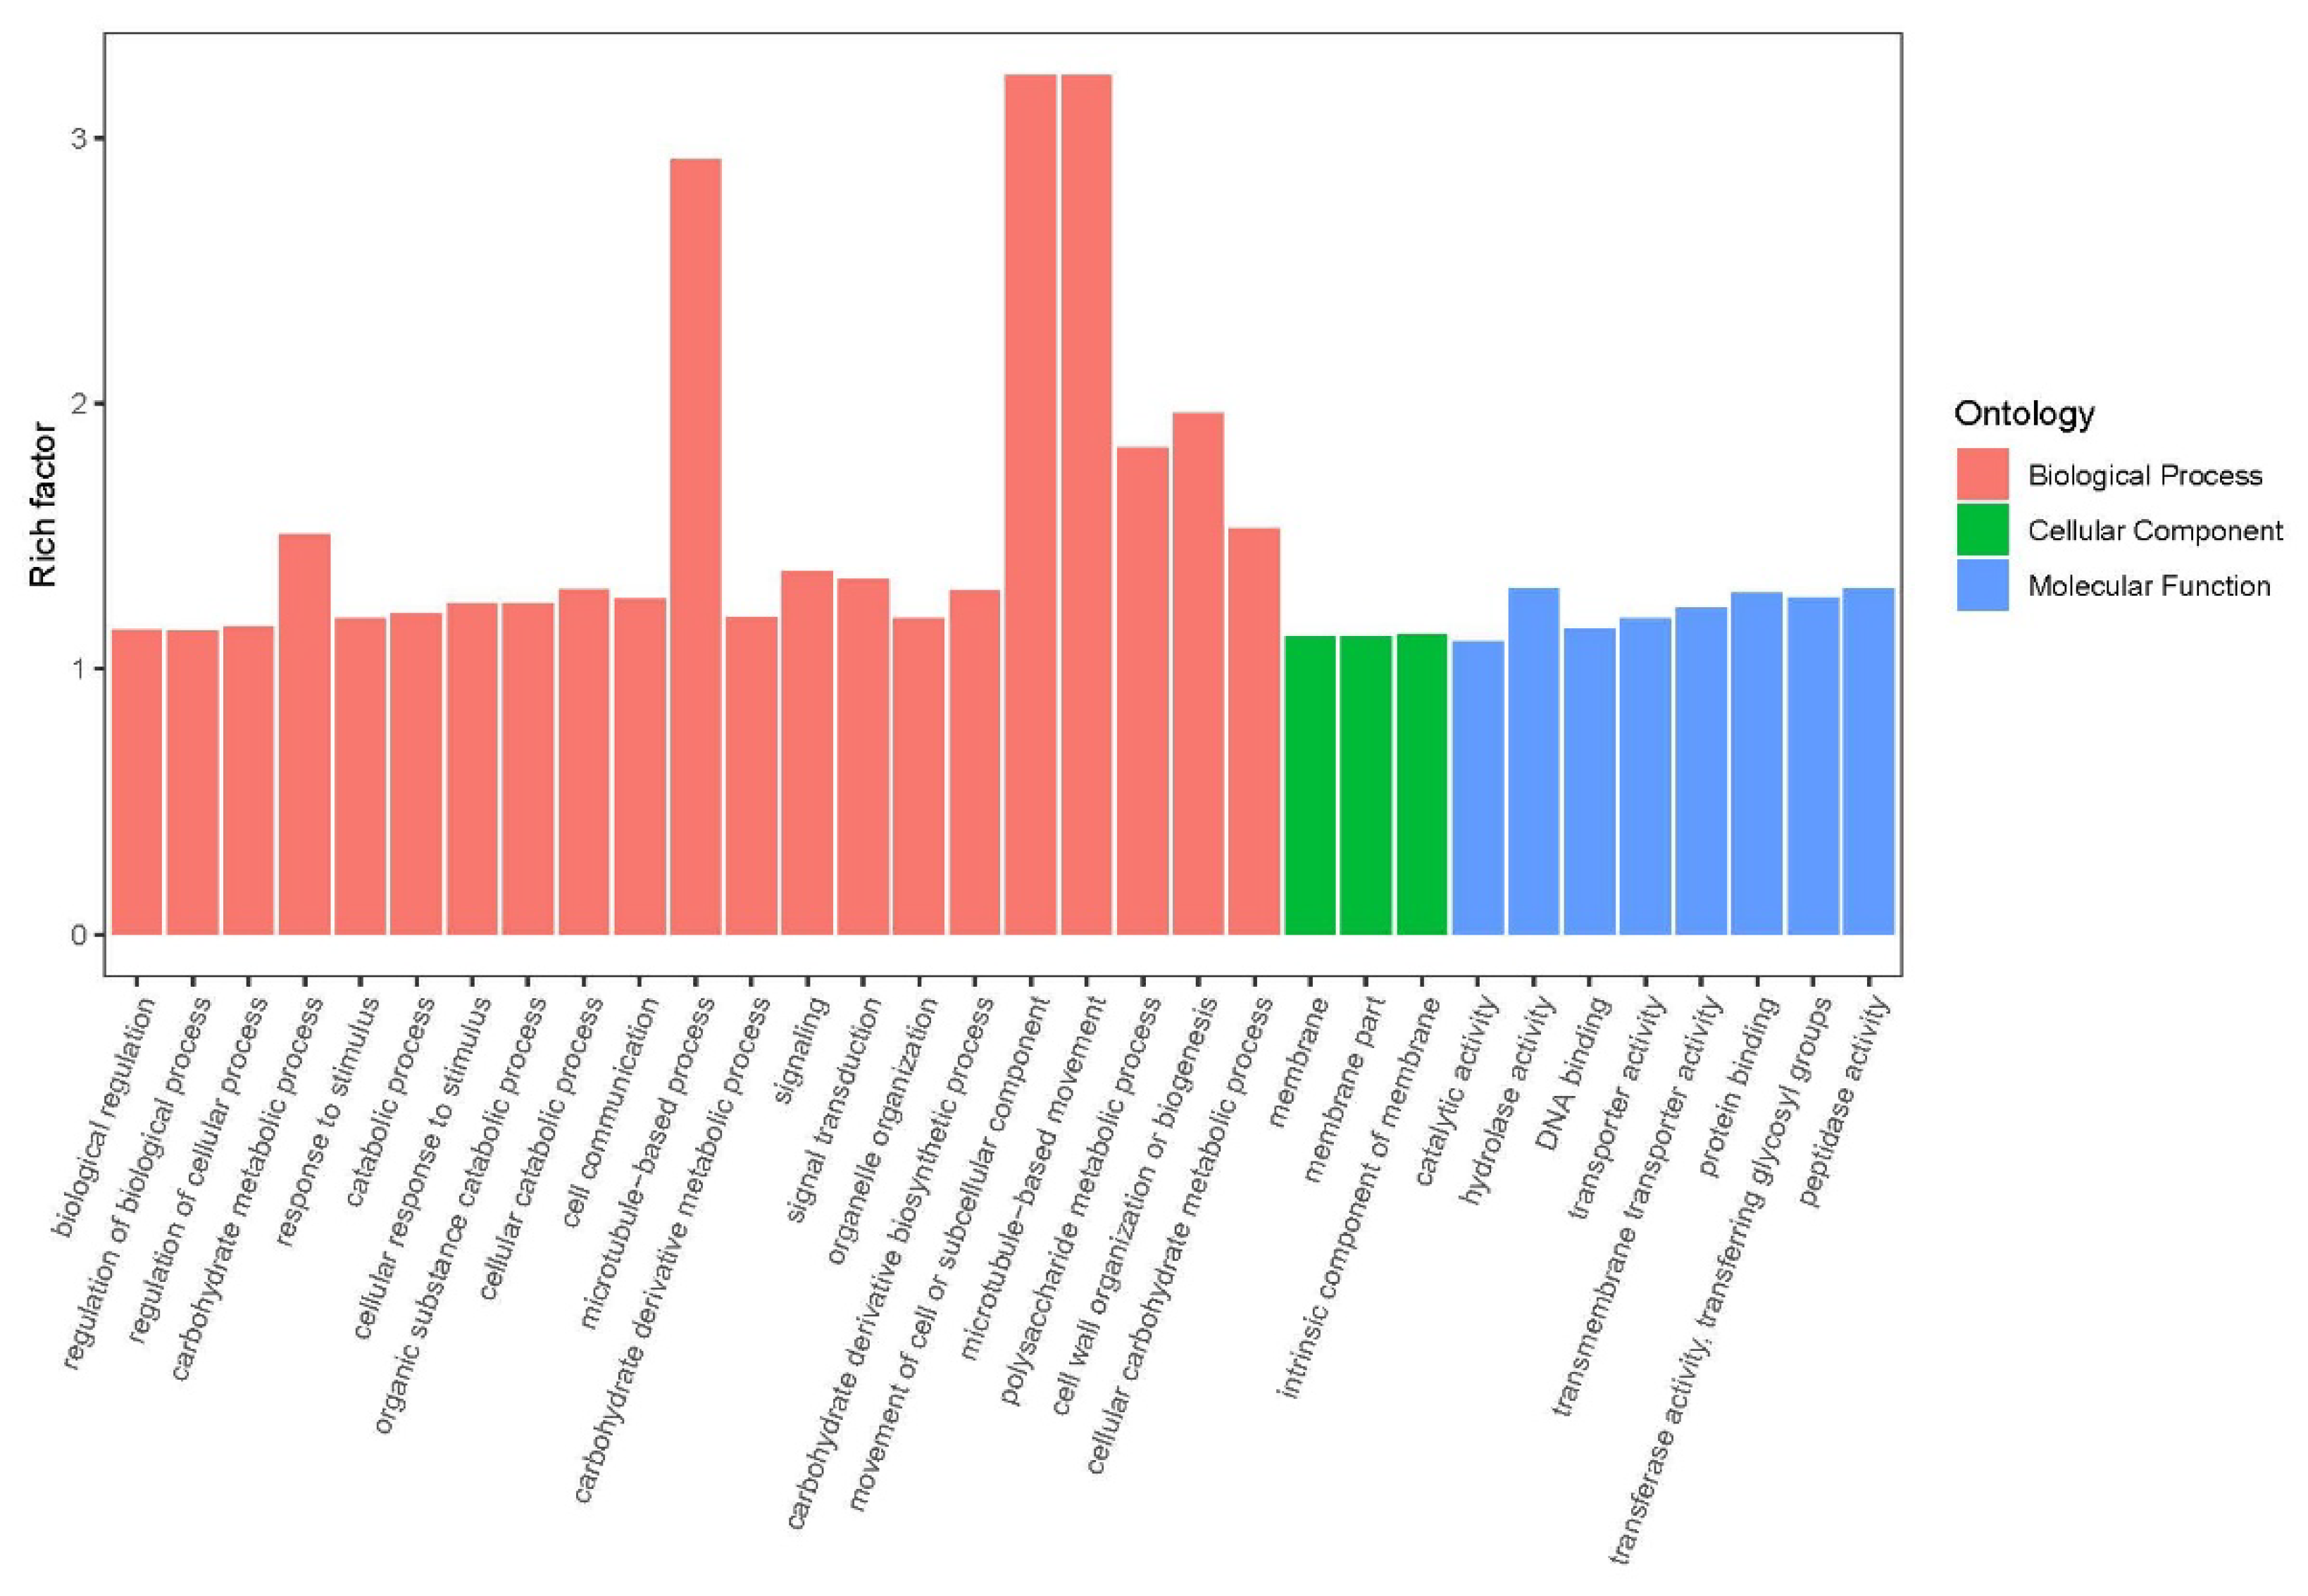
Figure 3.
KEGG enrichment analysis of DEGs. Top 20 KEGG up (A) and down (B) pathways of S1 vs S2. The abscissa is the P value, and the ordinate is the KEGG path name. The greater the rich factor (P value), the more significant the enrichment level of DEGs in this pathway. The color of the circle represents the degree of enrichment of the rich factor. The size of the circle represents the number of DEGs contained in that KEGG pathway.
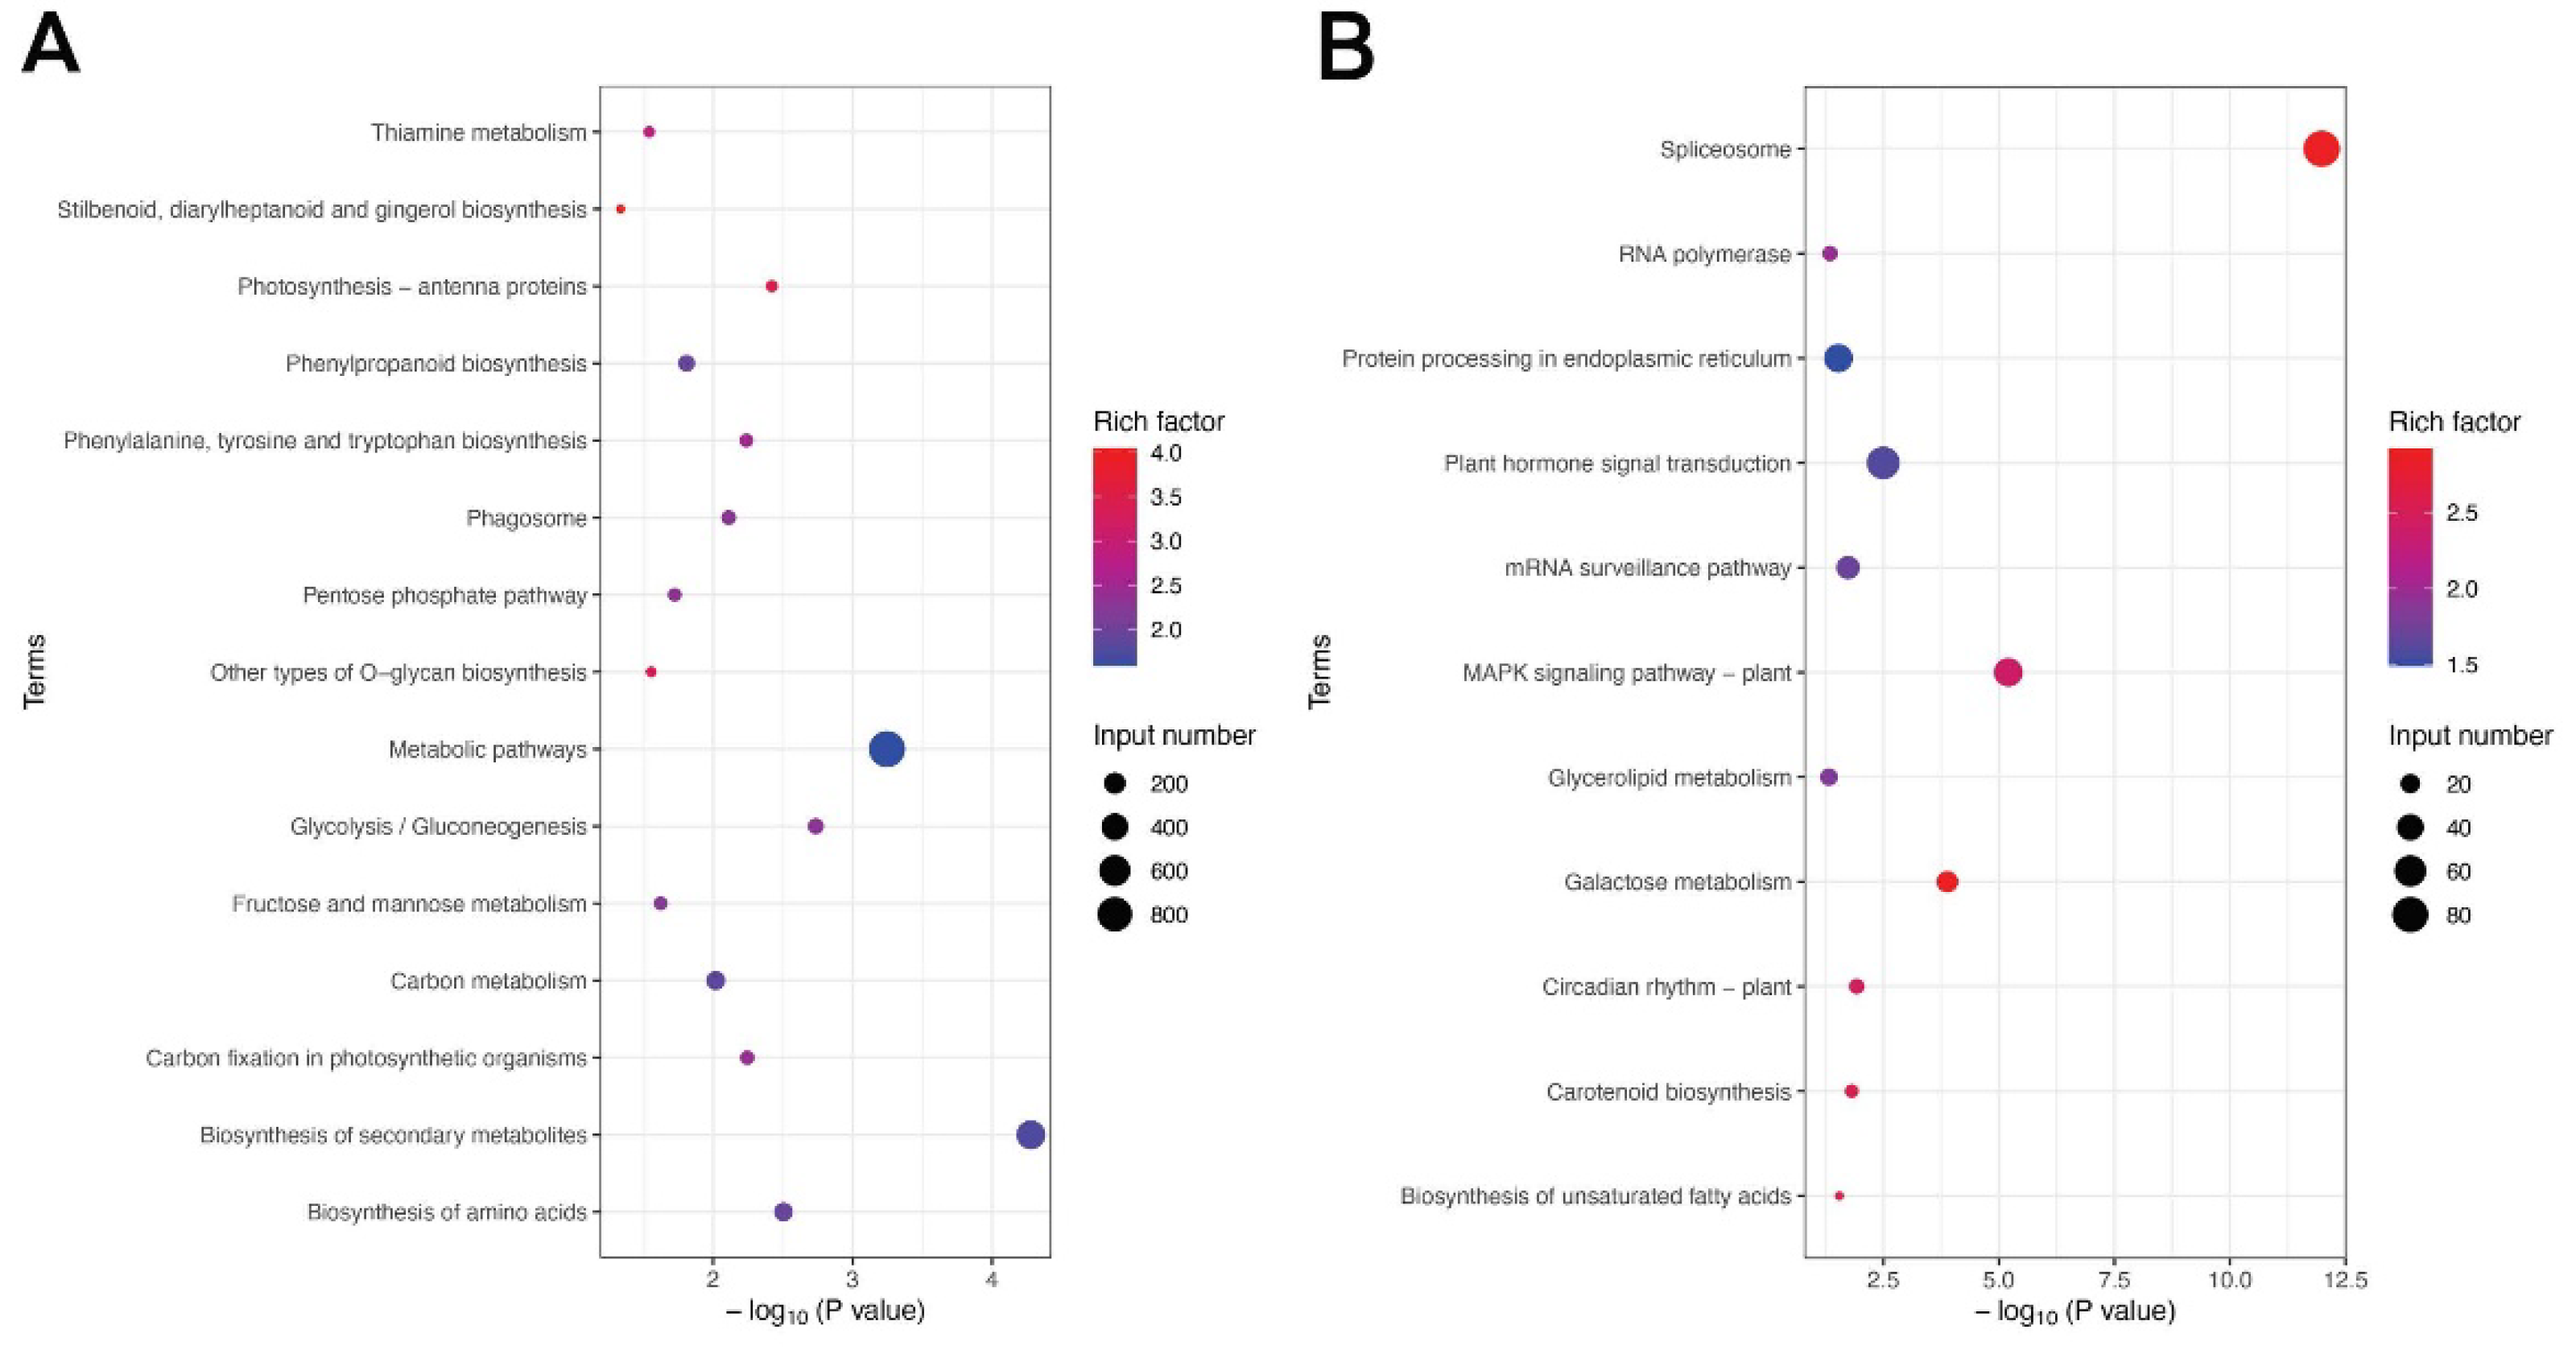
Figure 4.
Heatmap analysis of significant DEGs associated with seed development from two developmental stages in twelve cultivars. The expression value (in RPKM) for the DEGs during S1 and S2 development in both cultivars was log2 transformed, and the total RPKM value was greater than 20. lipid biosynthesis.
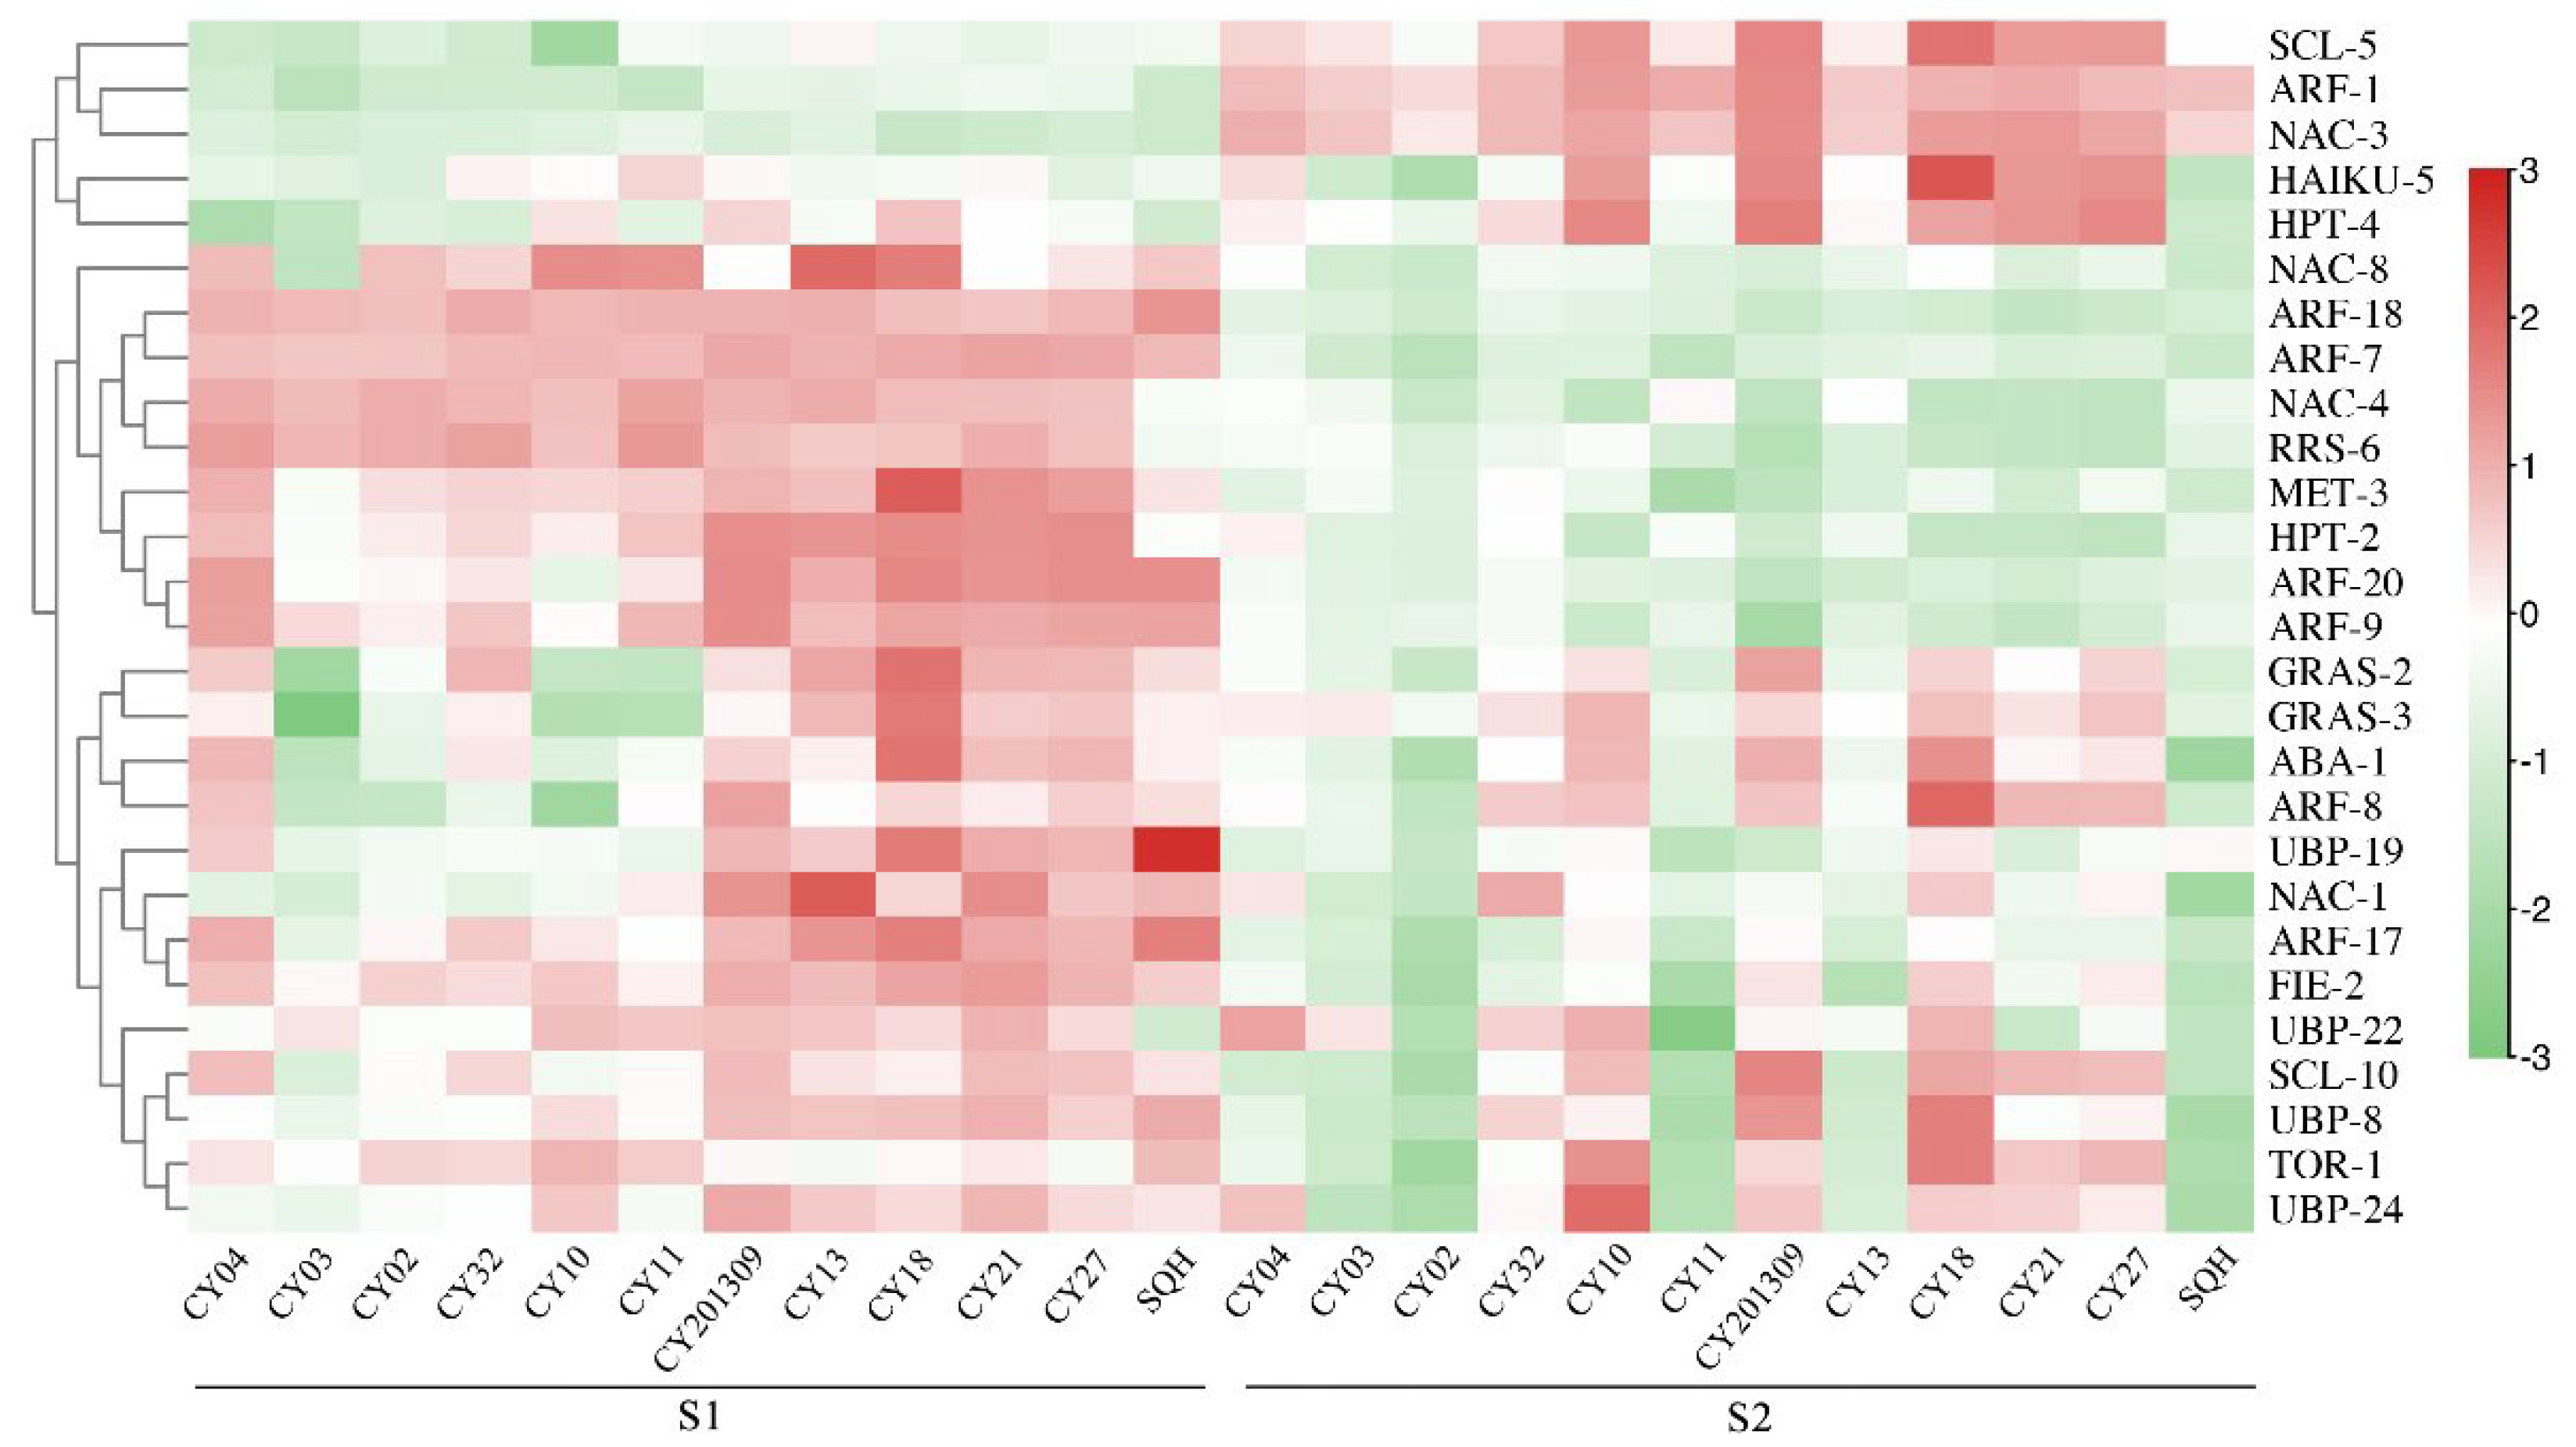
Figure 5.
Heatmap analysis of significant DEGs associated with lipid biosynthesis from two developmental stages in twelve cultivars. The expression value (in RPKM) for the DEGs during S1 and S2 development in both cultivars was log2 transformed, and the total RPKM value was greater than 20.
Figure 5.
Heatmap analysis of significant DEGs associated with lipid biosynthesis from two developmental stages in twelve cultivars. The expression value (in RPKM) for the DEGs during S1 and S2 development in both cultivars was log2 transformed, and the total RPKM value was greater than 20.
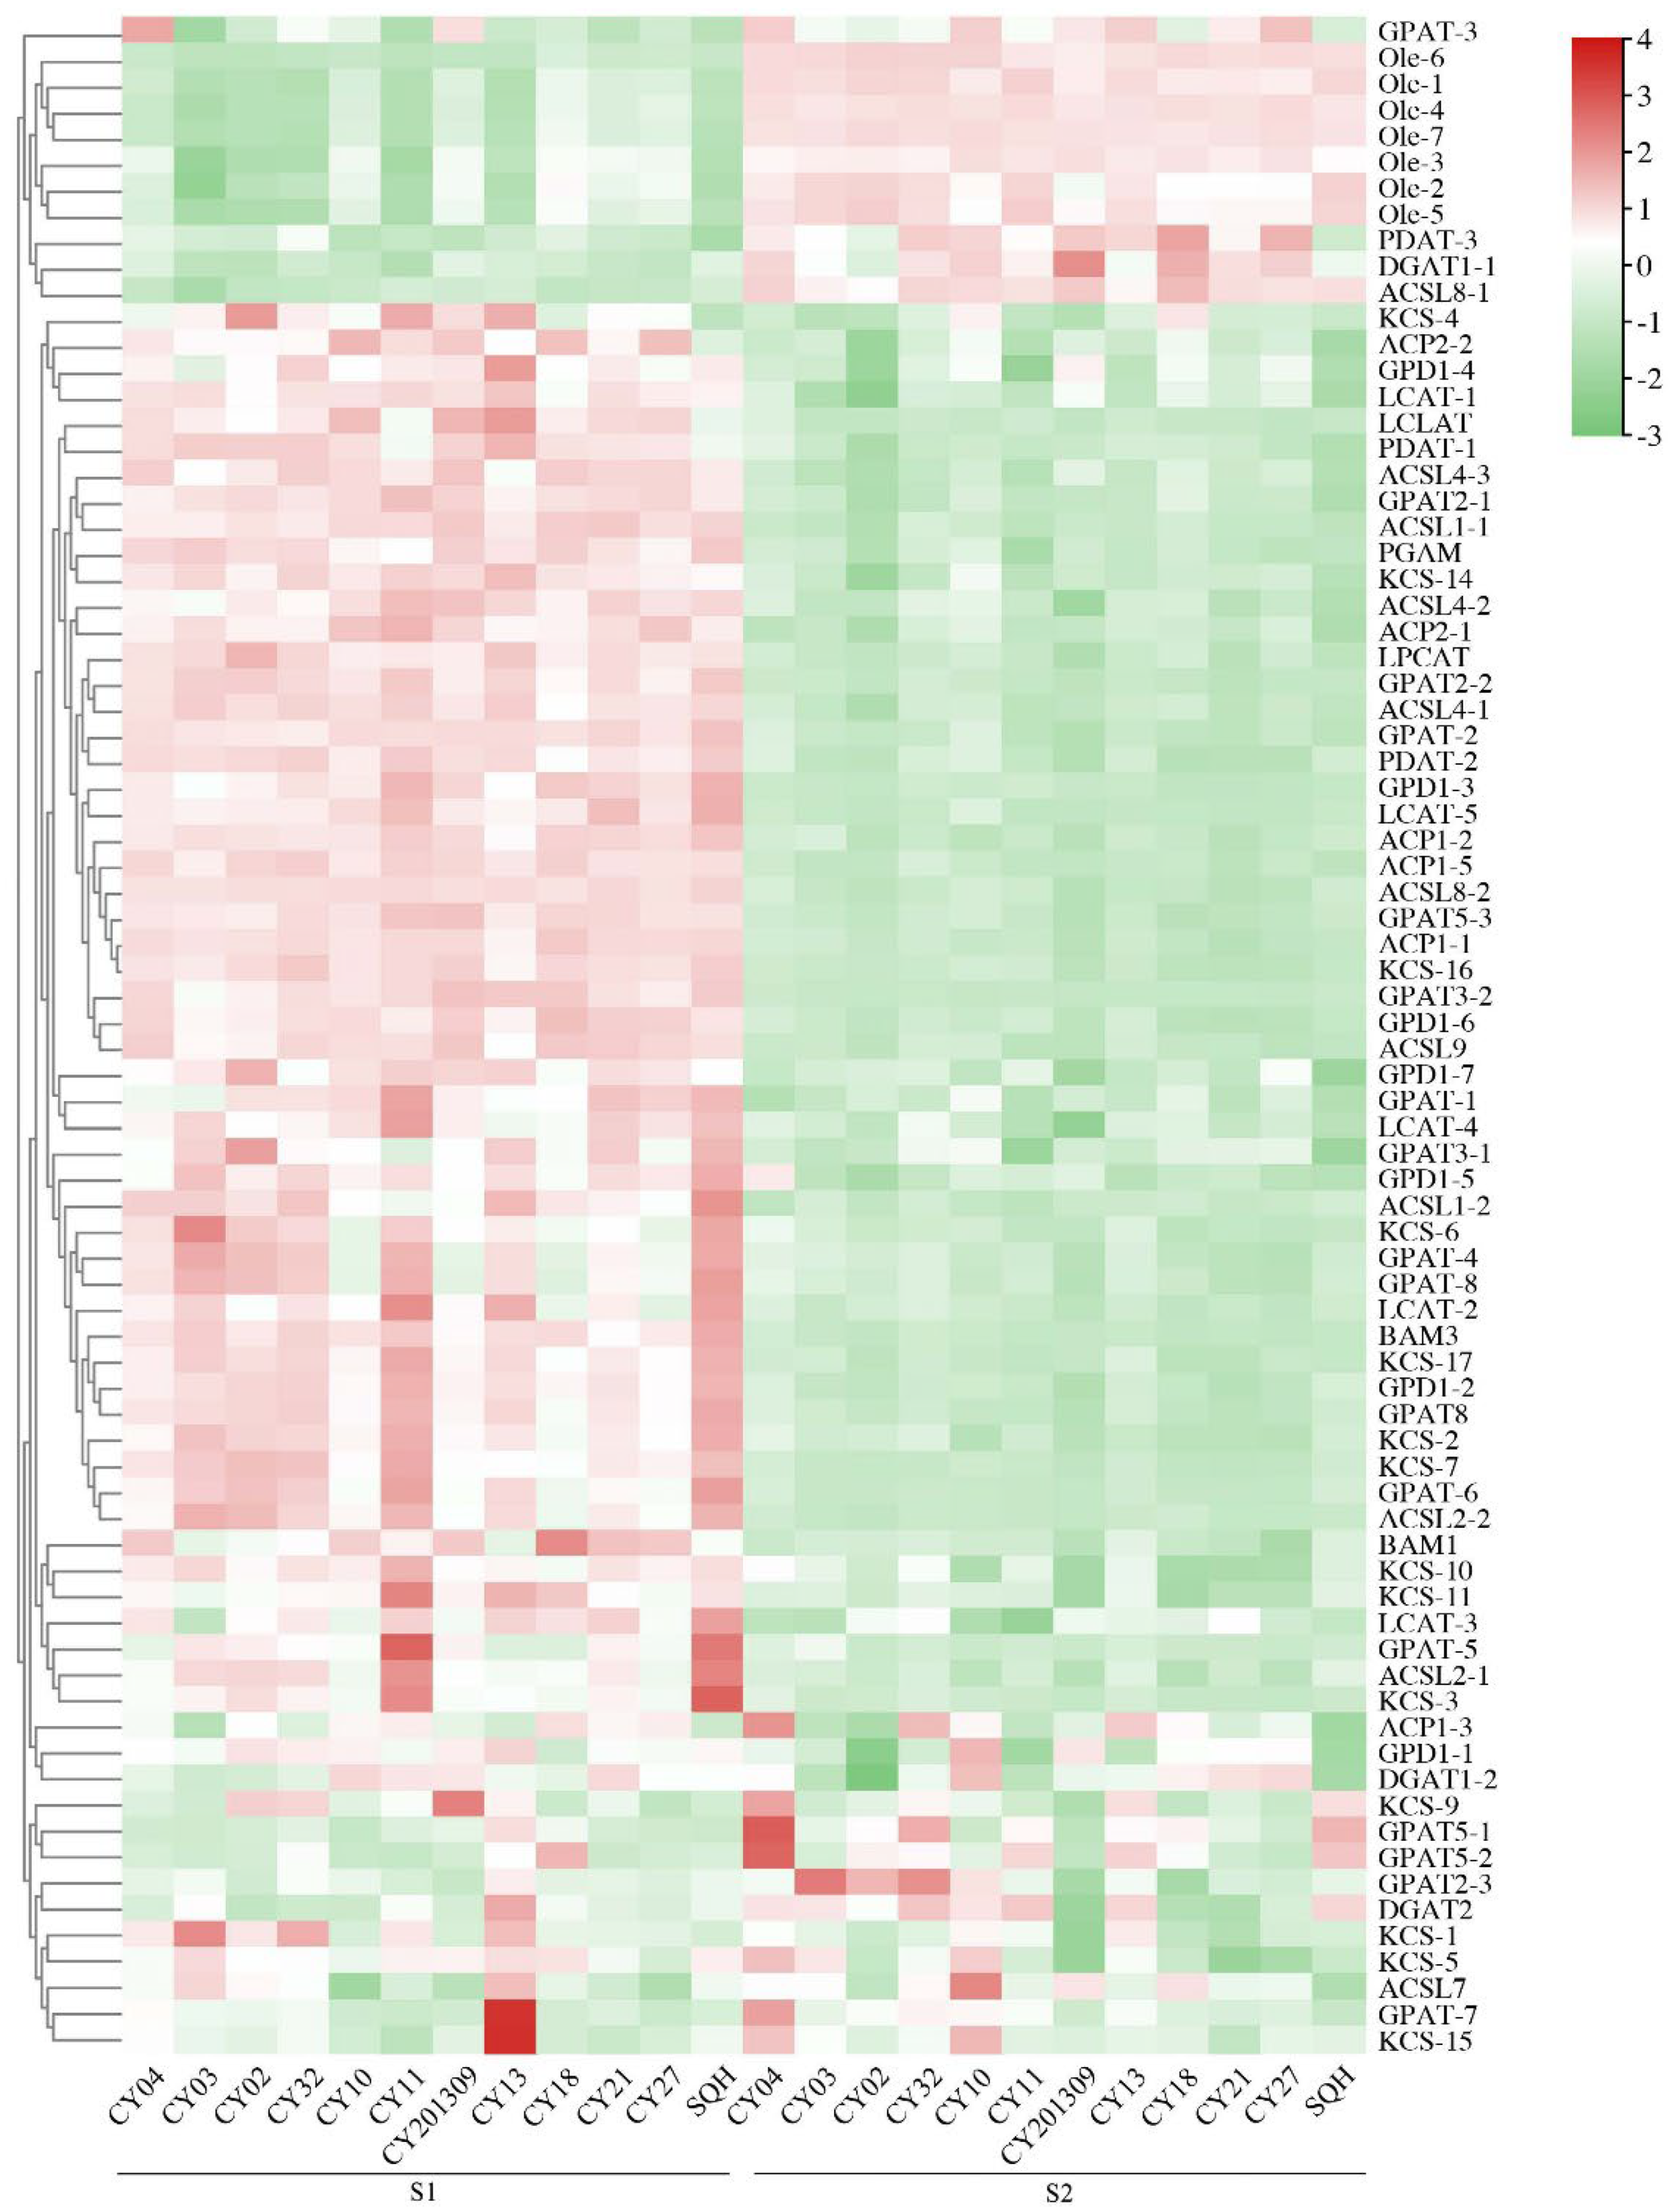
Figure 6.
Heatmap analysis of significant TFs associated with lipid biosynthesis from two developmental stages in twelve cultivars. The expression value (in RPKM) for the DEGs during S1 and S2 development in both cultivars was log2 transformed, and the total RPKM value was greater than 20.
Figure 6.
Heatmap analysis of significant TFs associated with lipid biosynthesis from two developmental stages in twelve cultivars. The expression value (in RPKM) for the DEGs during S1 and S2 development in both cultivars was log2 transformed, and the total RPKM value was greater than 20.
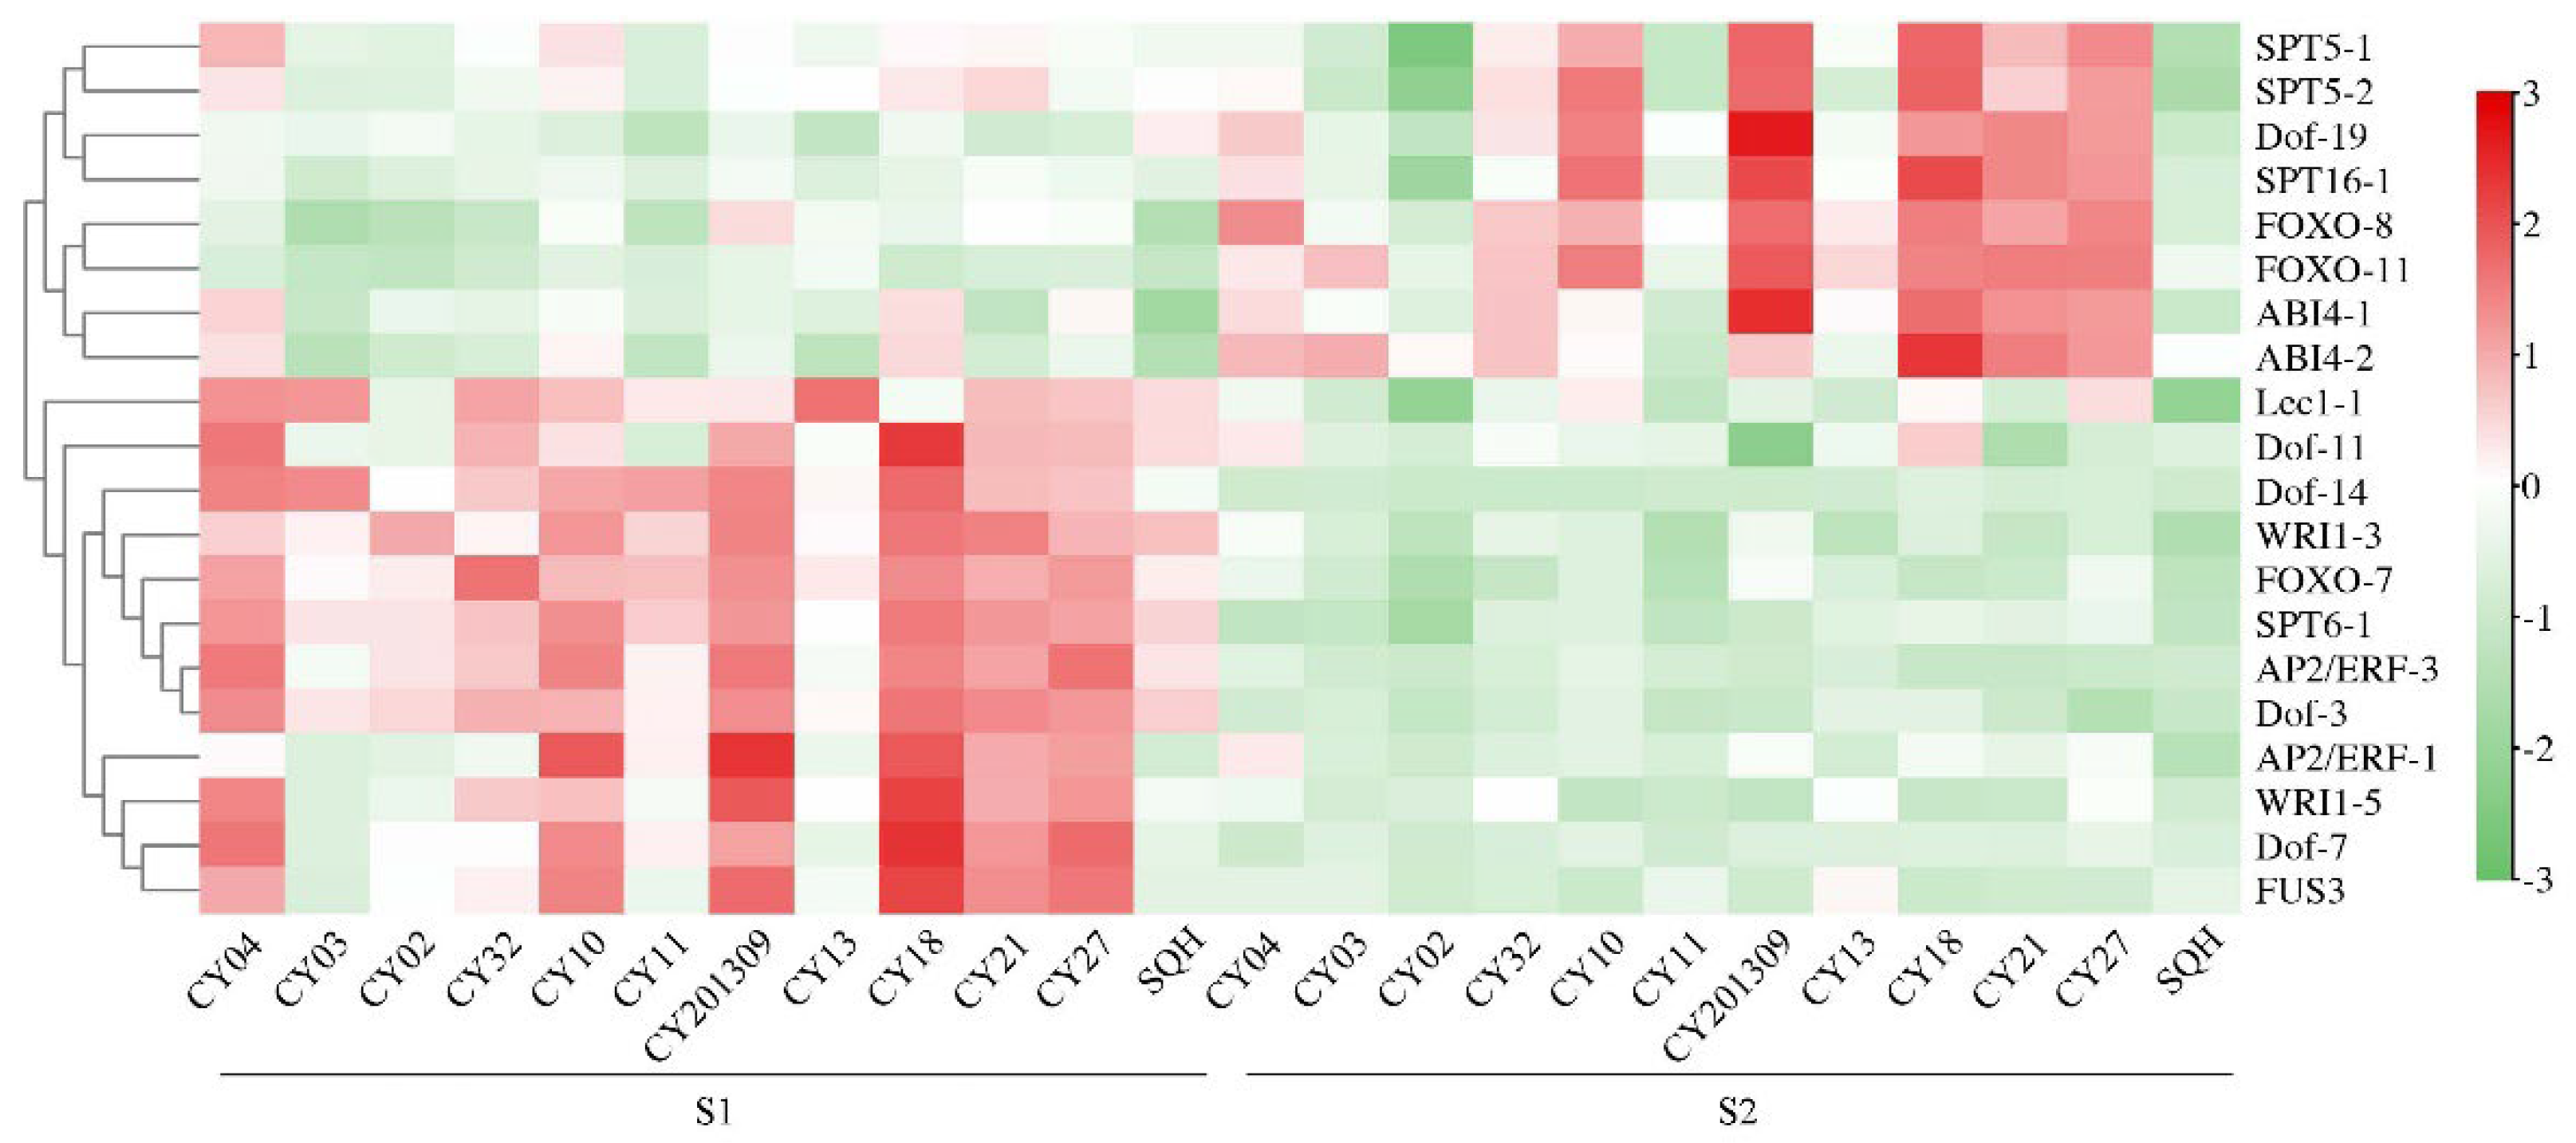
Figure 7.
Weighted gene co-expression network analysis and visualization. (A) Hierarchical cluster tree showing co-expression modules identified by WGCNA. Each leaf (short vertical line) in the tree represented one gene. The major tree branches constitute 17 modules labeled by different colors.
Figure 7.
Weighted gene co-expression network analysis and visualization. (A) Hierarchical cluster tree showing co-expression modules identified by WGCNA. Each leaf (short vertical line) in the tree represented one gene. The major tree branches constitute 17 modules labeled by different colors.
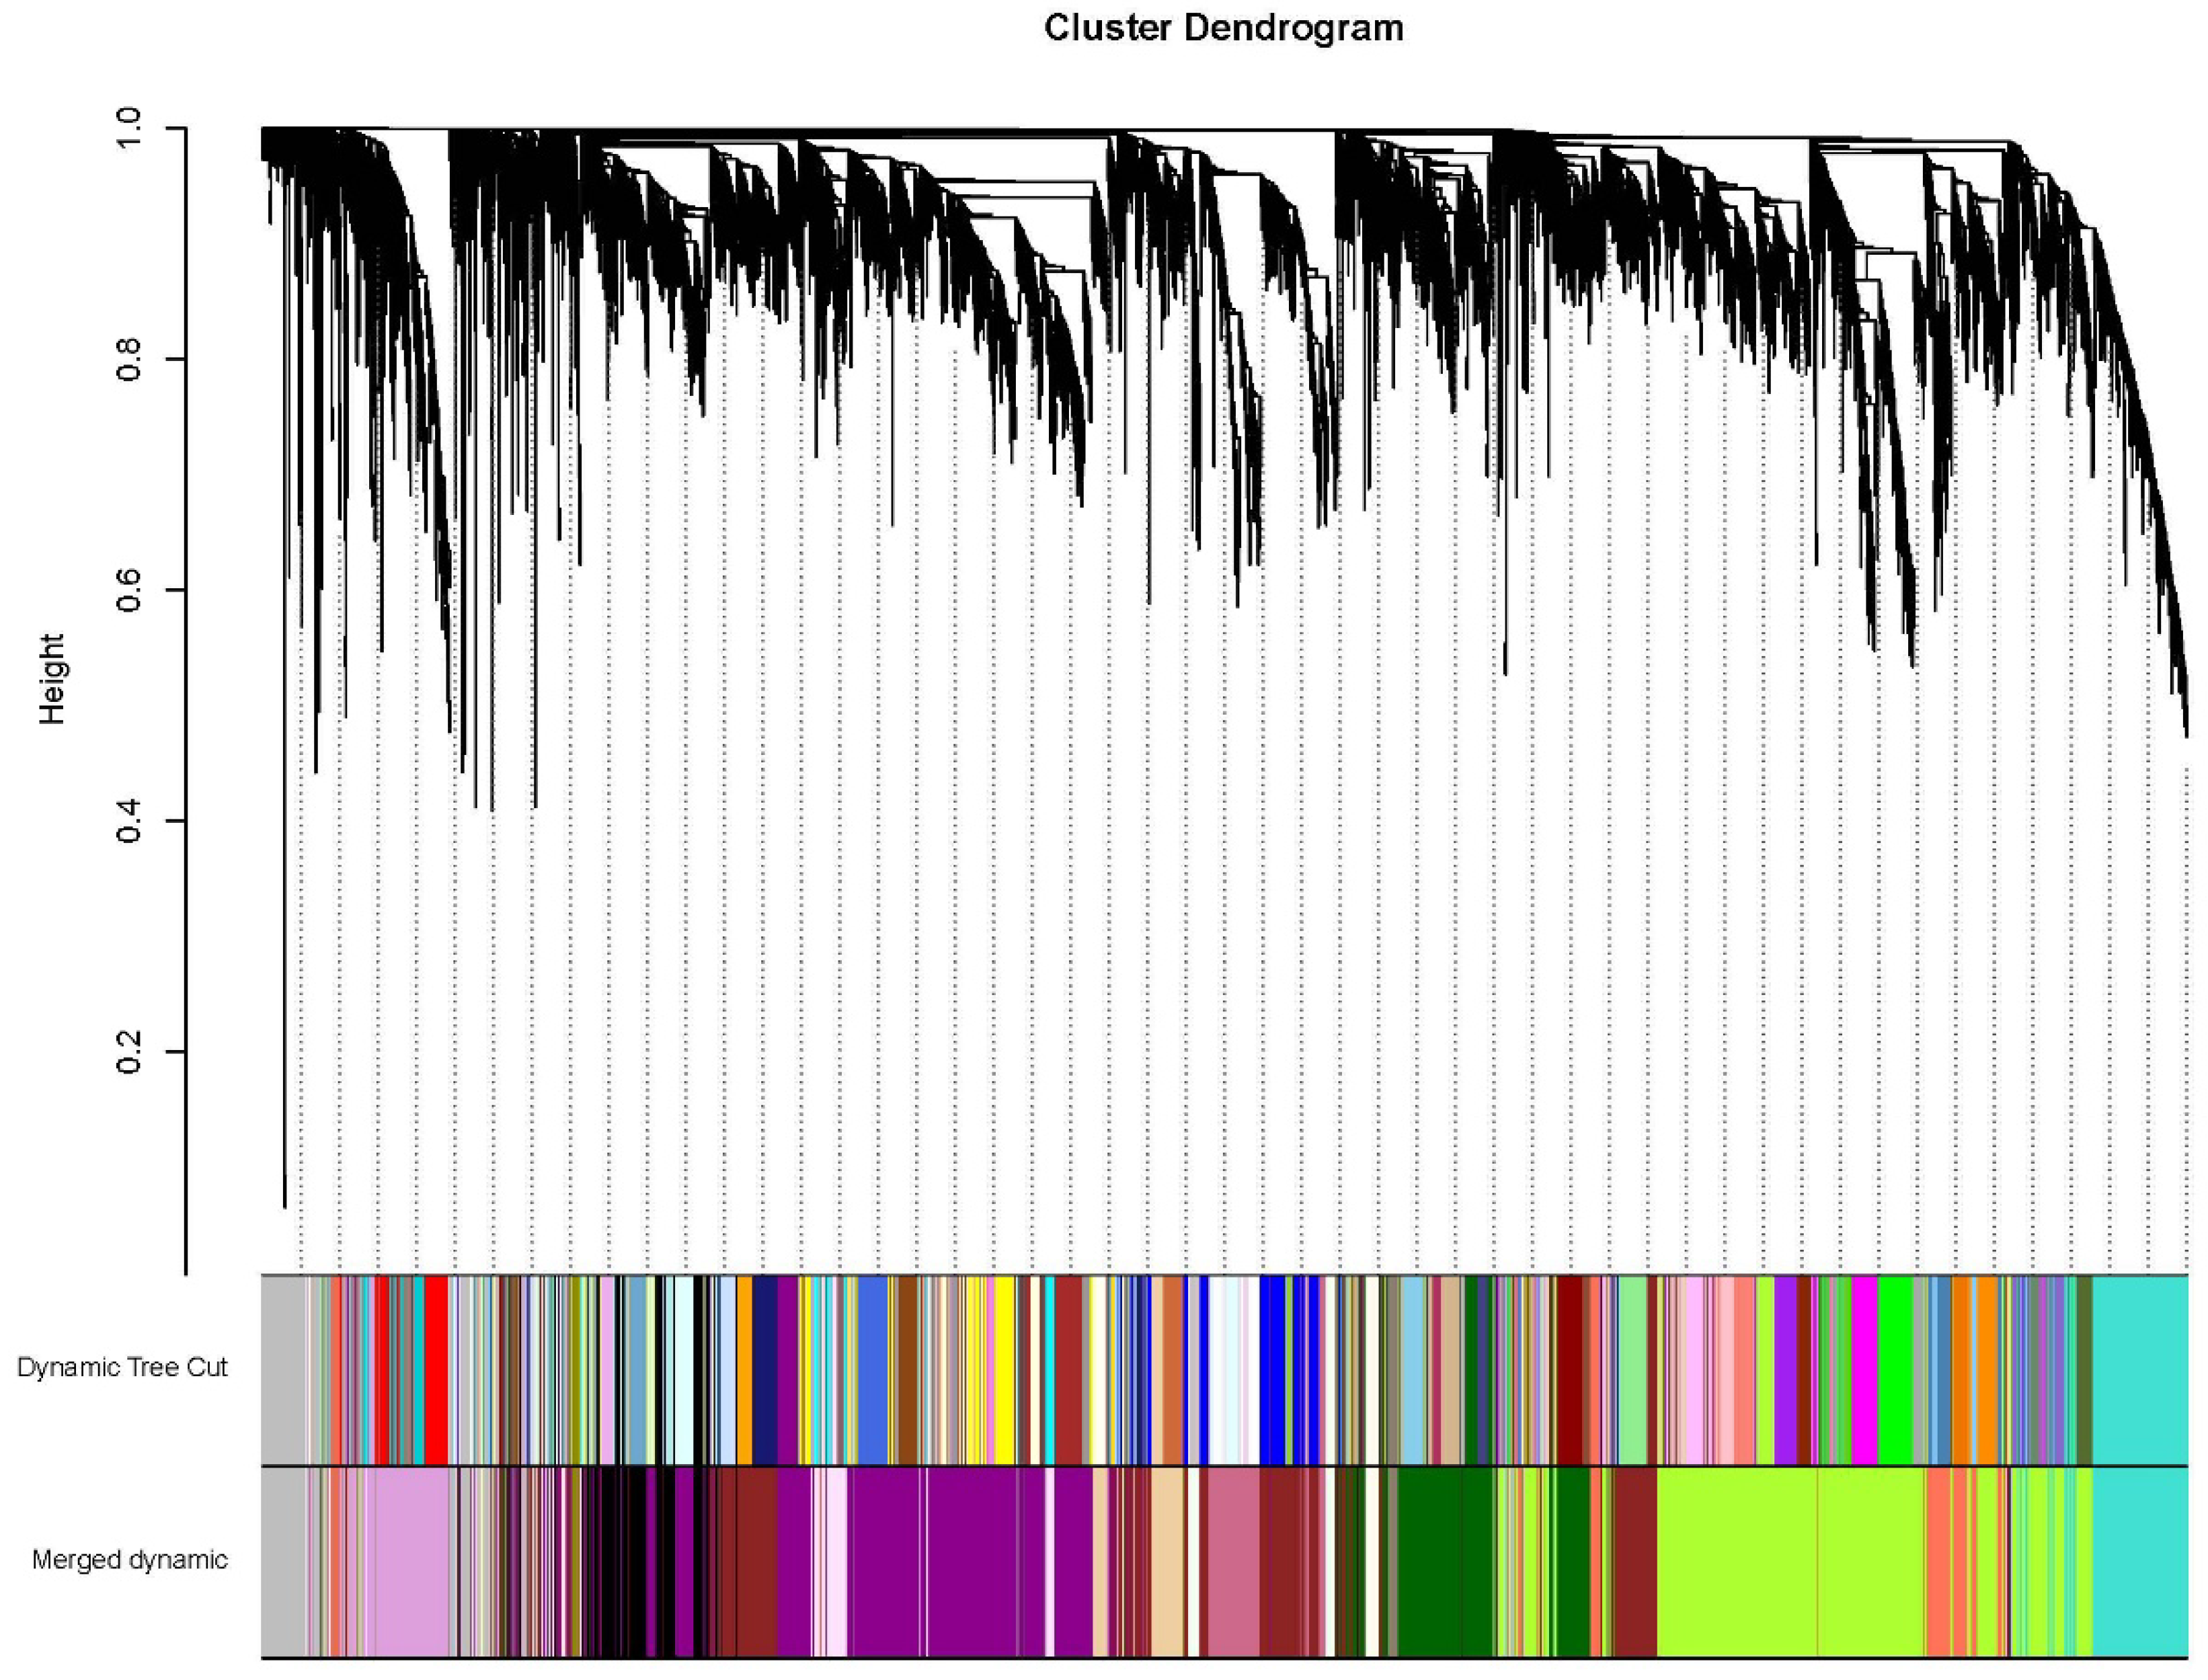
Figure 8.
Module-trait relationships. Each row corresponded to a module, and each column corresponded to a trait. OC: oil content; TSW: thousand-seed weight; TD: transverse diameters; LD: longitudinal diameters.
Figure 8.
Module-trait relationships. Each row corresponded to a module, and each column corresponded to a trait. OC: oil content; TSW: thousand-seed weight; TD: transverse diameters; LD: longitudinal diameters.
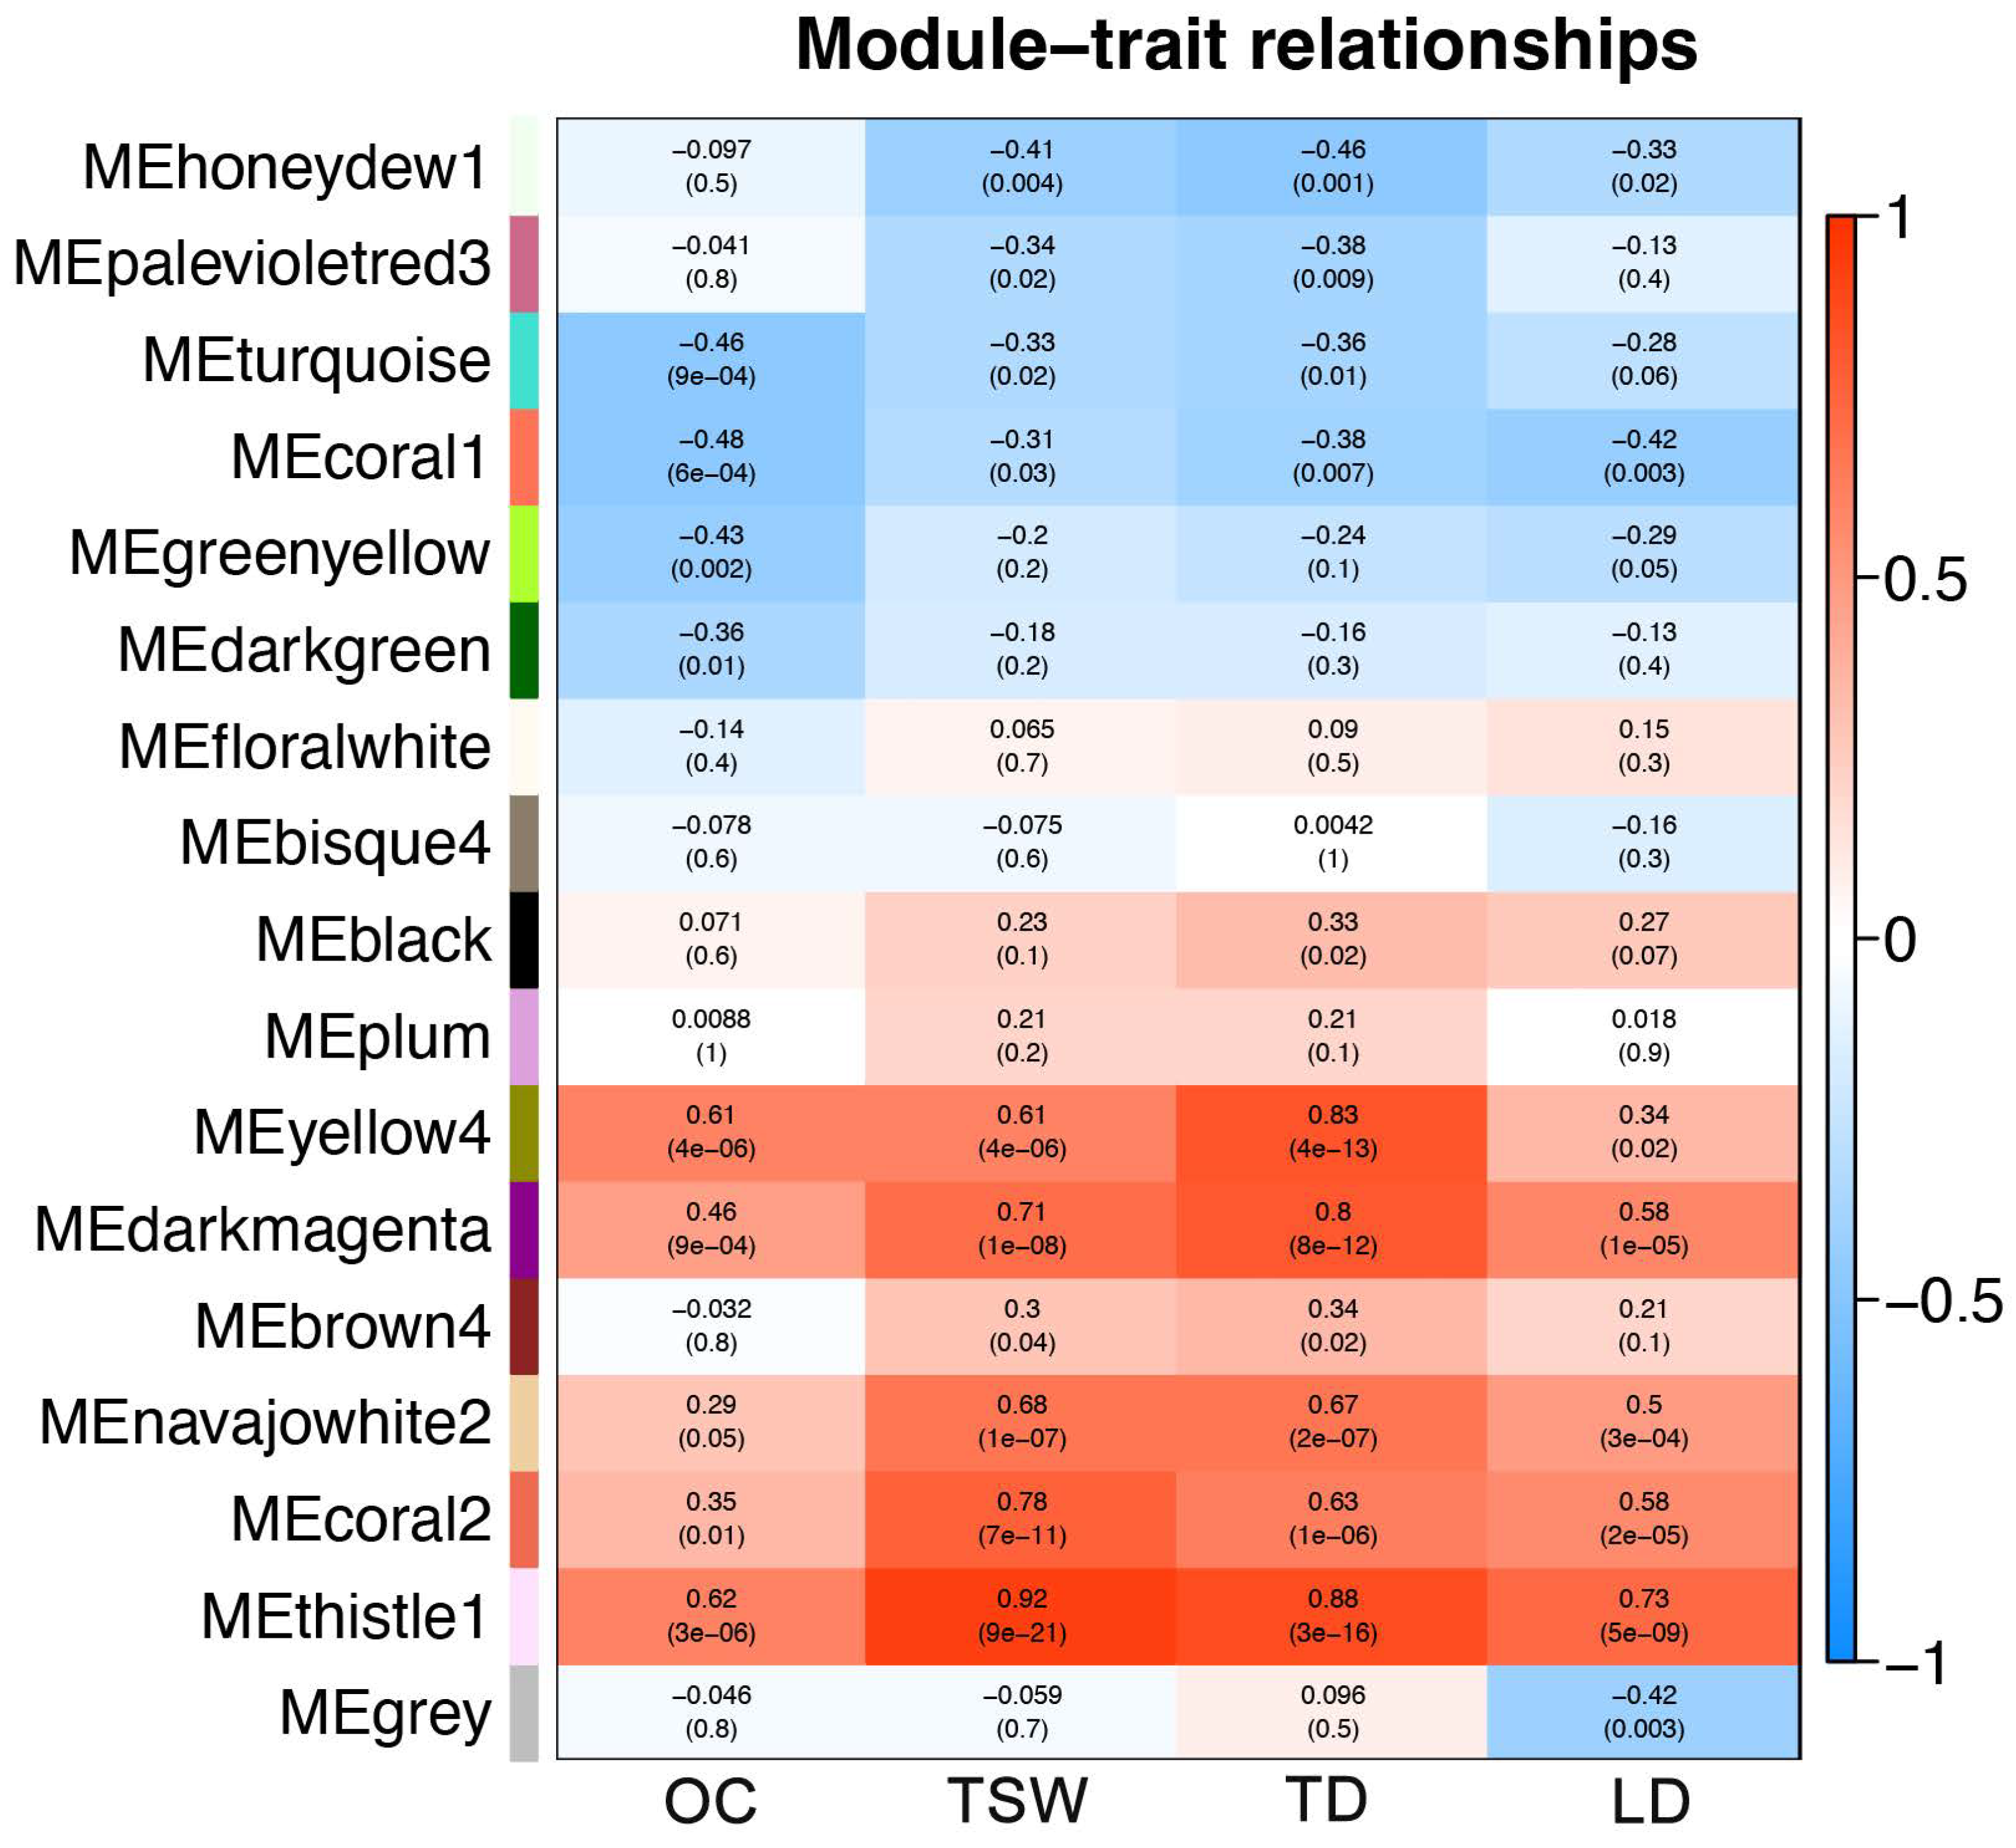
Figure 9.
Gene co-expression network analysis in five modules of yellow4 (A), darkmagenta (B), navajowhite2 (C), coral2 (D) and thistle1 (E).
Figure 9.
Gene co-expression network analysis in five modules of yellow4 (A), darkmagenta (B), navajowhite2 (C), coral2 (D) and thistle1 (E).
Disclaimer/Publisher’s Note: The statements, opinions and data contained in all publications are solely those of the individual author(s) and contributor(s) and not of MDPI and/or the editor(s). MDPI and/or the editor(s) disclaim responsibility for any injury to people or property resulting from any ideas, methods, instructions or products referred to in the content. |
© 2025 by the authors. Licensee MDPI, Basel, Switzerland. This article is an open access article distributed under the terms and conditions of the Creative Commons Attribution (CC BY) license (http://creativecommons.org/licenses/by/4.0/).
Copyright: This open access article is published under a Creative Commons CC BY 4.0 license, which permit the free download, distribution, and reuse, provided that the author and preprint are cited in any reuse.


