
Submitted:
09 February 2026
Posted:
10 February 2026
You are already at the latest version
Abstract
The Spotted Flycatcher is a long-distance migrant insectivore, breeding in western Eurasia and migrating to Africa south of the Sahara. This paper focuses on the annual variation of its southward post-breeding migration. It uses two monitoring datasets: bird ringing data of on passage through Bukowo-Kopań (Baltic Sea coast, N Poland), (14 August–1 November in 1967–2025); and bird atlas data from the Second Southern African Bird Atlas Project (2007–2025) between 24°–26°S and 27°–29°E, on the south of the species’ non-breeding range. For each dataset, we computed the annual anomaly as the area between the multi-year average cumulative curve and the annual curve of migration. The number of birds ringed per 50 mistnets was an index of migrants’ abundance each year. For the atlas data, we calculated an index of peak abundance at the end of arrivals. These four measures of migration were response variables, and indices of climate in Europe and Africa were explanatory variables in multiple regression models. The best models showed that the East-Atlantic/Western Russia oscillation in May–July was related to Spotted Flycatchers’ migration at Bukowo–Kopań and South Africa. May–September temperatures around the Baltic contributed to explaining interannual variation in passage at Bukowo-Kopań. October–November temperatures south of Sahel largely explained variation in arrivals in South Africa; these results are less robust due to 18 years available. We showed that climate at the breeding grounds and on route have combined carry-over effects on migrants, manifested similarly at distant locations along flyways.
Keywords:
migration phenology
; climate change
; long-distance migrant
; Operation Baltic ringing
; Second Southern African Bird Atlas Project
1. Introduction
The advancing spring phenology of long-distance migrant birds in the northern hemisphere over the last few decades in response to climate change has been well documented (e.g. Ahola et al. 2004, Hüppop & Hüppop 2003, Tryjanowski et al. 2005, Tøttrup et al. 2006, Both & te Marvelde 2007, Gordo 2007, Usui et al. 2017, Lehikoinen et al. 2019, Haest et al. 2020). However, analogous studies of shifts in autumn phenology are fewer because the intertwined effects of many factors, such as spring arrival timing, clutch number, migration distance, innate migration program, and environmental conditions, result in varied responses (Sokolov et al. 1999, Jenni & Kéry 2003, Gordo 2007, Gallinat et al. 2015, Miles et al. 2017, Haest et al. 2018). Short-distance migrants and multi-brooded species have shown a tendency to delay their post-breeding migration, while long-distance migrants and single-brooded species are prone to advance departure from the breeding grounds (Jenni & Kéry 2003, Gallinat et al. 2015, Halupka & Halupka 2017, Haest et al. 2018). Analogous studies of phenological shifts in long-distance migrants on their arrivals and departures in Africa are even scarcer, due to a paucity of long-term monitoring datasets on migrant birds (Altwegg et al. 2012, Bussière et al. 2014). We address the knowledge gap on climatic drivers of birds’ autumn phenology, using the long-distance migrant Spotted Flycatcher Muscicapa striata, which migrates between northwestern Europe and southern Africa, as our model species.
We have developed an approach to quantify the interannual variation in the timing of northward migration using the data from bird monitoring by ringing within the Operation Baltic project (Busse & Meissner 2015), to derive the annual anomaly of their arrivals from the long-term pattern, which we then related with large-scale and local climate indices (Remisiewicz & Underhill 2020, 2022a, 2022 b, 2025, Gołębiewski & Remisiewicz 2023). This approach has been successfully extended to investigate patterns of post-breeding migration to the south (Pinszke & Remisiewicz 2023). Recently, we developed an analogous algorithm to derive the annual anomaly from the long-term arrival pattern from monitoring bird atlas data gathered through the protocol of the Second Southern African Bird Atlas Project (SABAP2) (Underhill 2016, Underhill et al. 2017, Brooks et al. 2022, Lee et al 2022). The anomaly quantifies the timing and abundance of arrival and enables the investigation of possible sources of variation, including the influence of climate change (Underhill & Remisiewicz 2025). In this paper, we combine these strategies by relating the annual anomalies of southward migration of the Spotted Flycatcher in Poland and South Africa to climate indices. We expect that the timing and abundance would show some common relationships to climate indices because ringing recoveries indicate that at least some of the Spotted Flycatchers on passage through the Polish coast of the Baltic Sea are likely to have South Africa as their migration destination.
Some long-term phenological shifts in the timing of arrivals in South Africa and departures have been shown for several long-distance migrants by comparing the outcomes of two atlas projects, SABAP1 and SABAP2; these changes have been attributed to climate changes at the breeding grounds (Altwegg et al. 2012, Bussière et al. 2014). However, we have shown that in several long-distance migrant passerines, the interannual variation and long-term trends in the timing of northward migration in the Baltic region were related to large-scale climate indices at their non-breeding grounds in Africa more than to local conditions in Europe (Remisiewicz & Underhill 2022b, 2025). Thus, we expect that climate factors in Europe and Africa, along the southward migration routes, should also be related to the timing of arrival at stopover and final staging destinations in South Africa.
Considering the common breeding areas in the Baltic region of Spotted Flycatchers monitored by our projects, Operation Baltic and SABAP2, we set out to determine whether the timing and abundance of these birds at the southern Baltic coast, at the initial stage of their post-breeding migration, in South Africa, at the final stage of this migration, would be related to climate conditions at these breeding grounds. We also aimed to determine if and how the timing and abundance of Spotted Flycatchers in South Africa were related to conditions at the preceding stages of their migration over Africa.
2. Materials and Methods
2.1. Study Species
The Spotted Flycatcher is primarily an insectivore, hunting from a perch to feed on small flying insects, including flies, moths and butterflies, but on migration stopovers, they also eat berries (Davies 1977, Cramp & Perrins 1993, Hernández 2009, Chalpygina et al. 2018). On its breeding grounds, it occurs in open woodlands, parks and gardens (Cramp & Perrins 1993). In the northern part of its European range, it breeds during May–July, and can lay two clutches when breeding begins early (Cramp & Perrins 1993). In the UK, Spotted Flycatchers lay eggs earlier and have larger clutches when May is warm, but June clutches are larger with increased rainfall (O'Connor & Morgan 1982). This has been attributed to the positive effect of temperatures on flying insects' activity in May, but negative in June–July, when heat makes insects active and difficult to catch, so light rain benefits hunting success of aerial feeders (Davies 1977, O'Connor & Morgan 1982). Spotted Flycatcher breeds across Europe to central Asia (Figure 1).
It has Least Concern status (IUCN), although its European breeding population showed a moderate decline since the 1980s (PECMBS 2026), but the UK breeding population suffered 88% decline between 1970 and 2018 and since 2016 has been on the UK Red List (Banks et al. 2020). The reasons for the species’ decline across Europe include a decrease in insect availability due the use of pesticides and herbicides, nest predation, heat waves during the post-fledging period, droughts in the Sahel, and habitat loss across both the breeding and non-breeding range (Freeman & Crick 2003, Burgess et al. 2025).
The Spotted Flycatcher is a long–distance migrant, which cover up to 10 000 km between its breeding grounds in Eurasia and non-breeding grounds in Africa south of the Sahara Desert (Figure 1). Populations breeding west of 12°E migrate mostly to West Africa, and those breeding east of this migratory divide migrate to more eastern Africa, as far south as South Africa, north of 26°S (Cramp & Perrins 1993, Herremans 1997, Spina et al. 2022). They leave northern breeding grounds in August–September, and in some stopover location in Europe adults occur ahead of immatures, but in others immature are the first migrants (Cramp & Perrins 1993). In the Baltic region, adults occur as the first migrants, but most Spotted Flycatchers ringed on passage to the south are immatures, likely due to the “coastal effect” (Hyttiä et al. 1973, Busse & Halastra 1981, Payevsky & Shapoval 2024). This species migrates southward across Europe during September–October, and across Africa in October–November, to reach their non-breeding grounds in late October–early December, where they stay until late March–early April (Figure 2; Cramp & Perrins 1993, Herremans 1997). On the non-breeding grounds, the habitat is mostly savanna, an open woodland habitat which provides suitable hunting perches.
Spotted Flycatchers, which migrate in August–September through the southern coasts of the Baltic Sea, originate from the breeding grounds in the Baltic region and east of it, as indicated by ringing recoveries (Figure 1; Spina et al. 2022). They migrate mostly across the central and eastern part of the Mediterranean region, to central Africa, where their ringing recoveries concentrate in Gabon, Congo and Angola, and to northeastern South Africa, although a few recoveries also come from the Iberian Peninsula (Figure 1; Fransson & Hall-Karlsson 2013, Valkama et al. 2014, Spina et al. 2022, Payevsky& Shapoval 2024). Spotted Flycatchers, which stay November–March in northeastern South Africa, partly also originate from the breeding grounds in the Baltic region, but they can also come from more eastern areas, as the few ringing recoveries indicate (Figure 1), although no recoveries link southern Africa and Russia (Kharitonov et al. 2024).
2.2. Study Areas, Sampling and Method of Data Analyses
Our two datasets are linked by partly overlapping breeding origin of the studied populations of Spotted Flycatchers, with the Bukowo-Kopań (N Poland) located at the initial stage of their migration to the south, and the South African study area at their final destination.
2.2.1. Spotted Flycatcher Data from Ringing by the Operation Baltic
As the main dataset for the southern Baltic coast, we used the numbers of Spotted Flycatchers caught at the bird ringing station Bukowo-Kopań (54°20′56″–27′46″ N, 16°15′54″–24′38″ E) in N Poland, as a part Operation Baltic project. The station operated on narrow spits between the Baltic Sea and the coastal lakes Bukowo and Kopań, which concentrate flocks of migrants (Figure 1). Birds were mist-netted daily, from dawn to dusk, according to the monitoring protocol of the Operation Baltic (Busse & Meissner 1995), during autumn migration (14 August and 1 November) in 1967–2025; this period covered the whole autumn passage of the Spotted Flycatcher in the Baltic region (Cramp & Simmons 1993). Mist nets were open in pine and broadleaved forests and in bushes on dunes, and in reedbeds with willows. The number of 7-m-long mist nets was stable during each season, but it ranged from 25 to 76 in different autumns (Supplementary Material, Table S1). Mist nets were closed during extreme wind or rain, and such days were at most four per autumn season. Birds were extracted from mist nets, ringed and measured according to the Operation Baltic standard (Busse & Meissner 1995). Spotted Flycatchers were identified and aged according to plumage, but not sexed, because they lack clear sexual dimorphism (Svensson 1992, Demongin 2016). More details on the methods used at this station are provided by Maciąg & Remisiewicz (2025).
Additionally, as the background information on breeding origin and migration routes, we used ringing recoveries of Spotted Flycatchers caught at Bukowo-Kopań and three other coastal stations of the Operation Baltic project and ringed or recovered elsewhere up to 30 June 2025 (Figure 1). These ringing recoveries were the effect of ringing at the stations: Bukowo-Kopań in autumns 1965–2025 and springs (23 March–15 May) in 1982–2025, Mierzeja Wiślana in autumns 1965-2025, at Hel in springs 1965–2025, and Wapnica in autumn 1966 (Figure 1). Some Spotted Flycatchers caught at Bukowo-Kopań station possibly came from the local breeding population, but we have never observed any breeding pairs or recaptured locally ringed birds during spring and summer (MR pers. obs); thus the mist-netting location is a stopover site rather than a breeding site. Catching and ringing of birds at all four stations were conducted with a permit from the General Directorate for Environmental Protection, Poland, and the annual approval of the Polish Bird Ringing Centre of the Polish Academy of Sciences, and with the approval of relevant land management authorities.
2.2.2. Methods of Analysing the Ringing Dataset from the Operation Baltic Project
Small gaps in data on single days when the nets were closed were imputed with bird numbers averaged from the catches of that species on that day in six earlier and six later years, in relation to the total number of the birds caught in these years, as in other studies (Redlisiak et al. 2018, Remisiewicz & Maciąg 2025). In 2011, Bukowo-Kopań did not operate, and in five years, fewer than 10 Spotted Flycatchers were caught, so we excluded these years from analyses. Thus, we analysed data from 53 autumns during 1967–2025. We used only the first capture date for each individual. For analyses, we merged adults and immatures, as the latter group formed >90% of Spotted Flycatchers due to the “coastal effect” (Payevsky 1995). Based on the ringing data, we summed up all Spotted Flycatchers caught each day of the autumn season at Bukowo-Kopań, and recalculated it to the daily percentages of the total numbers caught that autumn. These daily percentages in subsequent days were summed up into a cumulative curve of passage in each autumn. For each day, the values from these curves were averaged across the analysed years to derive the multi-year average cumulative curve of autumn passage. Next, for each year, we calculated the Annual Anomaly (AA) for each year as the departure of the cumulative curve for that autumn from the average curve of autumn passage in 1967–2025 (Remisiewicz & Underhill 2020 WW1). Negative and positive values of AA indicated earlier and later passage, respectively, than the multi-year average curve. We then used the time-series of AAs in 1967–2025 as the measure of the overall autumn migration timing at BK, as in our earlier papers (Remisiewicz & Underhill 2020, 2022a, 2025, Pinszke & Remisiewicz 2023). We also used the number of birds caught each autumn (nAB), recalculated for 50 mistnets of 7m length, as the measure of the abundance of Spotted Flycatchers during autumn passage, as in earlier papers (Remisiewicz & Underhill 2022b, Remisiewicz & Maciąg 2025).
2.2.3. Spotted Flycatcher Dataset from South Africa
There is no long-term bird observatory in southern Africa to generate data comparable to that described for Bukowo-Kopań. To do an analogous analysis in South Africa, we used data from the Second Southern African Bird Atlas Project (SABAP2) (Underhill 2016, Underhill et al. 2017, Brooks et al. 2022, Lee et al. 2022). We used bird atlas data from the start of SABAP2 in July 2007 up to February 2025; the project is ongoing. We downloaded the SABAP2 data for the Spotted Flycatcher for the region of South Africa for which data volumes were substantial and where the species winters (24°–26°S and 27°–29°E) (Figure 1). For each non-breeding season we made use of the data collected between 1 July and 31 January of the following year, for 18 seasons between 2007/08 and 202/425.
The SABAP2 data consist of comprehensive species list within units of space called pentads, 5’ north to south and 5’ east to west (Underhill 2016, Brooks et al. 2022). SABAP2, and its predecessor SABAP1 have made extensive use of the concept of the reporting rate for species, defined as the number of lists on which the species was recorded divided by the total number of lists (Harrison & Underhill 1997, Underhill 2016, Brooks et al. 2022). In this context, Harrison & Underhill (1997) discussed the value of, and caveats to, the use of reporting rates for species. These limitations do not apply to the Spotted Flycatcher; reporting rates thus provide insights into its migration phenology.
Overall, there is consensus that, within a species, a relationship exists between bird abundance and reporting rates (Underhill 2016, Brooks et al. 2022, Lee et al. 2022). As abundance increases, so do reporting rates (Robertson et al. 1995). The First Southern African Bird Atlas Project (SABAP1) made extensive use of the reporting rate concept, justified by the discovery that reporting rates provided a quantitative description which coincided with the qualitative understanding of the phenology of migration (Underhill et al. 1992). Reporting rates provide an “index” of the relative abundance of a species at the time of the survey. The reporting rates are monotonic; they increase with abundance, with no functional mathematical relationship.
In the initial development of the concept of reporting rates for bird species, it was assumed they provided an index of relative abundance, with caveats to their interpretation (Linsdale 1928). A bird atlas project in the state of Wisconsin, USA, used reporting rates (Temple & Temple 1984) and Spearman’s rank correlation to demonstrate a strong positive relationship between actual counts and reporting rates. The choice of Spearman’s rank correlation acknowledged an understanding that the relationship between abundance and reporting rate was non-linear but monotonically increasing.
2.2.4. Methods of Analysing the Atlas Dataset from South Africa
We computed daily reporting rates for Spotted Flycatchers from 1 July to 31 January the following year. We did this for both the individual seasons and for the period as a whole. There were 18 seasons of data (Season 1: 1 July 2007 to 31 January 2008, …, Season 18: 1 July 2024 to 31 January 2025).
This analysis considers two parameters of the annual reporting rate patterns:
(1) MRR: the average maximum of mid-summer reporting rate reached at the completion of migration, which quantifies the abundance of Spotted Flycatchers in each season;
(2) SAA: the annual anomaly of arrivals in South Africa, which quantifies whether the pattern of arrival of migrants in each season was early or late relative to the 19-year average pattern.
The “average maximum” for a season was defined as the median of the reporting rates between 11 and 31 January (of the following year – e.g. the “average maximum” reached during the 2007/2008 arrival period was taken as the median of the reporting rates for the final three weeks of January 2008). We term this the “achieved midsummer reporting rate”. We chose this period of January for this purpose because this is when the least movement takes place; southward migration is complete, and northward migration has not yet begun (Herremans 1997).
Based on the underlying concept developed by Remisiewicz & Underhill (2020), we applied an “annual arrival anomaly” to measure how early or late arrival was in each season in relation to the long-term (2007–2024) average pattern. The concept in Remisiewicz & Underhill (2020) was to cumulate the number of birds ringed on a daily basis during the season to estimate the pattern and timing of arrival in that year in relation to the multi-year average. With the reporting rates we use here, the cumulative effect is built into the observation process, because individuals of the species which have already arrived are available to boost the reporting rate; in other words, the reporting rates measure not only the birds which arrived on the day, but also previous arrivals.
However, the reporting rates for individual days are based on sampling, and as a result of sampling variability, the rates do not increase steadily through the arrival period, although the overall pattern is clearly upwards. To overcome this problem, we followed the method of Underhill & Remisiewicz (2025) and calculated the monotonic regression of daily reporting rates in each season in each region. One of the first applications of monotonic regression appears to have been in non-metric multidimensional scaling (Kruskal 1964a, b), and the properties of the method and the algorithm are described there. In our context, given reporting rates r1, r2, …, r215 for the days from 1 July to 31 January, the monotonic regression is a set of values d1, d2, … d215 having the properties that d1≤d2≤…≤d215, and Σ(ri–di)2 is minimised. In other words, the monotonic regression creates an increasing set of numbers as close as possible to the erratically but steadily increasing reporting rates during the arrival period. The do not increase linearly, and large blocks are identical numbers.
We computed the monotonic regression of arrival for the overall 18-year period and for each of the 18 seasons. As done by Remisiewicz & Underhill (2020), we define the anomaly for a season as the sum of the daily differences between the values of the overall monotonic regression for all 18 seasons and those from the monotonic regression for the season. These differences have a sign, positive or negative, which is retained. If the monotonic regression for the season lies above and to the left of the overall pattern, then the bulk of the differences are negative, the anomaly is negative and arrival was early in that year. If the differences are positive, then migration was late in relation to the overall multiyear pattern, used as a baseline.
We did not calculate the annual anomalies over the full 215-day period from 1 July to 31 January. We examined the data for each of the 18 years, and chose a starting date five days before the year in which reporting rates started to increase in response to arrival, with a similar strategy to choose the end date.
2.2.5. Multi-Year Trends in Both Datasets
To check for any long-term trends in the timing of post-breeding migration, we analysed the Annual Anomalies (AA) of Spotted Flycatcher passage at Bukowo-Kopań over 1967–2025 using the linear regression against year. Analogously, we checked for multi-year trends over 2007–2024 for the SABAP2 data.
2.3. Climate Indices
We used climate variables, which were large-scale climate indices and temperatures averaged over large regions of Europe and Africa, as we can only assume general migration routes of Spotted Flycatchers migrating between northern Europe and southern Africa, based on ringing recoveries (Figure 1).
For the Bukowo-Kopań dataset, we used large-scale climate indices that shape the climate in northern Europe, and temperatures in three areas of the Baltic region (Table 1). We used annual averages of these indices during the breeding period (May–July) and during the first stage of migration to the south (August–September) . We aimed to identify the influence of these climate indices on the timing of passage of Spotted Flycatchers during breeding and migration (Figure 2).
The timing of arrival of Spotted Flycatchers in South Africa is likely to be influenced by the same climate factors in northern Europe as we used for Bukowo-Kopań, and also by conditions in sub-Sahelian Africa. Thus, we averaged the climate indices that operate in eastern and southern Africa (IOD, SOI), and temperatures in four regions of central and southern Africa in October–November (Table 2), when Spotted Flycatchers migrate over these regions (Cramp & Perrins 1993).
2.4. Multiple Regression Models for Bukowo-Kopań
We used 12 climate variables and the Year (Table 1) as explanatory variables in multiple regression models, to explain the variation in timing of Spotted Flycatcher passage at Bukowo-Kopań, reflected by the Annual Anomaly (AA), and in their abundance, reflected by their standardised numbers (nAB), in over 1967–2025. We used these as response variables to quantify passage at Bukowo-Kopań. We standardised all response and explanatory variables so that they had a mean of 0 and a standard deviation of 1. Because we had 53–58 years of data available, problems of overfitting were unlikely to be serious (Hawkins 2004). Despite that, we modelled cautiously, including only eight climate variables in one model, taking account of hazards such as multicollinearity (using Variance Inflation Factors), influential points (Cook’s distance), and overfitting (Dormann et al. 2013). We used the “all subsets regression” approach, and selected the best models using the Akaike Information Criteria corrected for small sample size (AICc), using the package “MuMIn 1.43.6” (Bartoń et al. 2019) in R 4.3.3 (R Core Team 2025). Details of the use of multiple regressions are provided in our earlier studies (Remisiewicz & Underhill 2020, 2022a, 2022b, 2025).
2.5. Multiple Regression Models for SABAP2 Data
We modelled two response variables: the timing of annual arrival of Spotted Flycatchers to South Africa (SAA), and their Maximum Midsummer Reporting Rates (MRR), which reflected the maximum abundance (Table 2). The SABAP2 dataset included 18 seasons, so a maximum of two explanatory variables could be fitted in regression models (Underhill & Remisiewicz 2025); this limits the hazards of over-fitting (Hawkins 2004). We used a forward stepwise procedure of model selection, allowing a maximum of two explanatory variables, starting with a null model, and subsequently adding variables that provide the greatest improvement at each step until a stopping rule is met. We did all subsets regression using the RSEARCH procedure in Genstat v. 22 (VSN International, 2022), and selected the best model using AIC and percentages of variances explained (AdjR2). Unlike the Bukowo-Kopań dataset, where the sample sizes were large enough for the standard interpretations of statistical analysis to be valid, the small sample size from South Africa means that the analyses need to be regarded as exploratory, in the sense of Tukey (1977), even though the same multiple regression methods were used for both datasets. Thus, for the South African component of the data, quantities such as percentage variation explained need to be treated at face value, rather than against the background of statistical significance.
3. Results
3.1. Multi-Year Trends of Spotted Flycatchers at Bukowo-Kopań and in South Africa
The post-breeding migration of the Spotted Flycatchers at Bukowo-Kopań occurs from mid-August till the first decade of October (Busse & Halastra 1981). The timing of this passage, reflected as AA, showed a nearly significant tendency to earlier passage over 1967–2025, and large year-to-year variation (Figure 3A). The number of Spotted Flycatchers caught at that station had no trend over 1967–2025, but also showed high interannual variation (Figure 3B). The timing and the numbers of Spotted Flycatchers in subsequent years were not correlated (r=0.14, p<0.05, n=53 years). The Anomaly of Arrivals in South Africa (SAA) showed interannual variation, but no trend (Figure 3C), while the Maximum Reporting Rate (MRR) showed a significant decreasing trend over 2007–2024 (Figure 3D). Multi-year trends did not explain much of the variation in our data, thus we set out to assess if the climate conditions at the breeding grounds would better explain the interannual variation at both study areas.
3.2. Relationships Between the Timing and Abundance of Spotted Flycatchers on Passage at Bukowo-Kopań and on Arrival in South Africa During 2007–2024
The Annual Anomaly of the autumn passage of Spotted Flycatcher through Bukowo-Kopań was correlated neither with their Annual Anomaly of Arrivals (r= –0.13), nor with the Median End of Arrivals in South Africa (r=0.12, for both correlations p < 0.0125, adjusted by Bonferroni correction), during 16 years common for both monitoring schemes during 2007–2024. The numbers of this species caught at Bukowo-Kopań were also correlated with neither measure of their arrivals in South Africa (r=0.31, r=0.20 respectively, p < 0.0125), for 17 common years in this period. Neither parameter of migration for Bukowo-Kopań showed any significant trend over 2007–2024.
3.3. Relationships of the Timing and Abundance of Spotted Flycatchers at Bukowo-Kopań to Climate Variables at the Breeding Grounds
For Bukowo-Kopań, the final multiple regression model explained over 19% of variation in AA over 1967–2025 with the combined effect of three climate variables: NAO in May–July, and temperatures in the Western Baltic region in May–July and Aug–Sept (Table 3; model selection in Tables S3–S4). The autumn passage of Spotted Flycatchers at Bukowo-Kopań was early with high temperatures in the Western Baltic region in both periods, as indicated by their negative effects on AA, and with low NAO, which had a positive effect (Table 3).
The best model explained nearly 11% of the variation in the numbers over 1967–2025 with the effects of NAO and EAWR in May–July. Birds were caught in greater numbers after low NAO and high EAWR, as indicated by opposite signs of these effects (Table 3; model selection in Tables S3–S4).
3.4. Relationships Between the Timing and Abundance of Arrivals in South Africa and Climate Variables
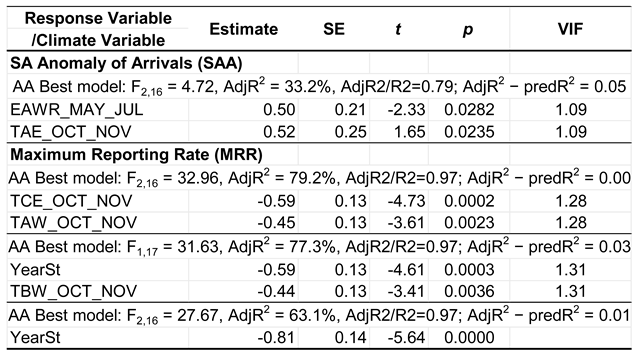
The best models for the Anomaly of arrivals explained 33% in the timing of Spotted Flycatcher arrivals in South Africa, by the effects of EAWR in May–July and of temperatures in southeastern Africa (TAE) in October–November (Table 4).
Both these effects were positive, i.e. with low values of each index, the birds arrived in South Africa late, and vice versa – with high index values, they arrived earlier.
The combined effects of temperatures in the eastern part of central Africa (TCE) and in the western part of southern Africa (TSW) accounted for 79% of the variation in the peak abundance of Spotted Flycatchers in South Africa, expressed by MRR; this model was not overfitted and had a good predictive value. This model indicated that Spotted Flycatchers were more abundant in South Africa when temperatures in these regions, likely along their migration routes to South Africa, were lower (Table 4).
4. Discussion
The EAWR oscillation pattern has largely been neglected in analyses of the phenology of bird migration, despite its role in shaping the climate in northern Europe in combination with the NAO. However, our results demonstrate that it was related to patterns in Spotted Flycatcher migration not only in the Baltic region but also in South Africa. This suggests that the influence of conditions on the breeding grounds was carried over and manifested at the arrival at the final non-breeding destination, about 10 000 km away. We also revealed that temperatures north of each study area were related to the timing and abundance of Spotted Flycatchers. We discuss these results in the context of the possible effect of climate change and increasing temperatures across the migrants’ geographical range.
4.1. Relationships Between Timing and Abundance of Spotted Flycatchers in the Baltic Region and South Africa, and Conditions at the Breeding Grounds
4.1.1. Influence of Large-Scale Climate Indices
Studies on the influence of environmental conditions on autumn migrants have mostly focused on the temperatures, rarely also on precipitation and winds, but almost none on the influence of large-scale oscillation patterns (Haest et al. 2019, Pinszke & Remisiewicz 2023, Maciąg & Remisiewicz 2025, Deng et al. 2025). NAO and EAWR are the most important atmospheric oscillation patterns, which together with SCA, jointly shape the climate in Europe (Rust et al. 2015, Craig & Allan 2021). The relationship between EAWR and birds’ autumn phenology in Eurasia has been described for cranes (Volkov et al. 2016) and birds of prey (Chen et al. 2025), but up to our knowledge has never been related with the passage of smaller birds, despite a considerable effect of this oscillation on conditions om northeastern Europe (Rust et al. 2015, Craig & Allan 2021).
A positive EAWR index in summer is associated with high-pressure systems and higher-than-average temperatures over Sweden, Finland, and the Baltic States (World Climate Service 2025). After a positive EAWR in May–July more Spotted Flycatchers were caught on migration at Bukowo-Kopań, which suggests that such conditions benefit breeding success of Spotted Flycatchers. Good breeding success with positive EAWR might reflect more frequent second clutches during early and warm springs and summers in the north, and also increased survival of offspring when it is warm, and insects are abundant. It is striking that the influence of EAWR in May–July been pronounced at the Spotted Flycatchers’ arrival in South Africa. The Arrival Anomaly in South Africa takes a positive value if the migrants begin arriving at their usual time, but their arrival extended longer than the multi-year average. If high positive EAWR promote Spotted Flycatchers’ breeding success, the arrival of adults and immatures from two broods to South Africa would likely extend longer than after colder springs with single broods, hence the positive relationship we noticed for this index and the arrival timing (SAA), not on the birds’ abundance (nAB), as at Bukowo-Kopań.
The influence of NAO on spring migration phenology in Europe has been demonstrated for many species (Rainio et al. 2007, Hüppop & Hüppop 2003, Stervander et al. 2005), studies on its effect on autumn migration phenology in Europe are scarce (Haest et al. 2019), though such a relationship has been shown for North American songbirds (Van Buskirk et al. 2009). Haest et al. (2019) identified some relationships between NAO and the mean autumn passage date of Garden Warblers, at Heligoland (Germany), although temperature, precipitation and wind in northern Europe better explained its year-to-year variation; that study did not include the Spotted Flycatcher. In our study, NAO in May–July explained a part of the interannual variation in the Spotted Flycatcher autumn phenology in the Western Baltic region, probably because it shapes not only temperature, but also other weather parameters. Summer NAO was also related to both the timing and abundance of Spotted Flycatchers on autumn passage at Bukowo-Kopań. The positive summer NAO brings sunny weather and increased risk of heat and drought in northwestern Europe (Linderholm et al. 2008). Such conditions in the Western Baltic region during breeding season are likely to impede the breeding success of Spotted Flycatcher, hence their late and less numerous passage through Bukowo after summers with high NAO. The opposite effect, early and abundant passage with low summer NAO, might be related to rainfall and clouds, which improve feeding conditions for Spotted Flycatchers in hot late summer (Davies 1977, O'Connor & Morgan 1982).
4.1.2. Influence of Temperatures
When May–September was warm across the Western Baltic region during the breeding and post-breeding seasons (Figure 2), the passage of Spotted Flycatchers at Bukowo-Kopań was relatively early (Table 2). This corresponds with studies from their breeding grounds in the UK, which showed that warm and sunny breeding seasons, especially May, were correlated with early and large clutches, probably due to increased availability of flying insects for Spotted Flycatchers (Davies 1977, O'Connor & Morgan 1982). Our results correspond with those of Haest et al. (2019), who showed that the Pied Flycatcher Ficedula hypoleuca, another insectivore, during 1960–2014 migrated in autumn through Heligoland early after warm summers (May–July) in Scandinavia.
The earlier arrivals of Spotted Flycatchers with lower temperatures in southeastern Africa (TAE) in October–November might be linked to increased availability of flying insects to insectivorous birds during light rain and cloudy conditions in hot and dry climates (Peach et al. 1991, Allan et al. 1997). Thus, cooler conditions at the last stages of their migration might promote their early arrival in South Africa. The temperatures in sub-Saharan Africa in October–November, all of which showed an increasing trend over 2007–2024, explained the variation in abundance (MRR) of Spotted Flycatchers' arrival in South Africa better than just the year alone (Table 3). Thus, we suggest that the multi-year increase in temperatures, and too hot conditions being unfavourable for Spotted Flycatchers’ feeding, might have contributed to the decreasing trend in this species’ abundance in South Africa over 2007–2024, shown by the SABAP2 dataset.
The results obtained here from the bird atlas data for South Africa are consistent with those obtained for the Barn Swallow (Underhill & Remisiewicz 2025). Arrival anomalies for three regions of South Africa were related to climate indices experienced by the birds in the months prior to arrival on the breeding grounds and along the migration route. This paper adds a fourth example of the analysis approach, and helps confirm the utility of the algorithms and methods. One common factor in both that paper and this analysis is the skill of the climate variables to explain the midsummer reporting rates at the end of arrival period. This has been a neglected component in analyses of the bird atlas data in South Africa. The country’s position at the distant end of migration routes results in it being the area where increases and decreases in population sizes will first be evident. For example, if populations decrease, most birds will be able to find non-breeding season territories farther north, and the decrease in the southern limits of migration will tend to be exaggerated. This adds a level of value to the data collected by the Second Southern African Bird Atlas Project.
5. Conclusions
This study showed that the phenology of southwards migration of Spotted Flycatchers, both on passage through the Baltic region and on arrival at their southernmost migration destination in South Africa, is influenced cumulatively by climate conditions to the north of each locality. Even the timing of arrival in South Africa is influenced by conditions on the breeding grounds. The results from Poland can be considered definitive, because of the long-term dataset (58 years), whereas the results from South Africa need to be treated as exploratory due to the shortness of the dataset (18 years). This analysis pioneers a collaborative approach to studying the phenology of migration, which would be further strengthened by the addition of datasets from analogous projects from other localities along the flyway. This paper demonstrates the value of long-term projects. We therefore recommend that the Operation Baltic project and the Second Southern African Bird Atlas Project be continued and funded sustainably into the future.
Supplementary Materials
The following supporting information can be downloaded at the website of this paper posted on Preprints.org.
Acknowledgments
We are grateful to the citizen scientists who collected the two datasets which we used in this paper. The Second Southern African Bird Atlas Project is globally unique in that its fieldwork protocol enables the opportunity to undertake the analyses performed here. Collecting monitoring data at Bukowo-Kopań station since 1960’s was possible only thanks to the work of thousands of citizen scientists coordinated by organising teams of the Operation Baltic project. This Baltic project has been supported over the years by the Special Research Facility grants (SPUB) from the Polish Ministry of Education and Science. We acknowledge all the weather data providers and the teams of Climate Explorer, a joint initiative of the Royal Netherlands Meteorological Institute (KNMI), the World Meteorological Organization (WMO) European Centre for Medium-Range Weather Forecast in the European Climate Assessment, Climate Explorer, and the US National Oceanic and Atmospheric Administration, National Weather Service, Climate Prediction Center, who made all the meteorological data available. Agata Pinszke prepared the map in Figure 1.
References
- Ahola, M.; Laaksonen, T.; Sippola, K.; Eeva, T.; Rainio, K.; Lehikoinen, E. Variation in Climate Warming along the Migration Route Uncouples Arrival and Breeding Dates. Global Change Biology 2004, 10, 1610–1617. [Google Scholar] [CrossRef]
- Allan, D.G.; Harrison, J.A.; Herremans, M.; Navarro, R.; Underhill, L.G. Southern African geography: Its relevance to birds. In The Atlas of Southern African Birds. Volume 1: Non-Passerines; Harrison, J.A, Allan, D.G., Underhill, L.G., Herremans, M., Tree, A.J., Parker, V., Brown, C.J., Eds.; BirdLife South Africa: Johannesburg, South Africa, 1997; pp. lxv–ci.
- Altwegg, R; Broms, K; Erni, B; Barnard, P; Midgley, GF; Underhill, LG. Novel methods reveal shifts in migration phenology of Barn Swallows in South Africa. Proceedings of the Royal Society of London B 2012, 279, 1485–1490. [Google Scholar] [CrossRef] [PubMed]
- Banks A, Caldow R, Donelan JL, Douse A, Duigan C, Foster S, Frost T,.
- Bartoń, K. MuMIn: Multi-Model Inference, Version 1.43.6. R Package. 2019, 1–75. [Google Scholar]
- BirdLife International Datazone. 2025. Available online: https://datazone.birdlife.org/search?search=Spotted%20FLycatcher (accessed on 1 December 2025).
- BirdLife International. Muscicapa striata. The IUCN Red List of Threatened Species. 2019. Available online: https://www.iucnredlist.org/species/22712252/137668645 (accessed on 1 December 2026).
- Both, C.; te Marvelde, L. Climate change and timing of avian breeding and migration throughout Europe. Climate Research 2007, 35(1-2), 93–105. [Google Scholar] [CrossRef]
- Breiman, L.; Freedman, D. 1983How many variables should be entered in a regression equation? J. Am. Statist. Assoc. 78, 131–136. [CrossRef]
- Brooks, M; Rose, S; Altwegg, R; Lee, ATK; Nel, H; Ottosson, U; Retief, E; Reynold, C; Ryan, PG; Shema, S; Tende, T; Underhill, LG; Thomson, RL. The African Bird Atlas Project: a description of the project and BirdMap data collection protocol. Ostrich 2022, 93, 223–232. [Google Scholar] [CrossRef]
- Burgess, M. D.; Sheehan, D. K.; White, P. J.; Anderson, G. Q.; Fisher, G.; Grice, P. V.; Peach, W.J.; Norris, K. Inadequate reproductive success is a potential cause of Spotted Flycatcher (Muscicapa striata) population decline in England. Ibis 2025. [Google Scholar] [CrossRef]
- Busse, P; Meissner, W. Bird Ringing Station Manual; De Gruyter Open Ltd; Warsaw/Berlin, 2015. [Google Scholar]
- Busse, P.; Halastra, G. Jesienny przelot ptaków na polskim wybrzeżu Bałtyku. [Autumn migration of birds at the Polish coast of the Baltic Sea]. Acta Ornithologica 1981, 18(3). [Google Scholar]
- Bussière, E.M.S.; Underhill, L.G.; Altwegg, R. Patterns of Bird Migration Phenology in South Africa Suggest Northern Hemisphere Climate as the Most Consistent Driver of Change. Global Change Biology 2015, 21, 2179–2190. [Google Scholar] [CrossRef]
- Chalpygina, A.B.; Savynska, N.O.; Brygaryrenko, V.V. Trophic Links of the Spotted Flycatcher, Muscicapa striata, in Transformed Forest Ecosystems of North-Eastern Ukraine. Baltic Forestry 2018, 24(1), 304–312. [Google Scholar]
- Chen, L., Liu, C. Y., Cheng, Y., Yu, G., Sun, G., Zhu, L., ... & Liu, Y. The influence of climate change on the autumn migration timing of three common migratory raptors in East Asia. Global Ecology and Conservation 2025, 59, e03578. [CrossRef]
- Craig, P.M.; Allan, R.P. The role of teleconnection patterns in the variability and trends of growing season indices across Europe. International Journal of Climatology 2022, 42(2), 1072–1091. [Google Scholar] [CrossRef]
- Cramp, S.; Perrins, C. M.; Brooks, D. J.; Dunn, E.; Gillmor, R.; Hall-Craggs, J.; Hillcoat, B.; Hollom, P. A. D.; Nicholson, E. M.; Roselaar, C. S.; Seale, W. T. C.; Sellar, P. J.; Simmons, K. E. L.; Snow, D. W.; Vincent, D.; Voous, K. H.; Wallace, D. I. M.; Wilson, M. G. Handbook of the Birds of Europe, the Middle East and North Africa, The Birds of the Western Palearctic, Vol. VII, Flycatchers to Shrikes; Oxford University Press; Oxford. New York, 1993; pp. 11–24. [Google Scholar]
- Davies, N.B. Prey selection and the search strategy of the spotted flycatcher (Muscicapa striata): a field study on optimal foraging. Anim. Behav. 1977, 25, 1016–1033. [Google Scholar] [CrossRef]
- Demongin, L. Identification Guide to Birds in the Hand; Laurent Demongin; Beauregard-Vendon, France, 2016. [Google Scholar]
- Deng, Y., Haest, B., Belotti, M. C., Zhao, W., Perez, G., Tielens, E. K., ... & Horton, K. G.Continental Connections: Changing Temperature, Wind and Precipitation Advance the Postbreeding Roosting Phenology of Avian Aerial Insectivores. Global Ecology and Biogeography 2025, 34(5), e70052. [CrossRef]
- Dormann, C.F.; Elith, J.; Bacher, S.; Buchmann, C.; Carl, G.; Carr, G.; Garc, J.R.; Gruber, B.; Lafourcade, B.; Leit, P.J.; et al. Collinearity: A review of methods to deal with it and a simulation study evaluating their performance. Ecography 2013, 36, 27–46. [Google Scholar] [CrossRef]
- Fransson, T.; Hall-Karlsson, S. Svensk Ringmärkningsatlas; Naturhistoriska riksmuseet & Sveriges Ornitologiska Forening; Stockholm, Sweden, 2008; Volume 3. [Google Scholar]
- Freeman, S. N.; Crick, H. Q. P. The decline of the Spotted Flycatcher Muscicapa striata in the UK: an integrated population model. Ibis 2003, 145(3), 400–412. [Google Scholar] [CrossRef]
- Gallinat, A. S.; Primack, R. B.; Wagner, D. L. Autumn, the neglected season in climate change research. Trends in Ecology & Evolution 2015, 30(3), 169–176. [Google Scholar]
- Gołębiewski, I.; Remisiewicz, M. Carry-over effects of climate variability at breeding and non-breeding grounds on spring migration in the European Wren Troglodytes troglodytes at the Baltic Coast. Animals 2023, 13, 2015. [Google Scholar] [CrossRef]
- Gordo, O. Why Are Bird Migration Dates Shifting? 2007. A Review of Weather and Climate Effects on Avian Migratory Phenology. Clim. Res. 35, 37–58. [CrossRef]
- Grice, PV; Hall, C; Hanmer, HJ; Harris, SJ; Johnstone, I; Lindley, P; McCulloch, N; Noble, DG; Risely, K; Robinson, RA; Wotton, S. The state of the UK’s birds 2020; The RSPB, BTO, WWT, DAERA, JNCC, NatureScot, NE and NRW; Sandy, Bedfordshire, UK, 2020. [Google Scholar]
- Haest, B.; Hüppop, O.; van de Pol, M.; Bairlein, F. Autumn bird migration phenology: A potpourri of wind, precipitation and temperature effects. Global Change Biology 2019, 25(12), 4064–4080. [Google Scholar] [CrossRef]
- Haest, B.; Hüppop, O.; Bairlein, F. Weather at the Winter and Stopover Areas Determines Spring Migration Onset, Progress, and Advancements in Afro-Palearctic Migrant Birds. Proc. Natl. Acad. Sci. USA 2020, 117, 17056–17062. [Google Scholar] [CrossRef]
- Halupka, L; Halupka, K. The effect of climate change on the duration of avian breeding seasons: a meta-analysis. Proc. R. Soc. B 2017, 284, 20171710. [Google Scholar] [CrossRef]
- Harrison JA, Underhill LG. 1997. Introduction and methods. In Harrison JA, Allan DG, Underhill LG, Herremans M, Tree AJ, Parker V, Brown CJ (eds) The atlas of southern African birds. Vol. 1: Non-passerines. Johannesburg: BirdLife South Africa: xliii–lxiv.
- Hawkins, D M. The problem of overfitting. Journal of Chemical Information and Computer Science 2004, 44, 1–12. [Google Scholar] [CrossRef]
- Hernández, A. Summer-autumn feeding ecology of Pied Flycatchers Ficedula hypolueca and Spotted Flycatchers Muscicapa striata: the importance of frugivory in a stopover area in north-west Iberia. Bird Conservation International 2009, 19, 224–238. [Google Scholar] [CrossRef]
- Herremans. M. 1997. Spotted Flycatcher Muscicapa striata. In The Atlas of Southern African Birds: Volume 2: Passerines; Harrison, J.A., Allan, D.G., Underhill, L.G., Herremans, M., Tree, A.J., Parker, V., Brown, C.J., Eds.; BirdLife South Africa: Johannesburg, South Africa, 1997. Available online at: https://sabap2.birdmap.africa/docs/sabap1/689.pdf.
- Hüppop, O; Hüppop, K. North Atlantic Oscillation and Timing of Spring Migration in Birds. Proc. R. Soc. B Biol. Sci. 2003, 270, 233–240. [Google Scholar] [CrossRef] [PubMed]
- Hyytiä, K.; Vikberg, P. Autumn migration and moult of the Spotted Flycatcher Muscicapa striata and the Pied Flycatcher Ficedula hypoleuca at the Signilskä bird station. Ornis Fenn. 1973, 50, 124–143. [Google Scholar]
- Jenni, L.; Kéry, M. Timing of autumn bird migration under climate change: advances in long–distance migrants, delays in short–distance migrants. Proceedings of the Royal Society of London. Series B: Biological Sciences 2003, 270(1523), 1467–1471. [Google Scholar] [CrossRef] [PubMed]
- Kharitonov, S.P.; Kharitonova, I.A.; Konyukhov, N.B.; Panov, I.M.; Litvin, K.E. Ring-recovery maps of bird species what are included in the database of the bird ringing centre of Russia; A. N. Severtsov Institute of Ecology and Evolution RAS; Moscow, Russia, 2024. [Google Scholar]
- Kruskal, J. Multidimensional scaling by optimizing goodness-of-fit to a nonmetric hypothesis. Psychometrika 1964a, 29, 1–28. [Google Scholar] [CrossRef]
- Kruskal, J. Nonmetric multidimensional scaling: a numerical method. Psychometrika 1964b, 29, 115–129. [Google Scholar] [CrossRef]
- Lee, A.T.K; Brooks, M.; Underhill, L.G. The SABAP2 legacy: a review of the history and use of data generated by a long running citizen science project. South African Journal of Science 2022, 118, Art. #12030. [Google Scholar] [CrossRef]
- Lehikoinen, A.; Lindén, A.; Karlsson, M.; Andersson, A.; Crewe, T.L.; Dunn, E.H.; Gregory, G.; Karlsson, L.; Kristiansen, V.; Mackenzie, S.; et al. Phenology of the Avian Spring Migratory Passage in Europe and North America: Asymmetric Advancement in Time and Increase in Duration. Ecol. Indic. 2019, 101, 985–991. [Google Scholar] [CrossRef]
- Linderholm, H.W.; Folland, C.; Knight, J.; Fereday, D.; Ineson, S.; Hurrell, J.W. Influences of the Summer North Atlantic Oscillation (SNAO) on regional climate –from the past to the future. IOP Conference Series: Earth and Environmental Science 2009, 6, 072039. [Google Scholar] [CrossRef]
- Linsdale, JM. A method of showing relative frequency of occurrence of birds. Condor 1928, 30, 180–184. [Google Scholar] [CrossRef]
- Maciag, T.; Remisiewicz, M. Climate change impact on the populations of Goldcrest Regulus regulus and Firecrest Regulus ignicapilla migrating through the southern Baltic coast. Sustainability 2025, 17, 1243. [Google Scholar] [CrossRef]
- Miles, W.T.S.; Bolton, M.; Davis, P.; Dennis, R.; Broad, R.; Robertson, I.; Riddiford, N.J.; Harvey, P.V.; Riddington, R.; Shaw, D.N.; et al. Quantifying Full Phenological Event Distributions Reveals Simultaneous Advances, Temporal Stability and Delays in Spring and Autumn Migration Timing in Long-Distance Migratory Birds. Glob. Chang. Biol. 2017, 23, 1400–1414. [Google Scholar] [CrossRef]
- NOAA; National Oceanic and Atmospheric Administration US Department of Commerce; National Weather Service. Climate Prediction Center. Climate & Weather Linkage, (accessed on 6 January 2026)Aaccessed on.
- O'Connor, R. J.; Morgan, A. Some effects of weather conditions on the breeding of the Spotted Flycatcher Muscicapa striata in Britain. Bird Study 1982, 29:1, 41–48. [Google Scholar] [CrossRef]
- Payevsky, V. A. Age structure of passerine migrants at the eastern Baltic coast: the analysis of the “coastal effect”. Ornis Svecica 1998, 8(4), 171–178. [Google Scholar] [CrossRef]
- Payevsky, V.A.; Shapoval, A.P. Seasonal migrations, population dynamics and age structure of the Spotted Flycatcher Muscicapa striata (Aves, Passeriformes) according to trapping and ringing data for sixty-four years (1957–2020) in the Eastern Baltic. Acta Biologica Sibirica 2024, 10, 533–545. [Google Scholar] [CrossRef]
- Peach, W.; Baillie, S.; Underhill, L.G. Survival of British Sedge Warblers Acrocephalus schoenobaenus in relation to West African rainfall. Ibis 1991, 133, 300–305. [Google Scholar] [CrossRef]
- PECBMS. Pan-European Common Bird Monitoring Scheme. Available online: https://pecbms.info/trends-and-indicators/species-trends/species/muscicapa-striata/ (accessed on 31 January 2026).
- Pinszke, A.; Remisiewicz, M. Long-term changes in autumn migration timing of Garden Warblers Sylvia borin at the southern Baltic coast in response to spring, summer and autumn temperatures. Eur. Zool. J. 2023, 90, 283–295. [Google Scholar] [CrossRef]
- R Core Team R. A Language and Environment for Statistical Computing. 2025. Available online: https://www.r-project.org (accessed on 1 October 2025).
- Rainio, K.; Tøttrup, A.P.; Lehikoinen, E.; Coppack, T. Effects of climate change on the degree of protandry in migratory songbirds. Climate Research 2007, 35(1-2), 107–114. [Google Scholar] [CrossRef]
- Redlisiak, M.; Remisiewicz, M.; Nowakowski, J. K. Long-term changes in migration timing of Song Thrush Turdus philomelos at the southern Baltic coast in response to temperatures on route and at breeding grounds. International Journal of Biometeorology 2018, 62(9), 1595–1605. [Google Scholar] [CrossRef] [PubMed]
- Remisiewicz, M.; Underhill, L.G. Climate in Africa Sequentially Shapes Spring Passage of Willow Warbler Phylloscopus trochilus across the Baltic Coast. PeerJ 2022, 10, e8770. [Google Scholar] [CrossRef] [PubMed]
- Remisiewicz, M.; Underhill, L.G. Climate in Europe and Africa sequentially shapes the spring passage of long-distance migrants at the Baltic coast in Europe. Diversity 2025, 17, 528. [Google Scholar] [CrossRef]
- Remisiewicz, M.; Underhill, L.G. Climatic Variation in Africa and Europe Has Combined Effects on Timing of Spring Migration in a Long-Distance Migrant Willow Warbler Phylloscopus trochilus. PeerJ 2020, 8, 1–30. [Google Scholar] [CrossRef] [PubMed]
- Remisiewicz, M.; Underhill, L.G. Large-scale climatic patterns have stronger carry-over effects than local temperatures on spring phenology of long-distance passerine migrants between Europe and Africa. Animals 2022, 12, 1732. [Google Scholar] [CrossRef]
- Robertson, A; Simmons, RE; Jarvis, AM; Brown, CJ. Can bird atlas data be used to estimate population size? A case study using Namibian endemics. Biological Conservation 1995, 71, 87–95. [Google Scholar] [CrossRef]
- Royal Netherlands Meteorological Institute (KNMI); World Meteorological Organization (WMO). Climate Explorer. Available online: http://climexp.knmi.nl/ (accessed on 10 January 2026).
- Rust, H. W.; Richling, A.; Bissolli, P.; Ulbrich, U. Linking teleconnection patterns to European temperature: a multiple linear regression. Meteorologische Zeitschrift 2015, 24(4), 411–423. [Google Scholar] [CrossRef]
- Sokolov, L.V.; Markovets, M.Y.; Morozov, Y.G. Long-Term Dynamics of the Mean Date of Autumn Migration in Passerines on the Courish Spit of the Baltic Sea. Avian Ecol. Behav. 1999, 2, 1–18. [Google Scholar]
- South African Bird Ringing Unit (SAFRING). Spotted Flycatcher Muscicapa striata. Available online: https://safring.ringing.africa/species/654 (accessed on 10 January 2026).
- Spina, F.; Baillie, S.R.; Bairlein, F.; Fiedler, W.; Thorup, K. The Eurasian African Bird Migration Atlas. Available online: https://migrationatlas.org (accessed on 30 January 2026).
- Stervander, M.; Lindström, Å.; Jonzén, N.; Andersson, A. Timing of spring migration in birds: long-term trends, North Atlantic Oscillation and the significance of different migration routes. Journal of Avian Biology 2005, 36(3), 210–221. [Google Scholar] [CrossRef]
- Svensson, L; Svensson, L. Identification Guide to European Passerines; 1992. [Google Scholar]
- Svensson, L. Identification Guide to European Passerines; British Trust for Ornithology; Thetford, UK, 1992. [Google Scholar]
- Temple, SA; Temple, AJ. Geographic distributions and patterns of relative abundance of Wisconsin birds: a WSO research project. Passenger Pigeon 1986, 48, 58–68. [Google Scholar]
- Tøttrup, A.P.; Thorup, K.; Rahbek, C. Patterns of Change in Timing of Spring Migration in North European Songbird Populations. J. Avian Biol. 2006, 37, 84–92. [Google Scholar] [CrossRef]
- Tryjanowski, P; Kuźniak, S; Sparks, TH. What Affects the Magnitude of Change in First Arrival Dates of Migrant Birds? Journal of Ornithology 2005, 146, 200–205. [Google Scholar] [CrossRef]
- Tukey, JW. Exploratory data analysis; Addison-Wesley; Reading, Massachusetts, 1977. [Google Scholar]
- Underhill, L. G.; Remisiewicz, M. Arrival and Peak Abundance of Barn Swallows Hirundo rustica in Three Regions of South Africa in Relation to Climate Indices, Deduced from Bird Atlas Data. Birds 2025, 6(3), 48. [Google Scholar] [CrossRef]
- Underhill, LG. The fundamentals of the SABAP2 protocol. Biodiversity Observations 2016, 7.42, 1–12. [Google Scholar]
- Underhill, LG; Brooks, M; Loftie-Eaton, M. The Second Southern African Bird Atlas Project: protocol, process, product. Vogelwelt 2017, 137, 64–70. [Google Scholar]
- Underhill, LG; Prŷs-Jones, RP; Harrison, JA; Martinez, P. Seasonal patterns of occurrence of Palaearctic migrants in southern Africa using atlas data. Ibis 134 Supplement 1992, 1, 99–108. [Google Scholar]
- Usui, T.; Butchart, S.H.M.; Phillimore, A.B. Temporal Shifts and Temperature Sensitivity of Avian Spring Migratory Phenology: A Phylogenetic Meta-Analysis. J. Anim. Ecol. 2017, 86, 250–261. [Google Scholar] [CrossRef] [PubMed]
- Valkama, J.; Saurola, P.; Lehikoinen, A.; Lehikoinen, E.; Piha, M.; Sola, P.; Velmala, W. Suomen Rengastysatlas II [The Finnish Bird Ringing Atlas, Vol. II]; Finnish Museum of Natural History and Ministry of Environment; Helsinki, Finland, 2014. [Google Scholar]
- Van Buskirk, J.; Mulvihill, R. S.; Leberman, R. C. Variable shifts in spring and autumn migration phenology in North American songbirds associated with climate change. Global Change Biology 2009, 15(3), 760–771. [Google Scholar] [CrossRef]
- Volkov, S. V.; Grinchenko, O. S.; Sviridova, T. V. The effects of weather and climate changes on the timing of autumn migration of the Common Crane (Grus grus) in the North of Moscow Region. Biology Bulletin 2016, 43(9), 1203–1211. [Google Scholar] [CrossRef]
- VSN International. Genstat for Windows, 22nd ed.; VSN International; Hemel Hempstead, UK, 2022. [Google Scholar]
- World Climate Service. 2025. Available online: https://www.worldclimateservice.com/2021/11/03/east-atlantic-western-russia/ (accessed on 24 January 2025).
Figure 1.
Location of study areas, ringing recoveries of Spotted Flycatchers caught at the Operation Baltic stations and in southern Africa, and recovered elsewhere up to 30 June 2025, and regions where analysed climate variables operate, against the Spotted Flycatcher range in Europe and Africa. Operation Baltic stations: red triangle – Bukowo–Kopań (54°20′56″–54°27′46″ N, 16°15′54″–16°24′38″E), black triangles: MW – Mierzeja Wiślana (54°21‟57″N, 19°23‟30″E), HL – Hel (54°44‟29″N, 18°33‟40″E), WA – Wapnica (53˚54’N, 14˚23’E). Circles: locations where birds were ringed or recaptured at these stations during breeding season (1 May–31 Jul) (white circles) or in other periods (black circles). For South Africa: red frame – study area in South Africa (24°–26°S, 27°–29°E), for birds captured in southern Africa: colours link ringing and recapture locations: sites where they were ringed (stars) or recovered (squares). Black rectangles: regions for which temperatures were analysed, ovals and arrows: approximate areas where large-scale climate indices operate. Symbols of climate indices as in Table 1. Ringing recoveries for southern Africa courtesy of SAFRING. Map: BirdLife International Datazone 2025, modified.
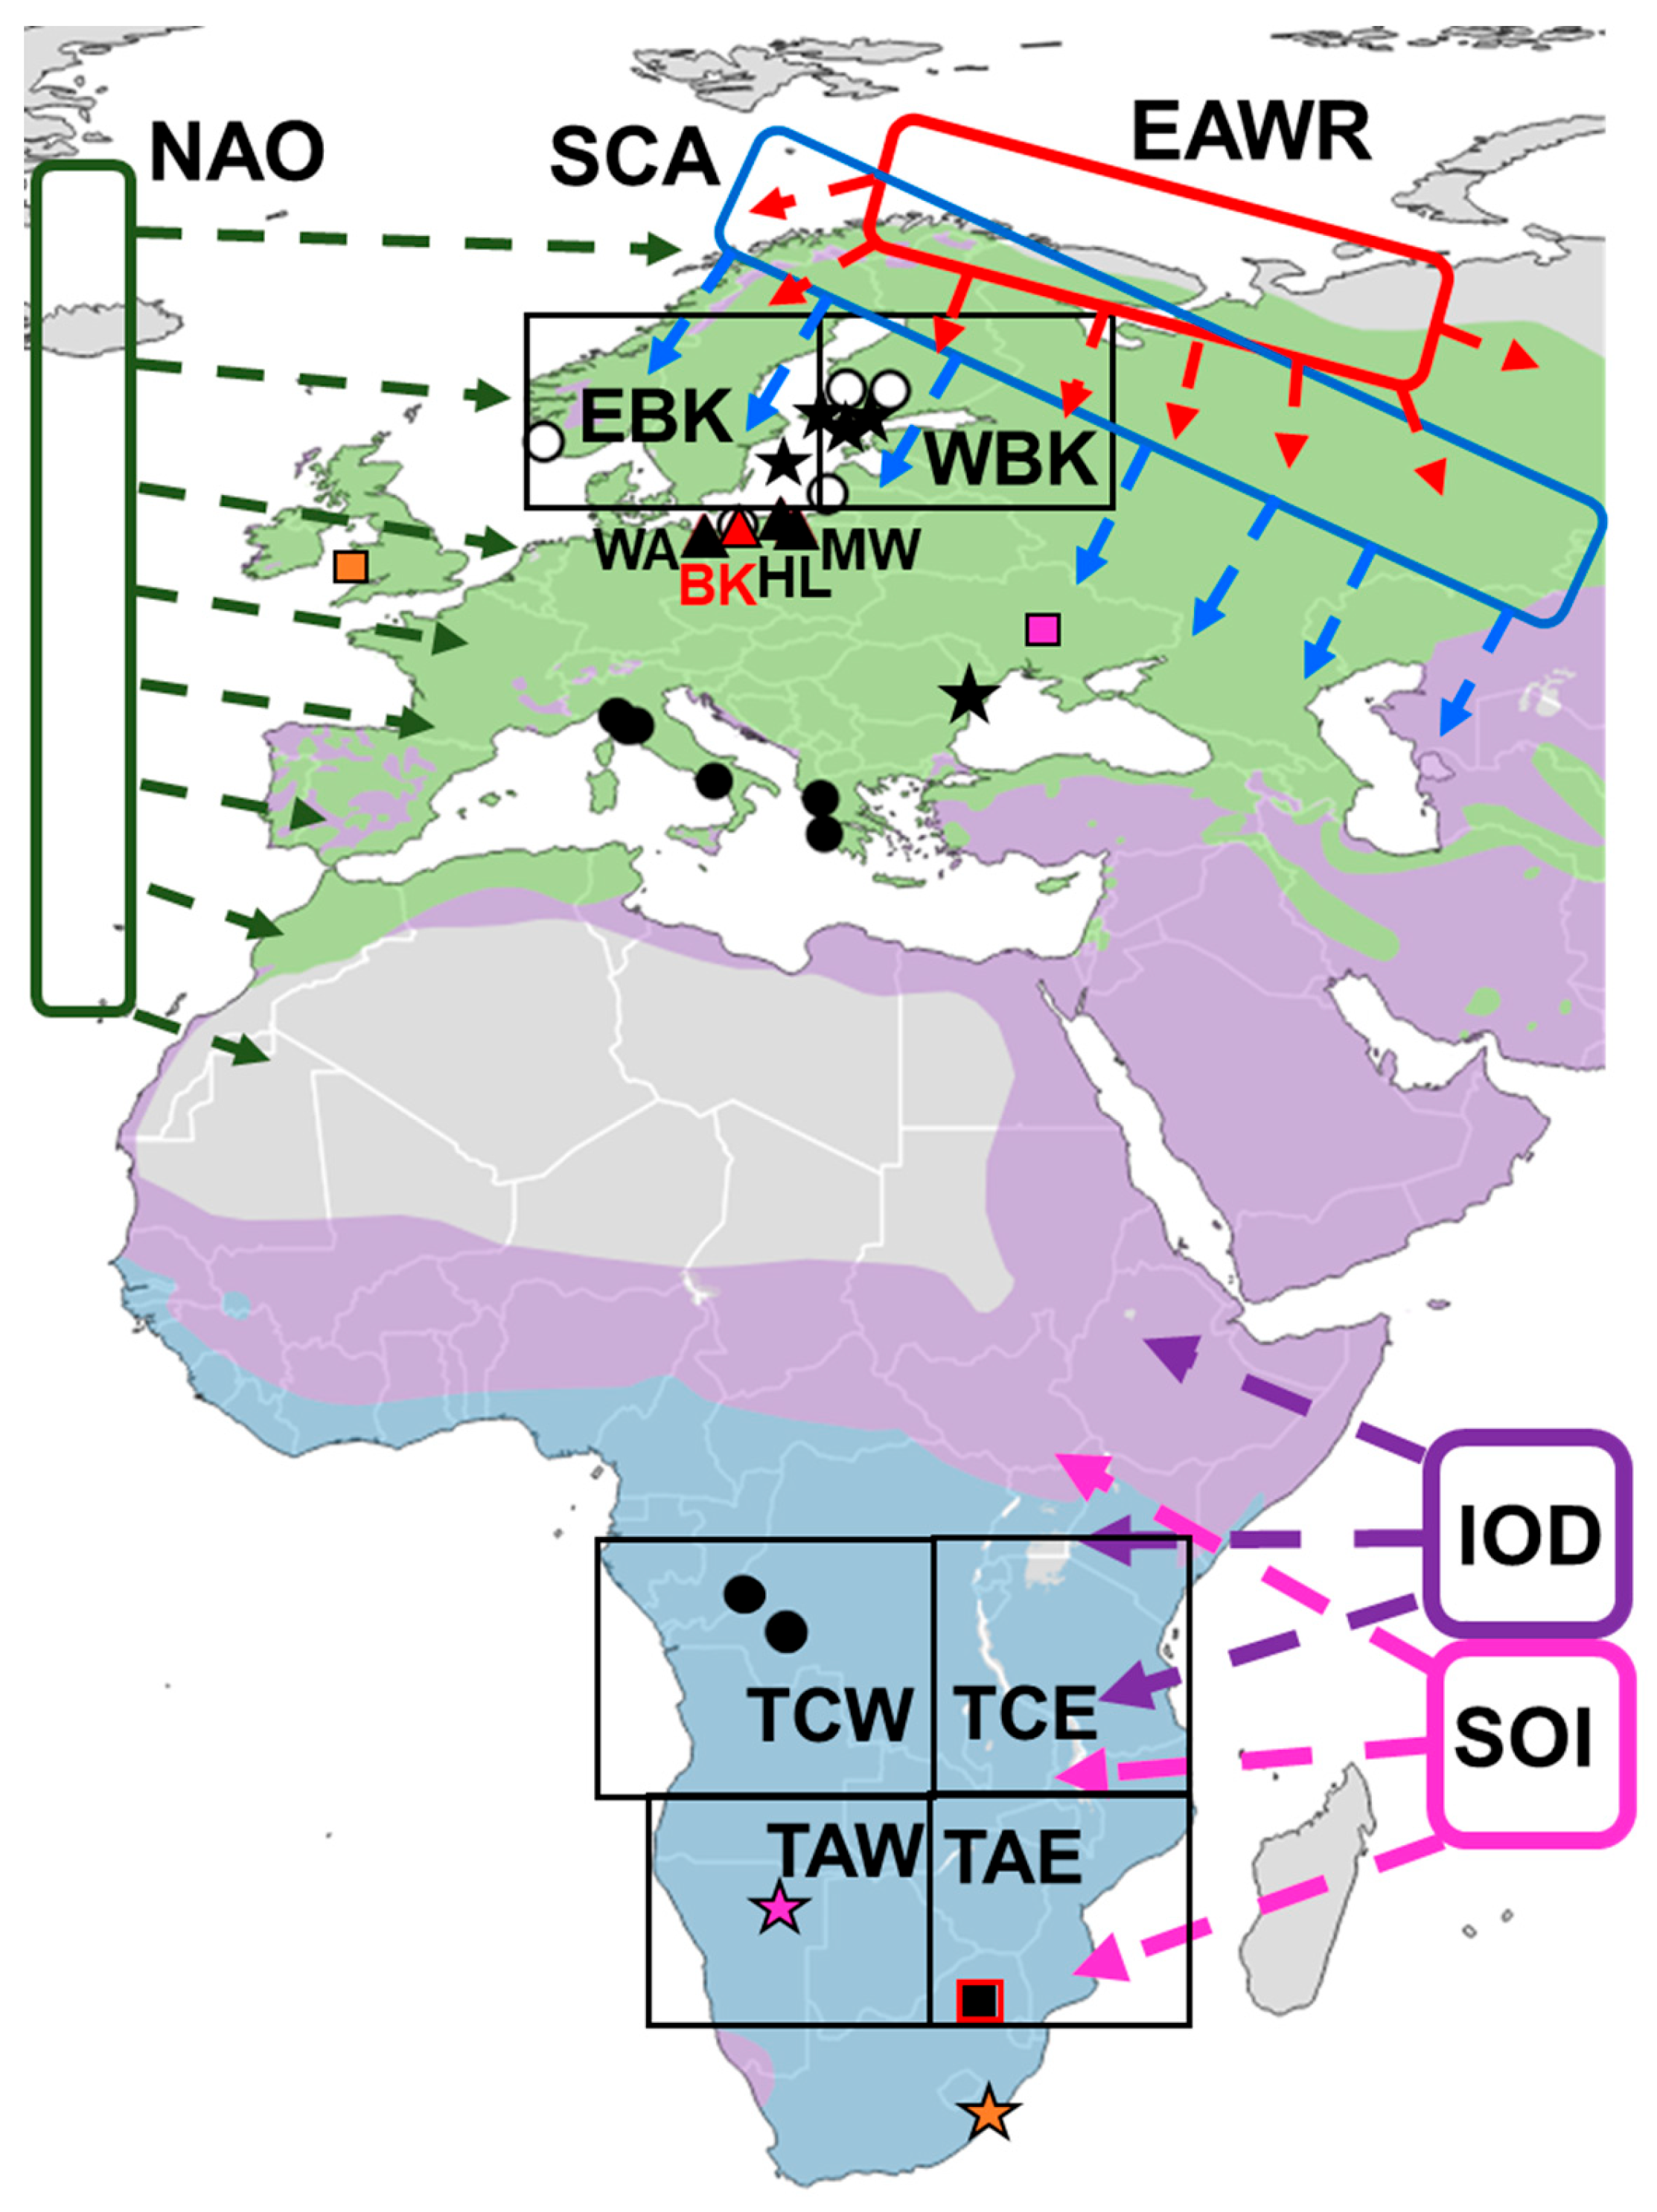
Figure 2.
Stages in the life cycle of the Spotted Flycatcher Muscicapa striata from the populations breeding in northern Europe. Months marked with two colours indicate possibly overlapping stages.
Figure 2.
Stages in the life cycle of the Spotted Flycatcher Muscicapa striata from the populations breeding in northern Europe. Months marked with two colours indicate possibly overlapping stages.
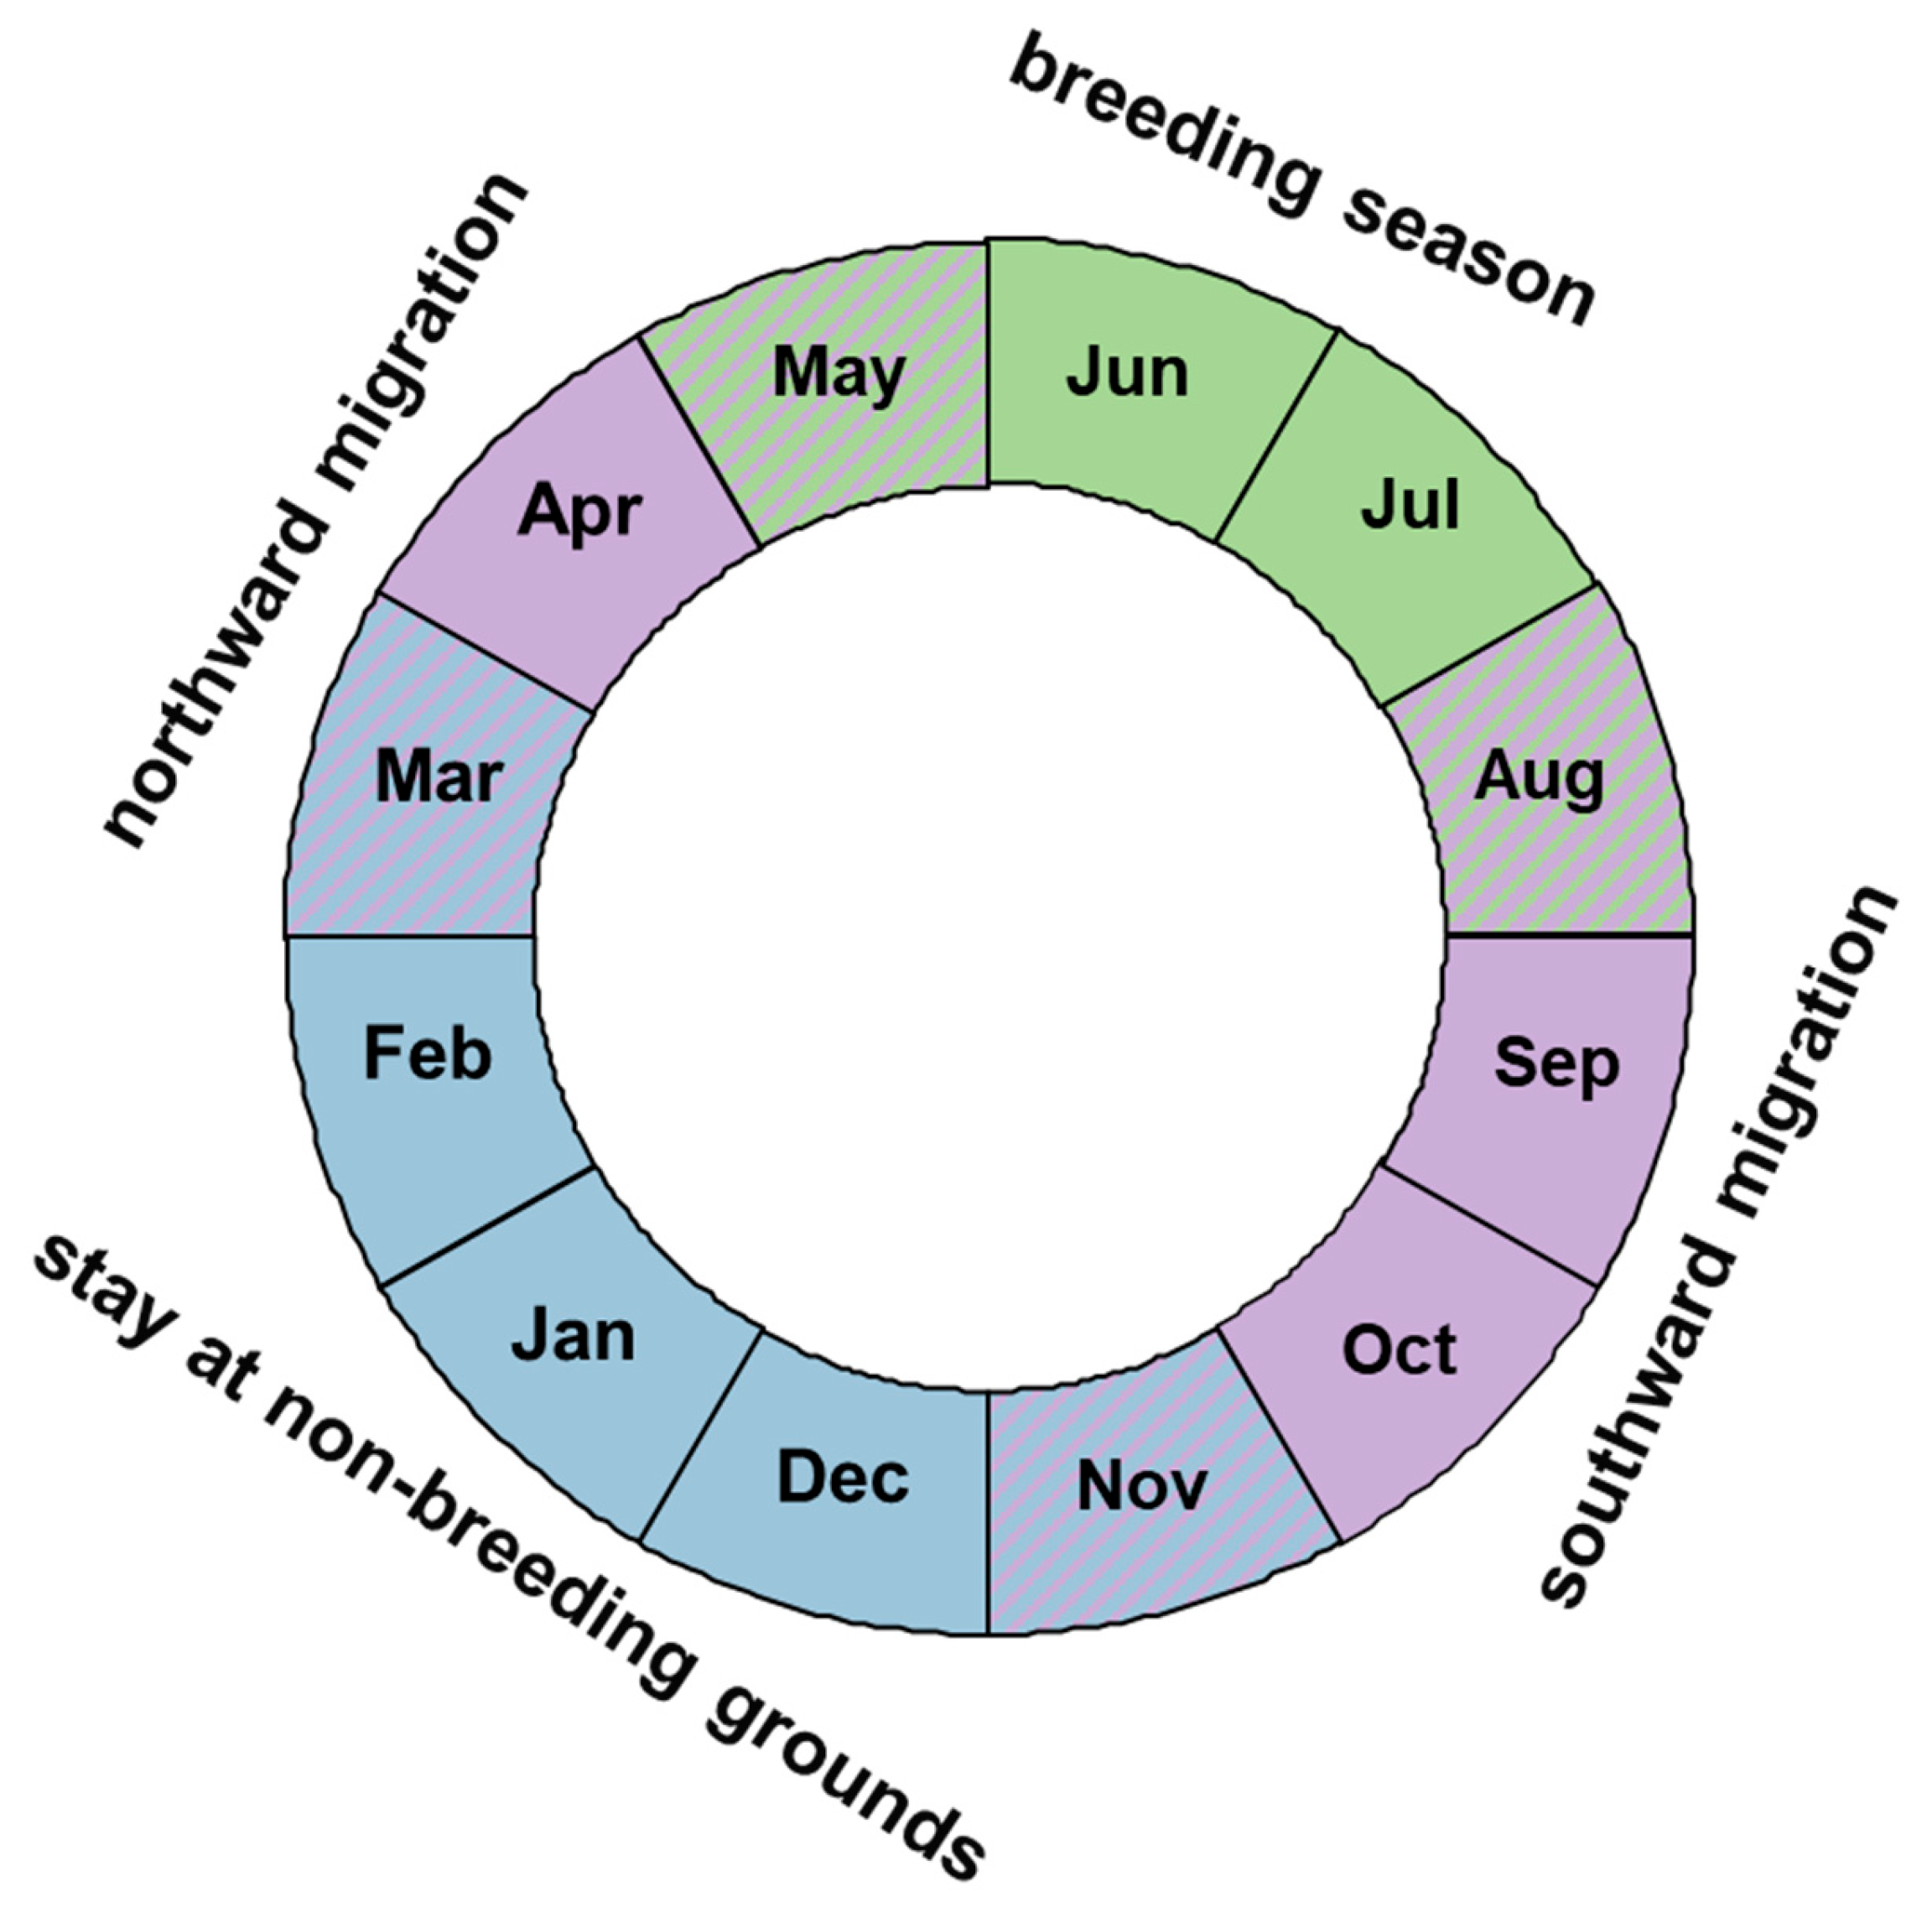
Figure 3.
Timing and abundance of the Spotted Flycacther during the post-breeding migration of the Spotted Flycatcher at the study areas at Bukowo–Kopań in 1967–2025 and in South Africa in 2007–2024. A) The timing of passage at Bukowo–Kopań, reflected by Annual Annomaly (AA); B) The abundance of passage at Bukowo–Kopań, reflected by the number of birds caught recalculated per 50 mistnets; C) The timing of arrivals in South Africa, reflected by Annual Arrival Annomaly (SAA); D) The abundance of arrivals in South Africa, reflected as maximum reporting rates (MRR).
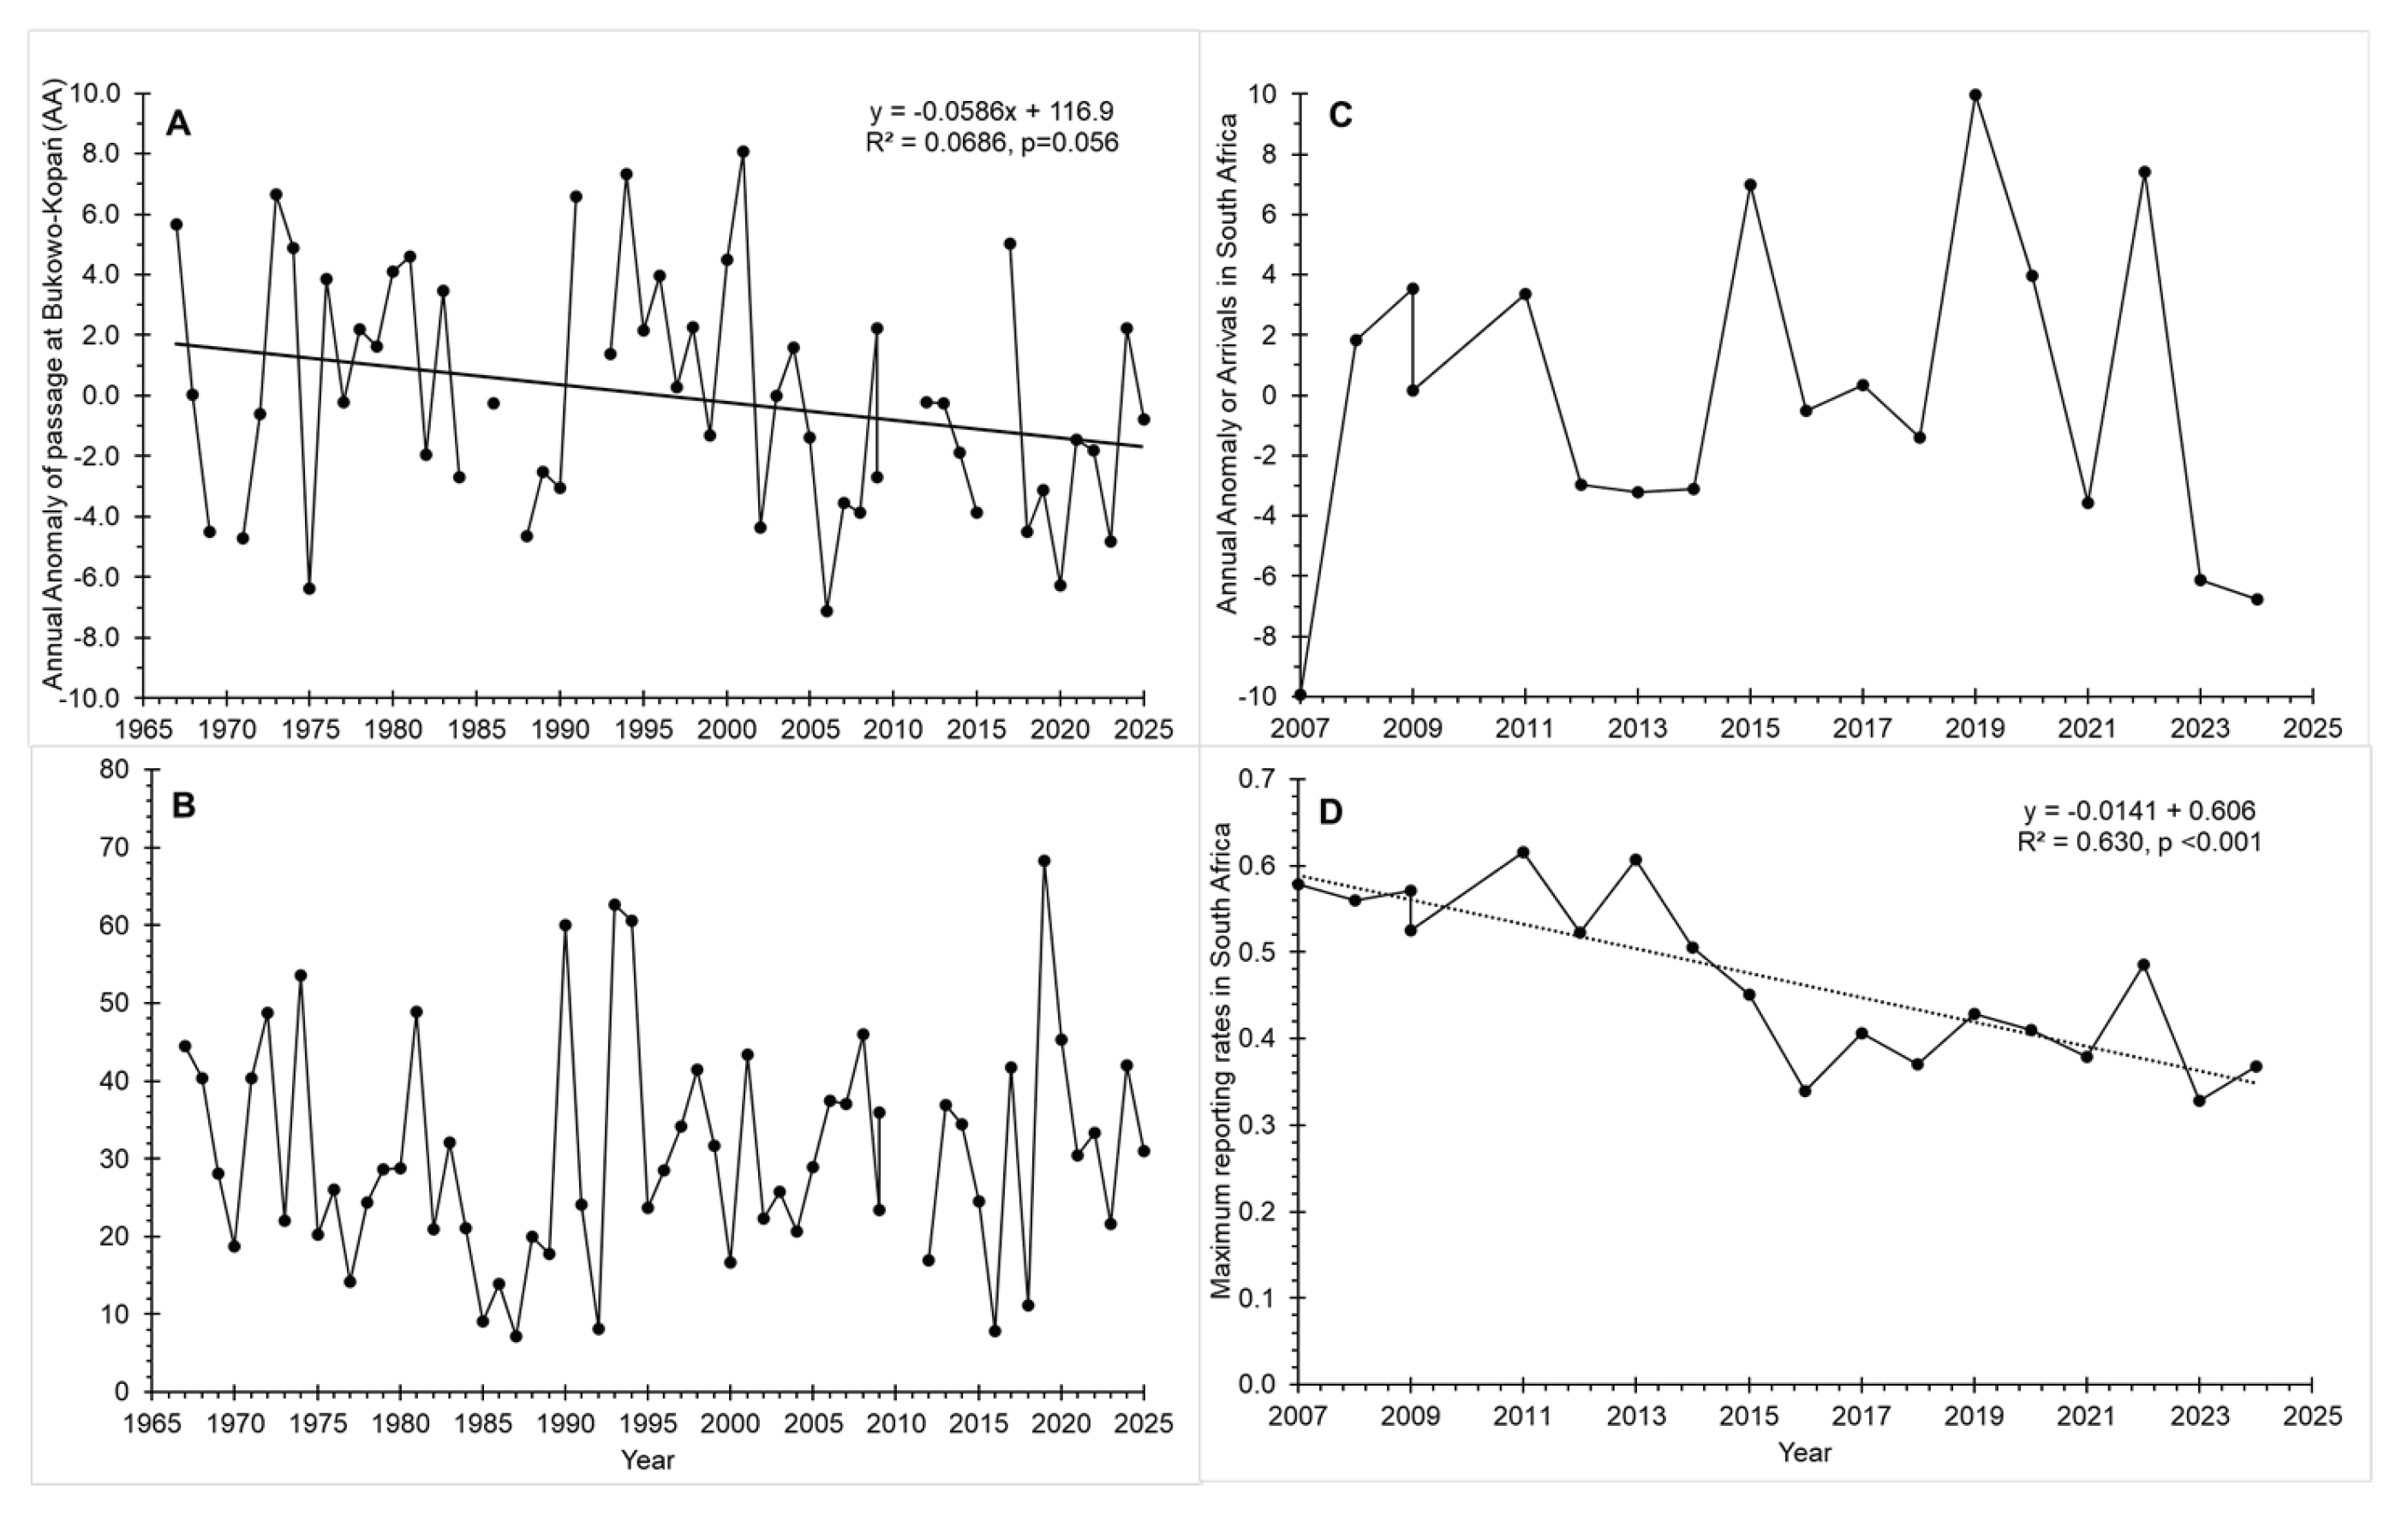

Table 1.
Variables used in multiple regression models for the southward migration of the Spotted Flycatcher at Bukowo-Kopań (N Poland) in 1967–2025.
Table 1.
Variables used in multiple regression models for the southward migration of the Spotted Flycatcher at Bukowo-Kopań (N Poland) in 1967–2025.
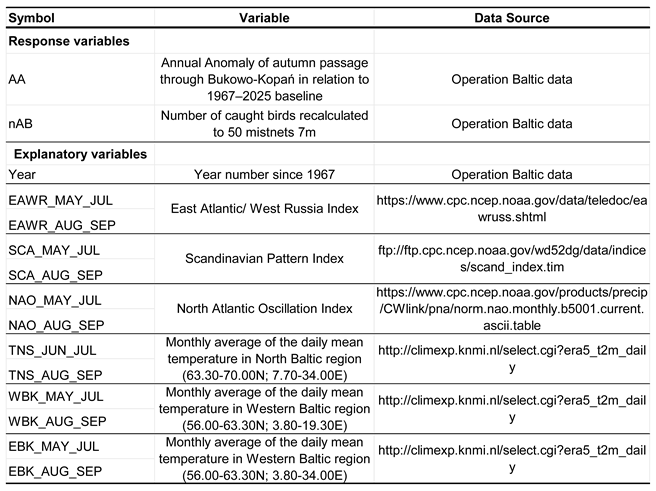 |
Table 2.
Variables used in multiple regression models for the arrivals on southward migration of the Spotted Flycatcher in South Africa in 2007–2025.
Table 2.
Variables used in multiple regression models for the arrivals on southward migration of the Spotted Flycatcher in South Africa in 2007–2025.
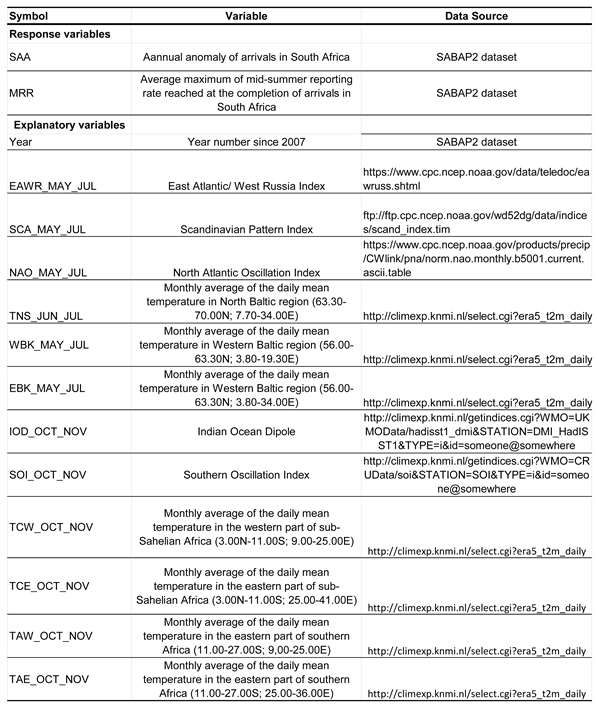 |
Table 3.
Effects of the climate variables selected in the best models on the timing of the autumn passage (AA) in 1967–2027 of the Spotted Flycatcher at Bukowo-Kopań (N Poland). Coeff= coefficients from multiple regression, SE = standard error of the estimates; t, p = t-test and significance of each estimate. VIF = variance inflation factor, AdjR2 = adjusted coefficient of determination, predR2 = predictive coefficient of determination. If predR2/AdjR2 is close to 1, the model is not overfitted; if AdjR2 − predR2 is close to 0, the model has good predictive value. Full models and model selection are presented in Tables S3-S4 in the Supplementary Material.
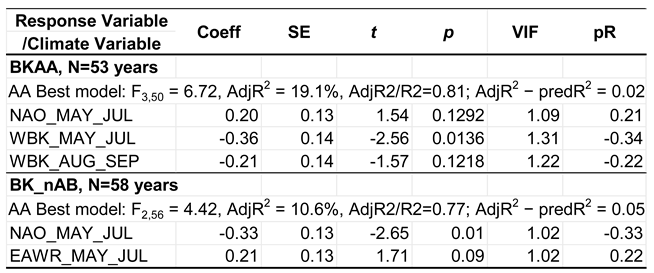 |
Table 4.
Effects of the climate variables selected in the best models for the Annual Anomaly of Arrivals (SAA) and the Maximum Reporting Rates (MRR) in 2007–2025 of the Spotted Flycatcher in South Africa. Abbreviations of climate variables are as in Table 2; the remaining symbols are as in Table 3. Model selection is presented in Tables S6-S6 in the Supplementary Material.
 |
Disclaimer/Publisher’s Note: The statements, opinions and data contained in all publications are solely those of the individual author(s) and contributor(s) and not of MDPI and/or the editor(s). MDPI and/or the editor(s) disclaim responsibility for any injury to people or property resulting from any ideas, methods, instructions or products referred to in the content. |
© 2026 by the authors. Licensee MDPI, Basel, Switzerland. This article is an open access article distributed under the terms and conditions of the Creative Commons Attribution (CC BY) license (http://creativecommons.org/licenses/by/4.0/).
Copyright: This open access article is published under a Creative Commons CC BY 4.0 license, which permit the free download, distribution, and reuse, provided that the author and preprint are cited in any reuse.


