
Submitted:
13 November 2024
Posted:
14 November 2024
You are already at the latest version
Abstract
Since about 2000, we observed the decline in the numbers of Goldcrests and increase in the numbers of Firecrests caught during autumn migration at two bird ringing stations, Bukowo-Kopań and Mierzeja Wiślana, on the Polish coast of the Baltic Sea over 1976–2023 . These two closely related forest bird species share similar biotopes but differ in foraging behavior and migration strategy. The changes in migrating bird abundance in autumn we observed at both ringing stations were correlated with the Pan-European breeding population trends over 1982–2022 from PECBMS project. This suggested that some Europe-wide factors are responsible for these changes. The snow cover in October decreased abundance and delayed autumn migration of Goldcrests on the Baltic coast, probably by exposing them to cold and impeding their feeding and fueling for migration. In Firecrests, the response to October snow was similar but much weaker. Firecrests, in turn, have shifted their migration earlier since late 1980’s, alleviating the effect of early winter. The warmer was October, the larger were the numbers of Firecrests on autumn migration at both stations, which suggest their good breeding success likely due to improved survival of chicks from late broods during warm autumns. Additionally, the increased number of broadleaf trees at the breeding grounds in Fennoscandia can favor the population of Firecrest, which prefers mixed forests and larger prey like spiders, over Goldcrest, which are bound to more coniferous forests, where they feed on smaller insects. If this trend continues, we expect a decline in the number of the currently numerous Goldcrest, but farther expansion of the breeding range to north-east and increase in numbers of the Firecrest, the less abundant of the two species. The change of forest management policy in Scandinavia by planting more broadleaf trees, is aimed at increasing biodiversity and can have a large impact on the forest environment, thus it is imperative to have methods for early detection of such changes. The results we presented show that monitoring the number of migrating birds can serve as a good indicator of environmental changes.
Keywords:
autumn migration
; passerine birds
; population indexes
; migrant’s abundance
; breeding population
; climate change
; Baltic region
1. Introduction
Climate change has a major influence on populations of birds worldwide [1], by influencing their migration [2], breeding success [3] and winter survival [4]. Birds quickly adjust to environmental conditions [5], thus assessment of bird numbers has been considered good bioindicators for monitoring the environmental changes [6]. Different bird species, depending on their biology and migration strategy, may be used to monitor different components of the environment. Therefore, most European countries (30) participate in the Pan-European Common Bird Monitoring Scheme (PECBMS), with 8 more countries performing bird census counts but not participating in this scheme [7]. Although the European tradition of monitoring numbers of breeding birds is extremely long for such countries as the United Kingdom [8], other countries have joined the surveys only recently, like Croatia in 2015 [9]. Counts of breeding birds are not the only method of bird population assessment [10]. Birds can be counted during the breeding season at constant effort sites [11], during wintering season along transects or by point-counts [12], and at sites of their concentrations on migration by visual observation or catching for ringing [13]. The indices of bird numbers calculated from the numbers of birds captured during migration [14] can serve as good measure of the population abundance for short-distance migrant species [14]. Migrants’ numbers are a good indicator of the population size of a species if the breeding monitoring scheme is missing, and high year-to-year variance in numbers can be attributed to the high mortality of young birds during their first migration [15]. In Poland, the common breeding birds survey has been conducted only since 2000, thus estimates of the population size before this time have to be based on some other schemes. Fortunately, the monitoring of bird populations by their ringing on migration has been conducted on the Polish coast of the Baltic Sea since the 1960’s by the Operation Baltic project [16]. In recent years, we have observed a decrease in the number of Goldcrests (Regulus regulus) and an increase in the numbers Fircrests (Regulus ignicapilla) caught during autumn migration at two bird ringing stations of the Operation Baltic. In the absence of long-term surveys of breeding populations in Poland, we investigated the contrasting long-term trends in numbers of these two species observed at the two coastal stations during several decades of the Operation Baltic project against the recent changes in the numbers of breeding birds, monitored across Europe since 1982.
Since the 1980s, the European population of Goldcrest has declined, but the population of the Firecrest has increased, despite the latter species being scarcer; such trends were first reported in the United Kingdom [17,18], but are now observed in continental Europe [19]. The situation when the population of a more common and resident species (Goldcrest) is in decline, while the population of its scarcer but more migratory counterpart (Firecrest) increases is rare [20]. Thus, in this study, we aim to present the changes in the numbers of Goldcrests and Firecrest caught during autumn migrations over 1976–2023 on the southern coast of the Baltic Sea, in the context of the trends in the European breeding populations of both species over 1982–2022. We set out to investigate possible reasons for the recent changes in their numbers, in terms of changes in their forest habitats and the environment, caused by human management and climate change.
2. Materials and Methods
2.1. Study Species
Both study species are the smallest passerine birds breeding in Europe, weighing only 5–8g and 9 cm-long from bill to tail [21]. The breeding range of Goldcrest, a common forest bird, extends across most of Europe, except the Iberian Peninsula (Figure 1A). The Firecrest has a more southern breeding range, which extends from North Africa across most of Europe except Fenno-Scandia, with the northern limit of the species’ range mostly along the southern coast of the Baltic Sea, until the recent north-eastern expansion of the species (Figure 1B) [21,22]. These two species use similar habitats, including coniferous and mixed forests, but Firecrest has a slightly larger preference for broadleaved trees than Goldcrest, which prefers more coniferous forests, especially as breeding habitat [21]. Thus, Goldcrests occur up to 4800 m a.s.l., within the reach of the mountain coniferous forests, while Firecrests are confined more to lowlands up to ca 2800 a.s.l. [21].These two species also slightly differ in their preference for urban habitats, with Firecrests’ breeding population densities in parks and large gardens close to the maximum densities in natural habitats [22]. Goldcrests use parks and cemeteries only when they provide coniferous trees scarce in the area [23]. These species differ in feeding behavior and favored prey, reducing their food competition. Goldcrests prefer to feed in denser branches and often feed on the undersides of branches and leaves, hunting for small insect prey (Chemiptera, Collembola, and Lepidoptera larvae), while Firecrests feed on larger prey, mainly on Collembola spiders and aphids, usually collected from the top surface of branches or leaves [24].
Goldcrest is considered a partial migrant, as only a part of its breeding population from northern Europe migrates south for winter [16]. Goldcrests that occur in autumn on the southern coast of the Baltic originate from the breeding grounds in Scandinavia, the Baltic countries, and north-western Russia (Figure 1A), as indicated by the recoveries of birds ringed at the bird stations at the Polish coast [26,27]. Firecrest is a resident in southern Europe, but in northern and central Europe its entire breeding populations are obligatory migrants to the south for winter (Figure 1A) [21]. Firecrests caught in autumn at the ringing stations on the Polish coast likely originate from the local populations and the more eastern part of the species’ breeding range (Figure 1B) [28].
2.2. Study Site and Sampling
We used the numbers of Goldcrests and Firecrest caught at two bird ringing stations of the Operation Baltic project located on the southern Baltic coast in Poland (Figure 1A, 1B): Mierzeja Wiślana (54°21′10″-57″ N, 19°18′55″-23′30″ E), and Bukowo-Kopań (54°20′56″-27′46″ N, 16°15′54″-24′38″ E) during 1976–2023. Birds were caught in mist nets according to the standard monitoring protocol between 14 August and 1 November each year [16]; this period covered the whole autumn migration period of both species in the Baltic region [21]. The number of 8 m-long nets was stable within each autumn, but ranged from 25 to 89 in different years (Table S1). In 2010 and 2011, ringing at Bukowo-Kopań did not cover the whole autumn season, thus we excluded these two years from the analysis for this station. Thus, for Bukowo-Kopań we analyzed data from 46 autumns, and for Mierzeja Wiślana from 48 autumns, during 1976–2023. Catching and ringing of birds at both stations was conducted based on the permit from the General Directorate for Environmental Protection, Poland, with the annual approval of the Polish Bird Ringing Centra of the Polish Academy of Sciences. Field research at Bukowo-Kopań was approved annually by the Marine Office in Słupsk or Szczecin, and at Mierzeja Wiślana by the Marine Office in Gdynia and the Forestry Division in Elbląg, which were the relevant land managing authorities for the locations of the stations.
2.3. Statistical Analysis
The migrating bird abundance index (MBAi) (Eq.1) for each autumn at each station was calculated as the total number of birds caught each autumn, recalculated into 50 standard 8m-long nets, to adjust for the differences in capture effort between the years (Tables S1–S4).
Small gaps in data caused by suspending catching effort for 1–2 days during storms were imputed for each species with bird numbers extrapolated from the catches of that species on that day in other years at that station, as in other studies using data from bird ringing stations [29,30]. For the missing date, in 6 preceding and 6 following years we calculated the proportion of birds caught on that date in relation to the total number of birds caught during the whole autumn except that day. Then, we used the mean of these proportions from these 12 years, to calculate the number of birds that would be caught on the “gap day” in relation to the total number of birds caught in the year in question; the obtained number of birds was the imputed value for the “gap day” [31].
We used the migrating bird abundance index (MBAi) to draw population trends over 1976–2023 using Generalized Additive Models (GAM) [32] in the package ‘gam’ in R 4.3.1. software [33] (Table S5).
Additionally, for each species, we analyzed the dates of the passage of 50% (median) of the birds at each station in subsequent years (Tables S6–S9), to establish any changes in their autumn migration timing over the years. We checked for any long-term changes in the median date of passage using GAMs.
To compare the abundance of both species on autumn migration with the breeding population trends, we downloaded and reanalyzed the data from the Pan-European Common Bird Monitoring Scheme (PECBMS) [6], which presents the European population trends of common breeding species based on data from 30 countries . We downloaded the available PECBMS data between 1982 and 2022 and analysed their trends using GAMs, as for the migrants’ abundance (Table S10). For each species, we compared the Pan-European breeding population (PECBMS) trends with the trends in the numbers of migrants at both stations (MBAi) over 1982–2022. To visualize these comparisons, we recalculated MBAi at each station in each year as a proportion to the migrants’ numbers in the first analyzed year (1982), analogously as the breeding birds population index is calculated by PECBMS (Table S11). For each species, we then correlated the European breeding birds abundance index with the migratory bird abundance at the southern Baltic coast, using Kendall’s rank correlation coefficient tau calculated by the ‘cor.matrix’ function implemented in the ‘misty’ package [34] (Table S12). Analogously, for comparisons with the PECBMS index the median autumn migration date in each year was subtracted from the median migration date in 1982 for each species at each station (Table S13).
To assess the influence of the climate change on the abundance and autumn migration timing at the Baltic coast for both species, we used monthly values of the North Atlantic Oscillation Index (NAO) downloaded from US National Ocean and Atmospheric Administration (NOAA) Climate Prediction Centre (https://www.cpc.ncep.noaa.gov/ accessed 25 Jan 2024) [35], European Temperature Anomaly (ETA) downloaded from NOAA National Centers for Environmental Information (https://www.ncei.noaa.gov/ accessed 08 Feb 2024) [36], and Eurasian Snow Cover (ESC) downloaded from Rutgers University Global Snow Lab (https://snowcover.org accessed 02 Jan 2024) [37]. The unit of ESC is the averaged weekly number of land squares covered by snow in at least 50% [37]. We then averaged each climate index for the months corresponding to the life stages of both species we analyzed, i.e. March–April for spring migration, May–July for the breeding period, and October for autumn migration [21] (Table S14). We used the climate indices as explanatory variables in four multiple regression models for each species, using as a response variables subsequently: migrant birds abundance index for Bukowo-Kopań (BK_MBAi) and Mierzeja Wiślana stations (MW_MBAi), and the median dates of passage for each station as the Julian date (day number since 1 January). In these models we analyzed 40 years during 1982–2023, excluding 2010 and 2011. Analogously, for each species, we run one additional model, to analyze the relationships between the PECBMS breeding bird abundance index (response variable) and these climate indices (explanatory variables), excluding those in October, after the breeding season. These models included all 41 years (1982–2022) for which PECMBS results were available. Thus, for each species, we obtained the results from five models, explaining the relationships between the climate factors and four parameters of their autumn migration, and one parameter of breeding abundance. Before running the multiple regression models, we standardized all used variables, which were in different scales, so that each had a mean of 0 and a standard deviation of 1. Then we checked for any correlations between the climate variables using Pearson’s correlation coefficient. All correlation coefficients except one were |r| < 0.61 (Table S15), allowing for including these variables in one model [38]. The one strongest correlation between ETA and ESC in March–April was r < -0.75 (Table S15), higher than the threshold of |r| = 0.70 recommended to avoid a potential bias of the results by multicollinearity [38]. Thus, we run each of our models four times: 1) excluding ETA in March–April, 2) excluding ESC in March–April, 3) combining climate factors selected in best models from both approaches, and 4) including both ETA and ESC in March–April. We then compared the best models selected in stages 3) and 4). In all cases, the finally selected best models were the same with both methods. Thus, we decided to present the results from method 4), including both correlated climate variables in one model, but carefully monitoring the effects of multicollinearity on the results. To assess the multicollinearity of all the explanatory variables in the full and the best models, we used the variance inflation factor (VIF) [38] in the R package “car 2.1-6” [39]. In all models and for all variables values of VIF < 5, much lower than the recommended threshold of VIF=10 [38], thus the potential bias from multicollinearity in our models was negligible. During each round of modeling, we selected the best model using “all subsets regression” by Akaike Information Criteria corrected for small sample size (AICc), using the package “MuMIn 1.43.6” [40]. We also estimated the proportion of variation explained by the best model using the adjusted coefficient of determination (AdjR2 ). For each climate index selected in each best model, we calculated the partial correlation coefficient (pR), which reflects the correlation between the response variable and each climate index while removing the effects of the remaining explanatory variables. using the package “ppcor 1.1” [41]. To visualize the effects of each climate variable on the indices of abundance for each species, we presented these partial correlation coefficients in bar graphs. These analyses follow the methods used in other studies [5,42]. All statistical analyses were conducted in R 4.3.1 [31].
2.3. Analysis of the Change in the Firecrest Breeding Range
To demonstrate the expected extension of the Firecrest breeding range we used observations downloaded from the Global Biodiversity Information Facility (GBIF). GBIF gathers data from multiple citizen science platforms such as: Artportalen, EBIRD, ICO-ornitho-cat, naturgucker, Observations, and so2-birds [43]. Firstly, we downloaded Firecrest observations from 1901–2023. The numbers of available records each year (Figure S1, Table S16) from 1955 onwards were sufficient to calculate the mean and standard deviation of the latitude and longitude of observations in 1955–2023 (Table S17), and to analyze trends in their latitude and longitude over this period using linear regression. We plotted all the available observations for Firecrest observed in the breeding season from 1st May to 30th June of 2002, 2012, and 2022 (Table S18-20) [43] on the map of Europe, to visualize the change in range and abundance of Firecrest observations between these years, using QGis 3.34.1-Prizren [44].
3. Results
3.1. Abundance of Migrating Goldcrests and Firecrests
The long-term trends in migrating bird abundance index (MBAi), obtained using GAM, at both stations showed a decrease in the numbers of Goldcrests migrating in autumn between 1980s and 2000s, followed by a stabilization after about 2006 (Figure 2, Table S5). The high year-to-year variation in MBAi at both stations has decreased after 2000. In contrast, the trends in MBAi for Firecrests at both stations indicated a decline in migrants’ abundance in the late 1970s and early 1980s, followed by stabilization of the observed numbers. However, the number of Firecrests caught at both stations have rapidly increased since 2016 (Figure 2, Table S5).
3.2. Autumn Migration Timing of Goldcrests and Firecrests
The average median date of autumn passage of the Goldcrest was 9th October at Mierzeja Wiślana and 11th October at the more western station Bukowo-Kopań (Figure 1). Despite some year-to-year variation, the median date of Goldcrest’s passage showed no long-term trends at both stations (Figure 3, Table S13).
For the Firecrest, the median date of autumn passage was on average October 6th at Mierzeja Wiślana and October 11th at Bukowo-Kopań (Table S13). Firecrests showed a trend for a gradually earlier passage since late 1980s at the more eastern Mierzeja Wiślana station, but no such trend occurred at Bukowo-Kopań (Figure 3, Table S13).
3.3. Pan-European Breeding Population Trends for Goldcrest and Firecrest
The Pan-European breeding population trends from PECBMS [7] showed a decrease in Goldcrests’ numbers and an increase in Firecrests’ numbers over 1982–2022, corresponding with trends in the numbers of these species caught during autumn migration at both Operation Baltic stations (Figure 4). For the Goldcrest, the migrating birds abundance index (MBAi) and the Pan-European breeding population index (PECMBS), each recalculated in relation to the relevant index in 1982 (Figure 4), were significantly correlated for both Bukowo-Kopań (Kendall’s tau: τ=0.45) and Mierzeja Wiślana (τ=0.35) (Table S12). For the Firecrest, the correlations between MBAi and PECMBS index were weaker but still statistically significant for both stations (τ=0.31 and τ=0.24, respectively) (Table S12).
3.4. Changes in Firecrest’s Breeding Range
To check if the increase of Firecrest numbers on migration was related to a change in their geographical range we analyzed observations of this species from 1901–2023 downloaded from the Global Biodiversity Information Facility (GBIF) (Table S16). We have observed high year-to-year variation in the numbers of recorded Firecrests, and consistent growth of the number of its observation since about 1960 (Figure S1, Table S17). Thus, 1960 was selected as the starting year to analyze the distribution of observations of the Firecrest. The average longitude of the observations in each year has decreased over 1960–2023 (Figure S2, Table S17), including initial decrease in the average longitude during 1960–1990, followed by the increase in the average longitude in 1991–2023 indicating an extension of the range to the east (Table S17). The average latitude of the observations in each year has slowly but steadily increased over the whole period 1960–2023 suggesting the extension of the Firecrest range to the north (Table S17). The comparison of the locations of all available observations of the Firecrest in the breeding season (1st May – 30th June) in 2002, 2012 and 2022 (Table S18, S19 and S20) [43], shows the cluster of new (from 2022) records in southern Sweden and the Baltic countries (Figure 5), corresponding to the extension of the species range towards north-east, which is in line with observed increased number of breeding Firecrests in Sweden [45].
3.4. Influence of Climate Factors on Abundance and Autumn Migration Timing in Goldcrest and Firecrest
The abundance of Goldcrests during autumn migration on the southern coast of the Baltic and the timing of that migration during 1982–2023 were related to the European Temperature Anomaly (ETA) and North Atlantic Oscillation (NAO) in spring (March–April), ETA in summer (May–July) and Euroasian Snow Cover (ESC) in summer and autumn (October) (Figure 6A).
The best-fitted models explained 18–27% of the variation in Goldcrest migration abundance and timing by the effects of climate variables (Tables S21–S25). For the Firecrest the best models explained 21–26% of variation in their autumn abundance (Figure 6A; Tables S21– S25). The effects of ETA and ESC in May–July jointly explained as much as 41% of variation in Firecrest’s migration timing at Mierzeja Wiślana (Figure 6B, Table S2), but the analyzed climate variables explained only 8% at most of the analogous variation at Bukowo (Table S25). This suggests that migration timing at the second, more western station is influenced by other factors, which we did not analyze.
Goldcrests were more abundant and migrated on average earlier in autumn at Bukowo-Kopań after warm springs with high ETA in March–April, than after cold ones (Figure 6A, Table S25). At Mierzeja Wiślana they were more abundant after springs with positive NAO, which also reflects warm and wet springs in northwestern Europe. Goldcrests were less abundant at Bukowo-Kopań, and at Mierzeja Wiślana, and they migrated on average later after warm summers, with high ETA in May-July, than after cold ones (Figure 6A, Figure 6B, Table S25). At both stations they occurred in greater numbers and, on average, later during autumn with more extensive snow cover (ETA) in October, (Figure 6A, Figure 6B). These relationships correspond well with the effect of climate variables on Goldcrest breeding abundance, reflected by the PECBMS index during 1982–2022 (Figure 6C). The best models, showing these relationships, explained 44% of the variation in PECBMS index during 1982–2022 (Tables S26–S28). Goldcrests were more abundantly breeding in Europe after springs with less extensive snow cover (ESC March-April) (Figure 6C, Table S28). Interestingly, they were also breeding more abundantly in Europe during cold summers (ETA May–July) and with more extensive snow cover over Eurasia in summer (ESC May–July), than during warmer summers with less snow (Figure 6C ,Table S28).
Firecrest abundance and timing of autumn migration at both stations at the southern Baltic coast were related mostly to conditions in October (Figure 6A, Figure 6B, Table S25). They were more abundant on autumn passage during warm October (ETA in October), and also with negative NAO in October, which is related to winds from east and northeast in Europe (Figure 6A, Table S25). Their autumn passage was on average later at Mierzeja Wiślana after more extensive snow cover in summer (ESC in May-July), and at Bukowo-Kopań with larger ESC in October (Figure 6B, Table S25). Additionally, their passage, on average, was later at Mierzeja Wiślana after cold summers (ETA in May-July), than after warm ones. Temperatures in spring (ETA in March–April) positively affected Firecrests’ breeding abundance in Europe (Figure 6C, Table S28).
4. Discussion
Our results showed that the long-term changes in abundance of Goldcrests and Firecrests observed during autumn migration at the southern Baltic coast correspond well with the trends of their breeding populations across Europe. We discuss the observed decreasing abundance of the Goldcrest and increasing abundance of the Firecrest in Europe, in the context of differences in their responses to climate change in Europe and the related changes of the species ranges over the last few decades.
A growing number of studies shows the deleterious effect of climate change on bird populations [1]. These studies suggest that long-distance migrants [46] and wetland species [47] are the birds most prone to the negative effects of climate change. However, population declines have also been observed in woodland species and in short-distance migrants or resident birds [43,48]. On the other hand, birds show a remarkable adaptability to the changing climate, such as decreasing migration distance [2] or adjusting migration timing to current conditions [49]. The best example of such adaptations are Blackcaps (Sylvia atricapilla), formerly long-distance migrants between Europe and Africa, in which some populations shortened migration distance, established a new wintering quarter in the UK, and showed corresponding shifts in spring and autumn migration timing and pre-migratory fueling [50,51,52,53]. Another example is an increasing evidence of Robins (Erithacus rubecula) wintering in Northern and Central Europe, which they used to leave entirely for winter a few decades ago [54]. Such flexibility enables birds to adjust their biology to changing environmental conditions and survive these changes. In most cases, such adjustments benefit the populations, as proved by increasing abundance of Blackcaps and Robins in Europe [6]. Such adaptations can, however, lead to dramatic effects leading to a mismatch between the peak abundance of birds’ main food supply and the timing of their reproduction with its peak demand for food [55]. Such phenological mismatches which has caused drastic population declines in e.g. Pied Flycatcher (Ficedula hypoleuca) [46] or Red Knot (Calidris canutus) [56]. The multispecies analyses show that long-distance migrants usually advance their autumn migration, as e.g. Garden Warblers [57], but the short-distant migrants rather delay migration, in response to climate warming and changing conditions in their breeding and wintering grounds [49]. The data from Finland show that partial migrants, including the Goldcrest, delay their migration until the weather conditions drive them away [58]. This pattern is common among short-distance migrants, which in the effect gradually delay their autumn migration in response to longer and warmer autumns at the north caused by the climate change [59].
The Goldcrest and the Firecrest, which are the smallest passerine species in Europe, are similar in biology and appearance, although are easy to distinguish in the field by their head patterns [21,24,49]. The much larger European breeding population of Goldcrests has been slightly decreasing during the few recent decades, while the much smaller population of Firecrests has been on the rise [19]. Despite their common co-occurrence in mixed forests, these species differ in habitat and food preferences sufficiently to avoid competing for these resources [21]. Thus, it hardly any inter-specific competition, but rather some other differences in these species’ biology, which underlay their different population trends. We aim to unravel the mystery behind this unusual pattern, when in two so similar species, the population size increases in the more migratory species, the Firecrest, but declines in the more sedentary species, the Goldcrest [20].
4.1. Multi-Year Trends in Firecrest and Goldcrest Abundance during Breeding and on Autumn
For Firecrests, the increase in their breeding abundance across Europe since the 1980s, as indicated by PECBMS, corresponds well with the increase in their numbers observed at both stations at the southern Baltic coast since the 1990s, which seemed to accelerate after about 2005 (Figure 4). The cluster of this species’ observations in southern Sweden in 2022 (Figure 5) is in line with the increased number of Firecrests breeding in Sweden [45]. The correlation of the trends between both Operation Baltic stations confirms that this increase is not a local phenomenon, but a wider pattern. The gradually earlier median date of Firecrests’ autumn passage observed at Mierzeja Wiślana since the 1980s, but not at Bukowo-Kopań (Figure 3), where ETA and ESC explain less variation in migration timing than at the first station (Figure 6B, Table S25), might reflect different proportions of Firecrest populations passing through these stations. Firecrests arriving from the north-east along the coast, probably dominate at the more eastern station Mierzeja Wiślana, and those coming from southern Sweden likely dominate at Bukowo-Kopań, considering the locations of these stations (Figure 1).
The decrease in Goldcrests’ breeding abundance across Europe since the 1980s, indicated by PECBMS, corresponds with the decrease in their numbers during autumn migration between the 1980s and the 2000s at both stations on the southern Baltic coast (Figure 4). The numbers of Goldcrests caught in autumn showed large year-to-year variation in the early 1970s and 1980s at both stations (Figure 2), which might suggest that the numbers of birds caught during migration poorly reflect the breeding population size [60]. Such high variation in numbers might have been caused by a varied proportion of the population that migrates each year, which is determined by the environmental capacity of their breeding grounds during winter [21,61]. Similarly, high year-to-year variation in numbers occurred in Goldcrest migrating in autumn through Hungary [62]. However, after the year 2000, the numbers of Goldcrests caught at both stations of the Operation Baltic have stabilized and showed smaller variation. This might indicate that the environmental capacity of the breeding grounds during harsh winter supports similar numbers of overwintering Goldcrests as during mild ones, hence they do not need to migrate in larger numbers during cold autumns, to survive harsh winters. Despite this year-to-year variation in numbers, the timing of Goldcrest autumn migration at the southern Baltic coast showed almost no change over almost fifty years covered by our study (Figure 3). This corresponds with no clear trend in the timing of autumn migration of Goldcrests at the ringing station Rybachy in the eastern part of the Baltic, ca 120 km north-east of Mierzeja Wiślana, over 1959-1998 [63], and at the station Christiansø in the western part of the Baltic Sea over 1976–1997 [64]. These results combined suggest that, despite possible differences between the years, there is likely no general change in the timing of Goldcrests’ departure from the breeding areas, which would be reflected in the timing of their autumn migration in the Baltic region.
4.2. Effect of Conditions in Spring and Summer on Both Species
Firecrests seem to benefit from warm springs and small snow cover in summer, in terms of their higher breeding abundance across Europe in such mild conditions (Figure 6C), which are likely to bring earlier and larger availability of their insect prey and thus increase survival of adults and their offspring. Early spring with good access to food might also allow Firecrests to raise two clutches, as often occurs in this species [21], and thus increase their breeding success. Early breeding and thus early maturity of offsprings during warm summers might explain early autumn passage of Firecrests at Mierzeja Wiślana after such conditions (Figure 6B, Table S25). Oppositely, early snow cover in May-July, seem to decrease Firecrests' breeding abundance, probably by limiting their possibilities to lay and raise second clutches. Additionally, more extensive snow cover in summer and autumn seemed to drive away Firecrests from their breeding grounds early (Figure 6C, Table S28), possibly by reduced availability of insects but increased energy expense for thermoregulation in cold. However, to unravel the direct mechanism of the influence of snowmelt timing on the autumn migration of Firecrest, it would be necessary to better understand their spring migration and breeding phenology [65].
Goldcrests’ breeding abundance across Europe also seems to benefit from less extensive snow cover in spring (Figure 6C, Table S28), likely because of better access to food when it is not covered with snow. This corresponds with the more abundant and earlier autumn migration of Goldcrests through the southern Baltic coast after warm and mild springs (Figure 6A, Figure 6B, Table S25), which might reflect good breeding success of Goldcrests after warm spring. Early autumn migration after warm springs might be a results of early breeding and early maturity of offsprings from first broods, which then occur relatively early on the southern Baltic coast. Analogously, Song Thrush (Turdus philomelos) have advanced its autumn migration in the Baltic region since the 1970’s in response to earlier spring related with their earlier breeding [31]. Similarly, American Robins (Turdus migratorius) adjusted their spring migration timing to spring snow conditions [48], which helped them to adapt breeding phenology to changing climate [31,66]. Among woodland bird, warm spring benefits the most resident species, which exhibit greater plasticity than migrants, such as Blue Tits (Cyanistes caeruleus), since migrants arriving in spring, as e.g. Pied Flycatcher and Wood Warbler (Phylloscopus sibilatrix) adjust their breeding phenology not only to the current weather but also incorporate the carry-over effects of the conditions on migration route and their previous breeding experience [67].
Goldcrests’ responses to climate warming seem to be more complex (Figure 6), probably due to their tendency for partial migration [21], and breeding range extending farther northeast, than in the Firecrest (Figure 5). Wide snow cover in spring over Eurasia and cold summers might prevent some Goldcrest from breeding in the most northeastern parts of their range in Europe and Asia. The study of Goldcrest egg incubation in Norway, suggesting that low temperatures limit the distribution of Goldcrest in Fennoscandia [68], supports such explanation. Thus, snow and cold in spring and summer might enforce a shift of Goldcrests’ breeding densities more into central Europe, which would explain their more abundant breeding across Europe during such springs and summers (Figure 6C, Table S28). This corresponds with a shift of the gravity center of Goldcrest’s relative breeding densities to the south in Finland over 1990–2012 [48]. Increased spring temperatures seem to benefit Goldcrests’ breeding success, likely by providing favorable conditions for raising two clutches [21]. However, we suggest that increasingly warmer summers and autumns might be the reasons for their population decline. During 1982–2023, the warmer were the summers, the less abundant, and the later were Goldcrests on autumn passage at the southern Baltic coast, which might reflect this species’ tendency for partial migration. Warm summers might encourage a greater part of their northeastern breeding populations to skip migration and stay for winter at their breeding grounds, than in cold summers. Staying in the north might benefit those “overwinterers” if the winter is mild, as they would take the best territories and breed earlier in spring than the “migrants” [21] arriving at these breeding grounds. However, this strategy might turn out deceiving in case of adverse weather in winter. Extreme cold and snow events have recently become scarcer in the north of Europe [69], but just one cold spell might be fatal for the “overwinterers”. Moreover, body shrinkage of females, including a decrease in wing length and body mass, was observed in Goldcrests occurring on autumn migration in Hungary [62]which might reduce their resistance to cold and cause the population decline, as in the Red Knot [56].
4.3. Effect of Autumn Conditions on Both Species
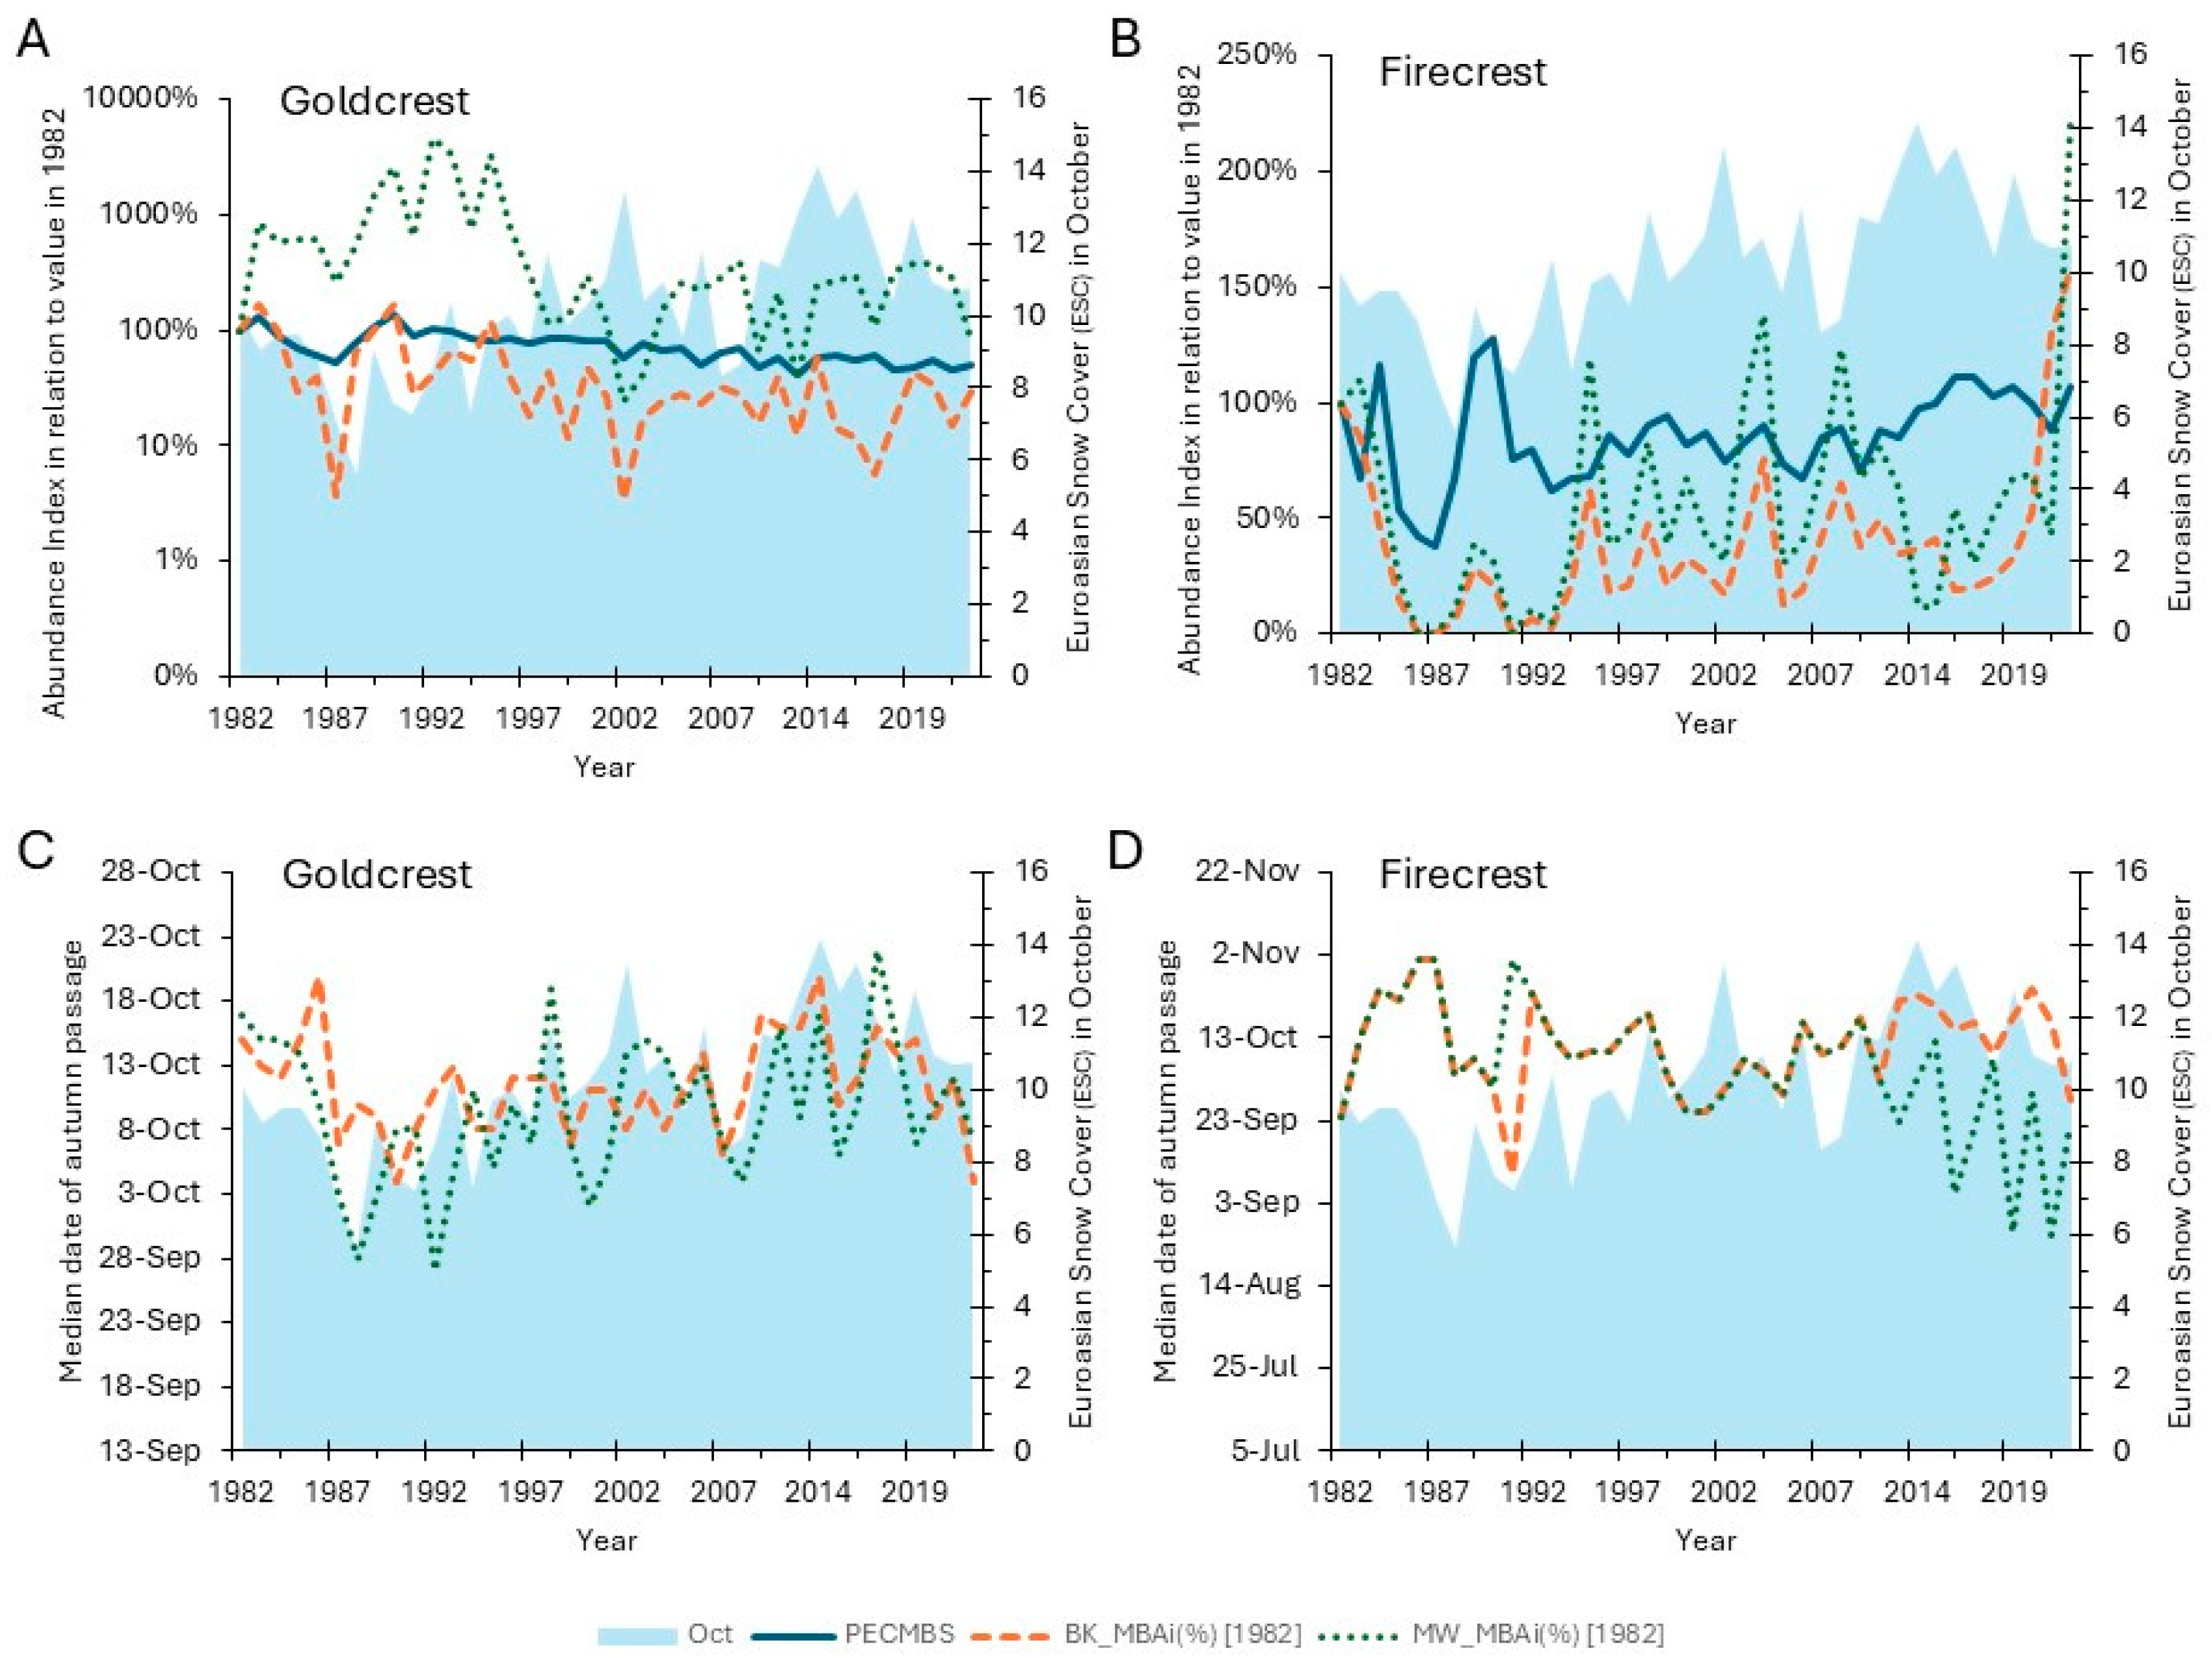
In both species, an extensive snow cover in October seems to delay autumn migration at the southern Baltic coast, and early snow in May–July delays migration at Mierzeja Wiślana (Figure 6B, Figure 7), probably as an effect of delayed departure from the breeding grounds in such conditions. Early snow might impede feeding and accumulation of fat reserves for autumn passage in both species, before they depart from their breeding grounds and at the stopover sites preceding our study sites.
Goldcrests were also less abundant during autumn migration at both stations with greater snow cover in October (Figure 6A). If snow in October delays their migration, their passage might extend later into November, beyond the end of ringing at both stations, hence fewer Goldcrests ringed on migration in such autumns. Unlike the Goldcrest, Firecrest’s autumn migration has advanced at Mierzeja Wiślana station during the recent decades (Figure 3), which could alleviate the influence of snow in October, but they are still susceptible to snow cover in May–July (Figure 6B, Figure 6C). The influence of the changes in snowmelt date on birds is highly dependent on the altitude of breeding grounds, and birds breeding at higher altitudes exhibit higher plasticity in response to changing snow conditions [70]. This might be an explanation for the stronger response of Goldcrests’ timing and numbers during autumn migration to snow cover in October, as this species inhabits coniferous forests higher in the mountains than Firecrest [21,57].
4.3. Effect of Forest Management and Anthropogenic Changes on the Abundance of Goldcrest and Firecrest
Firecrest prefers as their breeding habitat warmer and more humid areas, and mixed forests, with a greater proportion of broadleaf trees than Goldcrest, which prefers forests predominated by coniferous trees [19]. Therefore, the policy to increase forest diversity by the increased planting of broadleaf trees in forests in Sweden [71] and in Finland [59] might have helped expansion of Firecrests’ range to the north-east (Figure 5). Additionally, Firecrest’s adaptation to use urban parks and gardens, where they reach high breeding densities and breeding success [22], likely further promoted the population increase and expansion of this species. In contrast, the Goldcrest seems to be more reluctant to use urban areas [23], which might be maladaptive, considering the expanding urbanization of Europe.
5. Conclusions
We suggest that the main reasons for the opposite population trends in Europe in two closely related forest species, the Firecrest and the Goldcrest, are: 1) their different tendency to migrate (obligatory vs partial), which determines their contrasting responses to climate warming, and 2) their slightly different forest habitat preferences, considering increased planting of broadleaf trees in Fennoscandia.
Firecrests seem to benefit from climate warming, growing proportion of broadleaf trees in forests at their breeding grounds, and their adaptation to urban gardens, all of which promote their breeding success and survival. Obligatory migration of the northern populations promotes their winter survival. We expect that Firecrest’s population growth and expansion to the north-east will continue with climate warming and the same direction of their habitat management. In Goldcrests, increasingly warm summers and autumns might encourage more individuals to stay for winter in the north, despite this might be an “ecological trap”, as even one cold spell might be fatal to these tiny birds. We thus suggest that partial migration, which might serve birds as their mechanism of adjusting to changing climate, in the Goldcrests might lead to their decline. This effect might be corroborated by a decreasing coverage of coniferous forests, they preferred breeding habitat, in Europe. Fortunately, large population sizes of both species ensure their “Least Concern (LC)” current conservation status in Europe [72,73].
Our study shows that monitoring the numbers of birds on migration can help in the early detection of environmental changes. However, to identify the key factors responsible for changes in bird populations, we need to integrate data on their abundance during breeding and on migration with climate and environmental data, including information on habitat management in areas migratory species visit in different seasons.
Supplementary Materials
The following supporting information can be downloaded at the website of this paper posted on Preprints.org, Figure S1: Number of Firecrest observations over 1901–2023 downloaded from the Global Biodiversity Information Facility (GBIF). GBIF gathers data from multiple citizen science platforms such as: Artportalen, EBIRD, ICO-ornitho-cat, naturgucker, Observations, and so2-birds [43]. Figure S2: Average and standard deviation of latitude and longitude of Firecrest observation downloaded from the Global Biodiversity Information Facility (GBIF). GBIF gathers data from multiple citizen science platforms such as: Artportalen, EBIRD, ICO-ornitho-cat, naturgucker, Observations, and so2-birds [43] 1960–2023. Table S1 Number of Goldcrests caught on Bukowo BK (54°20′56″-27′46″ N, 16°15′54″-24′38″ E) field station between 14 August and 1 November 1976-2023. Table S2 Number of Goldcrests caught on Mierzeja Wiślana MW (54°21′10″-57″ N, 19°18′55″-23′30″ E) field station between 14 August and 1 November 1976-2023. Table S3 Number of Firecrests caught on Bukowo BK (54°20′56″-27′46″ N, 16°15′54″-24′38″ E) field station between 14 August and 1 November 1976–2023. Table S4 Number of Firecrests caught on Mierzeja Wiślana MW (54°21′10″-57″ N, 19°18′55″-23′30″ E) field station between 14 August and 1 November 1976–2023. Table S5 Migratory bird abundance index for both field stations with predicted abundance from generalized additive models for Goldcrest and Firecrest. Table S6 Cumulative number of Goldcrests caught on Bukowo BK (54°20′56″-27′46″ N, 16°15′54″-24′38″ E) field station between 14 August and 1 November 1976-2023. Table S7 Cumulative number of Goldcrests caught on Mierzeja Wiślana MW (54°21′10″-57″ N, 19°18′55″-23′30″ E) field station between 14 August and 1 November 1976-2023. Table S8 Cumulative number of Firecrests caught on Bukowo BK (54°20′56″-27′46″ N, 16°15′54″-24′38″ E) field station between 14 August and 1 November 1976–2023. Table S9 Cumulative number of Firecrests caught on Mierzeja Wiślena MW (54°21′10″-57″ N, 19°18′55″-23′30″ E) field station between 14 August and 1 November 1976–2023. Table S10 PanEuropean breeding birds population index from The Pan-European Common Bird Monitoring Scheme (PECBMS) [6]. Table S11 Pan-European breeding birds population index from The Pan-European Common Bird Monitoring Scheme (PECBMS) [6] comparison to Migratory Bird abundance Index from two field stations normalized to the index from 1982 from years 1982–2022 -{2010, 2011}. Table S12 Pan-European breeding birds population index from The Pan-European Common Bird Monitoring Scheme (PECBMS) [6] comparison to Migratory Bird abundance Index from two field stations normalized to the index from 1982 from years 1982–2022 -{2010, 2011}. Table S13. Observed (Obs) and predicted (pred) (using Generalized Additive Models) median dates of autumn passage for Goldcrest (RE_REG) and Firecrest (RE_IGN) at ringing stations Bukowo-Kopań (BK) and Mierzeja Wiślana (MW). Table S14 Comparison of North Atlantic Index, European Temperature Anomaly, and European snow cover to PanEuropean breeding birds population index from The Pan-European Common Bird Monitoring Scheme (PECBMS) [6]; Migratory Bird abundance Index from each ringing station recalculated as the proportion of the index in 1982.The median date of passage subtracted from the median date of passage in 1982 at each station for each species. Table S15. Pearson's correlation coefficients (r) between climate variables used as explanatory variables in 40 analysed years during 1982-2023 (excluding 2010, 2011), in multiple regression models, explaining changes in migrant bird abundance indices (MBAi) at Bukowo-Kopań and Mierzeja Wiślana (N Poland), and breeding bird abundance indices from PECBMS across Europe. Statistically significant coefficients (p<0.05) marked in red font. Table S16 Firecrest observations downloaded from the Global Biodiversity Information Facility (GBIF). GBIF gathers data from multiple citizen science platforms such as: Artportalen, EBIRD, ICO-ornitho-cat, naturgucker, Observations, and so2-birds [26]. Table S17 Firecrest lattitude and longitude avarage from the obsservations collected by the Global Biodiversity Information Facility (GBIF) during breeding season breeding season (1st May – 30th June). GBIF gathers data from multiple citizen science platforms such as: Artportalen, EBIRD, ICO-ornitho-cat, naturgucker, Observations, and so2-birds [26]. Table S18 Firecrest observations from 2002 downloaded from the Global Biodiversity Information Facility (GBIF). GBIF gathers data from multiple citizen science platforms such as: Artportalen, EBIRD, ICO-ornitho-cat, naturgucker, Observations, and so2-birds [26]. Table S19 Firecrest observations from 2012 downloaded from the Global Biodiversity Information Facility (GBIF). GBIF gathers data from multiple citizen science platforms such as: Artportalen, EBIRD, ICO-ornitho-cat, naturgucker, Observations, and so2-birds [26]. Table S20 Firecrest observations from 2022 downloaded from the Global Biodiversity Information Facility (GBIF). GBIF gathers data from multiple citizen science platforms such as: Artportalen, EBIRD, ICO-ornitho-cat, naturgucker, Observations, and so2-birds [26]. Table S21. Relationships between climate variables and Migrating Birds Abundance index (MBAi) of Goldcrest and Firecrest caught during autumn migration at stations Bukowo-Kopań (BK) and Mierzeja Wiślana (MW), N Poland, in 1982–2023. Estimate—coefficients from multiple regression, SE—standard error of the estimates; t, p - test and significance of each estimate, VIF—variance inflation factor. Table S22. Model selection procedure by “all subsets” selection, according to AICc, from the full model (Table S21). The models describe the relationship between the Migrating Birds Abundance index (MBAi) at stations Bukowo-Kopań (BK) and Mierzeja Wiślana (MW) in N Poland, for Goldcrest and Firecrest in 1982–2023, and climate variables. The table presents all models with ΔAICc < 2. Table S23 Relationships between climate variables and Migrating Birds Abundance index (MBAi) of Goldcrest and Firecrest caught during autumn migration at stations Bukowo-Kopań (BK) and Mierzeja Wiślana (MW), N Poland, in 1982–2023. Estimate—coefficients from multiple regression, SE—standard error of the estimates; t, pt-test and significance of each estimate, p < 0.05 marked in bold face . VIF—variance inflation factor. Table S24. Model selection procedure by “all subsets” selection, according to AICc, from the full model (Table S21). The models describe the relationship between the median date of autumn migration (Q2) at stations Bukowo-Kopań (BK) and Mierzeja Wiślana (MW) in N Poland, for Goldcrest and Firecrest in 1982–2023, and climate variables. The table presents all models with ΔAICc < 2. Table S25. Relationships between climate variables and Migrating Birds Abundance index (BK_MBAi) of Goldcrest Regulus regulus caught during autumn migration at station Bukowo-Kopań caught at Bukowo, N Poland, in 1982–2023. Table S26. Relationships between climate variables and PECMBS index for Goldcrest and Firecrest in 1982–2022. Estimate—coefficients from multiple regression, SE—standard error of the estimates; t, p — t-test and significance of each estimate, VIF—variance inflation factor. Table S27. Model selection procedure by “all subsets” selection, according to AICc, from the full model (Table S26). The models describe the relationship between the breeding bird abundance index from PECBMS in Europe for Goldcrest and Firecrest in 1982–2022, and climate variables. The table presents all models with ΔAICc < 2. Table S28. Relationships between climate variables and PECMBS for Goldcrest and Firecrest over 1982–2022.
Author Contributions
Conceptualization, T.M. and M.R.; methodology, T.M.; validation, M.R., formal analysis, M.R.; investigation, T.M.; resources, M.R.; data curation, T.M.; writing—original draft preparation, T.M.; writing—review and editing, T.M. and M.R.; visualization, T.M.; supervision, M.R.; project administration, M.R.; funding acquisition, M.R. All authors have read and agreed to the published version of the manuscript.
Funding
This research has been supported over the years by the Special Research Facility grants (SPUB) from the Polish Ministry of Education and Science to the Bird Migration Research Station, University of Gdańsk.
Institutional Review Board Statement
No approval of any Institutional Board was required for this study.
Informed Consent Statement
Not applicable.
Data Availability Statement
Data contained within the article or supplementary material or is derived from public domain resources. Data from ringing at Operation Baltic ringing stations s can be found at the Global Biodiversity Information Facility (GBIF) database at: Ringing Data from the Bird Migration Research Station, University of Gdańsk (gbif.org) [73].
Acknowledgments
Thousands of citizen scientists made a decisive contribution to this paper. We are grateful to thousands of volunteers and the staff of the Bird Migration Research Station for collecting the data at Operation Baltic ringing stations over the decades and compiling the databases we used. We would like to thank all the volunteers who participated in the citizen science projects and submitted their bird observations to various citizen science platforms, which we were able to use thanks to the Global Biodiversity Information Facility.
Conflicts of Interest
The authors declare no conflicts of interest.
References
- Crick, H.Q.P. The Impact of Climate Change on Birds. Ibis 2004, 146. [Google Scholar] [CrossRef]
- Visser, M.E.; Perdeck, A.C.; van Balen, J.H.; Both, C. Climate Change Leads to Decreasing Bird Migration Distances. Glob Chang Biol 2009, 15. [Google Scholar] [CrossRef]
- Skagen, S.K.; Adams, A.A.Y. Weather Effects on Avian Breeding Performance and Implications of Climate Change. Ecological Applications 2012, 22. [Google Scholar] [CrossRef] [PubMed]
- Askeyev, O.; Askeyev, A.; Askeyev, I. Recent Climate Change Has Increased Forest Winter Bird Densities in East Europe. Ecol Res 2018, 33. [Google Scholar] [CrossRef]
- Remisiewicz, M.; Underhill, L.G. Large-Scale Climatic Patterns Have Stronger Carry-Over Effects than Local Temperatures on Spring Phenology of Long-Distance Passerine Migrants between Europe and Africa. Animals 2022, 12. [Google Scholar] [CrossRef]
- Temple, S.A.; Wiens, J.A.; Bird, C. Bird Populations and Environmental Changes: Can Birds Be Bio-Indicators? American Birds 1989, 43. [Google Scholar]
- Gregory, R.D.; Eaton, M.A.; Burfield, I.J.; Grice, P. V.; Howard, C.; Klvaňová, A.; Noble, D.; Šilarová, E.; Staneva, A.; Stephens, P.A.; et al. Drivers of the Changing Abundance of European Birds at Two Spatial Scales. Philosophical Transactions of the Royal Society B: Biological Sciences 2023, 378. [Google Scholar] [CrossRef]
- Crick, H.Q.P.; Baillie, S.R.; Leech, D.I. The UK Nest Record Scheme: Its Value for Science and Conservation. Bird Study 2003, 50. [Google Scholar] [CrossRef]
- Dumbović Mazal, V.B.L.K.J. The Launch of the Common Farmland Bird Monitoring Scheme in Croatia. In Bird census news; Anselin, A., Heldbjerg, H., Eaton, M., Eds.; Research Institute for Nature and Forest, INBO,: Brussels, Belgium, 2015. [Google Scholar]
- Svensson, S. European Bird Monitoring: Geographical Scales and Sampling Strategies. The Ring 2000, 22. [Google Scholar]
- Robinson, R.A.; Julliard, R.; Saracco, J.F. Constant Effort: Studying Avian Population Processes Using Standardised Ringing. Ringing and Migration 2009, 24. [Google Scholar] [CrossRef]
- Roberts, J.P.; Schnell, G.D. Comparison of Survey Methods for Wintering Grassland Birds. J Field Ornithol 2006, 77. [Google Scholar] [CrossRef]
- Komenda-Zehnder, S.; Jenni, L.; Liechti, F. Do Bird Captures Reflect Migration Intensity? - Trapping Numbers on an Alpine Pass Compared with Radar Counts. J Avian Biol 2010, 41. [Google Scholar] [CrossRef]
- Nowakowski, J. Catch Numbers at Ringing Stations Is a Reflection of Bird Migration Intensity, as Exemplified by Autumn Movements of the Great Tit ( Parus Major ). RING 2003, 25. [Google Scholar] [CrossRef]
- Newton, I. Weather-Related Mass-Mortality Events in Migrants. Ibis 2007, 149. [Google Scholar] [CrossRef]
- Busse, P.; Meissner, W. Bird Ringing Station Manual; Walter de Gruyter GmbH & Co KG: Warsaw/Berlin, 2015; ISBN 9788376560526. [Google Scholar]
- Wynn, R.B.; Ward, M.; Adams, M.C. The Increasing Firecrest Population in the New Forest, Hampshire. British Birds 2012, 105. [Google Scholar]
- Balmer, D.E.; Gillings, S.; Caffrey, B.J.; Swann, R.L.; Downie, I.S.; Fuller, R.J. Bird Atlas 2007-11: The Breeding and Wintering Birds of Britain and Ireland; BTO Thetford, 2013; ISBN 190858128X.
- Kralj, J.; Flousek, J.; Huzak, M.; Ćiković, D.; Dolenec, Z. Factors Affecting the Goldcrest/Firecrest Abundance Ratio in Their Area of Sympatry. Ann Zool Fennici 2013, 50, 333–346. [Google Scholar] [CrossRef]
- Sanderson, F.J.; Donald, P.F.; Pain, D.J.; Burfield, I.J.; van Bommel, F.P.J. Long-Term Population Declines in Afro-Palearctic Migrant Birds. Biol Conserv 2006, 131. [Google Scholar] [CrossRef]
- Cramp, S. Volume VI: Warblers. In Handbook of the Birds of Europe, the Middle East, and North Africa: The Birds of the Western Palearctic; Oxford University Press: New York, 1992. [Google Scholar]
- Witt, K.; Mitschke, A.; Luniak, M. A Comparison of Common Breeding Bird Populations in Hamburg, Berlin and Warsaw. Acta Ornithol 2005, 40. [Google Scholar] [CrossRef]
- Snow, D.; Perrins, C.M. , The Birds of the Western Palearctic Concise Edition; Oxford University Press: Oxford ; New York, 1998; Vol. 2; ISBN 019854099X.
- Leisler, B.; Thaler, E. Differences in Morphology and Foraging Behaviour in the Goldcrest Regulus Regulus and Firecrest Regulus Ignicapillus. Ann Zool Fennici 1982, 19. [Google Scholar]
- Trepte, A. Wintergoldhähnchen - Steckbrief, Verbreitung, Bilder - Avi-Fauna Deutschland. Available online: Https://Www.Avi-Fauna.Info/ (accessed on day month year).
- Remisiewicz, M.; Baumanis, J. Autumn Migration of Goldcrest (Regulus Regulus) at the Eastern Abd Southern Baltic Coast; 1996; Vol. 18;
- Maciąg, T.; Remisiewicz, M.; Nowakowski, J.K.; Redlisiak, M.; Rosińska, K.; Stępniewski, K.; Stępniewska, K.; Szulc, J. Website of the Bird Migration Research Station Http://Www.Sbwp.Ug.Edu.Pl/Badania/Monitoringwyniki/.
- Spina, F.; Baillie, S.R.; Bairlein, F.; Fiedler, W.; Thorup, K. The Eurasian African Bird Migration Atlas. Available Online: Https://Migrationatlas.Org.
- Sokolov, L. V; Markovets, M.Y.; Shapoval, A.P.; Morozov, Y.G. Long-Term Trends in the Timing of Spring Migration of Passerines on the Courish Spit of the Baltic Sea. Avian Ecology and Behaviour 1998, 1. [Google Scholar]
- Tøttrup, A.P.; Thorup, K.; Rahbek, C. Patterns of Change in Timing of Spring Migration in North European Songbird Populations. J Avian Biol 2006, 37, 84–92. [Google Scholar] [CrossRef]
- Redlisiak, M.; Remisiewicz, M.; Nowakowski, J.K. Long-Term Changes in Migration Timing of Song Thrush Turdus Philomelos at the Southern Baltic Coast in Response to Temperatures on Route and at Breeding Grounds. Int J Biometeorol 2018, 62. [Google Scholar] [CrossRef] [PubMed]
- Allison, P.D. Multiple Regression: A Primer. Stat Med 1999, 20. [Google Scholar]
- R Core Team R: A Language and Environment for Statistical Computing. url = {https://www.R-project.org/}.
- Takuya Yanagida Misty: Miscellaneous Functions “T. Yanagida” 2024.
- Jones, P.D.; Jonsson, T.; Wheeler, D. Extension to the North Atlantic Oscillation Using Early Instrumental Pressure Observations from Gibraltar and South-West Iceland. International Journal of Climatology 1997, 17. [Google Scholar] [CrossRef]
- NOAA National Centers for Environmental information Climate at a Glance: Global Time Series.
- Estilow, T.W.; Young, A.H.; Robinson, D.A. A Long-Term Northern Hemisphere Snow Cover Extent Data Record for Climate Studies and Monitoring. Earth Syst Sci Data 2015, 7, 137–142. [Google Scholar] [CrossRef]
- Dormann, C.F.; Elith, J.; Bacher, S.; Buchmann, C.; Carl, G.; Carré, G.; Marquéz, J.R.G.; Gruber, B.; Lafourcade, B.; Leitão, P.J.; et al. Collinearity: A Review of Methods to Deal with It and a Simulation Study Evaluating Their Performance. Ecography 2013, 36. [Google Scholar] [CrossRef]
- Fox, J.; Weisberg, S. Multivariate Linear Models in R: An Appendix to an R Companion to Applied Regression; 2011; Vol. 12;
- Bartoń, K. MuMIn: Multi-Model Inference, Version 1.43.6. R package 2019. [Google Scholar]
- Kim, S. Ppcor: An R Package for a Fast Calculation to Semi-Partial Correlation Coefficients. Commun Stat Appl Methods 2015, 22. [Google Scholar] [CrossRef]
- Remisiewicz, M.; Underhill, L.G. Climatic Variation in Africa and Europe Has Combined Effects on Timing of Spring Migration in a Long-Distance Migrant Willow Warbler Phylloscopus Trochilus. PeerJ 2020, 8, e8770. [Google Scholar] [CrossRef]
- GBIF. org GBIF Occurrence Download. 2023.
- QGIS.Org, 3.34.1. QGIS.Org, 3.34.1.2024. QGIS Geographic Information System. Http://Www.Qgis.Org 2023.
- Green, M.; Haas, F.; Lindström, Å.; Nilsson, L. Övervakning Av Fåglarnas Populationsutveckling. Årsrapport För 2020. 2021.
- Both, C.; Bouwhuis, S.; Lessells, C.M.; Visser, M.E. Climate Change and Population Declines in a Long-Distance Migratory Bird. Nature 2006, 441, 81–83. [Google Scholar] [CrossRef] [PubMed]
- Vickery, J.A.; Ewing, S.R.; Smith, K.W.; Pain, D.J.; Bairlein, F.; Škorpilová, J.; Gregory, R.D. The Decline of Afro-Palaearctic Migrants and an Assessment of Potential Causes. Ibis 2014, 156, 1–22. [Google Scholar] [CrossRef]
- Lehikoinen, A.; Pakanen, V.M.; Kivinen, S.; Kumpula, S.; Lehto, V.; Rytkönen, S.; Vatka, E.; Virkkala, R.; Orell, M. Population Collapse of a Common Forest Passerine in Northern Europe as a Consequence of Habitat Loss and Decreased Adult Survival. For Ecol Manage 2024, 572, 122283. [Google Scholar] [CrossRef]
- Jenni, L.; Kéry, M. Timing of Autumn Bird Migration under Climate Change: Advances in Long-Distance Migrants, Delays in Short-Distance Migrants. Proceedings of the Royal Society B: Biological Sciences 2003, 270. [Google Scholar] [CrossRef]
- Ożarowska, A.; Meissner, W. Increasing Body Condition of Autumn Migrating Eurasian Blackcaps Sylvia Atricapilla over Four Decades. European Zoological Journal 2024, 91. [Google Scholar] [CrossRef]
- Ozarowska, A.; Zaniewicz, G.; Meissner, W. Spring Arrival Timing Varies between the Groups of Blackcaps (Sylvia Atricapilla) Differing in Wing Length. Ann Zool Fennici 2018, 55. [Google Scholar] [CrossRef]
- Delmore, K.E.; Van Doren, B.M.; Conway, G.J.; Curk, T.; Garrido-Garduño, T.; Germain, R.R.; Hasselmann, T.; Hiemer, D.; Van Der Jeugd, H.P.; Justen, H.; et al. Individual Variability and Versatility in an Eco-Evolutionary Model of Avian Migration: Migratory Strategies of Blackcaps. Proceedings of the Royal Society B: Biological Sciences 2020, 287. [Google Scholar] [CrossRef]
- Pulido, F.; Berthold, P. Current Selection for Lower Migratory Activity Will Drive the Evolution of Residency in a Migratory Bird Population. Proc Natl Acad Sci U S A 2010, 107. [Google Scholar] [CrossRef]
- Tellería, J.L. The Decline of a Peripheral Population of the European Robin Erithacus Rubecula. J Avian Biol 2015, 46. [Google Scholar] [CrossRef]
- Visser, M.E.; Both, C.; Lambrechts, M.M. Global Climate Change Leads to Mistimed Avian Reproduction. Adv Ecol Res 2004, 35. [Google Scholar]
- Van Gils, J.A.; Lisovski, S.; Lok, T.; Meissner, W.; Ozarowska, A.; De Fouw, J.; Rakhimberdiev, E.; Soloviev, M.Y.; Piersma, T.; Klaassen, M. Climate Change: Body Shrinkage Due to Arctic Warming Reduces Red Knot Fitness in Tropical Wintering Range. Science (1979) 2016, 352, 819–821. [Google Scholar] [CrossRef]
- Pinszke, A.; Remisiewicz, M. Long-Term Changes in Autumn Migration Timing of Garden Warblers Sylvia Borin at the Southern Baltic Coast in Response to Spring, Summer and Autumn Temperatures. European Zoological Journal 2023, 90. [Google Scholar] [CrossRef]
- Haila, Y.; Tiainen, J.; Fennica, K.V.-O. ; 1986, undefined Delayed Autumn Migration as an Adaptive Strategy of Birds in Northern Europe: Evidence from Finland. ornisfennica.journal.fiY Haila, J Tiainen, K VepsäläinenOrnis Fennica, 1986•ornisfennica.journal.fi.
- Søderdahl, A.S.; Tøttrup, A.P. Consistent Delay in Recent Timing of Passerine Autumn Migration. Ornis Fenn 2023, 100. [Google Scholar] [CrossRef]
- Svensson, S.E.; Svensson, S.E. Efficiency of Two Methods for Monitoring Bird Population Levels: Breeding Bird Censuses Contra Counts of Migrating Birds. Oikos 1978, 30. [Google Scholar] [CrossRef]
- Hogstad, O. Variation in Numbers, Territoriality and Flock Size of a Goldcrest Regulus Regulus Population in Winter. Ibis 1984, 126. [Google Scholar] [CrossRef]
- Gyurácz, J.; Bánhidi, P.; Góczán, J.; Illés, P.; Kalmár, S.; Koszorús, P.; Lukács, Z.; Molnár, P.; Németh, C.; Varga, L. Annual Captures and Biometrics of Goldcrests Regulus Regulus at a Western Hungarian Stopover Site. The Ring 2021, 43. [Google Scholar] [CrossRef]
- Sokolov, L. V.; Markovets, M.Y.; Morozov, Y.G. Long-Term Dynamics of the Mean Date of Autumn Migration in Passerines on the Courish Spit of the Baltic Sea. Avian Ecology and Behaviour 1999, 2. [Google Scholar]
- Tøttrup, A.P.; Thorup, K.; Rahbek, C. Changes in Timing of Autumn Migration in North European Songbird Populations. Ardea 2006, 94, 527–536. [Google Scholar]
- Redlisiak, M.; Remisiewicz, M.; Mazur, A. Sex-Specific Differences in Spring Migration Timing of Song Thrush Turdus Philomelos at the Baltic Coast in Relation to Temperatures on the Wintering Grounds. European Zoological Journal 2021, 88. [Google Scholar] [CrossRef]
- Oliver, R.Y.; Mahoney, P.J.; Gurarie, E.; Krikun, N.; Weeks, B.C.; Hebblewhite, M.; Liston, G.; Boelman, N. Behavioral Responses to Spring Snow Conditions Contribute to Long-Term Shift in Migration Phenology in American Robins. Environmental Research Letters 2020, 15. [Google Scholar] [CrossRef]
- Shutt, J.D.; Bell, S.C.; Bell, F.; Castello, J.; El Harouchi, M.; Burgess, M.D. Territory-Level Temperature Influences Breeding Phenology and Reproductive Output in Three Forest Passerine Birds. Oikos 2022, 2022. [Google Scholar] [CrossRef]
- Haftorn, S. Energetics of Incubation by the Goldcrest Regulus Regulus in Relation to Ambient Air Temperatures and the Geographical Distribution of the Species. Ornis Scandinavica 1978, 9. [Google Scholar] [CrossRef]
- Walsh, J.E.; Ballinger, T.J.; Euskirchen, E.S.; Hanna, E.; Mård, J.; Overland, J.E.; Tangen, H.; Vihma, T. Extreme Weather and Climate Events in Northern Areas: A Review. Earth Sci Rev 2020, 209. [Google Scholar] [CrossRef]
- Bison, M.; Yoccoz, N.G.; Carlson, B.; Klein, G.; Laigle, I.; Van Reeth, C.; Asse, D.; Delestrade, A. Best Environmental Predictors of Breeding Phenology Differ with Elevation in a Common Woodland Bird Species. Ecol Evol 2020, 10. [Google Scholar] [CrossRef]
- Felton, A.; Löfroth, T.; Angelstam, P.; Gustafsson, L.; Hjältén, J.; Felton, A.M.; Simonsson, P.; Dahlberg, A.; Lindbladh, M.; Svensson, J.; et al. Keeping Pace with Forestry: Multi-Scale Conservation in a Changing Production Forest Matrix. Ambio 2020, 49. [Google Scholar] [CrossRef]
- Regulus Ignicapilla: BirdLife International. IUCN Red List of Threatened Species 2020. [CrossRef]
- Regulus Regulus: BirdLife International. IUCN Red List of Threatened Species 2018. [CrossRef]
Figure 1.
The geographical range of Goldcrest (A) and Firecrest (B), and the location of the two bird ringing stations of the Operation Baltic project in Poland, which provided data analyzed in this paper (maps after Trepte 2024 [25] modified).
Figure 1.
The geographical range of Goldcrest (A) and Firecrest (B), and the location of the two bird ringing stations of the Operation Baltic project in Poland, which provided data analyzed in this paper (maps after Trepte 2024 [25] modified).
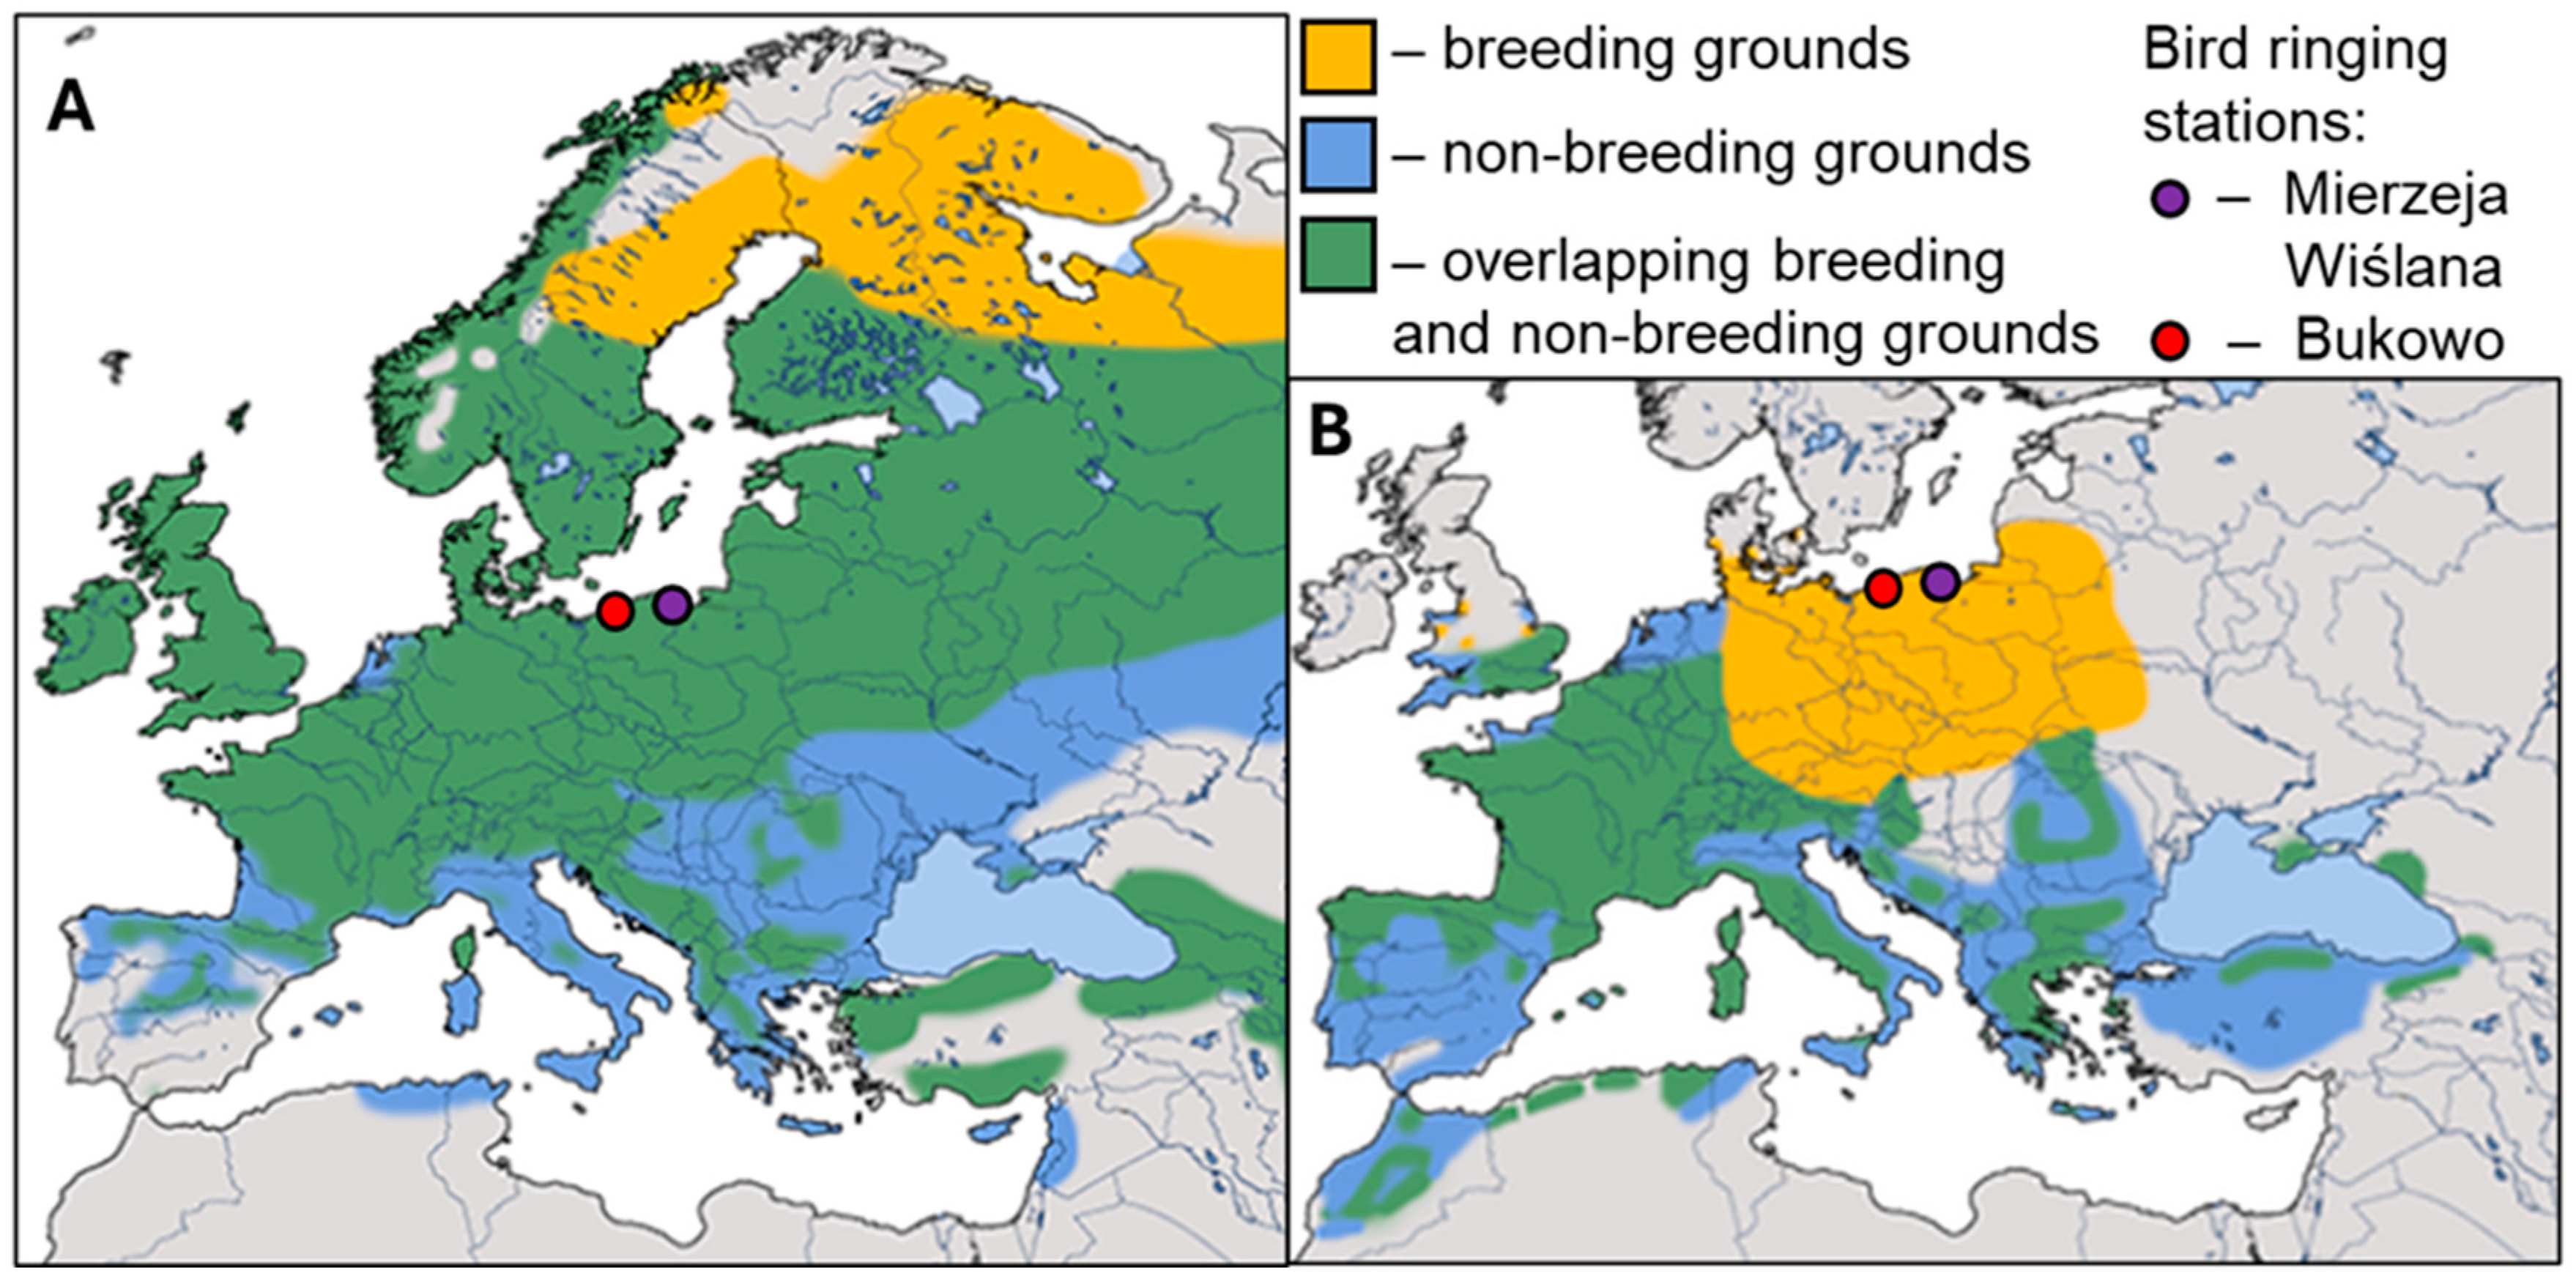
Figure 2.
Migrating bird abundance index (MBAi) for Goldcrest and Firecrest caught during autumn migration (14 August – 1 November) at ringing stations Bukowo-Kopań (BK) and Mierzeja Wiślana (MW) over 1976-2023. Black circles indicate MBAi in each year; the gray line is a trend calculated using GAM. The source data and statistics are presented in Table S5.
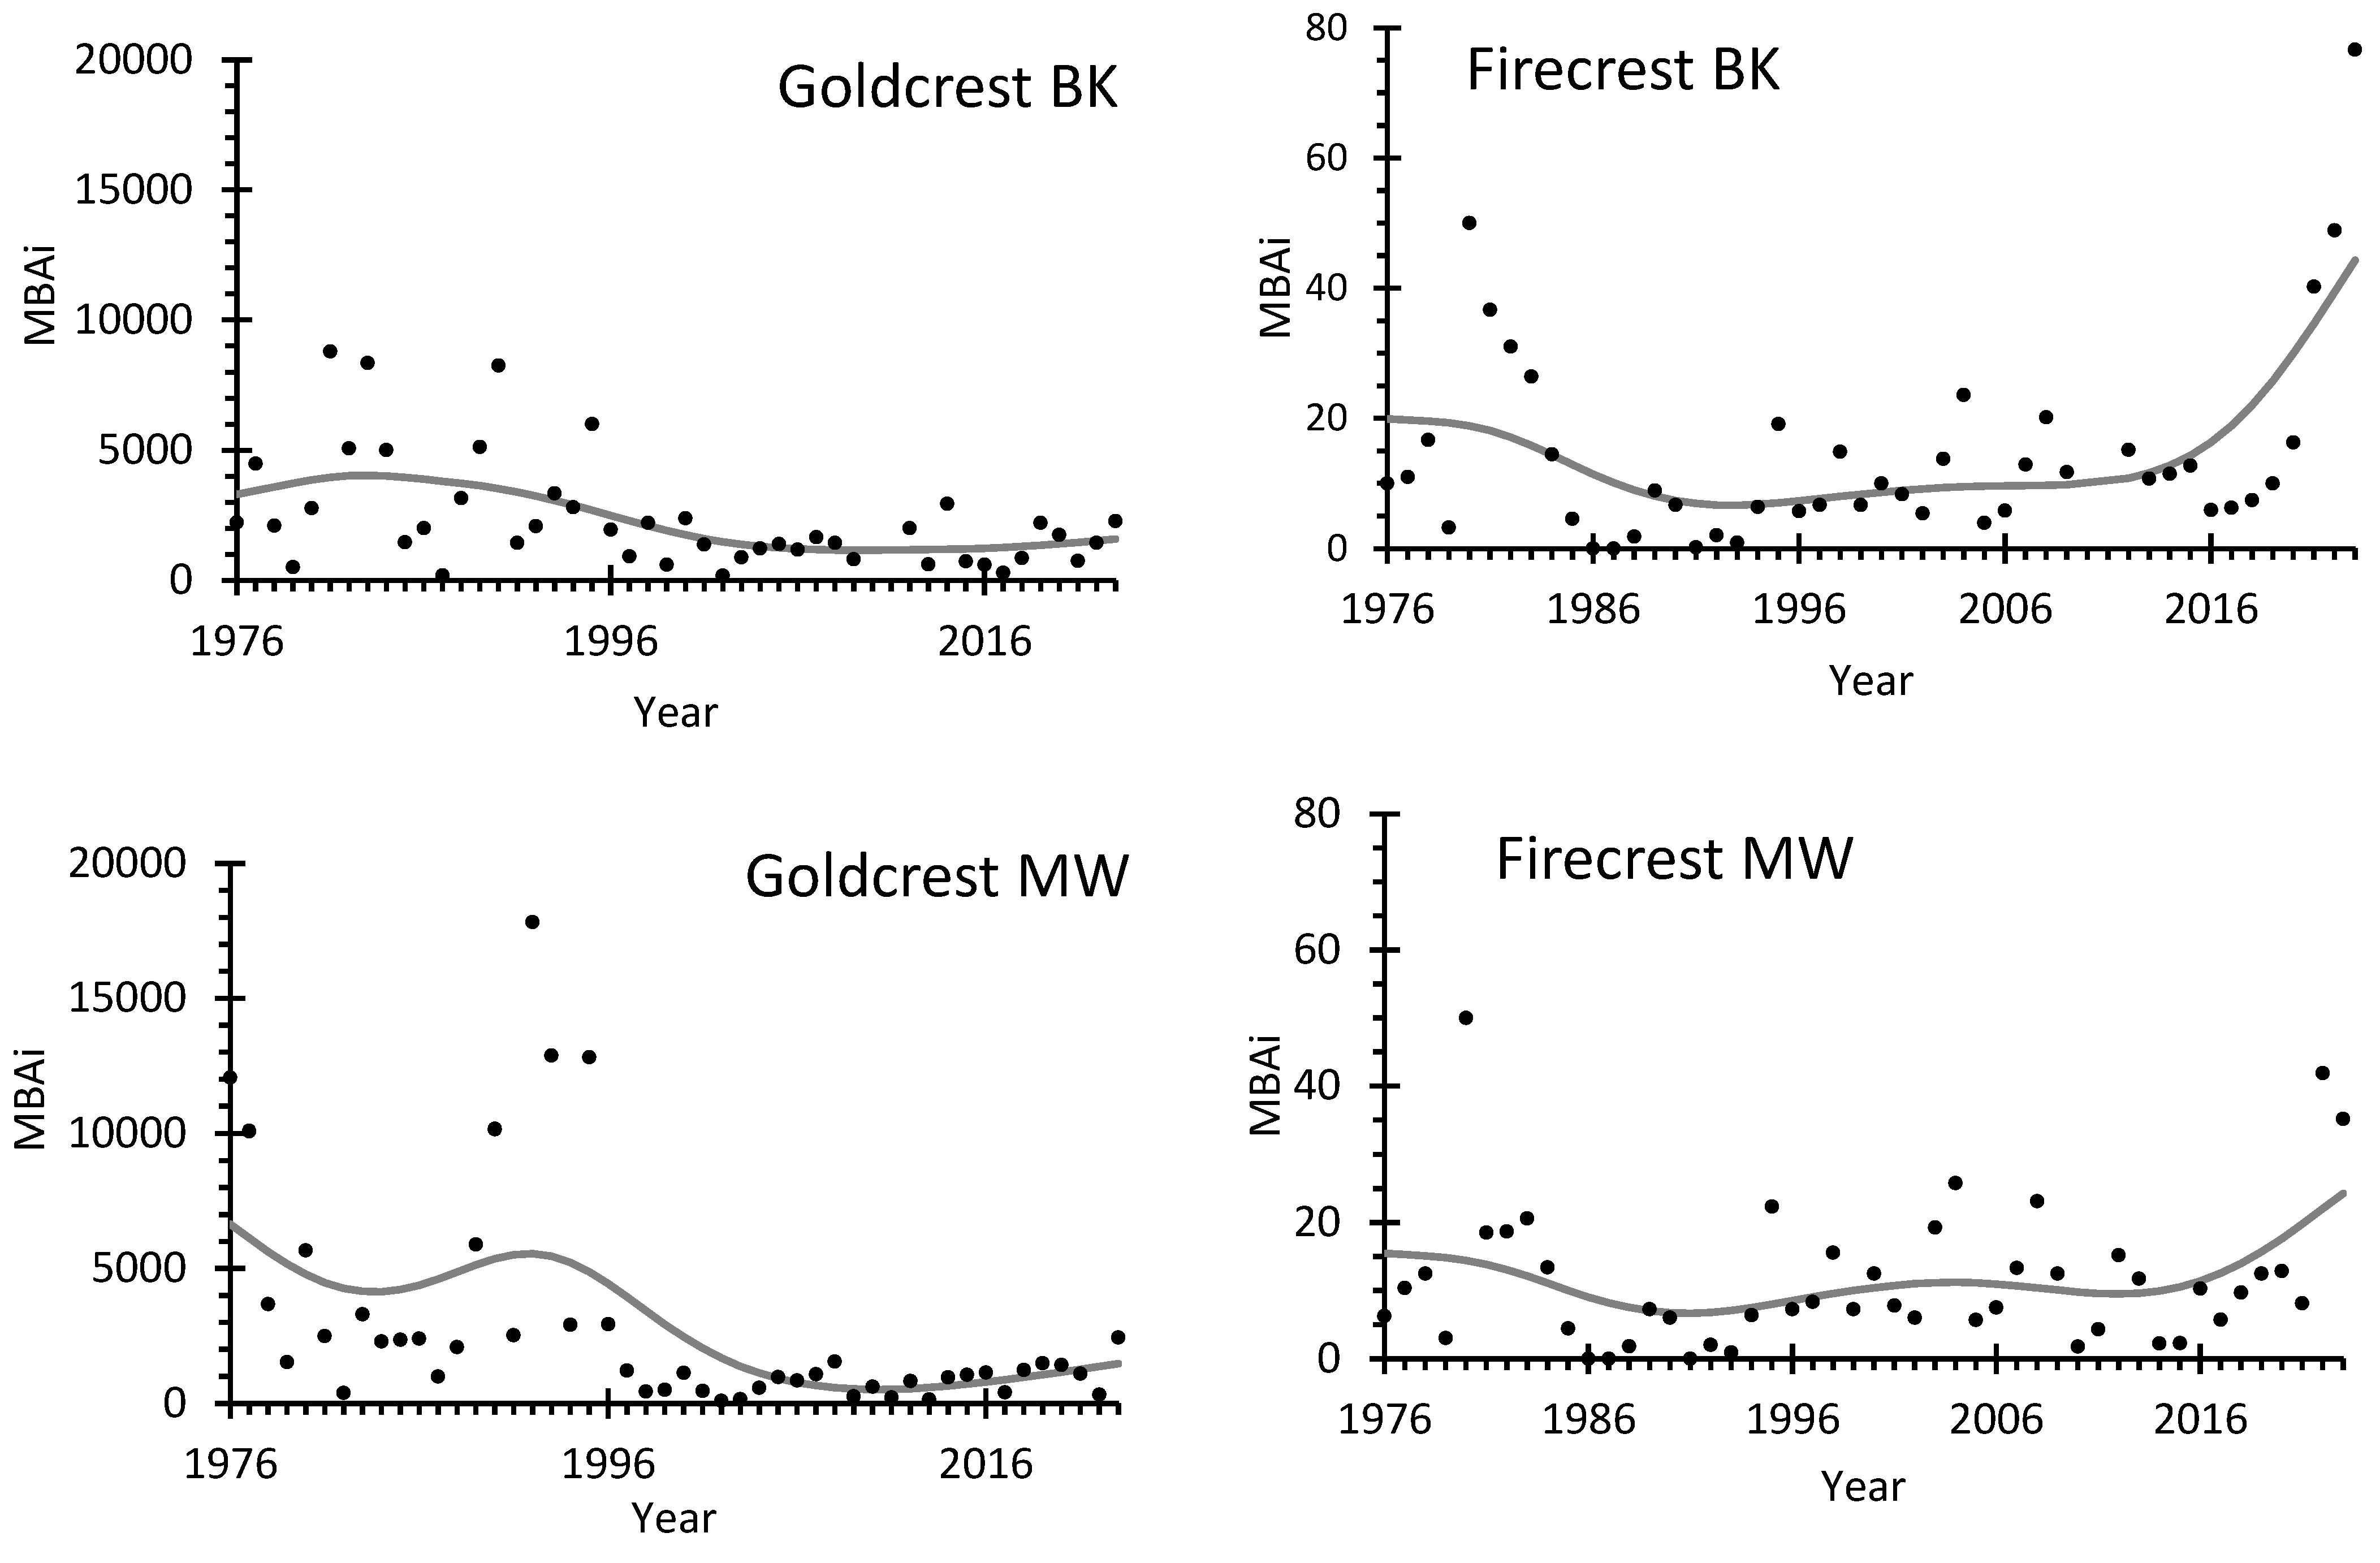
Figure 3.
Median dates of autumn passage for Goldcrest and Firecrest caught during autumn migration (14 August – 1 November) at ringing stations Bukowo-Kopań (BK) and Mierzeja Wiślana (MW) over 1976-2023. Black circles indicate the median dates of passage in each year, the red line shows the trend calculated with GAM. The source data and statistics are presented in Table S13.
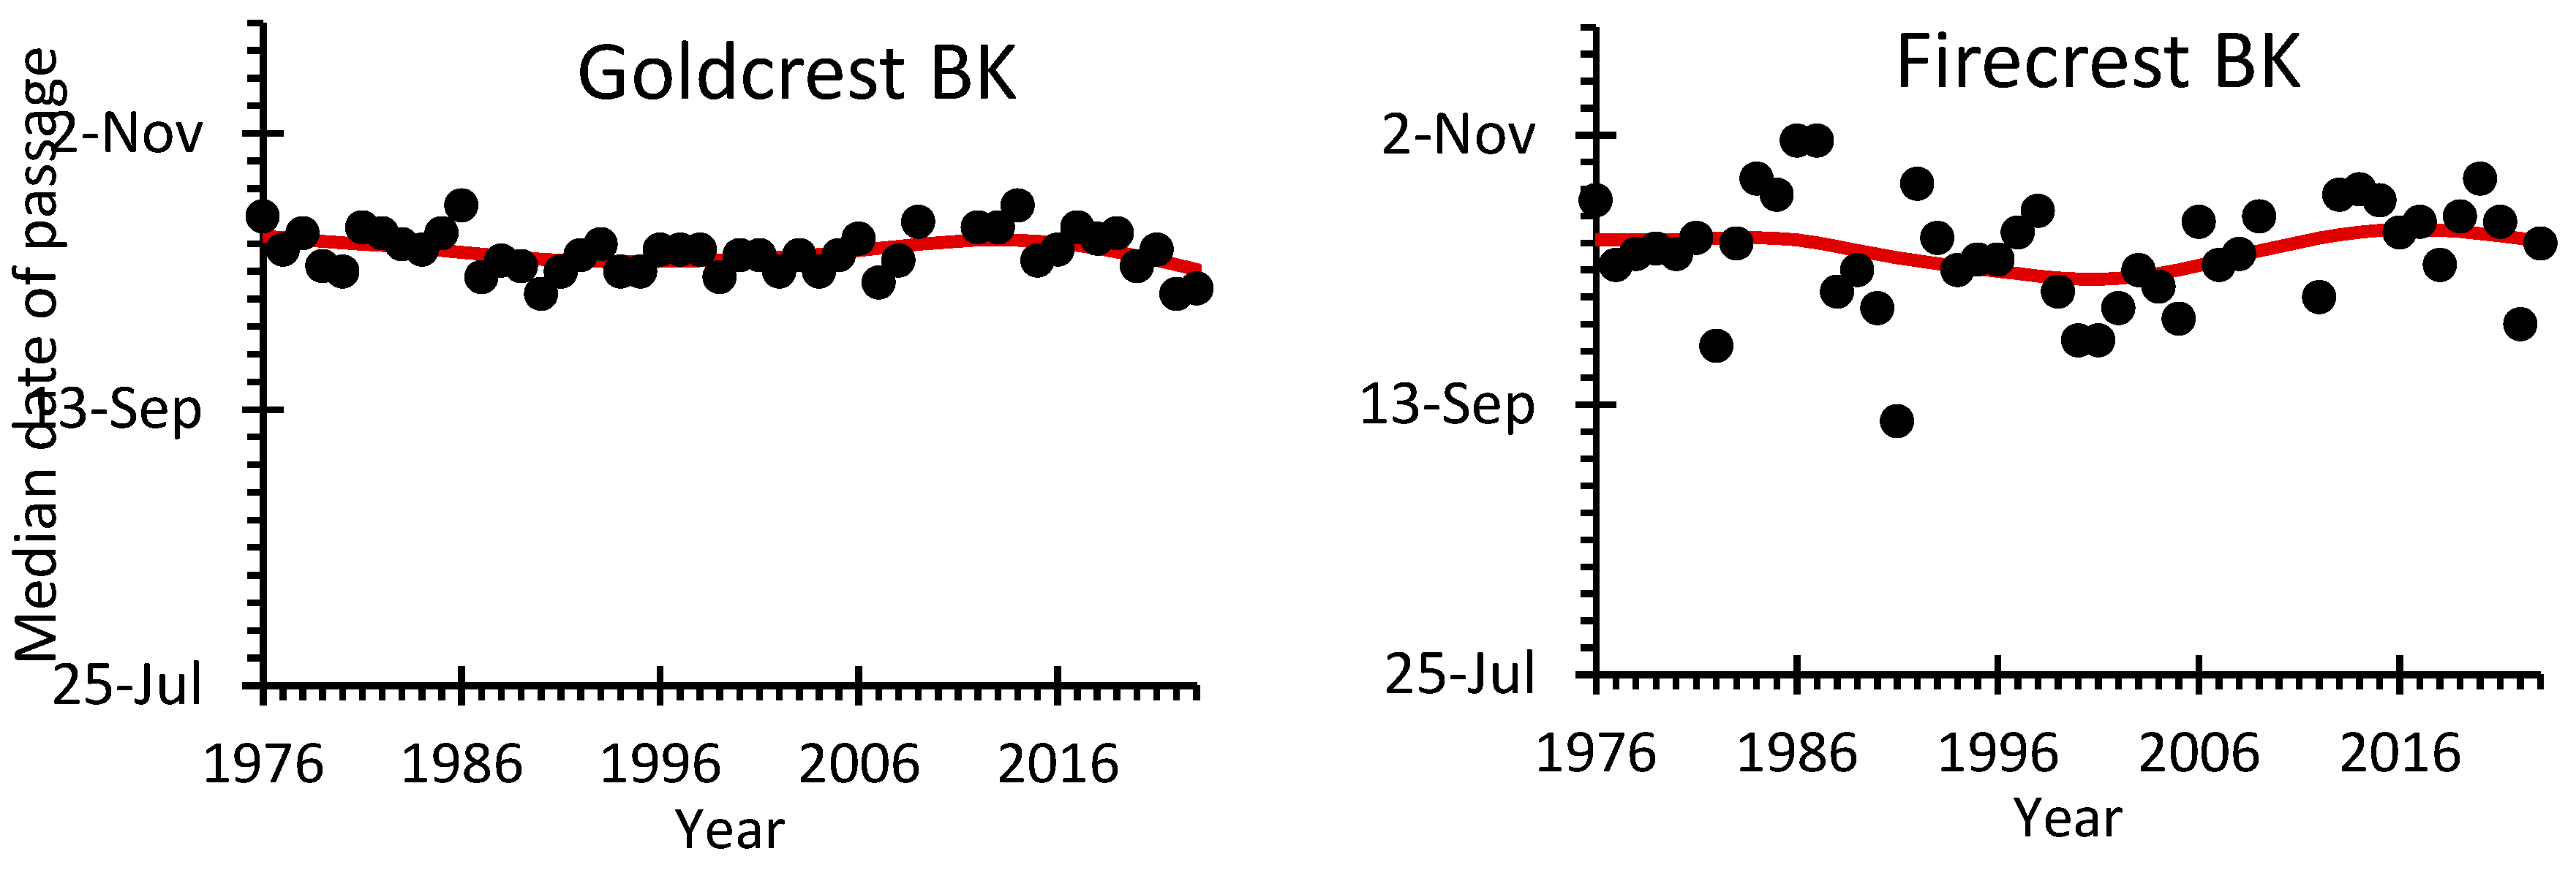
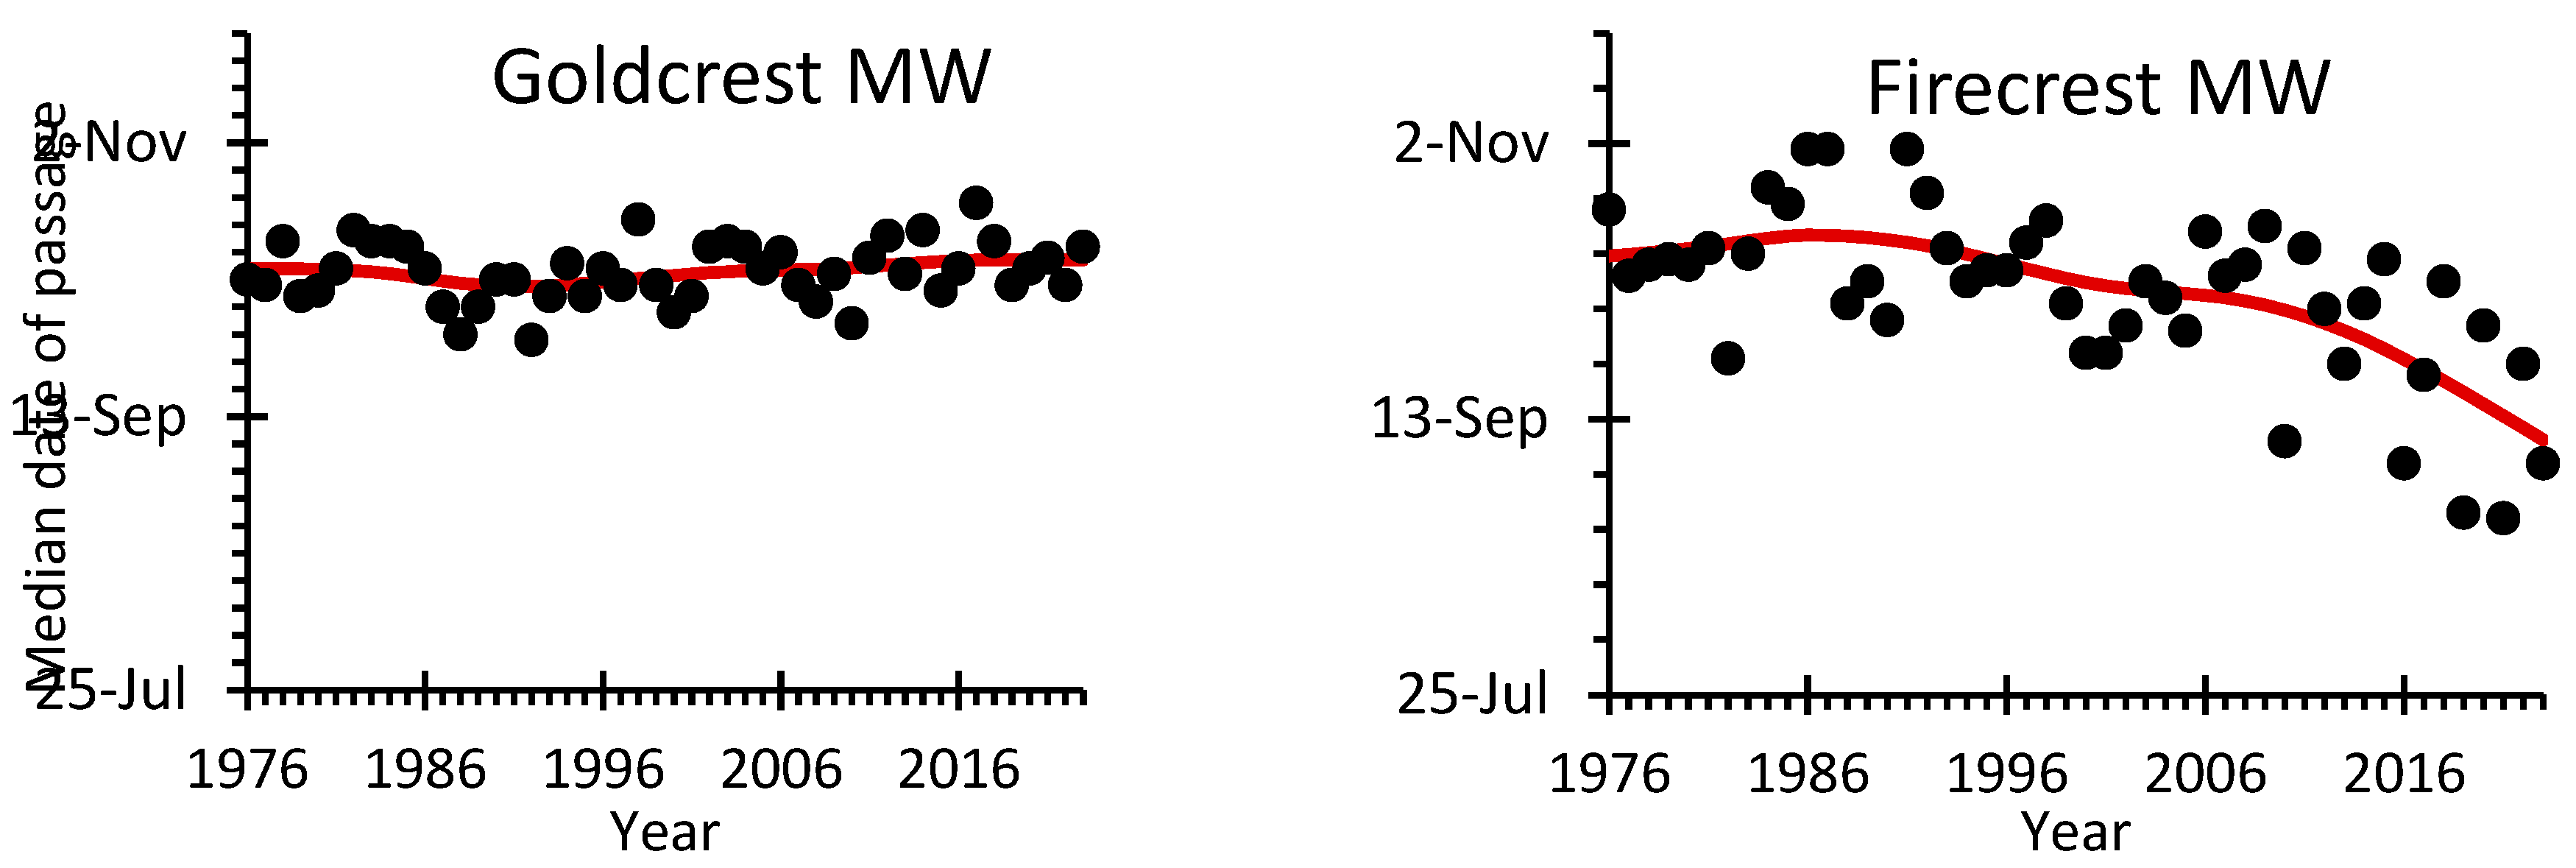
Figure 4.
Goldcrest and Firecrest Migratory Bird Abundance index (MBAi) at ringing stations Bukowo-Kopań (BK) and Mierzeja Wiślana (MW) compared to breeding bird population index based on the Pan-European Common Bird Monitoring Scheme (PECBMS) over 1982-2022. The points represent the value of each index in relation to that index in 1982, and the lines in corresponding color represent the trend calculated with GAM: navy blue – PECBMS; orange – Migratory Bird Abundance index at Bukowo-Kopań (BK_MBAi%); gray – Migratory Bird Abundance index at Mierzeja Wiślana (MW_MBAi%). Source data and statistics are presented in Table S12.
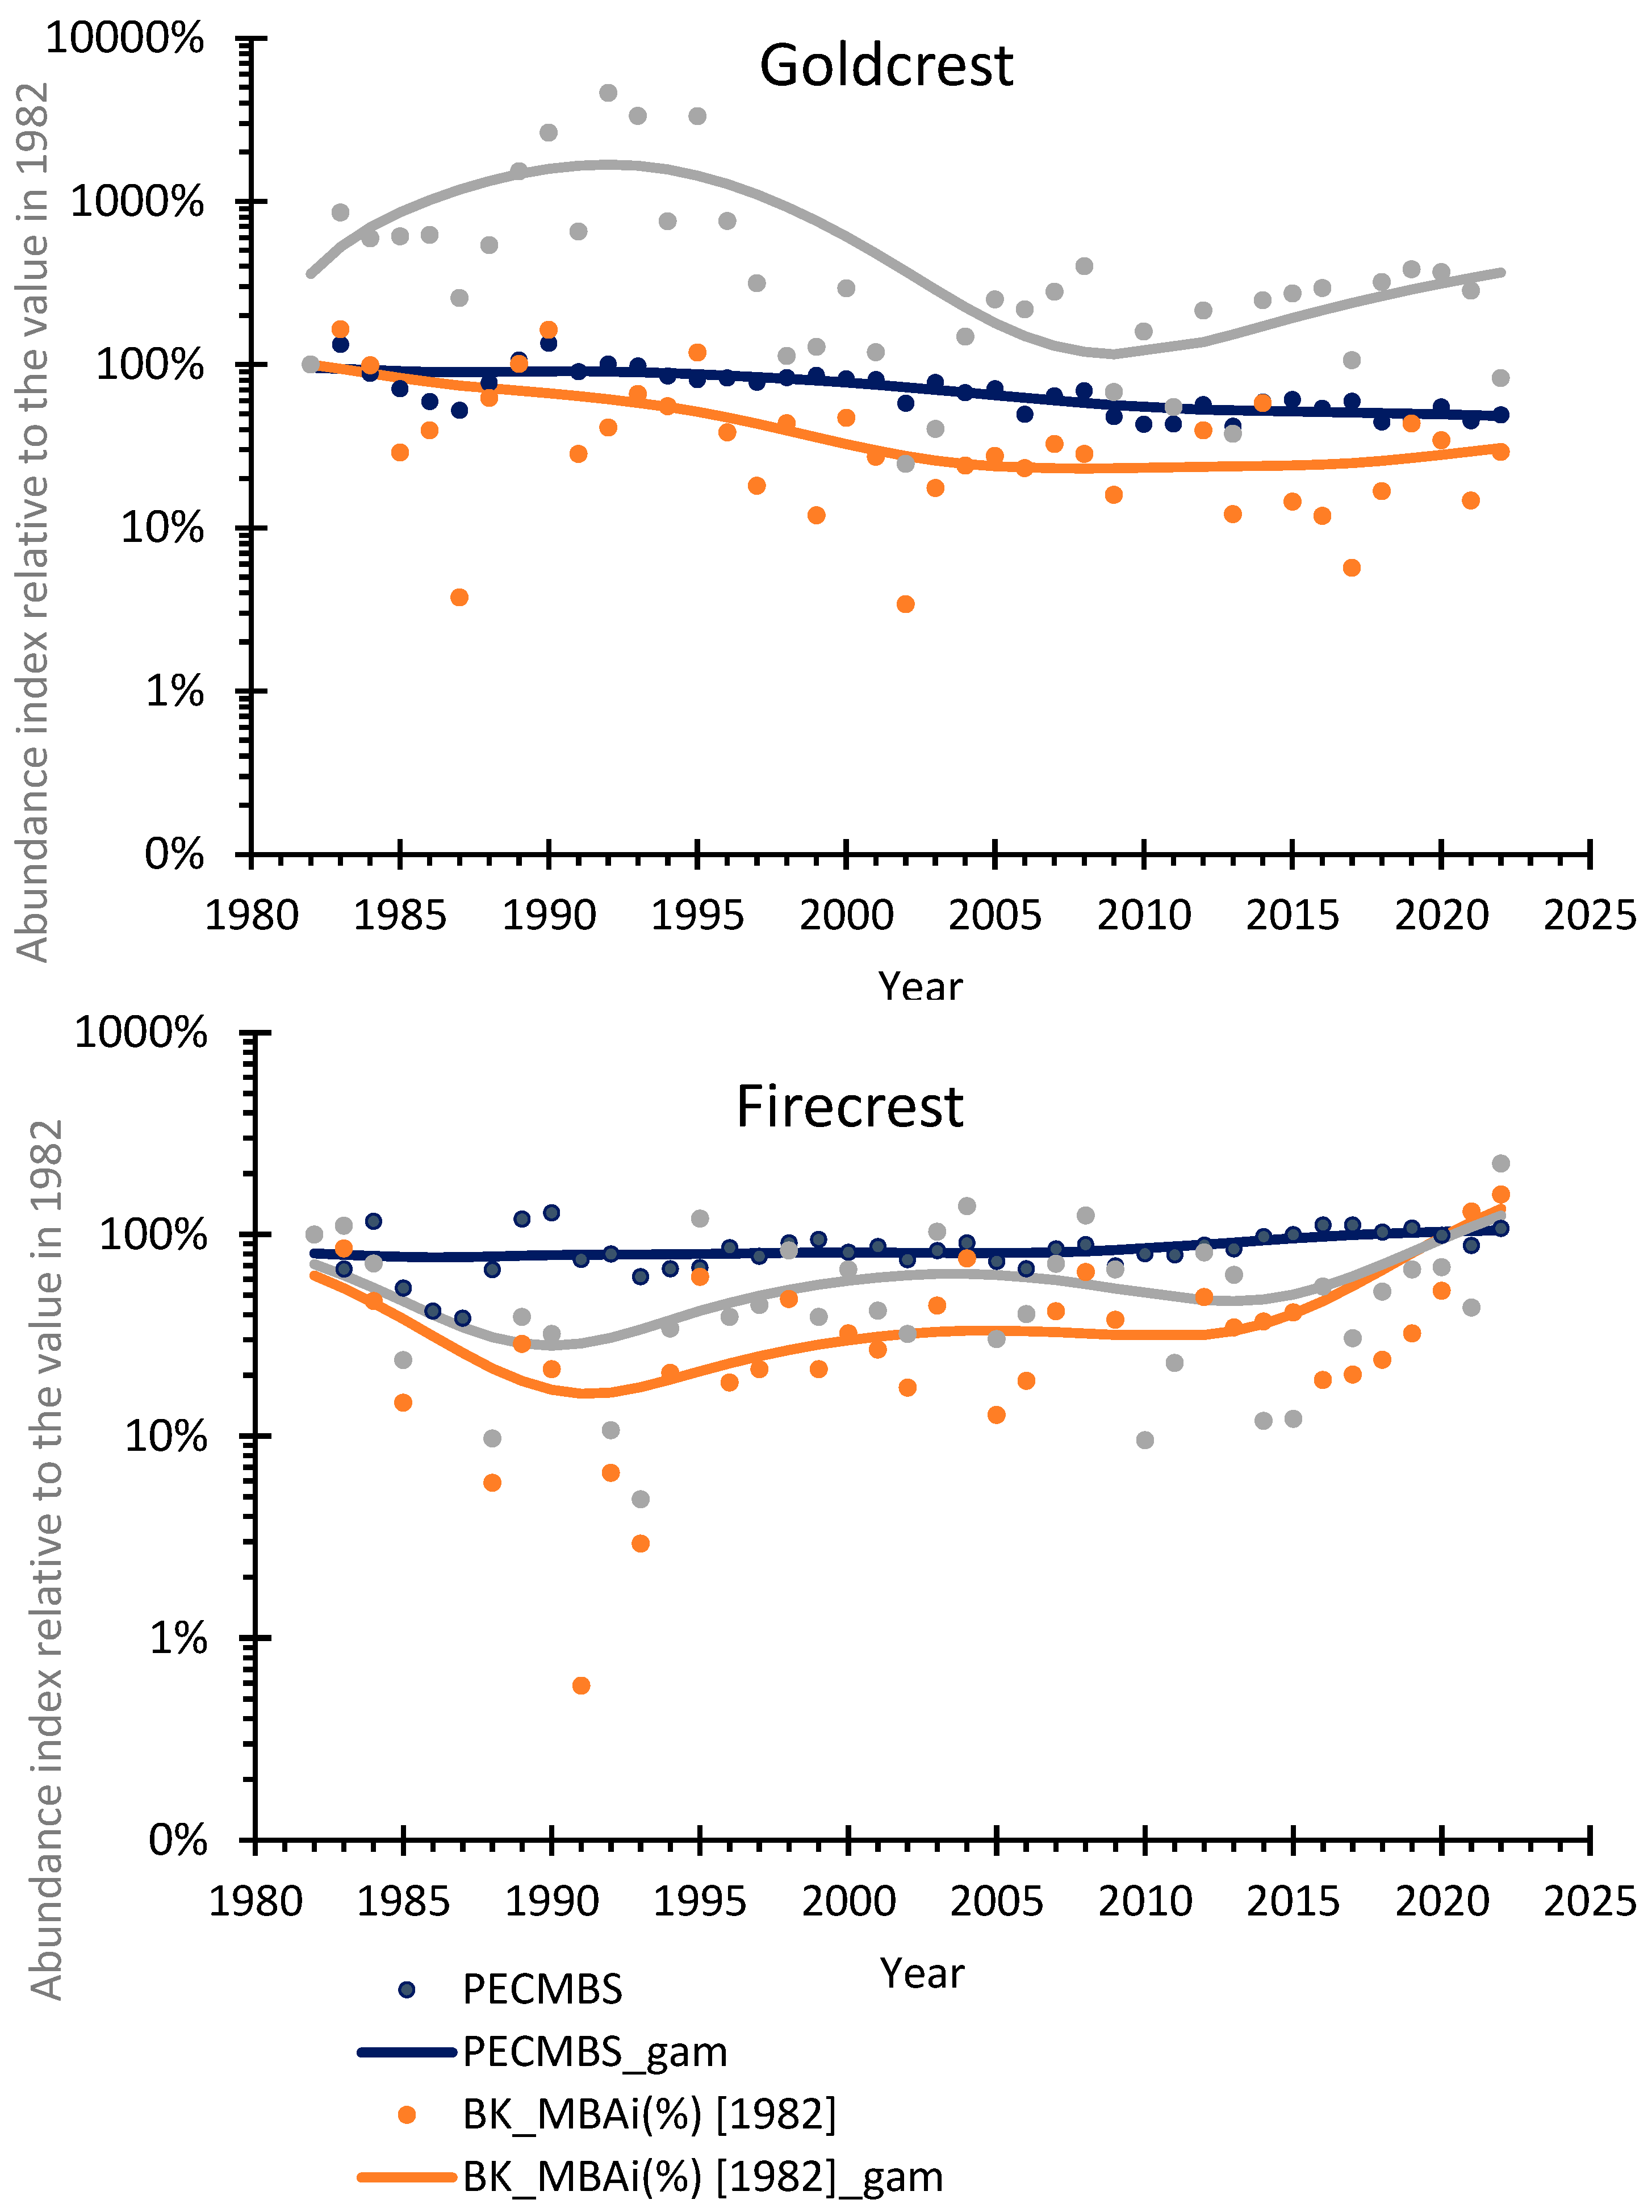
Figure 5.
Firecrest observations in the breeding season (1st May – 30th June) in 2002 (red), 2012 (purple), and 2022 (blue). Observations were downloaded from the Global Biodiversity Information Facility (GBIF) [26].
Figure 5.
Firecrest observations in the breeding season (1st May – 30th June) in 2002 (red), 2012 (purple), and 2022 (blue). Observations were downloaded from the Global Biodiversity Information Facility (GBIF) [26].
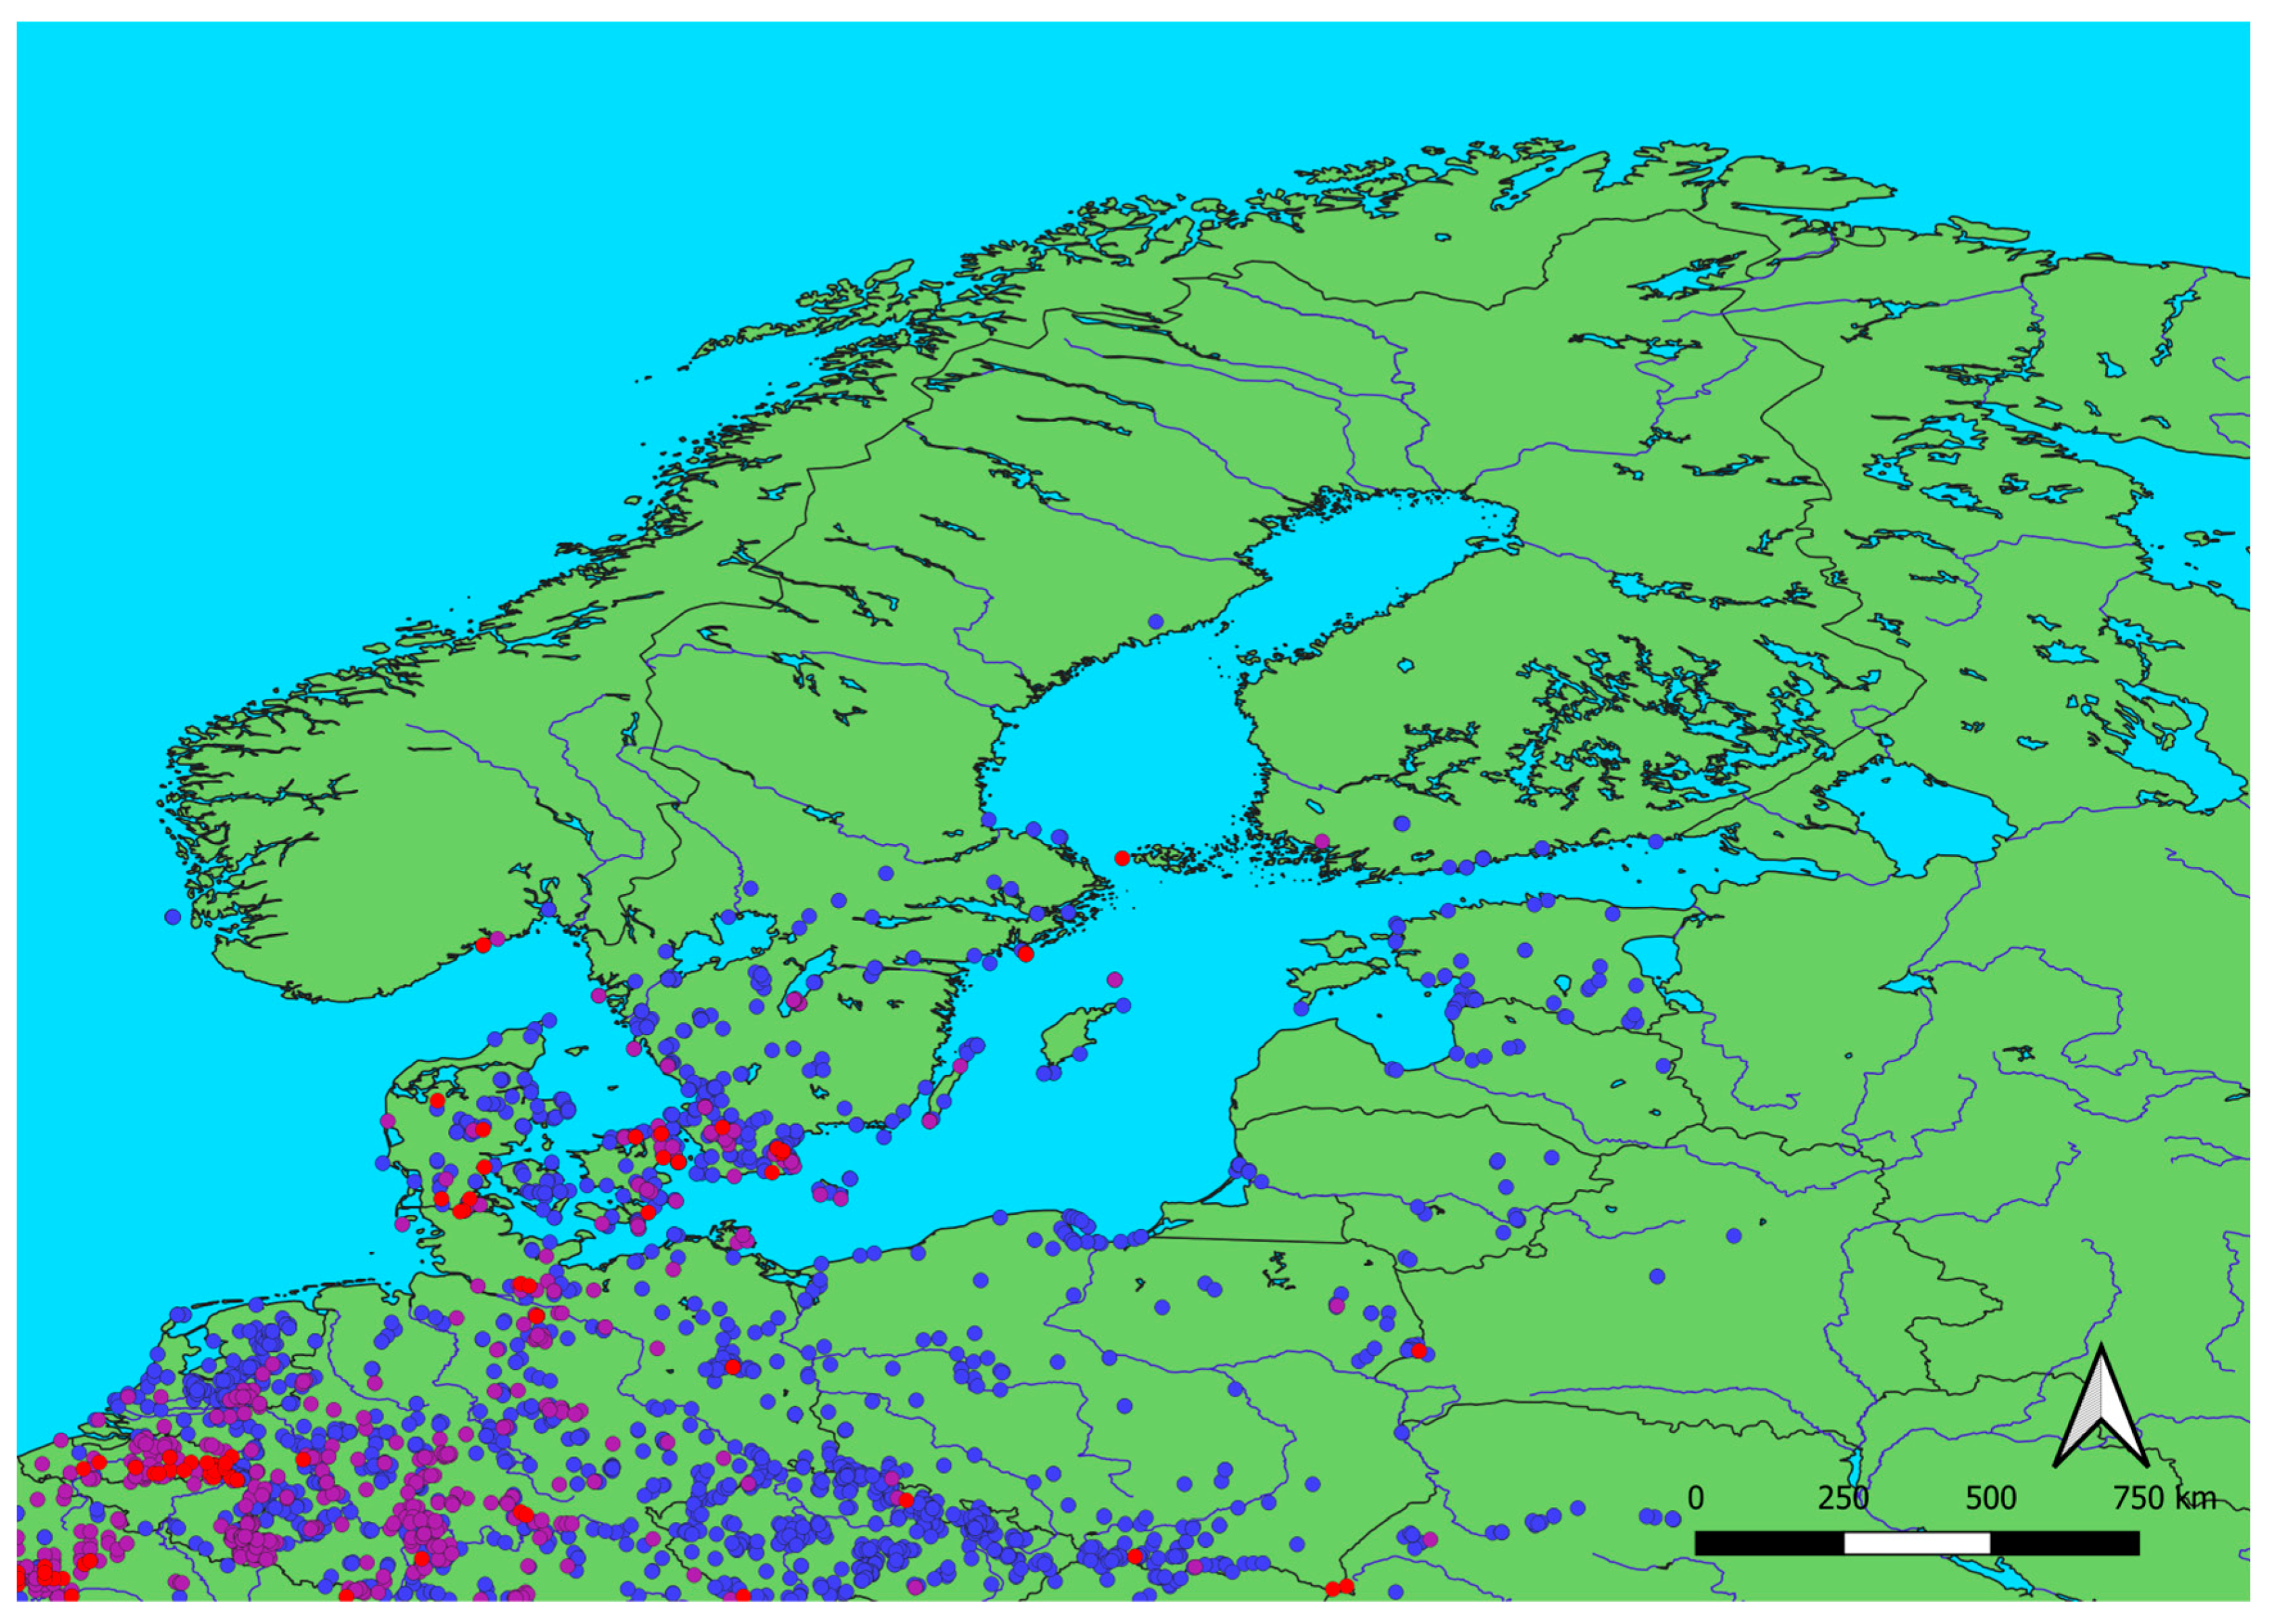
Figure 6.
Coefficients of partial correlation between climate variables and abundance indices for Goldcrest and Firecrest during 1982-2023, from the best multiple regression models. A) Relationships for migrating birds abundance index (MBAi) at Bukowo-Kopań (BK) and Mierzeja Wiślana (MW) during autumn migration in 1982–2023 (excluding 2010 and 2011); B) Relationships for the median date of autumn migration at these stations in 1982–2023; C) Relationships for the breeding population indices based on the Pan-European Common Bird Monitoring Scheme (PECBMS) in 1982–2022. Climate indices: NAO – North Atlantic Oscillation index, ETA – European Temperature Anomaly, ESC – Euroasian Snow Cover, abbreviations of months show the periods for which these indices were averaged. The details of the models and the model selection procedure by AICc are presented in Tables S21-S28.
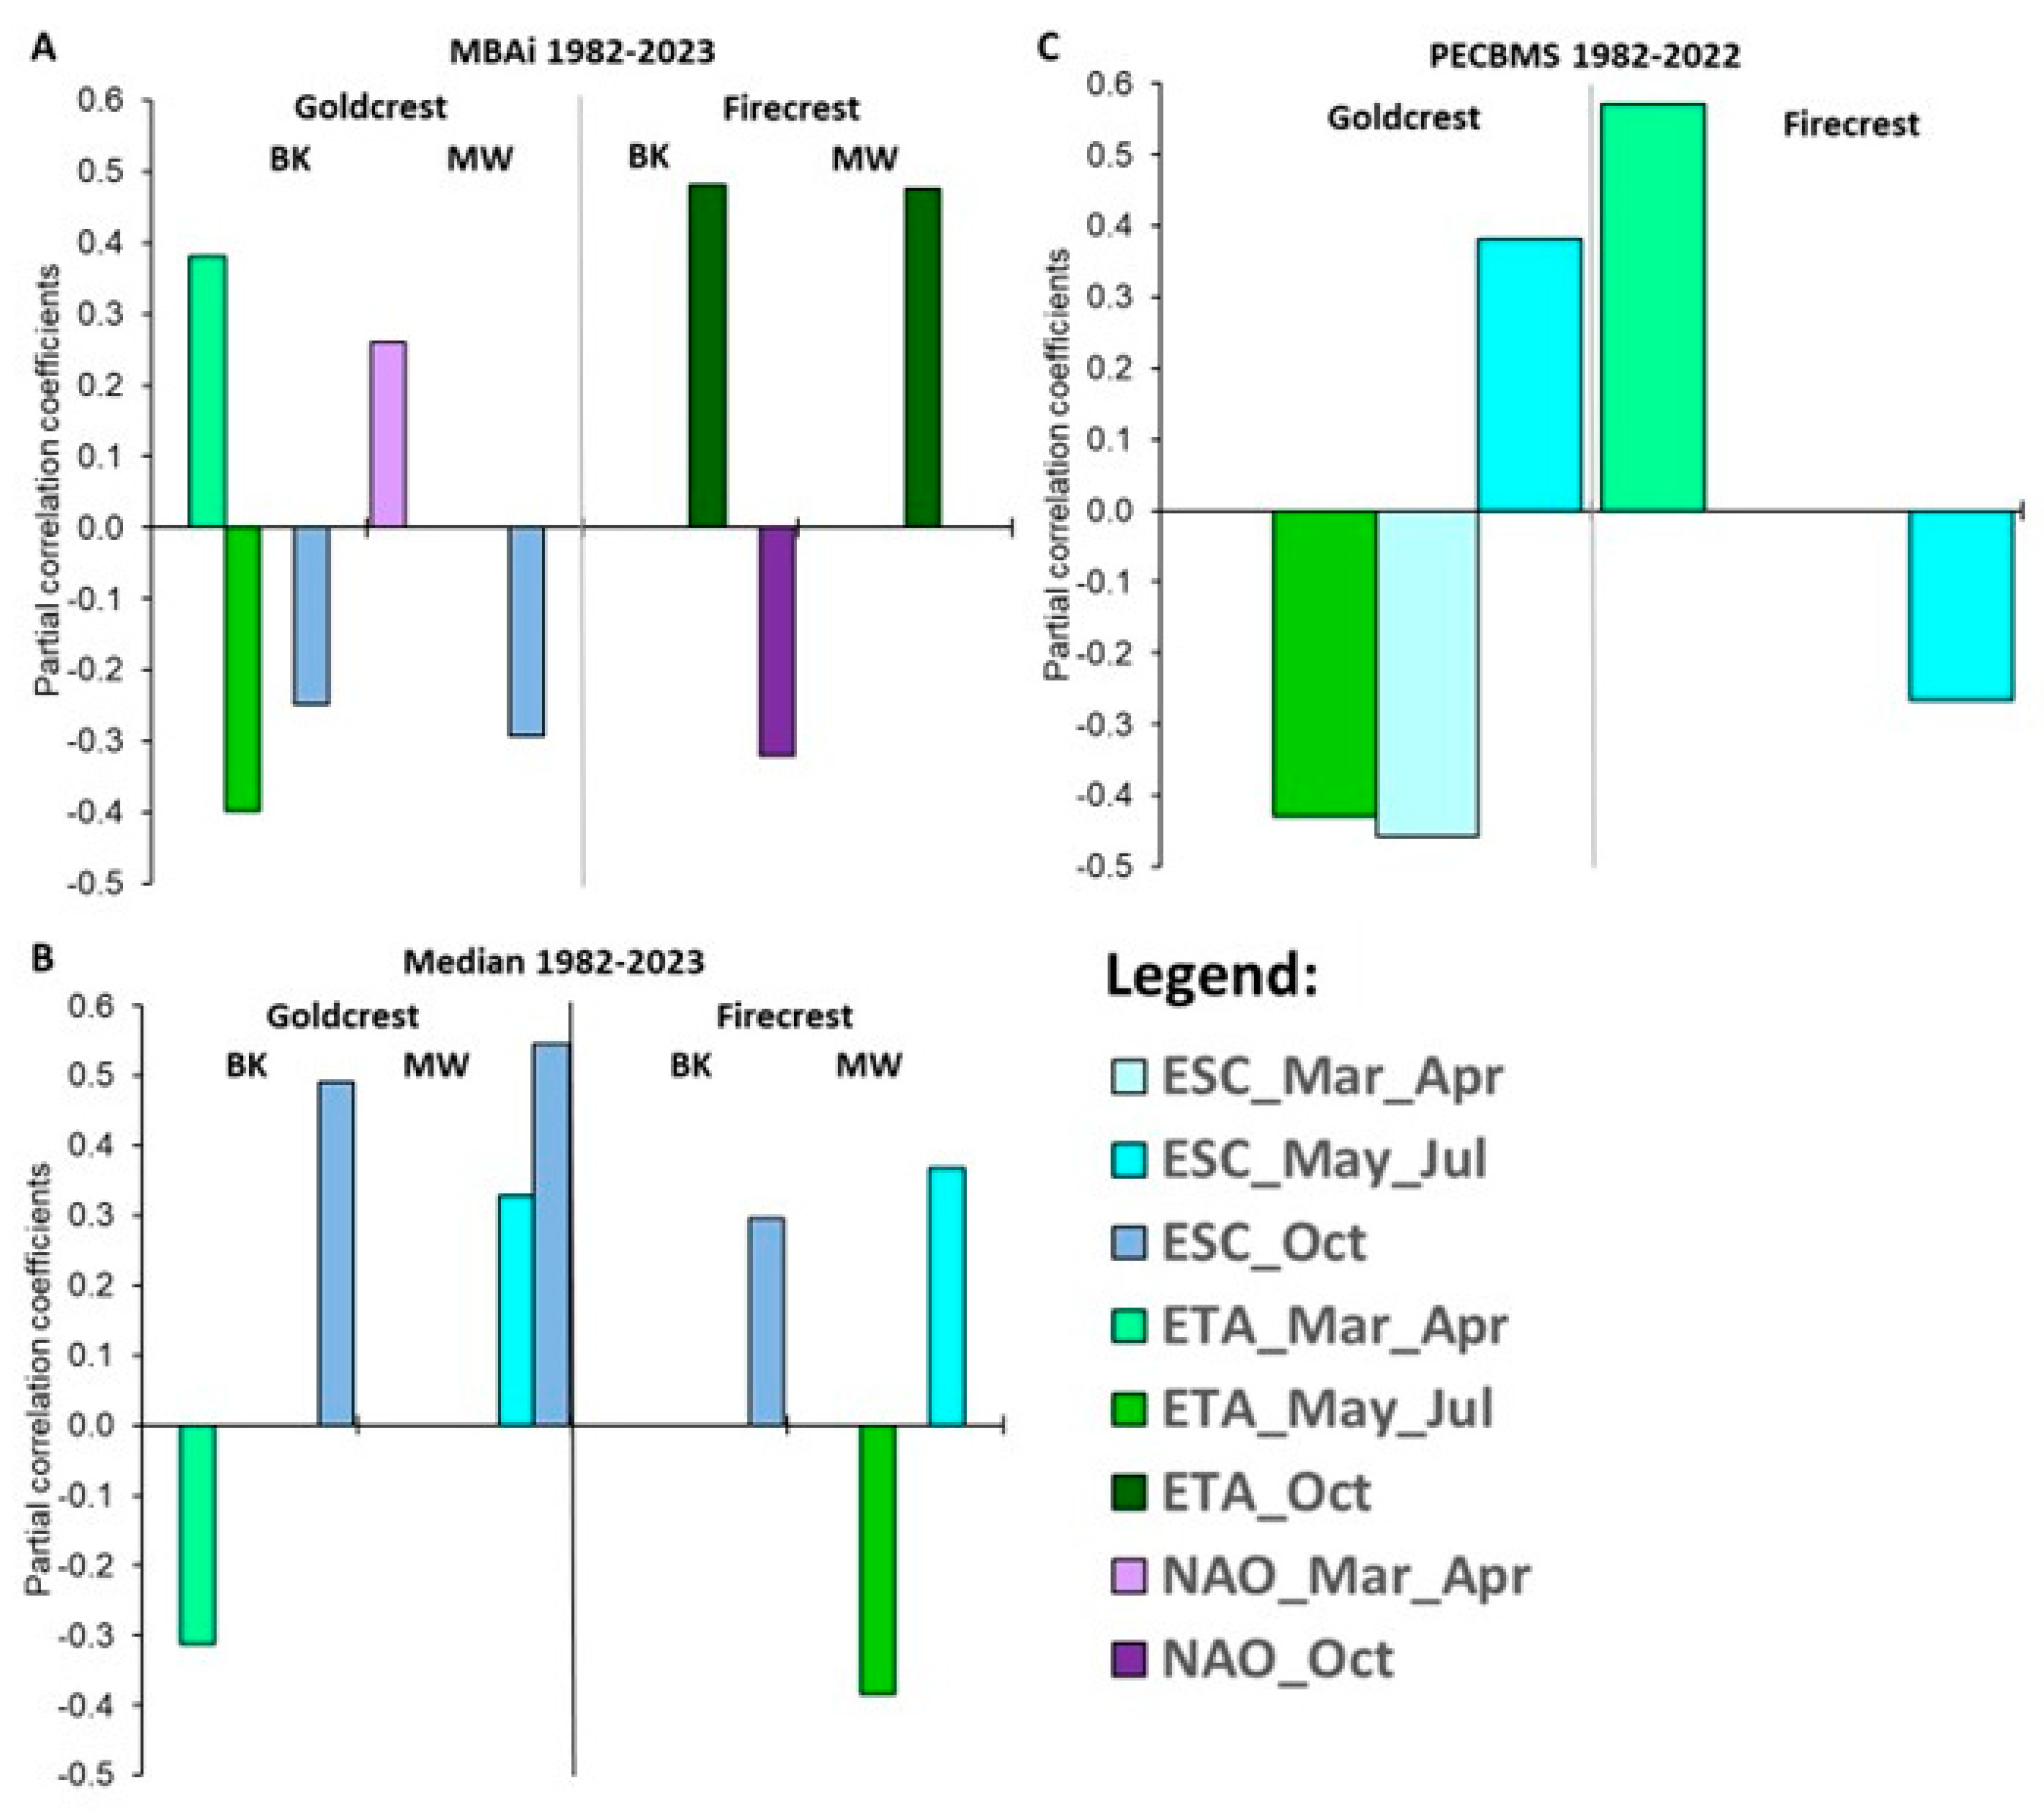
Figure 7.
Goldcrest and Firecrest Migrant Birds Abundance index (MBAi) and migration timing during autumn migration at two ringing stations at the southern Baltic coast (Bukowo-Kopań: BK, orange lines, and Mierzeja Wiślana: MW, gray lines), and the breeding bird population index based on the Pan-European Common Bird Monitoring Scheme (PECBMS, navy blue lines), against the Eurasian Snow Cover (ESC) in October (blue area) during 1982–2023. A) Goldcrest abundance during autumn migration at Bukowo-Kopań (BK MBAi) and Mierzeja Wiślana (MW_MBAi) and during breeding (PECMBS) against the October ESC, B) Firecrest abundance during autumn migration at Bukowo-Kopań (BK MBAi) and Mierzeja Wiślana (MW_MBAi) and during breeding (PECMBS) against the October ESC; C) Goldcrest median date of autumn migration at Bukowo-Kopań (BK) and Mierzeja Wiślana (MW) against the October ESC; D) Firecrest median date of autumn migration at Bukowo-Kopań (BK) and Mierzeja Wiślana (MW) against the October ESC. All abundance indices were calculated as a proportion of the index from 1982. ESC is expressed as the number of land squares covered with snow in at least 50% in October [37]. The source data and statistics are presented in (Table S14).
Disclaimer/Publisher’s Note: The statements, opinions and data contained in all publications are solely those of the individual author(s) and contributor(s) and not of MDPI and/or the editor(s). MDPI and/or the editor(s) disclaim responsibility for any injury to people or property resulting from any ideas, methods, instructions or products referred to in the content. |
© 2024 by the authors. Licensee MDPI, Basel, Switzerland. This article is an open access article distributed under the terms and conditions of the Creative Commons Attribution (CC BY) license (https://creativecommons.org/licenses/by/4.0/).
Copyright: This open access article is published under a Creative Commons CC BY 4.0 license, which permit the free download, distribution, and reuse, provided that the author and preprint are cited in any reuse.


