Submitted:
13 January 2026
Posted:
14 January 2026
You are already at the latest version
Abstract
Drag reduction forms a key area of focus in aerodynamics with a significant emphasis on delaying the laminar to turbulent transition of boundary layers over the wing of aircraft. There is enough evidence to suggest that achieving such transition delays is particularly challenging for backward swept wings with large leading edge sweep angles, which give rise to crossflow and attachment line instabilities, in addition to the Tollmien-Schlichting waves. The sustenance of extended laminar flow regions at high sweep angles has been demonstrated in recent studies, by designing airfoils with specially curated leading edge profiles, which generate pressure distributions that can suppress crossflow. Such airfoils are called Crossflow Attenuating Natural Laminar Flow (CATNLF) airfoils. However, the design of such airfoils is presently restricted to inverse methodologies due to the inability of the conventional geometry parameterization techniques in representing the specialized leading edge profiles of CATNLF airfoils. The aim of this study is to illustrate that a parametric representation of CATNLF airfoils can be realized using Bezier curves, thereby enabling their forward multi-point design using gradient-free Bayesian optimization. The developed design framework in terms of geometry parameterization and optimization formulation is able to deliver airfoils that can sustain natural laminar flow up to around 50% chord length on the upper surface, with a leading edge sweep angle greater than 27 degrees at a Mach number of 0.78 and a Reynolds number of 20 million within a range of lift coefficients Cl = 0.5 ± 0.1, making them a suitable design choice for a medium-range transport aircraft.
Keywords:
natural laminar flow
; crossflow attenuation
; CATNLF
; Bezier curves
; airfoil parameterization
; Bayesian optimization
1. Introduction
Drag reduction is a continuous pursuit which is necessary for realizing the ambitions of sustainable aviation, particularly with regards to the reduction of fuel consumption and carbon emissions. Improvements in wing design can offer great potential in realizing significant drag reductions at the aircraft level. While the emphasis from structural design perspective is to primarily reduce the induced drag by developing lighter wings that can accommodate higher aspect ratios, the aerodynamics discipline is majorly focused on reducing the viscous drag. It is estimated that laminarizing the upper and lower surfaces of the wing can reduce drag by 12-17% at the aircraft level [1].
Laminar-turbulent transition delay of boundary layers over the wing surfaces is a fundamental requirement for the reduction of viscous drag, which enhances the extent of laminar region that exerts lower skin friction and pressure drags. The underlying mechanism to achieve this transition delay is to suppress or prevent the relevant flow instability mechanisms from reaching a certain threshold. For transport aircraft in commercial aviation with backward swept wings, which operate predominantly in transonic flow regimes, the most relevant instability mechanisms are Tollmien-Schlichting (TS) waves, crossflow (CF) instabilities and attachment line transition. TS waves are triggered in presence of adverse pressure gradients. The non-alignment between the flow streamlines and the favourable pressure gradients over a swept wing gives rise to CF instabilities, predominantly near the leading edge. The attachment line transition, also referred to as leading-edge contamination, must also be considered on backward swept wings when the flow coming from the fuselage causes disturbances in the attachment line over the leading edge of the wing. More physical insights regarding these instability mechanisms can be gained from [2,3,4,5]. The inhibition of these instabilities can either be achieved through passive tailoring of the geometric profile shapes, which is termed as natural laminar flow (NLF), or actively with the aid of boundary layer suction at the leading edge, which is referred to as hybrid laminar flow control (HLFC). A comprehensive overview of the various engineering methodologies that enable transition delay was presented in [6]. NLF airfoils are conventionally considered to be suitable for low leading edge sweep angles (), assumably up to 20 degrees, while the use of boundary layer suction in HLFC airfoils can extend this limit over the sweep angles to some extent. The limitation on the sweep angle for maintaining a laminar boundary layer results in high wave drag in transonic regimes, which partially offsets the viscous drag reduction and significantly deters the overall drag savings achieved through transition delay. Moreover, the use of boundary layer suction to alleviate the limitations on the sweep angle introduces several challenges in terms of fabrication and maintenance of a complex suction system. In an ideal scenario, the real benefit of laminarization for sustainable aviation in the future can most easily be realized practically by developing NLF airfoils which can suitably work with sweep angles higher than or equal to those of the present day turbulent aircraft, which translates to degrees for mid-range aircraft as Airbus A320. The introduction of CATNLF airfoils, which is discussed in Section 2, is a highly promising step in this direction, even though it also comes with several challenges of its own. Conventionally, the design of CATNLF airfoils is limited to inverse design methodologies, which focus on matching prescribed pressure distributions, since none of the conventional airfoil parameterization techniques are capable of representing such airfoils. However, there are several advantages associated with optimization-based forward design methodologies, like the ability to minimize a relevant physical metric, which for aerodynamic design is most often the total drag, and the possibility to include multiple design points to maintain a robust performance in a given design range of values.
Keeping in mind the knowledge gaps highlighted above, the novel contributions of this article are listed as follows:
- A geometry parameterization methodology based on Bezier curves is presented, which is capable of capturing and representing the intricate geometric as well as aerodynamic characteristics of CATNLF airfoils for sustaining laminarity at degrees.
- The design of CATNLF airfoils using the forward design methodology is demonstrated for the first time, to the best of the knowledge of the authors. This is achieved by integrating the Bezier parameterization methodology with a gradient-free Bayesian optimization algorithm. Multi-point optimizations have been performed to robustly minimize the aerodynamic drag within a design range enveloping the cruise by .
Therefore, this article is structured as follows. First, a general description and working of CATNLF airfoils is presented, highlighting the underlying physical principles and the design challenges. Then, different parameterization methodologies are introduced and analyzed in the context of CATNLF airfoils, in terms of representing the geometric and aerodynamic characteristics of reference CATNLF airfoils of the Common Research Model, CRM-NLF[7]. Consequently, two design cases are presented that demonstrate the forward design of CATNLF airfoils with the aid of multi-point Bayesian optimization, minimizing the total drag for a range of design values.
2. CATNLF Airfoils
The concept of CATNLF airfoils for attaining natural laminar flow over the upper surface for large values was introduced in [8,9]. The idea behind the CATNLF design methodology, that a large nose acceleration followed by a plateau is required to suppress crossflow, is not new, and is standard in the use of swept wing design [10,11]. However, the CATNLF design method [9] systematically exploits its complete potential to a degree that NLF is still possible for Reynolds numbers and leading edge sweeps corresponding to long-range aircraft flow and configurations. The laminarization of the lower airfoil surfaces in these studies was ignored under the assumption of a Krueger flap for insect protection. The main idea behind this approach is to prescribe a pressure distribution that exhibits a rapid rise near the leading edge and maintains a mild favourable pressure gradient downstream to the greatest extent possible, which is qualitatively illustrated in Figure 1. The steep pressure rise damps out the CF instabilities and avoids transition near the leading edge, while the favourable pressure gradient downstream suppresses TS waves. It is important to note that the restriction on the pressure gradient for dampening the TS waves usually comes at an expense of an aggravated shock strength, leading to a significant wave drag penalty in laminar aerodynamic designs in comparison to well-designed turbulent airfoils and wings, which can accommodate mildly adverse pressure gradients which facilitate either a weakening or a complete elimination of shocks. This further motivates the need for achieving laminarity at large sweep angles in order to counteract such wave drag penalties for an efficient aerodynamic design. The computational design of CATNLF airfoils by prescribing such pressure distributions via the inverse design methodology was described in [12].
While having some merits in terms of high computational efficiency in comparison to a 3D optimization, the inverse design methods in aerodynamics present several challenges. First, the fundamental design philosophy of the inverse methods is to find an airfoil profile that matches a target pressure distribution, with desirable characteristics. Such characteristics in the domain of laminar airfoil design prescribe limitations in the pressure gradients based on the knowledge regarding their impact on triggering different flow instability mechanisms. Coming up with such knowledge-based pressure distributions is often not very straightforward and can introduce several complications for certain flow conditions, where the target pressure distributions may be ill-posed, or the inverse solutions may be non-existent or hindered by other numerical complexities. Even after overcoming these challenges, it may be hard to justify whether the prescribed pressure distribution really adheres to the minimum overall drag requirement, which is the end goal in aerodynamic design.
The forward design methodology, on the other hand is driven by framing an aerodynamic design problem as an optimization problem with the goal of minimizing the drag as a function of design variables, which directly minimizes the fuel consumption and carbon emissions and represents the actual goal of aerodynamic design. Eventhough proving the global optimality of an optimized design is practically impossible, particularly in a non-convex design space, the forward design framework is still relatively straightforward to implement by circumventing the intricacies of the knowledge-based mathematical formulations. One key requirement for using the forward design framework in aerodynamics is to define a parametric representation of the target geometry in order to formulate the design vector. This is a major shortcoming for CATNLF design, as the conventional bump function based airfoil parameterization techniques like Class Shape Transformation (CST)[13] or Hicks-Henne[14] cannot be used for CATNLF airfoils, particularly due to the design requirements for a specialized leading edge shape for crossflow attenuation. The shortcomings of using such parametric formulations, particularly in the context of designing CATNLF airfoils, are illustrated and discussed in Section 3.
3. Bump Function Based Parameterization
The underlying philosophy of this class of parameterization is based on deforming a base shape with the help of some bump functions, which can be scaled to parametrically align the base shape to an intended airfoil shape with minimal mean squared error. The scalar weights which define the extent of this scaling together constitute the design vector, and the number of bump functions used per airfoil surface decides the number of weights and consequently the number of design variables. The CST bump functions are based on Bernstein basis polynomial, where bump functions are defined for a chosen degree n. The CST bump function is defined as in equation 1.
It is important to note here that the sum of all Bernstein basis polynomials defined for a given n result to . Therefore the sum of Bernstein basis polynomials remains as 1 throughout the parametric space defined by t. However, when each of the individual polynomials are scaled by some weight, the resultant summation can deviate from 1, giving rise to a deformed shape function. When this shape function is multiplied to the base shape or the class function, the resultant profile is the one where the original class function inherits the characteristic deviations of the shape function. The bump functions for CST with are shown in Figure 2. The working of the CST parameterization is illustrated in Figure 3.
CST is one of the most widely used parameterization techniques in aeronautics, owing to the various favourable characteristics it exhibits in terms of offering smoothness and capability for local control in a narrow vicinity of the parameter t, which represents the normalized chord in the airfoil geometry, using a single bump function. However, the CST framework is unsuitable for CATNLF airfoils as they require much finer control over the leading edge geometry in order to fulfill the pressure distribution requirements as illustrated in Figure 1. The CST formulation does not offer the possibility to refine the controllability of a certain relative chord location of an airfoil, in this context near the leading edge at , as the Bernstein basis polynomials cannot be further refined in t.
Hicks-Henne bump functions form another important class of bump functions which offer significantly more design freedom than Bernstein polynomials. These are sinusoidal functions whose widths and locations can be modified with the help of the underlying hyperparameters and , respectively.
By finetuning these hyperparameters, these bump functions can be altered in the chord-wise direction to offer better control of the leading edge profile, as shown in Figure 4 for the number of bumps . The bumps are spaced from the leading edge to the trailing edge following a hyperbolic tangent distribution for the , making them more concentrated near the leading edge. The widths of the bump functions, which govern their extent of influence, are distributed according to , ensuring a sharper leading edge control. The representation quality of the CRM-NLF airfoils was analyzed in terms of the quality of geometric reconstruction of the leading edges as well as the resulting flow instabilities, particularly in terms of crossflow attenuation, which are presented here in detail.
Having the bump functions defined with their properties highlighted as above, the most crucial decision governing the quality of Hicks-Henne parameterization is the choice of the base shape, which is generally an airfoil shape. Several transonic airfoils from the literature, like the RAE 2822 and the DLR F-15 failed to provide an acceptable level of leading edge reconstruction on any CRM-NLF airfoil, even when using up to 80 design variables. Another attempt was made to utilize a CRM-NLF airfoil itself by using section I as the base shape, for parameterizing the other remaining airfoils of sections B through H. The results presented here have been derived using 40 design variables representing the upper and lower surfaces with 20 bump functions each. The reconstructions of the leading edges can be inferred from Figure 5. It can be observed visually that the Hicks-Henne leading edge masks the underlying reference shape very well for section E, and the reconstruction quality for section D is relatively poor, where the underlying reference airfoil in black is visibly not completely aligned with the reconstructed red curve by Hicks-Henne. Although a more concrete measure of quantifying the quality of fit could be a metric like the mean squared error, it is not possible to evaluate it in this scenario as the coordinates of the reference airfoil and the parametric representation are different. Therefore, an alternative approach has been taken here by comparing the flow instability curves as shown in Figure 6, which are very sensitive to the geometric profile, given the flow conditions. The results here are evaluated for , and , based on the CRM-NLF configuration.
It can be observed from Figure 6 that the instability curves based on the Hicks-Henne profile exhibit significant deviation from the reference curves, despite using 40 design variables, which is much larger than the typical number of 10-20 parameters used for airfoil design in literature. This warrants a need for developing a more suitable airfoil geometry parameterization technique which can represent the leading edge profiles for CATNLF airfoils with reasonable dimensional efficiency. This has been achieved with the use of Bezier curves in this study, which is explained in Section 4.
4. Bezier Parameterization
A Bezier curve [15] of degree n is defined by a control polygon of control points , as defined in equation 3, which also uses the Bernstein polynomials as given in equation 1.
Each control point is a vector containing the coordinate information for itself. Two Bezier curves can also be joined by prescribing certain relationships between the adjoining control points. For example, a geometric continuity can be established between two Bezier curves by ensuring that the adjoining control points are collinear. Figure 7 illustrates an isolated and joined cubic Bezier curve.
Owing to the desirable properties in terms of smoothness, controllability and the ability to construct complex geometries by joining simpler curves, Bezier curves have been used for representing CATNLF airfoil geometries in this work. An airfoil profile is constructed using four quartic (degree ) curves joined via continuity at the leading edge and at at the upper and lower surfaces. The trailing edge is closed with continuity. The control points can serve as the design vector for representing a CATNLF airfoil for an optimization problem with only 20 design variables.
The biggest advantage of using Bezier curves for a parametric representation of CATNLF airfoils in this case is that there are no additional hyperparameters, in terms of choosing a base shape or manipulating the bump functions, which need to be adjusted for CATNLF airfoils. Each control point, unless constrained by continuity, is free to move in the two dimensional space to provide the best alignment with the target geometry. The use of this parameterization technique with an optimizer for the forward design of CATNLF airfoils would also ensure better design freedom in terms of exploring the airfoil geometric design space more freely as compared to the bump function based methodologies, which come with several design restrictions as highlighted previously.
The reconstruction of CRM-NLF Section C airfoil using Bezier curves is illustrated in Figure 8. The leading edge profiles are captured really well as seen in Figure 9, which is also evident from the almost perfect agreement of the flow instability curves of Figure 10, based on the reference CRM-NLF airfoils and their Bezier representations. A comparison of all three, that is Bezier, Hicks- Henne and the reference geometries is given in Figure 11, where it can be further observed that the 20 dimensional Bezier parameterization in red is able to mask the underlying reference airfoil in black almost identically, while the Hicks-Henne formulation is unable to eliminate all the deviations even with a 40 dimensional representation.
5. Forward Design of CATNLF Airfoils
5.1. Blackbox Solver: conFLOW
conFLOW is the black-box solver used for aerodynamic analysis, the concept of which was introduced in [16]. It is based on the conical flow or 2.75D flow assumption[17]. The conical flow approximation accounts for the effects of wing sweep and taper while ignoring the span-wise geometric and flow gradients, and wing-tip vorticity, since these effects are generally not very severe for high-aspect ratio wings. The wing-body juncture flow interactions, which are also ignored with the conical flow assumption, originate from a local flow distortion that depends on the wing planform, freestream Mach number, and the relative position of wing and fuselage. This paper chooses a mid-fidelity flow model for developing a suitable design of CATNLF airfoils, because that allows to include the critical flow phenomena at the leading edge of a swept wing, that lead to crossflow induced transition, if the flow acceleration taking place downstream from the stagnation line is not properly controlled by the geometry parameters.
It is important to highlight here that the juncture flow at the root presents a number of local flow characteristics at the inner portion of the wing, which cannot be taken into account by the conical flow assumption. Such effects primarily comprise the generation of strong pressure gradients and additional supervelocities near the juncture, creating stronger shocks and consequently increasing the wave drag of the inner wing. Furthermore, the boundary layer of the fuselage meets the leading edge of the wing part with the largest chord section along the span, risking leading edge contamination with turbulence from the fuselage, thereby forcing direct break-down to turbulence if the local momentum thickness is above a certain level, for which re-laminarization can be expected. This contamination can be avoided by employing specific aerodynamic devices, like Gaster bumps, close to the root, which generate locally very thin leading-edge boundary layers by guiding away the incoming turbulent stagnation-line boundary layer [18]. In summary, the non-conical flow of the inner wing, which is beyond the scope of this study, can be analyzed and overcome by the application of design methodologies [19] with higher fidelity, which take account of the 3D flow character and modify both the inner wing geometry as well as the belly fairing in the juncture region. In addition, it has to be avoided that the fuselage turbulent flow propagates along the wing leading edge. In conjunction with the conical flow, the method from incompressible linear stability theory [20] is used for transition prediction, taking into account CF and TS waves. Attachment line transition is modelled using the criterion[16]1. The validation data for conFLOW can be inferred from [21].
5.2. Bayesian Optimization
Bayesian optimization is a gradient-free optimization methodology with proven computational efficiency[22]. It works on the principle of iterative improvement of a probabilistic surrogate model over a given dataset of design vectors and objective functions. The design candidates for a given iteration are selected based on the maximization of an acquisition function, based on the surrogate model. The acquisition function used in this case was Thompson sampling. The detailed application of Bayesian optimization for aerodynamic design of airfoils and wings can be inferred from [21], as the same optimization framework has been used in this work
The mathematical description of the forward design framework for CATNLF airfoils posed as a Bayesian optimization problem in the Bezier parametric design space is given in Table 1. The reference mid-range wing planform used in this study comprised a root chord length m, tip chord length m, root span location m and tip span m. The design section is located at m, translating to a normalized span location . The flow conditions were assumed as and Million. In addition to designing the airfoil profile, the leading edge sweep angle is also treated as a design variable in this work, enabling us to observe the maximum sweep angle over which laminarity can be sustained while minimizing the overall drag. The minimization of wave drag pushes to higher values and the suppression of CF and attachment line transition would impose limitations on the sweep angle, making this a valid optimization variable.
6. Results
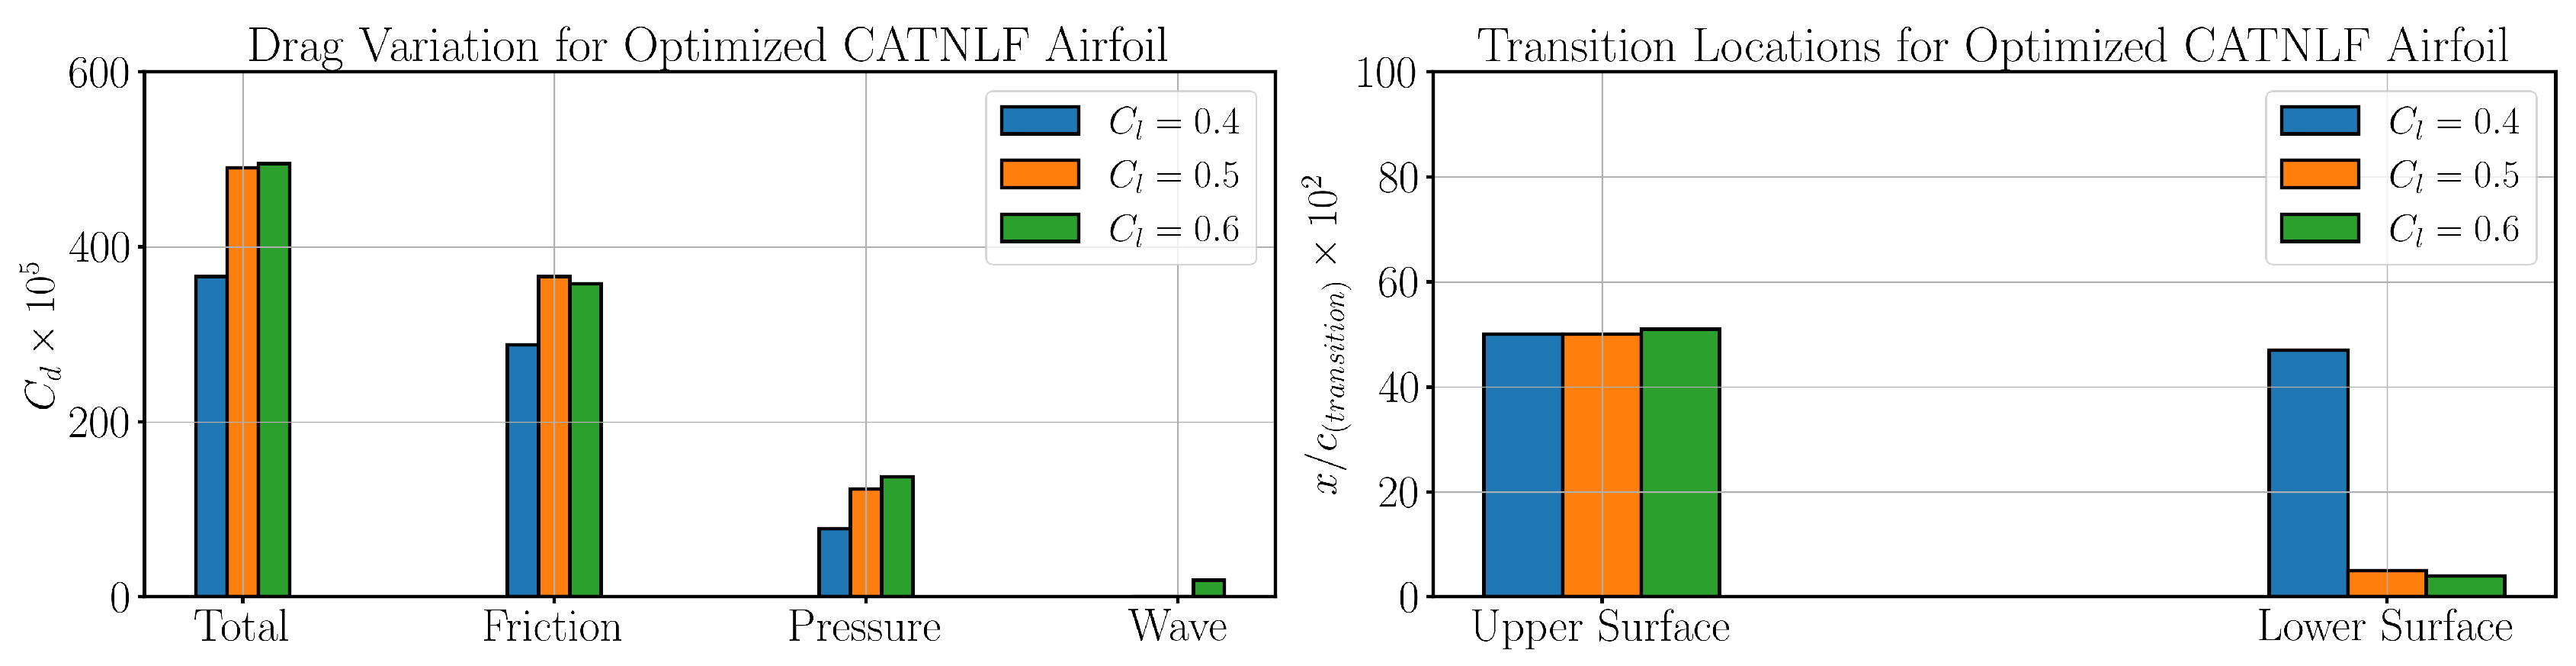
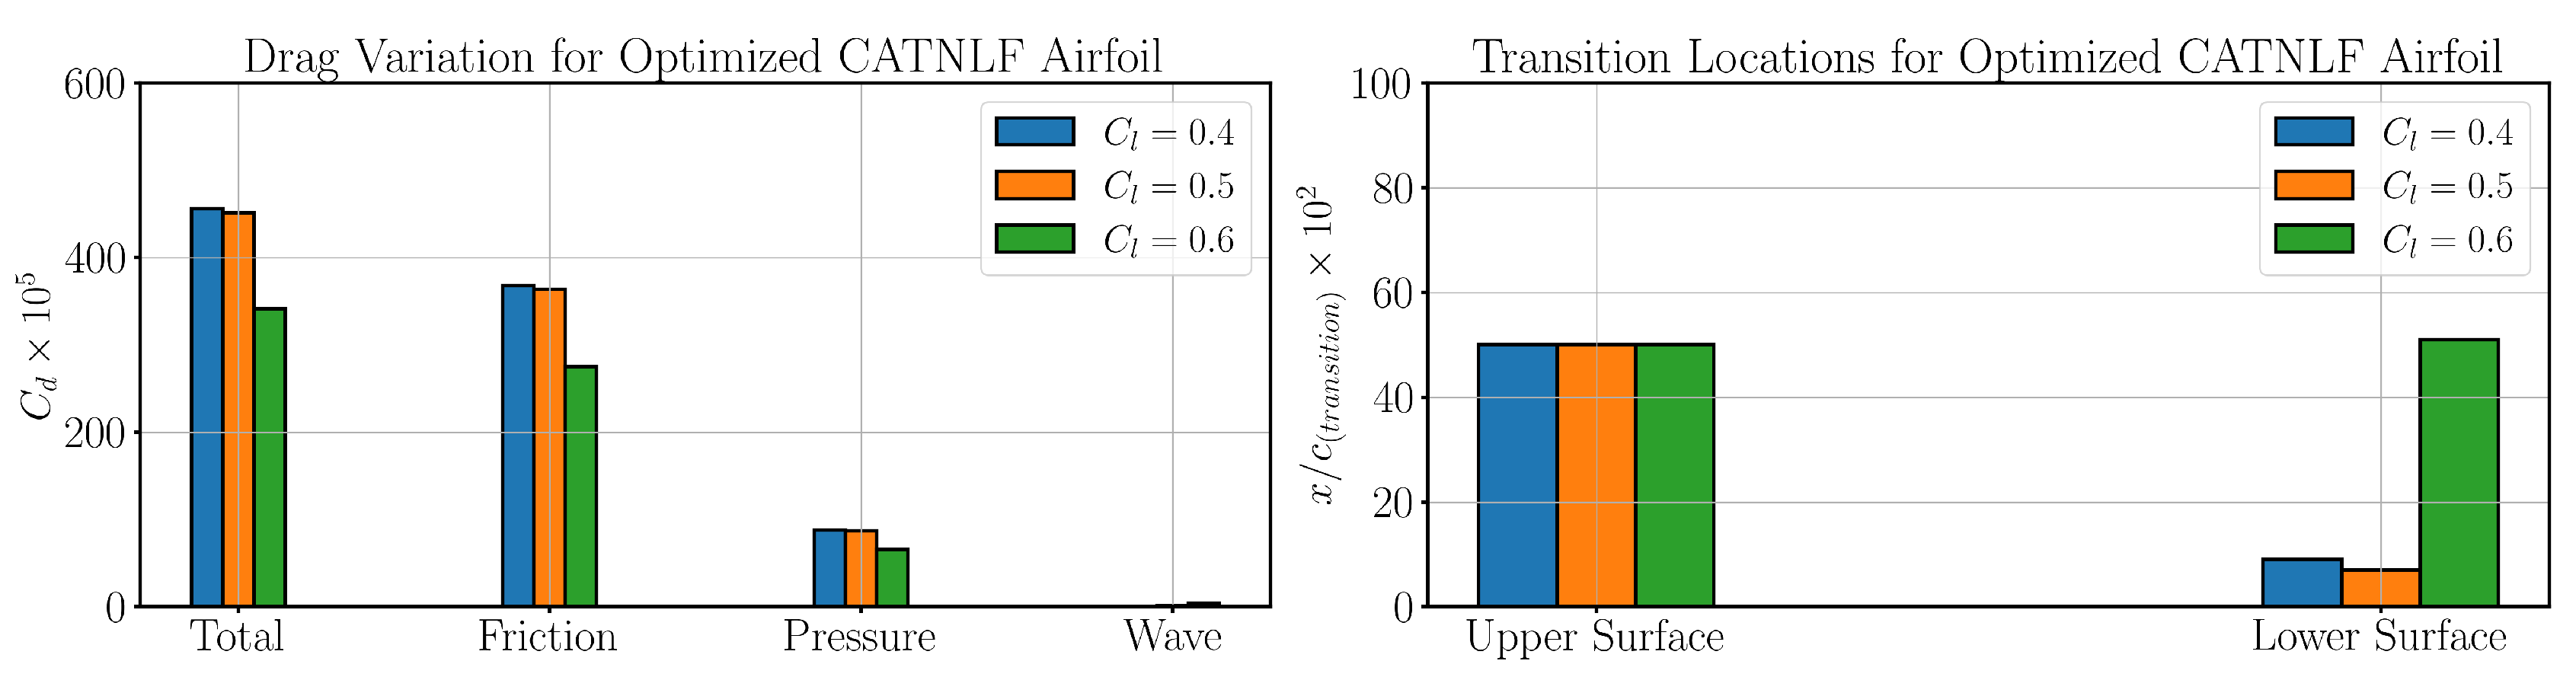
The results of the numerical experiments performed in this work for demonstrating the forward multi-point design of CATNLF airfoils are presented in this section. One of the key governing factors in laminar design is determining the critical N factor for TS and CF waves, which is dependent on the flow conditions and the turbulence intensity of the freestream. Two scenarios have been analyzed in this study with different N factors taken from different references in order to analyze their influence on limiting the sweep angle. The critical N factors of TS = 11.5 and CF = 7 have been taken from [23], while the values TS = CF = 10 are inspired from [12], in order to study if the optimizer is able to utilize the alleviated CF restriction for extending the sweep angle limitations. While the objective in the original design of CATNLF airfoils was to laminarize only the upper surface, the lower surface was also left free for laminarization in this study, without imposing any leading edge transition artificially, thereby giving the maximum design freedom to the optimizer. A database of 500 airfoils was generated for the initial design of experiments (DOE) in Bayesian optimization based on perturbations of the CRM-NLF airfoils and some NLF airfoils from literature. For both the design cases, it is evident from the N factor envelopes in Figure 14 and Figure 19, that the respective values are not exceeded in any of the cases for the upper surface, and the transition in all these cases was caused either due to the presence of a shock or a laminar separation bubble, approximately at . On the other hand, the optimizer was not able to robustly laminarize the lower surface by limiting the instability curves below their critical limits for all the design points in any of the two cases, as evident from Figure 15 and Figure 20. The transition locations and the resulting drag variations can also be inferred from Figure 16 and Figure 21. Although a detailed investigation into deciphering the reason behind this lack of laminarization of the lower surface is deemed beyond the scope of this article, at a preliminary level this can be attributed to the choice of airfoils in the initial DOE, where all the CRM-NLF airfoils were originally designed solely for upper surface laminarity and the other NLF airfoils in the literature were designed for lower sweep angles.
6.1. Case 1: TS = 11.5 and CF = 7
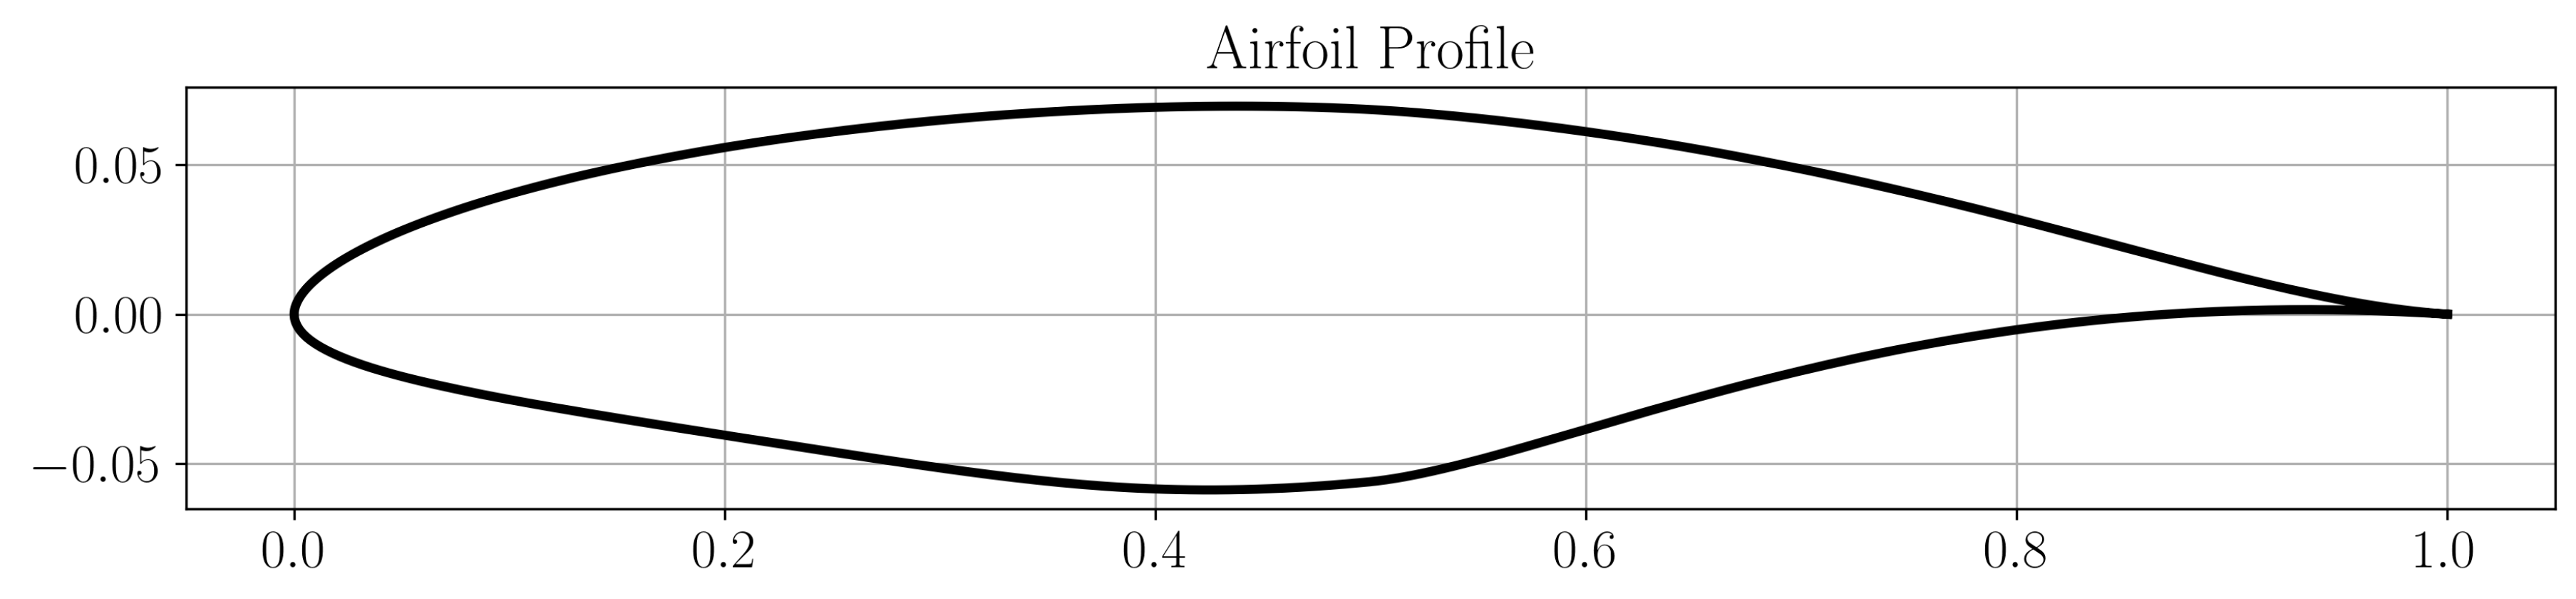
The optimized deg was achieved with an averaged drag and the upper surface transition at all values. The resulting airfoil profile for this case is illustrated in Figure 12.
The optimized pressure distributions are given in Figure 13, where it can be observed that the general expected trends in terms of the pressure gradients have been deciphered really well by the optimizer, simply from a blackbox solver relating the input design vector to the resulting total drag output. The highly loaded case is particularly interesting to observe in this case. Owing to the large underlying area needed under the curve for fulfilling the lifting requirements, this case results in a significantly stronger shock at the upper surface, which also results in a significantly higher wave drag as shown in Figure 16, compared to the lower cases. However, the optimizer very cleverly tries to minimize this shock strength by not simply following the favourable pressure gradient trend throughout the flow regime. Near the leading edge, the pressure distribution exhibits an adverse pressure gradient. This benefits the aerodynamic characteristics in two ways. First, it aids in the crossflow attenuation near the leading edge of the airfoil as evident from the instability curves in Figure 14. This results in an amplification of the TS waves up to . The pressure distribution is then reoriented to follow a favourable pressure gradient in order to suppress these TS waves from further amplifying and maintaining them just below their critical threshold till the transition is inevitable due to the presence of shock. This clearly demonstrates the utility of the forward design methodology in providing aerodynamic design solutions which can maintain robustness at different design points by cleverly utilizing the design freedom to the maximum extent possible while maintaining the core focus on total drag reduction by tailoring the flow characteristics to suit the reduction of different drag components in a balanced manner. Such solutions can be hard or challenging to come up with using inverse design methods.
Figure 13.
Pressure distribution curves for different and angles of attack for case 1: and (left), and (middle), and (right).
Figure 13.
Pressure distribution curves for different and angles of attack for case 1: and (left), and (middle), and (right).
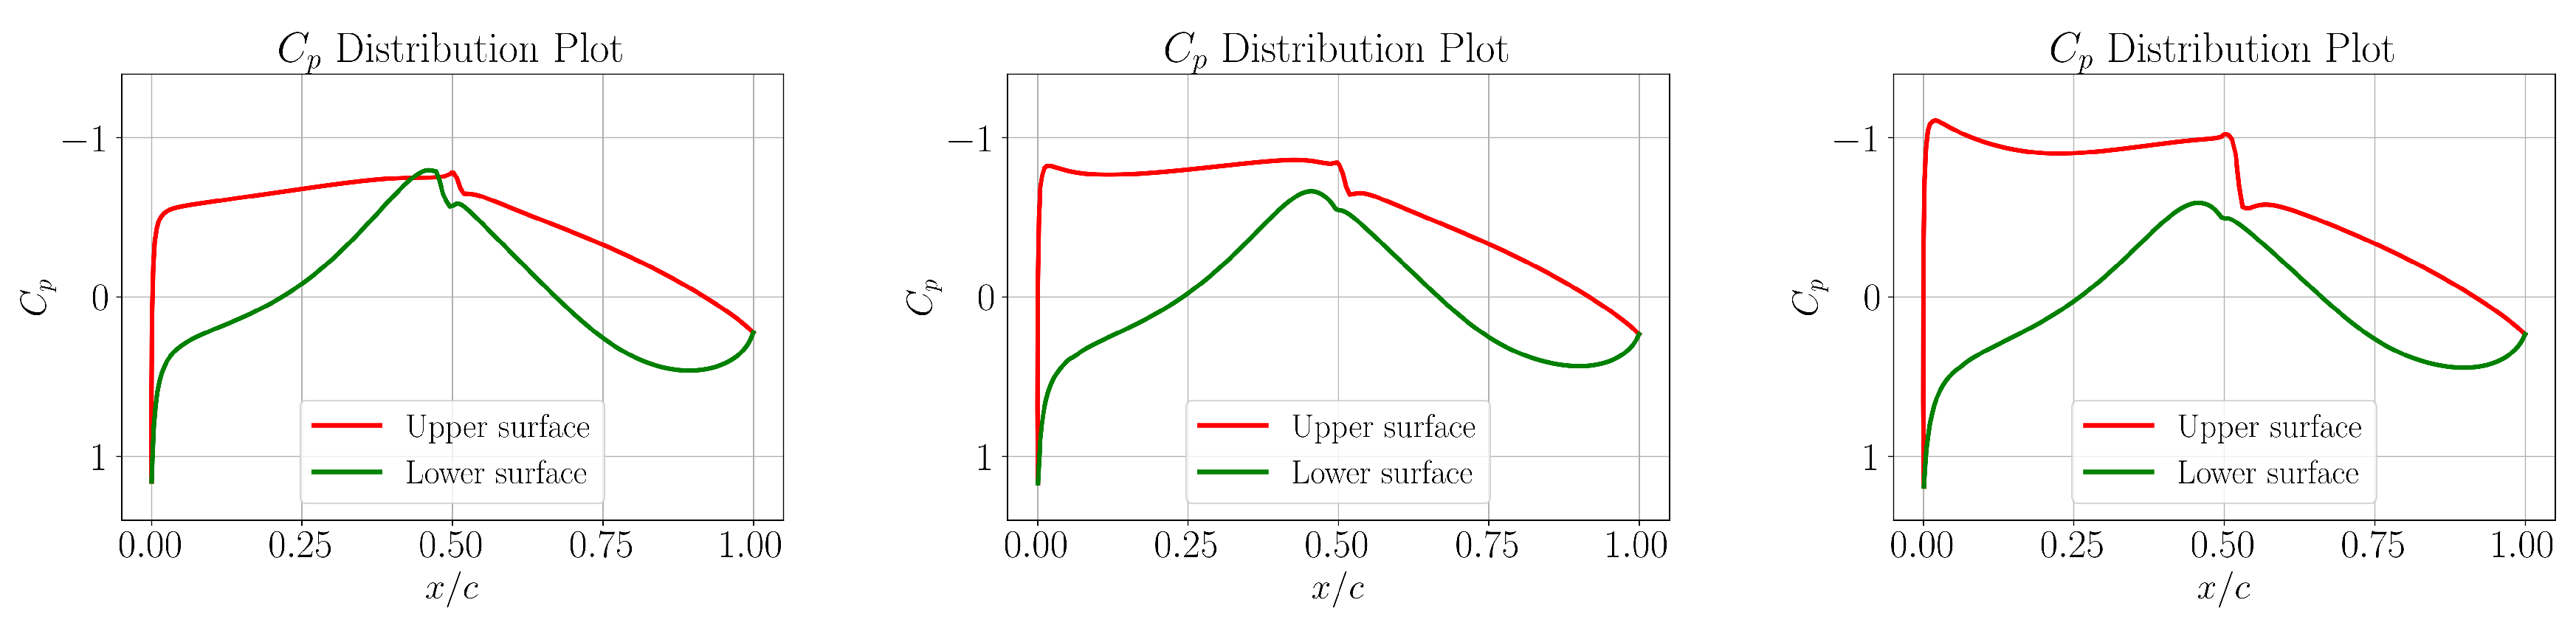
Figure 14.
Upper surface N factor envelopes with dominant instability mechanisms for case 1: (left), (middle) and (right).
Figure 14.
Upper surface N factor envelopes with dominant instability mechanisms for case 1: (left), (middle) and (right).
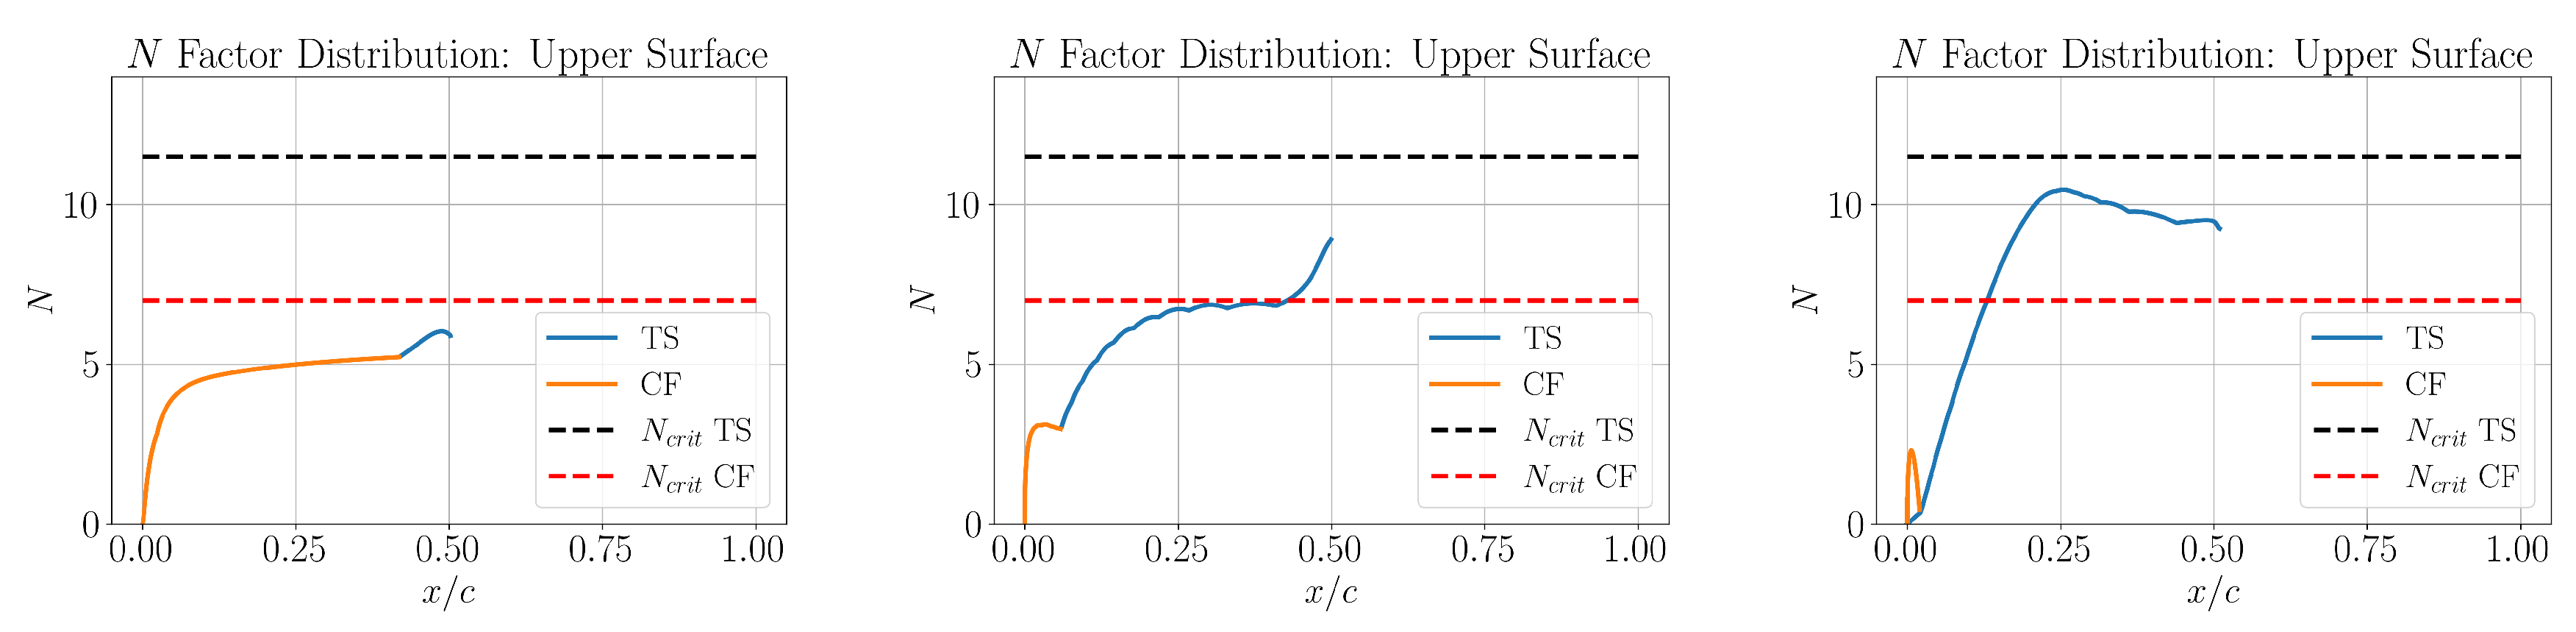
Figure 15.
Lower surface N factor envelopes with dominant instability mechanisms for case 1: (left), (middle) and (right).
Figure 15.
Lower surface N factor envelopes with dominant instability mechanisms for case 1: (left), (middle) and (right).
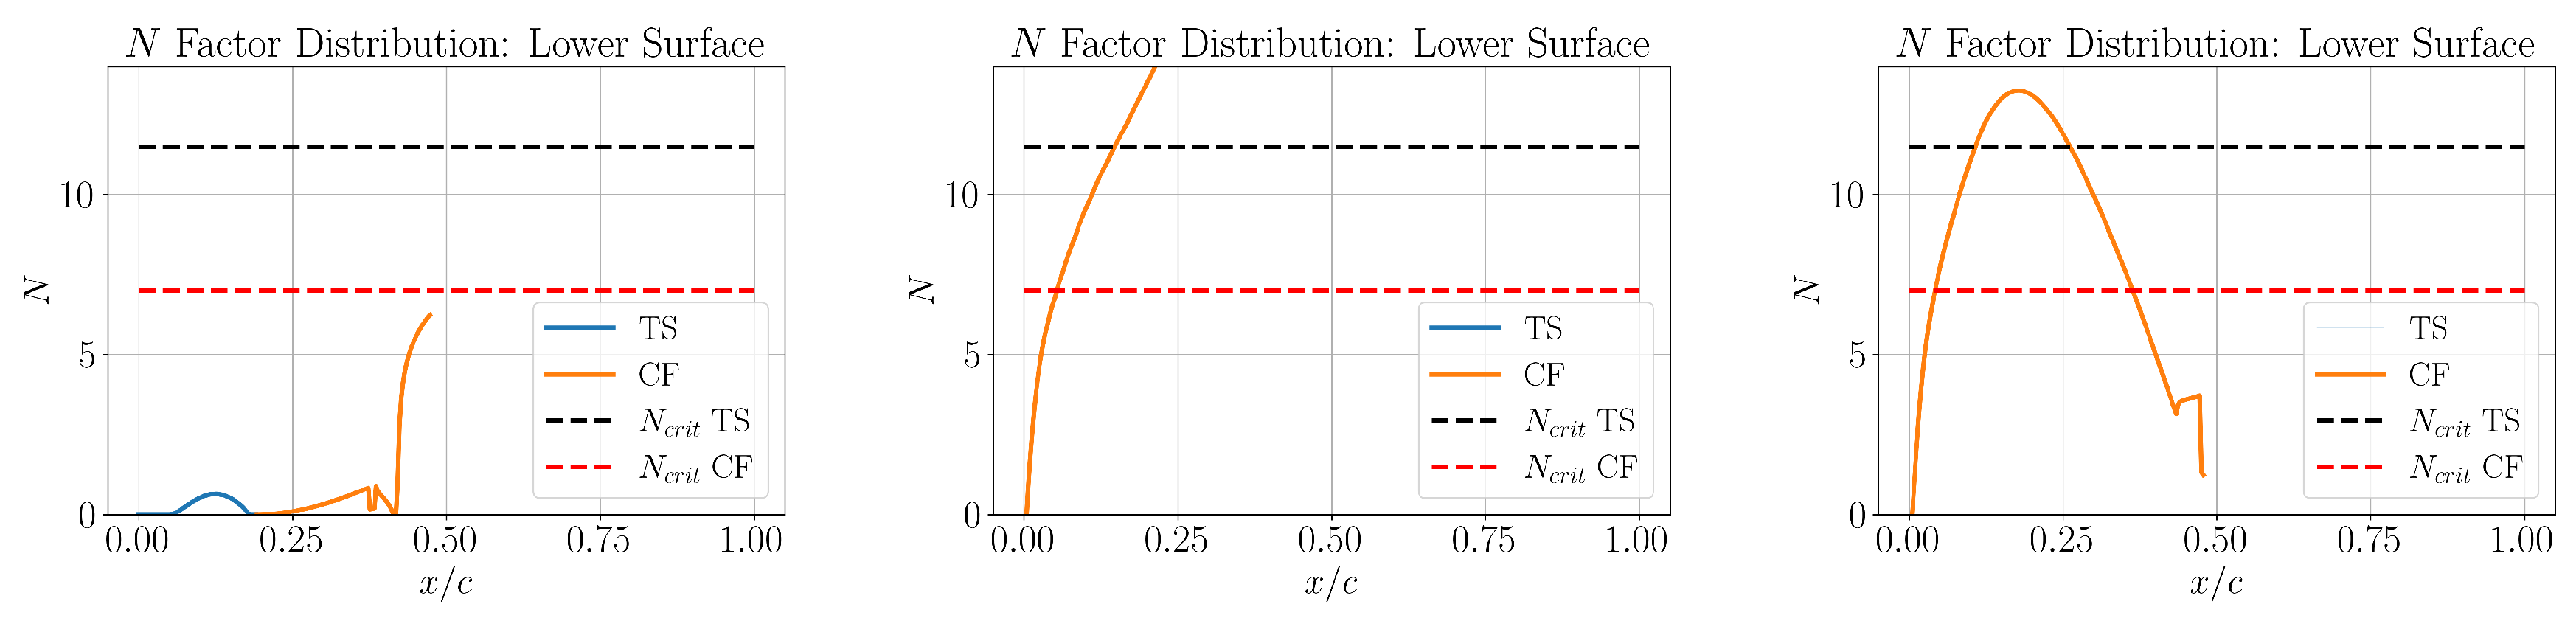
Figure 16.
Aerodynamic characteristics of resultant airfoil within the design range for case 1: Drag variation (left) and Transition locations (right).
Figure 16.
Aerodynamic characteristics of resultant airfoil within the design range for case 1: Drag variation (left) and Transition locations (right).
6.2. Case 2: TS = CF = 10
Owing to an alleviated threshold on CF, a higher deg was achieved in this case with an averaged drag while retaining the upper surface transition at all values. The resulting airfoil profile for this case is illustrated in Figure 12.
Figure 17.
Resultant optimized CATNLF airfoil profile for case 2.
It is evident here that the optimizer has smartly utilized the additional design freedom coming from an elevated CF threshold by going for a higher sweep angle design. This aids in practically eliminating the wave drag to a negligible level as illustrated in Figure 21, including at the design point, which was not possible in case 1. It can be observed from the pressure distributions in Figure 18 that the resulting shock strengths are very low and therefore simply the conventional trend in terms of following a favourable pressure gradient has been adopted by the optimizer at all the design points.
Figure 18.
Pressure distribution curves for different and angles of attack for case 2: and (left), and (middle), and (right).
Figure 18.
Pressure distribution curves for different and angles of attack for case 2: and (left), and (middle), and (right).
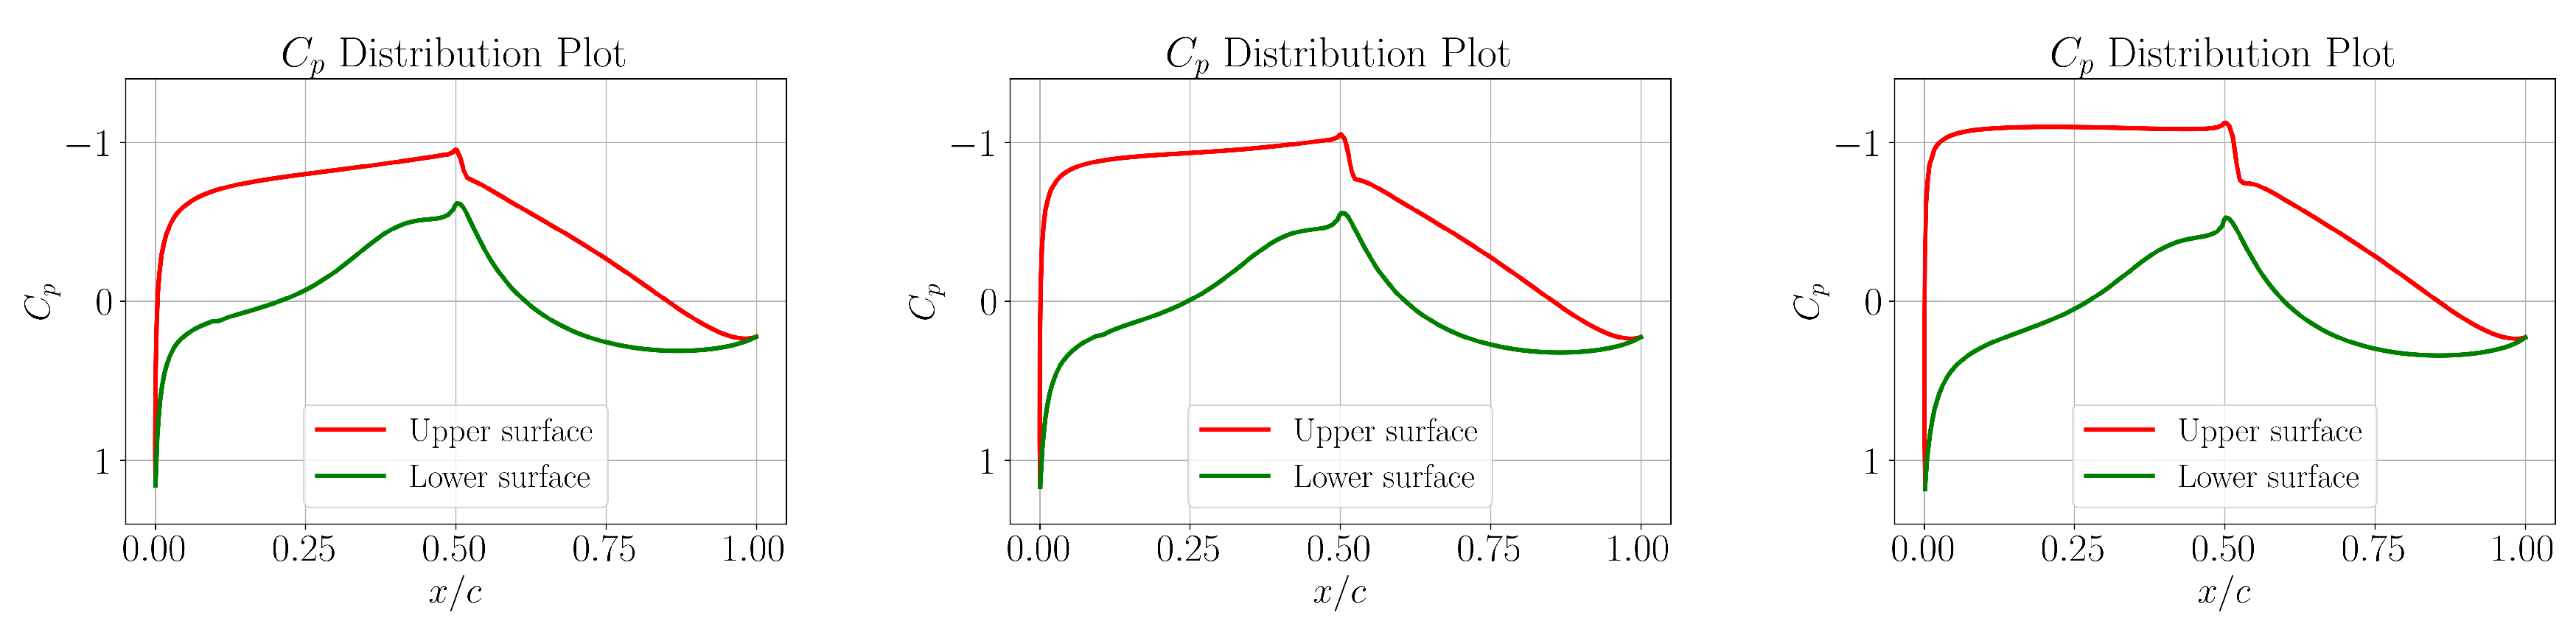
Figure 19.
Upper surface N factor envelopes with dominant instability mechanisms for case 2: (left), (middle) and (right).
Figure 19.
Upper surface N factor envelopes with dominant instability mechanisms for case 2: (left), (middle) and (right).
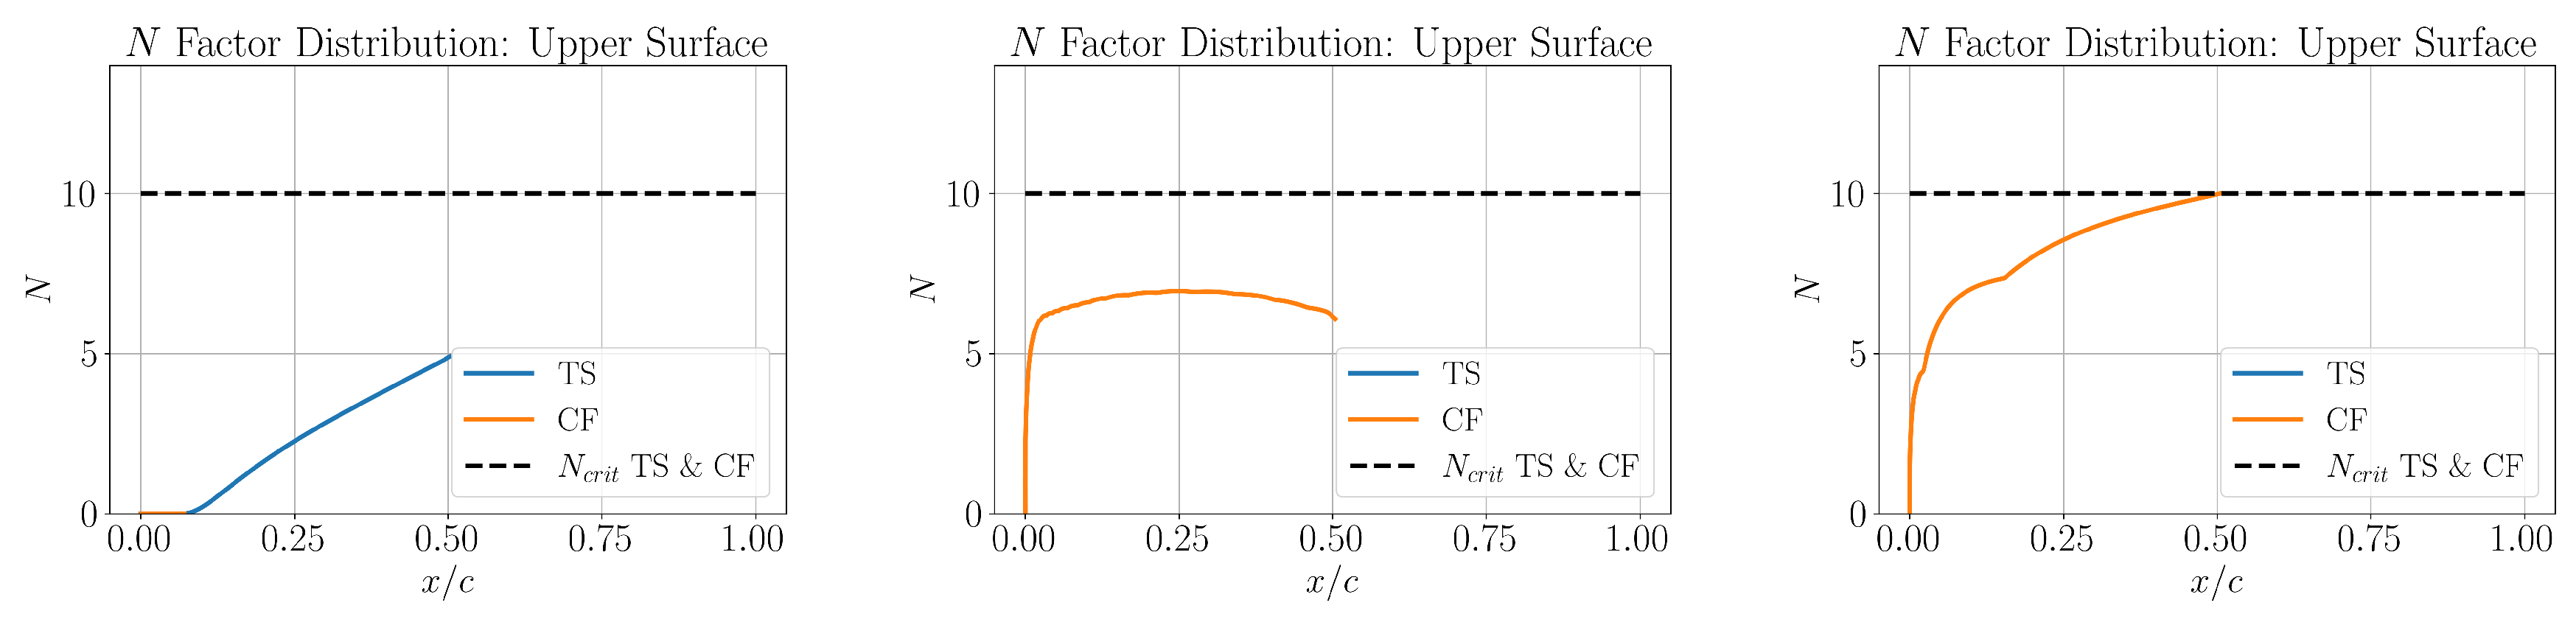
Figure 20.
Lower surface N factor envelopes with dominant instability mechanisms for case 2: (left), (middle) and (right).
Figure 20.
Lower surface N factor envelopes with dominant instability mechanisms for case 2: (left), (middle) and (right).
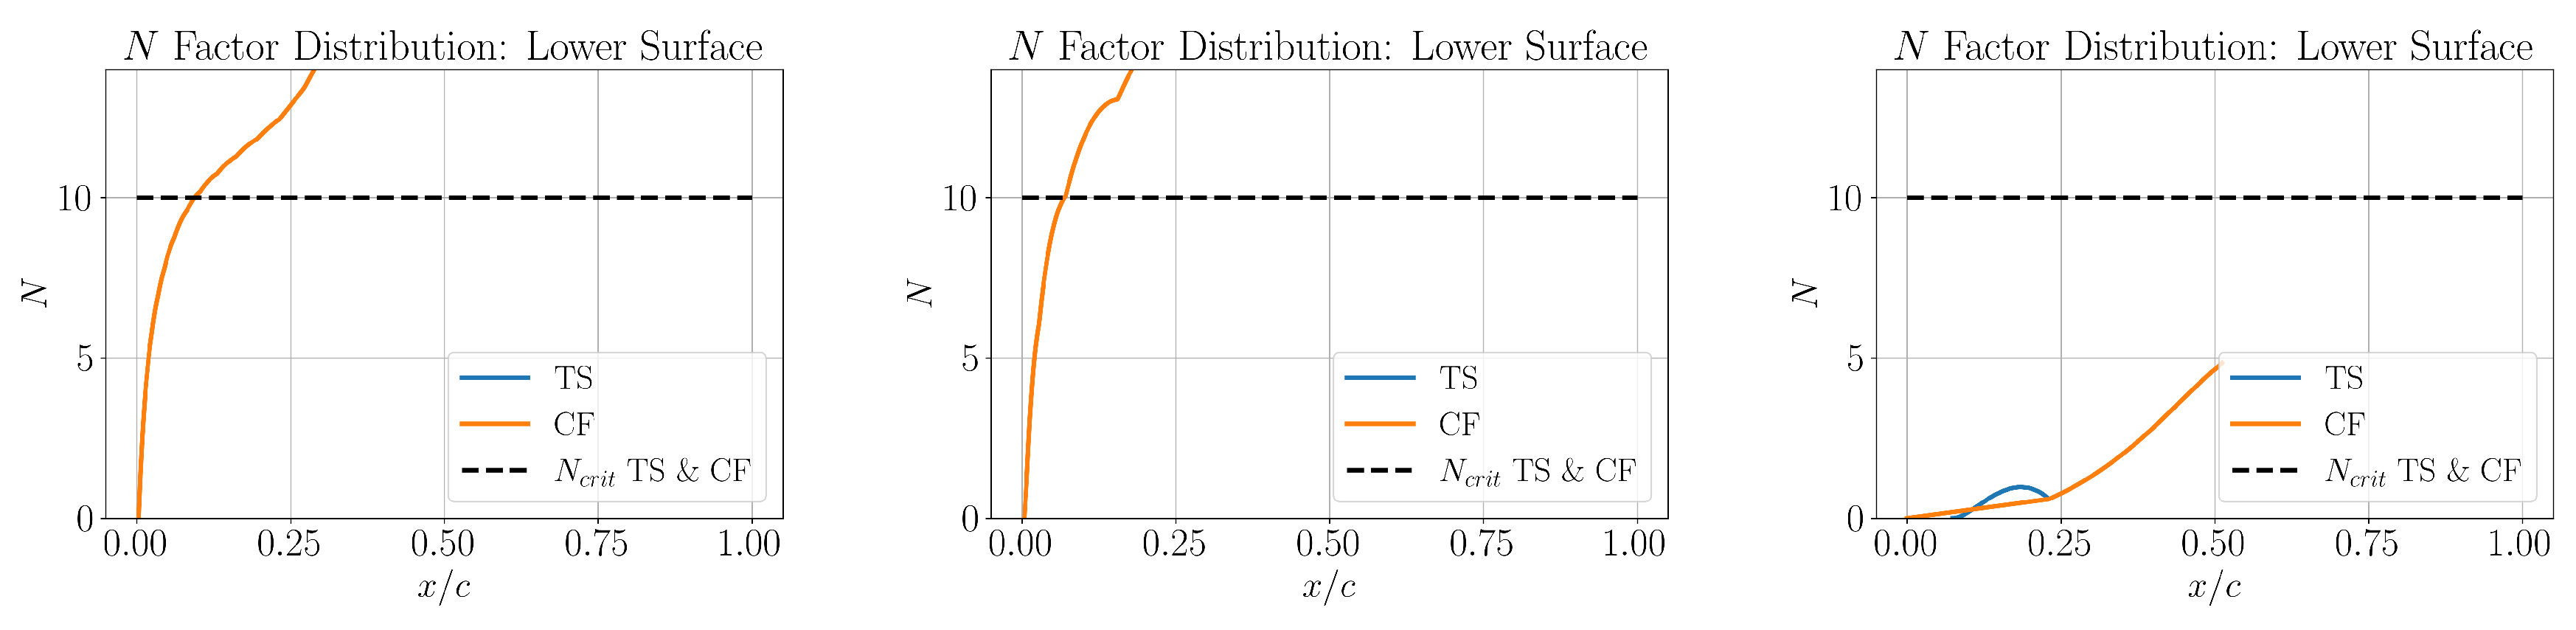
Figure 21.
Aerodynamic characteristics of resultant airfoil within the design range for case 2: Drag variation (left) and Transition locations (right).
Figure 21.
Aerodynamic characteristics of resultant airfoil within the design range for case 2: Drag variation (left) and Transition locations (right).
7. Conclusion
The efficacy of Bezier curves in capturing and parameterizing the intricate features of CATNLF airfoils has been illustrated and demonstrated in this work. This parametric representation of crossflow attenuating leading edge profiles enables the forward aerodynamic design of CATNLF airfoils, with an added advantage of maintaining robust performance within a range of design values at the desired flow conditions. The CATNLF design framework developed in this study by coupling the Bezier parameterization with Bayesian optimization was able to deliver laminar airfoil designs at sweep angles degrees, and they maintain laminar flow at multiple design points. The robust laminarization on the lower surfaces of the airfoils could not be achieved in this study, most likely due to a lack of available CATNLF airfoil geometries which possess the necessary characteristics to do so. In future, combining the strengths of forward and inverse design can be highly useful in this regard, where a rich database of CATNLF airfoils can be generated, possessing a wide range of aerodynamic characteristics for satisfying different design requirements, which can be utilized in the DOE for the Bayesian based forward design methodology developed in this study for obtaining further improvements which are hard to predict in advance. Also, the forward design framework presented in this article, using a combination of the Bezier parametric formulation and Bayesian optimization, is independent of the choice of the blackbox solver for the aerodynamic analysis. The mid-fidelity design of CATNLF airfoils resulting from this work can be further improved by modelling aerodynamics with higher fidelities, additionally taking into account the 3D effects which were ignored in this study.
Author Contributions
Samarth Kakkar : Writing - original draft, conceptualization, methodology; Thomas Streit & Arne Seitz : Writing - review and editing, methodology; Rolf Radespiel: Writing - review and editing, conceptualization, methodology, funding acquisition, supervision.
Funding
The authors gratefully acknowledge the funding by the Bundesministerium für Wirtschaft und Klimaschutz, Germany, within the scope of the Luftfahrtforschungsprogramm VI-2 project H2Avia-AeSt (Funding Code 20E2106C).
Conflicts of Interest
The authors declare no conflicts of interest.
References
- Butz, H.; Friedrichs, J.; Henke, R.; Hornung, M.; Klenner, J.; Radespiel, R.; Räckers, B.; Reckzeh, D.; Rossow, C.; Thielecke, F.; et al. The Energy-Efficient Aircraft of the Future – A Long-Term Perspective; 2025. [Google Scholar] [CrossRef]
- Sengupta, T.K. Instabilities of flows and transition to turbulence; CRC Press: Boca Raton, FL, 2012. [Google Scholar]
- Vos, R.; Farokhi, S. Introduction to transonic aerodynamics; Springer, 2015; Vol. 110. [Google Scholar]
- Schlichting, H.; Gersten, K. Boundary layer theory; Springer, 2003. [Google Scholar]
- Schmid, P.J.; Henningson, D.S.; Jankowski, D. Stability and transition in shear flows. Applied Mathematical Sciences, vol. 142. Appl. Mech. Rev. 2002, 55, B57–B59. [Google Scholar]
- Beck, N.; Landa, T.; Seitz, A.; Boermans, L.; Liu, Y.; Radespiel, R. Drag reduction by laminar flow control. Energies 2018, 11, 252. [Google Scholar] [CrossRef]
- Lynde, M. General information on the wind tunnel data from the CRM-NLF test. 2021. [Google Scholar]
- Lynde, M.N.; Campbell, R.L. Expanding the natural laminar flow boundary for supersonic transports. In Proceedings of the 34th AIAA applied aerodynamics conference, 2016; p. 4327. [Google Scholar]
- Campbell, R.L.; Lynde, M.N. Natural laminar flow design for wings with moderate sweep. In Proceedings of the 34th AIAA Applied Aerodynamics Conference, 2016; p. 4326. [Google Scholar]
- Campbell, R.; Campbell, M.; Streit, T. Progress toward efficient laminar flow analysis and design. In Proceedings of the 29th AIAA applied aerodynamics conference, 2011; p. 3527. [Google Scholar]
- Streit, T.S.; Seitz, A.; Hein, S.; Kunze, P. NLF potential of laminar transonic long range aircraft. In Proceedings of the AIAA Aviation 2020 Forum, 2020; p. 2748. [Google Scholar]
- Lynde, M.N.; Campbell, R.L. Computational design and analysis of a transonic natural laminar flow wing for a wind tunnel model. 35th AIAA Applied Aerodynamics Conference 2017, p. 3058.
- Kulfan, B.M. Universal parametric geometry representation method. Journal of aircraft 2008, 45, 142–158. [Google Scholar] [CrossRef]
- Hicks, R.M.; Henne, P.A. Wing design by numerical optimization. Journal of aircraft 1978, 15, 407–412. [Google Scholar] [CrossRef]
- Farin, G.; Hoschek, J.; Kim, M.S. Handbook of computer aided geometric design; Elsevier, 2002. [Google Scholar]
- Risse, K. Preliminary overall aircraft design with hybrid laminar flow control. PhD thesis;Dissertation, RWTH Aachen University, 2016. [Google Scholar]
- Streit, T.; Wichmann, G.; von Knoblauch zu Hatzbach, F.; Campbell, R. Implications of conical flow for laminar wing design and analysis. 29th AIAA Applied Aerodynamics Conference 2011, p. 3808.
- Gaster, M. On the flow along swept leading edges. Aeronautical Quarterly 1967, 18, 165–184. [Google Scholar] [CrossRef]
- Streit, T.; Hoffrogge, C. DLR transonic inverse design code, extensions and modifications to increase versatility and robustness. The Aeronautical Journal 2017, 121, 1733–1757. [Google Scholar] [CrossRef]
- Schrauf, G. LILO 2.1 user’s guide and tutorial. Bremen, Germany, GSSC Technical Report 2006, 6.
- Kakkar, S.; Olivucci, P.; Sudhi, A.; Badrya, C.; Radespiel, R. High Dimensional Bayesian Optimization for Aerodynamic Design of Airfoils and Wings with Hybrid Laminar Flow Control. Available at SSRN 5316824.
- Garnett, R. Bayesian Optimization; Cambridge University Press, 2023. [Google Scholar]
- Sudhi, A.; Radespiel, R.; Badrya, C. Design exploration of transonic airfoils for natural and hybrid laminar flow control applications. Journal of Aircraft 2023, 60, 716–732. [Google Scholar] [CrossRef]
| 1 |
is based on the attachment line momentum thickness. |
Figure 1.
Intended pressure distribution near the leading edge for ensuring crossflow attenuation at large sweep angles.
Figure 1.
Intended pressure distribution near the leading edge for ensuring crossflow attenuation at large sweep angles.
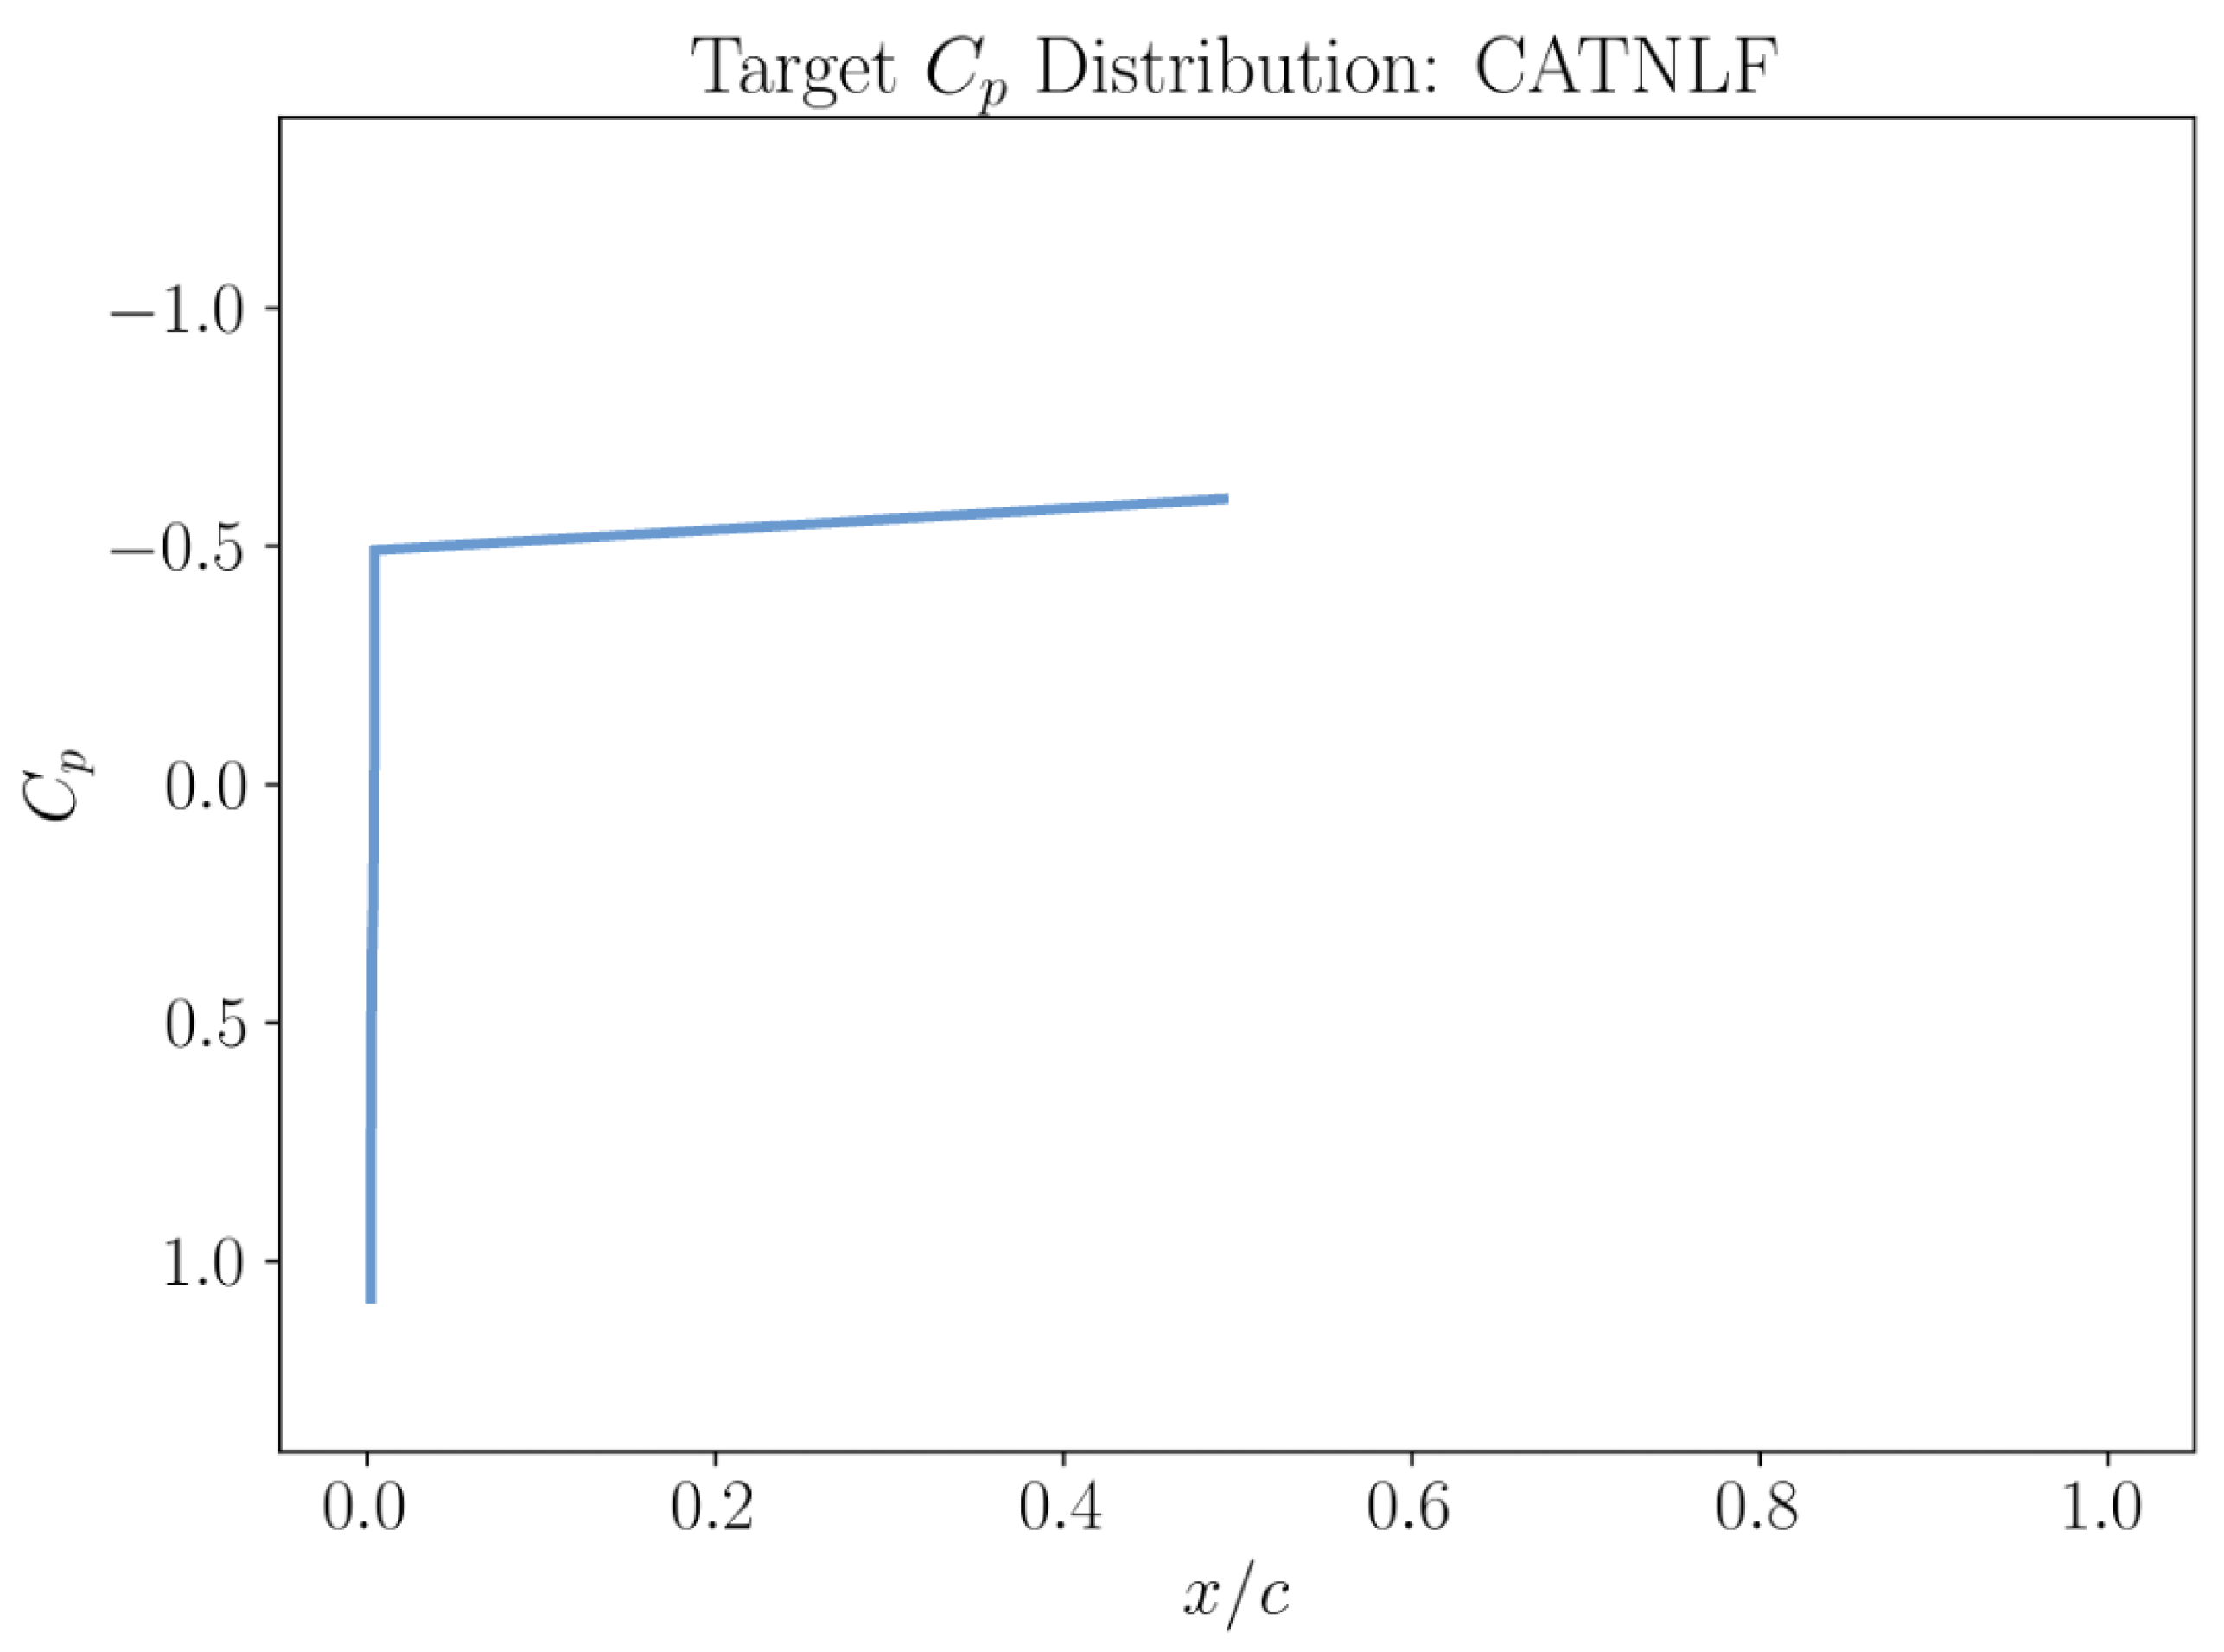
Figure 2.
CST bump functions based on Bernstein polynomials with .
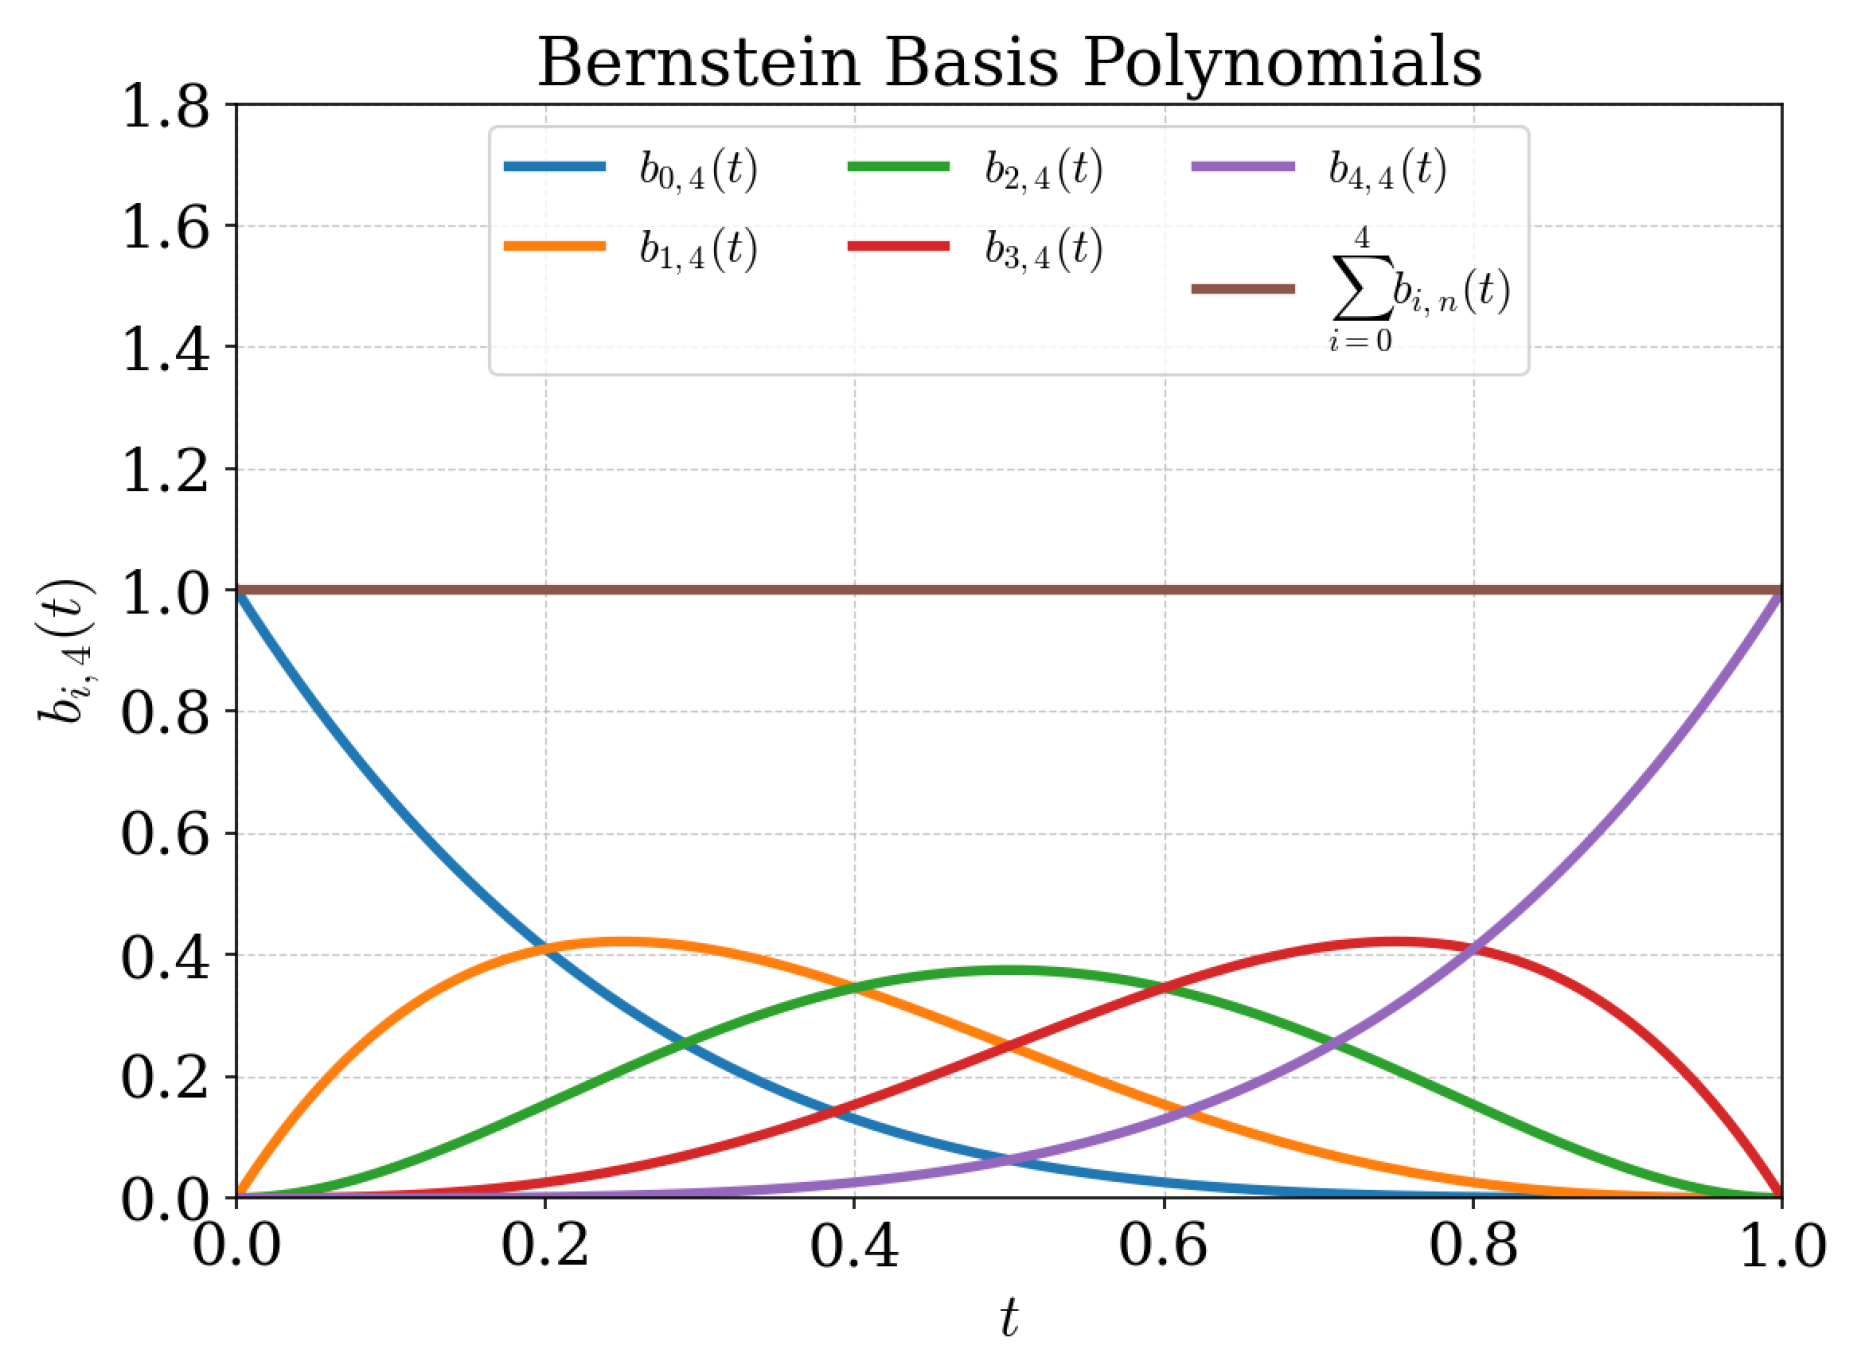
Figure 3.
CST parameterization methodology: Class function × Shape function.
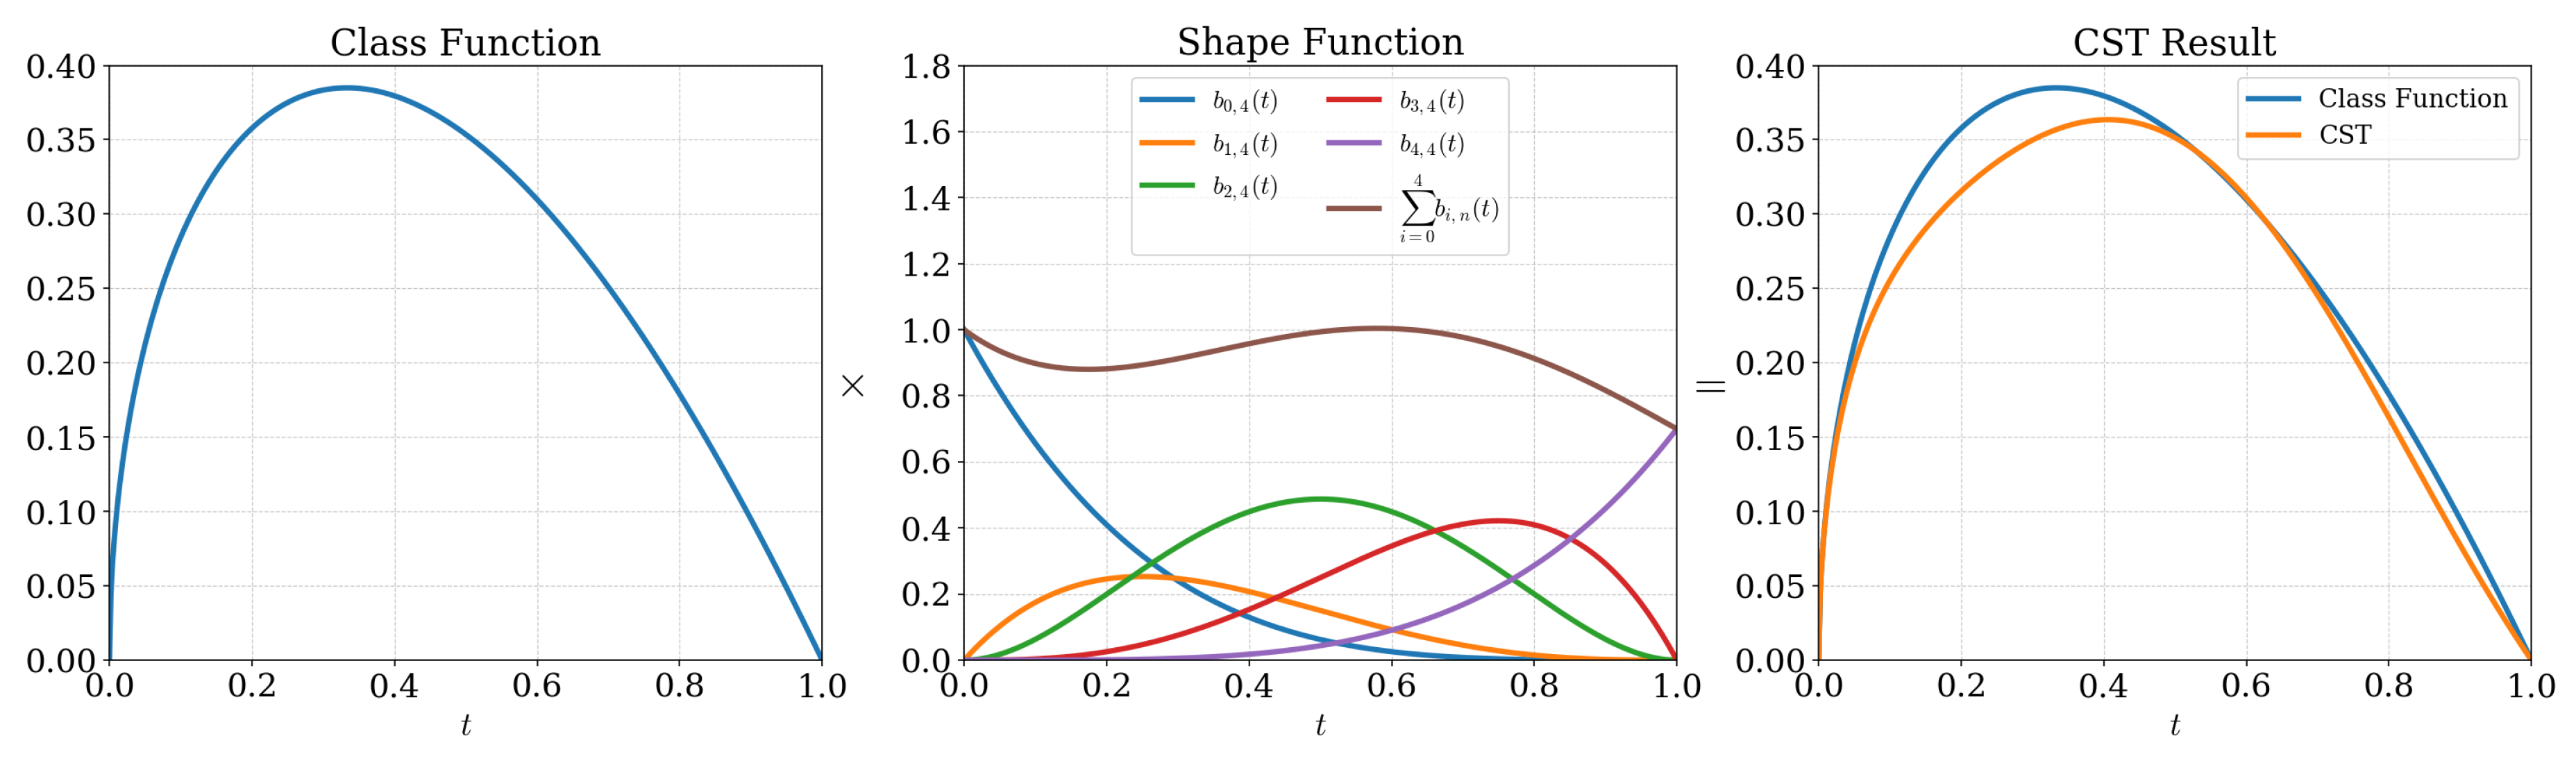
Figure 4.
Hicks-Henne bump functions with finer leading edge control, assuming leading edge at .
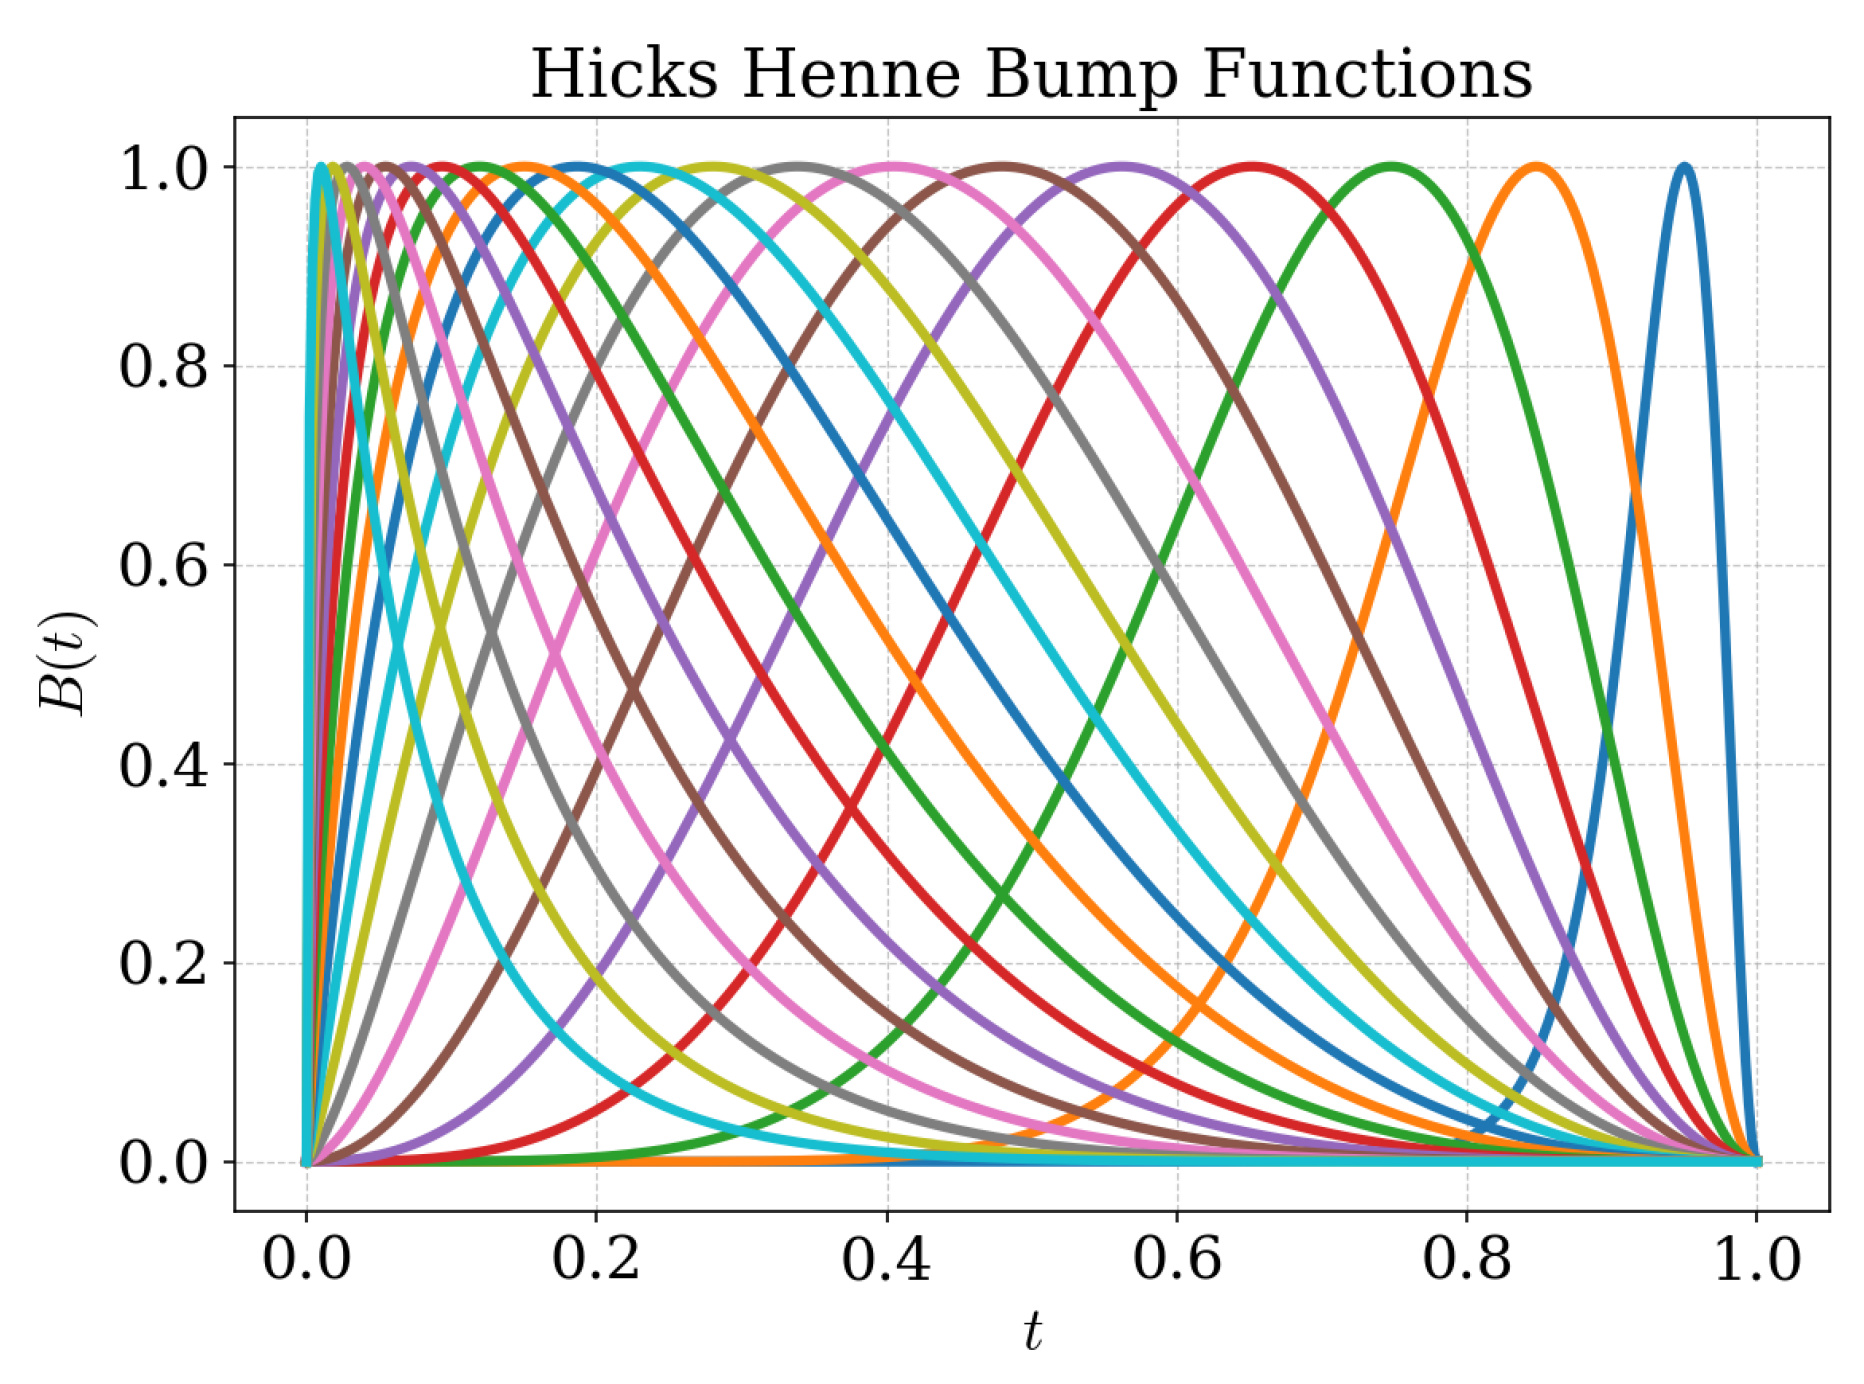
Figure 5.
Hicks-Henne reconstruction of leading edge geometries for section D (left) and section E (right).
Figure 5.
Hicks-Henne reconstruction of leading edge geometries for section D (left) and section E (right).
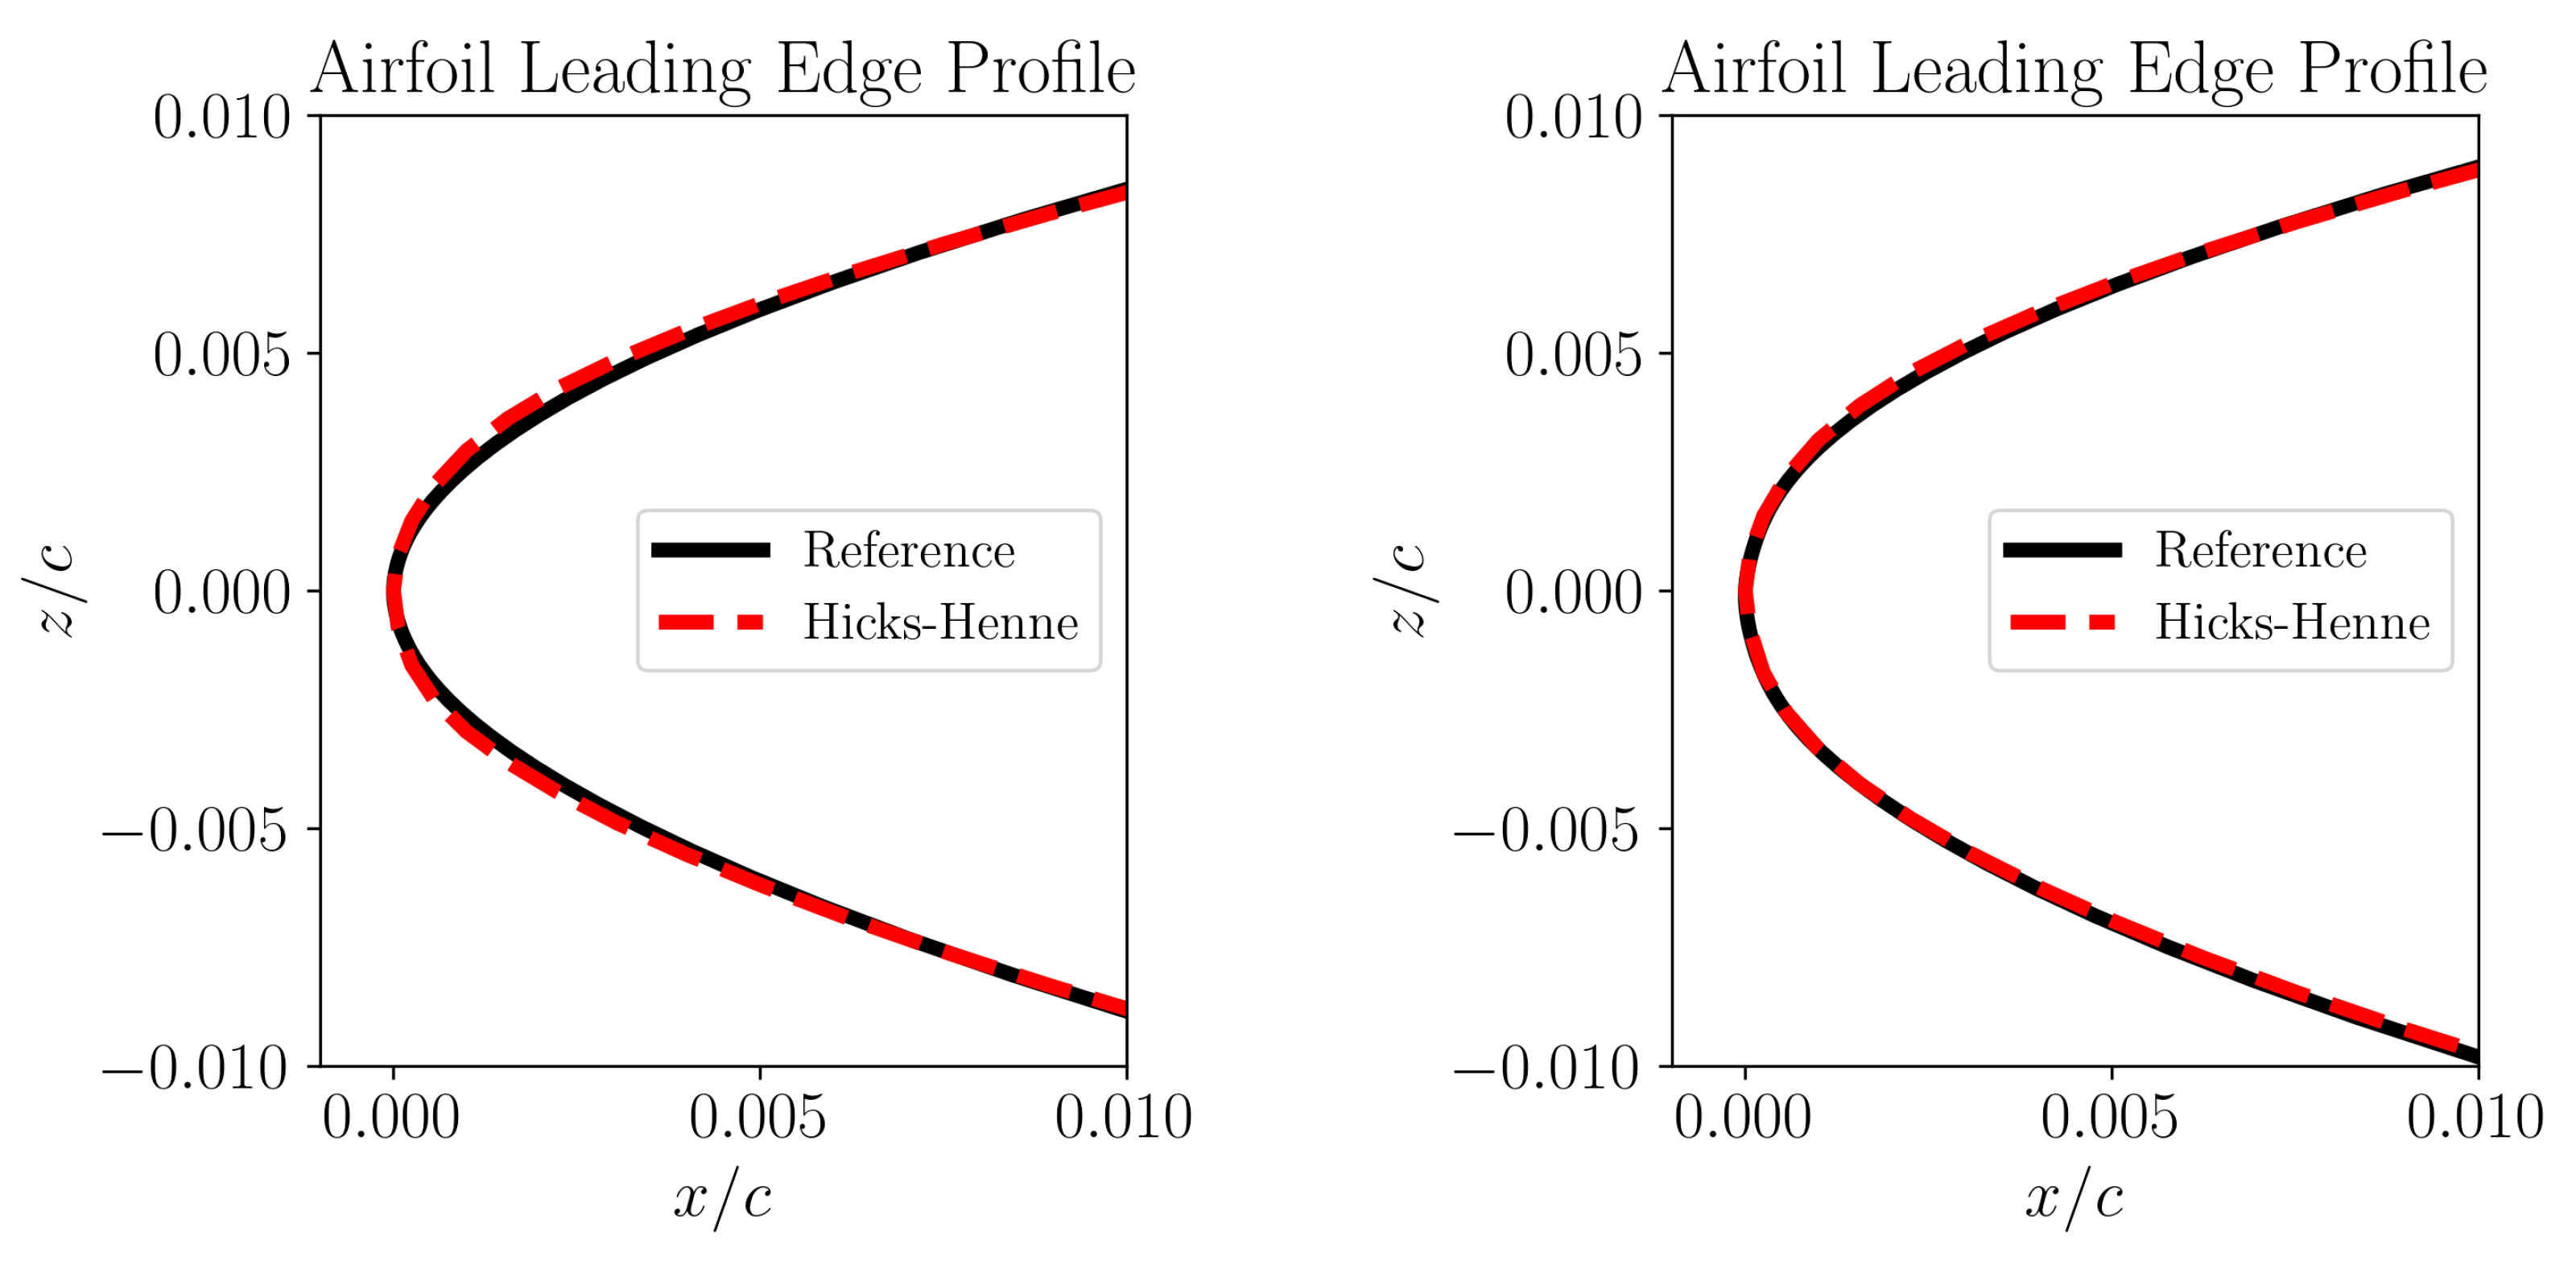
Figure 6.
Instability curves comparison for Hicks-Henne parameterization with CRM-NLF airfoils as reference: Section D for Million, (left) and Section E for Million, (right).
Figure 6.
Instability curves comparison for Hicks-Henne parameterization with CRM-NLF airfoils as reference: Section D for Million, (left) and Section E for Million, (right).
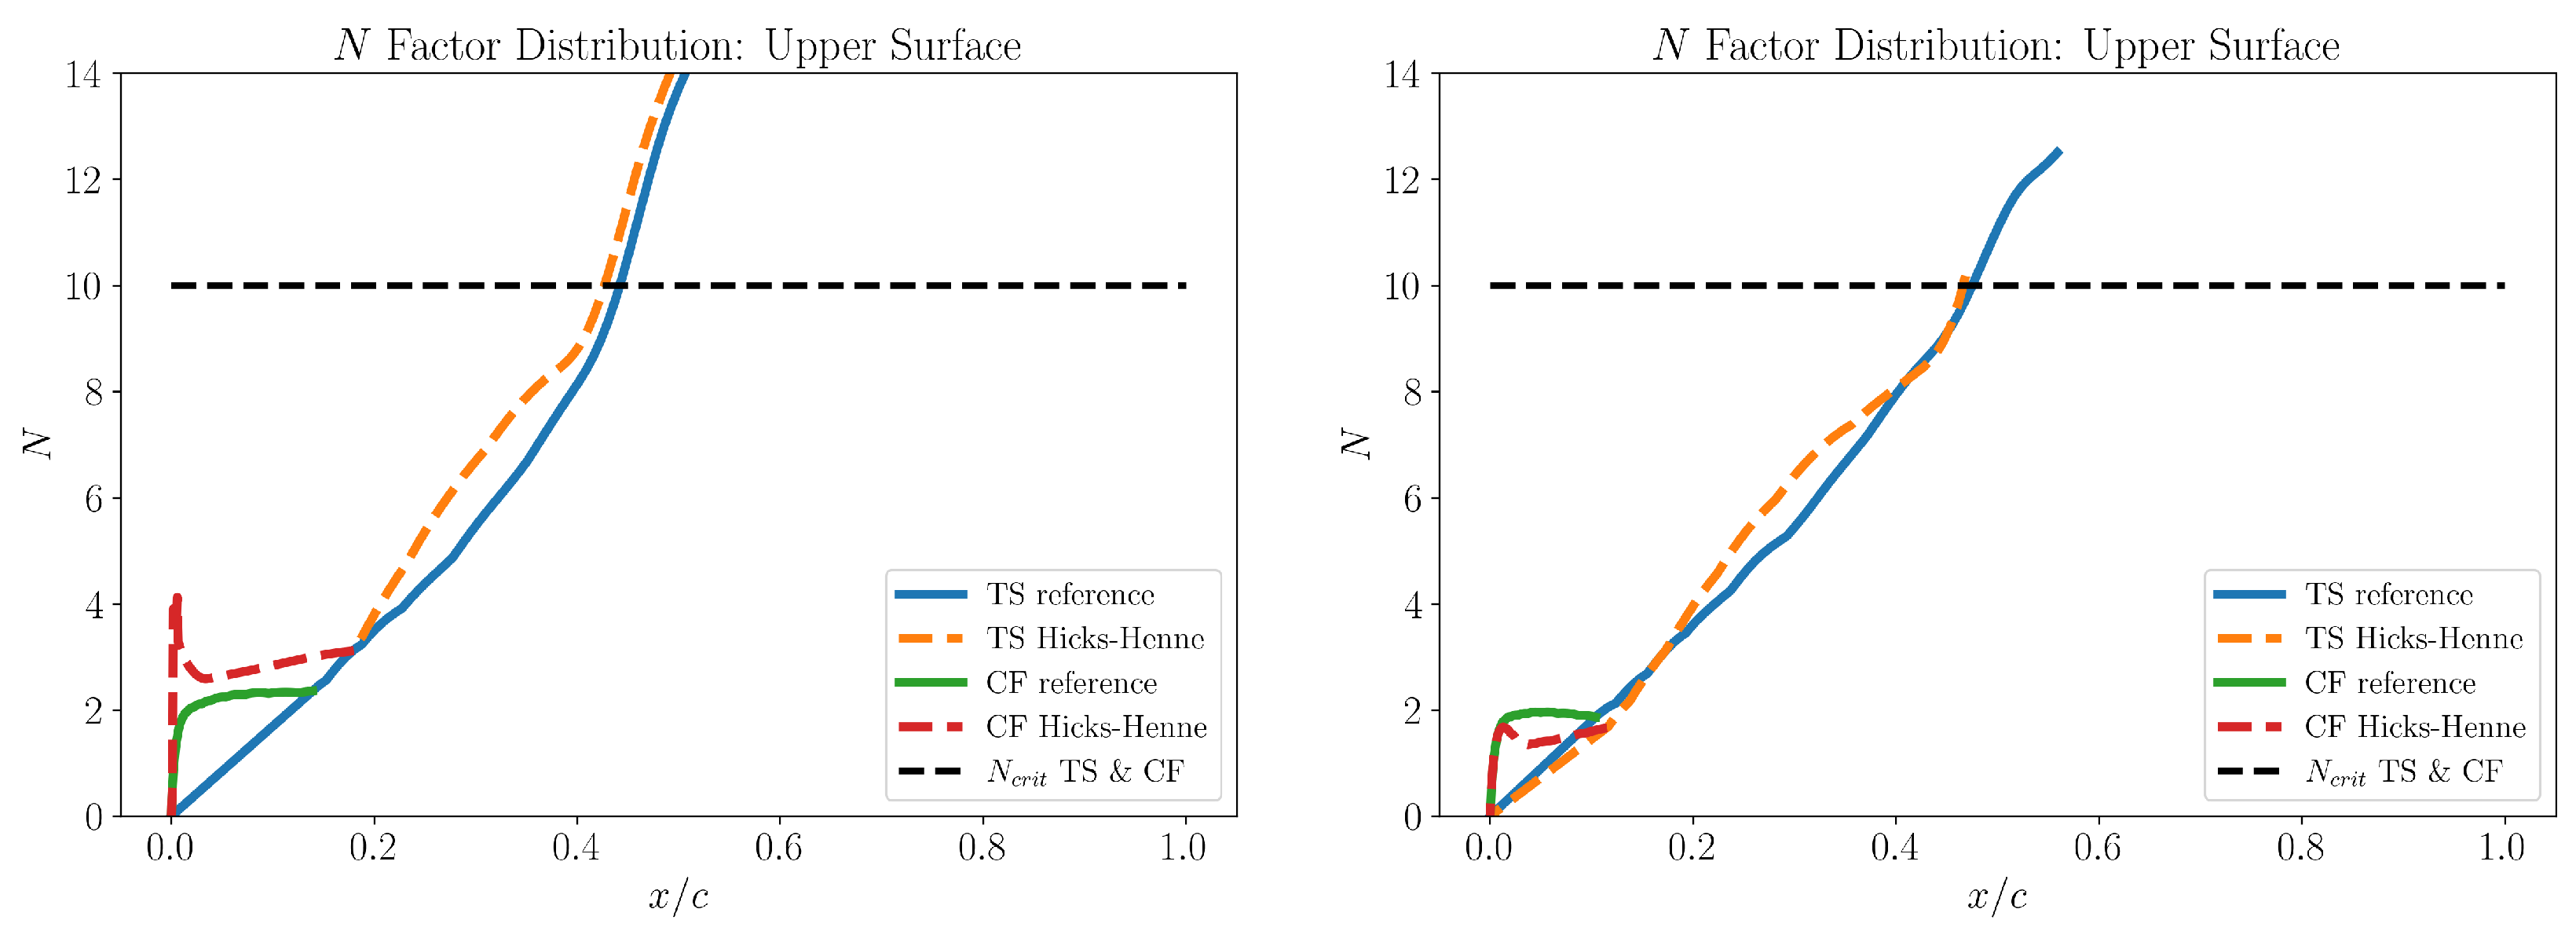
Figure 7.
Single cubic Bezier curve (left) and joined cubic Bezier curves (right).
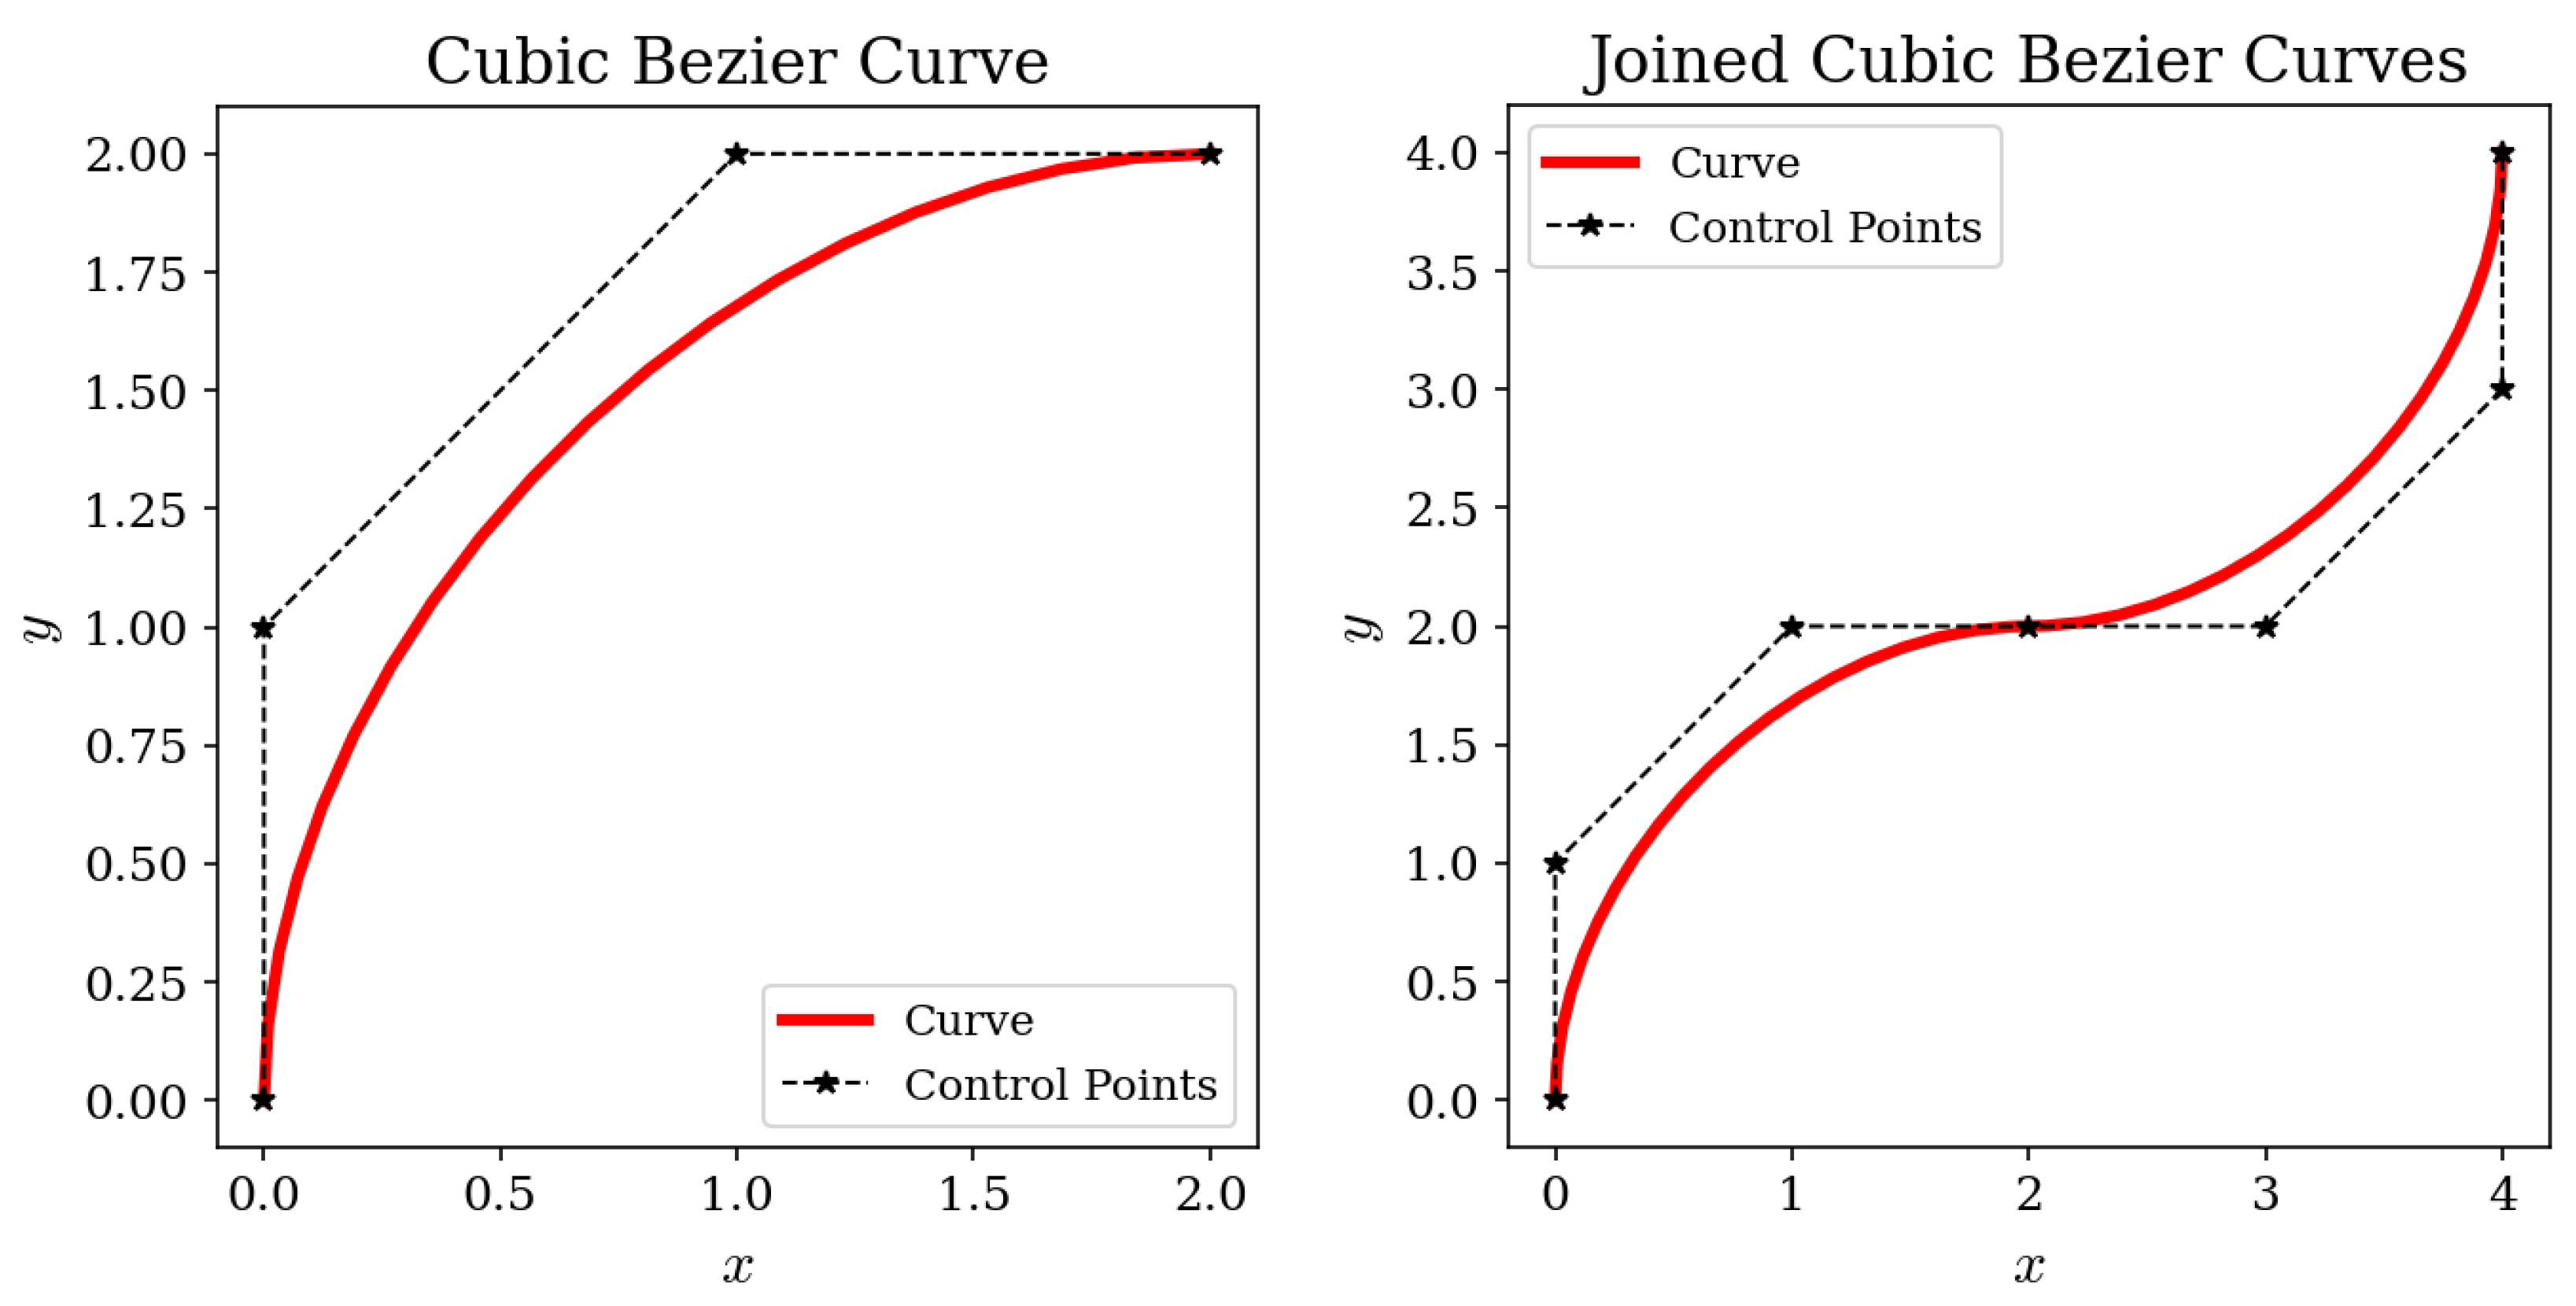
Figure 8.
CRM-NLF Section C profile represented using Bezier parameterization.
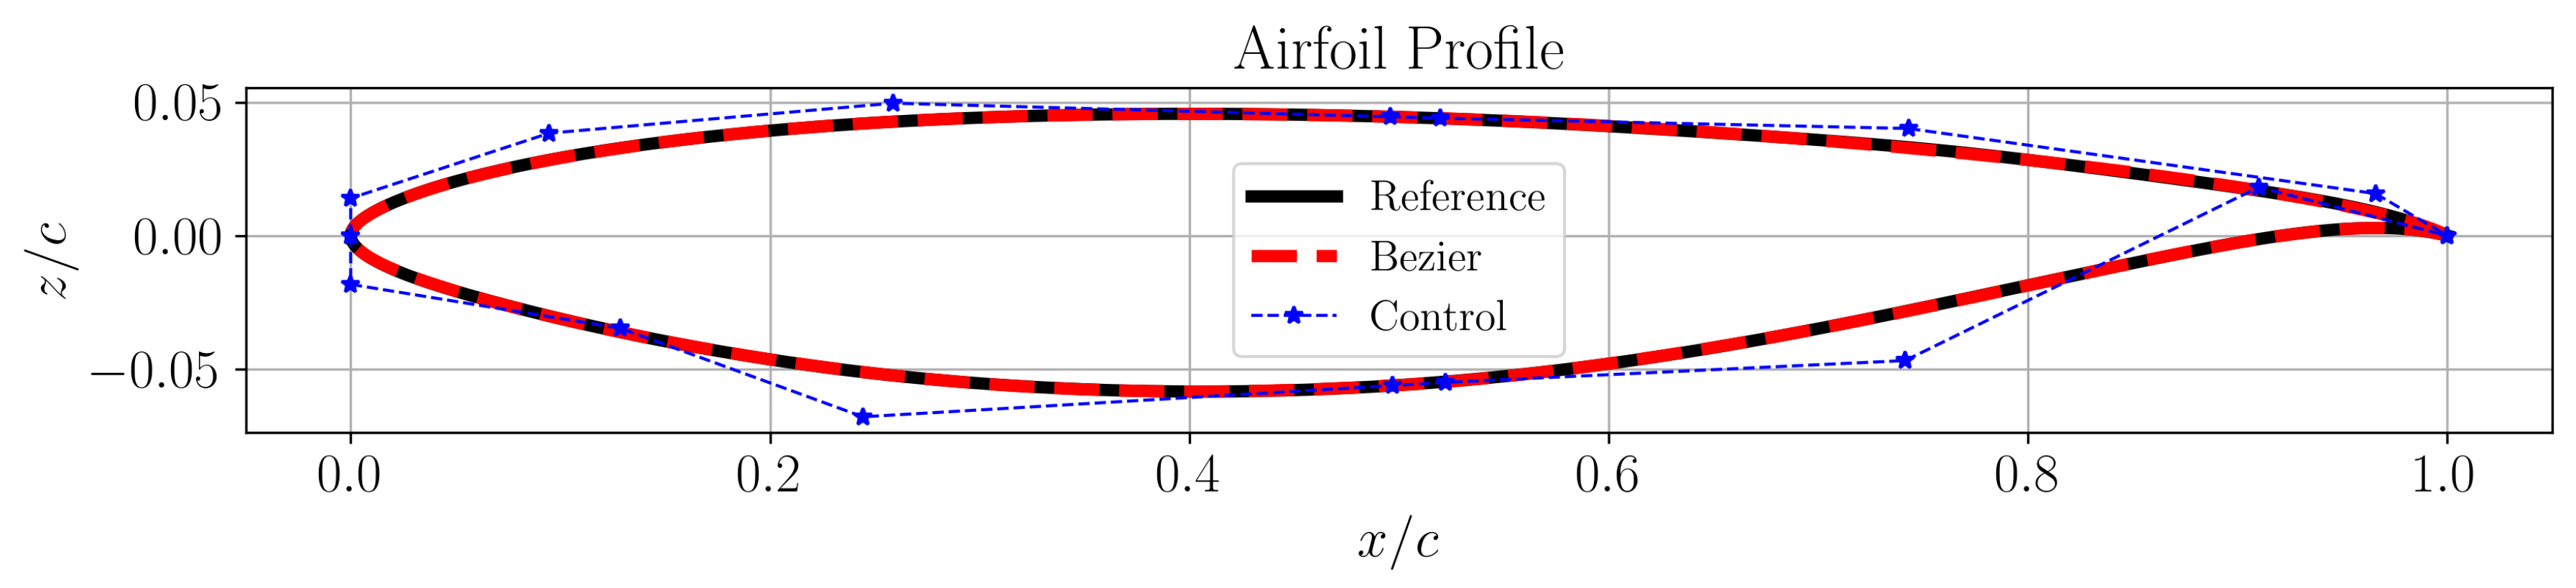
Figure 9.
Bezier reconstruction of leading edge geometries for section D (left) and section E (right).
Figure 9.
Bezier reconstruction of leading edge geometries for section D (left) and section E (right).
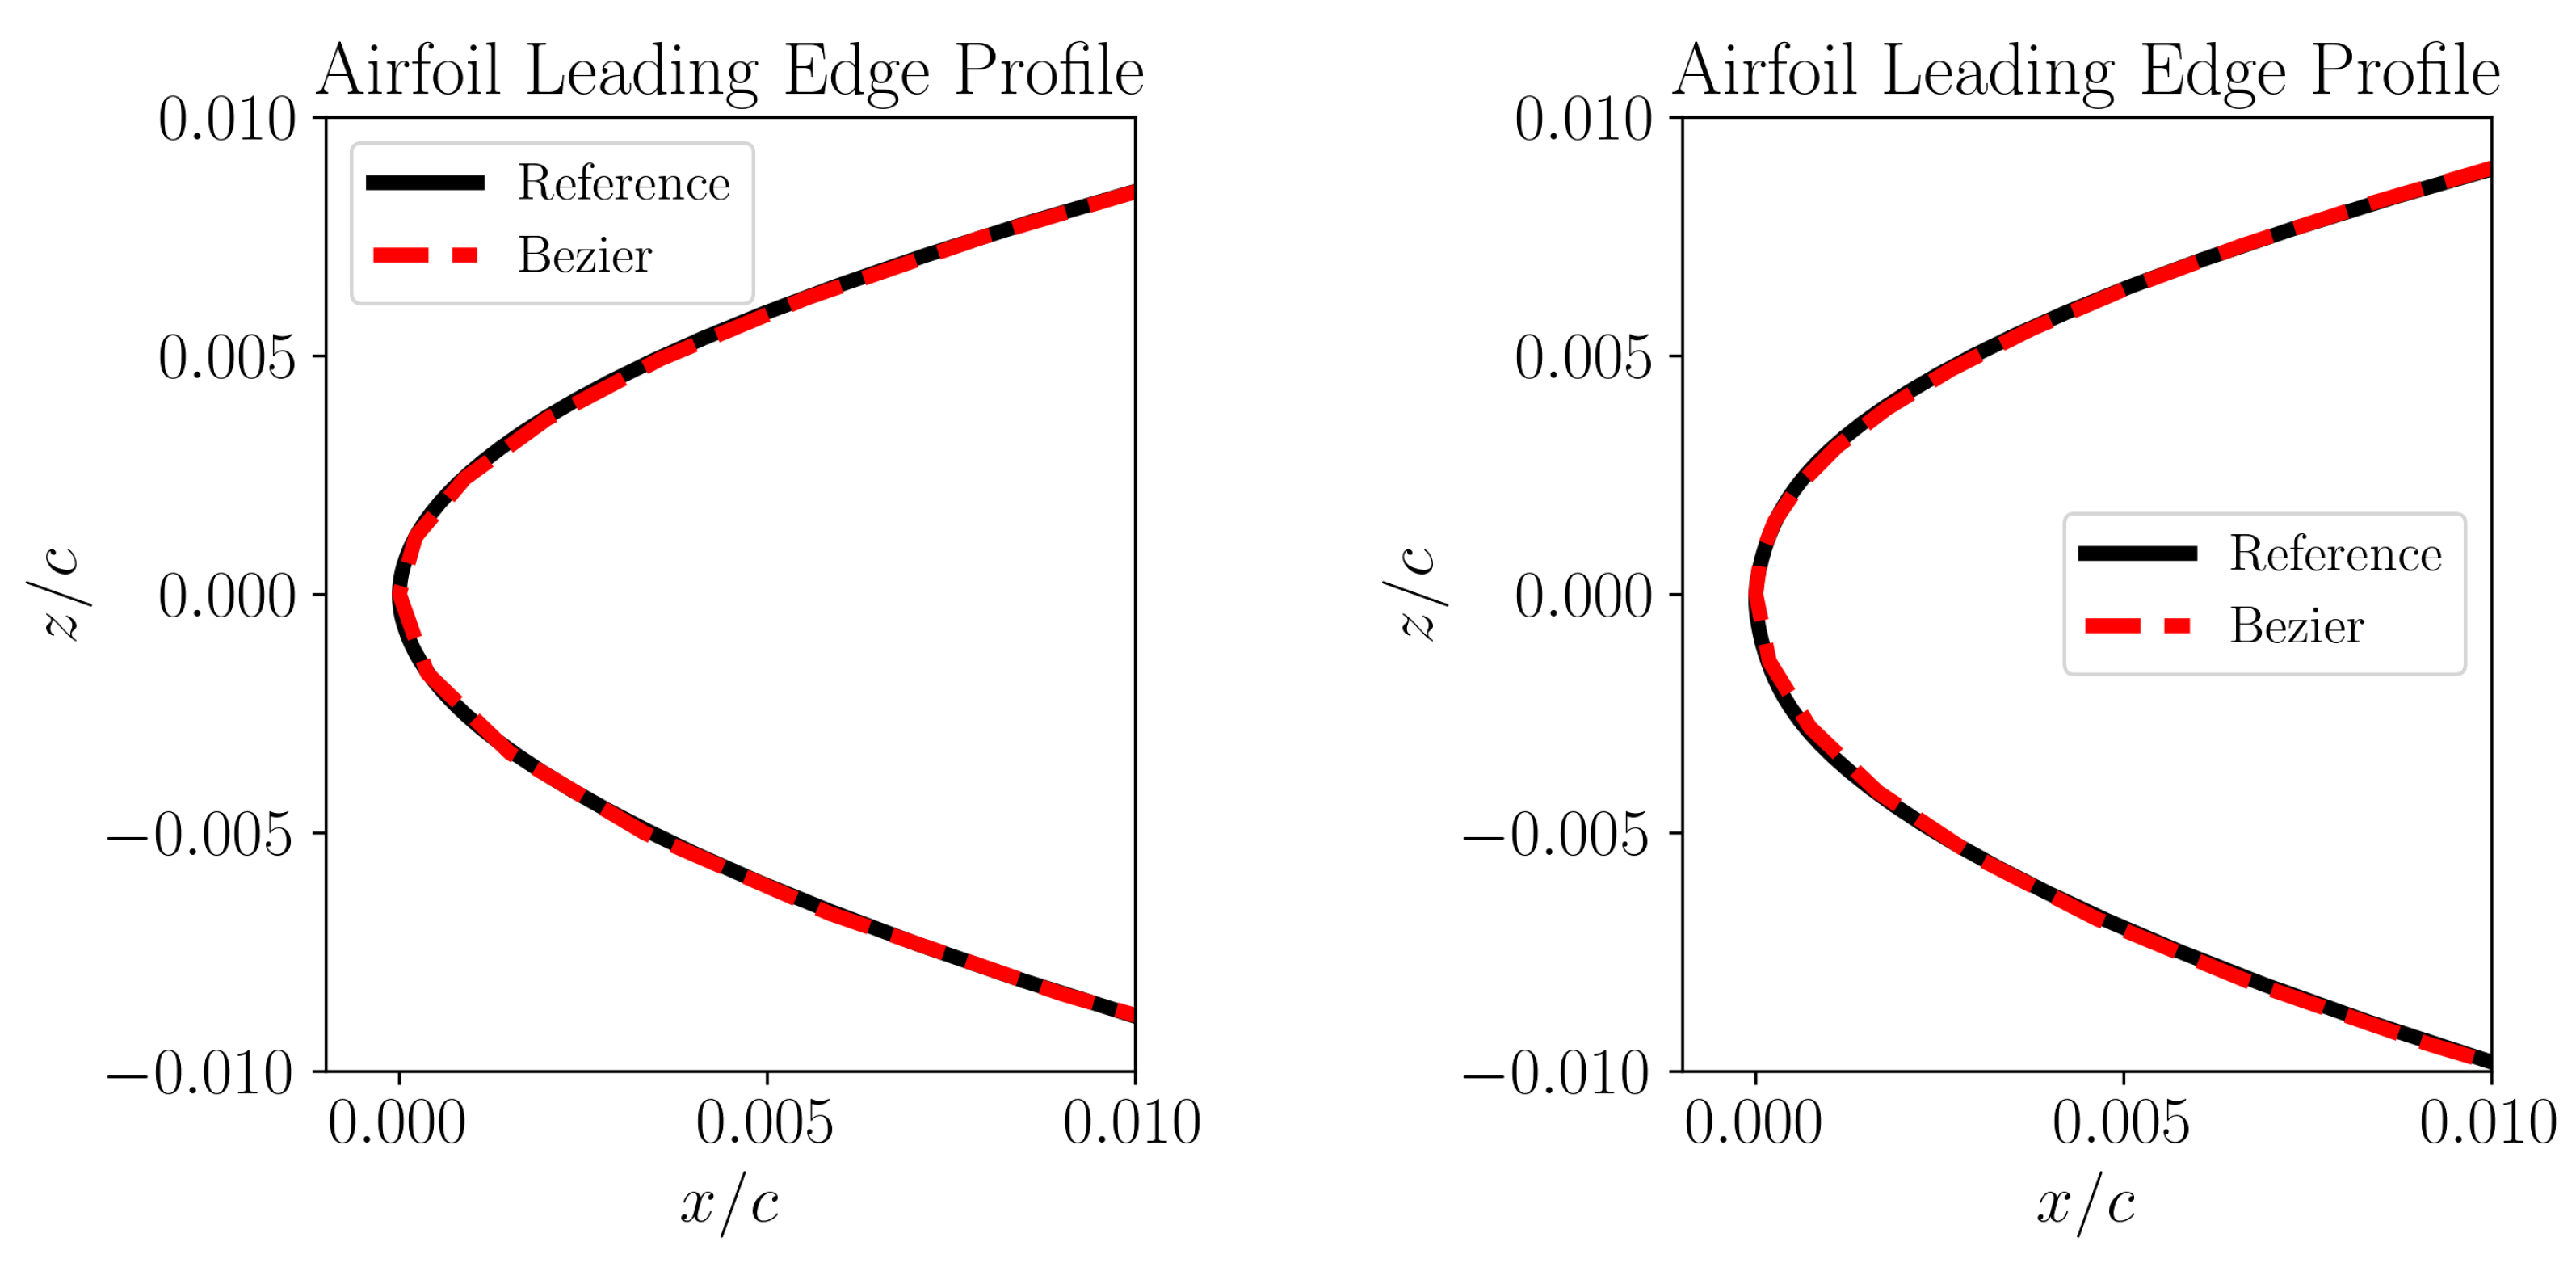
Figure 10.
Instability curves comparison for Bezier parameterization with CRM-NLF airfoils as reference: Section D for Million, (left) and Section E for Million, (right).
Figure 10.
Instability curves comparison for Bezier parameterization with CRM-NLF airfoils as reference: Section D for Million, (left) and Section E for Million, (right).
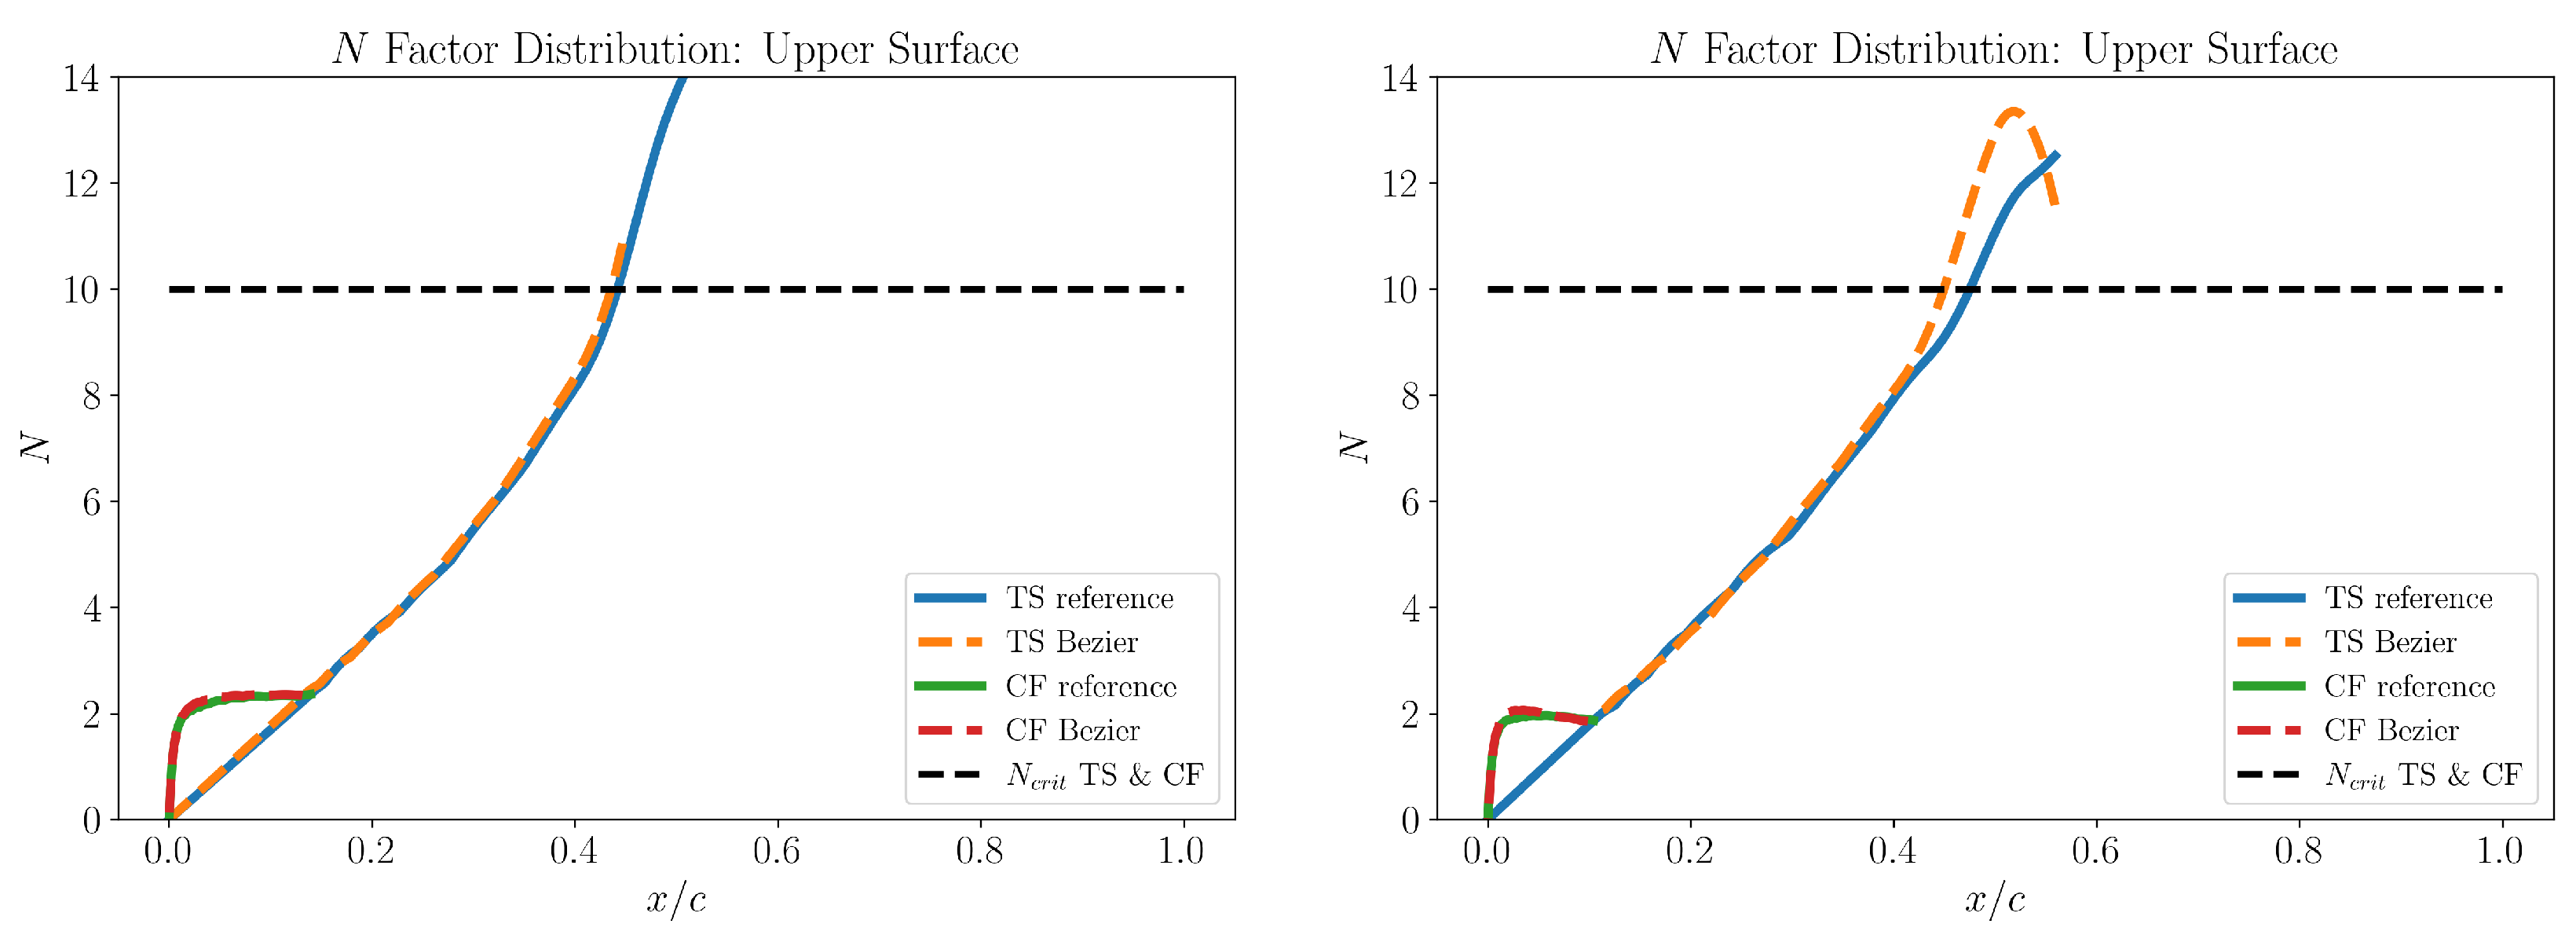
Figure 11.
Comparison of Bezier and Hicks-Henne reconstruction of leading edge geometries for section D (left) and section E (right).
Figure 11.
Comparison of Bezier and Hicks-Henne reconstruction of leading edge geometries for section D (left) and section E (right).
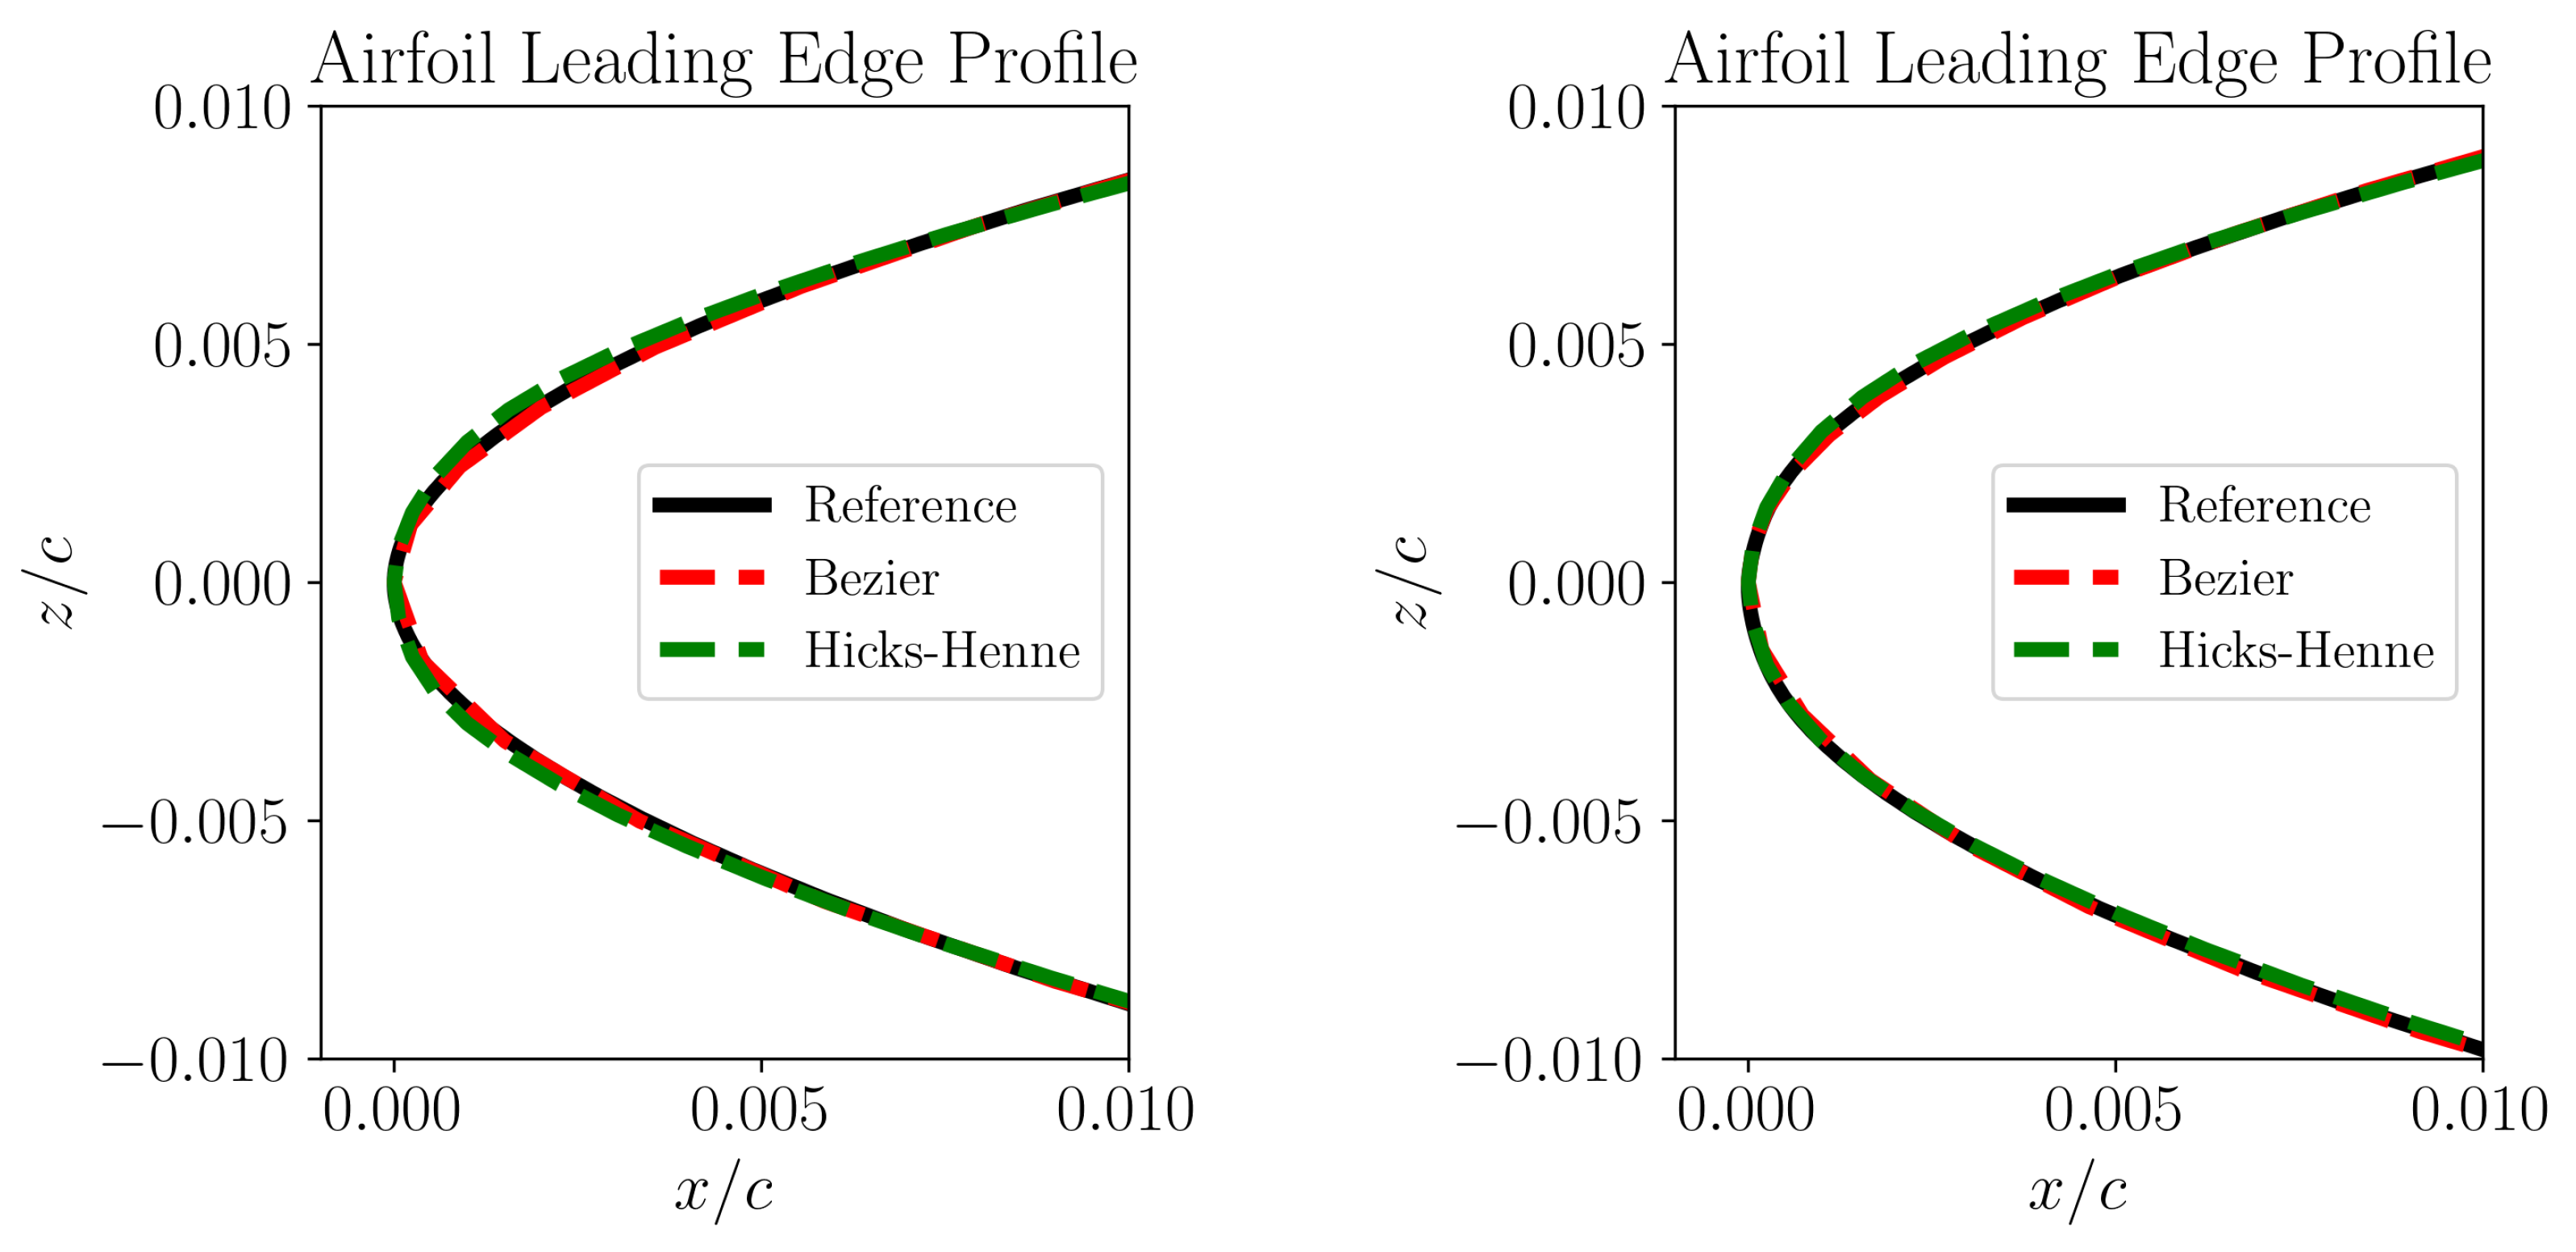
Figure 12.
Resultant optimized CATNLF airfoil profile for case 1.
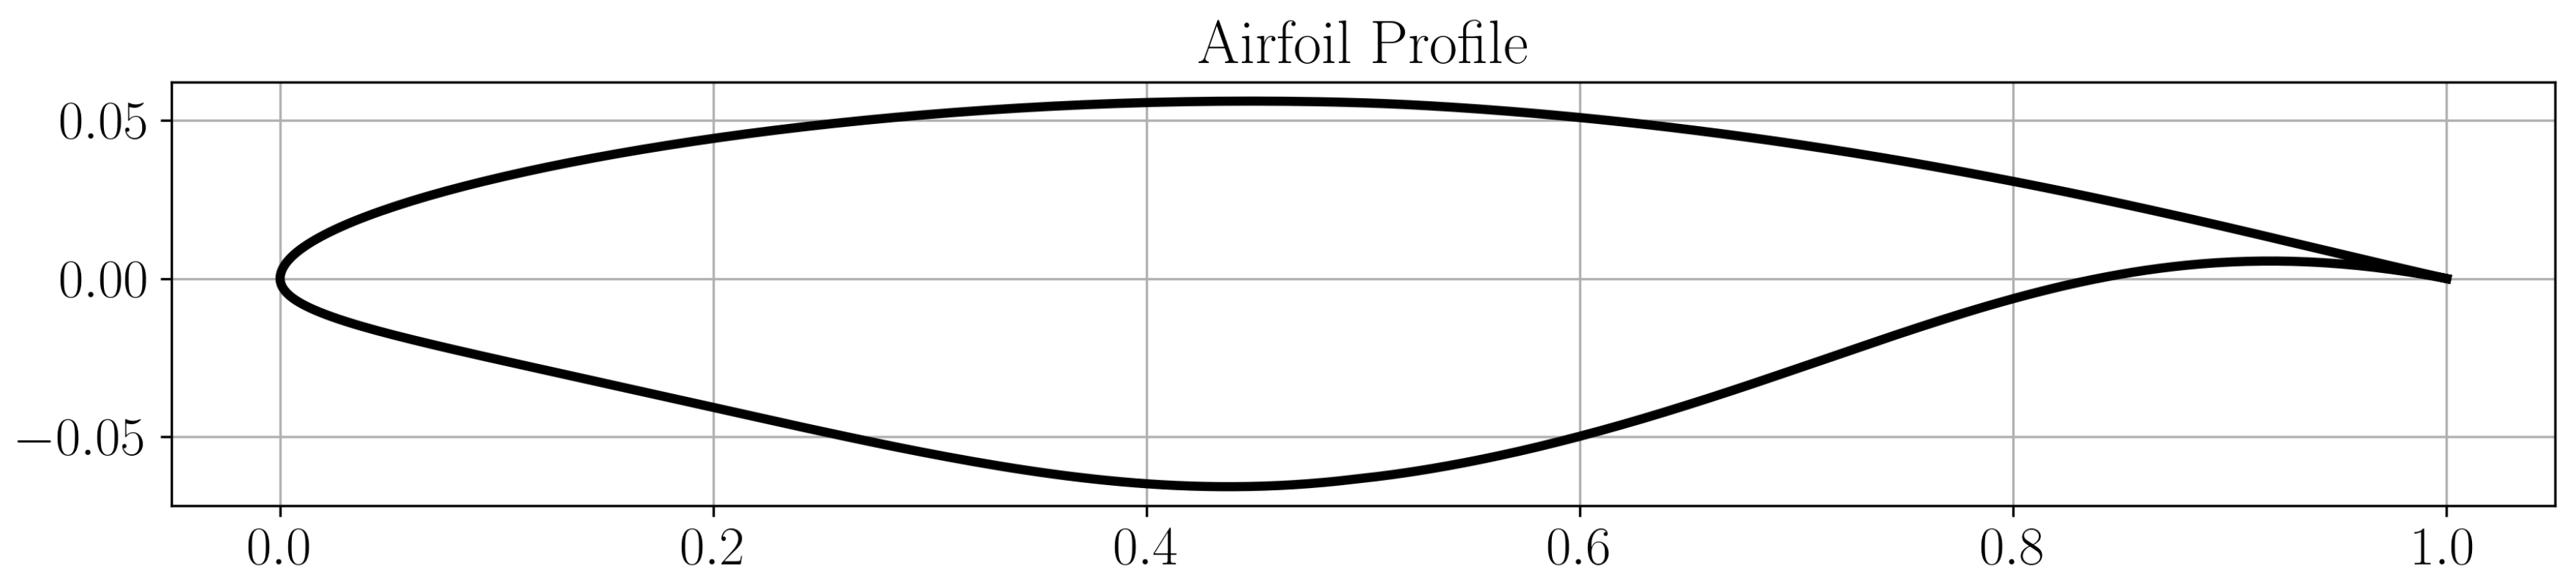

Table 1.
CATNLF airfoil optimization problem formulation.
| Forward design framework for CATNLF airfoils |
|---|
| Minimize: averaged for |
| Design variable: = 20 Bezier control parameters + |
| Subject to constraints: |
| Nose radius: 0.008 |
| Maximum thickness: 12% |
| Minimum thickness: 0 |
| Moment coefficient: ≥ -0.15 |
| Prevent attachment line transition1: |
Disclaimer/Publisher’s Note: The statements, opinions and data contained in all publications are solely those of the individual author(s) and contributor(s) and not of MDPI and/or the editor(s). MDPI and/or the editor(s) disclaim responsibility for any injury to people or property resulting from any ideas, methods, instructions or products referred to in the content. |
© 2026 by the authors. Licensee MDPI, Basel, Switzerland. This article is an open access article distributed under the terms and conditions of the Creative Commons Attribution (CC BY) license (http://creativecommons.org/licenses/by/4.0/).
Copyright: This open access article is published under a Creative Commons CC BY 4.0 license, which permit the free download, distribution, and reuse, provided that the author and preprint are cited in any reuse.


