
Submitted:
06 January 2026
Posted:
07 January 2026
You are already at the latest version
Abstract
Poly-γ-glutamic acid (γ-PGA) is an important biopolymer produced by various species of Bacillus. Novel γ-PGA producers have shown strain-dependent nutritional and culture requirement that must be characterised and optimised to improve γ-PGA yields. The optimal nutritional and cultural condition for maximum γ-PGA titre in a newly identified γ-PGA producing strain Bacillus licheniformis DPC6338 was determined using one factor at a time (OFAT) and design of experiments (DOE). The optimal nutritional and culture condition for maximum γ–PGA titre in B. licheniformis DPC6338 was 67g/L glutamic acid, 32g/L tryptone, 75g/L glucose, 5g/L citric acid, 2g/L K2HPO4, 0.5g/L MgSO4·7H2O, 0.02 g/L FeCl2·4H2O, 0.1g/L CaCl2·2H2O, 0.5 g/L MnSO4·H2O, 2g/L ZnSO4·7H2O, 42°C, pH 6.5 – 7.0, 1% inoculum, at 250 rpm. Under optimised conditions in shake flask, maximum γ–PGA titre 75.35 ± 0.38 was obtained after 96h while peak productivity of 1.3 g/L/h occurred at 48 h, representing a 27% and 4% improvement in titre and productivity compared to the screening medium. Scale-up to bioreactor conditions significantly enhanced the final titre γ-PGA and early-phase volumetric productivity by ~30% and ~80% respectively. The results obtained in this study highlight the potential of B. licheniformis DPC6338 for industrial γ-PGA producing strain.
Keywords:
Bacillus licheniformis
; poly-γ-glutamic acid
; γ-PGA
; fractional factorial design
; FFD
; central composite design
; CCD
; response surface methodology
; fermentation
1. Introduction
γ-Polyglutamic acid (γ-PGA) is a naturally occurring, biodegradable, and water-soluble biopolymer composed of D- and/or L-glutamic acid units linked through γ-amide bonds [1]. Owing to its unusual γ-linkage, γ-PGA exhibits resistance to proteolytic degradation, high stability, and excellent functional properties. These characteristics, along with its non-toxic, edible, and environmentally friendly nature, have led to growing interest in γ-PGA for applications in food, medicine, agriculture, cosmetics, wastewater treatment, and biodegradable materials [2,3,4]. Despite these diverse uses, large-scale commercialisation remains constrained by high production costs associated with expensive substrates, energy-intensive fermentation, and limited strain productivity [5,6]. Consequently, the search for robust microbial producers capable of synthesising γ-PGA efficiently and cost-effectively continues to attract significant attention.
The most efficient natural γ-PGA producers are members of the genus Bacillus including B.subtilis, B.licheniformis, and B.amyloliquefaciens. Among these, B.licheniformis is considered particularly attractive for industrial γ-PGA production due to its robust growth, adaptability to diverse fermentation conditions, high productivity in several strains, and efficient extracellular secretion of γ-PGA [7]. Generally, bacillus strains produce γ-PGA for several reasons including nutrient storage, biofilm formation [8], protection from environmental stress [9,10], metal binding [11], competition and resource capture [12]. Hence, even among isolates of the same species, γ-PGA biosynthesis is highly strain-dependent, with notable variability in yield, molecular weight, D/L-glutamate composition and consequently the functional properties and applicability [6,7]. This variability is strongly influenced by both the genetic make-up of the strain [13,14,15] as well as the nutritional and environmental factors including the presence of glutamate, type of carbon and nitrogen sources, presence of metal ions such as Fe2+, Mn2+, Mg2+ and Zn2+, temperature, pH, stirring speed, aeration, and inoculum characteristics (e.g., age, concentration) [16,17,18,19,20]. This strain-dependent variation in γ-PGA production studies often necessitates process optimisation when dealing with new strains [21,22,23].
The strain B.licheniformis DPC6338 represents a promising candidate for efficient γ-PGA production [24]. However, the data regarding its optimal cultivation conditions and production potential is limited. Generally, previous studies have employed statistical methods such as one-factor at a time (OFAT) and design of experiment (DOE) to systematically screen and optimise key medium and process variables [25,26]. In this study, the nutritional and culture requirements for γ-PGA production by B.licheniformis DPC6338 was conducted using one-factor at a time (OFAT) and design of experiment (DOE). First, the effects of various carbon and nitrogen sources on γ-PGA production were evaluated to identify suitable nutrient bases for the strain. Next, a fractional factorial experimental design was employed to screen for statistically significant medium components that influence γ-PGA yield in the candidate strain, and the concentrations of the most influential parameters were further optimised using a central composite design (CCD). Finally, the optimum culture conditions including temperature (25 – 45 °C), pH (4 – 8) and inoculum concentration (1–10%) were identified using OFAT. Bioreactor scale experiment were conducted using the optimised conditions. The outcomes of this work will provide critical insights into the cultivation requirements for optimal γ-PGA production from the candidate strain and lay the foundation for upscaling the process.
2. Materials and Methods
2.1. Bacteria Strain, Cultivation and Maintenance Conditions
B.licheniformis DPC6338 were taken from glycerol stock (-80 °C), plated on tryptic soy agar (TSA, Merck, containing 15 g/L agar, 20 g/L casein peptone, 5 g/L NaCl) and cultured aerobically at 37 °C for 24 hours. Cultures were maintained by bi-weekly subculturing on TSA. Single colonies were then inoculated into 100 mL sterile flasks containing 25 mL TSB as seed medium at 37 °C, 250 rpm for 8 h. The OD600 of the cultures was adjusted to 1.0 with a UV-Vis spectrophotometer (BioTek Epoch 2 Microplate Spectrophotometer, USA). The γ-PGA production was conducted in 300 mL Erlenmeyer flask with a total fermentation volume of 50 mL comprising the γ-PGA production medium (49mL) and 2% inoculum (1mL, OD600 = 1). A negative control (no inoculum) was added to confirm no false-positive turbidity. The modified γ-PGA production medium E consisting of 80 g/L glucose, 30 g/L l-glutamic acid, 8 g/L NH4Cl, 1 g/L K2HPO4, 1 g/L MgSO4·7H2O, 1 g/L ZnSO4·7H2O 0.02 g/L FeCl3·6H2O, 0.2 g/L CaCl2·2H2O and 0.2 g/L MnSO4·H2O, pH 7) was used for screening [27]. The fermentation was conducted at 37 °C, 250 rpm, 120h with aliquots (1mL) drawn daily to determine the γ-PGA titre. All fermentation was carried out in triplicate, and the average values were recorded.
2.2. Effect of Nitrogen and Carbon Sources on γ-PGA Production in B.licheniformis DPC6338
To study the effects of different nitrogen sources, NH4Cl in the screening medium was replaced individually with various inorganic (NaNO3, NH4NO3, urea) and organic (peptone, yeast extract, tryptone and casein hydrolysate) nitrogen sources at 5 g/l respectively and compared against a control (No nitrogen). The nitrogen source that resulted in the maximum production of γ-PGA was used for subsequent experiments.
The effects of different carbon sources on the production of γ-PGA were tested by individually replacing glucose with sucrose, maltose, lactose, fructose, xylose, mannose, and glycerol at 60 g/L and keeping the other components in the fermentation medium at the same levels. The carbon source supporting the maximum production of γ-PGA was selected for further study.
2.3. Determination of Significant Medium Components Using Fractional Factorial Design
A two-level fractional factorial design (FFD, 210−5) was employed to identify significant medium components influencing poly-γ-glutamic acid (γ-PGA) production by B. licheniformis DPC6338. Ten components (glucose, glutamic acid, citric acid, tryptone, K2HPO4, MgSO4·7H2O, FeCl3·6H2O, CaCl2·2H2O, MnSO4·H2O, ZnSO4·7H2O) were screened at two levels (low, −1; high, +1).(Table 1)
The FFD was generated by Minitab 22 (Minitab LLC, USA) and comprised 68 runs (Table 2) including four center points and two replicates, providing a Resolution IV design that permits unbiased estimation of main effects in the presence of two-factor interactions. Fermentations were performed in 300 mL Erlenmeyer flasks containing 50 mL of production medium under shaking at 37 °C and 250 rpm for 24 h. γ-PGA titres were quantified with the CTAB assay (see Section 2.7). The experimental data obtained from the fractional factorial design experiments were analysed using multiple linear regression to fit a first-order polynomial model that included main and two-factor interaction effects. The independent variables were coded at two levels (–1 and +1) corresponding to the low and high levels of each factor. The general model in coded form is expressed as:
where Y is the measured response (γ-PGA titre), Xi represents the coded independent variables, β0 is the intercept, βi are the linear coefficients, βij represent the two-factor interactions, and ε is the experimental error term.
Factorial regression and analysis of variance (ANOVA) were performed in Minitab 22 and factors with p < 0.05 were considered significant.
2.4. Optimisation of the Concentration of Medium Components for γ-PGA Production in B.licheniformis DPC6338 Using Central Composite Design (CCD)
Based on FFD results, glutamic acid (40 – 80 g/L), glucose (50 – 100 g/L), and tryptone (12 – 36 g/L) were selected as key components for optimization. A central composite design (CCD) with three factors and five coded levels (−α, −1, 0, +1, +α; α = 1.68179) was constructed using Minitab 22. The experimental domain for each factor was determined from the FFD response surface. Twenty runs (8 factorial, 6 axial, 6 center points) were executed in one block, with each run duplicated to estimate pure error. γ-PGA titres were recorded as before. Data were analysed using a quadratic response-surface model. Residual analysis showed non-normality in one extreme observation; therefore, a Box–Cox transformation (λ = 2.54, rounded to 3) was applied to stabilize variance and improve model fit. Model adequacy was assessed using R2, adjusted R2, predicted R2, and the lack-of-fit test.
2.5. Determination of Culture Conditions Using OFAT
The effect of temperature (24 – 45 °C), pH (4 – 9) and inoculum concentration (1 – 10% v/v) on γ-PGA titre was determined using OFAT experimental design. All fermentations were conducted in a 300 mL shake flask containing 50mL media, 250 rpm. One parameter was varied at a time while others were maintained at standard conditions. Each experiment was performed in triplicate. γ-PGA titre and cell growth were determined at the end of the cultivation period as described in Section 2.7.
2.6. Bioreactor Experiments
Bioreactor experiment was conducted using the Applikon MiniBio 200 mL bioreactor (Getinge AB, Gothenburg, Sweden). The fermentation was done using 150 mL of the optimised medium, 42 °C, pH 7, 72 – 120h h, 2 vvm air, 250 rpm stirring which was ramped up to 500 rpm after 24 hours to keep the dissolved oxygen constant in the viscous broth. Antifoam was added to the fermentation medium while pH was controlled with 1M NaOH and 1M HCL.
2.7. Analytical Methods
2.7.1. Purification of γ-PGA
γ-PGA was purified by the ethanol precipitation method [28]. The fermentation broth was diluted with equal volume of water to reduce the viscosity. The diluted fermentation broth was centrifuged at 13000g for 20 mins to separate the cells from the crude fermentation product presumed to be γ-PGA. Then, 3 – 4 volumes of cold ethanol was poured into the cell free supernatant containing γ-PGA and kept at 4 °C for 12 h with stirring. The precipitate obtained was dissolved in distilled water, dialysed overnight (Sigma Aldrich, D9652, MW cutoff 14000) and lyophilised. The purified γ-PGA was resolubilised and quantified spectrophotometrically using the CTAB assay or with gel permeation chromatography.
2.7.2. Quantitative Determination and Characterisation of γ- PGA Produced by Bacillus licheniformis DPC 6338
For CTAB assay, 0.1 mL of the re-solubilised γ-PGA solution was mixed with 0.2 mL CTAB (0.02 M CTAB in 2% NaOH solution) and held at room temperature for 5 min. The γ-PGA titre was determined by measuring the turbidity of the mixture at 400 nm and comparing the results with a standard curve that had been prepared using a pure γ-PGA standard (γ-PGA sodium salt, sigma Aldrich, No. G1049 and P4886) [29].
The concentration and molecular weight of γ-PGA was determined by gel permeation chromatography (GPC) and a refractive-index detector as detailed previously [24].
2.7.3. Other Analytical Methods
Cell growth in the fermentation broth was determined by measuring the dry cell weight DCW. The concentration of L-glutamic acid remaining in the culture was measured with L-Glutamic Acid Assay Kit (Megazyme by Neogen, Ireland Sku 700004301). The concentration of glucose was quantified using HPLC equipped with an RI detector (Waters Alliance 2414, Germany) and Rezex ROA-Organic (Phenomenex, Ireland) with the following conditions: oven temperature (60 °C), detector temperature (35 °C), 0.005N H2SO4 as mobile phase (0.5 mL/min).
3. Results and Discussion
3.1. Effect of Nitrogen and Carbon Source on Biomass Growth and PGA Titre
Nine nitrogen sources (4 organic and 4 inorganic nitrogen and no-nitrogen) were evaluated over a 96-h cultivation period to elucidate their effects on cell growth and γ-PGA production by B.licheniformis DPC6338 (Figure 1). The results revealed that the type of nitrogen source profoundly affected γ-PGA synthesis, whereas cell growth was less sensitive to these variations. Among the nitrogen sources tested, tryptone yielded the highest γ-PGA titre, reaching approximately 55 g/L after 72 h, followed closely by yeast extract (YE) and casein hydrolysate (CH). Soy peptone (SP) and urea also supported moderate production, while inorganic nitrogen sources such as NaNO3, NH4Cl, and (NH4)2SO4 led to markedly lower γ-PGA titres (<20 g/L). The nitrogen-free control produced negligible amounts of γ-PGA, confirming nitrogen’s critical role in biosynthesis. Interestingly, dry cell weight (DCW) values were relatively consistent (15–25 g/L) across all nitrogen sources, suggesting that γ-PGA production is not directly proportional to biomass formation. Similar observation was reported in the study of Cheng et al. [30]. The observed decoupling between cell growth and product synthesis implied that γ-PGA production in B. licheniformis is a partially growth-associated process, dependent on specific nitrogen metabolism rather than overall cellular proliferation. The observation in this study that Bacillus licheniformis DPC6338 exhibits a strong preference for organic nitrogen sources such as tryptone, yeast extract, and casein hydrolysate for higher γ-PGA titre is consistent with the literature. Guo, Lu, Wang, Zhang, Wang, Zhao, Zheng and Qiao [16] reported that adding (NH4)2SO4 to sugarcane molasses substrate had no effect on the γ-PGA yield in B. licheniformis CGMCC NO. 23967, but adding 4 g/L yeast extract gave the highest γ-PGA production (42.697 g/L) and maintained favourable cell growth conditions. The maximum γ-PGA production using B. licheniformis NRC20 was recorded using l-glutamic acid and yeast extract while moderate γ-PGA production was found in medium containing NH4NO3, NaNO3, peptone and NH4Cl as nitrogen source. In one study of γ-PGA fermentation by Bacillus sp. FBL-2, yeast extract showed the highest production of γ-PGA and peptone resulted in the highest cell growth while inorganic nitrogen sources such as ammonium sulphate and ammonium chloride could not support γ-PGA synthesis and cell growth [31]. It is however noteworthy that several other studies have indicated that their γ-PGA producing strains showed preference for inorganic nitrogen sources [21,27,32,33,34]. This mixed outlook highlight the strain dependent nitrogen requirement of γ-PGA producers. The superior performance of organic nitrogen sources, particularly tryptone and YE, observed in our study may be attributed to their complex composition of peptides, amino acids, and growth factors, which serve as precursors and cofactors in glutamate biosynthesis. These compounds likely facilitate intracellular glutamate accumulation and provide metabolic signals conducive to γ-PGA synthetase (pgsBCA) activation leading to higher yields than observed with simple inorganic nitrogen salts.
Eight carbon sources were tested for their effect on γ-PGA production by B.licheniformis DPC6338. Gluose gave the highest γ-PGA titre followed by fructose and sucrose (Figure 2). Moderate γ-PGA production was observed using mannose and maltose as carbon source while γ-PGA yield using glycerol was poor compared to other sources. Although B.licheniformis DPC6338 was isolated from dairy, lactose did not support cell growth and γ-PGA production. On the other hand, xylose could only support cell growth but not γ-PGA production
Glucose and fructose have also been reported to be a better carbon source than sucrose, maltose, lactose and xylose for γ-PGA production by B. licheniformis NRC20 [22] and B. licheniformis A14 [26]. Nonetheless, studies elucidating the effect of carbon sources on γ-PGA production have also shown a strain-dependent pattern. For instance, in B. siamensis SB1001, the maximum γ-PGA was produced with sucrose followed by glycerol and glucose while fructose, maltose and xylose were good for cell growth but had almost no effect on the γ-PGA production [35]. Sucrose was the best carbon source for γ-PGA production In B. subtilis ZJU-7 [36] and Bacillus sp. FBL-2 [31]. In B. licheniformis NCIM 2324, glycerol supported maximum PGA production of 6.81 g/l, while glucose supported maximum production of DCW, but resulted in comparatively low PGA production [27]. Glucose and tryprone supported maximum γ-PGA production in this study and were used further.
3.2. Screening of Significant Medium Components Using Fractional Factorial Design (FFD)
A two-level fractional factorial design (FFD, 210−6) was employed to identify the most influential medium components affecting poly-γ-glutamic acid (PGA) production. Ten factors — Glutamic acid (A), Citric acid (B), Glucose (C), Di-potassium phosphate (D), MgSO4·7H2O (E), FeCl2·4H2O (F), ZnSO4·7H2O (G), MnSO4·4H2O (H), CaCl2·2H2O (J), and Tryptone (K) were evaluated, and the corresponding response variable was the γ-PGA titre (g/L) (Table 2).
The experimental data were fitted to a first-order polynomial model with two-factor interaction terms. The ANOVA results (Table 3) indicated that the model was highly significant (F = 246.02, p < 0.0001), demonstrating that the selected factors adequately explained the variability in γ-PGA production. The model showed excellent goodness-of-fit, with R2 = 99.56%, Adjusted R2 = 99.15%, and Predicted R2 = 98.37%, confirming the reliability of the model for prediction and interpretation. The lack-of-fit was not significant (p > 0.05), implying that the model accurately represented the experimental data. All linear terms were significant except for FeCl2·4H2O (D). The interaction coefficients further reveal the complex interplay among medium components. Strong positive interactions were observed for A × G, A × K, C × E, and D × F, showing that the combined presence of these components enhances γ-PGA production beyond their individual contributions. The curvature term was significant (p < 0.001), suggesting that the response surface is not strictly linear and that higher-order effects may exist. This reflects slight nonlinearity in the factor – response relationship and justifies the inclusion of center points in the design. The center point replicates were consistent, providing a reliable estimate of pure error (MS = 0.34). Overall, the ANOVA results confirm that both main effects and selected two-factor interactions significantly contributed to γ-PGA production, and the model provides an excellent statistical fit.
The regression equation in coded variables was expressed as:
Y = 6.5916 + 4.4663A – 0.8686B + 0.9398C + 0.5509D – 0.2446E – 0.1470F + 0.3994G + 0.9019H – 0.2617J + 2.7805K – 0.5513AB + 0.4692AC + 0.2336AD – 0.1047AE – 0.5666AF + 0.4921AG + 1.6371AH – 0.6172AJ + 1.3687AK + 1.1101BC + 0.2262BD + 0.0337BE – 0.0230BF – 0.1534BG + 0.5744BH + 0.7861CD – 0.0750CE – 0.0827CF – 1.0726CG + 0.6889DE + 1.1978DF + 2.104(CtPt)
where Y is the predicted PGA titre (g/L), and A–K are the coded levels (–1 and +1) of the respective medium components.
Table 4 presents the coded regression coefficients, their standard errors, t-statistics, and p-values, enabling quantitative assessment of the magnitude and direction of each effect. Factors identified as statistically significant in the ANOVA (Table 3) were consistent with their corresponding regression coefficients, which further clarified the direction and strength of each effect. Among the linear terms, Glutamic acid (A) and Tryptone (K) exhibited the largest positive effects (p < 0.001), indicating that increasing their concentrations substantially enhanced γ-PGA production. Glutamic acid serves as both a substrate and a precursor for γ-glutamyl linkage formation, while Tryptone provides peptides and amino nitrogen essential for bacterial growth and enzymatic activity. These findings are consistent with previous reports highlighting glutamate and complex nitrogen sources as key determinants for γ-PGA biosynthesis [37]. Other positively contributing factors included Glucose (C), K2HPO4 (D), MnSO4·4H2O (H), and ZnSO4·7H2O (G), all significant at p < 0.05. Glucose likely supported energy, biomass growth and cofactor supply for γ-glutamyl ligase activity, whereas Mn2+ and Zn2+ ions are known to act as cofactors enhancing enzyme stability and productivity [38]. Conversely, Citric acid (B), MgSO4·7H2O (E), CaCl2·2H2O (J), and FeCl2·4H2O (F) showed negative coefficients, implying inhibitory or non-beneficial effects when their concentrations were elevated. In particular, excess Fe2+ or Ca2+ may interfere with metabolic enzyme activities or cause ionic stress in the culture broth, reducing γ-PGA yield [38].
Several two-factor interactions were also significant (p < 0.05), reflecting synergistic or antagonistic relationships among medium components. Strong positive interactions were observed between: Glutamic acid × MnSO4·4H2O (AH, β = +1.6371), Glutamic acid × Tryptone (AK, β = +1.3687), Citric acid × Glucose (BC, β = +1.1101), K2HPO4 × FeCl2·4H2O (DF, β = +1.1978). These suggest that the beneficial effect of one factor depends on the presence or optimal level of another. For instance, the synergism between glutamate and Mn2+ may reflect metal ion–mediated activation of enzymes involved in PGA synthesis. Negative interactions, such as Glutamic acid × CaCl2·2H2O (AJ, β = –0.6172) and Glucose × ZnSO4·7H2O (CG, β = –1.0726), indicated potential antagonistic effects, where high concentrations of both components simultaneously reduced PGA yield.
The Pareto chart above (Figure 3) visually summarized the relative influence of all factors and their interactions. The effects exceeding the Bonferroni limit (p < 0.05) were considered significant. Glutamic acid (A), Tryptone (K), MnSO4·4H2O (H), and Glucose (C) were the dominant variables, confirming the statistical findings from the regression and ANOVA analyses. These results clearly demonstrate that the combination of carbon, nitrogen, and specific metal ions is critical for achieving high PGA titres, aligning with known metabolic pathways of Bacillus subtilis strains.
The center point (CtPt) effect was significant (p < 0.001), suggesting mild curvature in the response surface, possibly due to non-linearity in the influence of glutamic acid and tryptone concentrations. This finding justified further optimization using a second-order design such as Response Surface Methodology (RSM). To determine if the components with significant negative linear effects (citric acid, MgSO4.7H2O, and CaCl.2H2O) were truly necessary for the process at all, or if they were only inhibitory at the tested concentrations, a one-off experiment was conducted. The experimental media comprised only the factors with a significant positive effect (glutamic acid, glucose, K2HPO4, ZnSO4.7H2O, MnSO4.4H2O, tryptone at their high levels from the screening experiment, as those conditions produced the highest yields. No microbial growth or PGA production was observed after 24h hours with this medium indicating that these components with significant negative linear effects (citric acid, MgSO4.7H2O, and CaCl.2H2O) were necessary for γ-PGA biosynthesis but in lower concentrations.
3.3. Optimisation of Medium Composition with Central Composite Design CCD
Based on the results from the fractional factorial design (FFD), three significant factors: glutamic acid (A), tryptone (B), and glucose (C) were selected for further optimization of poly-γ-glutamic acid (PGA) production using a Central Composite Design (CCD) under Response Surface Methodology (RSM). The CCD consisted of 20 experimental runs, combining factorial, axial, and center points to estimate curvature and model adequacy. The experimental design matrix and observed responses are presented in Table 5
A second-order polynomial model was fitted to the response data, and the regression equation in coded terms for the untransformed response is expressed as:
Y = 23.491 + 1.304A + 1.019B − 0.210C − 1.636A2 − 0.715B2 + 0.282C2 + 0.055AB − 0.323AC − 0.440BC
where Y represents the predicted PGA titre (g/L), and A, B, and C are the coded levels of glutamic acid, tryptone, and glucose, respectively.
The ANOVA results (Table 6) indicate that the quadratic model was statistically significant (p = 0.001), with an F-value of 8.31, confirming that the model adequately represents the relationship between the factors and PGA titre. Among the model terms, the linear effects of glutamic acid (p = 0.001) and tryptone (p = 0.006) were significant, while glucose had no significant effect (p = 0.488). Significant quadratic effects were observed for glutamic acid2 (p = 0.000) and tryptone2 (p = 0.031), indicating curvature in the response surface. The two-way interaction terms were not statistically significant (p > 0.05), implying minimal synergistic interactions between factors within the design range. The CCD response surface analysis (pre-transformation) revealed that both glutamic acid and tryptone had significant positive linear effects and negative quadratic terms, indicating that increasing their concentrations beyond a point decreased yield (Table 6). Glucose had no significant effect on γ-PGA titre, although it supports biomass growth. The initial model explained 88.2% of the total variance (R2adj = 77.6%). However, the predictive power was poor (R2pred = 17.2%) and the lack-of-fit was significant (p = 0.017).
A Box–Cox transformation was performed to improve model fit and normality of residuals. The optimal lambda (λ) was 2.54, suggesting a cubic transformation of the response. The transformed model improved the adjusted R2 (77.68%) and predicted R2 (55.50%), indicating enhanced predictability and the lack-of-fit became insignificant (p = 0.072). This confirmed that transformation corrected model bias and stabilized residuals. Only glutamic acid and tryptone remained statistically significant, while glucose was excluded from the final model. The ANOVA for the transformed response (Table 7) confirmed the significance of glutamic acid, tryptone, and their quadratic terms (p < 0.05).
The 3D response surface and contour plots (Figure 4) reveal the combined effect of glutamic acid and tryptone on γ-PGA production. The response surface exhibits a dome-shaped curvature, suggesting that γ-PGA titre increases with increasing concentrations of glutamic acid and tryptone up to an optimal region, after which a decline occurs. This confirms the significance of the quadratic terms. Glucose had negligible effect on the response surface curvature, consistent with its nonsignificant model term.
3.4. Numerical Optimization and Validation
Numerical optimization using Minitab’s response optimizer identified the optimal medium composition for maximum γ-PGA production as 67.13 g/L glutamic acid and 32.36 g/L tryptone, predicting a γ-PGA titre of 24.13 g/L with a composite desirability of 0.897. Although the response optimizer predicted a maximum γ-PGA titre of 24.13 g/L at the optimal medium composition, experimental validation resulted in a substantially higher titre of 34.10 ± 0.55 g/L. This difference can be attributed to the modest predictive R2 (55%), which indicates limited accuracy when forecasting new observations. The statistical model therefore underestimated the true response near the optimum. In addition, biological fermentation systems often exhibit nonlinear behaviour and complex interactions that are not fully captured by second-order RSM models. Nevertheless, the optimization successfully guided the process toward a region of enhanced productivity, demonstrating the practical value of the approach even when predictive the R2 was moderate. The optimised medium for efficient γ-PGA production by B. licheniformis DPC6338 was 32 g/L Tryptone, 67 g/L Glutamic acid, 5 g/L Citric acid, 75 g/L Glucose, 2 g/L Di-potassium phosphate, 0.5 g/L MgSO4·7H2O, 0.02 g/L FeCl2·4H2O, 0.5 g/L ZnSO4·7H2O, 0.5 g/L MnSO4·4H2O and 0.1 g/L CaCl2·2H2O. The high glutamic acid and tryptone requirement observed in our study is not unique to B. licheniformis DPC6338. For instance, the optimal medium for efficient γ-PGA production by B. subtilis ZJU-7: was 59.80 g/L sucrose, 53.54 g/L tryptone, 81.05 g/L L-glutamic acid, 10 g/L NaCl, 1.0 g/L MgSO47H2O, and 1.0 g/L CaCl2, [36]. Similarly, the optimal medium for γ-PGA production by Bacillus sp. FBL-2 was 51.73 g/l sucrose, 105.30 g/l L-glutamic acid, 13.25 g/l yeast extract, and 10.04 g/l citric acid [31]. The optimum media for B. subtilis MJ80 was 70 g/L glutamic acid, 30 g/L starch, 7 g/L urea, 12 g/L citric acid, 80 g/L glycerol, 0.5% NaCl, 0.05% K2HPO4, 0.025% MgSO4·7H2O, 0.005% MnSO4·5H2O, 0.015% CaCl2, and 0.004% FeCl3 [39].
3.5. Effect of Culture Conditions Using OFAT
3.5.1. Effect of Inoculum Concentration
Figure 5. illustrates the influence of inoculum size on γ-PGA titre production during batch fermentation. Maximum γ-PGA titre was obtained at 48h, and the highest PGA titres were observed at 1%, 8%, and 10% inocula, yielding 57.60 ± 4.23 g/L, 53.26 ± 0.91 g/L, and 57.18 ± 7.46 g/L, respectively. These values were substantially higher than those obtained with 2% (42.28 ± 0.35 g/L) and 4% (44.14 ± 0.30 g/L) inocula, confirming that intermediate inoculum sizes were suboptimal for maximal γ-PGA synthesis. Notably, the 1% and 10% inocula produced statistically comparable peak titres, although the variability at 10% was considerably higher.
The effect of the inoculum in this study was more pronounced in the rate of decline post-peak production (Figure 5). Lower inoculum concentration (1% > 2% > 4%) showed less loss in γ-PGA titre at 72 – 96 h while 8% and 10% inocula declined significantly. These findings are consistent with previous reports that high inoculum densities enhance early γ-PGA production but may negatively affect product stability during extended fermentation due to metabolic stress and nutrient competition [40]. Overall, the non-linear response obtained in this study suggests that γ-PGA production is not directly proportional to inoculum size but more linked to product degradation after peak production. A similar observation that inoculum concentration was not a significant factor influencing γ-PGA production in Bacillus licheniformis has been reported previously [41,42]. Nonetheless, inoculum concentration between 1 – 15% have been used in most studies [21,39,43,44]. In this study, the 1% inoculum exhibited a more balanced production profile and was used for further studies.
3.5.2. Effect of pH
pH is a significant factor that influences the physiology of a microorganism by affecting nutrient solubility and uptake, enzyme activity, cell membrane morphology, by-product formation and oxidative-reductive reactions. The best pH was chosen after a 48h fermentation time. An initial pH of 6.5 – 7 supported maximum PGA and biomass production (Figure 6). This is consistent with previous studies which show that optimum pH range for γ-PGA fermentation was pH 6 – 7 [31,45].
3.5.3. Effect of Temperature
Temperature is a critical environmental factor influencing microbial growth, enzymatic activity, and metabolic flux, all of which directly affect γ-PGA biosynthesis.
The effect of temperature on γ-polyglutamic acid (γ-PGA) production was evaluated over a fermentation period of 120 h at different incubation temperatures (24 – 45 °C) (Figure 7). At lower temperatures (24 and 27 °C), γ-PGA production remained consistently low throughout the fermentation, with concentrations not exceeding 10 g/L. These conditions resulted in slow production kinetics and limited polymer accumulation. Moderate temperatures (30 – 36 °C) supported improved γ-PGA synthesis, with concentrations gradually increasing over time and reaching intermediate maximum values between 40 and 60 g/L, depending on the incubation period. The highest γ-PGA concentrations were observed at elevated temperatures, particularly at 39 and 42 °C. Among all conditions tested, incubation at 42 °C resulted in the maximum γ-PGA production, with a peak concentration of approximately 70 g/L observed around 72 h of fermentation. Production at this temperature showed rapid accumulation during the early and mid-exponential phases, followed by a gradual decline at extended incubation times. At 45 °C, although γ-PGA synthesis occurred, the maximum yield was lower than that observed at 42 °C, indicating that excessively high temperatures negatively affected polymer production. Overall, the results indicate that γ-PGA production is strongly temperature-dependent, with 42 °C identified as the optimal temperature under the conditions tested in this study. Previous studies have shown that the optimum temperature for γ-PGA production is strain-dependent with most strains typically achieving optimal production between 30 and 37 °C. However, certain strains have demonstrated superior γ-PGA yields at higher temperatures of 40 – 50 °C [23,43,46,47].
3.6. Production of γ-PGA Under Optimised Conditions at Shake Flask and Bioreactor Scale
γ-PGA fermentation was conducted under optimum medium and culture conditions for 96h with 24hr sampling. A maximum γ-PGA titre of 75 ± 0.38 g/L was obtained after 96h fermentation. However, peak average productivity of 1.3 g/L/h occurred at 48 h and declined steadily even though titre continues to increase (Figure 8). This was indicative of early high production rate followed by slower accumulation.
The pronounced decline in γ-PGA productivity after 48 was likely attributable to nutrient depletion, increased broth viscosity limiting oxygen transfer, and metabolic stress during extended fermentation, despite continued polymer accumulation. Glucose was totally depleted within 48h while about 67% and 86% of the glutamate in the medium was consumed at 48h and 96h respectively (Figure 8).
Interval productivity analysis revealed that γ-PGA synthesis was most rapid during the first 48 h, with productivities of 1.31 ± 0.08 and 1.29 ± 0.09 g/L·h for the 0 – 24 h and 24 – 48 h intervals, respectively. Thereafter, productivity declined 4-fold to 0.30 ± 0.05 g/L·h between 48 and 72 h and further to 0.24 ± 0.04 g/L·h between 72 and 96 h, indicating reduced production efficiency during prolonged cultivation (Table 8).
During strain screening, DPC6338 produced approximately 60 g/L γ-PGA within 48 – 96 h. Therefore, the maximum γ-PGA titre of 75.35 g/L obtained under optimised conditions represents a ~27% improvement in titre. Volumetric productivity at 48 h also increased modestly from ~1.25 to 1.30 g/L·h (~ 4%), indicating that the optimization enhanced both the final product accumulation and the production rate which further validated the efficacy of the RSM optimisation.
Figure 9.
γ-PGA production under bioreactor conditions.
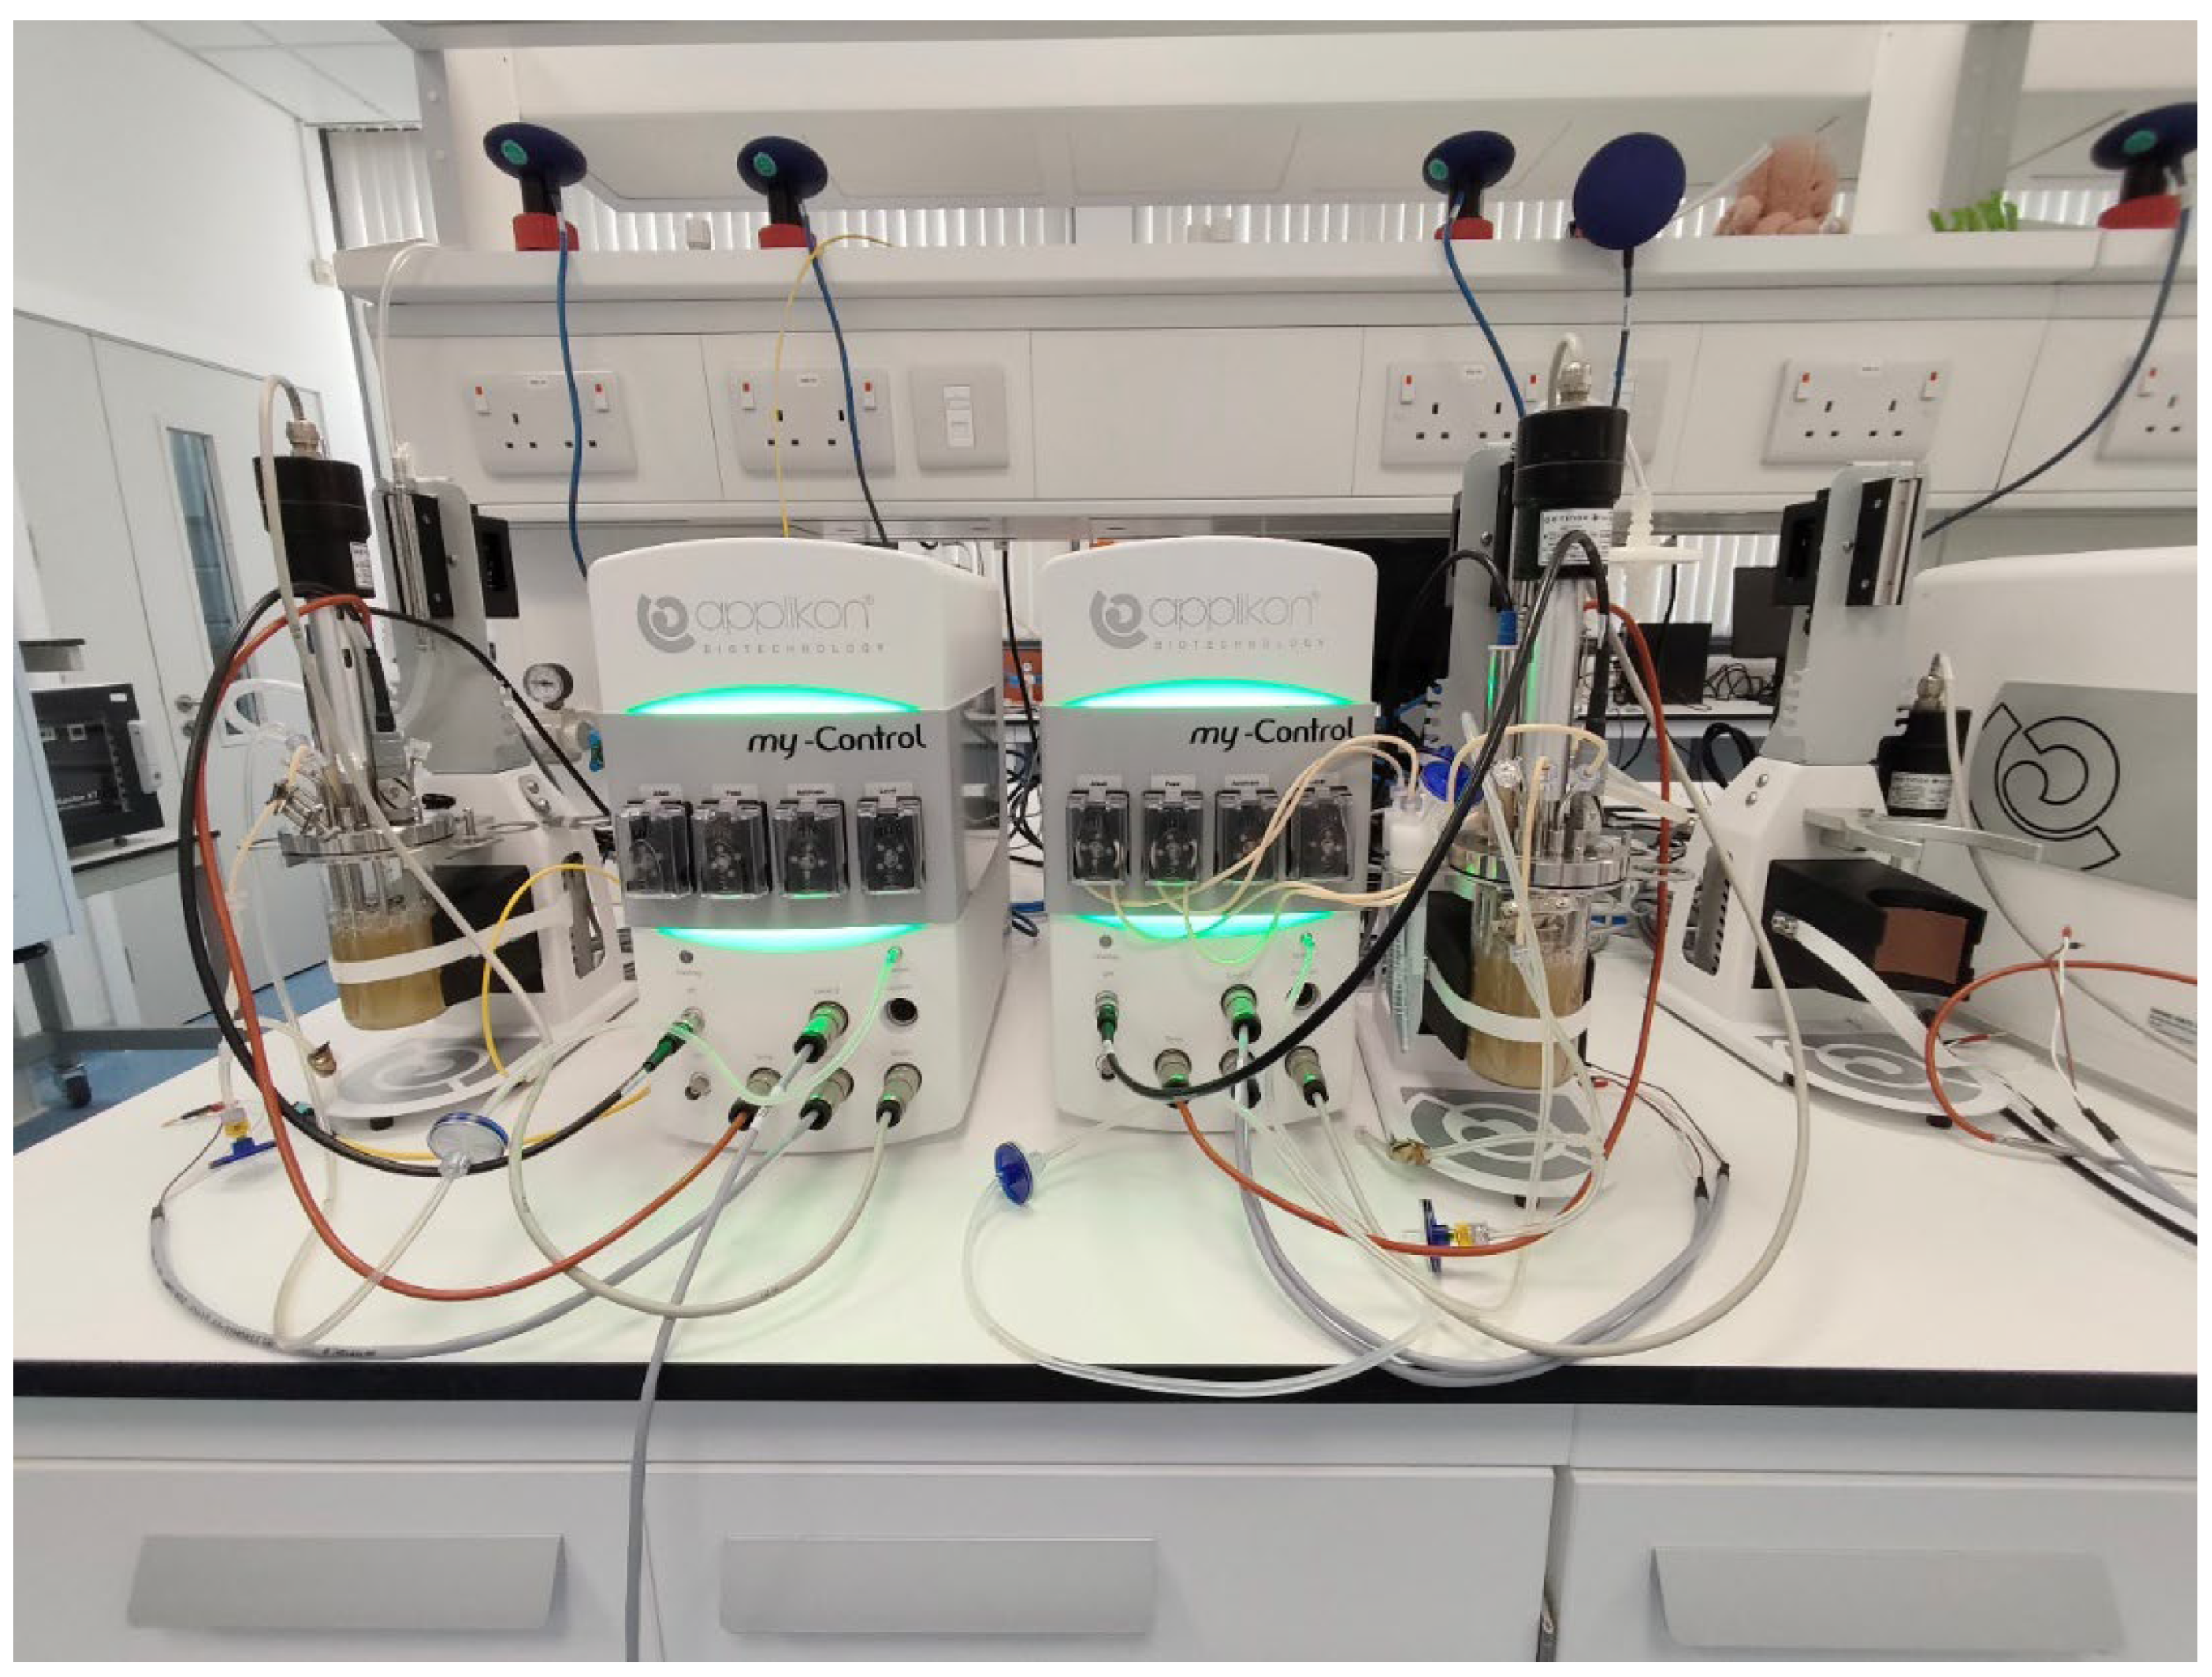

Table 9.
γ-PGA titre and productivity under bioreactor conditions.
| Screening medium | Optimised medium | |||
|---|---|---|---|---|
| Time (h) | γ-PGA titre g/L |
γ-PGA productivity g/L/h | γ-PGA titre g/L | γ-PGA productivity g/L/h |
| 24 | 54.91 ± 4.11 | 2.29 | 56.25 ±4.17 | 2.34 |
| 48 | 84.08 ± 5.19 | 1.75 | 81.36 ± 3.92 | 1.70 |
Scale-up to bioreactor conditions significantly enhanced γ-PGA production compared to shake-flask cultivation, resulting in a ~30% increase in the final titre and up to ~80% higher early-phase volumetric productivity. While the optimised medium showed marginally higher productivity at 24 h, the screening medium achieved a slightly higher final γ-PGA concentration. The difference in the performance of the screening and optimised medium under bioreactor conditions may be attributed to newer variables such as aeration, faster agitation, pH control at play under bioreactor conditions [27,48]. These factors have been shown to impact yield and molecular weight in bioreactor-based γ-PGA fermentation and highlights the need for further optimisation at bioreactor scale.
The candidate strain in this study B.licheniformis DPC6338 achieved higher or comparable titres (~75–84 g/L) and productivities up to ~1.7 g/L·h, outperforming many previously reported γ-PGA producing Bacillus strains in both titres and rates under shake-flask and small-scale bioreactor conditions (Table 10).
4. Conclusion
Overall, the results obtained from this study highlight the capacity of B. licheniformis DPC6338 for industrial γ-PGA production. Optimisation at bioreactor scale may further improve the yield. Bioprospecting for other metabolites may further enhance the industrial relevance of this strain.
Author Contributions
Somiame Itseme Okuofu: Conceptualization, Methodology, Validation, Formal analysis, Investigation, Writing - Original Draft, Visualization. Vincent O’Flaherty: Resources, Writing - Review & Editing, Supervision, Funding acquisition. Olivia McAuliffe: Resources, Writing - Review & Editing, Supervision, project administration, Funding acquisition. All authors have read and agreed to the published version of the manuscript.
Funding
This research was funded by the Department of Agriculture, Food and the Marine, Grant No. 2019PROG731.
Institutional Review Board Statement
Not applicable.
Informed Consent Statement
Not applicable.
Data Availability Statement
The original contributions presented in this study are included in the article material. Further inquiries can be directed to the corresponding author(s).
Acknowledgments
The authors thank Dr John Leech of the Bioprocess Innovation Suite at Teagasc Food Research Centre Moorepark for technical help with the bioreactor scale studies.
Conflicts of Interest
The authors declare no conflict of interest.
References
- Murakami, S.; Aoki, N.; Matsumura, S. Bio-based biodegradable hydrogels prepared by crosslinking of microbial poly (γ-glutamic acid) with L-lysine in aqueous solution. Polymer journal 2011, 43, 414-420. [CrossRef]
- Moradali, M.F.; Rehm, B.H. Bacterial biopolymers: from pathogenesis to advanced materials. Nature Reviews Microbiology 2020, 18, 195-210. [CrossRef]
- Ogunleye, A.; Bhat, A.; Irorere, V.U.; Hill, D.; Williams, C.; Radecka, I. Poly-γ-glutamic acid: production, properties and applications. Microbiology 2015, 161, 1-17. [CrossRef]
- Nair, P.; Navale, G.R.; Dharne, M.S. Poly-gamma-glutamic acid biopolymer: A sleeping giant with diverse applications and unique opportunities for commercialization. Biomass Conversion and Biorefinery 2023, 13, 4555-4573. [CrossRef]
- Luo, Z.; Guo, Y.; Liu, J.; Qiu, H.; Zhao, M.; Zou, W.; Li, S. Microbial synthesis of poly-γ-glutamic acid: current progress, challenges, and future perspectives. Biotechnology for Biofuels 2016, 9, 134. [CrossRef]
- Okuofu, S.I.; O’Flaherty, V.; McAuliffe, O. Production of Poly-γ-Glutamic Acid from Lignocellulosic Biomass: Exploring the State of the Art. Biochemical Engineering Journal 2024, 109250. [CrossRef]
- Elbanna, K.; Alsulami, F.S.; Neyaz, L.A.; Abulreesh, H.H. Poly (γ) glutamic acid: A unique microbial biopolymer with diverse commercial applicability. Frontiers in microbiology 2024, 15, 1348411. [CrossRef]
- Yu, Y.; Yan, F.; Chen, Y.; Jin, C.; Guo, J.-H.; Chai, Y. Poly-γ-Glutamic Acids Contribute to Biofilm Formation and Plant Root Colonization in Selected Environmental Isolates of Bacillus subtilis. Frontiers in Microbiology 2016, Volume 7 - 2016. [CrossRef]
- Wei, X.; Pan, Z.; Chen, Z.; He, N. Stress response regulation to extracellular polymeric substances biosynthesis in Bacillus licheniformis. Microbial Cell Factories 2025, 24, 222. [CrossRef]
- Deol, R.; Louis, A.; Glazer, H.L.; Hosseinion, W.; Bagley, A.; Chandrangsu, P. Poly-gamma-glutamic acid secretion protects Bacillus subtilis from zinc and copper intoxication. Microbiology spectrum 2022, 10, e01329-01321. [CrossRef]
- Mark, S.S.; Crusberg, T.C.; Dacunha, C.M.; Di Iorio, A.A. A heavy metal biotrap for wastewater remediation using poly-gamma-glutamic acid. Biotechnol Prog 2006, 22, 523-531. [CrossRef]
- Xue, J.; Tong, T.; Wang, R.; Qiu, Y.; Gu, Y.; Sun, L.; Xu, H.; Lei, P. Secretion of poly-γ-glutamic acid by Bacillus atrophaeus NX-12 enhanced its root colonization and biocontrol activity. Frontiers in Microbiology 2022, Volume 13 - 2022. [CrossRef]
- Sawada, K.; Hagihara, H.; Takimura, Y.; Kataoka, M. Production and molecular weight variation of poly-γ-glutamic acid using a recombinant Bacillus subtilis with various Pgs-component ratios. Biosci Biotechnol Biochem 2024, 88, 1217-1224. [CrossRef]
- Hsueh, Y.H.; Huang, K.Y.; Kunene, S.C.; Lee, T.Y. Poly-γ-glutamic Acid Synthesis, Gene Regulation, Phylogenetic Relationships, and Role in Fermentation. Int J Mol Sci 2017, 18. [CrossRef]
- Wei, X.; Yang, L.; Chen, Z.; Xia, W.; Chen, Y.; Cao, M.; He, N. Molecular weight control of poly-γ-glutamic acid reveals novel insights into extracellular polymeric substance synthesis in Bacillus licheniformis. Biotechnology for Biofuels and Bioproducts 2024, 17, 60. [CrossRef]
- Guo, L.; Lu, L.; Wang, H.; Zhang, X.; Wang, G.; Zhao, T.; Zheng, G.; Qiao, C. Effects of Fe2+ addition to sugarcane molasses on poly-γ-glutamic acid production in Bacillus licheniformis CGMCC NO. 23967. Microbial Cell Factories 2023, 22, 37, . [CrossRef]
- Yamashiro, D.; Yoshioka, M.; Ashiuchi, M. Bacillus subtilis pgsE (Formerly ywtC) stimulates poly-γ-glutamate production in the presence of zinc. Biotechnology and bioengineering 2011, 108, 226-230. [CrossRef]
- Jung, D.-Y.; Jung, S.; Yun, J.-S.; Kim, J.-N.; Wee, Y.-J.; Jang, H.-G.; Ryu, H.-W. Influences of cultural medium component on the production of poly(γ-glutamic acid) byBacillus sp. RKY3. Biotechnology and Bioprocess Engineering 2005, 10, 289-295. [CrossRef]
- Völker, F.; Hoffmann, K.; Halmschlag, B.; Maaß, S.; Büchs, J.; Blank, L.M. Citrate Supplementation Modulates Medium Viscosity and Poly-γ-Glutamic Acid Synthesis by Engineered B. subtilis 168. Engineering in Life Sciences 2025, 25, e70009. https://doi.org/10.1002/elsc.70009.
- Feng, J.; Shi, Q.; Zhou, G.; Wang, L.; Chen, A.; Xie, X.; Huang, X.; Hu, W. Improved production of poly-γ-glutamic acid with low molecular weight under high ferric ion concentration stress in Bacillus licheniformis ATCC 9945a. Process Biochemistry 2017, 56, 30-36. [CrossRef]
- Guo, G.; Wang, H.; Jia, H.; Ni, H.; Xu, S.; Zhang, C.; Zhang, Y.; Wu, Y.; Tu, Q. Production and Characterization of Poly-γ-Glutamic Acid by Bacillus velezensis SDU. Microorganisms 2025, 13, 917. [CrossRef]
- Tork, S.E.; Aly, M.M.; Alakilli, S.Y.; Al-Seeni, M.N. Purification and characterization of gamma poly glutamic acid from newly Bacillus licheniformis NRC20. International Journal of Biological Macromolecules 2015, 74, 382-391. [CrossRef]
- Zeng, W.; Liu, Y.; Shu, L.; Guo, Y.; Wang, L.; Liang, Z. Production of ultra-high-molecular-weight poly-γ-glutamic acid by a newly isolated Bacillus subtilis strain and genomic and transcriptomic analyses. Biotechnology Journal 2024, 19, 2300614. [CrossRef]
- Okuofu, S.I.; Nayak, J.K.; Khan, A.A.; O’Flaherty, V.; McAuliffe, O. NADES pretreatment of ryegrass pressed cake for biosugar and γ–PGA production. Industrial Crops and Products 2025, 237, 122307, . [CrossRef]
- Ebrahimzadeh Kouchesfahani, M.; Bahrami, A.; Babaeipour, V. Poly-γ-glutamic acid overproduction of Bacillus licheniformis ATCC 9945a by developing a novel optimum culture medium and glutamate pulse feeding using different experimental design approaches. Biotechnology and Applied Biochemistry 2024, 71, 565-583. [CrossRef]
- Mahaboob Ali, A.A.; Momin, B.; Ghogare, P. Isolation of a novel poly-γ-glutamic acid-producing Bacillus licheniformis A14 strain and optimization of fermentation conditions for high-level production. Preparative Biochemistry & Biotechnology 2020, 50, 445-452. [CrossRef]
- Bajaj, I.B.; Lele, S.S.; Singhal, R.S. Enhanced production of poly (γ-glutamic acid) from Bacillus licheniformis NCIM 2324 in solid state fermentation. Journal of Industrial Microbiology and Biotechnology 2008, 35, 1581-1581. [CrossRef]
- Manocha, B.; Margaritis, A. A novel Method for the selective recovery and purification of γ-polyglutamic acid from Bacillus licheniformis fermentation broth. Biotechnology progress 2010, 26, 734-742. [CrossRef]
- Halmschlag, B.; Völker, F.; Hanke, R.; Putri, S.P.; Fukusaki, E.; Büchs, J.; Blank, L.M. Metabolic engineering of B. subtilis 168 for increased precursor supply and poly-γ-glutamic acid production. Frontiers in Food Science and Technology 2023, 3, 1111571, . [CrossRef]
- Cheng, C.; Asada, Y.; Aida, T. Production of γ-Polyglutamic Acid by Bacillus licheniformis A35 under Denitrifying Conditions. Agricultural and Biological Chemistry 1989, 53, 2369-2375. [CrossRef]
- Min, J.H.; Reddy, L.V.; Dimitris, C.; Kim, Y.M.; Wee, Y.J. Optimized Production of Poly(γ-Glutamic acid) By Bacillus sp. FBL-2 through Response Surface Methodology Using Central Composite Design. J Microbiol Biotechnol 2019, 29, 1061-1070. [CrossRef]
- Jian, X.; Shouwen, C.; Ziniu, Y. Optimization of process parameters for poly γ-glutamate production under solid state fermentation from Bacillus subtilis CCTCC202048. Process Biochemistry 2005, 40, 3075-3081. [CrossRef]
- Wang, D.; Fu, X.; Zhou, D.; Gao, J.; Bai, W. Engineering of a newly isolated Bacillus tequilensis BL01 for poly-γ-glutamic acid production from citric acid. Microbial Cell Factories 2022, 21, 276. [CrossRef]
- Sun, X.; Cai, Y.; Wang, D. Enhanced Poly-γ-Glutamic Acid Production by a Newly Isolated Bacillus halotolerans F29. J Microbiol 2024, 62, 695-707. [CrossRef]
- Wang, D.; Hwang, J.-S.; Kim, D.-H.; Lee, S.; Kim, D.-H.; Joe, M.-H. A newly isolated Bacillus siamensis SB1001 for mass production of poly-γ-glutamic acid. Process Biochemistry 2020, 92, 164-173. [CrossRef]
- Shi, F.; Xu, Z.; Cen, P. Optimization of γ-polyglutamic acid production by Bacillus subtilis ZJU-7 using a surface-response methodology. Biotechnology and Bioprocess Engineering 2006, 11, 251-257. [CrossRef]
- Zeng, W.; Liang, Z.; Li, Z.; Bian, Y.; Li, Z.; Tang, Z.; Chen, G. Regulation of poly-γ-glutamic acid production in Bacillus subtilis GXA-28 by potassium. Journal of the Taiwan Institute of Chemical Engineers 2016, 61, 83-89. [CrossRef]
- Yang, G.; Chen, J.; Qu, Y.B.; Lun, S.Y. [Effects of metal ions on gamma-poly (glutamic acid) synthesis by Bacillus licheniformis]. Sheng Wu Gong Cheng Xue Bao 2001, 17, 706-709.
- Ju, W.-T.; Song, Y.-S.; Jung, W.-J.; Park, R.-D. Enhanced production of poly-γ-glutamic acid by a newly-isolated Bacillus subtilis. Biotechnology Letters 2014, 36, 2319-2324. [CrossRef]
- Liu, W.; Wang, J.; Gu, L.; Zhou, H.; Cheng, H.; Zha, J.; Yin, D.; Qian, J.; Zheng, P.; Zhang, X.; et al. Coculture Corynebacterium glutamicum and Bacillus licheniformis for producing poly-γ-glutamic acid from glucose. Applied Microbiology and Biotechnology 2025, 109, 259. [CrossRef]
- Youssef, R.M.; Samir, R.; Gomaa, O.M.; ElHifnawi, H.N.; Ramadan, M.A. Production and optimization of polyglutamic acid from Bacillus licheniformis: effect of low levels of gamma radiation. AMB Express 2025, 15, 93. [CrossRef]
- Nair, P.G.; Joseph, E.; Yadav, R.; Rajput, V.; Nisal, A.; Dharne, M.S. Production of poly-gamma-glutamic acid (γ-PGA) from sucrose by an osmotolerant Bacillus paralicheniformis NCIM 5769 and genome-based predictive biosynthetic pathway. Biomass Conversion and Biorefinery 2023. [CrossRef]
- Lin, Y.; Shu, L.; Chen, H.; Duan, X.; Zeng, W. Poly-γ-glutamic acid production from untreated sugarcane molasses by non-sterilized repeated-batch fermentation with Bacillus subtilis GLS-8. Chemical Engineering Journal Advances 2025, 24, 100900. [CrossRef]
- Song, D.; Reddy, L.; Charalampopoulos, D.; Wee, Y. Poly-(Υ-glutamic acid) production and optimization from agro-industrial bioresources as renewable substrates by Bacillus sp. FBL-2 through response surface methodology. Biomolecules 2019, 9. [CrossRef]
- da Silva, S.B.; Cantarelli, V.V.; Ayub, M.A.Z. Production and optimization of poly-γ-glutamic acid by Bacillus subtilis BL53 isolated from the Amazonian environment. Bioprocess and Biosystems Engineering 2014, 37, 469-479. [CrossRef]
- Dong, B.; Hu, Q. Optimization of Fermentation Conditions for γ-PGA Production by Bacillus subtilis QM3. Open Access Library Journal 2024, 11, 1-15. [CrossRef]
- Zeng, W.; Chen, G.; Guo, Y.; Zhang, B.; Dong, M.; Wu, Y.; Wang, J.; Che, Z.; Liang, Z. Production of poly-γ-glutamic acid by a thermotolerant glutamate-independent strain and comparative analysis of the glutamate dependent difference. AMB Express 2017, 7, 213. [CrossRef]
- Zhang, D.; Feng, X.; Li, S.; Chen, F.; Xu, H. Effects of oxygen vectors on the synthesis and molecular weight of poly(γ-glutamic acid) and the metabolic characterization of Bacillus subtilis NX-2. Process Biochemistry 2012, 47, 2103-2109. [CrossRef]
- Zhao, C.; Zhang, Y.; Wei, X.; Hu, Z.; Zhu, F.; Xu, L.; Luo, M.; Liu, H. Production of ultra-high molecular weight poly-γ-glutamic acid with Bacillus licheniformis P-104 and characterization of its flocculation properties. Applied biochemistry and biotechnology 2013, 170, 562-572. [CrossRef]
- Peng, Y.; Jiang, B.; Zhang, T.; Mu, W.; Miao, M.; Hua, Y. High-level production of poly(γ-glutamic acid) by a newly isolated glutamate-independent strain, Bacillus methylotrophicus. Process Biochemistry 2015, 50, 329-335. [CrossRef]
- Ebrahimzadeh Kouchesfahani, M.; Bahrami, A.; Babaeipour, V. Poly-γ-glutamic acid overproduction of Bacillus licheniformis ATCC 9945(a) by developing a novel optimum culture medium and glutamate pulse feeding using different experimental design approaches. Biotechnol Appl Biochem 2024, 71, 565-583. [CrossRef]
Figure 1.
Effect of nitrogen sources on γ-PGA production by B.licheniformis DPC6338.
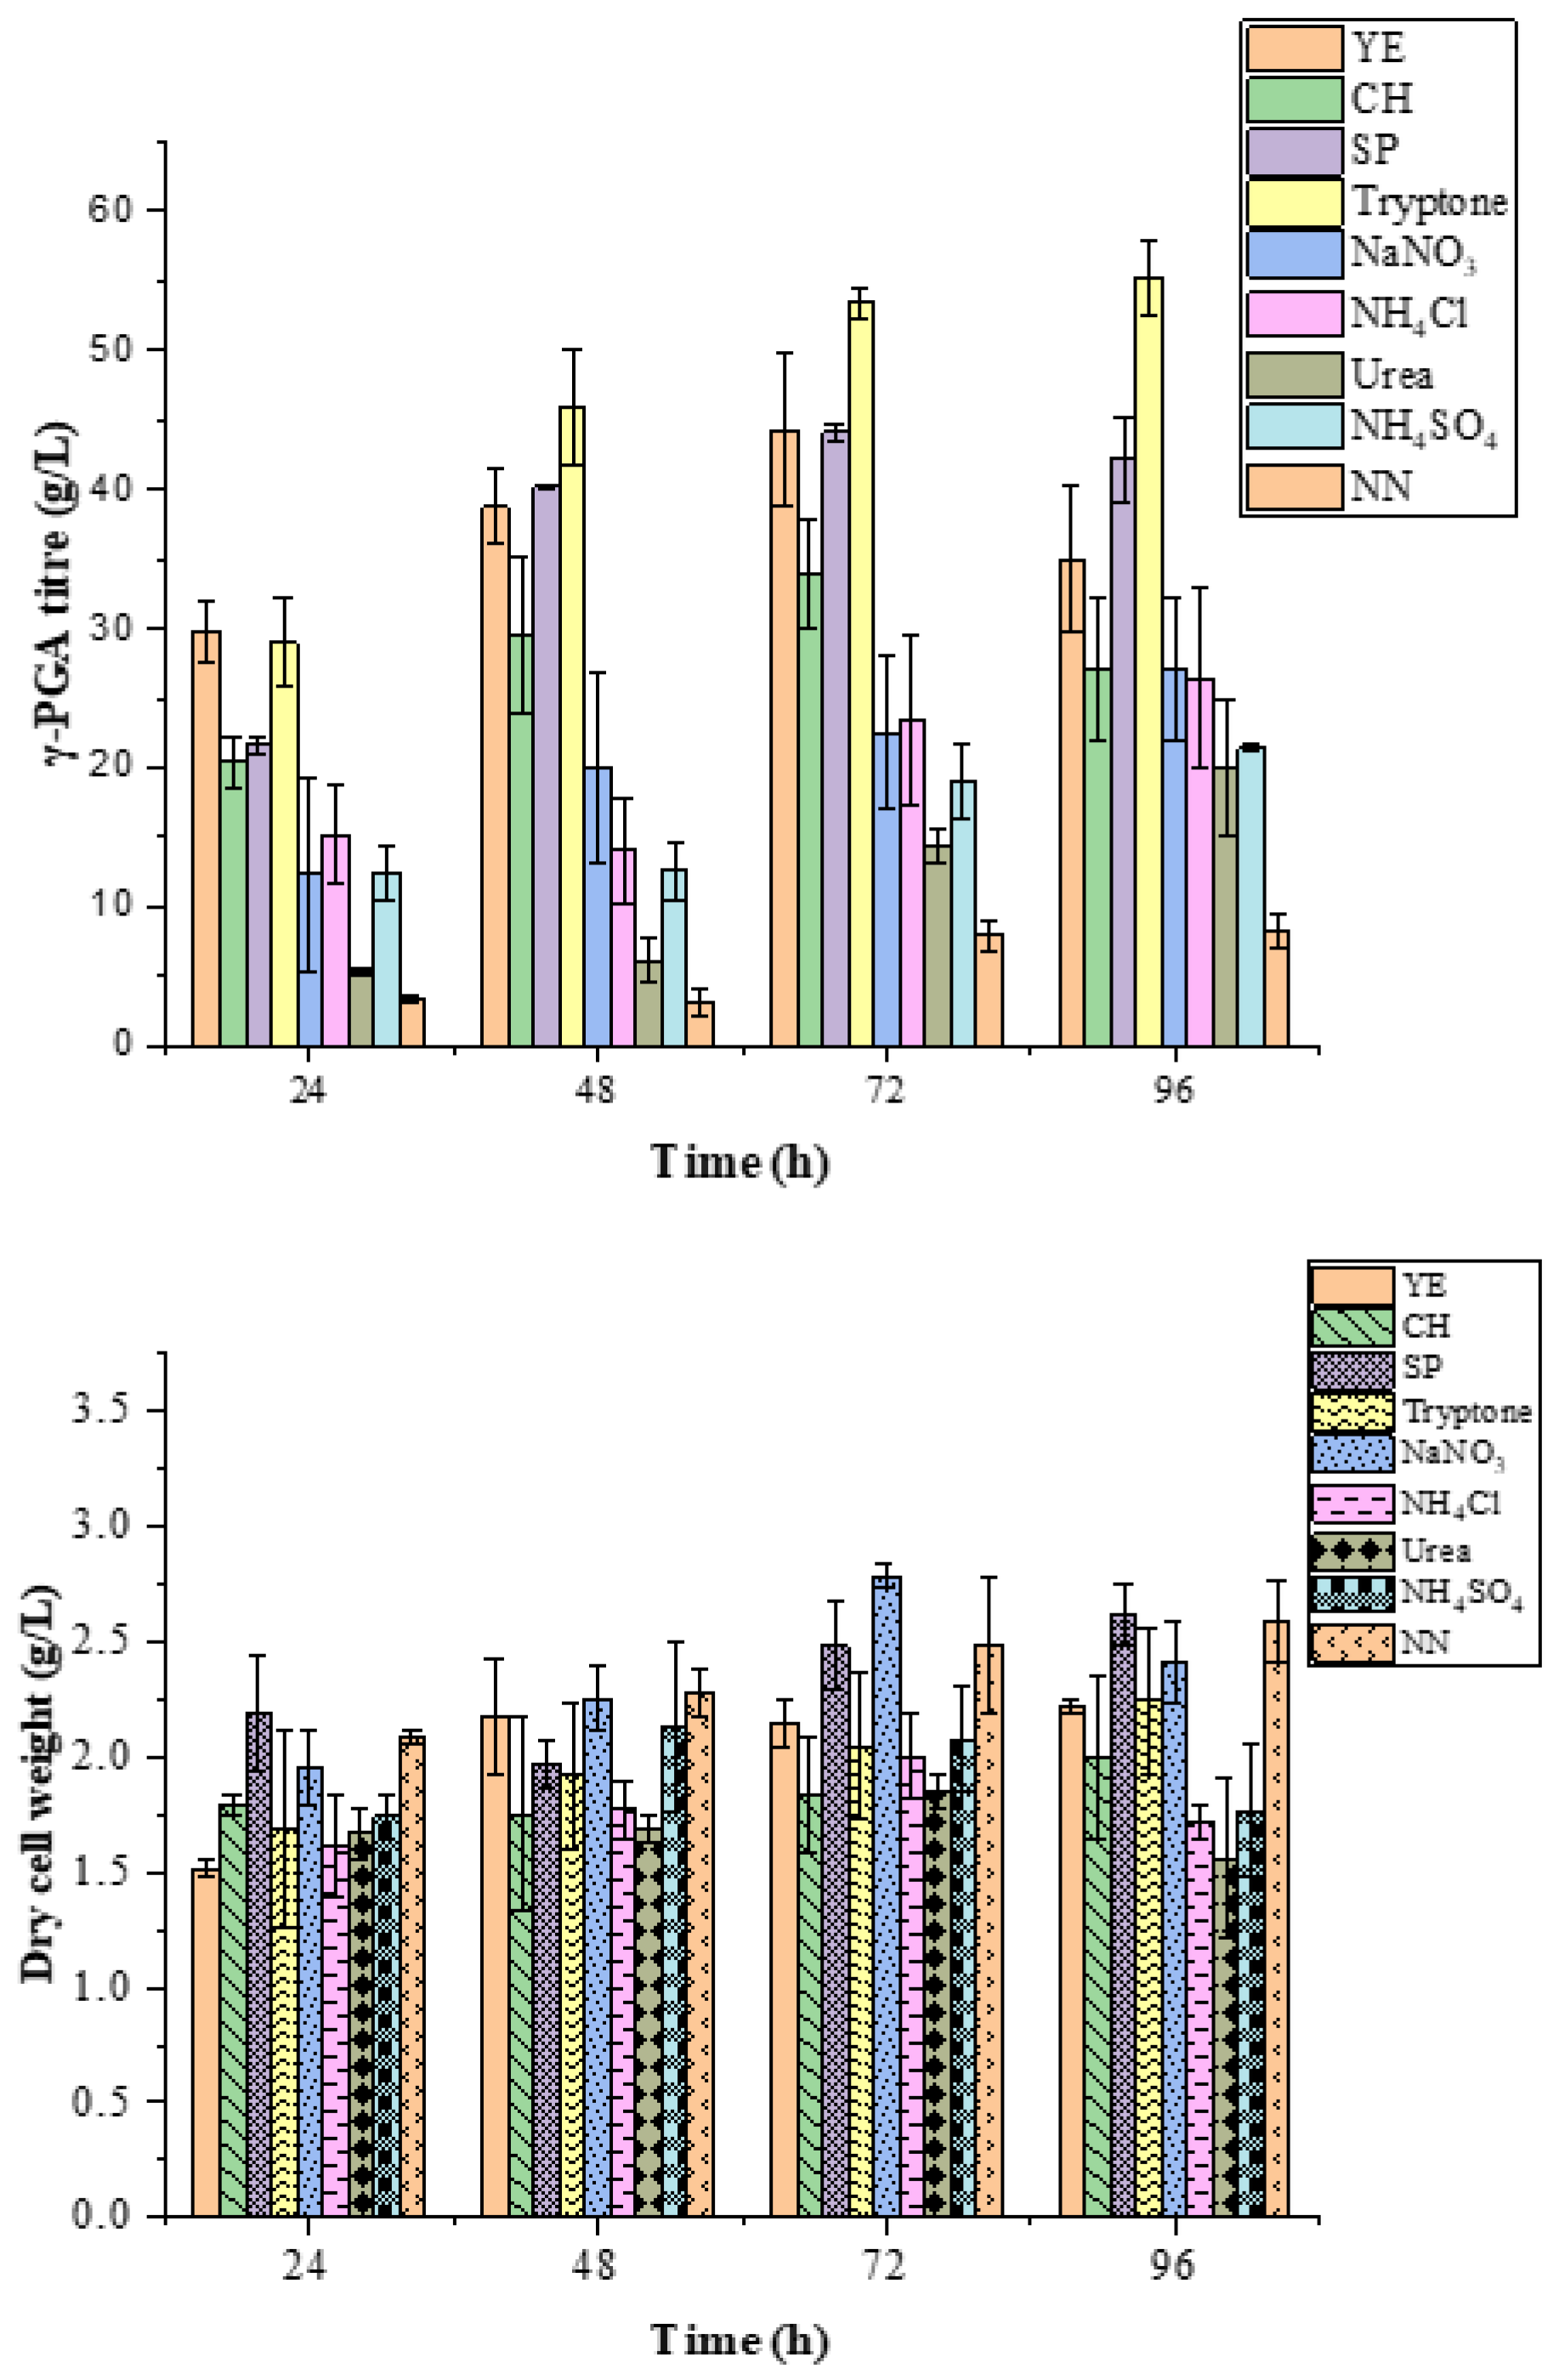
Figure 2.
Effect of carbon sources on γ-PGA production by B.licheniformis DPC6338.
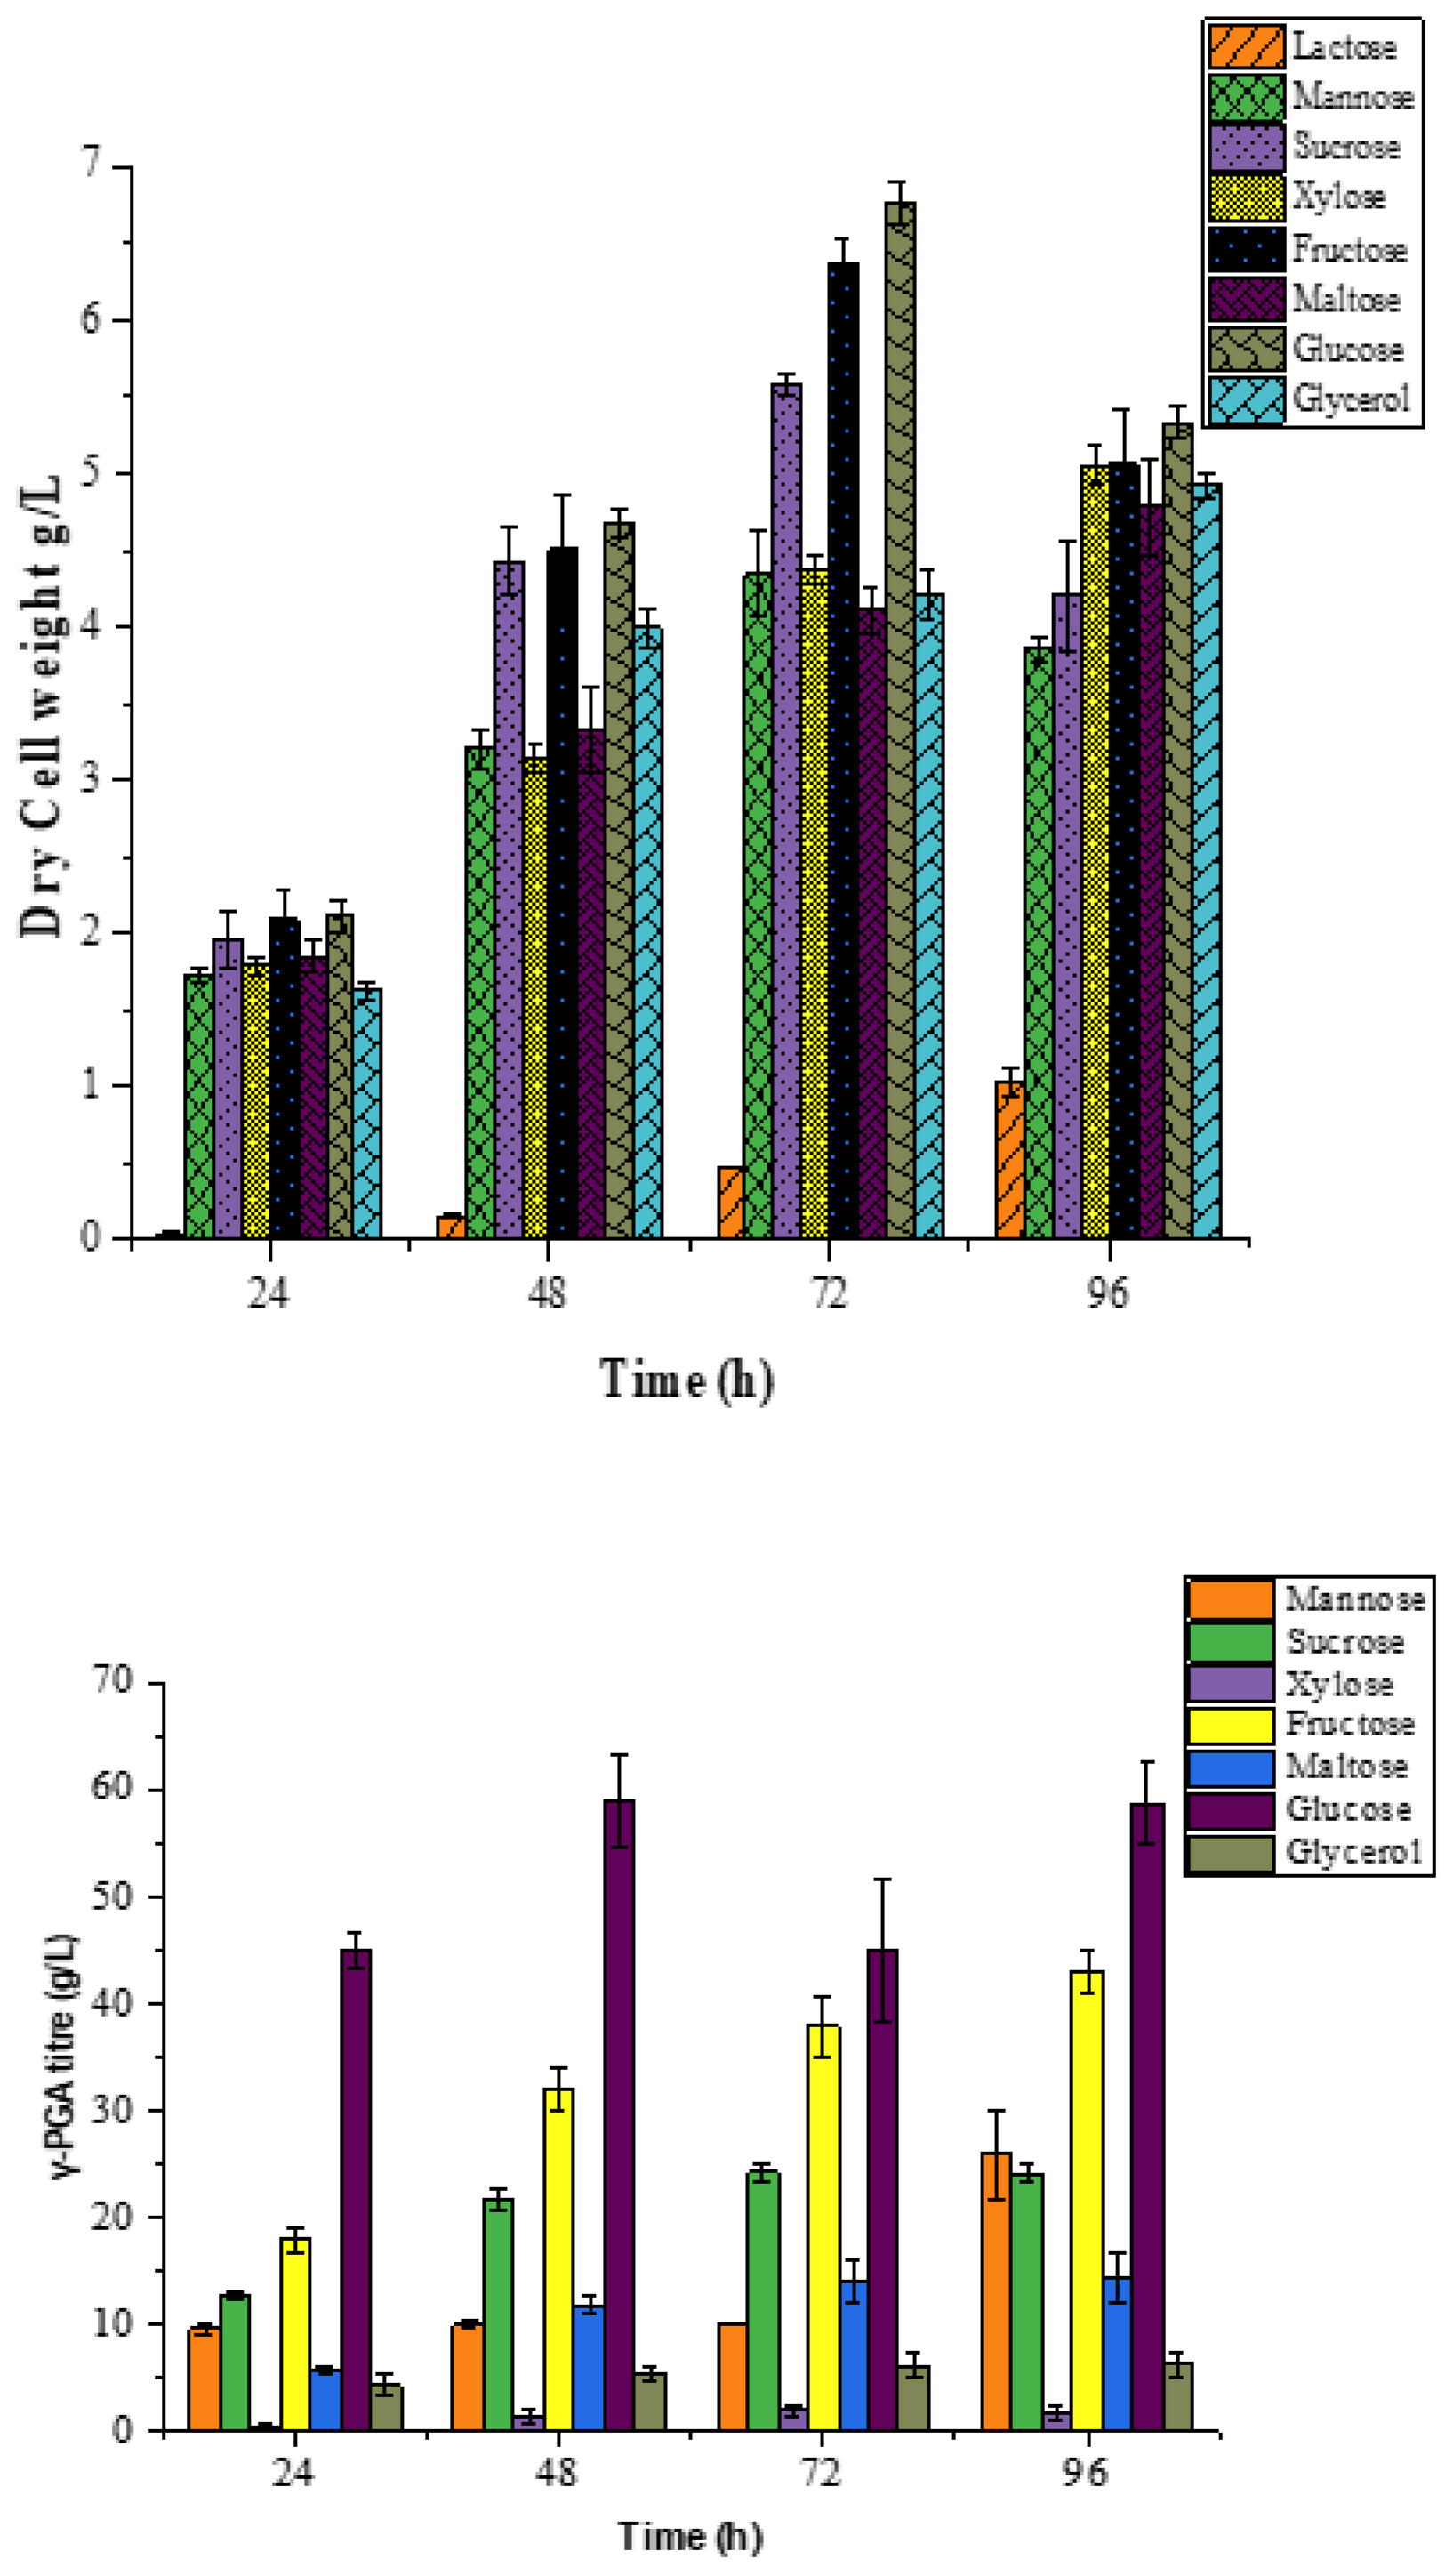
Figure 3.
Pareto chart of standardised effects.
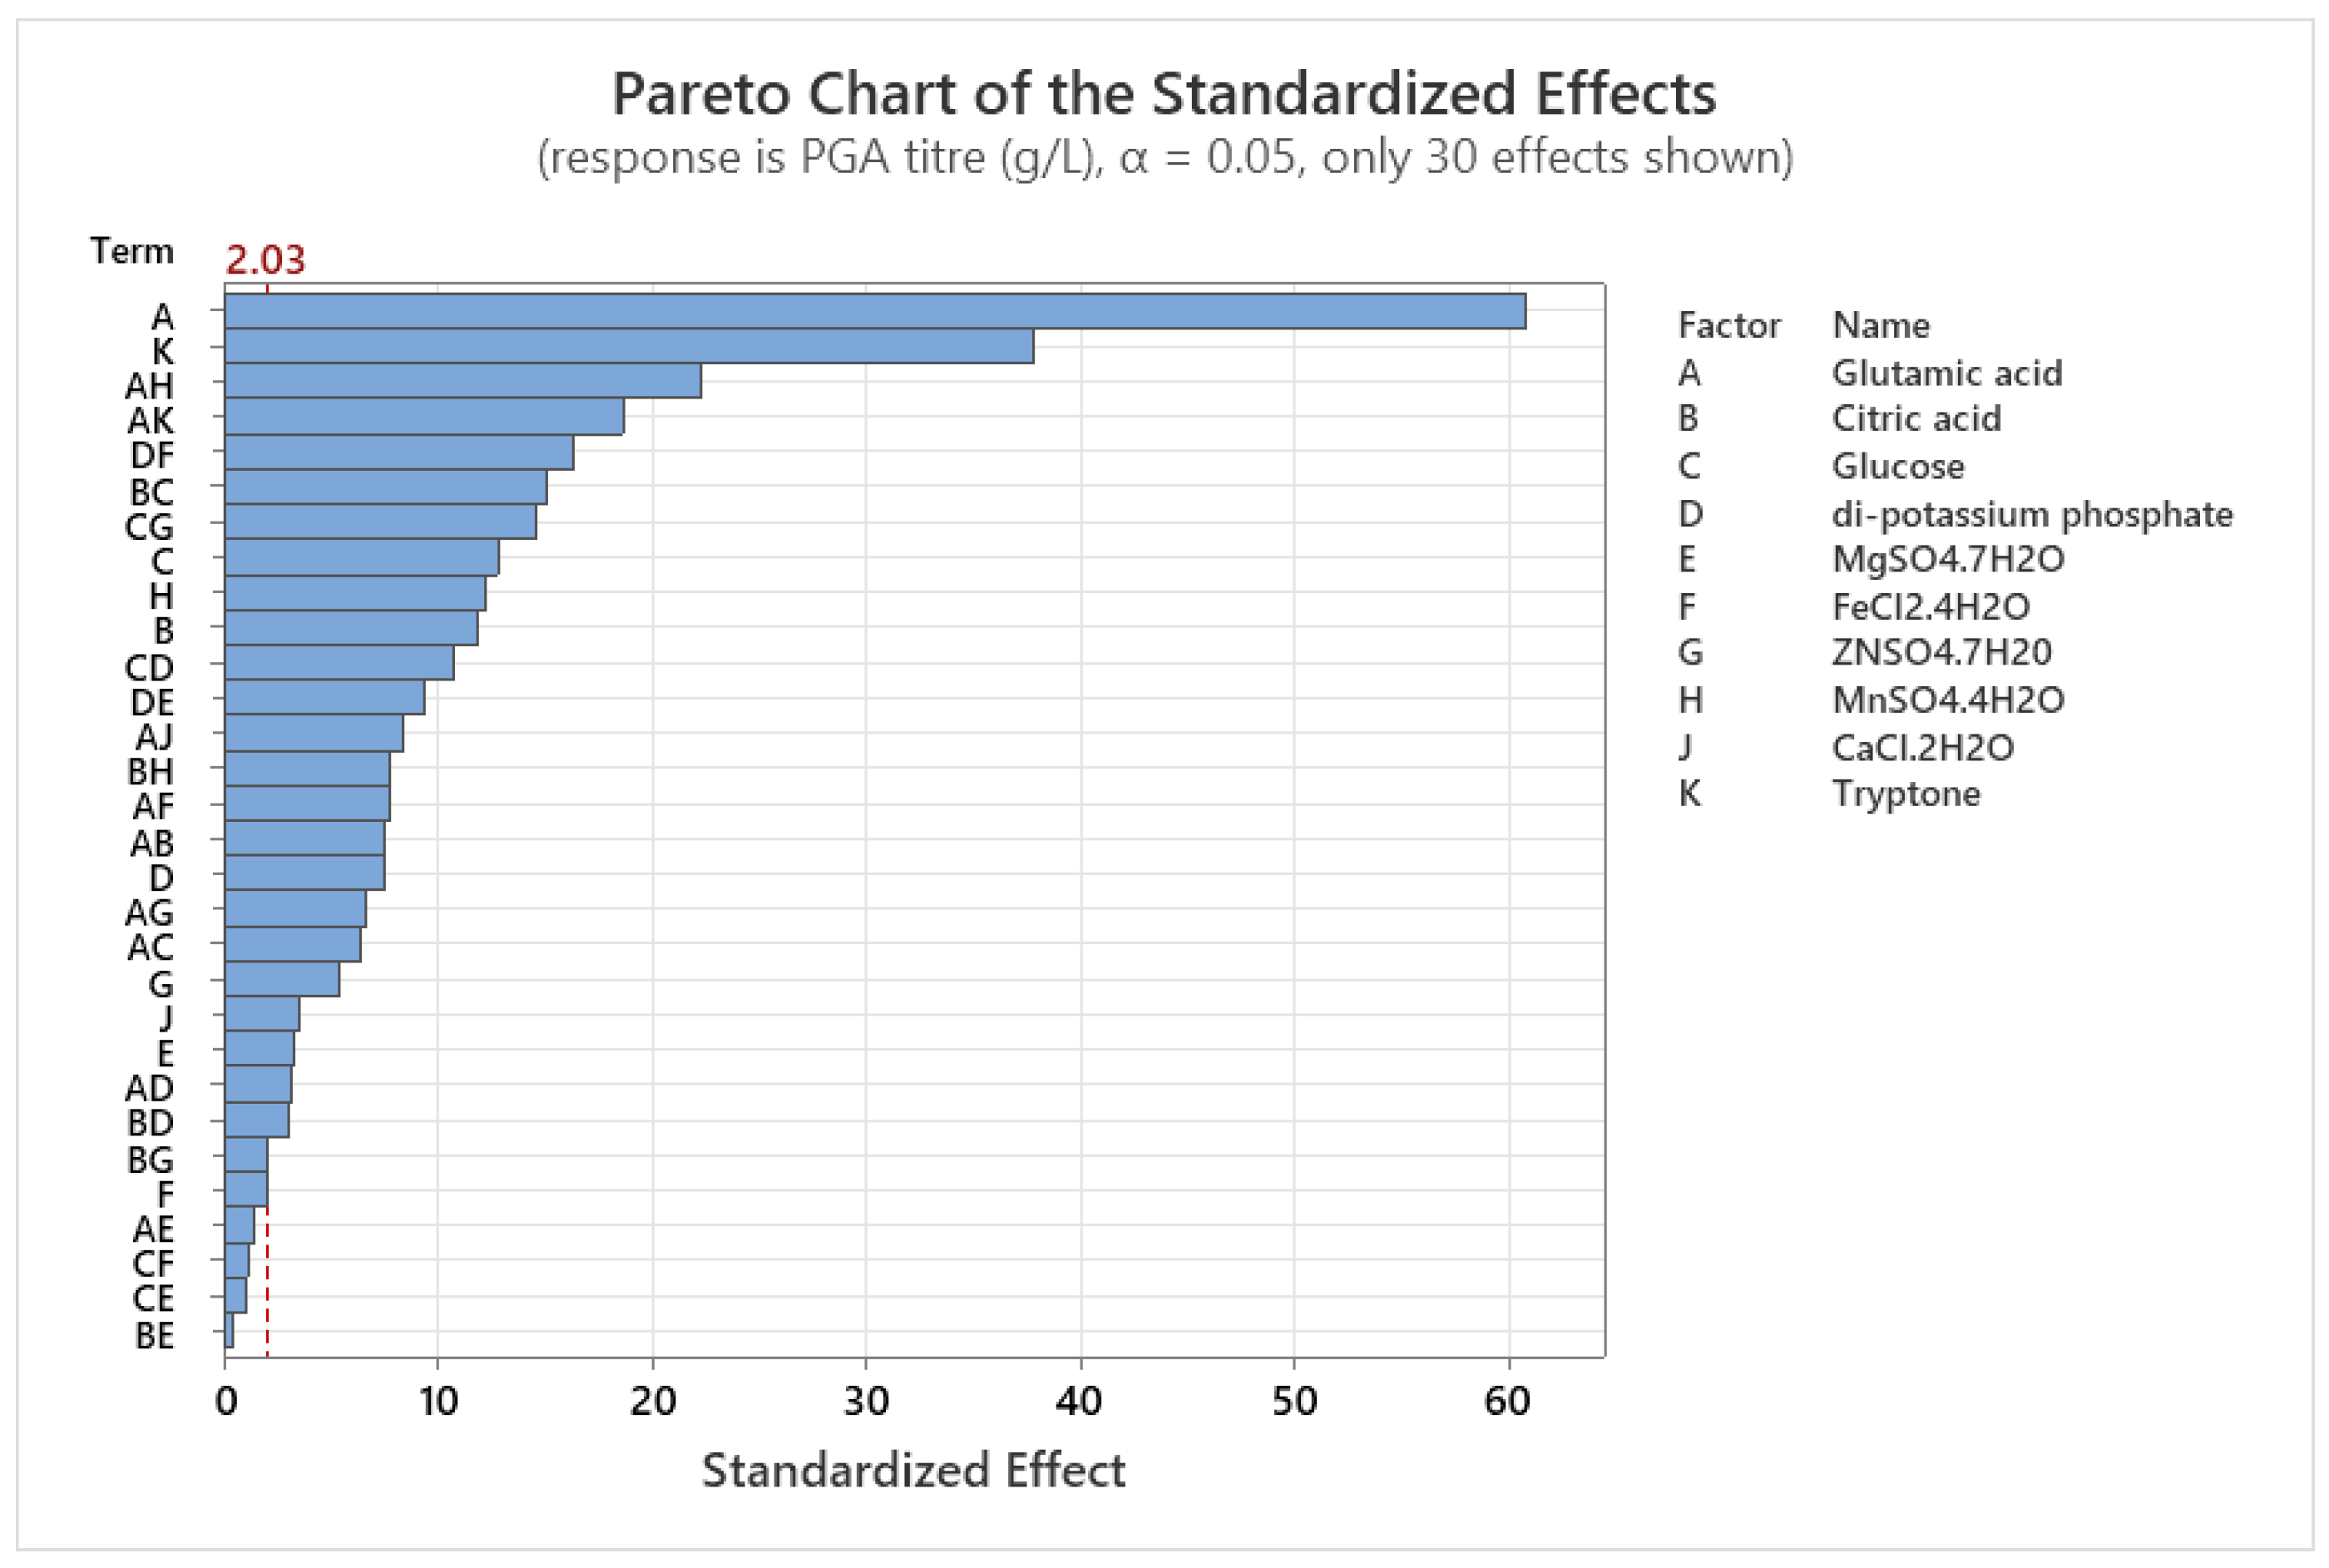
Figure 4.
Surface plot showing the interactive effect of glutamic acid and tryptone on PGA titre.
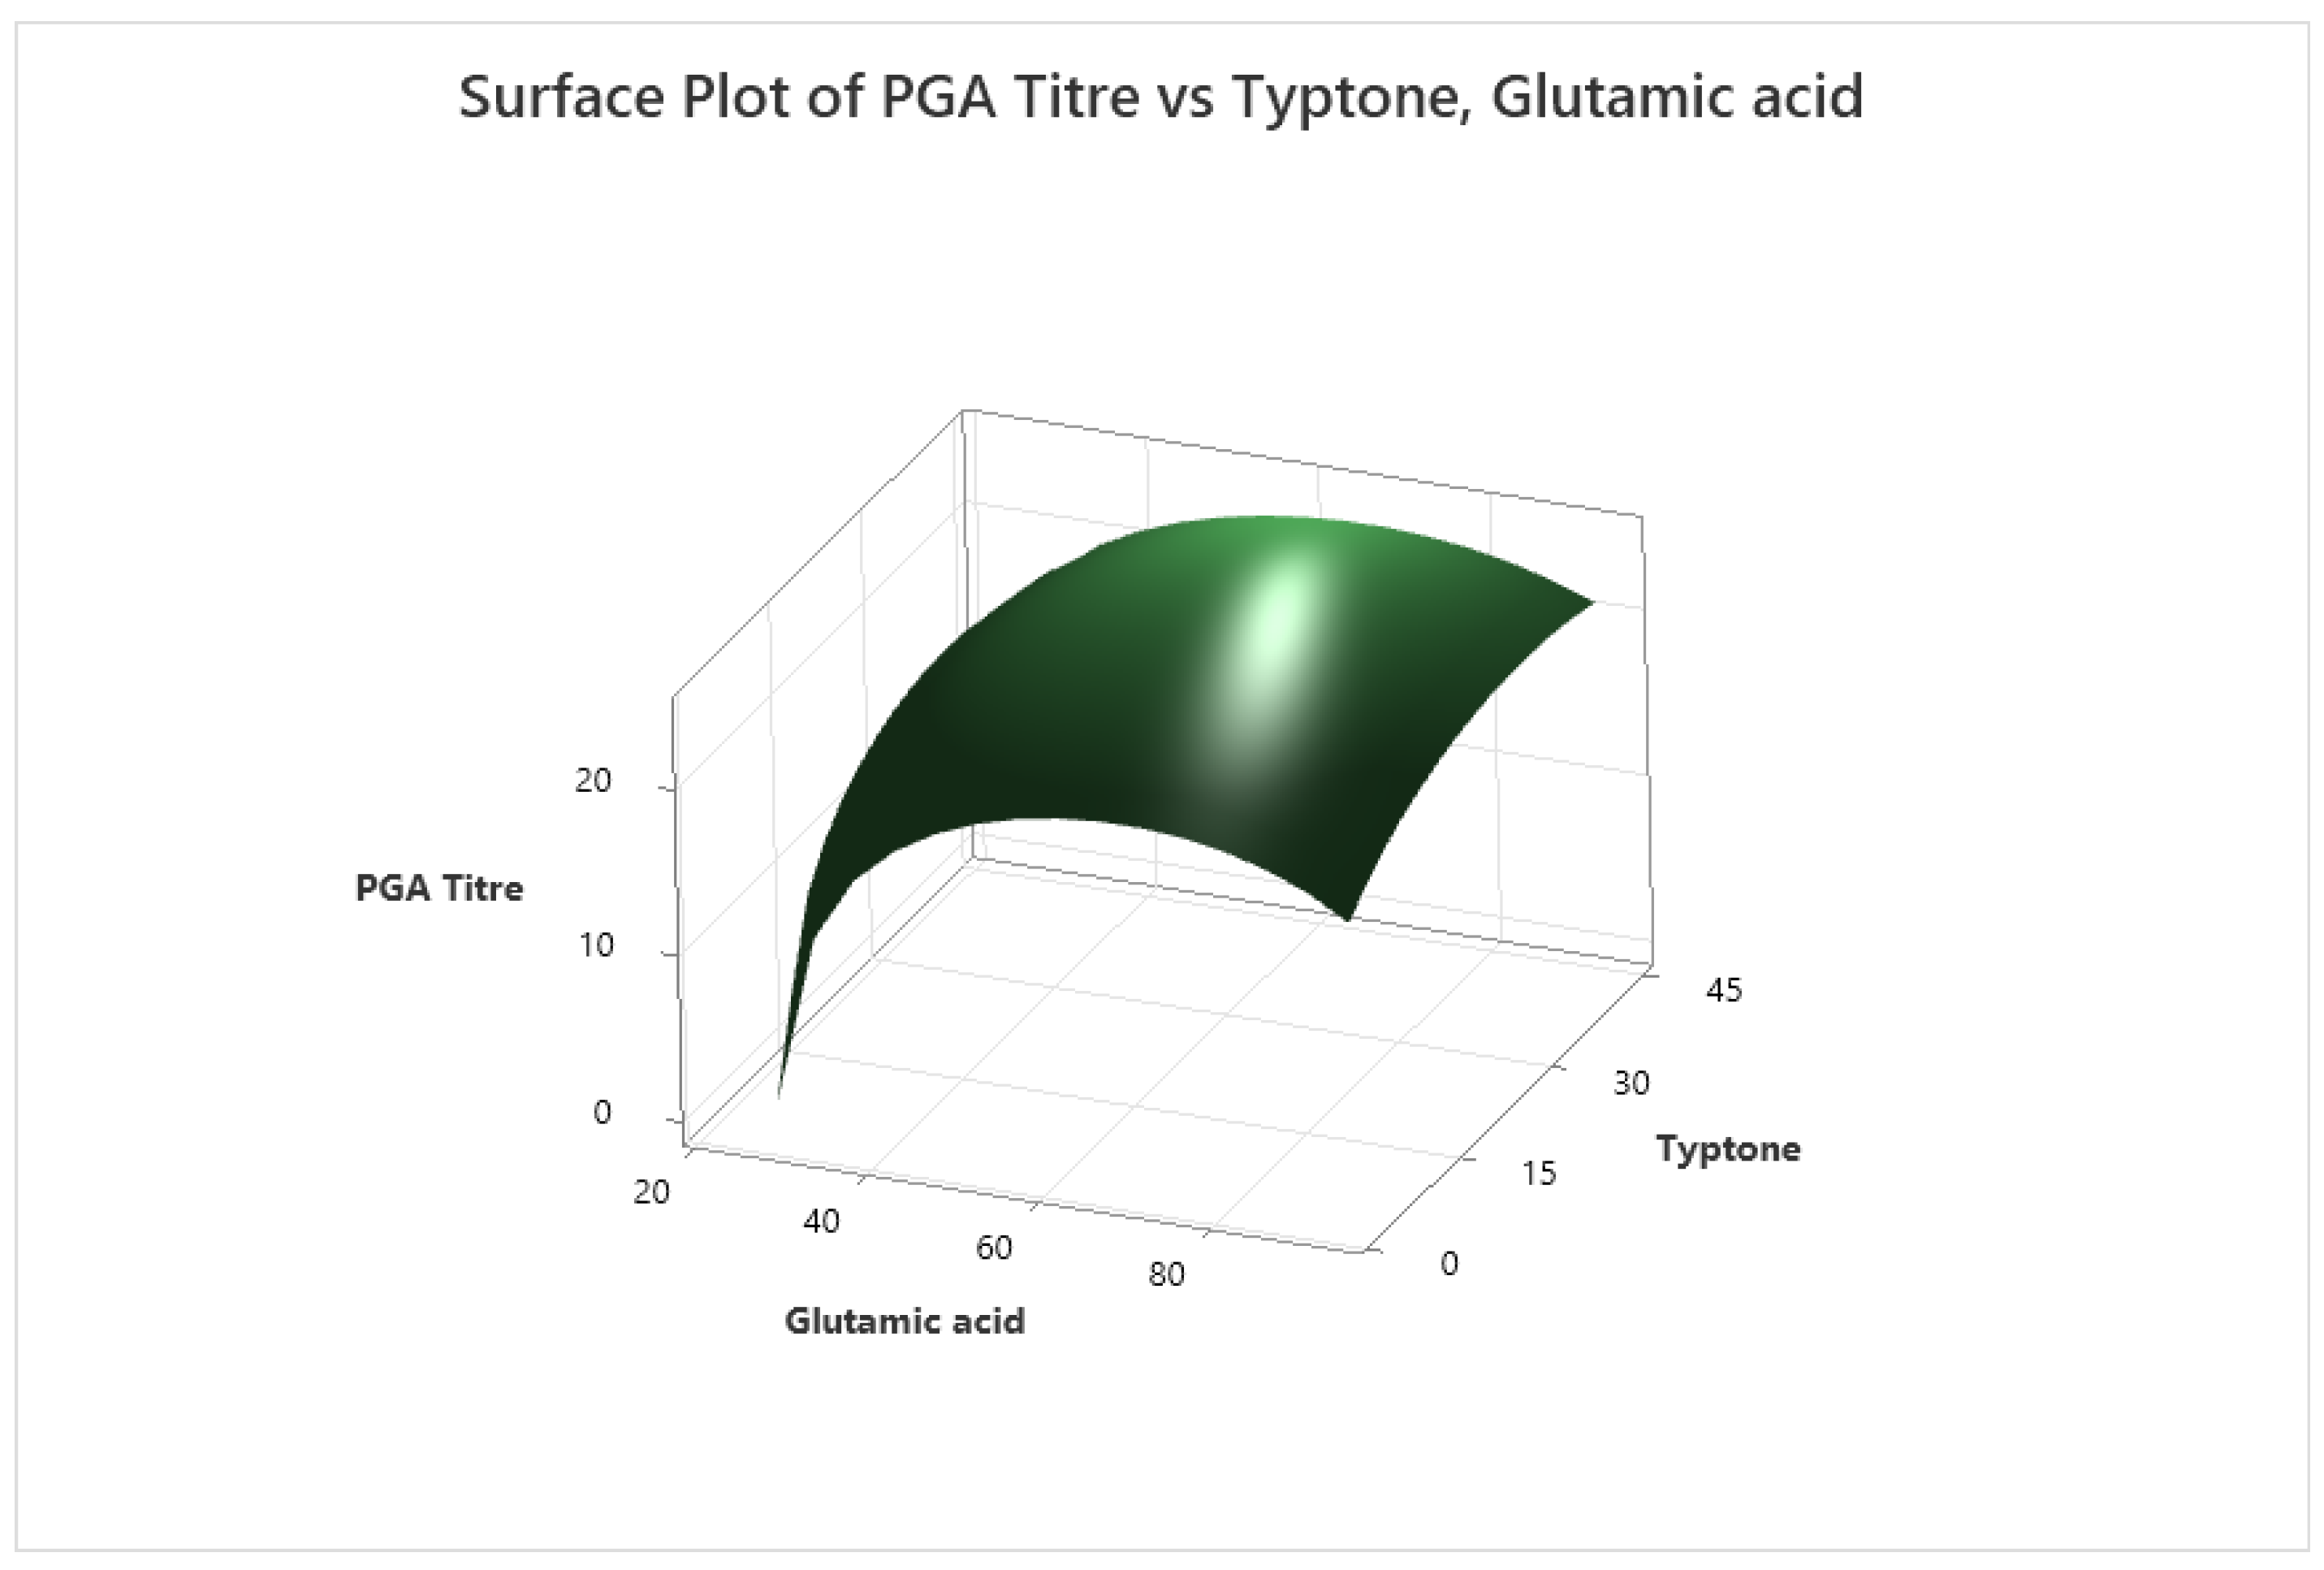
Figure 5.
Effect of the inoculum on γ-PGA titre.
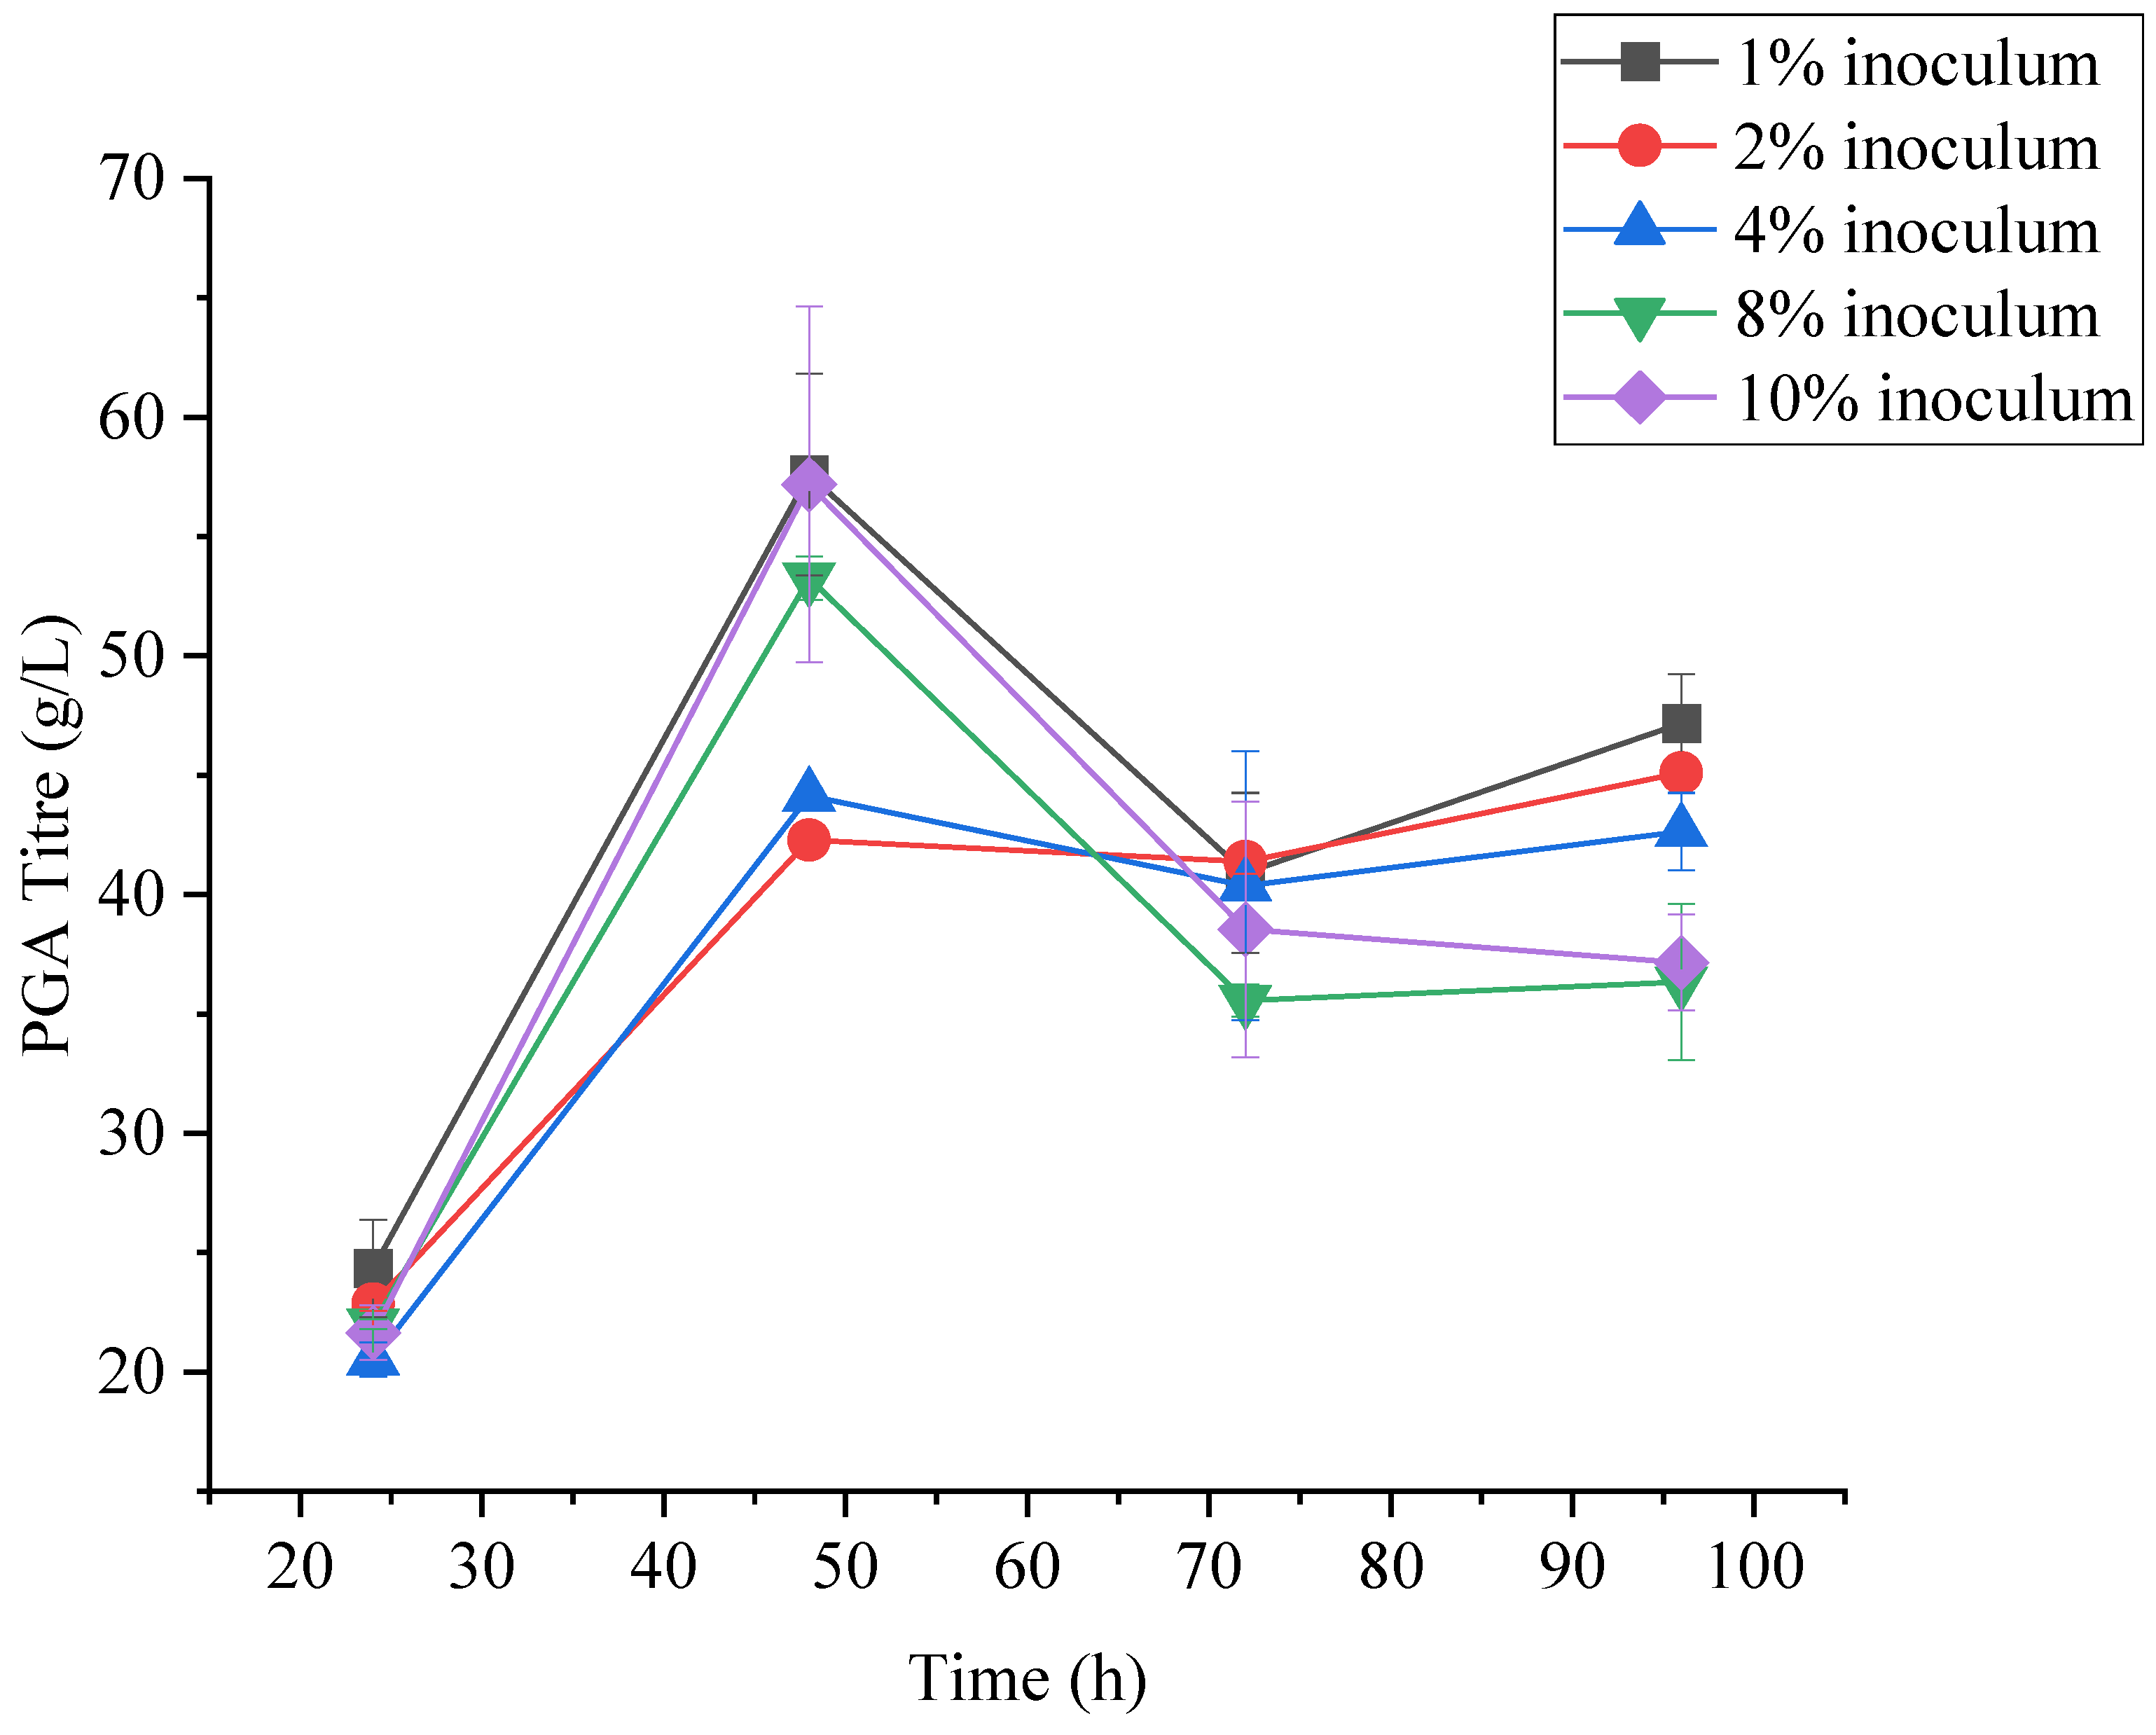
Figure 6.
Effect of pH on γ-PGA titre.
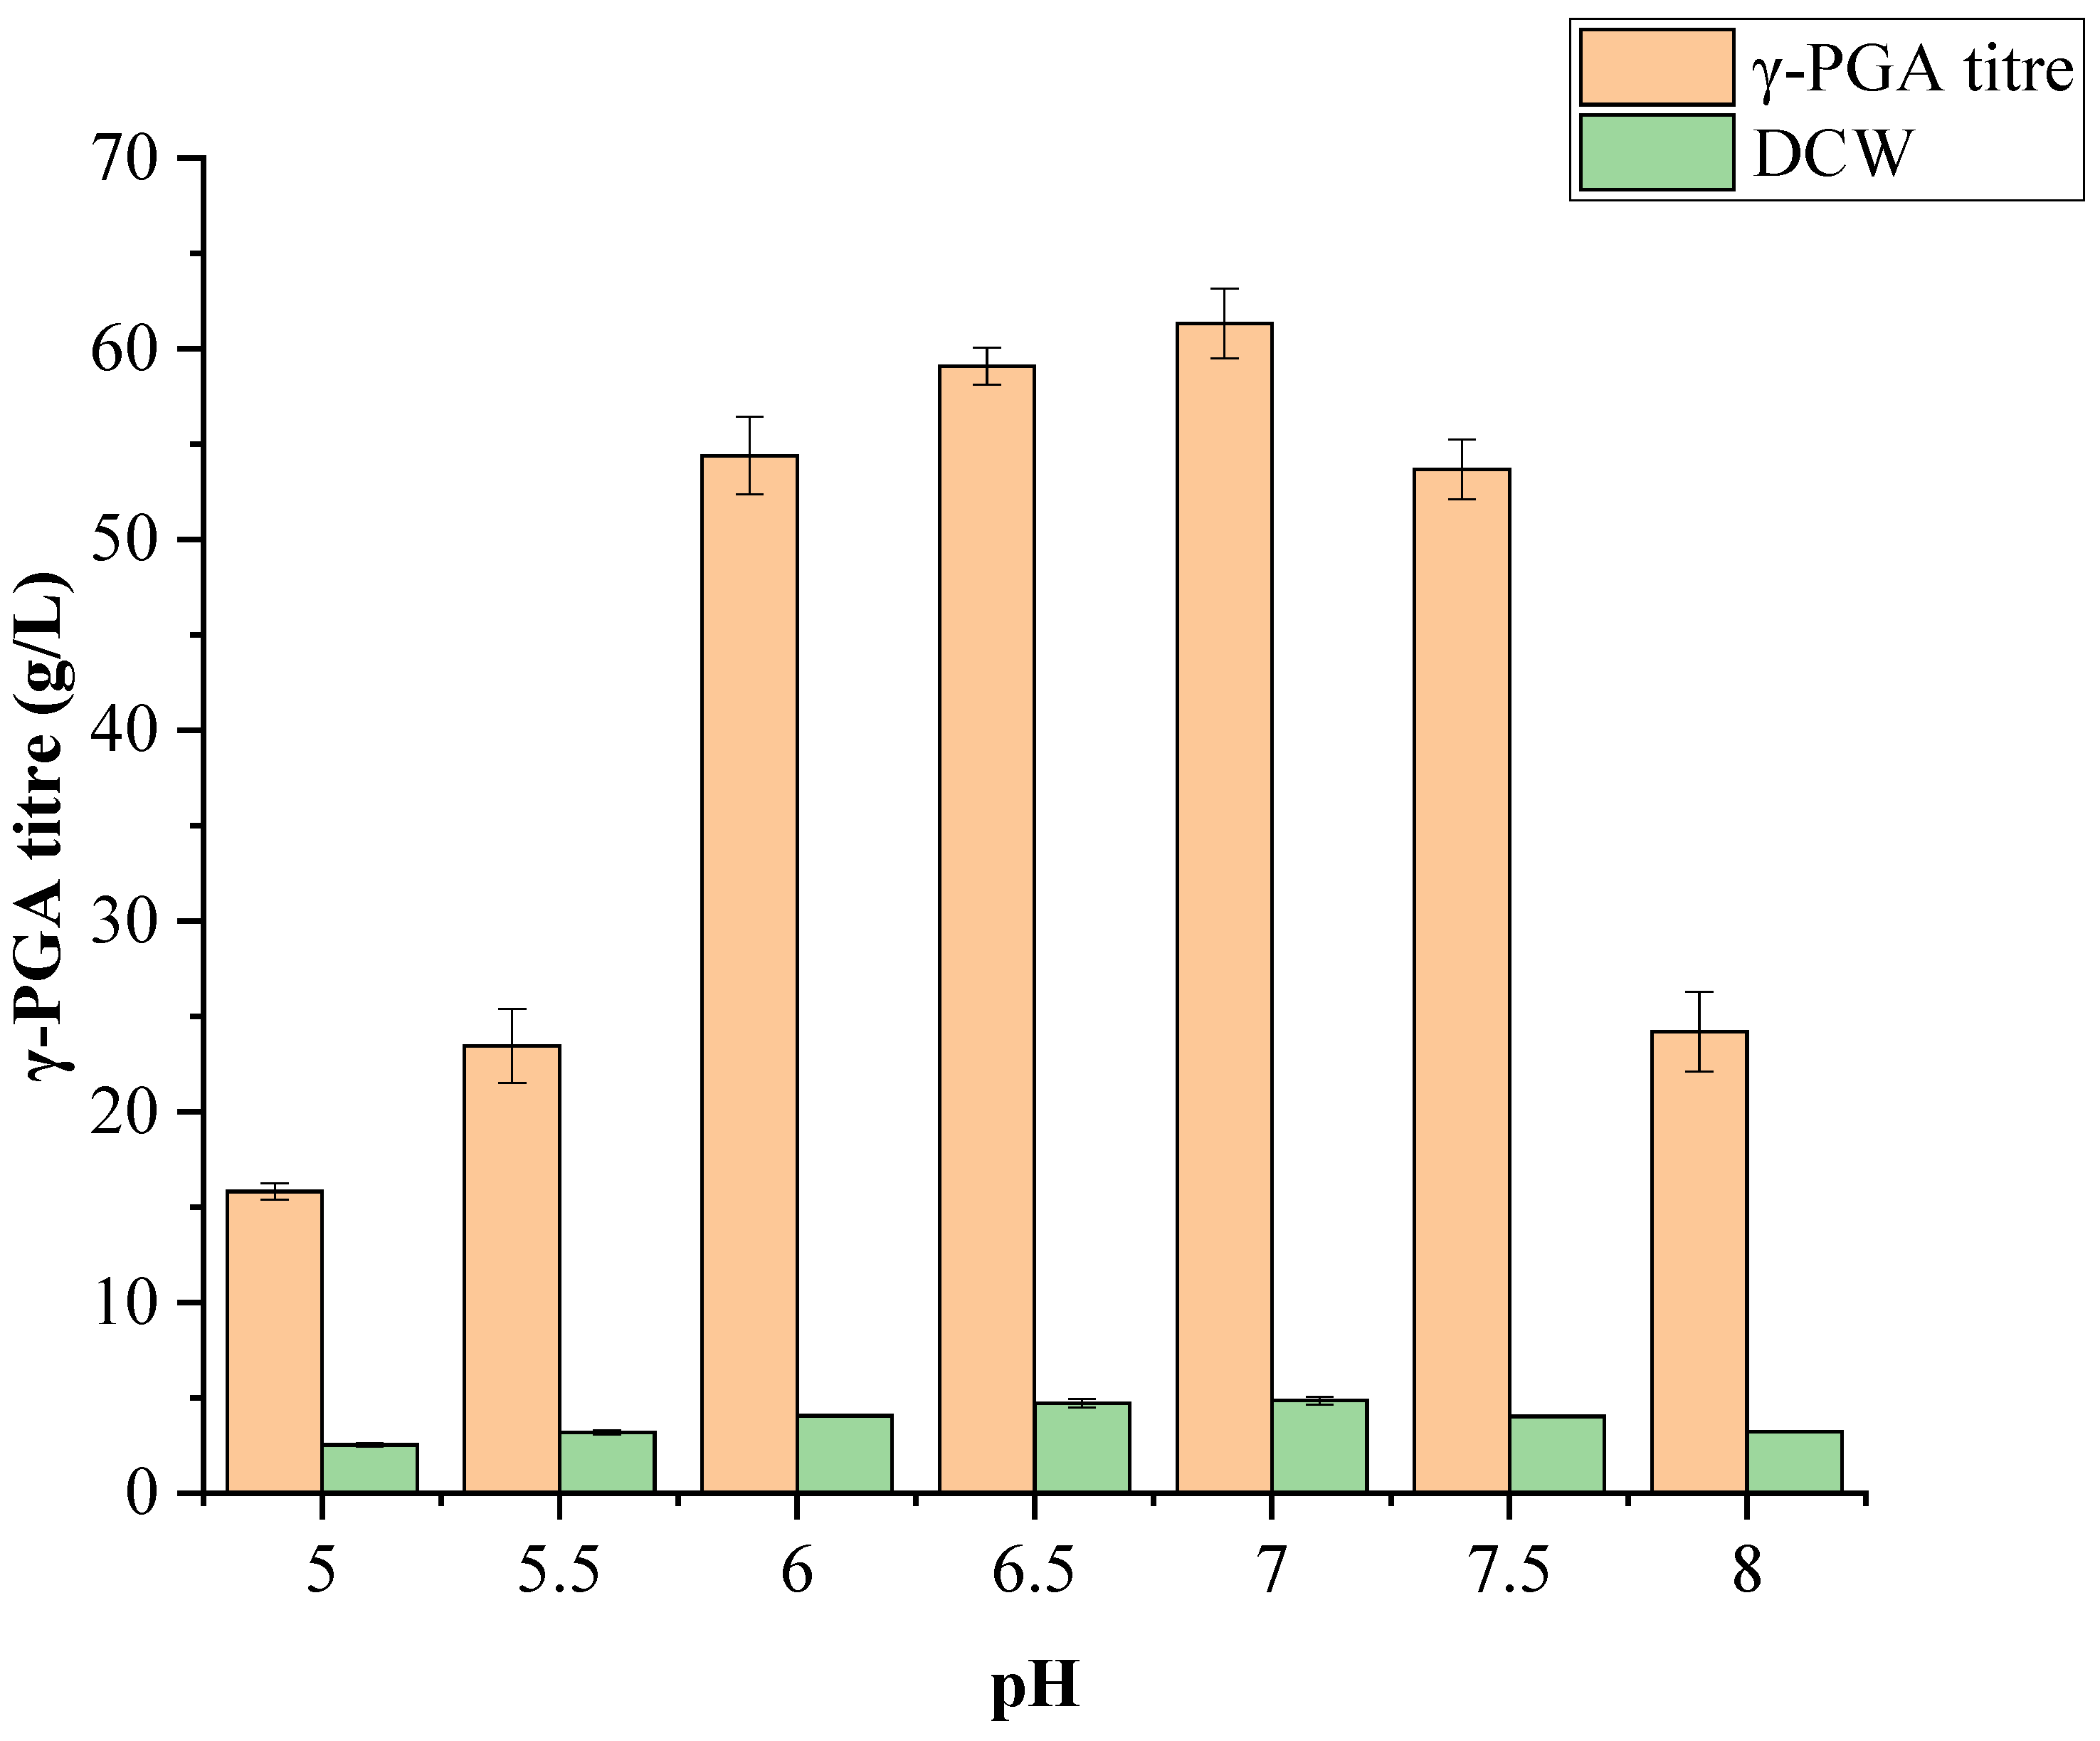
Figure 7.
The effect of temperature on γ-polyglutamic acid (γ-PGA) production in B.licheniformis DPC6338.
Figure 7.
The effect of temperature on γ-polyglutamic acid (γ-PGA) production in B.licheniformis DPC6338.
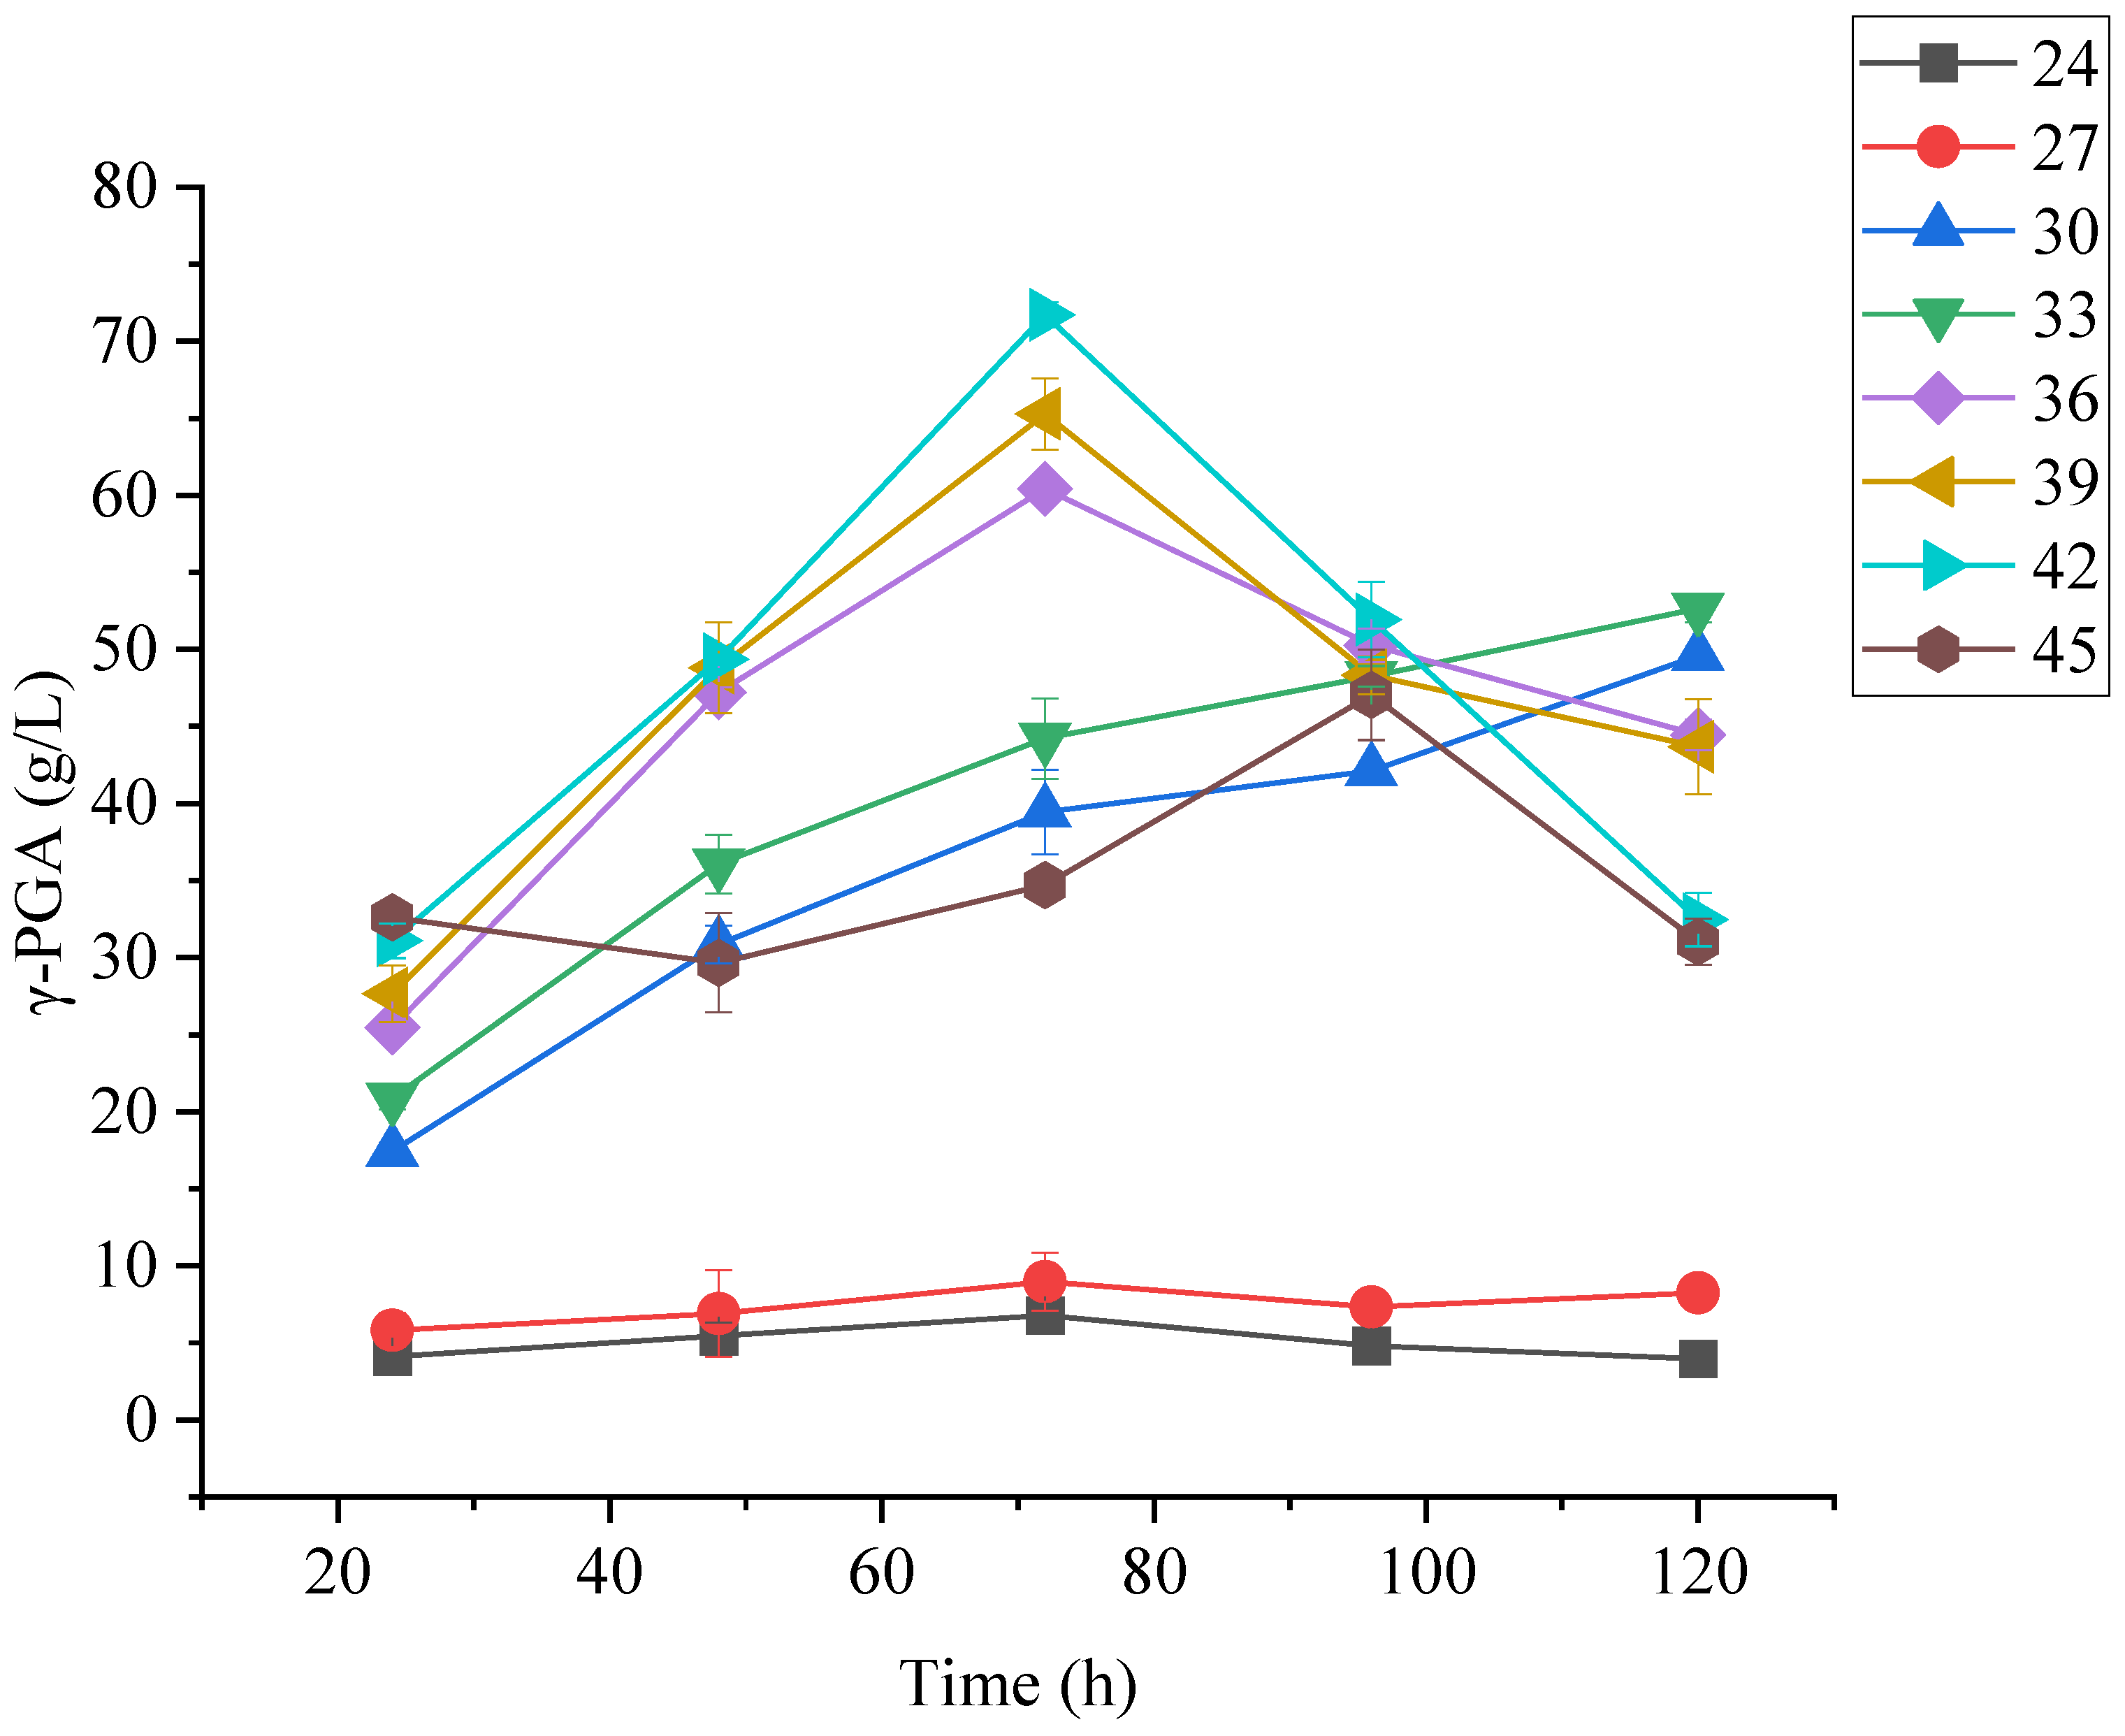
Figure 8.
Time profiles of growth, glucose, glutamic acid consumption and γ-PGA titre using optimised conditions in shake flask experiments.
Figure 8.
Time profiles of growth, glucose, glutamic acid consumption and γ-PGA titre using optimised conditions in shake flask experiments.
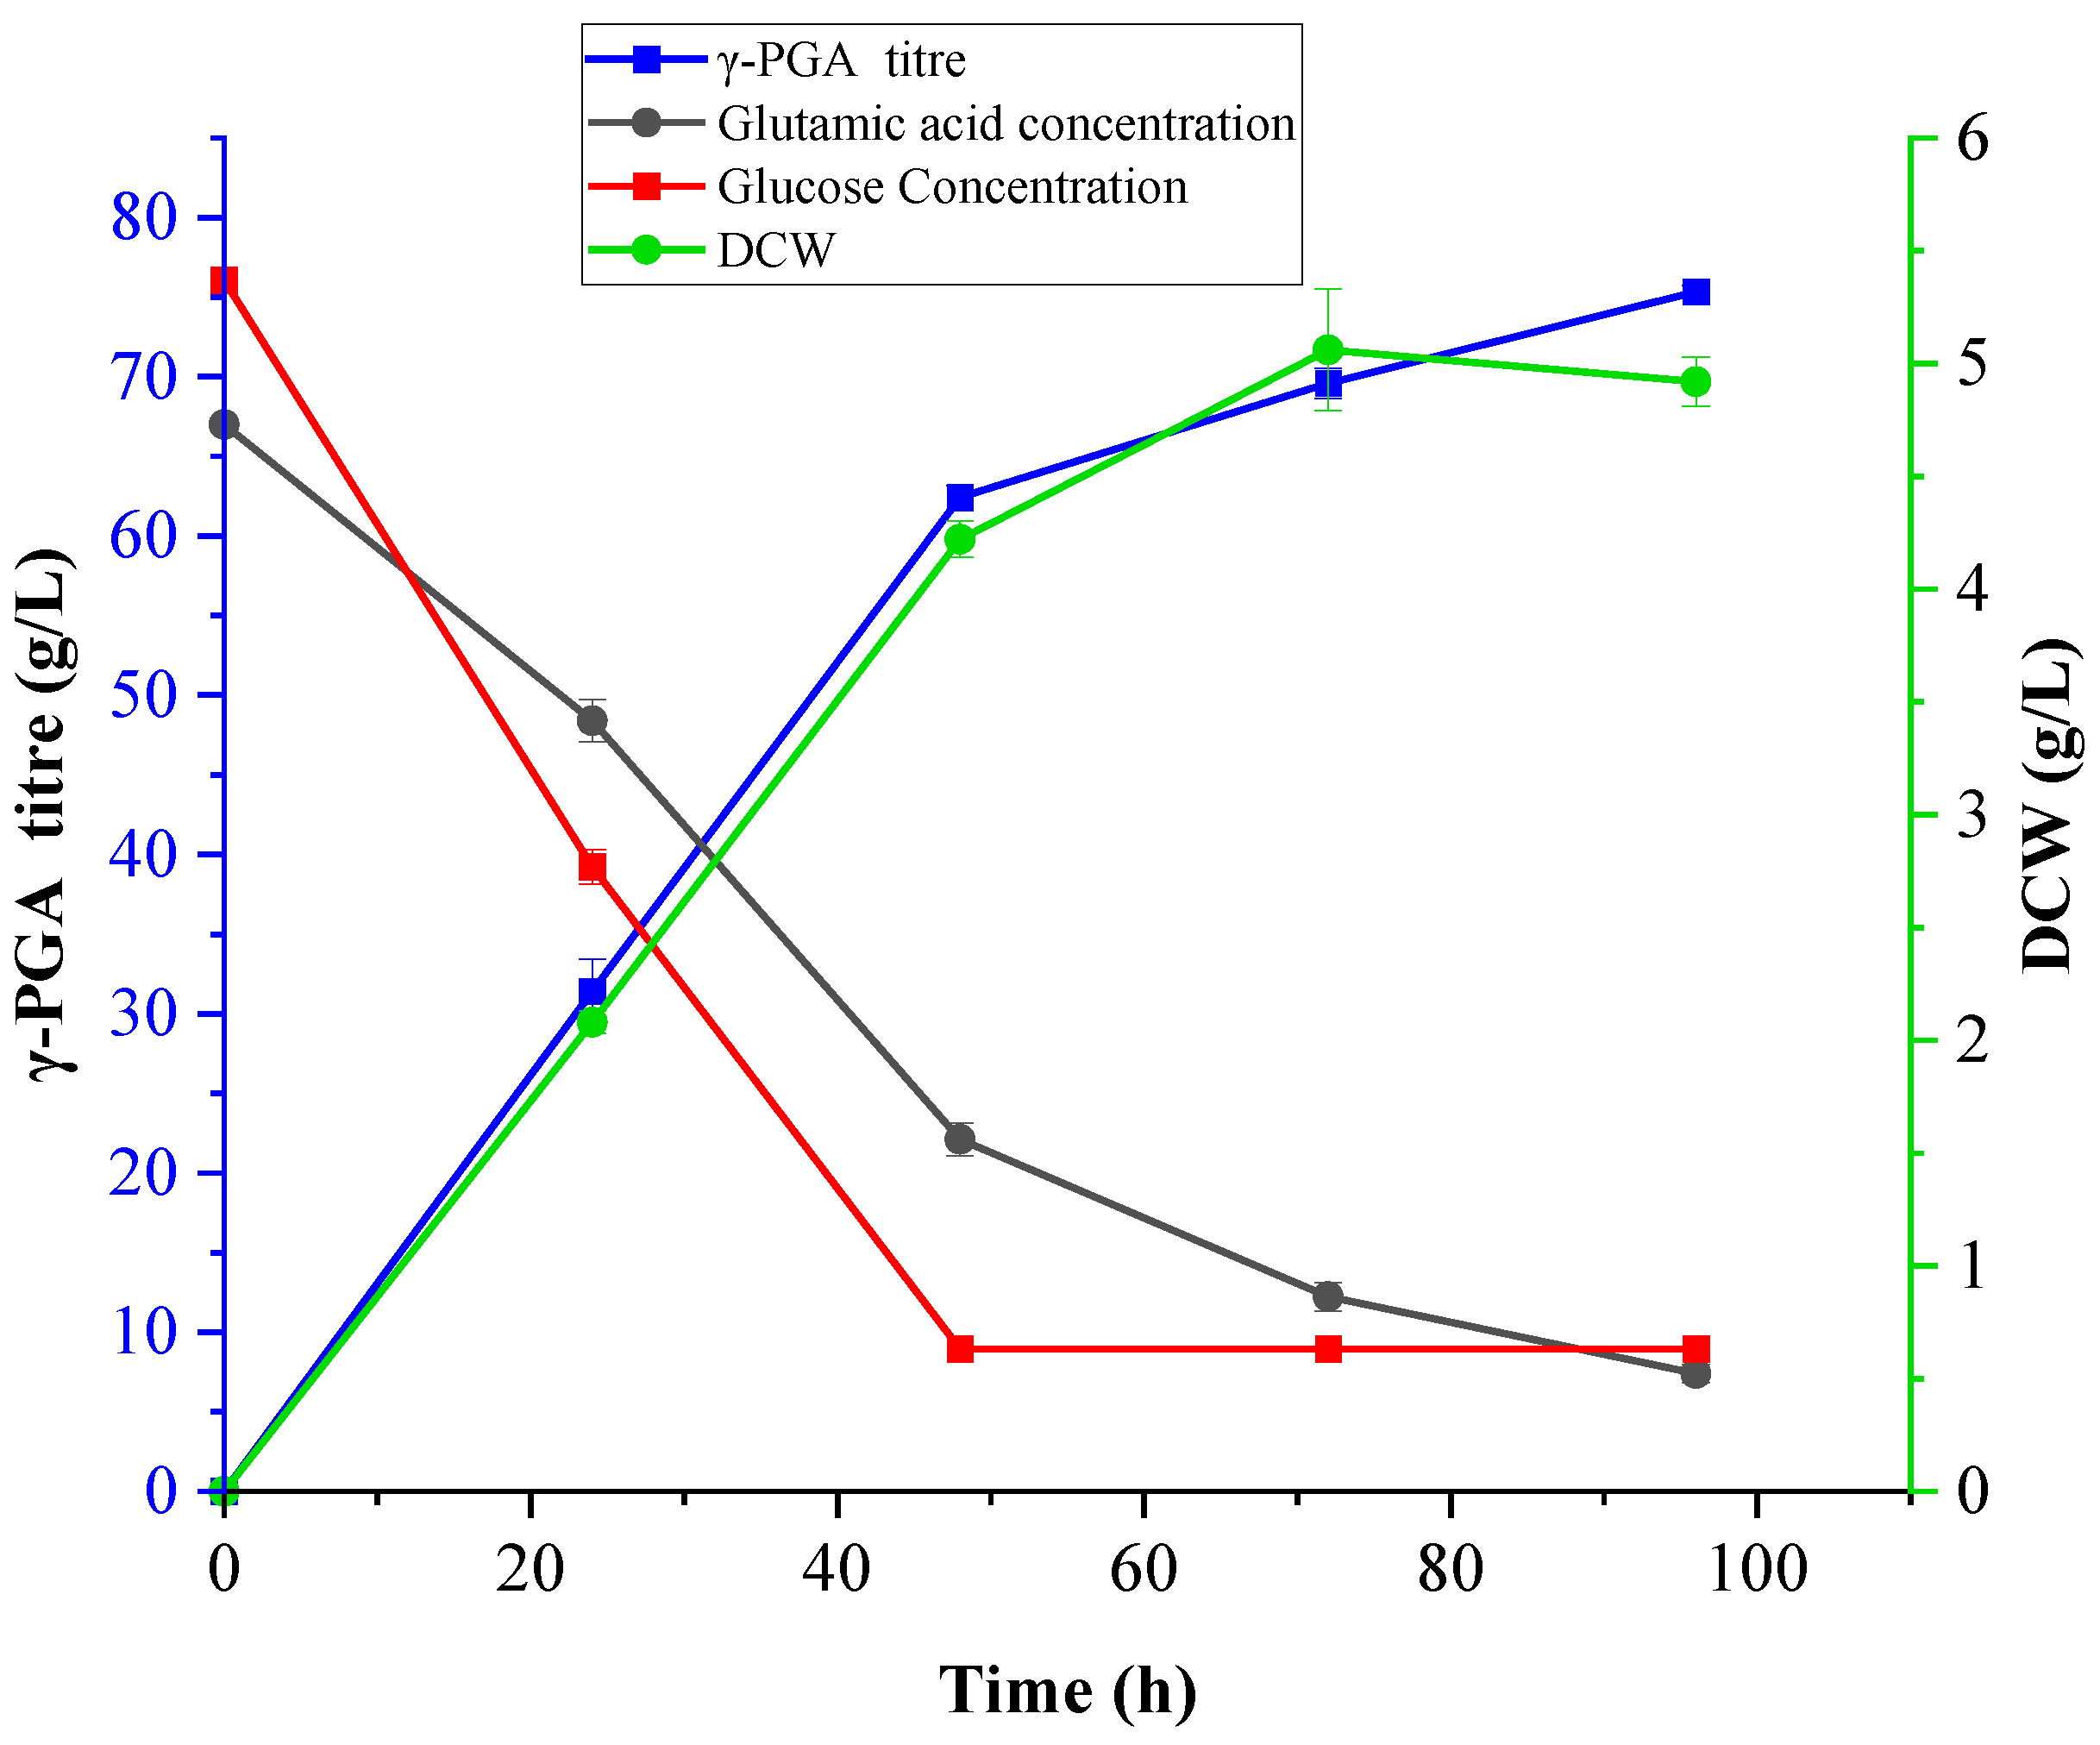
Table 1.
Medium components and the levels employed in fractional factorial design for screening of significant medium conditions affecting γ-PGA production by B. licheniformis DPC6338.
Table 1.
Medium components and the levels employed in fractional factorial design for screening of significant medium conditions affecting γ-PGA production by B. licheniformis DPC6338.
| Factors | Low, −1; | High, +1 | Unit |
|---|---|---|---|
| Glucose | 20 | 60 | g/L |
| Glutamic acid | 10 | 50 | g/L |
| Citric acid | 5 | 15 | g/L |
| Tryptone | 5 | 20 | g/L |
| K2HPO4 | 0.5 | 2 | g/L |
| MgSO4·7H2O | 0.5 | 2 | g/L |
| FeCl3·6H2O | 0.02 | 0.1 | g/L |
| CaCl2·2H2O | 0.1 | 0.5 | g/L |
| MnSO4·H2O | 0.1 | 0.5 | g/L |
| ZnSO4·7H2O | 0.5 | 2 | g/L |
Table 2.
Fractional factorial design with actual values and its response for B.licheniformis DPC6338.
Table 2.
Fractional factorial design with actual values and its response for B.licheniformis DPC6338.
| Run Order | Glutamic acid | Citric acid | Glucose | K2HPO4 | MgSO4 .7H2O |
FeCl2. 4H2O |
ZnSO4. 7H20 |
MnSO4. 4H2O |
CaCl. 2H2O |
Tryptone | PGA titre (g/L) |
|---|---|---|---|---|---|---|---|---|---|---|---|
| 1 | 10.00 | 5.00 | 60.00 | 2.00 | 0.50 | 0.10 | 0.50 | 0.10 | 0.50 | 20.00 | 6.85 |
| 2 | 50.00 | 5.00 | 60.00 | 0.50 | 0.50 | 0.10 | 2.00 | 0.10 | 0.50 | 5.00 | 3.64 |
| 3 | 50.00 | 15.00 | 20.00 | 2.00 | 0.50 | 0.02 | 2.00 | 0.10 | 0.50 | 20.00 | 8.77 |
| 4 | 10.00 | 15.00 | 60.00 | 2.00 | 2.00 | 0.02 | 0.50 | 0.10 | 0.10 | 20.00 | 6.22 |
| 5 | 10.00 | 15.00 | 20.00 | 2.00 | 2.00 | 0.1 | 2.00 | 0.10 | 0.50 | 5.00 | 2.14 |
| 6 | 50.00 | 15.00 | 20.00 | 0.50 | 2.00 | 0.10 | 0.50 | 0.10 | 0.50 | 20.00 | 2.61 |
| 7 | 50.00 | 5.00 | 20.00 | 2.00 | 0.50 | 0.10 | 0.50 | 0.50 | 0.50 | 5.00 | 6.96 |
| 8 | 50.00 | 5.00 | 20.00 | 0.50 | 2.00 | 0.02 | 2.00 | 0.50 | 0.50 | 5.00 | 12.40 |
| 9 | 10.00 | 5.00 | 20.00 | 0.50 | 2.00 | 0.10 | 0.50 | 0.10 | 0.10 | 5.00 | 0.74 |
| 10 | 10.00 | 5.00 | 20.00 | 0.50 | 0.50 | 0.10 | 2.00 | 0.50 | 0.50 | 20.00 | 4.49 |
| 11 | 50.00 | 15.00 | 60.00 | 0.50 | 2.00 | 0.02 | 2.00 | 0.10 | 0.10 | 5.00 | 4.52 |
| 12 | 10.00 | 15.00 | 60.00 | 2.00 | 0.50 | 0.02 | 2.00 | 0.50 | 0.50 | 5.00 | 0.06 |
| 13 | 10.00 | 5.00 | 60.00 | 0.50 | 2.00 | 0.02 | 2.00 | 0.10 | 0.50 | 20.00 | 2.62 |
| 14 | 50.00 | 15.00 | 20.00 | 2.00 | 2.00 | 0.02 | 0.50 | 0.50 | 0.10 | 5.00 | 5.46 |
| 15 | 10.00 | 15.00 | 20.00 | 0.50 | 2.00 | 0.02 | 2.00 | 0.50 | 0.10 | 20.00 | 2.08 |
| 16 | 50.00 | 15.00 | 60.00 | 0.50 | 0.50 | 0.02 | 0.50 | 0.50 | 0.50 | 20.00 | 19.51 |
| 17 | 10.00 | 5.00 | 60.00 | 0.50 | 0.50 | 0.02 | 0.50 | 0.50 | 0.10 | 5.00 | 0.58 |
| 18 | 50.00 | 15.00 | 20.00 | 2.00 | 2.00 | 0.02 | 0.50 | 0.50 | 0.10 | 5.00 | 5.10 |
| 19 | 10.00 | 15.00 | 20.00 | 0.50 | 0.50 | 0.02 | 0.50 | 0.10 | 0.50 | 5.00 | 0.22 |
| 20 | 50.00 | 5.00 | 60.00 | 2.00 | 2.00 | 0.02 | 0.50 | 0.10 | 0.50 | 5.00 | 6.86 |
| 21 | 50.00 | 15.00 | 60.00 | 2.00 | 2.00 | 0.10 | 2.00 | 0.50 | 0.50 | 20.00 | 20.65 |
| 22 | 50.00 | 15.00 | 60.00 | 2.00 | 0.50 | 0.10 | 0.50 | 0.10 | 0.10 | 5.00 | 8.07 |
| 23 | 50.00 | 15.00 | 60.00 | 0.50 | 0.50 | 0.02 | 0.50 | 0.50 | 0.50 | 20.00 | 20.84 |
| 24 | 10.00 | 15.00 | 60.00 | 2.00 | 2.00 | 0.02 | 0.50 | 0.10 | 0.10 | 20.00 | 6.28 |
| 25 | 50.00 | 5.00 | 60.00 | 0.50 | 0.50 | 0.10 | 2.00 | 0.10 | 0.50 | 5.00 | 3.54 |
| 26 | 10.00 | 15.00 | 20.00 | 0.50 | 2.00 | 0.02 | 2.00 | 0.50 | 0.10 | 20.00 | 2.30 |
| 27 | 10.00 | 15.00 | 60.00 | 0.50 | 0.50 | 0.10 | 2.00 | 0.10 | 0.10 | 20.00 | 2.03 |
| 28 | 50.00 | 5.00 | 20.00 | 2.00 | 2.00 | 0.10 | 2.00 | 0.10 | 0.10 | 20.00 | 16.87 |
| 29 | 50.00 | 15.00 | 20.00 | 0.50 | 2.00 | 0.10 | 0.50 | 0.10 | 0.50 | 20.00 | 2.31 |
| 30 | 10.00 | 5.00 | 60.00 | 2.00 | 2.00 | 0.10 | 2.00 | 0.50 | 0.10 | 5.00 | 0.74 |
| 31 | 50.00 | 15.00 | 60.00 | 2.00 | 0.50 | 0.10 | 0.50 | 0.10 | 0.10 | 5.00 | 7.90 |
| 32 | 10.00 | 15.00 | 20.00 | 2.00 | 0.50 | 0.10 | 0.50 | 0.50 | 0.10 | 20.00 | 1.32 |
| 33 | 50.00 | 15.00 | 20.00 | 0.50 | 0.50 | 0.10 | 2.00 | 0.50 | 0.10 | 5.00 | 7.80 |
| 34 | 10.00 | 5.00 | 60.00 | 0.50 | 0.50 | 0.02 | 0.50 | 0.50 | 0.10 | 5.00 | 0.70 |
| 35 | 50.00 | 5.00 | 60.00 | 0.50 | 2.00 | 0.10 | 0.50 | 0.50 | 0.10 | 20.00 | 15.93 |
| 36 | 30.00 | 10.00 | 40.00 | 1.25 | 1.25 | 0.06 | 1.25 | 0.30 | 0.30 | 12.50 | 9.48 |
| 37 | 50.00 | 5.00 | 20.00 | 2.00 | 2.00 | 0.10 | 2.00 | 0.10 | 0.10 | 20.00 | 19.33 |
| 38 | 50.00 | 15.00 | 60.00 | 0.50 | 2.00 | 0.02 | 2.00 | 0.10 | 0.10 | 5.00 | 4.64 |
| 39 | 50.00 | 5.00 | 60.00 | 2.00 | 0.50 | 0.02 | 2.00 | 0.50 | 0.10 | 20.00 | 20.89 |
| 40 | 10.00 | 15.00 | 20.00 | 0.50 | 0.50 | 0.02 | 0.50 | 0.10 | 0.50 | 5.00 | 0.16 |
| 41 | 10.00 | 15.00 | 20.00 | 2.00 | 0.50 | 0.10 | 0.50 | 0.50 | 0.10 | 20.00 | 0.83 |
| 42 | 10.00 | 5.00 | 20.00 | 2.00 | 0.50 | 0.02 | 2.00 | 0.10 | 0.10 | 5.00 | 0.67 |
| 43 | 30.00 | 10.00 | 40.00 | 1.25 | 1.25 | 0.06 | 1.25 | 0.30 | 0.30 | 12.50 | 7.95 |
| 44 | 50.00 | 5.00 | 20.00 | 2.00 | 0.50 | 0.10 | 0.50 | 0.50 | 0.50 | 5.00 | 7.00 |
| 45 | 10.00 | 5.00 | 20.00 | 2.00 | 2.00 | 0.02 | 0.50 | 0.50 | 0.50 | 20.00 | 0.50 |
| 46 | 50.00 | 15.00 | 60.00 | 2.00 | 2.00 | 0.10 | 2.00 | 0.50 | 0.50 | 20.00 | 20.71 |
| 47 | 50.00 | 5.00 | 20.00 | 0.50 | 0.50 | 0.02 | 0.50 | 0.10 | 0.10 | 20.00 | 15.94 |
| 48 | 50.00 | 5.00 | 60.00 | 0.50 | 2.00 | 0.10 | 0.50 | 0.50 | 0.10 | 20.00 | 14.74 |
| 49 | 10.00 | 5.00 | 20.00 | 2.00 | 2.00 | 0.02 | 0.50 | 0.50 | 0.50 | 20.00 | 0.66 |
| 50 | 10.00 | 5.00 | 60.00 | 2.00 | 0.500 | 0.10 | 0.50 | 0.10 | 0.50 | 20.00 | 8.92 |
| 51 | 10.00 | 15.00 | 20.00 | 2.00 | 2.00 | 0.10 | 2.00 | 0.10 | 0.50 | 5.00 | 2.36 |
| 52 | 10.00 | 5.00 | 20.00 | 0.50 | 2.00 | 0.10 | 0.50 | 0.10 | 0.10 | 5.00 | 0.71 |
| 53 | 10.00 | 15.00 | 60.00 | 0.50 | 2.00 | 0.10 | 0.50 | 0.50 | 0.50 | 5.00 | 0.46 |
| 54 | 10.00 | 5.00 | 60.00 | 0.50 | 2.00 | 0.02 | 2.00 | 0.10 | 0.50 | 20.00 | 3.16 |
| 55 | 10.00 | 5.00 | 20.00 | 0.50 | 0.50 | 0.10 | 2.00 | 0.50 | 0.50 | 20.00 | 6.47 |
| 56 | 50.00 | 5.00 | 60.00 | 2.00 | 2.00 | 0.02 | 0.50 | 0.10 | 0.50 | 5.00 | 7.06 |
| 57 | 30.00 | 10.00 | 40.00 | 1.25 | 1.25 | 0.06 | 1.25 | 0.30 | 0.30 | 12.50 | 9.20 |
| 58 | 30.00 | 10.00 | 40.00 | 1.25 | 1.25 | 0.06 | 1.25 | 0.30 | 0.30 | 12.50 | 8.15 |
| 59 | 50.00 | 5.00 | 60.00 | 2.00 | 0.50 | 0.02 | 2.00 | 0.50 | 0.10 | 20.00 | 19.97 |
| 60 | 50.00 | 15.00 | 20.00 | 0.50 | 0.50 | 0.10 | 2.00 | 0.50 | 0.10 | 5.00 | 7.45 |
| 61 | 50.00 | 5.00 | 20.00 | 0.50 | 2.00 | 0.02 | 2.00 | 0.50 | 0.50 | 5.00 | 12.14 |
| 62 | 50.00 | 5.00 | 20.00 | 0.50 | 0.50 | 0.02 | 0.50 | 0.10 | 0.10 | 20.00 | 16.38 |
| 63 | 50.00 | 15.00 | 20.00 | 2.00 | 0.50 | 0.02 | 2.00 | 0.10 | 0.50 | 20.00 | 7.87 |
| 64 | 10.00 | 15.00 | 60.00 | 0.50 | 0.50 | 0.10 | 2.00 | 0.10 | 0.10 | 20.00 | 1.86 |
| 65 | 10.00 | 5.00 | 20.00 | 2.00 | 0.50 | 0.02 | 2.00 | 0.10 | 0.10 | 5.00 | 0.83 |
| 66 | 10.00 | 15.00 | 60.00 | 2.00 | 0.50 | 0.02 | 2.00 | 0.50 | 0.50 | 5.00 | 0.27 |
| 67 | 10.00 | 5.00 | 60.00 | 2.00 | 2.00 | 0.10 | 2.00 | 0.50 | 0.10 | 5.00 | 0.44 |
| 68 | 10.00 | 15.00 | 60.00 | 0.50 | 2.00 | 0.10 | 0.50 | 0.50 | 0.50 | 5.00 | 0.35 |
Table 3.
ANOVA table for the fractional factorial experimental results for screening of important medium components.
Table 3.
ANOVA table for the fractional factorial experimental results for screening of important medium components.
| Model Summary | |||||
|---|---|---|---|---|---|
| S | R-sq | R-sq(adj) | R-sq(pred) | ||
| 0.587236 | 99.56% | 99.15% | 98.37% | ||
| Source | DF | Adj SS | Adj MS | F-Value | P-Value |
| Model | 32 | 2714.85 | 84.84 | 246.02 | 0.000 |
| Linear | 10 | 1967.56 | 196.76 | 570.56 | 0.000 |
| Glutamic acid | 1 | 1276.67 | 1276.67 | 3702.14 | 0.000 |
| Citric acid | 1 | 48.28 | 48.28 | 140.02 | 0.000 |
| Glucose | 1 | 56.52 | 56.52 | 163.91 | 0.000 |
| K2HPO4 | 1 | 19.42 | 19.42 | 56.33 | 0.000 |
| MgSO4.7H2O | 1 | 3.83 | 3.83 | 11.10 | 0.002 |
| FeCl2.4H2O | 1 | 1.38 | 1.38 | 4.01 | 0.053 |
| ZnSO4.7H2O | 1 | 10.21 | 10.21 | 29.60 | 0.000 |
| MnSO4.4H2O | 1 | 52.06 | 52.06 | 150.98 | 0.000 |
| CaCl.2H2O | 1 | 4.38 | 4.38 | 12.71 | 0.001 |
| Tryptone | 1 | 494.79 | 494.79 | 1434.81 | 0.000 |
| 2-Way Interactions | 21 | 730.63 | 34.79 | 100.89 | 0.000 |
| Glutamic acid*Citric acid | 1 | 19.45 | 19.45 | 56.40 | 0.000 |
| Glutamic acid*Glucose | 1 | 14.09 | 14.09 | 40.85 | 0.000 |
| Glutamic acid* K2HPO4 | 1 | 3.49 | 3.49 | 10.13 | 0.003 |
| Glutamic acid* MgSO4.7H2O | 1 | 0.70 | 0.70 | 2.04 | 0.163 |
| Glutamic acid* FeCl2.4H2O | 1 | 20.55 | 20.55 | 59.58 | 0.000 |
| Glutamic acid* ZnSO4.7H2O | 1 | 15.50 | 15.50 | 44.95 | 0.000 |
| Glutamic acid* MnSO4.4H2O | 1 | 171.53 | 171.53 | 497.40 | 0.000 |
| Glutamic acid* CaCl.2H2O | 1 | 24.38 | 24.38 | 70.70 | 0.000 |
| Glutamic acid*Tryptone | 1 | 119.90 | 119.90 | 347.68 | 0.000 |
| Citric acid*Glucose | 1 | 78.88 | 78.88 | 228.73 | 0.000 |
| Citric acid* K2HPO4 | 1 | 3.27 | 3.27 | 9.49 | 0.004 |
| Citric acid* MgSO4.7H2O | 1 | 0.07 | 0.07 | 0.21 | 0.649 |
| Citric acid* FeCl2.4H2O | 1 | 0.03 | 0.03 | 0.10 | 0.755 |
| Citric acid* ZnSO4.7H2O | 1 | 1.51 | 1.51 | 4.37 | 0.044 |
| Citric acid* MnSO4.4H2O | 1 | 21.12 | 21.12 | 61.24 | 0.000 |
| Glucose* K2HPO4 | 1 | 39.55 | 39.55 | 114.69 | 0.000 |
| Glucose* MgSO4.7H2O | 1 | 0.36 | 0.36 | 1.04 | 0.314 |
| Glucose* FeCl2.4H2O | 1 | 0.44 | 0.44 | 1.27 | 0.268 |
| Glucose* ZnSO4.7H2O | 1 | 73.63 | 73.63 | 213.51 | 0.000 |
| K2HPO4* MgSO4.7H2O | 1 | 30.37 | 30.37 | 88.08 | 0.000 |
| K2HPO4* FeCl2.4H2O | 1 | 91.82 | 91.82 | 266.28 | 0.000 |
| Curvature | 1 | 16.66 | 16.66 | 48.32 | 0.000 |
| Error | 35 | 12.07 | 0.34 | ||
| Total | 67 | 2726.92 |
Table 4.
Regression coefficients table for the fractional factorial experimental results for screening of important medium components.
Table 4.
Regression coefficients table for the fractional factorial experimental results for screening of important medium components.
| Coded term | Uncoded term | Effect | Coef | SE Coef | T-Value | P-Value | Remark |
|---|---|---|---|---|---|---|---|
| Constant | 6.5916 | 0.0734 | 89.80 | 0.000 | |||
| A | Glutamic acid | 8.9326 | 4.4663 | 0.0734 | 60.85 | 0.000 | Significant |
| B | Citric acid | -1.7372 | -0.8686 | 0.0734 | -11.83 | 0.000 | Significant |
| C | Glucose | 1.8795 | 0.9398 | 0.0734 | 12.80 | 0.000 | Significant |
| D | K2HPO4 | 1.1018 | 0.5509 | 0.0734 | 7.51 | 0.000 | Significant |
| E | MgSO4.7H2O | -0.4891 | -0.2446 | 0.0734 | -3.33 | 0.002 | Significant |
| F | FeCl2.4H2O | -0.2941 | -0.1470 | 0.0734 | -2.00 | 0.053 | Not Significant |
| G | ZnSO4.7H2O | 0.7988 | 0.3994 | 0.0734 | 5.44 | 0.000 | Significant |
| H | MnSO4.4H2O | 1.8039 | 0.9019 | 0.0734 | 12.29 | 0.000 | Significant |
| J | CaCl.2H2O | -0.5234 | -0.2617 | 0.0734 | -3.56 | 0.001 | Significant |
| K | Tryptone | 5.5610 | 2.7805 | 0.0734 | 37.88 | 0.000 | Significant |
| AB | Glutamic acid*Citric acid | -1.1025 | -0.5513 | 0.0734 | -7.51 | 0.000 | Significant |
| AC | Glutamic acid*Glucose | 0.9383 | 0.4692 | 0.0734 | 6.39 | 0.000 | Significant |
| AD | Glutamic acid* K2HPO4 | 0.4672 | 0.2336 | 0.0734 | 3.18 | 0.003 | Significant |
| AE | Glutamic acid* MgSO4.7H2O | -0.2094 | -0.1047 | 0.0734 | -1.43 | 0.163 | Not Significant |
| AF | Glutamic acid* FeCl2.4H2O | -1.1332 | -0.5666 | 0.0734 | -7.72 | 0.000 | Significant |
| AG | Glutamic acid* ZnSO4.7H2O | 0.9843 | 0.4921 | 0.0734 | 6.70 | 0.000 | Significant |
| AH | Glutamic acid* MnSO4.4H2O | 3.2742 | 1.6371 | 0.0734 | 22.30 | 0.000 | Significant |
| AJ | Glutamic acid* CaCl.2H2O | -1.2344 | -0.6172 | 0.0734 | -8.41 | 0.000 | Significant |
| AK | Glutamic acid*Tryptone | 2.7374 | 1.3687 | 0.0734 | 18.65 | 0.000 | Significant |
| BC | Citric acid*Glucose | 2.2203 | 1.1101 | 0.0734 | 15.12 | 0.000 | Significant |
| BD | Citric acid* K2HPO4 | 0.4523 | 0.2262 | 0.0734 | 3.08 | 0.004 | Significant |
| BE | Citric acid* MgSO4.7H2O | 0.0675 | 0.0337 | 0.0734 | 0.46 | 0.649 | Not Significant |
| BF | Citric acid* FeCl2.4H2O | -0.0461 | -0.0230 | 0.0734 | -0.31 | 0.755 | Not Significant |
| BG | Citric acid* ZnSO4.7H2O | -0.3068 | -0.1534 | 0.0734 | -2.09 | 0.044 | Significant |
| BH | Citric acid* MnSO4.4H2O | 1.1489 | 0.5744 | 0.0734 | 7.83 | 0.000 | Significant |
| CD | Glucose* K2HPO4 | 1.5722 | 0.7861 | 0.0734 | 10.71 | 0.000 | Significant |
| CE | Glucose* MgSO4.7H2O | -0.1500 | -0.0750 | 0.0734 | -1.02 | 0.314 | Not Significant |
| CF | Glucose* FeCl2.4H2O | -0.1654 | -0.0827 | 0.0734 | -1.13 | 0.268 | Not Significant |
| CG | Glucose* ZnSO4.7H2O | -2.1452 | -1.0726 | 0.0734 | -14.61 | 0.000 | Significant |
| DE | K2HPO4* MgSO4.7H2O | 1.3778 | 0.6889 | 0.0734 | 9.38 | 0.000 | Significant |
| DF | K2HPO4* FeCl2.4H2O | 2.3956 | 1.1978 | 0.0734 | 16.32 | 0.000 | Significant |
| Ct Pt | 2.104 | 0.303 | 6.95 | 0.000 | Significant |
Table 5.
Optimisation of medium composition with central composite design CCD.
| Run Order | Glutamic acid | Tryptone | Glucose | γ-PGA Titre |
|---|---|---|---|---|
| 1 | 40.00 | 12.00 | 100.00 | 20.74 ± 0.60 |
| 2 | 60.00 | 24.00 | 75.00 | 22.89 ± 2.06 |
| 3 | 40.00 | 36.00 | 100.00 | 21.08 ± 1.21 |
| 4 | 40.00 | 12.00 | 50.00 | 19.56 ± 2.13 |
| 5 | 60.00 | 3.82 | 75.00 | 18.12 ± 0.55 |
| 6 | 40.00 | 36.00 | 50.00 | 20.70 ± 0.20 |
| 7 | 60.00 | 24.00 | 75.00 | 23.30 ± 4.96 |
| 8 | 60.00 | 24.00 | 117.05 | 23.05 ± 1.96 |
| 9 | 26.36 | 24.00 | 75.00 | 15.86 ± 0.40 |
| 10 | 60.00 | 24.00 | 32.96 | 25.08 ± 0.59 |
| 11 | 80.00 | 36.00 | 50.00 | 24.05 ± 0.30 |
| 12 | 93.64 | 24.00 | 75.00 | 21.42 ± 2.63 |
| 13 | 80.00 | 36.00 | 100.00 | 22.18 ± 1.83 |
| 14 | 80.00 | 12.00 | 100.00 | 22.58 ± 1.33 |
| 15 | 80.00 | 12.00 | 50.00 | 21.73 ± 0.20 |
| 16 | 60.00 | 24.00 | 75.00 | 23.32 ± 1.67 |
| 17 | 60.00 | 24.00 | 75.00 | 24.37 ± 2.02 |
| 18 | 60.00 | 44.18 | 75.00 | 24.37 ± 0.63 |
| 19 | 60.00 | 24.00 | 75.00 | 23.54 ± 0.20 |
| 20 | 60.00 | 24.00 | 75.00 | 23.60 ± 1.04 |
Table 6.
ANOVA table for optimisation of medium components using central composite design.
| Model Summary | |||||
|---|---|---|---|---|---|
| S | R-sq | R-sq(adj) | R-sq(pred) | ||
| 1.07895 | 88.20% | 77.58% | 17.23% | ||
| Source | DF | Adj SS | Adj MS | F-Value | P-Value |
| Model | 9 | 87.0311 | 9.6701 | 8.31 | 0.001 |
| Linear | 3 | 38.0033 | 12.6678 | 10.88 | 0.002 |
| Glutamic acid | 1 | 23.2282 | 23.2282 | 19.95 | 0.001 |
| Typtone | 1 | 14.1703 | 14.1703 | 12.17 | 0.006 |
| Glucose | 1 | 0.6048 | 0.6048 | 0.52 | 0.488 |
| Square | 3 | 46.6228 | 15.5409 | 13.35 | 0.001 |
| Glutamic acid*Glutamic acid | 1 | 38.5913 | 38.5913 | 33.15 | 0.000 |
| Typtone*Typtone | 1 | 7.3758 | 7.3758 | 6.34 | 0.031 |
| Glucose*Glucose | 1 | 1.1429 | 1.1429 | 0.98 | 0.345 |
| 2-Way Interaction | 3 | 2.4051 | 0.8017 | 0.69 | 0.579 |
| Glutamic acid*Typtone | 1 | 0.0242 | 0.0242 | 0.02 | 0.888 |
| Glutamic acid*Glucose | 1 | 0.8321 | 0.8321 | 0.71 | 0.418 |
| Typtone*Glucose | 1 | 1.5488 | 1.5488 | 1.33 | 0.276 |
| Error | 10 | 11.6413 | 1.1641 | ||
| Lack-of-Fit | 5 | 10.4284 | 2.0857 | 8.60 | 0.017 |
| Pure Error | 5 | 1.2129 | 0.2426 | ||
| Total | 19 | 98.6724 | |||
| Response Surface Regression: PGA Titre versus Glutamic acid, Tryptone, Glucose | |||||
| Term | Coef | SE Coef | T-Value | P-Value | VIF |
| Constant | 23.491 | 0.440 | 53.38 | 0.000 | |
| Glutamic acid | 1.304 | 0.292 | 4.47 | 0.001 | 1.00 |
| Typtone | 1.019 | 0.292 | 3.49 | 0.006 | 1.00 |
| Glucose | -0.210 | 0.292 | -0.72 | 0.488 | 1.00 |
| Glutamic acid*Glutamic acid | -1.636 | 0.284 | -5.76 | 0.000 | 1.02 |
| Typtone*Typtone | -0.715 | 0.284 | -2.52 | 0.031 | 1.02 |
| Glucose*Glucose | 0.282 | 0.284 | 0.99 | 0.345 | 1.02 |
| Glutamic acid*Typtone | 0.055 | 0.381 | 0.14 | 0.888 | 1.00 |
| Glutamic acid*Glucose | -0.323 | 0.381 | -0.85 | 0.418 | 1.00 |
| Typtone*Glucose | -0.440 | 0.381 | -1.15 | 0.276 | 1.00 |
Table 7.
Model Summary, ANOVA and Regression coefficients for Transformed Response.
| S | R-sq | R-sq(adj) | R-sq(pred) | |||
|---|---|---|---|---|---|---|
| 0.985652 | 82.38% | 77.68% | 55.50% | |||
| Source | DF | Adj SS | Adj MS | F-Value | P-Value | |
| Model | 4 | 68.123 | 17.0308 | 17.53 | 0.000 | |
| Linear | 2 | 29.535 | 14.7674 | 15.20 | 0.000 | |
| Glutamic acid | 1 | 16.602 | 16.6022 | 17.09 | 0.001 | |
| Typtone | 1 | 12.933 | 12.9325 | 13.31 | 0.002 | |
| Square | 2 | 38.589 | 19.2943 | 19.86 | 0.000 | |
| Glutamic acid*Glutamic acid | 1 | 33.707 | 33.7068 | 34.70 | 0.000 | |
| Typtone*Typtone | 1 | 7.425 | 7.4249 | 7.64 | 0.014 | |
| Error | 15 | 14.573 | 0.9715 | |||
| Lack-of-Fit | 10 | 12.932 | 1.2932 | 3.94 | 0.072 | |
| Pure Error | 5 | 1.641 | 0.3282 | |||
| Total | 19 | 82.696 | ||||
| Regression coefficients | ||||||
| Term | Coef | SE Coef | T-Value | P-Value | VIF | |
| Constant | 9.185 | 0.341 | 26.92 | 0.000 | ||
| Glutamic acid | 1.103 | 0.267 | 4.13 | 0.001 | 1.00 | |
| Typtone | 0.973 | 0.267 | 3.65 | 0.002 | 1.00 | |
| Glutamic acid*Glutamic acid | -1.522 | 0.258 | -5.89 | 0.000 | 1.01 | |
| Typtone*Typtone | -0.714 | 0.258 | -2.76 | 0.014 | 1.01 | |
Table 8.
γ-PGA productivity results.
| Time interval (h) | Δ γ-PGA (g/L) | Productivity (g/L·h) |
|---|---|---|
| 0 – 24 | 31.41 | 1.31 |
| 24 – 48 | 31.03 | 1.29 |
| 48 – 72 | 7.16 | 0.30 |
| 72 – 96 | 5.76 | 0.24 |
Table 10.
Comparison of the (γ- PGA titres and productivity obtained in this study versus literature.
Table 10.
Comparison of the (γ- PGA titres and productivity obtained in this study versus literature.
|
Strain |
γ-PGA Titre (g/L) | Productivity (g/L·h) | Reference |
|---|---|---|---|
| Bacillus subtilis MJ80 | 75.5 (3L fermenters) 68.7 (300 L fermenters) |
~1.04 0.95 |
[39] |
| Bacillus licheniformis P-104 | 41.6 | 1.07 | [49] |
| Bacillus halotolerans F29 | 50.9 | 1.33 | [49] |
| Bacillus velezensis SDU | 23.1 | 0.77 | [21] |
| Bacillus subtilis ZJU-7 | 54.4 | Not reported | [36] |
| Bacillus licheniformis NCIM 2324 | 35.75 | Not reported | [27] |
| Bacillus licheniformis A14 | 37.8 | Not reported | [26] |
| Bacillus methyotrophicus SK19.001 | 35.34 | Not reported | [50] |
| Bacillus licheniformis ATCC 9945 | 66.1 | Not reported | [51] |
| Bacillus subtilis GXD-20 | 22.29 | Not reported | [43] |
| Bacillus tequilensis BL01 | 25.73 | 0.48 | [33] |
| Bacillus licheniformis DPC6338 | ~ 81 - 84 (bioreactor) 75 (shake flask) |
~ 1.75 | This study |
Disclaimer/Publisher’s Note: The statements, opinions and data contained in all publications are solely those of the individual author(s) and contributor(s) and not of MDPI and/or the editor(s). MDPI and/or the editor(s) disclaim responsibility for any injury to people or property resulting from any ideas, methods, instructions or products referred to in the content. |
© 2026 by the authors. Licensee MDPI, Basel, Switzerland. This article is an open access article distributed under the terms and conditions of the Creative Commons Attribution (CC BY) license (http://creativecommons.org/licenses/by/4.0/).
Copyright: This open access article is published under a Creative Commons CC BY 4.0 license, which permit the free download, distribution, and reuse, provided that the author and preprint are cited in any reuse.


