Submitted:
02 January 2026
Posted:
04 January 2026
You are already at the latest version
Abstract
Mangroves represent a key component of coastal ecosystems. From 1897 to 2024, Taiwan’s southwest coast experienced marked climatic shifts, including a 2.0 °C increase in average annual temperature and a 56.5 mm reduction in annual rainfall. Among 18 coastal towns in western Taiwan, Taixi Township in Yunlin County exhibited a cumulative land subsidence of −283.0 cm from 1975 to 2023. The grey/white mangrove (Avicennia marina) in regions with severe subsidence exhibited slow growth or mortality. In the present study, mangrove area (MA) was estimated using a quadratic polynomial trend equation. The total MA at Tougang Ditch was −0.0084(t − 21.0)2 + 2.8, with t = 21.0 in 1995, and that at Budai Lagoon was −0.0468(t − 12.3)2 + 26.1, with t = 12.3 in 1986, supported by high coefficients of determination (R² > 0.85), respectively. SPOT-6 satellite images from February 22, 2025, were used to assess the coastal landscapes of Chiayi County and Tainan City. The total MA and windbreak forest area were 281.9 and 896.3 ha, respectively. The long-term assessment method introduced in this study may help predict mangrove health and carbon sink stocks and refine carbon sequestration estimates in subsidence or sea-level-rise regions.
Keywords:
Avicennia marina
; blue carbon
; climate change
; land subsidence
; mangrove
; sea level rise
1. Introduction
1.1. Implications of Climate Change
Taiwan has a tropical climate with distinct wet and dry seasons, with a rainy summer (April to September) and a dry winter (October to March). Rainfall during the wet season is approximately 10 times that during the dry season, and annual rainfall fluctuates considerably [1]. During the rainy season, increased freshwater supply reduces salinity, which promotes photosynthesis and plant growth, ultimately resulting in higher leaf area index values than those noted during the dry season [2]. However, runoff from land-based sediments and organic matter enters coastal areas where mangroves grow [3,4]. The semiannual amount of rainfall is strongly correlated with the semiannual radius growth of mangroves (correlation coefficient: > 0.9) [4]. Rainfall is also associated with annual ring width in planted white spruce (Picea glauca) [5]. This association is reflected by a net primary productivity of 8.82 grams of carbon per square meter per day [6].
1.2. Mangroves
Mangroves are plant communities that grow in intertidal zones of tropical and subtropical estuaries, lagoons, and bays [7,8,9]. These salt-tolerant plants bring rich nutrients to estuaries through water exchange and deposition driven by river flow and tides [10,11,12,13]. In addition to serving as highly productive ecosystems with academic value, mangroves play crucial roles in maintaining ecological balance and protecting the environment. Mangroves provide habitats in which birds, benthic organisms, and fish (e.g., juveniles of Lutjanus cyanopterus) reproduce and survive [14,15,16]. These plants support abundant benthic organisms, facilitating the formation of a complete food web [15,16,17,18]. Furthermore, mangroves maintain the stability and diversity of fish communities [10,19,20,21,22], thereby supporting fishery resources. Studies have revealed that the distributions of large, medium, and small fish were 18.2%, 24.2%, and 57.6%, respectively, including 32 fish species listed in the International Union for Conservation of Nature Red List [2,22].
1.3. Changes in Taiwan’s Mangrove Landscape
Comprehensive surveys have revealed changes in the area, species composition, and diversity of Taiwan’s mangroves that have occurred over time [17,23]. Mangrove area (MA) in 37 major distribution regions increased slowly from 178 ha in 1966 to 226 ha in 1986 and then rapidly to 586 ha between 1986 and 2011; of the total MA, the area covered by the grey/white mangrove Avicennia marina was approximately 320 ha [17,24,25]. Taiwan currently has approximately 681 ha of mangroves, which constitute major ecosystems and blue carbon sources in coastal regions [9,25,26].
Mangroves provide habitats for prawns (e.g., Exopalaemon carinicauda), crabs (e.g., Metaplax elegans), and fishes (e.g., Gerres erythrourus), shellfish (e.g., Fronsella taiwanica) [27]. Large mangrove stands in southwest Taiwan’s Danshueih, Puzih, Jishui, Cigu, and Yanshuei estuaries often attract egrets to nest and breed [28,29,30,31]. Mature mangrove forests harbor diverse insects and spiders [27,32,33] and serve as carbon sinks across regions [34,35,36,37].
1.4. Land Subsidence
Climate change is causing the sea level to rise. Additionally, research has revealed global land subsidence due to groundwater overpumping in Egypt [38] and mining in New Zealand [18]. The ascending respiratory roots of A. marina are often submerged in seawater. Tropical and subtropical regions that support winter growth of sea cucumbers now face land subsidence at a rate faster than that of sea level rise [19], particularly in South Asia, Southeast Asia, and East Asia [39,40,41]. In China’s Zhuhai, the maximum rate of annual land subsidence has reached −11.0 cm [18,42]. In Taiwan’s Pingtung County, the average annual land subsidence rate at the Linbian River Pingtung County, the coastal Preventing, Taiwan, was −18.4 cm from 1966 to 1983, and −4.5 cm from 1994 to 2024, corresponding to a cumulative subsidence of −590 cm 1966 to 2024 [43,44], causing recurring property losses during heavy rainfall.
1.5. Effects and Assessment of Land Subsidence in Coastal Taiwan
Large areas of A. marina originally existed at Dongshih Lagoon (DS) in Taiwan’s Chiayi County. Between 1962 and 1963, the county government introduced Kandelia obovata mangroves from the Tamsui River, Taipei [45]. In 1963 and 1964, approximately 110 ha mangroves of A. marina, A. officindlis, and Rhizophora conjugatam, respectively, were introduced at Cigu Lagoon, Tainan City [45]. However, Dongshih has been facing land subsidence since 1970. In 1988, the total MA in this region was only approximately 51 ha [46]. By 1990, A. marina mangroves along the coast of the Xingcuoliao and Xinjiezhuang villages had sunk or died due to land subsidence (Figure 1) [4,24,47]. If this pattern continues, mangroves may subsequently re-establish at displaced sites [48].
Originally, DS had approximately 40 ha of A. marina, Puzih Estuary (PZ; Chiayi County) had approximately 3 ha of K. obovata and A. marina, Budai Lagoon (BD; Chiayi County) had approximately 30 ha of A. marina, and Jishui Estuary (JS; Tainan City) had approximately 50 ha of mangroves [9,10,47,49].
In 1975, the mangrove forests at JS were dominated by A. marina, with very few Lumnitzera racemosa, K. obovata, and Excoecaria formosana. Initially, the south bank was not subjected to seaside development or embankment reconstruction. The seaside was developed in 1989, and the embankment was reconstructed in 2009. Reconstruction of embankments or redirection of water flow resulted in varying degrees of erosion or siltation in river-mouth mudflats, modulating changes in MA. In 1975, the Water Resources Agency (Ministry of Economic Affairs) started monitoring land subsidence to investigate long-term subsidence due to groundwater overpumping in the west coast of Taiwan [50,51]. Geographic information system technology and high-speed satellite imagery have since been used to analyze changes in MA [52,53]. The compounding effects of climate change are analyzed by incorporating relative increase in sea level, defined as the sum of land subsidence and sea level rise [54].
1.6. Mangrove Productivity and Carbon Sequestration
In India, A. marina has high growth efficiency and biomass yield. Its carbon stock (t/ha) is 75% higher than that of local R. mucronata and 3–8 times higher than that of A. marina in Taiwan [9]. Fan evaluated annual litterfall in mangroves and sea sedge at JS from October 2002 to September 2004 and reported that the total annual litterfall values were 11.78 and 12.55 Mg/ha/year, respectively [10,55]. Another study indicated that the average net photosynthetic rate of sea sedge in Taijiang National Park was 4.87 μmol/m2/s [56]. Li reported that the annual carbon storage of sea sedge at Cigu Wetland and Sihcao Wetland (SC) was 12.64 Mg C/ha/year and that the net ecosystem production was 5.83 Mg C/ha/year (46.1%) [57]. Wu reported that the annual carbon storage of sea cucumber in Fangyuan, Budai, Beimen, and Cigu was Mg C/ha/year; the corresponding net production rates were 15.67, 10.002, 7.08, and 12.64 Mg C/ha/year [35]. The carbon storage amounts for Budai and Beimen were only 77.6% and 58.1% higher than those for Cigu and Sihcao. Wu attributed the low net production of A. marina at Budai and Beimen to its proximity to the estuary [35]. Chang attributed the low net production of A. marina at Puzi and Beimen mainly to land subsidence [4]. Severe subsidence reduced the annual growth radius of sea eggplant and led to gradual mortality [4]. The aforementioned inconsistent conclusions indicate a need for further research involving sampling from areas with different amounts of stratum subsidence. In the present study, we investigated the implications of climate change and the adaptive responses of A. marina by analyzing long-term changes in MA.
2. Methods
2.1. Study Sites
Between 2009 and 2025, nine sampling sites along Taiwan’s west coast—from Chiayi County to Tainan City—spanned approximately 100 km. Analysis was performed in two phases. The following sites were analyzed during the first phase (2009–2012): DS (23.48163N, 120.14454E) and BD (23.36710E, 120.14877N), where mangroves have been dead for many years [24,46], as well as JS (23.24360N, 120.09461E) and Tougang Ditch (TG; 23.27696N, 120.12039E), where mangroves are nearly dead. The study sites further included areas with slight to severe land subsidence: SC (23.03181N, 120.14703E) and Jiangjun Estuary (JJ; 23.22543N, 120.11598E). The sampling areas are described from north to south.
DS lies south of the Beigang River, Liujiao Ditch, and Aogu Wetland. It contains shallow waters protected to the west by Waisanding Sand Bar. Notably, DS is a key oyster farming area in Chiayi County. Here, A. marina mangroves were planted in 1962–1963, but they have disappeared because of severe land subsidence [5,26].
BD is located on the south side of Budai Harbor in Chiayi County and on the west side of the Cwan West Coast Expressway. It is another key oyster culture area in Chiayi County. The lagoon previously hosted A. marina mangroves, but they have disappeared because of land subsidence.
JS extends from the estuary to Wuwang Bridge. Historically, it supported abundant Sanguinolaria diphos (Bivalvia) and was egret camp. Mangroves at JS are dominated by A. marina, with L. racemosa, K. obovata, E. formosana, and Volkameria inermis scattered along the southern coast, some A. marina may develop pendent roots to protect itself before dying [4]. In spring 2011, 10 mangrove tree samples were collected from JS (Figure 1).
TG is a tributary of the Jishui River. In spring 2011, 10 dead tree samples were collected from TG (Figure 1).
JJ is flows into Beimen Lagoon. The riverbanks of JJ are covered with K. obovate and E. formosana, as well as water lilies that have drifted in from elsewhere. After the river was cleaned up, some of the woodland was isolated in the low-lying areas outside the embankment.
SC is on the west coast of Taiwan, where slight land subsidence occurs. It was included as the reference site. Mangroves grew at SC after construction of the West Coast Highway. Notably, mangroves at SC were used to infer the time of death for those at TG. In spring 2011, four living mangroves were collected from SC.
The second phase (2023–2025) included four sampling sites with relatively low land subsidence: PZ (23.47840N, 120.19535E) and Haomeiliao Wetland (HM, 23.36400N, 120.13357E) in Chiayi County as well as Syuejia Wetland (SJ; 23.27752N, 120.16749E) and JJ in Tainan City (Figure 2).
2.2. Subsampling Sites at JS
Not all mangroves were cut down during the reconstruction of Jishui River embankment. Some mangroves in this area disappeared because of land subsidence [4,50,51]. Therefore, in this study, we divided the JS site into seven small subsites (JS-A–JS-G). JS-A has a spur, and new beach area form every year. JS-B has a new dike, which contains mangroves. It was constructed between 1989 and 2002 after the removal of tidal channels to fishponds. JS-C is near fishponds, JS-D and JS-G are near tidal zone. JS-F was formed by enclosing part of the Beimen Salt Pan in the waterway during the reconstruction of the dike. A tidal channel lies between JS-G and JS-F (Figure 3). In the present study, areas disturbed because of dike construction were separated as much as possible. MAs of the seven sites were calculated for the period from 1975 to 2012. In addition, a carbon sink attenuation curve was generated for A. marina in the site with relatively low land subsidence.
2.3. Study Overview
All A. marina samples were sawed off from tree trunks close to the roots and brought to our laboratory at Kun Shan University. For each tree, the width of the growth rings was measured during the dry and wet seasons every year (precision = 0.01 mm). Data for each tree were compiled to form a series. The annual ring width for each tree was calculated with consideration of the ring width during wet season and that during dry season: [YRs,i(X)], where s is the site, i is the tree’s serial number, and X is the year. The series were used to estimate tree age, the average annual ring width for each site and year, and the average [YRS(X)] series for each site.
2.4. Analysis of Long-Term Climate Data
Annual and monthly rainfall and average temperature data (1897–2024) were collected from the Former Tainan Meteorological Station (TN) [1]. The following long-term climate trend models were used: the linear rainfall equation PLT(X) = aX + b and the linear temperature equation TLT(X) = cX + d, where a, b, c, and d denote constants and X denotes the year (1–128 years: 1897–2024) [58,59]. Jagged line graphs that could cause confusion were eliminated using the dynamic mean or smoothing process [4,60,61,62]. The rainfall time-series sequence for Tainan (N = 19) was calculated as follows: PTS(X) = Avg[(P(X − 18),…, P(X))], X = 1915–2024. The rainfall time-series sequences were analyzed to assess long-term fluctuations in rainfall. The period from April to September constitutes the wet season in Taiwan (average monthly rainfall > 70 mm), whereas that from October to March constitutes the dry season (average monthly rainfall < 70 mm).
The half-year rainfall series sequence of TN was HP(TN,X). Alternating wet and dry half-year seasons exerts cyclical [62] and staggered effects on plant growth (half-year radius growth rate or MA size). The half-year rainfall time-series sequence was HPTN(X) = (HP(TN,X − 1) + HP(TN,X))/2, where X = 1–40.
Plant biodiversity is often lost under unsuitable climate conditions (e.g., temperature, rainfall, and conductivity) and altered land-usage scenarios [63]. These factors not only reduce biodiversity but also decelerate plant growth and compromise carbon storage [4]. Rainfall introduces abundant nutrients from the upstream catchment and reduces seawater salinity in estuaries, thereby accelerating mangrove growth and increasing trunk ring width [12]. The occurrence of wet years in Taiwan has shifted from once every 19 years to once every 7 years, whereas that of drought has shifted from once every 17 years to once every ≤ 9 years [64]. Therefore, indicating that Taiwan is also currently experiencing 「droughts and floods」.
By measuring the annual increase in the ring radius of 24 mangrove, we generated the matrix [YR(X,S)]24x37, where the row X indicates the year (1973–2010) and the columns indicate three study sites on Taiwan’s west coast (JS, TG, and SC) and corresponding tree counts (4 to 10). Notably, some elements were blank.
The YR(X,S) series for each tree was compared with Tainan’s annual rainfall data for the same period. Similarity analyses were performed using Resemblance in PRIMER 7 [65]. The average value of YR(X,S) for the same study site in the same year was calculated to obtain a new series for long-term dynamic analysis (quadratic polynomial trend equation, intersite differences in land subsidence, and subsidence outcomes).
2.5. Estimation of Land Subsidence
According to the Water Resources Agency groundwater in coastal Taiwan has been overextracted to meet the demand of the booming aquaculture industry [50]. This has resulted in groundwater salinization and land subsidence. The worst-hit areas include Changhua County, Yunlin County, Chiayi County, Tainan City, Pingtung County, and Yilan County [50,51].
Monitoring data for the following regions were obtained from the Water Resources Agency: Changhua County (N = 58, 1979–2023), Yunlin County (N = 95, 1975–2023), Chiayi County (N = 125, 1986–2023), and Tainan City (N = 84, 1987–2023). Land subsidence data were compiled up to 2023. If monitoring records were missing for some years, data were imputed using the internal-difference method. Notably, data for Beimen District in Tainan City were obtained using the same monitoring schedule that was used in Chiayi County. The monitoring data was analyzed to identify the effects of land subsidence on mangrove growth rate and coverage area.
2.6. Estimation of MA for the Period from 1975 to 2025
The literature describes mangrove distributions across years, offering time-series data for mapping mangroves and estimating MA [4,66]. In the present study, we assessed changes in MA by using the following maps: (1) the 1975 Orthophoto Map from the Aerial Survey Office of the Ministry of Agriculture; (2) 1:5000 aerial photographs from 1983, 1989, 1991, 2002, 2009, and 2012, collected from the Aerial Survey Office, and the 1:5000 Taiwan Digital Map, prepared by the Van and referenced to aerial color orthoimages from the Aerial Survey Office; (3) the 2007 Google Map; and (4) SPOT-7 images from March 22, 2017, and January 13, 2023, and SPOT-6 images from February 22, 2025. These data sets covered the entire west coast of Taiwan.
For data conversion, the 1:5000 photograph base map (paper) was purchased from the Agricultural and Forestry Aerial Survey Institute and scanned into a .tif file (Appendix 1). It was digitized into a Taiwan Datum 1997 (TWD97) coordinate system by using the Georeferencing function in Esri’s ArcGIS 10.8 [64,67,68].
In the maps of 1975 and 1983, horsetail trees (Casuarina sp.), fishponds, dry fields, and rice fields were marked along the beach, estuary, and riverside. The term “mangroves” first appeared in the 1989 maps. Early identification relied on mangrove vegetation near the waterline. MAs were depicted individually on the basis of their ability to withstand high and low tides [66]. The orthoimage digital files purchased from the Agricultural and Forestry Aerial Survey Institute contained TWD97 coordinates. The resolution was 0.5 × 0.5 m2 in 2002 and 0.25 × 0.25 m2 in 2009 and after 2012. The high resolution facilitated the identification and depiction of individual mangroves in river channels. In 2017, SPOT-7 satellite images were purchased from the Center for Space Remote Sensing Research at National Central University. These images contained TWD97 coordinates, had a resolution of 1.5 × 1.5 m2, and included red–green–blue + near-infrared bands. Using the unsupervised classification (Iso Cluster Unsupervised Classification) function in ArcMap, we identified mangrove vegetation in high and low tidal areas. Because of the low resolution, distinguishing very small patches was challenging. Upstream areas of Jishui Creek, east of South Highway 1, contained mixed vegetation comprising mangroves, mixed woods, and crops. Because these areas formed relatively recently, corrections were made after onsite inspection and comparison.
Satellite images obtained from the Center for Space and Remote Sensing Research included one SPOT-7 image acquired on March 22, 2017 (Center for Space and Remote Sensing Research 2024). From these images, we estimated mangrove coverage within the study sites. As mentioned, the JS site was divided into seven subsites (JS-A–JS-G) (Figure 2 and Figure 3) to separate areas disturbed by the restoration project. The MA of each subsite between 1975 and 2012 was calculated.
Two onsite surveys were conducted in December 2014 and August 2023. The results revealed very few K. obovata and A. marina scattered along the riverside approximately 300 m upstream of the Puzi River Port Bridge in Chiayi County. Notably, because of the low plant count, small area, strip-shaped patches, and mixed growth with agarwood and bitterwood shrubs, the SPOT-7 satellite image from March 22, 2017, was difficult to interpret. Therefore, the area upstream of the Port Bridge was excluded from analysis [69].
Finally, the mangrove cover matrix in each study area was calculated as MA(S,t), where S is the site and t is the time: 1–43, representing December 1975–2017.
2.7. Estimation of Annual Ring Width in Mangroves
2.7.1. Estimation of Half-Year Radius Growth Time-Series Sequences
In spring 2011, samples were collected from 10 trees at JS and 4 trees at SC. TG contained 10 dead and leafless A. marina trees (total: 24 trees). Samples collected from mangrove trunks close to the roots were taken to our laboratory, where they were cross-sectioned and half-year radius growth time-series sequences for the dry and wet seasons were measured. These sequences are expressed as HG(S,X,i), where S represents the three study sites (JS, SC, and TG), X represents the half-year sequence (X = 1–79, corresponding to April 1972–April 2011), and i represents the tree code [6].
Many scholars have measured tree rings to estimate long-term annual rainfall, MA, biodiversity, nutrient intak, and carbon sequestration [5,64,69,70,71,72]. Some scholars have demonstrated that tree rings do not necessarily form once a year; some mangroves can produce 7 rings every 4 years [74,75]. To accurately identify the association between annual ring width and rainfall, we avoided radial lines that crossed ≥ 2 rings within a year when measuring the horizontal cross-sections of mangroves.
Because mangroves at TG died or experienced severe decay, the half-year radius growth time-series sequence HGTG(X,i) for each dead A. marina was realigned with the half-year rainfall series sequence HPTN(X) by using the dynamic average HGTG(X,i) = (HG(TG,X − 1,i) + HG(TG,X,i))/2, significant differences in growth between the dry and wet seasons [6], and the permutation-order scale-invariant feature transform method. The best match between the two series was used to infer the lifespan of each dead A. marina tree. Then, the average values for trees of the same age with a known lifespan at TG were combined to form a new half-year radius growth time-series sequence, HG(TG,X). The five oldest A. marina trees were used to construct another half-year radius growth time-series sequence, HG(older-TG,X). The similarity between HG(older-TG,X) and HPTN(X) was approximately 91%, whereas that between HG(SC,X) and HP(TN,X) was approximately 93% [4]. The average half-year ring-width time series for A. marina in the same year is expressed as [HG(S,X)].
For each study site, the annual ring-width time series [YRS(X)] was used to derive the quadratic trend line YRS(X) = −k(X − a)2 + b (X = 2–37). A positive value of −k indicated no land subsidence or minimal subsidence, whereas a negative value indicated land subsidence. The parameter a represents the year corresponding to the maximum value, whereas the parameter b represents the maximum annual radius growth for the site.
2.7.2. Analysis of Long-Term Trends in MA
Using six sets of aerial images and two satellite images from 1975 to 2012, we obtained the long-term MA series (MA(S,t)), where S represents DS, BD, JS, TG, or JS-A–JS-G and s 1–37 of t (1975–2012). The quadratic polynomial trend equation for the long-term MA series is expressed as follows: MAS(t) = −k(t − a)2 + b (t = 2–37), where site S has the largest area b in year a.
3. Results
3.1. Long-Term Changes in Annual Temperature and Rainfall
Climate records (1897–2024) from TN revealed average monthly rainfall of 267.0 ± 145.2 mm during the wet season (April to September, N = 128) and 27.0 ± 9.0 (16.4–39.2) mm during the dry season (October to March), indicating a clear seasonal contrast. The average annual temperature was 23.8 °C ± 0.7 °C (N = 128). It increased by 2.04 °C during the observation period and followed a long-term trend of TLT(X) = 0.0159X + 22.813 (R2 = 0.7326) (Figure 4). The average annual rainfall was 1748.2 ± 532.1 mm. It decreased by 56.5 mm during the observation period and followed a long-term trend of PLT(X) = −0.4412X + 1776.7 (X = 1 was 1897 and X = 128 was 2024). Time-series sequence (PTS) analysis indicated that a wet period occurred approximately every 19 years; however, the last occurrence was in 1977. Subsequent intervals shortened and rainfall declined (Figure 5).
3.2. Land Subsidence Along the West Coast of Taiwan
Data (1975 to 2023) collected from the Water Resources Agency indicated extensive land subsidence from Shengang Township, Changhua County, southward to Annan District, Tainan City. The most severe subsidence occurred in Taixi Township, Yunlin County (−283.0 cm). In Chiayi County, Dongshih Township and Budai Township had a subsidence of −233.6 and −179.4 cm, respectively. In Tainan City, Beimen District and Syuejia District had a subsidence of −153.3 and −104.0 cm, respectively (Table 1; Figure 6).
Among the three sites surveyed in 2009 and 2010, JS and TG were located in severely subsided areas and experienced an average annual subsidence of −3.27 and −3.48 cm, respectively.
3.3. Changes in MA from 1975 to 2025
Orthophoto maps, 1:5000 aerial photographs, 1:5000 Taiwan Digital Map, Google Map, and SPOT-7 images from March 22, 2017, indicated that mangroves at DS, BD, JS, and TG were gradually disappearing or had completely disappeared. The MA across these four sites was 118.7 ha (Table 2). Mangroves at PZ expanded upstream to 77.6 ha (Figure 7). After mangroves in the middle of BD died, only those near the windbreak of Haomeiliao Wetland on the inner side of the sandbar remained (Figure 8). At JS, mangroves covered 17.5 ha. In 2017, mangroves were expanded upstream to SJ, reaching 23.3 ha in 2017 (Figure 9).
Spatiotemporal changes in MA along Taiwan’s southwest coast from 1975 to 2017 were assessed using aerial images from 1975, 1983, 1989, 2002, 2009, and 2012. Subsequently, it declined because of salt-field development, Provincial Highway 61 construction, and continual land subsidence, with areas of 14.6, 35.5, … and 0.0 ha. MA at JS covered 21.4, 9.9, … and 15.6 ha, whereas that at TG covered 0.8, 2.2, … and 0.2 ha. JJ retained only 0.8 ha of K. obovata on the south bank because of extensive reclamation. MA across the DS, BD, JS, and TG sites increased from 61.2 ha in 1975 to 118.7 ha in 2017.
3.4. Long-Term Trends in MA
On the basis of the area estimated from 6 aerial photographs and satellite images from 1975 to 2012, we performed a quadratic polynomial trend analysis of the MA series at TG. The result was MATG(t) = −0.0084(t − 21.0)2 + 2.8 (R2 = 0.7274, t = 1–38). At TG, MA was the largest in 1995 (2.8 ha), consistent with the time-series estimation results for annual ring width. Quadratic polynomial trend analysis for BD site revealed that MABD(t) = −0.0468(t − 12.3)2 + 26.1 (R2 = 0.7827, t = 1–38). At BD, MA was the largest in 1986 (26.1 ha; Figure 13).
MAs at JS-A (new beach formed because of diversion work) and JS-E (old salt beach incorporated into the river) increased exponentially, whereas MAs at JS-C, JS-D, and JS-G (three smaller sites near the river mouth) decreased. The results were as follows (Figure 14): MAJS-C(t) = −0.0201(t − 14.3)2 + 7.0 (R2 = 0.8554), MAJS-D(t) = −0.0093(t − 15.8)2 + 2.2 (R2 = 0.8956), and MAJS-G(t) = −0.0077(t − 11.6)2 + 4.3 (R2 = 0.908). At JS-C, JS-D, and JS-G, MA was the largest at t = 14.3 in 1996, t = 15.8 in 1998, and t = 11.6 in 1994, which aligned closely with the timing of the largest MA at TG (1995; Figure 13).
3.5. MA in 2025
MA was estimated using SPOT 6 satellite images of the coastal area spanning the Beigang River in Chiayi County to the Jiangjun River in Tainan City, with the images captured on February 22. The total MA and windbreak forest area were 281.9 and 896.3 ha, respectively.
MA was the largest (109.1 ha) at the estuary of the Jishui River (including SJ and TG). The second largest MA (85.4 ha) was at the mouth of Puzi Estuary (including the upstream section of Dongshih East Bridge). The third largest MA (57.1 ha) was on the east side of Haomeiliao Sandbar. Mangroves at Bajhang Estuary (including the channel south of the dike) covered 25.2 ha, whereas those at the Jiangjun River covered 4.9 ha. The Jiangjun River supported K. obovata and E. formosana. Windbreak forest area was the largest at Aogu (787.6 ha), followed by at Shuangchun (61.6 ha) and Jiangjun Estuary (47.1 ha; Figure 15).
3.6. Annual Ring Width
In the first phase (2009–2012), similarity between average annual ring width and rainfall at TN was used to infer the age of each A. marina tree at TG. The lifespan was calculated from 1973 to 2008. The similarity between average annual ring width and annual rainfall was 80.0% at TG and 84.3% at JS. The annual ring-width time series—YRsite(X) values—for all A. marina trees across the SC, TG, and JS sites were combined and analyzed. The average annual ring width at SC was 1.98 ± 0.34 mm/year (N = 4), that at TG was 1.38 ± 0.39 mm/year (N = 10), and that at JS was 1.04 ± 0.26 mm/year (N = 10). The TG and JS were lower than that at SC.
3.7. Trends in Annual Ring Width and Land Subsidence
At SC, the quadratic polynomial trend line was YRSC(X) = −0.0025(X − 34.4)2 + 2.151 (R2 = 0.4189, N = 4). At TG, the quadratic polynomial trend line of average annual ring width was YRTG(X) = −0.002(X − 25.7)2 + 1.716 (R2 = 0.8233, N = 10). The annual radial increment was the fastest in 1998. At JS, the quadratic polynomial trend line was YRJS(X) = −0.0032(X − 32.8)2 + 2.644 (R2 = 0.7853, N = 10). The annual radial increment was the fastest in 2005. The annual radial increment was the fastest in 2007 (Figure 16). The average annual rates of land subsidence at JS, TG, and SC were −4.34, −5.21, and −1.43 cm, respectively (Table 3).
4. Discussion
Calculations based on 24 mangrove samples collected from the west coast of Taiwan revealed that the linear equation for annual radius growth was RJS(X) = 2.3705X − 4.5357 (R2 = 0.9945, X = 1–37). The slope of this equation is 90.5% lower than that of the linear trend equation for mangroves in the Jishui River, as estimated by Fan (2009): R(X) = 2.618X + 1.9086 (R2 = 0.98) [10].
4.1. Environmental Risk Factors of Land Subsidence
Although the Zengwun Estuary Delta on the west coast of Taiwan has experienced slight subsidence due to tectonic activity, most western coastal areas have experienced severe land subsidence due to groundwater overpumping. Data from the land subsidence database of the Water Resources Agency indicate that the maximum cumulative subsidence in Taixi Township, Yunlin County, was approximately −283 cm, with an average annual subsidence of −5.9 cm (Table 1).
In some areas along Taiwan’s west coast, land has sunk severely because of groundwater overpumping. From 1988 to 2009, the maximum cumulative subsidence in the Beimen area was approximately −94 cm, which explains why old mangrove trees at JS drowned and seedlings continued to expand inland. The correlation between changes in MA at Beimen and cumulative land subsidence highlighted a clear association between changes in MA at JS and land subsidence. By 2007, MA at Beimen decreased to 17.35 ha.
Over the years, A. marina at TG exhibited a marked decline in annual ring width due to land subsidence. Notably, these trees still had green leaves before death, and many dead tree heads surrounded them. The radius growth of the outermost circle gradually decreased. In the present study, A. marina trees at JS and TG were assessed to generate the quadratic polynomial curve for declining carbon sink in land subsidence areas.
4.2. Estimation of Blue Carbon Content in Mangroves
The age of A. marina at TG was inferred by comparing the semiannual radius growth time series for dead mangroves with the semiannual rainfall time series from TN. The finding is consistent with the area estimated using six aerial photographs and satellite images from 1975 to 2012 (Table 2). Therefore, the time series trend equation for radius growth, that is, Ysite(X) = −k(X – a)2 + b, and that for area, that is, Ysite,area(t) = −k(t – a)2 + b, can be used to estimate the dynamic trend of mangrove carbon sinks in land subsidence areas. Furthermore, the trend-line extrapolation method can be used with previously reported values for carbon sequestration per unit area of mangrove forest to project changes in MA over several years and estimate blue carbon stocks.
Regarding the amount of blue carbon stored in mangroves growing in land subsidence areas, when cumulative land subsidence exceeding the height of their pneumatophores (PnRs) and seawater persistently submerges PnRs, mangrove growth begins to decline. After the parabolic trend reaches its vertex, the curve reverses, and MA decreases. For a target year, carbon sequestration per unit area was estimated from studies providing relevant information per unit of MA [9,55].
In practical application, the annual ring-width method requires careful, sequential steps.
- Cut mangrove samples (subsample number > 4).
- Measure annual ring-width every year YRS(X), X = 1,…, m.
- Construct the time series [YRS(X)].
- Fit the quadratic polynomial trend equation YRS(X) = −k(X – a)2 + b to the time series.
- Calculate the parabola vertex (a, b), where a is time and b is the maximum annual ring-width (mm).
With the increasing availability of satellite imagery and area estimation techniques, the estimation method has become more feasible. We propose the following specific and feasible steps as follows:
- Obtain satellite images of the target area for estimating mangrove carbon sinks for 6 years (preferably with a gap between every 2 years) to extend the observation time axis.
- Select the target sample area from ≥ 2 crossing lines (field surveys can be incorporated if necessary), ensuring that each crossing line includes at least three fixed sample areas, with boundaries fixed across years and the total sample area exceeding 5 ha.
- Use unsupervised classification (Iso Cluster Unsupervised Classification) in ArcMap to estimate the MAS(t), t = 1,…, m, of each fixed sample area per year and construct the time series [MAS(t)].
- Derive the quadratic polynomial trend equation for the time series MAS(t) of the entire target area (or several sample sites), MAS(t) = −k(t − a)2 + b.
- Calculate the vertex of the parabola (a, b), where a is the time and b is the maximum MA.
The carbon sequestration potential of A. marina is typically influenced by age, season, growth, and sediment characteristics; in addition, the nutrient inputs due to rainfall and water bird habitats exert considerable effects [28,29,30,31,32,71]. Reduced rainfall and groundwater extraction led to land subsidence, which reduced radius growth [4], indicating a sharp decline in net production. Rainfall exerts a dynamic effect throughout the year, whereas land subsidence exerts an irreversible effect. Lin et al. presented five carbon budgets for A. marina in the Asia–Pacific region (New Zealand, Indonesia, and Iran) and compared them with data from four sites in Taiwan [18,41,69,75].
Future research of A. marina carbon sequestration should first clarify whether subsidence has occurred at each study site and whether it influences the carbon budget and carbon sequestration of A. marina. Assessment methods for both area and radius growth can accurately estimate the growth status of A. marina. Therefore, these methods can be used to predict future carbon sinks. They can also prevent misinterpretation of net productivity in the evaluation of A. marina carbon sinks in subsidence areas.
Author Contributions
Conceptualization, F.-J.L., and Y.-T.U.; methodology, S.-H.C., and H.-Y.C.; software, C.-W.L., and Y.-T.U.; botany, K.-F.H.; validation, F.-J.L., and Y.-T.U.; formal analysis, Y.-T.U.; investigation, resources, and curation, F.-J.L; and Y.-T.U.; writing; funding acquisition, F.-J.L. All authors have read and agreed to the published version of the manuscript.
Funding
Ocean Conservation Administration, Ocean Affairs Council, Taiwan (R.O.C.) Project Number: 114 Marine Conservation-0605-Biology-Geology-03, and 114 Marine Conservation-021-Biology-Geology-10.
Institutional Review Board Statement
Not applicable.
Informed Consent Statement
Not applicable.
Data Availability Statement
The mangrove data was collected by the participants, while other data was purchased from relevant government agencies.
Acknowledgments
We thank Dr. Jung-Ting Hsu, Mr. Bo-Wei Wang, Mr. Po-Ling Deng, Ms. Yi-Ling Chen, and Meihua Landscape Engineering for helped with data collection and compilation. In addition, we thank Dr. Chia-Hung Jen, Dr. Chien-Jung Liu, Dr. Chih-Hua Chang, Mr. Kun-Neng Chen, Ms. Yu-Chen Lin, Mr. Zhan-Xian Zhan, Mr. Yu-Hwa Chen, Mr. Yun-Zhan Hsieh, Mr. Bo-Zhi Pan, Mr. Cheng-Hsun Yang, Mr. Feng-Tse Yang, and Mr. Ha-Xiang Yang for their assistance with fieldwork and data collection. This manuscript was edited by Wallace Academic Editing. This study was facilitated by the Ocean Conservation Administration, Ocean Affairs Council, Construction and Planning Agency, Ministry of the Interior, Fourth River Management Branch, Chiayi County Government, and Tainan City Government.
Conflicts of Interest
The authors declare no relevant conflicts of interest.
Abbreviations
The following abbreviations are used in this manuscript:
| BD | Budai Lagoon |
| CG | Cigu Fishpond |
| DS | Dongshih Lagoon |
| HG | half-year radius growth |
| HM | Haomeiliao Wetland |
| JJ | Jiangjyun River |
| JS | Jishui Estuary |
| MA | mangrove area |
| PL | linear rainfall equation |
| PZ’ | Puzih Estuary |
| SC | Sihcao Wetland |
| SJ | Syuejia Wetalnd |
| TG | Tougang Ditch |
| TL | linear temperature equation |
| TN | Former Tainan Meteorological Station |
| WG | Wanggong Ditch |
| YR | annual ring width |
References
- Central Weather Administration. Precipitation and Temperature Data. Available online: https://www.cwa.gov.tw/eng/ (accessed on 2025).
- Jaramillo, F.; Licero, L.; Åhlen, I.; Manzoni, S.; Rodríguez-Rodríguez, J.A.; Guittard, A.; Hylin, A.; Bola˜ nos, J.; Jawitz, J.; Wdowinski, S.; et al. Effects of hydroclimatic change and rehabilitation activities on salinity and mangroves in the Cienaga Grande de Santa Marta, Colombia. Wetlands 2018, 38, 755–767. [Google Scholar] [CrossRef]
- Rahaman, S.M.B.; Sarder, L.; Rahaman, S.M.B.; Ghosh, A.K.; Biswas, S.K.; Siraj, S.S.; Huq, K.A.; Hasanuzzaman, A.F.M.; Islam, S.S. Nutrient dynamics in the Sundarbans mangrove estuarine system of Bangladesh under different weather and tidal cycles. Ecol. Processes 2013, 2, 1–13. [Google Scholar] [CrossRef]
- Chang, S.-H. The Effects of Land-Subsidence on the Mangrove Ecosystems: A Case Study of Jishui Estuary and Pujsu River. Master’s Thesis, Department of Environmental Engineering, Kun Shan University, 2012. [Google Scholar]
- Gagnon, J.D. Rainfall and the width of annual rings in planted white spruce. For. Chron. 1961, 37, 96–101. [Google Scholar] [CrossRef]
- Casal, G.; Tregarot, F.; Cornet, C.C.; McCarthy, T.; van der Gees, M. A cost-effective method to map mangrove forest extent, composition, and condition in small islands based on Sentinel-2 data: Implications for management. Ecol. Indic. 2024, 159, 111696. [Google Scholar] [CrossRef]
- Kandasamy, K.; Bingham, B.L. Biology of mangroves and mangrove ecosystems. Adv. Mar. Biol. 2001, 40, 81–251. [Google Scholar] [CrossRef]
- Purnobasuki, H. Characteristics of root caps in four root types of Avicennia marina (Forsk.) Vierh. Am. J. Plant Sci. 2013, 4, 853–858. [Google Scholar] [CrossRef]
- Lin, H.-J.; Chen, K.-Y.; Kao, Y.-C.; Lin, W.-J.; Lin, C.-W.; Ho, C.-W. Assessing coastal blue carbon sinks in Taiwan. J. Mar. Res. 2023, 3, 1–17. [Google Scholar] [CrossRef]
- Fan, K.-C. Litterfall and nutrient dynamics of a mangrove Avicennia marina (Forsk.) Vierh. Forest at the Chishui River, Tainan County, Taiwan. Taiwan J. For. Sci. 2007, 22, 441–454. [Google Scholar] [CrossRef]
- Igulu, M.M.; Nagelkerken, I.; van der Velde, G.; Mgay, Y.D. Mangrove fish production is largely euelled by external food sources: a stable Isotope analysis of fishes at the individual, species, and community levels from across the globe. Ecosystems 2013, 16, 1336–1352. [Google Scholar] [CrossRef]
- Ueng, Y.-T.; Wang, Y.-K.; Tsao, C.-W.; Tung, S.-C.; Hsu, J.-T.; Chang, Y. Monitoring and assessment of oyster and barnacle larvae settlement in an oyster farm in western Taiwan. Nat. Resour. 2020, 11, 112–126. [Google Scholar] [CrossRef]
- Ueng, Y.-T.; Lin, F.-J.; Tsao, C.-W.; Chen, H.-C.; Chang, W.-C. Sand grain size and organic matter in the intertidal zone on the Southwest Taiwan Coast. Nat. Resour. 2021, 12, 108–123. [Google Scholar] [CrossRef]
- Lin, H.-J.; Kao, W.-Y.; Wang, Y.-T. Analyses of stomach contents and stable isotopes reveal food sources of estuarine detritivorous fish in tropical/subtropical Taiwan. Estuar. Coast Shelf S 2007, 73, 527–537. [Google Scholar] [CrossRef]
- Nagelkerken, I.; Blaber, S.J.M.; Bouillon, S.; Green, P.; Haywood, M.; Kirton, L.G.; Meynecke, J.O.; Pawlik, J.; Penrose, H.M.; Sasekumr, A.; et al. The habitat function of mangroves for terrestrial and marine fauna: a review. Aquat. Bot. 2008, 89, 155–185. [Google Scholar] [CrossRef]
- da Silva, F.R.M.; Filho, E.M.N; Gallina, M.L.; Keppeler, F.W.; Loiola, M.; Giarrizzo, T. From fisher tales to scientific evidence: revealing the significance of estuarine and mangrove habitats as nursery grounds for juveniles of the largest Atlantic Ocean snapper. Front. Mar. Sci. 2023, 10, 1292788. [Google Scholar] [CrossRef]
- Hsueh, M.-L. Disappearing Wetland Forests: Taiwan’s Mangroves, Conservation Education Center; Endemic Species Research Institute: C.O.A.: Taiwan, 1995. [Google Scholar]
- Swales, A.; Denys, P.; Pickett, V.I.; Lovelock, C.E. Evaluating deep subsidence in a rapidly-accreting mangrove forest using GPS monitoring of surface-elevation benchmarks and sedimentary records. Mar. Geol. 2016, 380, 205–218. [Google Scholar] [CrossRef]
- Xu, S.; Chen, Z.; Li, S. The habitat functions of mangroves for aquatic fauna and fisheries. Acta Ecol. Sin. 2010, 30, 186–196. [Google Scholar]
- Savage, C.; Thrush, S. F.; Lohrer, A. M.; Hewitt, J.E. Ecosystem services transcend boundaries: estuaries provide resource subsidies and influence functional diversity in coastal benthic communities. Plos One. 2012, 7, e42708. [Google Scholar] [CrossRef]
- Whitfield, A.K.; Able, K.W.; Blaber, S.J.M.; Elliott, M.; Franco, A.; Harrison, T.D.; Houde, F.D. Feeding ecology and trophic dynamics. In Fish and Fisheries in Estuaries: A Global Perspective; Whitfield, A.K., Able, K.W., Blaber, S.J.M., Elliott, M., Eds.; John Wiley & Sons Ltd: New York, United States, 2012; pp. 255–331. [Google Scholar] [CrossRef]
- Zhao, J.; Li, C.; Wang, T.; Li, C.; Shen, J.; Liu, Y.; Wu, P. Distribution pattern of mangrove fish communities in Chin. Biology 2022, 11, 1696. [Google Scholar] [CrossRef]
- Hsueh, M.-L.; Lee, H.-H. Diversity and distribution of the mangrove forests in Taiwan. Wetl. Ecol. Manag. 2000, 8, 233–242. [Google Scholar] [CrossRef]
- Ueng, Y.-T.; Lin, K.-H. (Eds.) Demonstration Planning for Protected Areas in Environmentally Sensitive Zones in Taiwan’s Coastal Areas—Report on the Results of Bird, Mangrove, and Wetland Survey Projects; Taiwan Wetland Conservation Alliance: Taiwan, 1994. [Google Scholar]
- Wang, H.-U.; Fu, S.-W.; Deng, G.-Z.; Hong, X.-Z.; Liao, X.-Y. Changes in mangrove area and species composition in Taiwan. Taiwan J. For. Sci. 2015, 41, 41–57. [Google Scholar] [CrossRef]
- Sheue, C.-R.; Liu, H.-Y.; Yong, J.W.H. Kandelia obovata (Rhizophoraceae), a new mangrove species from Eastern Asia. Taxon 2003, 52, 287–294. [Google Scholar] [CrossRef]
- Ueng, Y.-T.; Wang, J.-P. A new species of the Genus Fronsella (Mollusca: Montacutidae) from Taiwan. J. Natl. Taiwan Mus. 2005, 58, 93–99. [Google Scholar]
- Weng, J.-H.; Ueng, Y.-T. First report on the breeding of great white egret (Egretta alba) in Southwesten Taiwan. J. Natl. Taiwan Mus. 2005, 58, 59–67. [Google Scholar]
- Weng, J.H.; Ueng, Y.T.; Wang, J.-P.; Perng, J.-J. The breeding of intermediate egret (Egretta intermedia) in Southwestern Taiwan. Wild Birds 2004, 8, 69–73, 89–90. [Google Scholar]
- Yang, J.Y.-C.; Ueng, Y.-T. Taiwan’s Wetlands of Importance, Urban and Rural Development Branch, Construction and Planning Agency; Ministry of the Interior: Taipei, Taiwan, 2011. [Google Scholar]
- Yen, L.-F. Diet Analysis of Five Herons in Tainan . Master’s Thesis, Department of Life Sciences National Cheng Kung University, Taiwan, 2014. [Google Scholar]
- Chen, T.-H. A Study on the Spiders Cluster of Mangrove in Jishuei River and Puzih River,Taiwan. Master’s Thesis, Department of Environmental Engineering, Kun Shan University, Tainan, 2019. [Google Scholar]
- Liao, C.-H.; Ueng, Y.T. The report of population distribution and captive-bred of Long-legged flies Thinophilus (Diptera: Dolichopodidae) in Jishui Estuary of Taiwan. Wetland Taiwan 2019, 8, 65–76. [Google Scholar]
- Wu, T.-H. Forest management and carbon storage. J. For. Res. 2009, 16, 47–55. [Google Scholar]
- Wu, H.-H. The Carbon Budgets of Kandelia Obovata and Avicennia Marina Mangroves. Master’s Thesis, Department of Life Sciences, National Chung Hsing University, Taichung, 2021. [Google Scholar]
- Ueng, Y.-T.; Lin, F.-J.; Hsiao, Y.-W.; Chen, P.-S. A new carbon sinks and biodiversity-weighted model — a case study on the coastal wetlands of Southwest Taiwan. Wetl. Sci. Pract. 2025, 43, 17. [Google Scholar]
- Ueng, Y.-T.; Lin, F.-J.; Hsiao, Y.-W.; Chen, P.-S.; Chang, H.-Y. Overemphasis on blue carbon leads to biodiversity loss: a case study on subsidence coastal wetlands in Southwest Taiwan. JBES 2025, 27, 46–57. [Google Scholar] [CrossRef]
- Rateb, A.; Abotalib, A.Z. Inferencing the land-subsidence in the Nile Delta using Sentinel-1 satellites and GPS between 2015 and 2019. Sci. Total Environ. 2020, 729, 138868. [Google Scholar] [CrossRef] [PubMed]
- Wu, P.-C.; Wei, M. M.; D’Hondt, S. Subsidence in coastal cities throughout the world observed by InSAR. Geophys. Res. Lett. 2022, 49, e2022GL098477. [Google Scholar] [CrossRef]
- Pedretti, L.; Giarola, A.; Korff, M.; Lambert, J.; Meisina, C. Comprehensive database of land-subsidence in 143 major coastal cities around the world: overview of issues, causes, and future challenges. Front. Earth Sci. 2024, 12, 1351581. [Google Scholar] [CrossRef]
- Riastama, C.N.; Anjasmara, I.M.; Maulida, P. Monitoring land-subsidence and its effect on Surabaya coastal inundation by utilizing GPS campaigns data. Earth Environ. Sci. 2023, 1127, 012002. [Google Scholar] [CrossRef]
- Sun, H.; Peng, H.; Zeng, M.; Wang, S.; Pan, Y.; Pi, P.; Xue, Z.; Zhao, X.; Zhang, A.; Liu, F. Land-subsidence in a coastal city based on SBAS-InSAR monitoring: A case study of Zhuhai, China. Remote Sens. 2023, 15, 2424. [Google Scholar] [CrossRef]
- Mao, G.-G. A study on the preventing strategies of aquifer subsidence at Pingtung coastal area. Rural Dev. 2002, 3, 35–58. [Google Scholar]
- Water Resources Agency. Land Subsidence Monitoring Information Integration Service System. Available online: https://landsubsidence.wra.gov.tw (accessed on 1 December 2024).
- Chang, S.-T. Mangroves in Taiwan and their function of promoting new land. Bank Taiwan Q. 1970, 21, 82–110. BOTQ.pdf.
- Shih, H.-T.; Sheue, C.-R.; Yang, Y.-P. Changes in the distribution of Mangroves in Taiwan. J. Natl. Taiwan Mus. 2025, 78, 1–38. [Google Scholar] [CrossRef]
- Chen, Y.-C. The Study of Mangrove Distribution Change on Tonshu, Chiayi County. Master’s Thesis, The Graduate Institute of Geography, National Taiwan University, Taiwan, 2001. [Google Scholar]
- Clunie, N.M.U. Death of mangroves: upper Whangarei harbour. Conservation Advisory Science Notes No. 32. Department of Conservation: Wellington: New Zealand, 1993. [Google Scholar]
- Shen, C.-C. Current status and conservation of Taiwan mangroves. Taiwan Museum 1993, 12, 22–25. [Google Scholar]
- Water Resources Agency, MOEA. Land-Subsidence Information; Water Resources Agency, MOEA: Taichung, Taiwan, 2024. [Google Scholar]
- Water Resources Agency; MOEA. The Jishui River System and its Tributary, the Baishui River, are Under Management, Water Resources Agency, MOEA, 2017. Available online: https://www.wra.gov.tw/cl.aspx?n=3527 (accessed on 1 February 2025).
- Sunkur, R.; Kantamaneni, K.; Bokhoree, C.; Rathnayake, U.; Fernando, M. Mangrove mapping and monitoring using remote sensing techniques towards climate change resilience. Sci. Rep. 2024, 14, 6949. [Google Scholar] [CrossRef] [PubMed]
- Fathah, A.L.; Semedi, B.; Wardana, F.C.; Isdianto, A. Assessment of mangrove diversity, biomass, and carbon stocksin the Ujungpangkah Estuary, Gresik. JEEST. 2025, 12, 25–34. [Google Scholar]
- Whilst NIWA. Coastal hazards and sea-level rise in Wellington City supporting the 2020-2021 district plan process prepared for Wellington City Council, NIWA Client Report; Whilst NIWA, 2021. [Google Scholar]
- Lin, W.-J.; Lin, C.-W.; Wu, H.-H.; Kao, Y.-C.; Lin, H.-J. Mangrove carbon budgets suggest the estimation of net production and carbon burial by quantifying litterfall. CATENA 2023, 232, 107421. [Google Scholar] [CrossRef]
- Huang, J.-Z. An Estimation of Carbon Fixation Capacity in Mangrove Forest Taijiang National Park. Master’s thesis, Forestry and Natural Resources Department of National Chiayi University, Taiwan, 2012. [Google Scholar]
- Li, S.-B. Carbon Budget of Mangroves in the Chiku area, Tainan. Master’s Thesis, Department of Life Sciences, National Chung Hsing University, Taiwan, 2015. [Google Scholar]
- Thotli, L.R.; Gugamsetty, B.; Kalluri, R.O.R.; Tandule, C.R.; Kotalo, R.G.; Akkiraju, B.; Lingala, S.S.R. Long-term (2001–2020) trend analysis of temperature and rainfall and drought characteristics by in situ measurements at a tropical semi-arid station from southern peninsular India. Int. J. Climatol. 2022, 42, 8928–8949. [Google Scholar] [CrossRef]
- Kamp, J.; Frank, C.; Trautmann, S.; Busch, M.; Flade, M.; Gerlach, B.; Karthäuser, J.; Kunz, F.; Mitschke, A.; Schwarz, J.; et al. Population trends of common breeding birds in Germany 1990–2018. J. Ornithol. 2020, 162, 1–15. [Google Scholar] [CrossRef]
- Chen, P.-S.; Chei, S.-J.; Kuo, T.-H.; Deng, P.-L.; Liu, C.-L.; Ueng, Y.-T. Population growth, habitat utilization, and conservation strategy of the black-faced spoonbill (Platalea minor) on southwest coast of Taiwan. Wilson J. Ornithol. 2024, 135, 492–501. [Google Scholar] [CrossRef]
- van Bijsterveldt, C.E.J.; Herman, P.M.J.; van Wesenbeeck, B.K.; Ramadhani, S.; Heuts, T.S.; van Starrenburg, C.; Tas, S A.J.; Triyanti, A.; Helmi, M.; Femke H. Tonneijck, R.H.; Bouma, T.J. Subsidence reveals potential impacts of future sea level rise on inhabited mangrove coasts. Nat. Sustain. 2023, 6, 1–13. [CrossRef]
- Lee, M.-Y. Causes of the hundred-year drought in Taiwan in 2020/21. Conf. Disaster Manage. Taiwan 2021, 202, 141–144. [Google Scholar] [CrossRef]
- Weiskopf, S.R.; Lerman, S.B.; Isbell, F.; Morelli, T.L. Biodiversity promotes urban ecosystem functioning. Ecography 2024, 2024, e07366. [Google Scholar] [CrossRef]
- Law, M.; Collins, A. Getting to Know Arcgis Desktop 10.8; Esri Press, 2022. [Google Scholar]
- Krebs, C.J. Ecological Methodology, 2nd ed.; Benjamin/Cummings: Menlo Park, California, USA, 1999. [Google Scholar]
- Chen, P.-S.; Chei, S.-J.; Kuo, T.-H.; Deng, P.-L.; Liu, C.-L; Ueng, Y.-T. Water bird communities in nonoperational Cigu salt pan wetland of varying land elevation and water depth on the Southwest Taiwan coast. Nat. Resour. 2020, 11, 20–37. [Google Scholar] [CrossRef]
- Moore, I.D.; Grayson, R.B.; Ladson, A.R. Digital Terrain Modelling: A review of hydrological, geomorphological, and biological applications. Hydrol. Process. 1999, 5, 3–30. [Google Scholar] [CrossRef]
- Tarboton, D.G. A New method for the determination of flow directions and upslope areas in grid digital elevation models. Water Resour. Res. 1997, 33, 309–319. [Google Scholar] [CrossRef]
- Febriandi, F. The estimation of mangroves area and density of mangroves changes use the remote sensing data at Northheast Province of Aceh, Indonesia. Sumatra Journal of Disaster, Geography and Geography Education 2017, 1, 105–110. [Google Scholar] [CrossRef]
- Benson, L.V.; Petersen, K.; Stein, J. Anasazi (pre-Columbian Native-American) migrations during the middle-12th and late-13th centuries–were they drought induced? Clim. Change 2007, 83, 187–213. [Google Scholar] [CrossRef]
- Chang, Y.-S. Using Tree Ring Stable Oxygen Isotope to Reconstruct Historical Climates in Taijiang Inland Sea in Taiwan. Master’s Thesis, Department of Life Sciences National Cheng Kung University, Taiwan, 2020. [Google Scholar]
- Yang, P.-C. Relative Contribution of Plant- and Animal-Derived Detritus in Riverine and Fringe Mngroves in Taiwan. Master’s thesis, Department of Bioenvironmental Systems Engineering, National Taiwan University, Taiwan, 2021. [Google Scholar]
- Huang, J.-S. Effects of Thinning on Carbon Sequestration in Mangroves. Master’s thesis, Department of Life Sciences, National Chung Hsing University, Taiwan, 2016. [Google Scholar]
- El-Hussieny, S.A.; Kamal, H.; Shaltout, K.H.; Alatar, A.A. Carbon sequestration potential of Avicennia marina (Forssk.) Vierh. and Rhizophora mucronata Lam. along the Western Red Sea Coast of Egypt. Rend. Lincei-Sci. Fis. 2021, 32, 599–607.73. [Google Scholar] [CrossRef]
- Duke, N.C.; Birch, W.R.; Williams, W.T. Growth rings and rainfall correlations in a mangrove tree of the genus Diospyros (Ebenaceae). Aust. J. Bot. 1981, 29, 135–142. [Google Scholar] [CrossRef]
- Nguyen, H.T.; Stanton, D.E.; Schmitz, N.; Farquhar, G.D.; Bal, M.C. Growth responses of the mangrove Avicennia marina to salinity: Development and function of shoot hydraulic systems require saline conditions. Ann. Bot. 2015, 15, 397–407. [Google Scholar] [CrossRef]
Figure 1.
Avicennia marina mangrove in habitats prone to land subsidence at Tougang Ditch (a) and Jishui Estuary (b).
Figure 1.
Avicennia marina mangrove in habitats prone to land subsidence at Tougang Ditch (a) and Jishui Estuary (b).
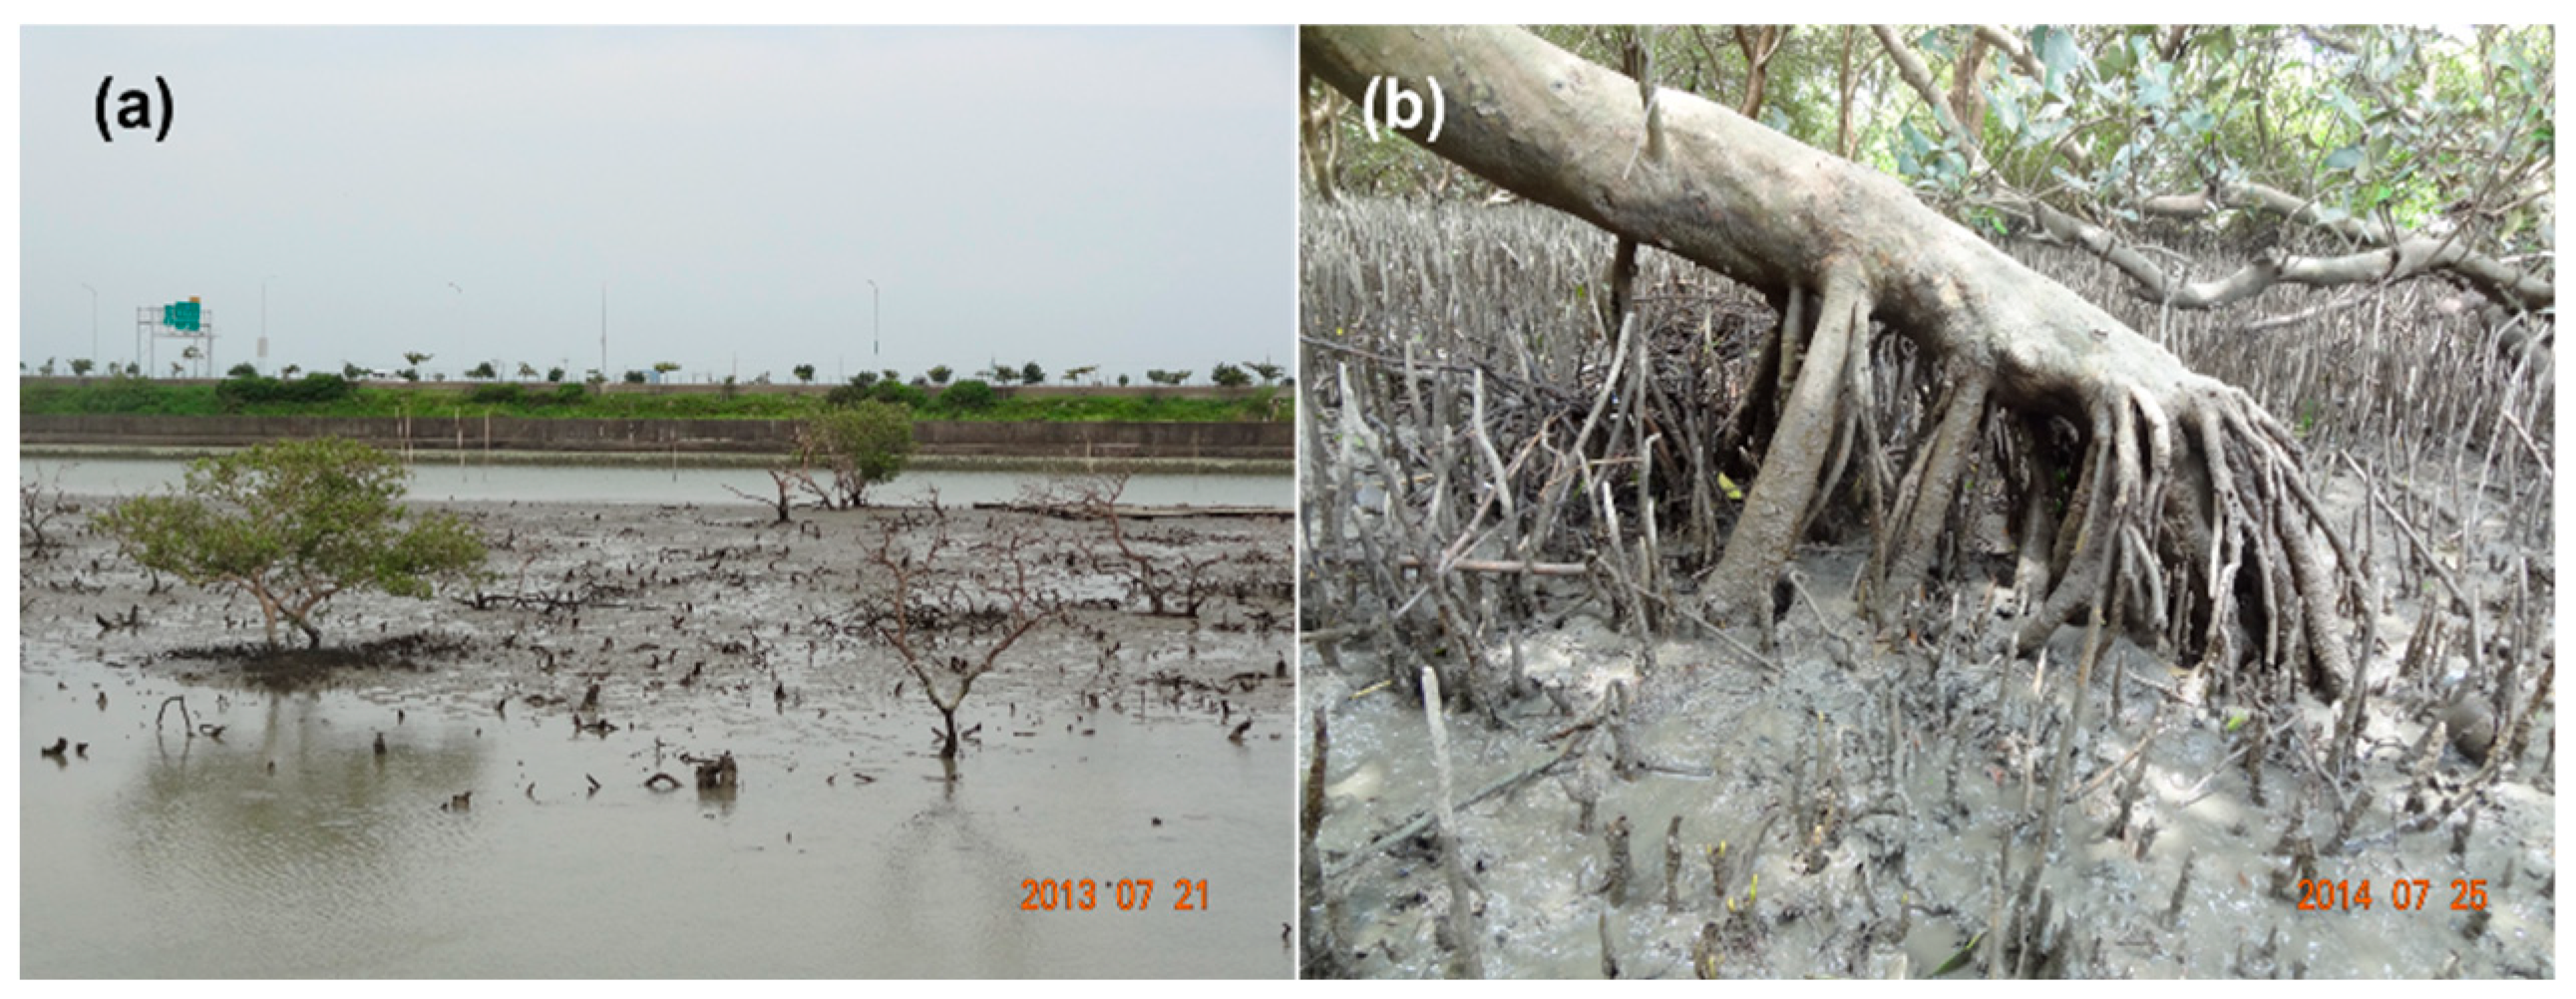
Figure 2.
Avicennia marina sampling sites on the west coast of Taiwan.
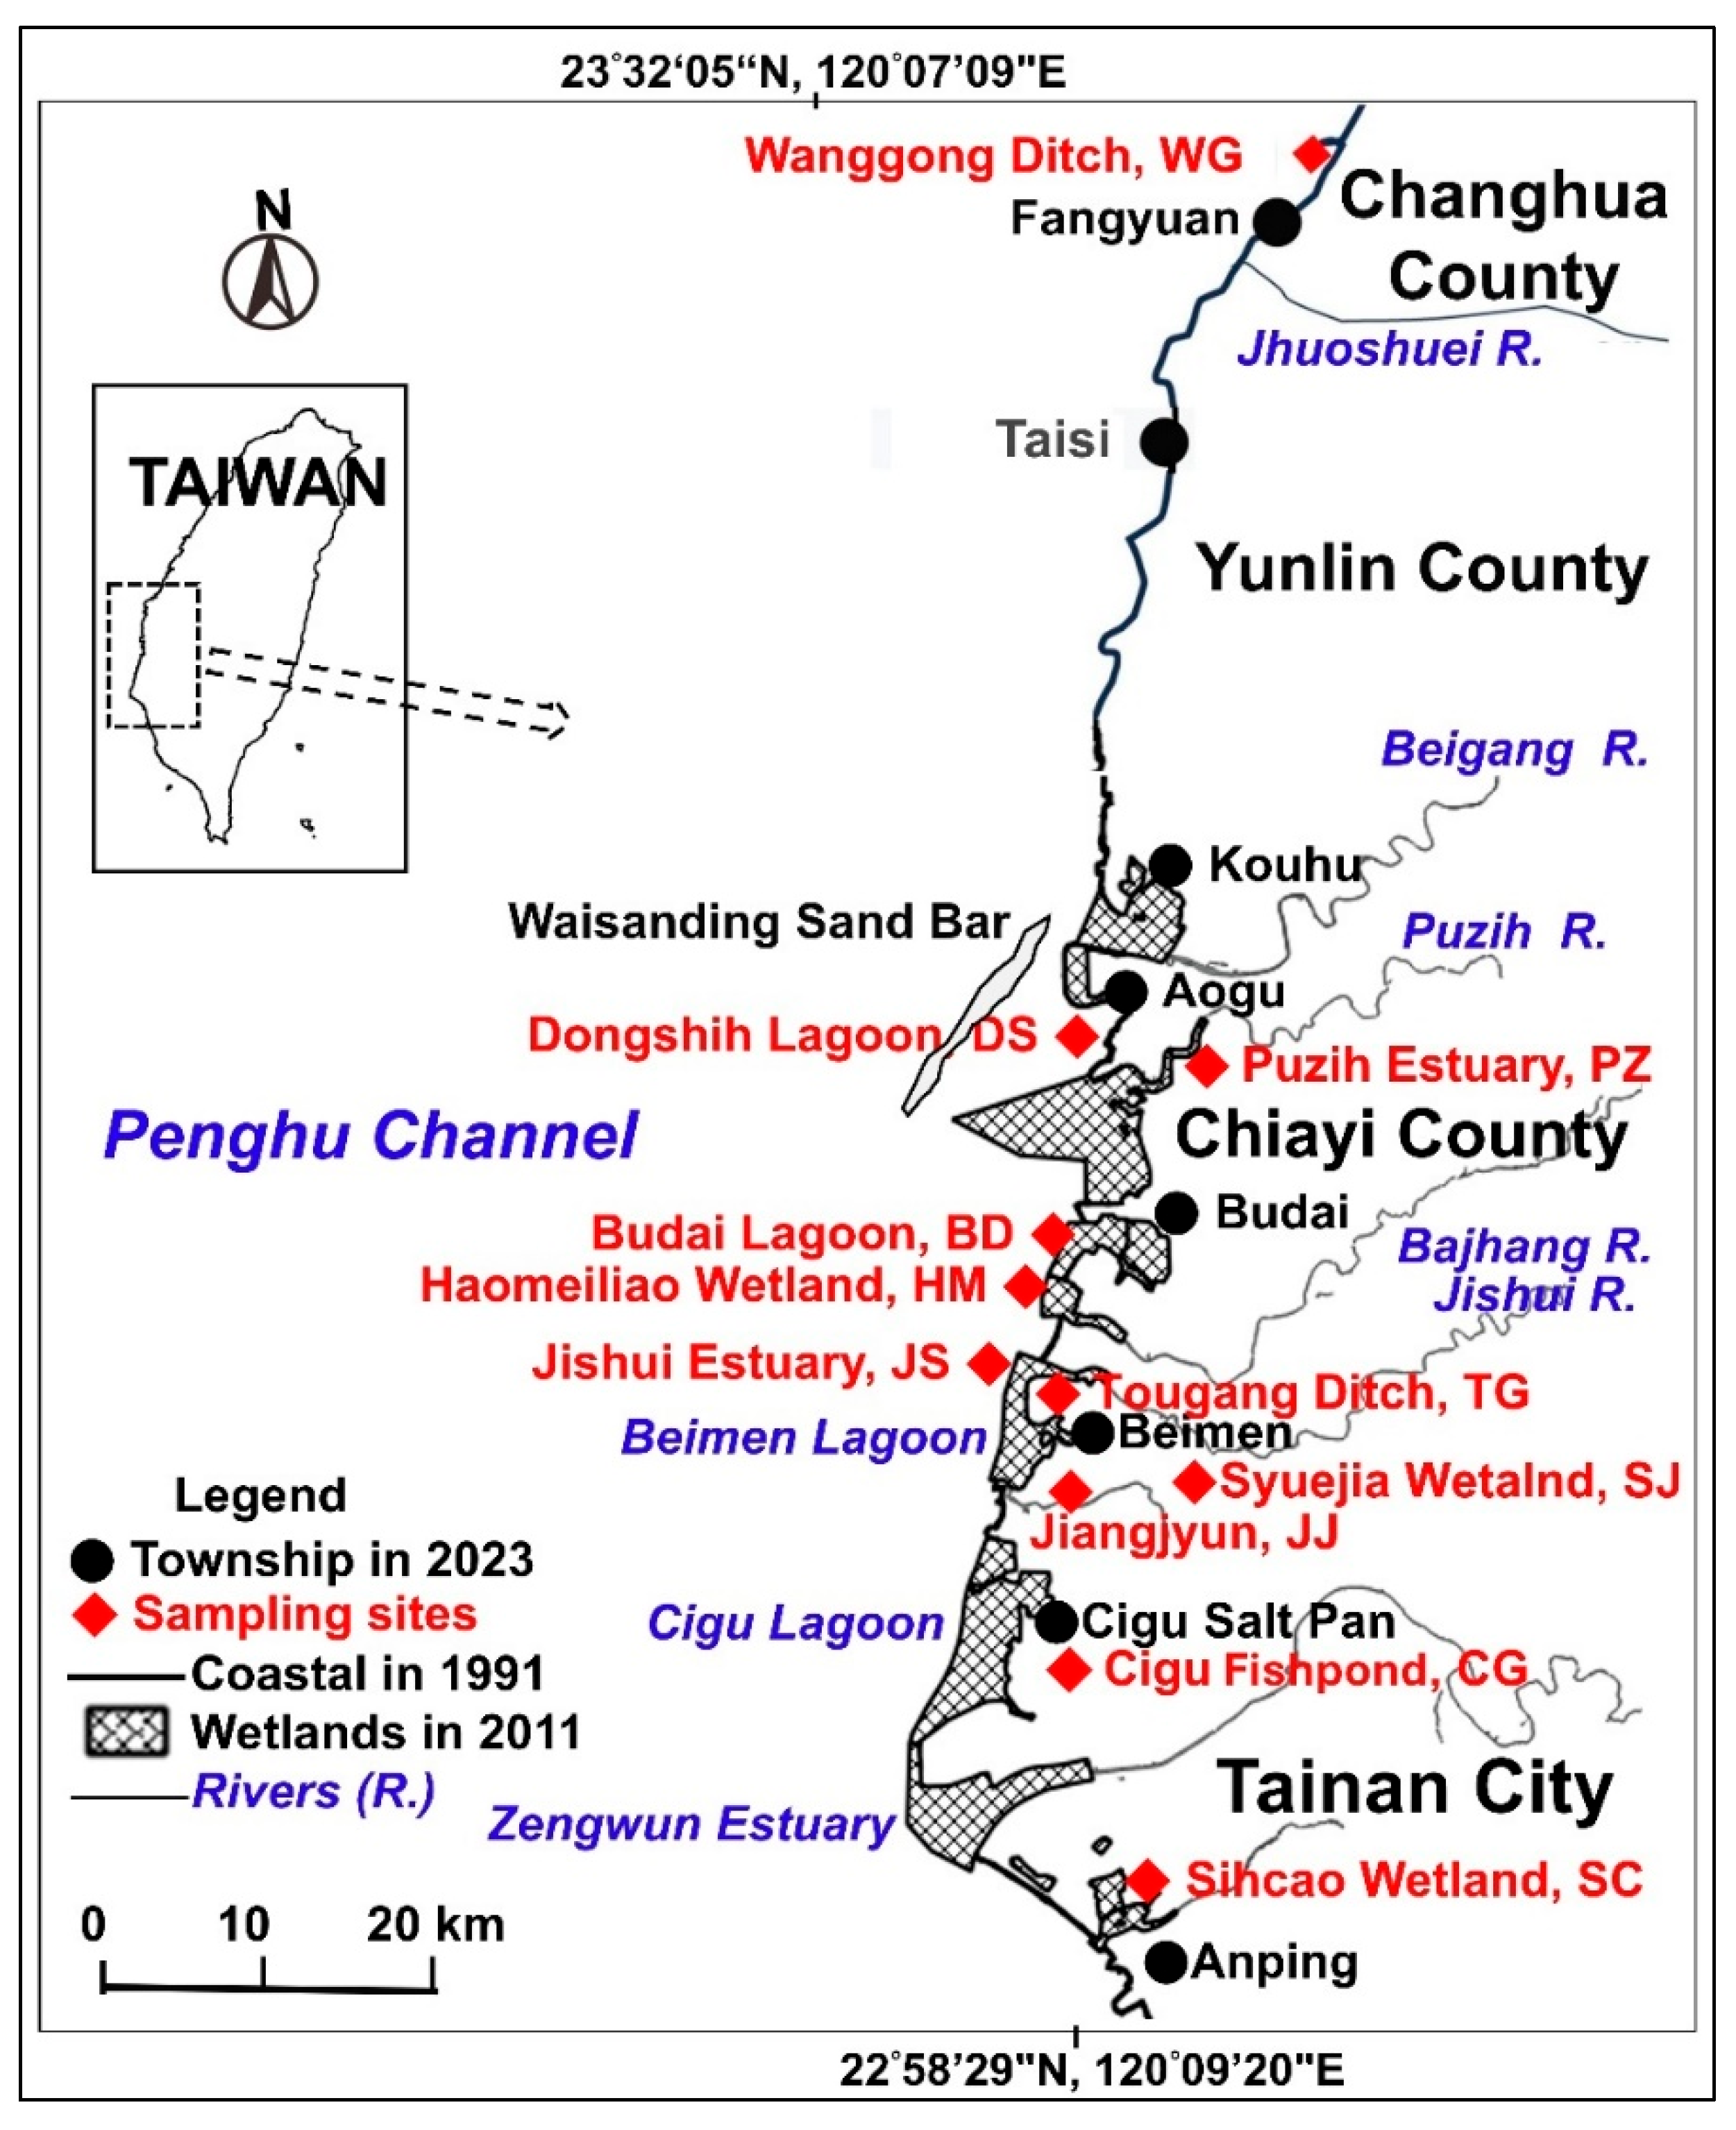
Figure 3.
Map depicting Jishui Estuary, Tougang Ditch, and seven Jishui Estuary subsites (JS-A–JS-G).
Figure 3.
Map depicting Jishui Estuary, Tougang Ditch, and seven Jishui Estuary subsites (JS-A–JS-G).
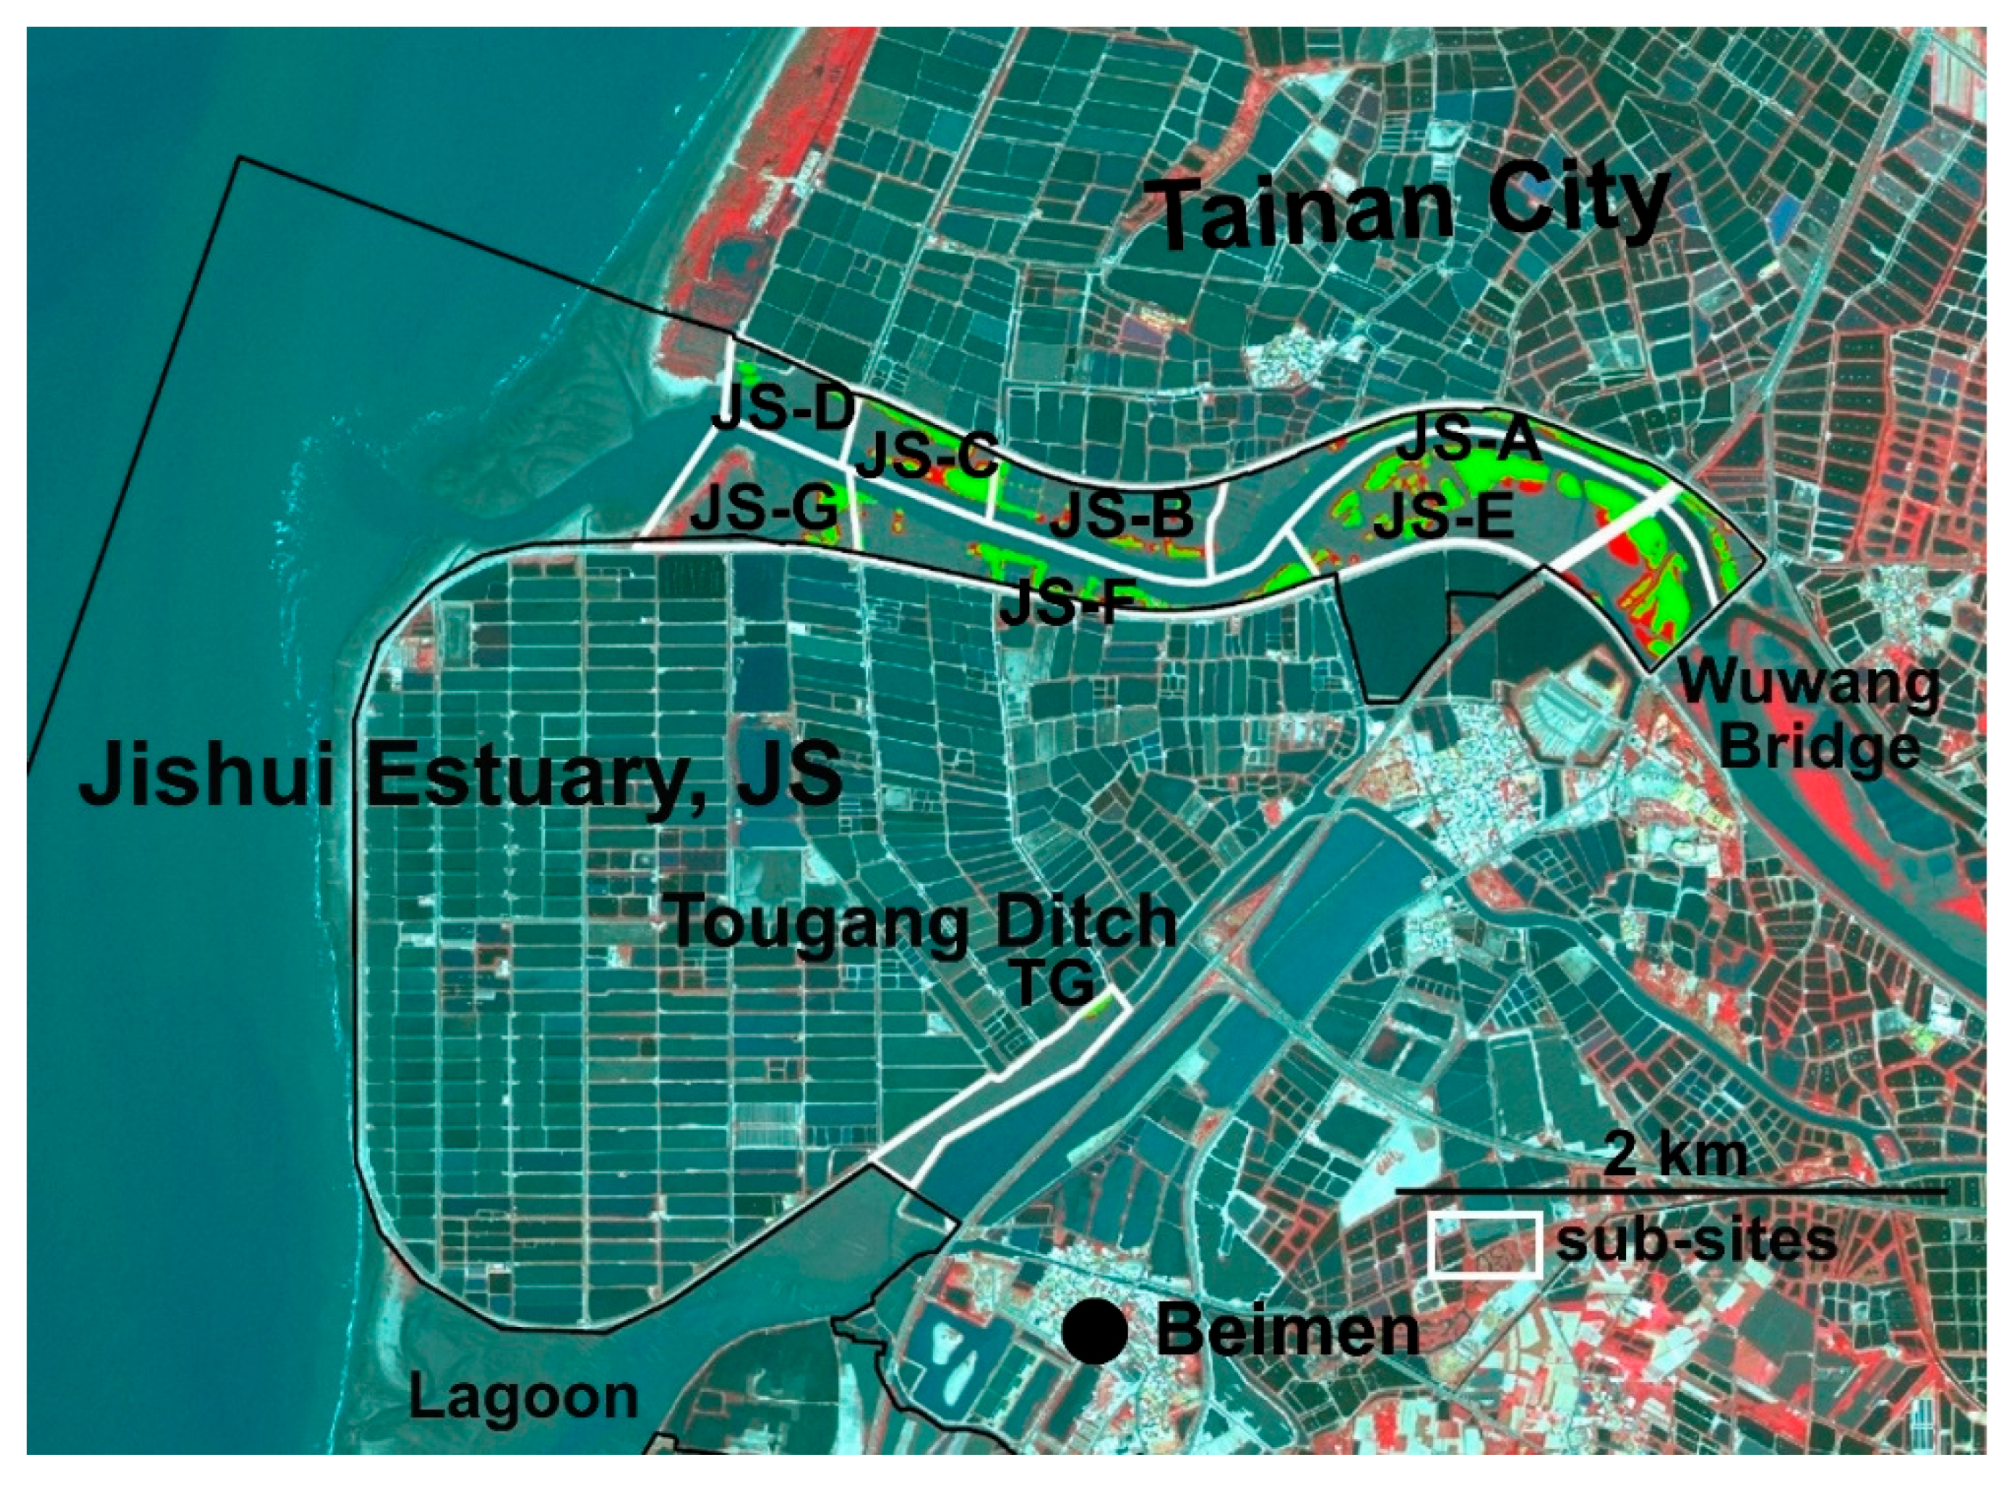
Figure 4.
Changes in the long-term trend (TLT) of annual temperature in Tainan. Data (1897–2024) were collected from the Tainan Meteorological Station.
Figure 4.
Changes in the long-term trend (TLT) of annual temperature in Tainan. Data (1897–2024) were collected from the Tainan Meteorological Station.
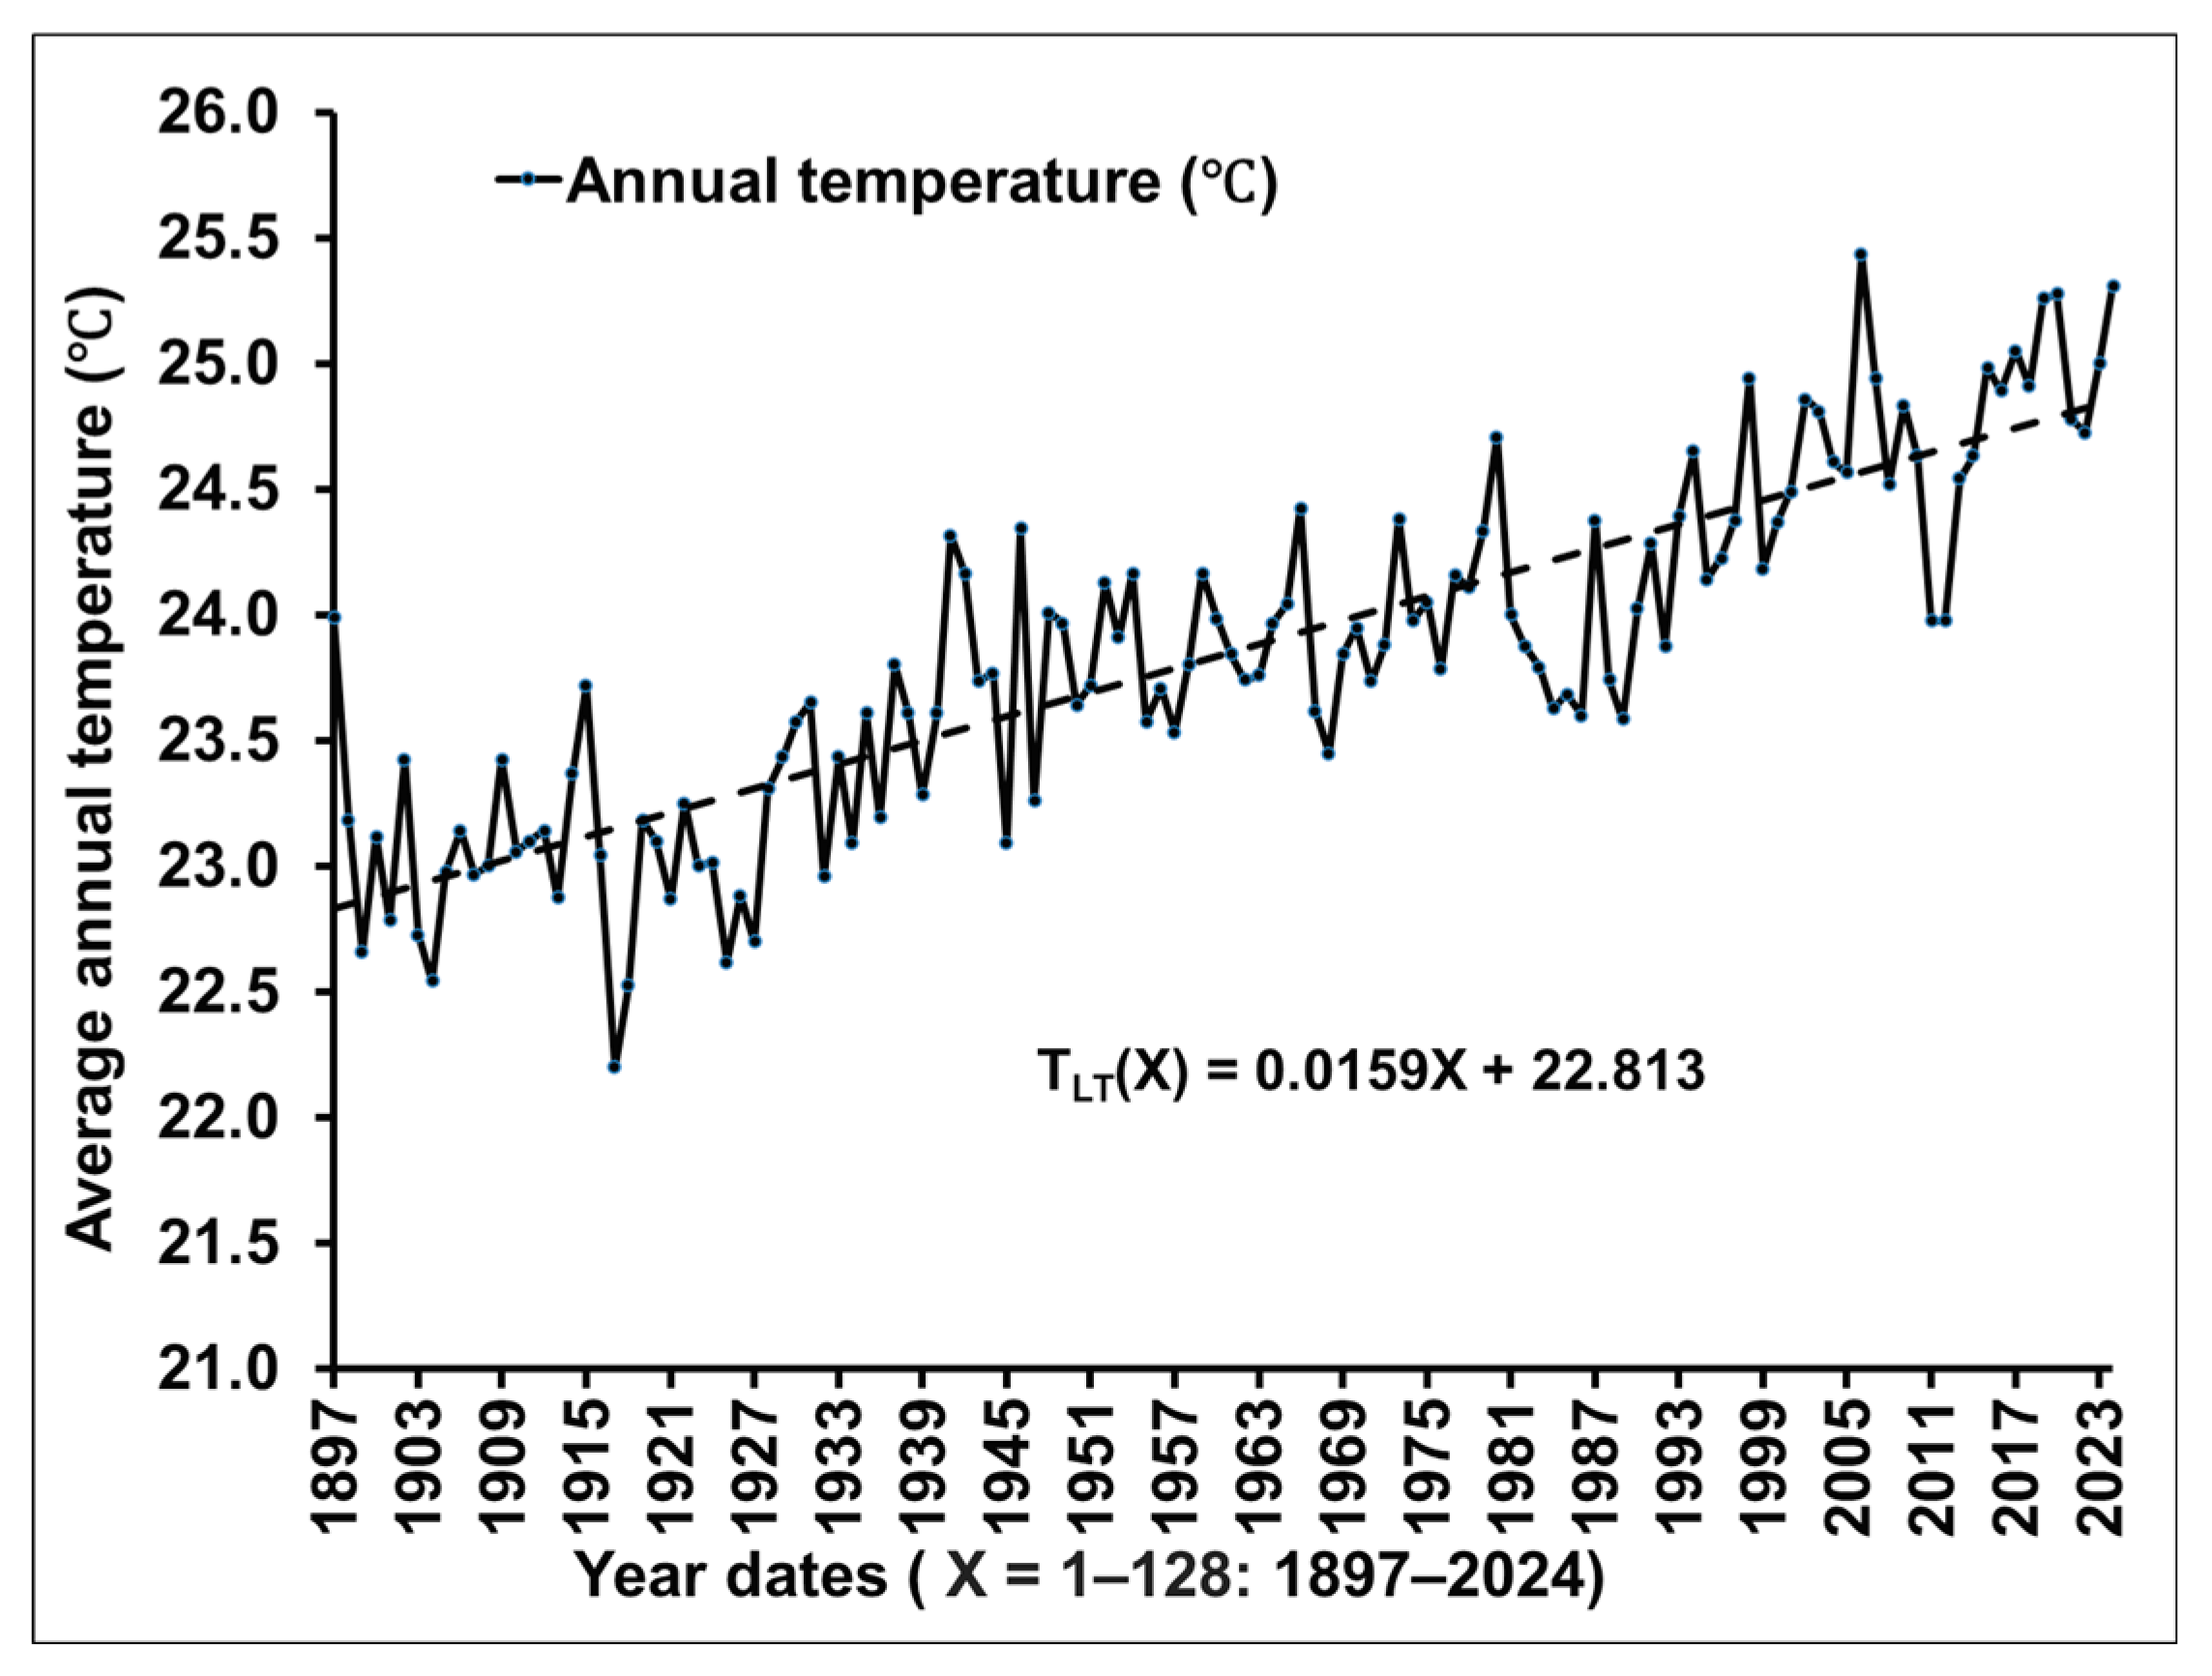
Figure 5.
Changes in the long-term trend (PLT) of annual rainfall in Tainan. Data (1897–2024) were collected from the Tainan Meteorological Station.
Figure 5.
Changes in the long-term trend (PLT) of annual rainfall in Tainan. Data (1897–2024) were collected from the Tainan Meteorological Station.
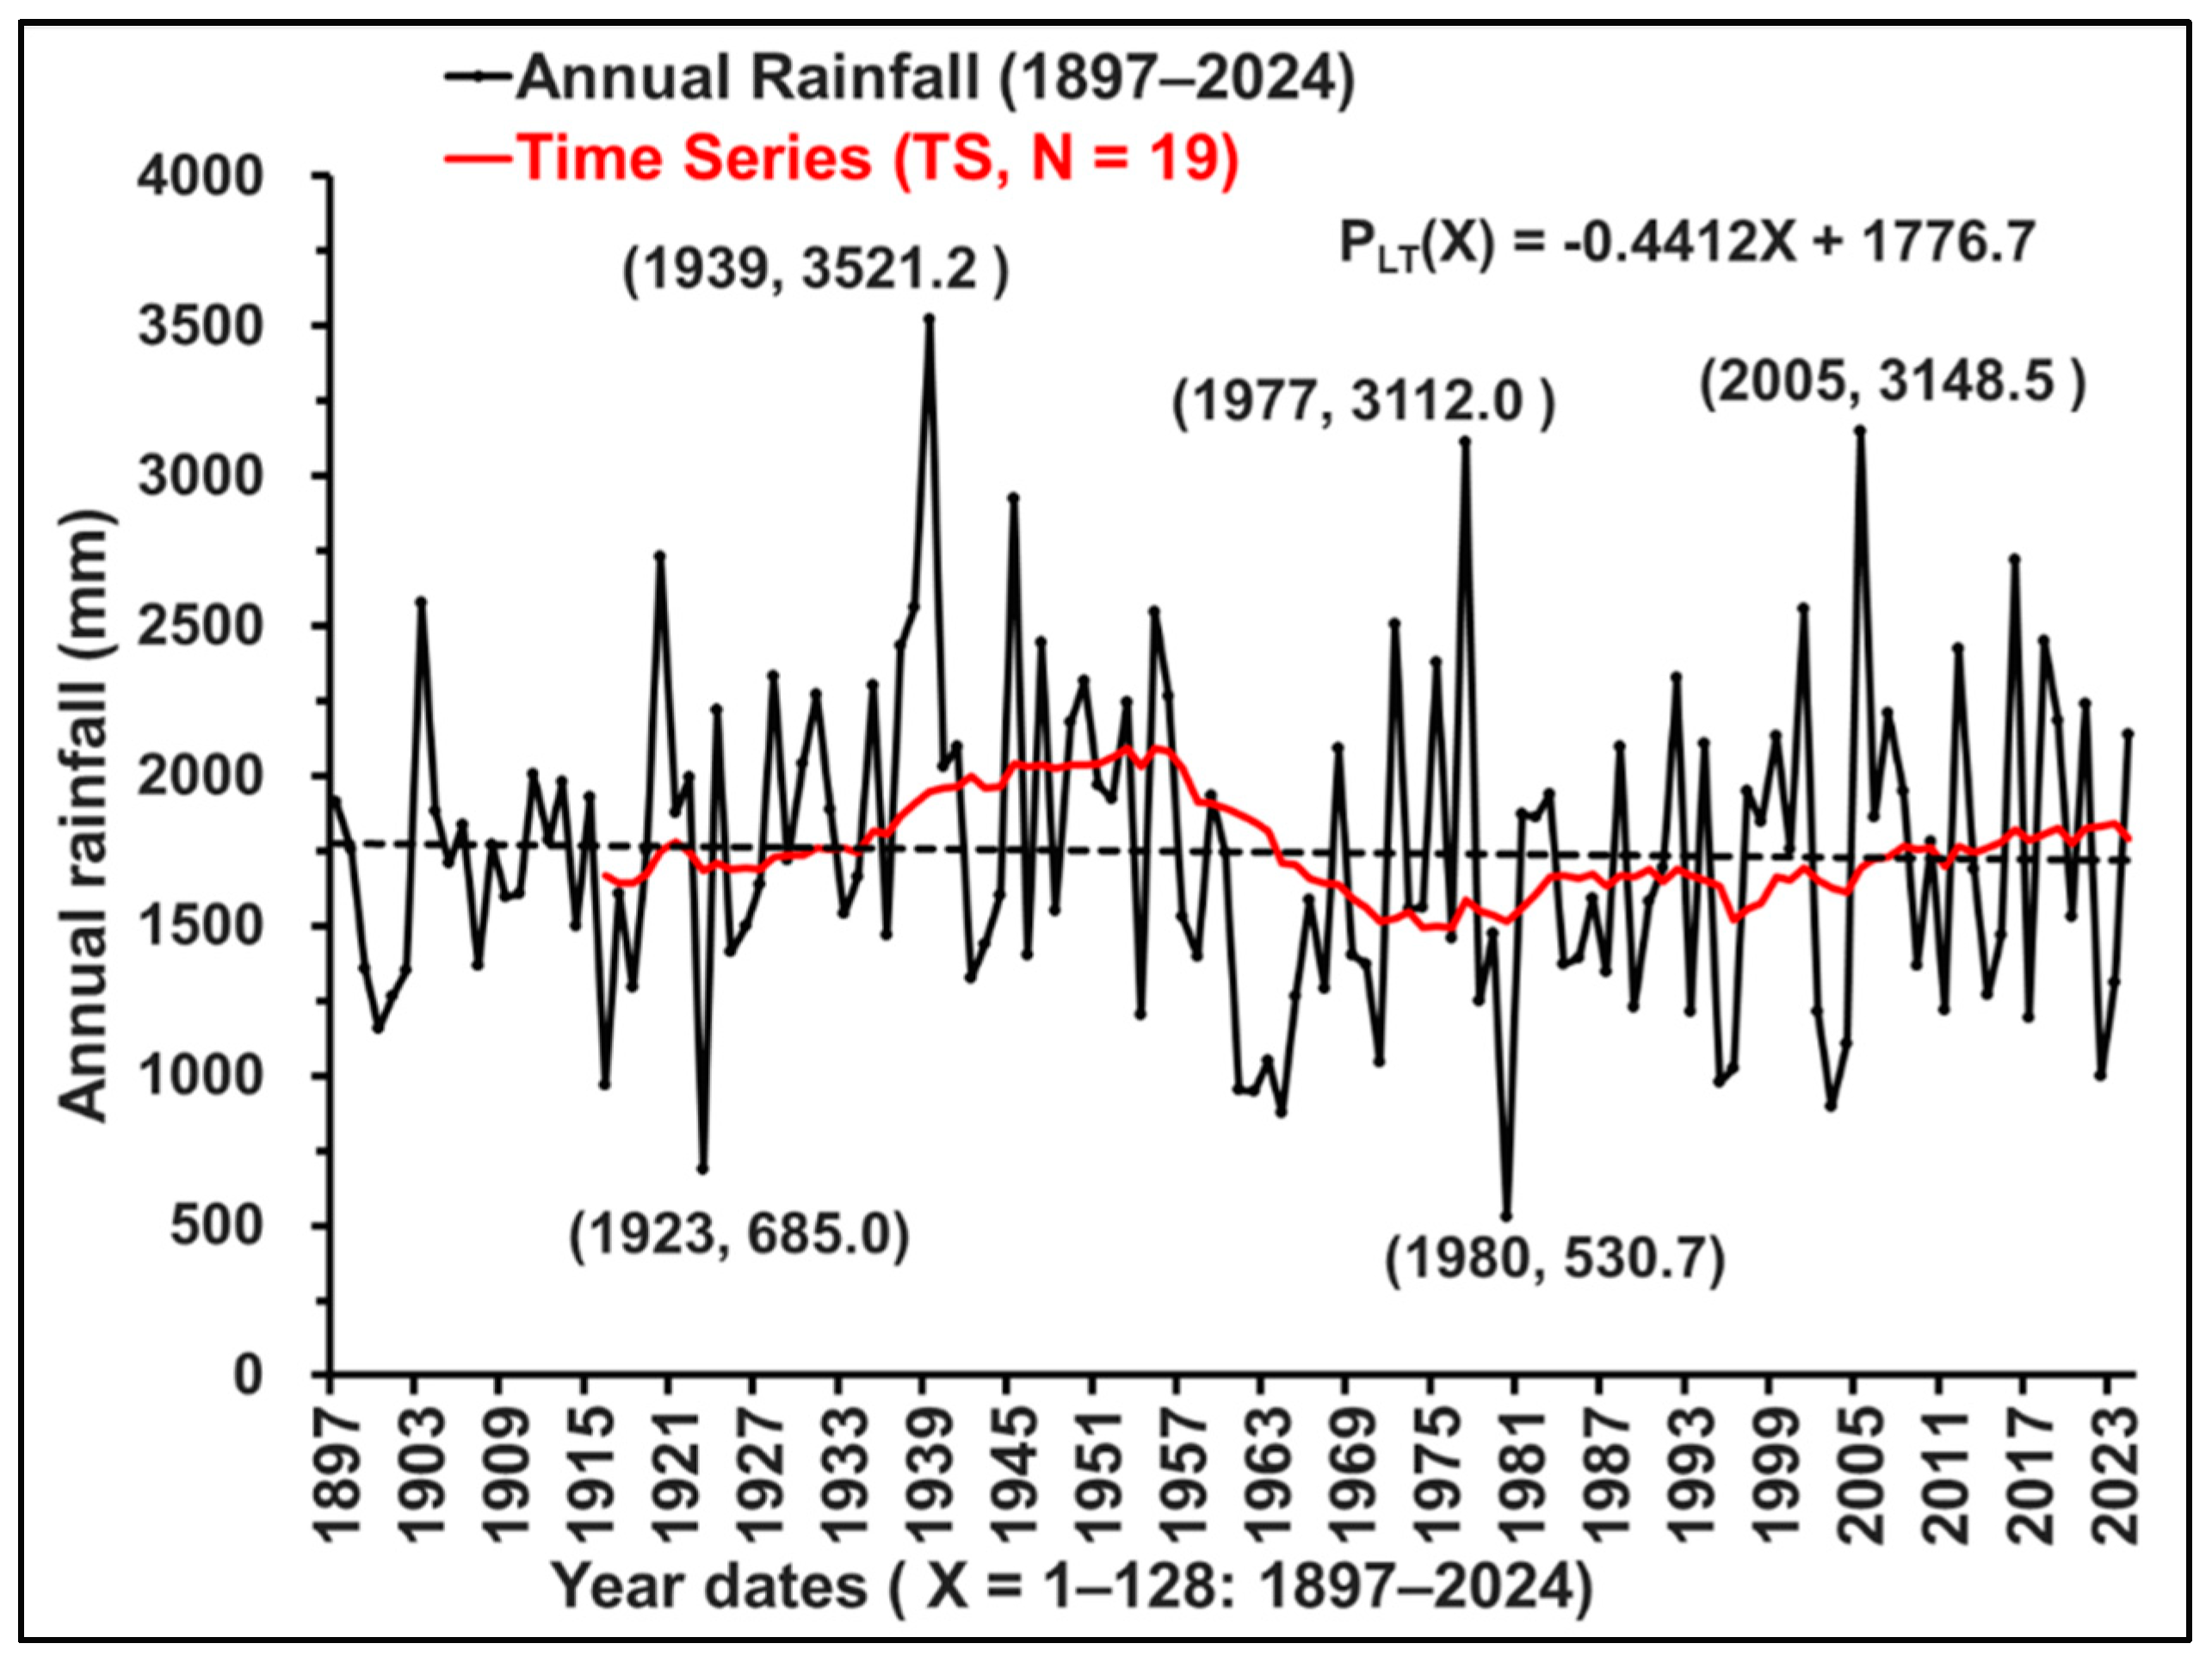
Figure 6.
Land subsidence along the west coast of Taiwan. Data (1975–2023) were compiled from the Water Resources Agency, Ministry of Economic Affairs.
Figure 6.
Land subsidence along the west coast of Taiwan. Data (1975–2023) were compiled from the Water Resources Agency, Ministry of Economic Affairs.
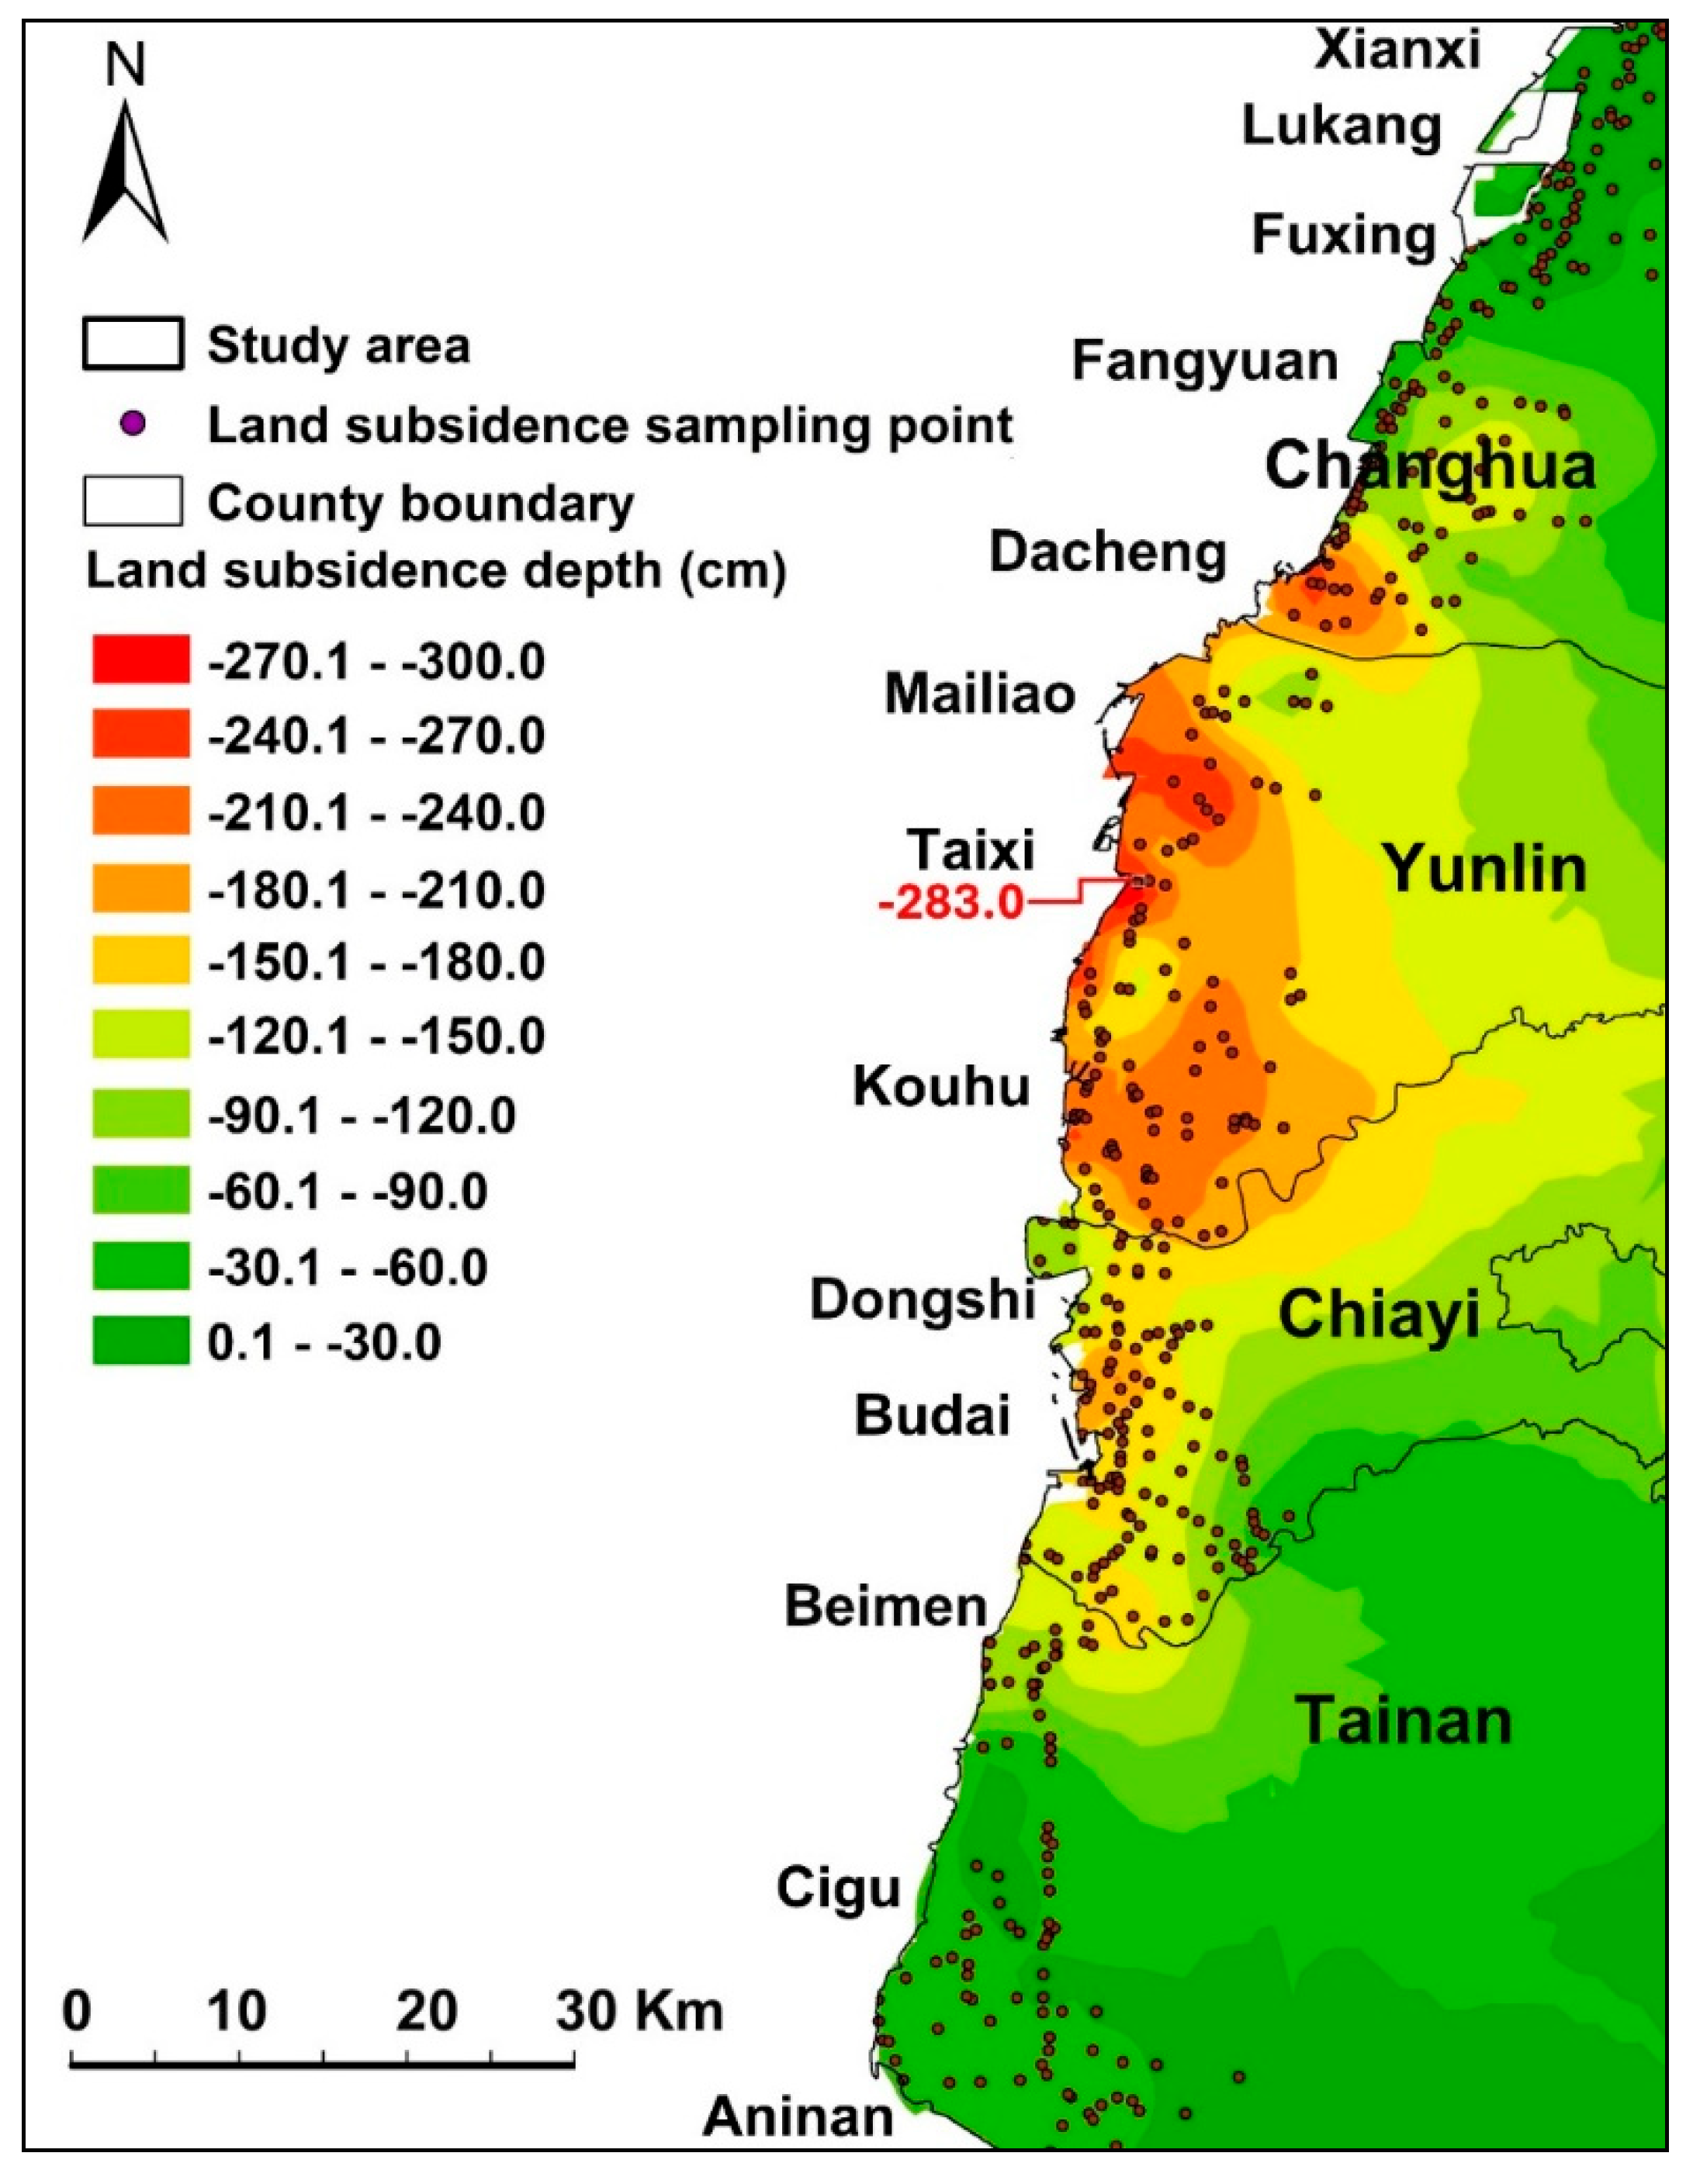
Figure 7.
Changes in mangrove area at Dongshih Lagoon, Chiayi County, from 1975 to 1991.
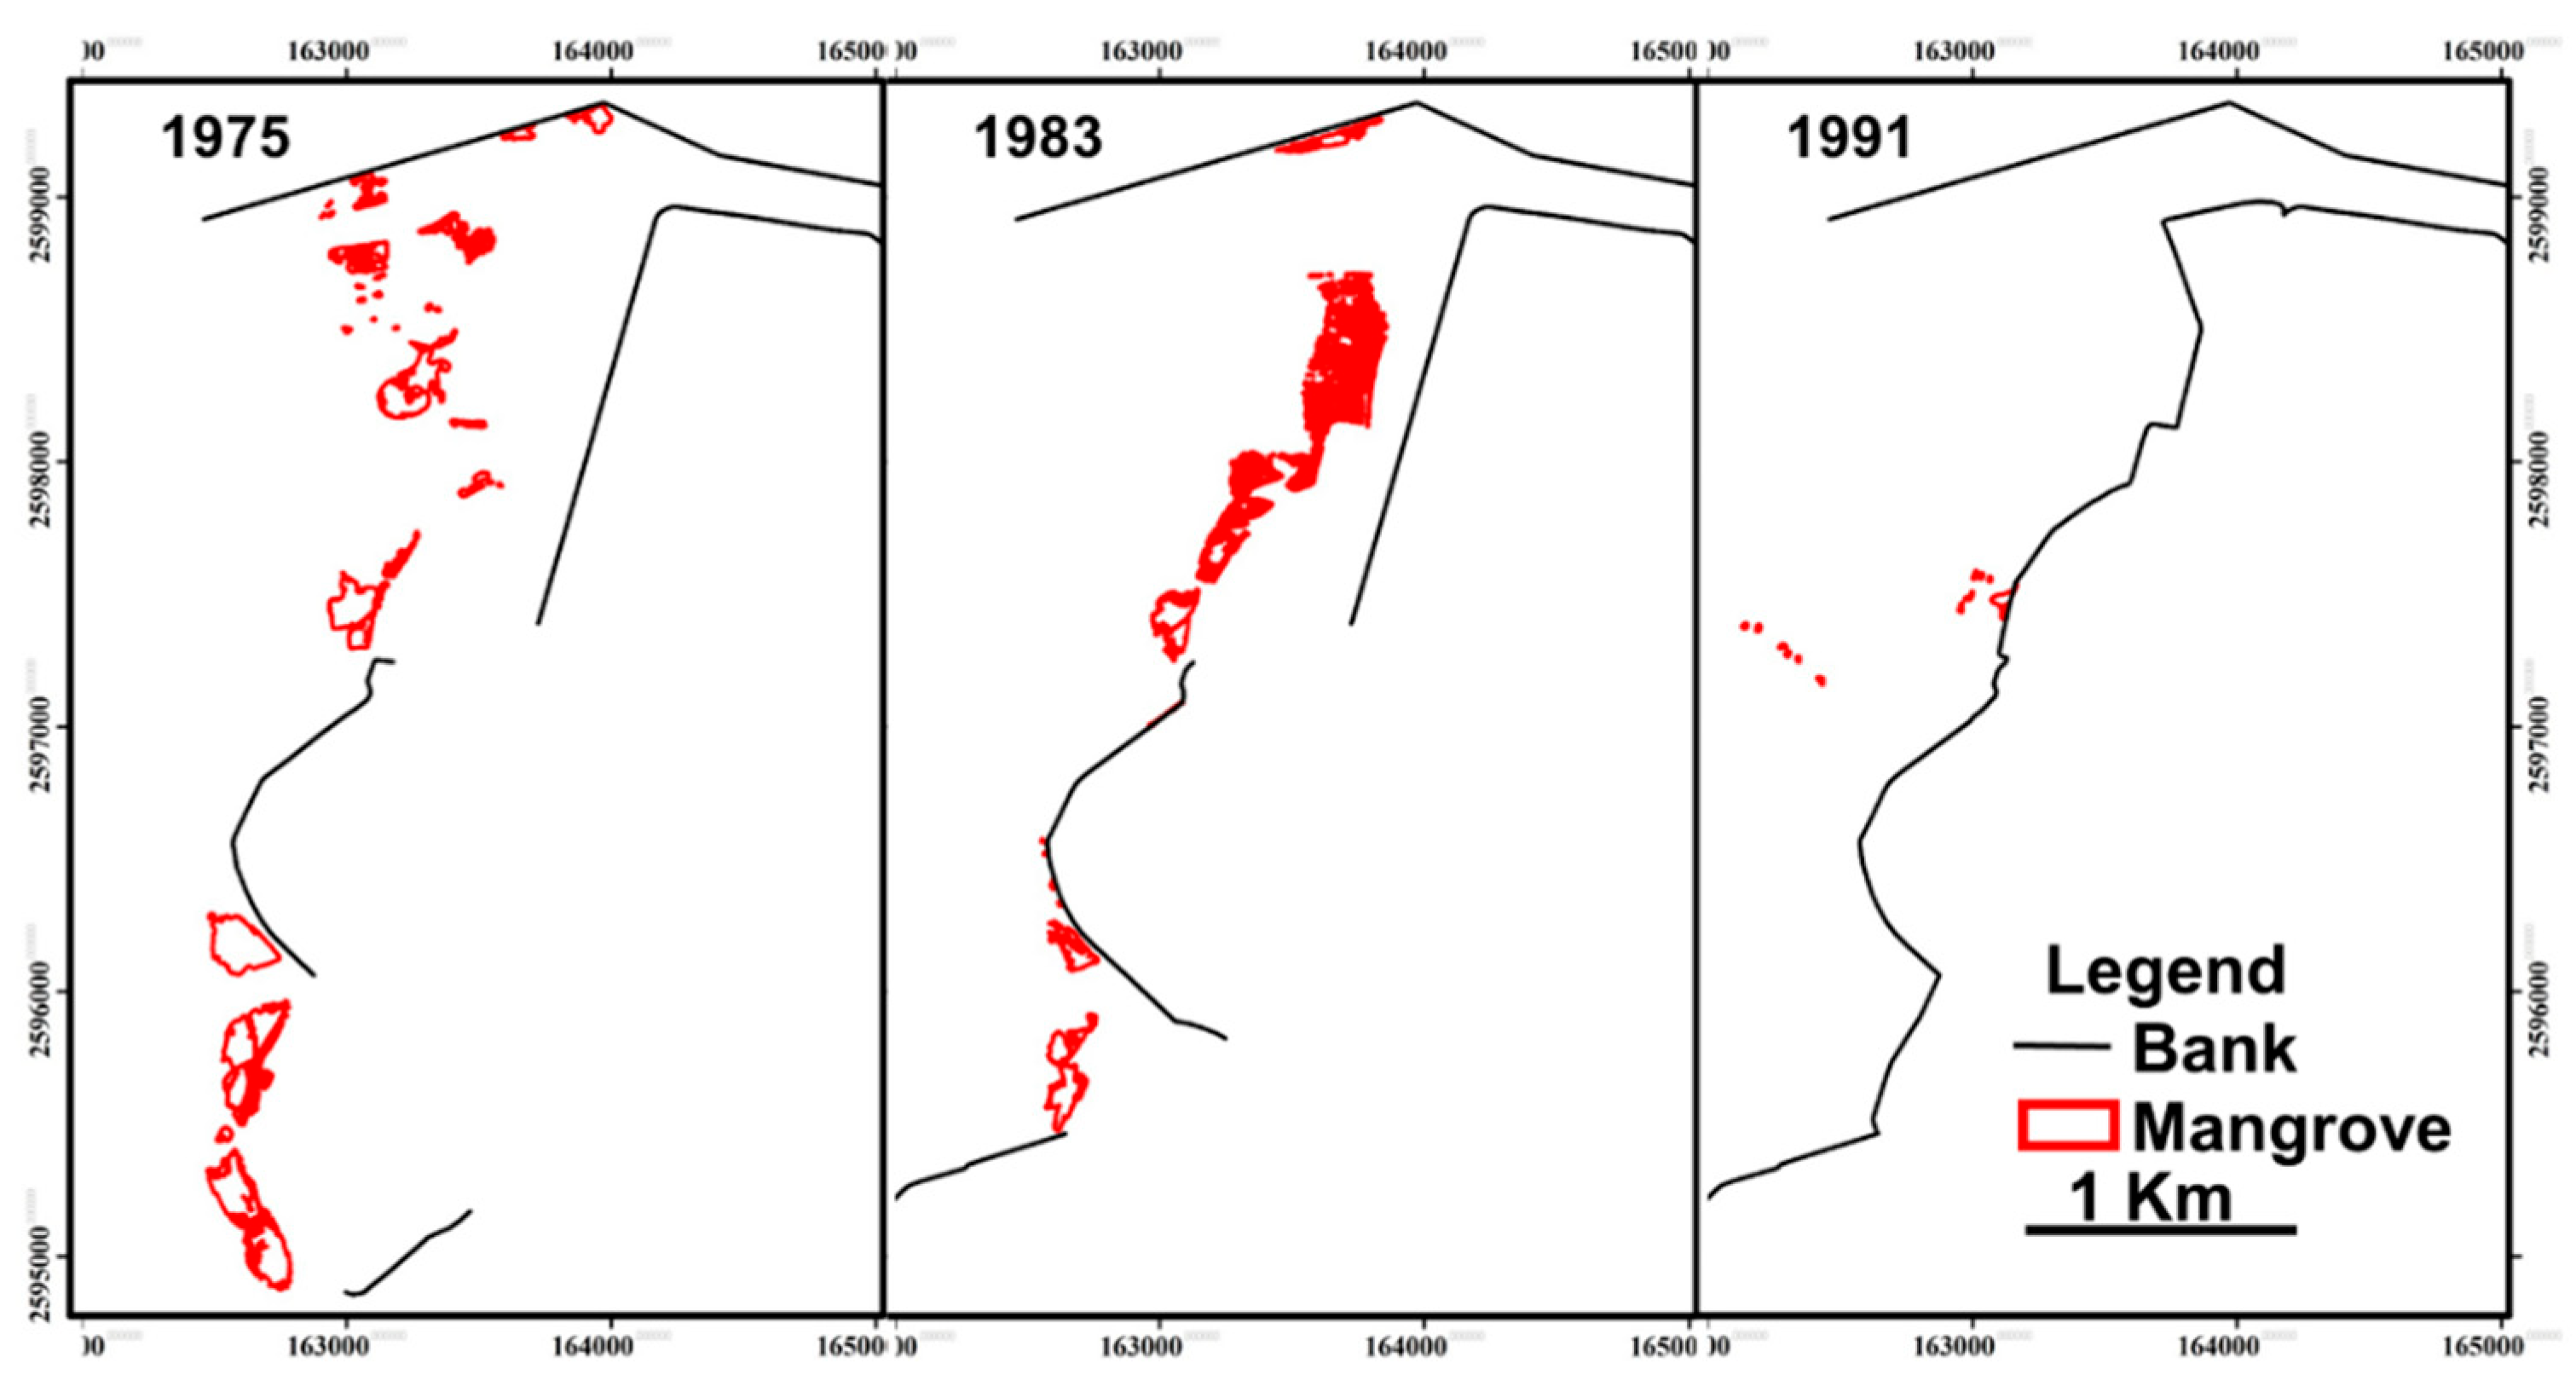
Figure 8.
Changes in mangrove area at Budai Lagoon, Chiayi County, from 1975 to 2012.
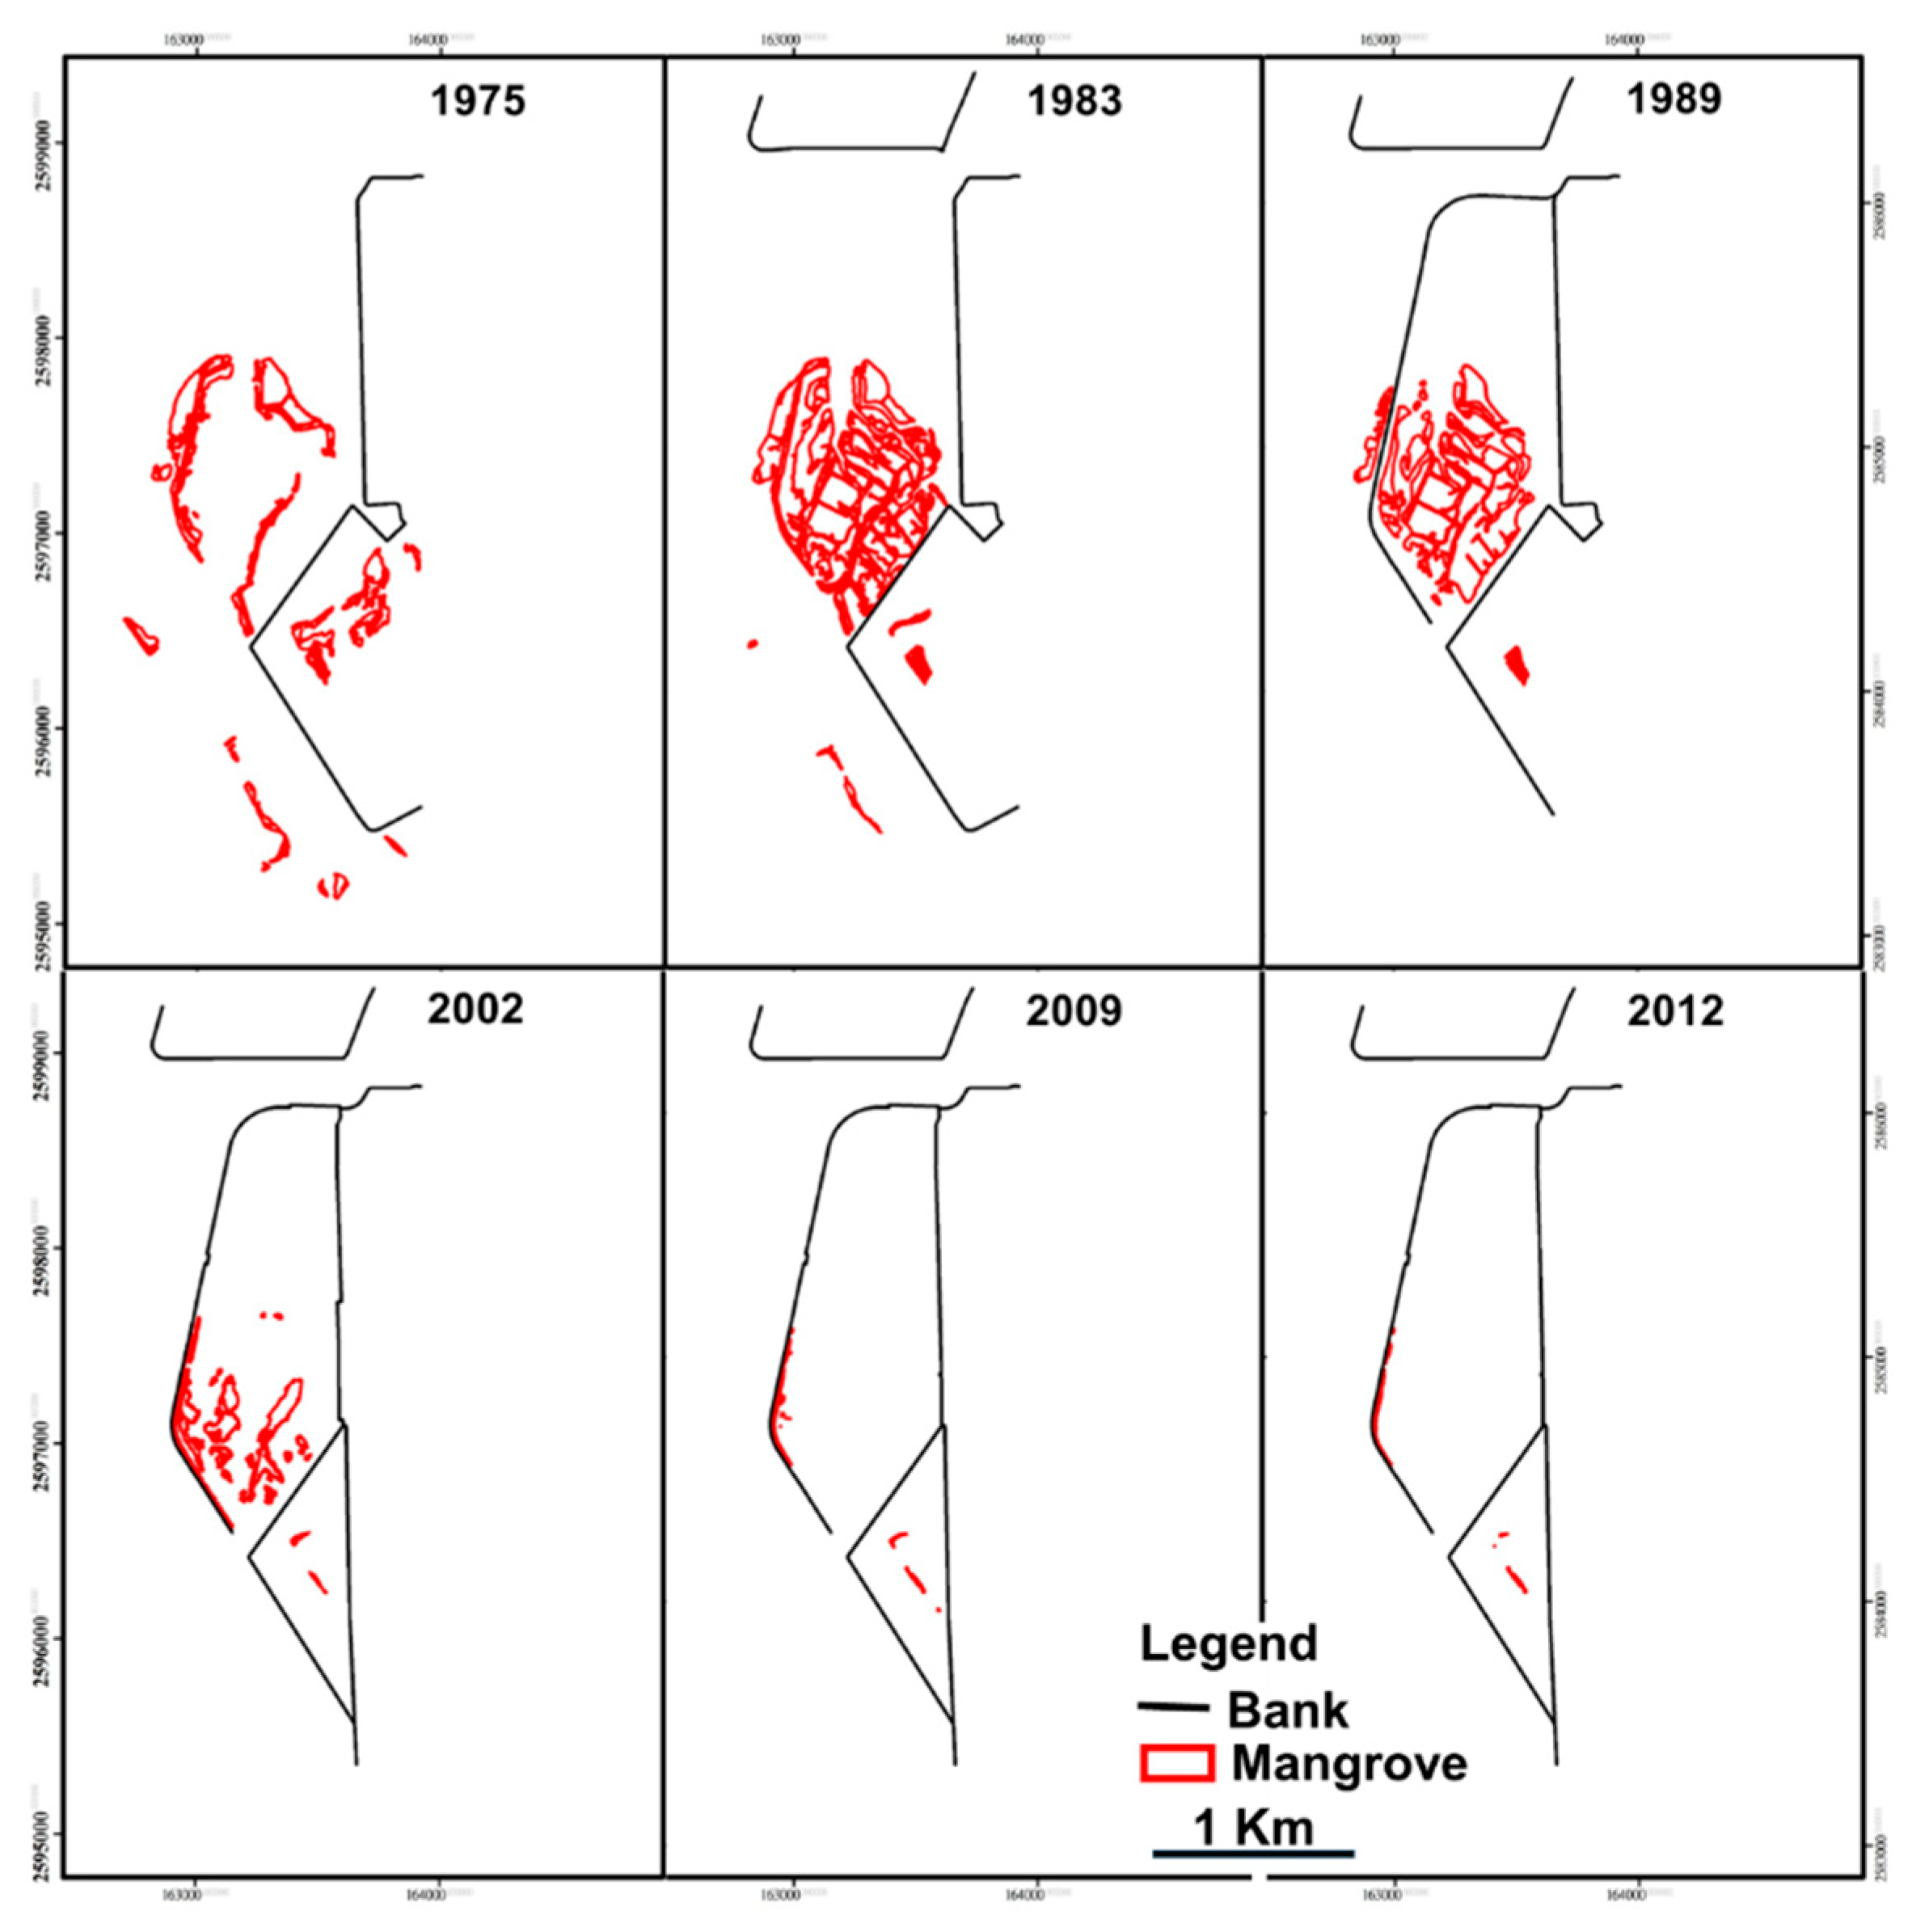
Figure 9.
Changes in mangrove areas at Jishui Estuary and Tougang Ditch, Tainan City, from 1975 to 2012.
Figure 9.
Changes in mangrove areas at Jishui Estuary and Tougang Ditch, Tainan City, from 1975 to 2012.
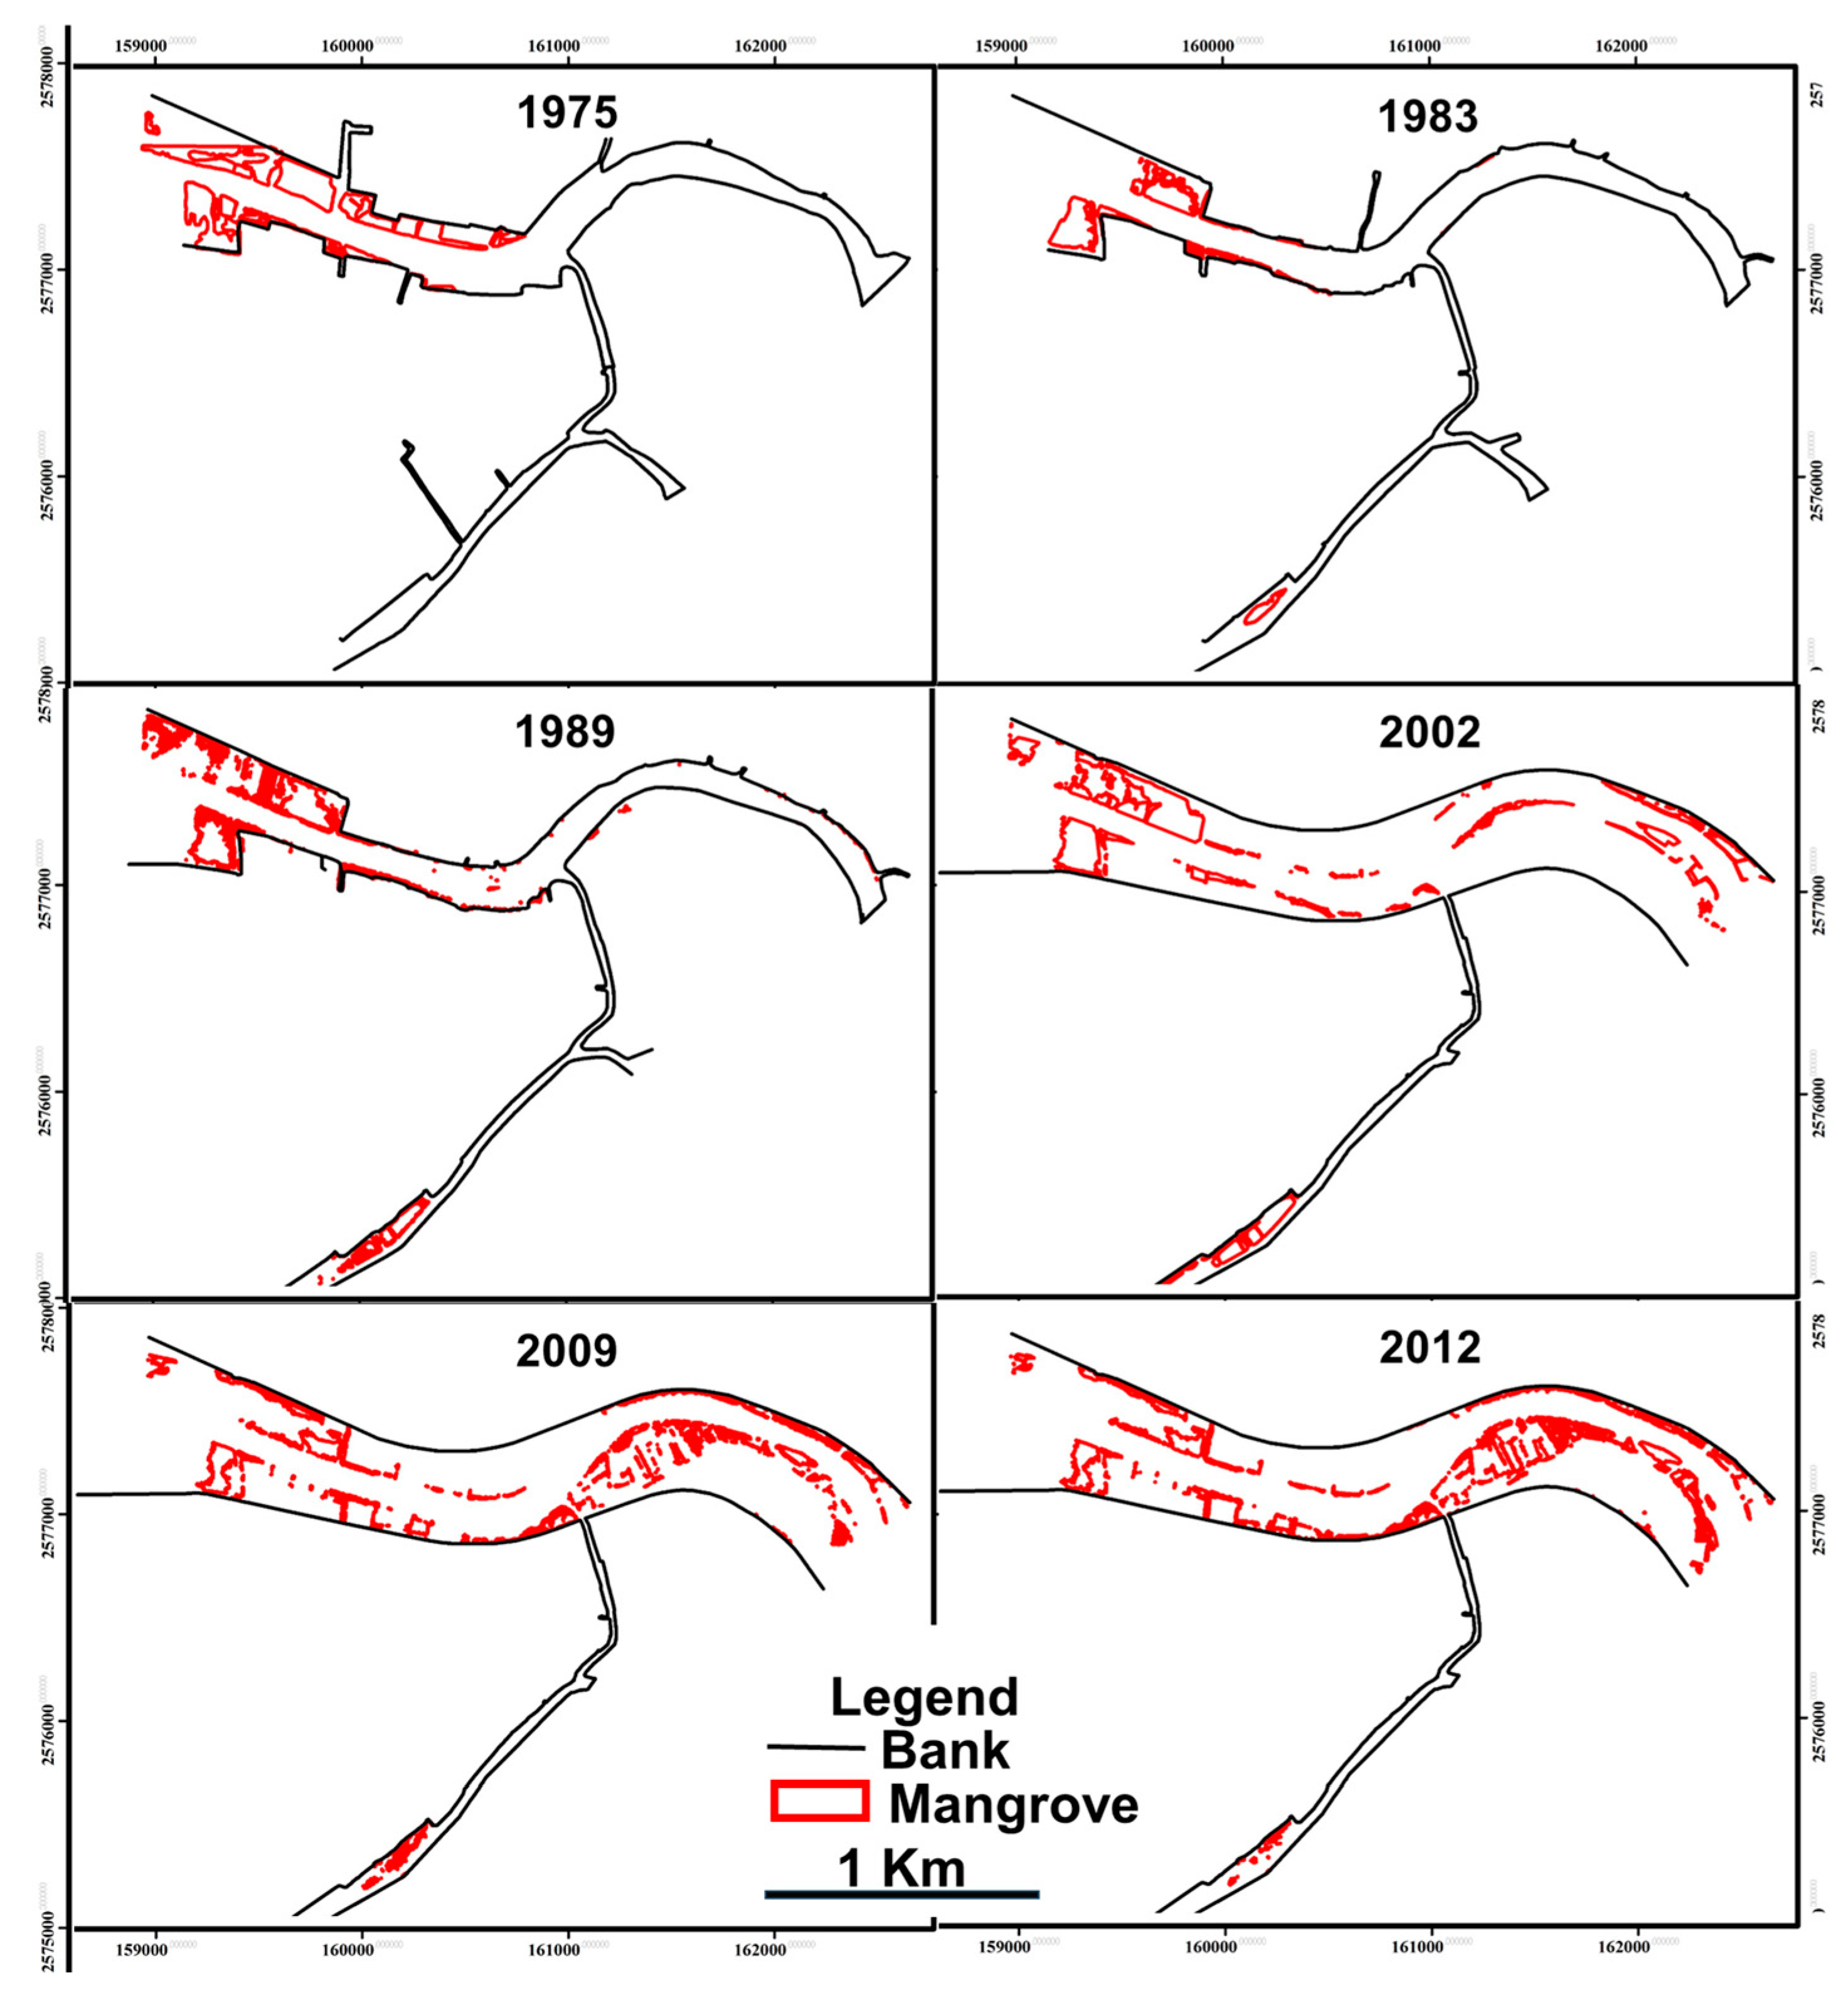
Figure 10.
Changes in mangrove areas at Dongshih Lagoon and Puzih Estuary, Chiayi County, from 1975 to 2017.
Figure 10.
Changes in mangrove areas at Dongshih Lagoon and Puzih Estuary, Chiayi County, from 1975 to 2017.
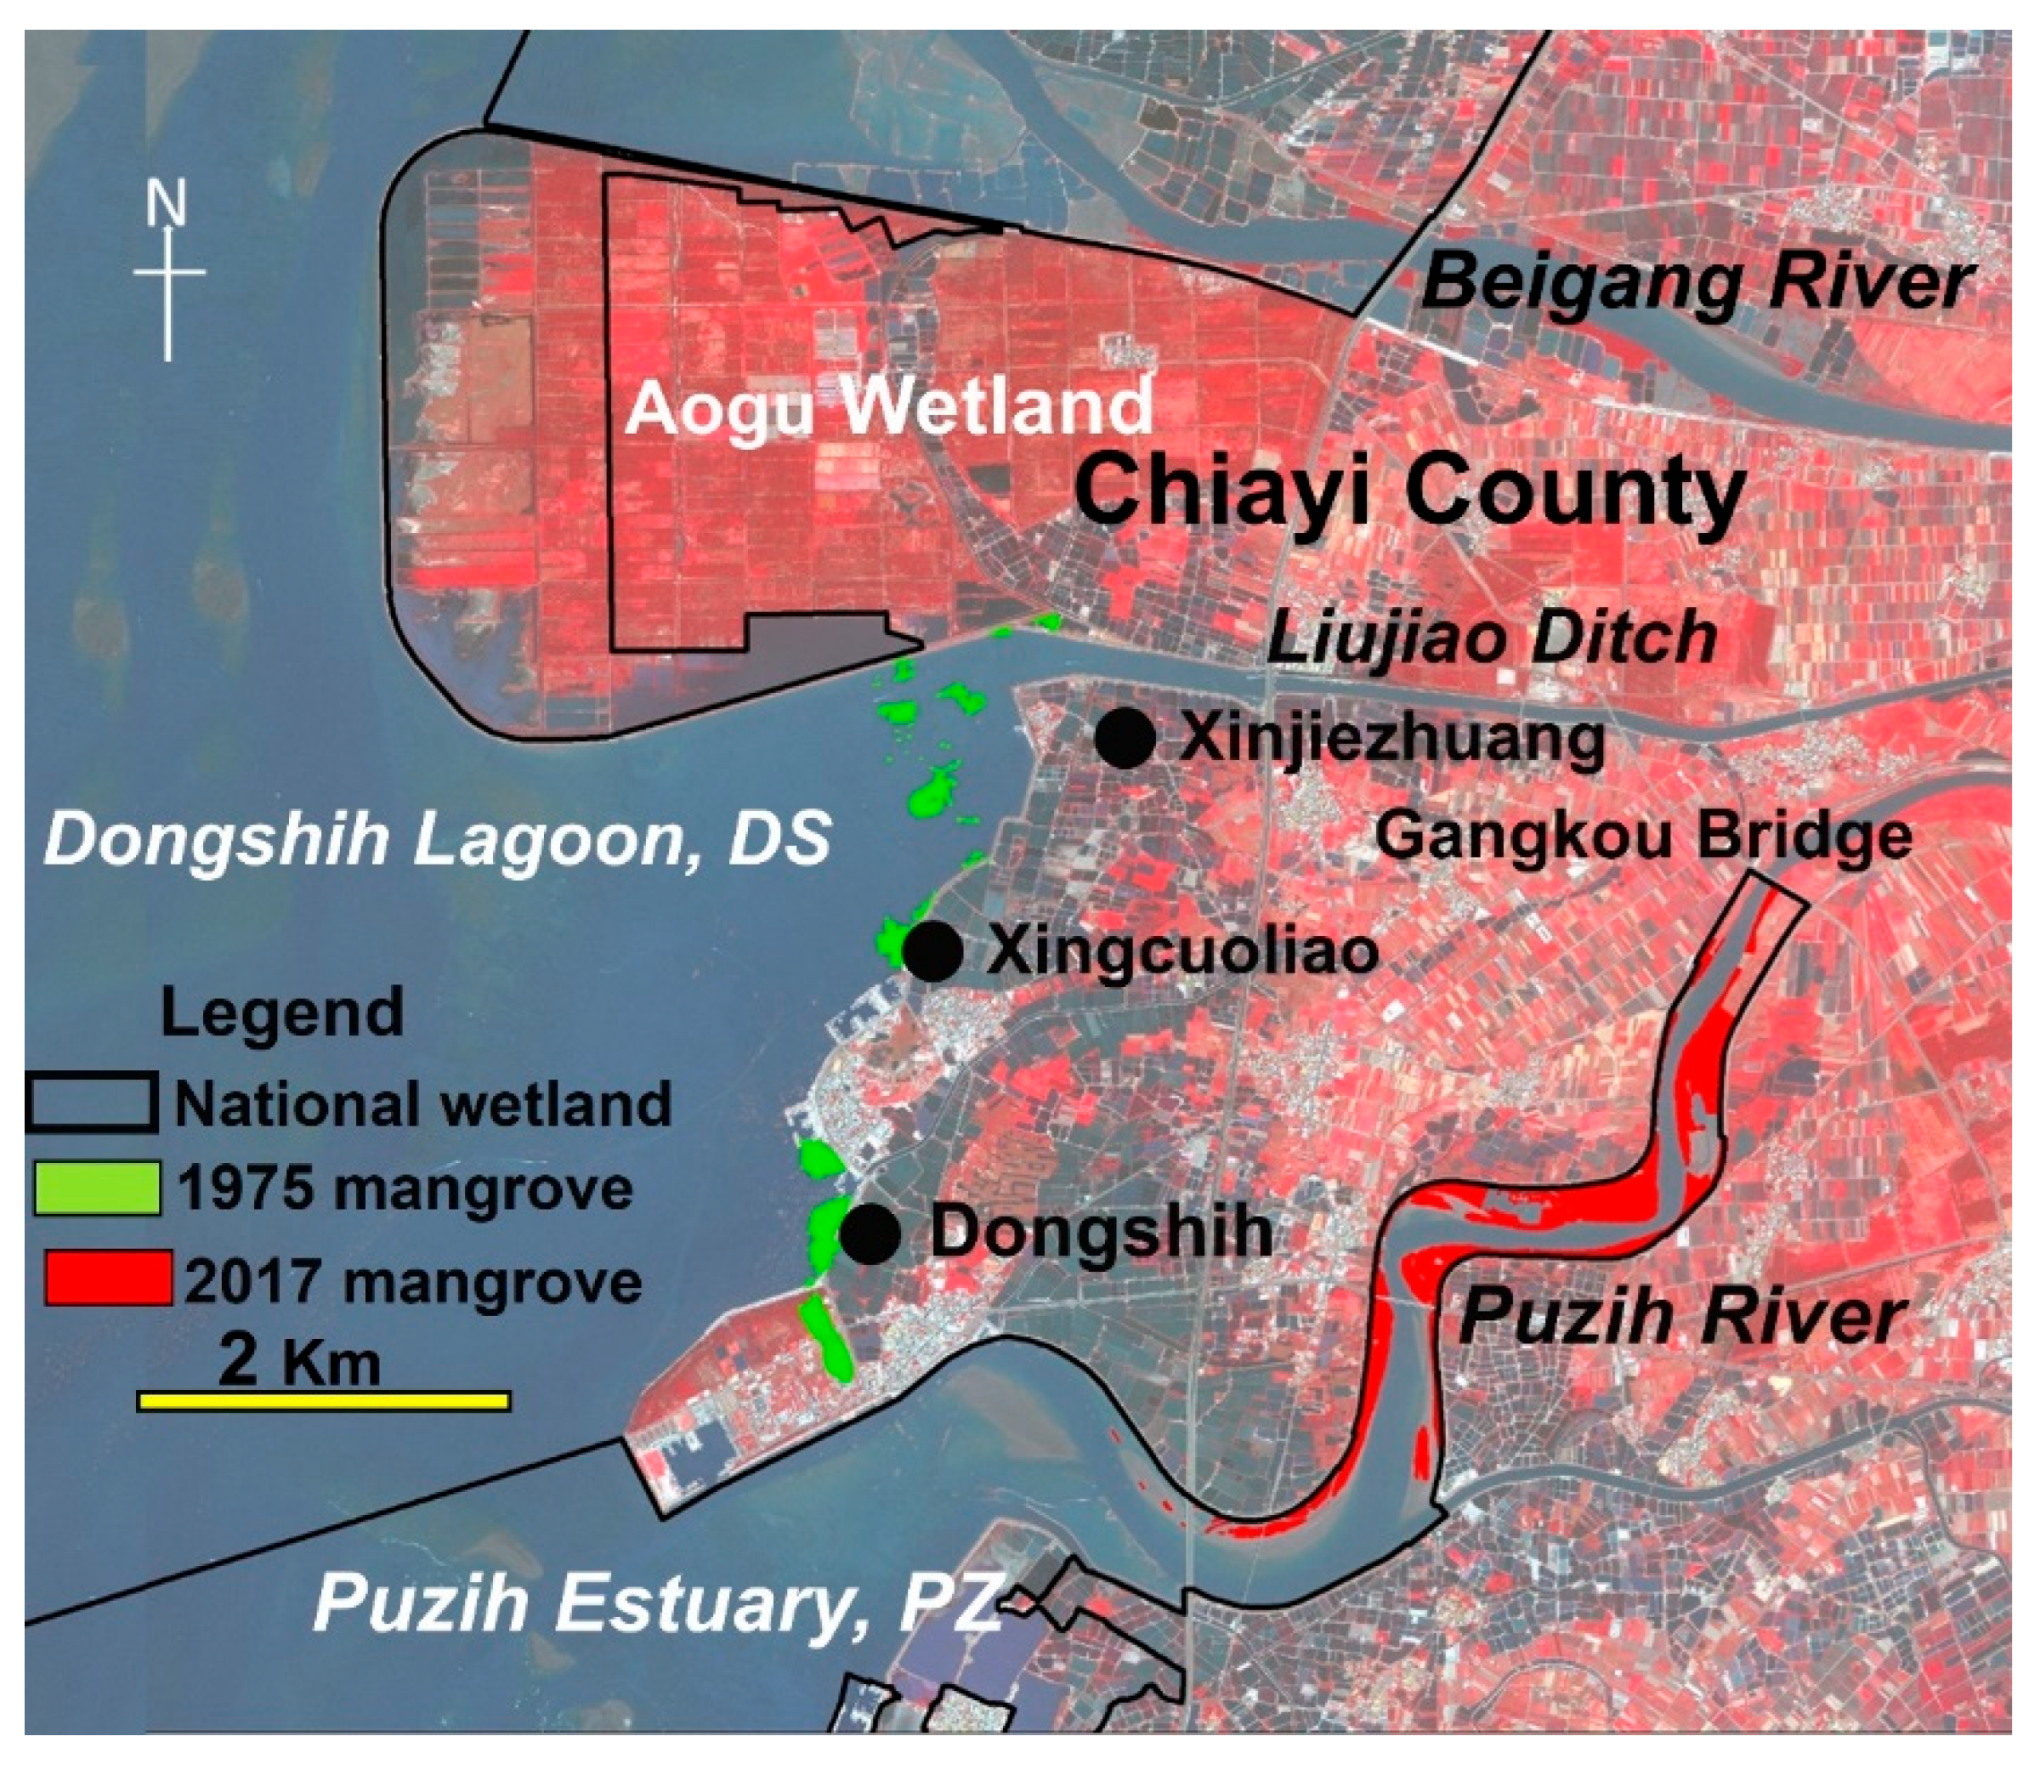
Figure 11.
Changes in mangrove areas at Budai Lagoon and Haomeiliao Wetland, Chiayi County, from 1975 to 2017.
Figure 11.
Changes in mangrove areas at Budai Lagoon and Haomeiliao Wetland, Chiayi County, from 1975 to 2017.
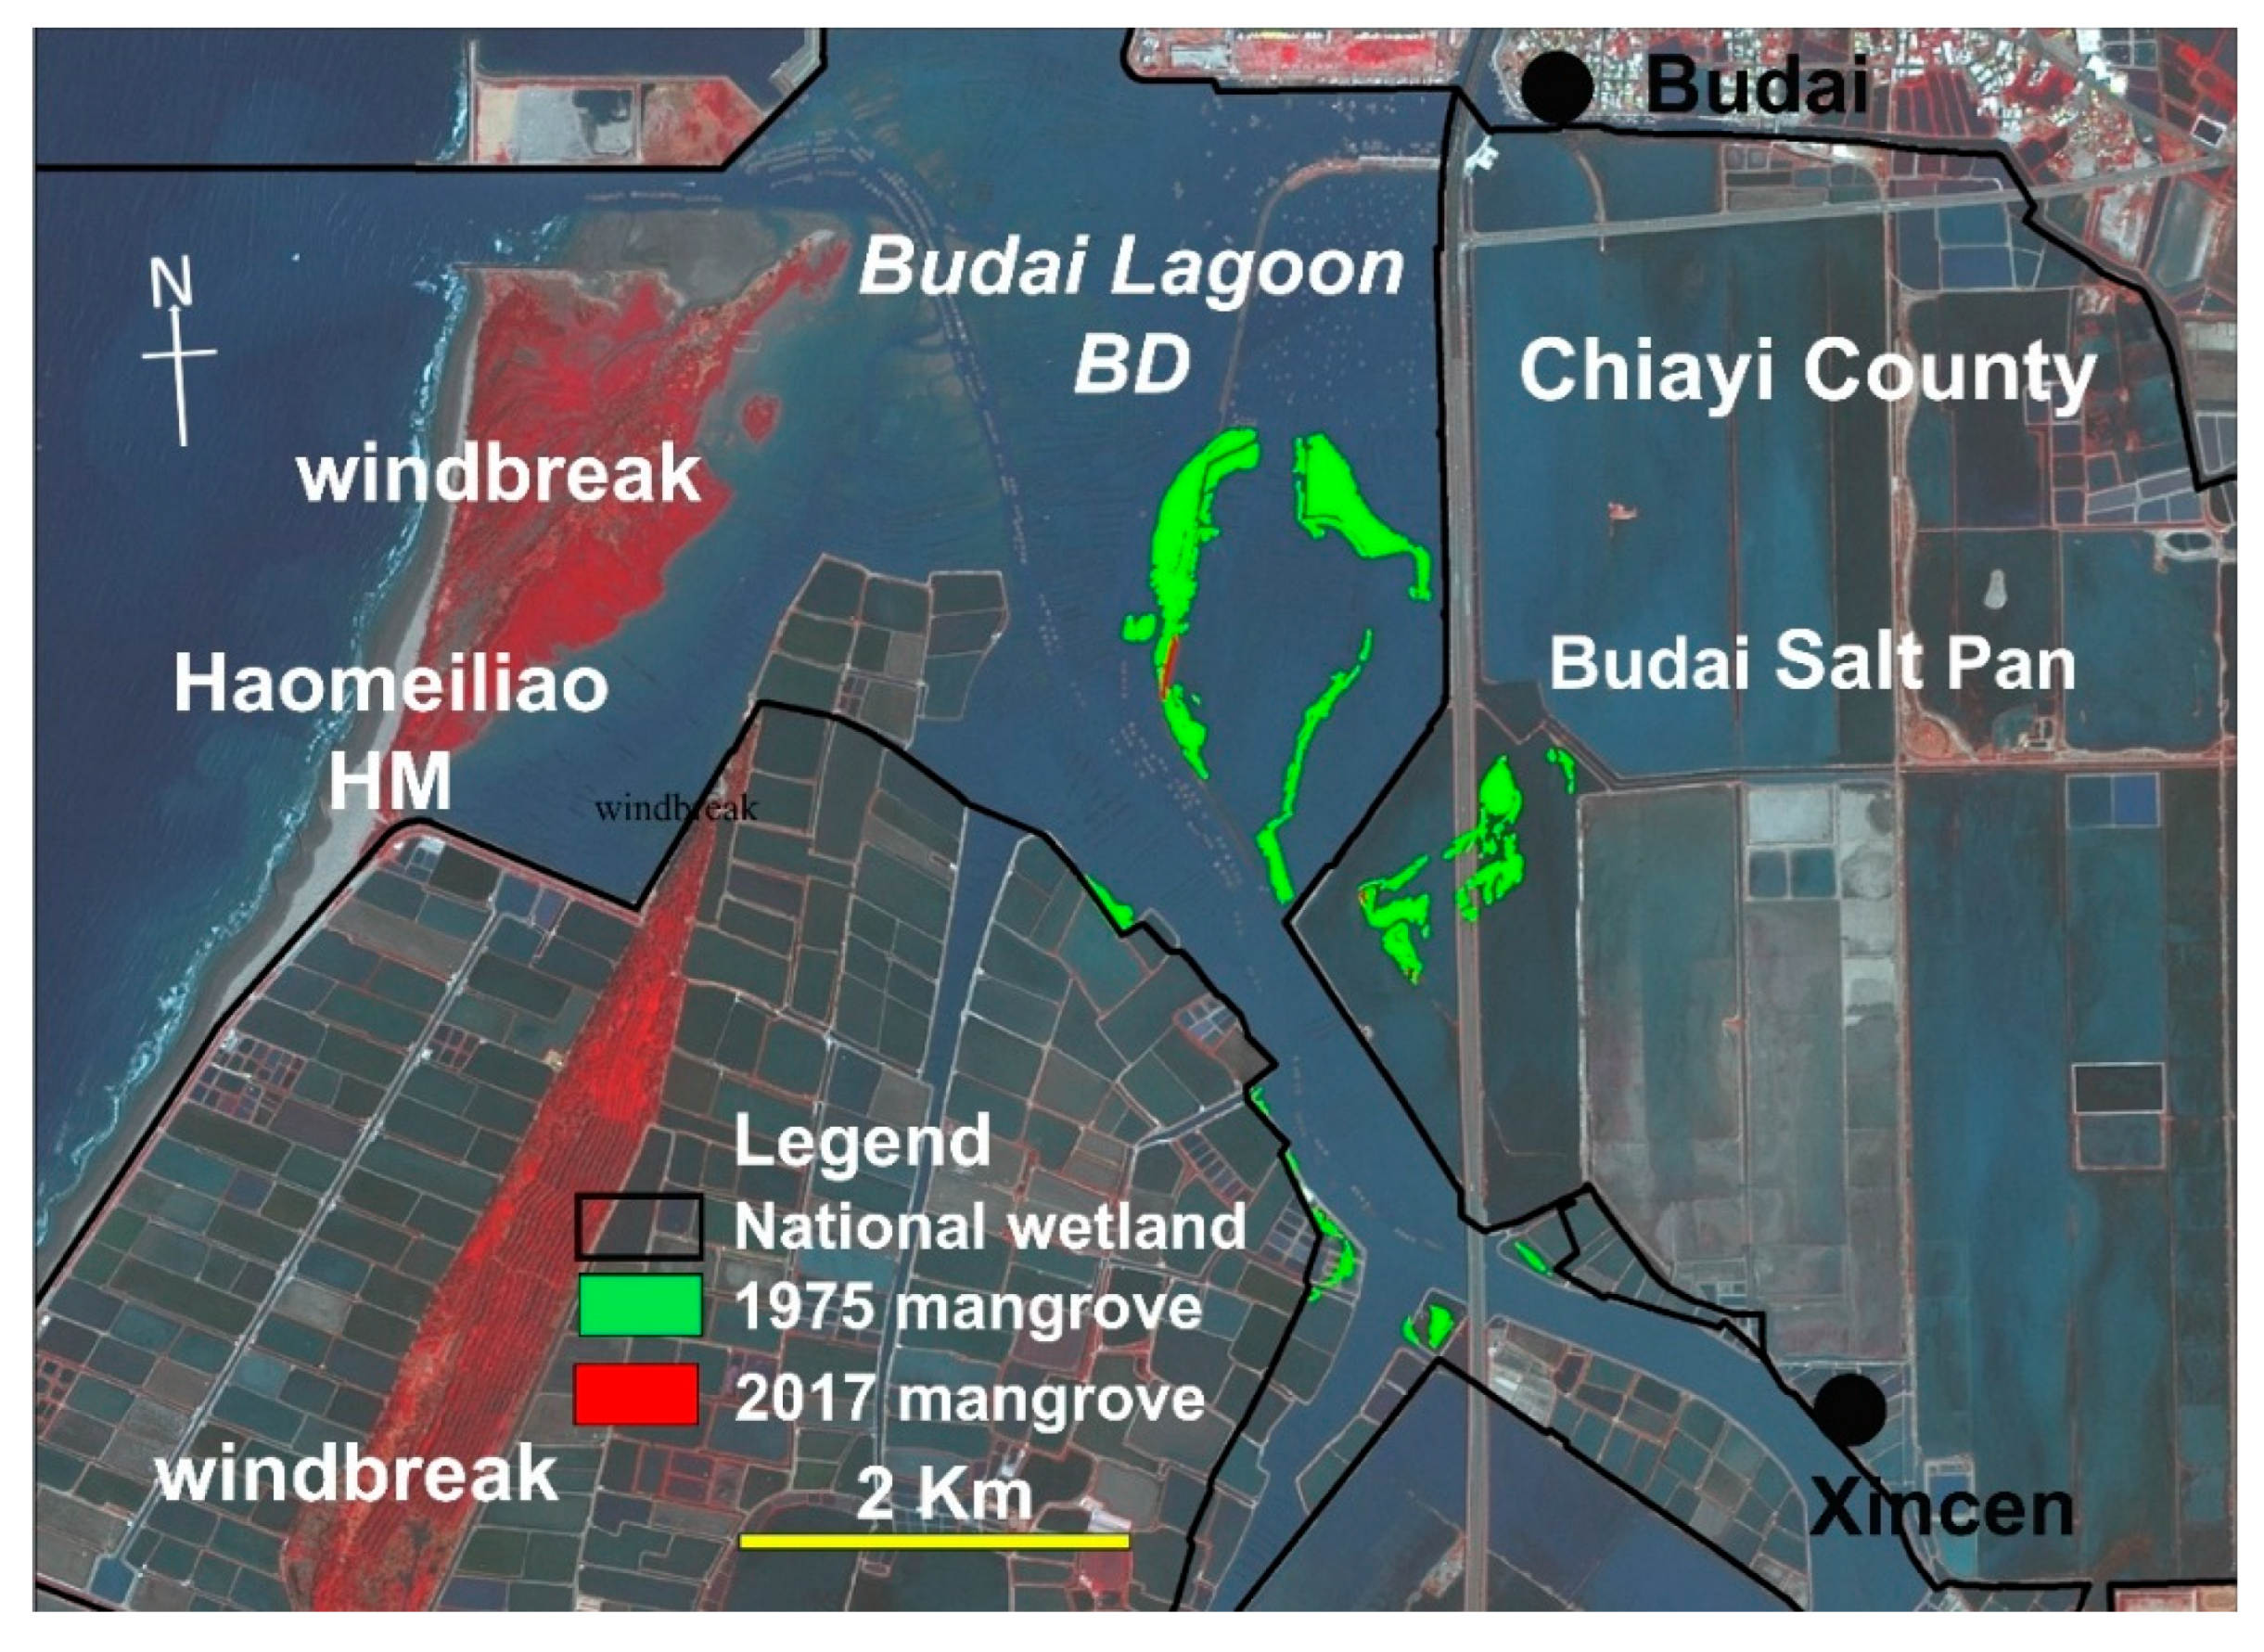
Figure 12.
Changes in mangrove areas at Jishui Estuary, Tougang Ditch, and Syuejia Wetland, Tainan City, from 2017 to 2023.
Figure 12.
Changes in mangrove areas at Jishui Estuary, Tougang Ditch, and Syuejia Wetland, Tainan City, from 2017 to 2023.
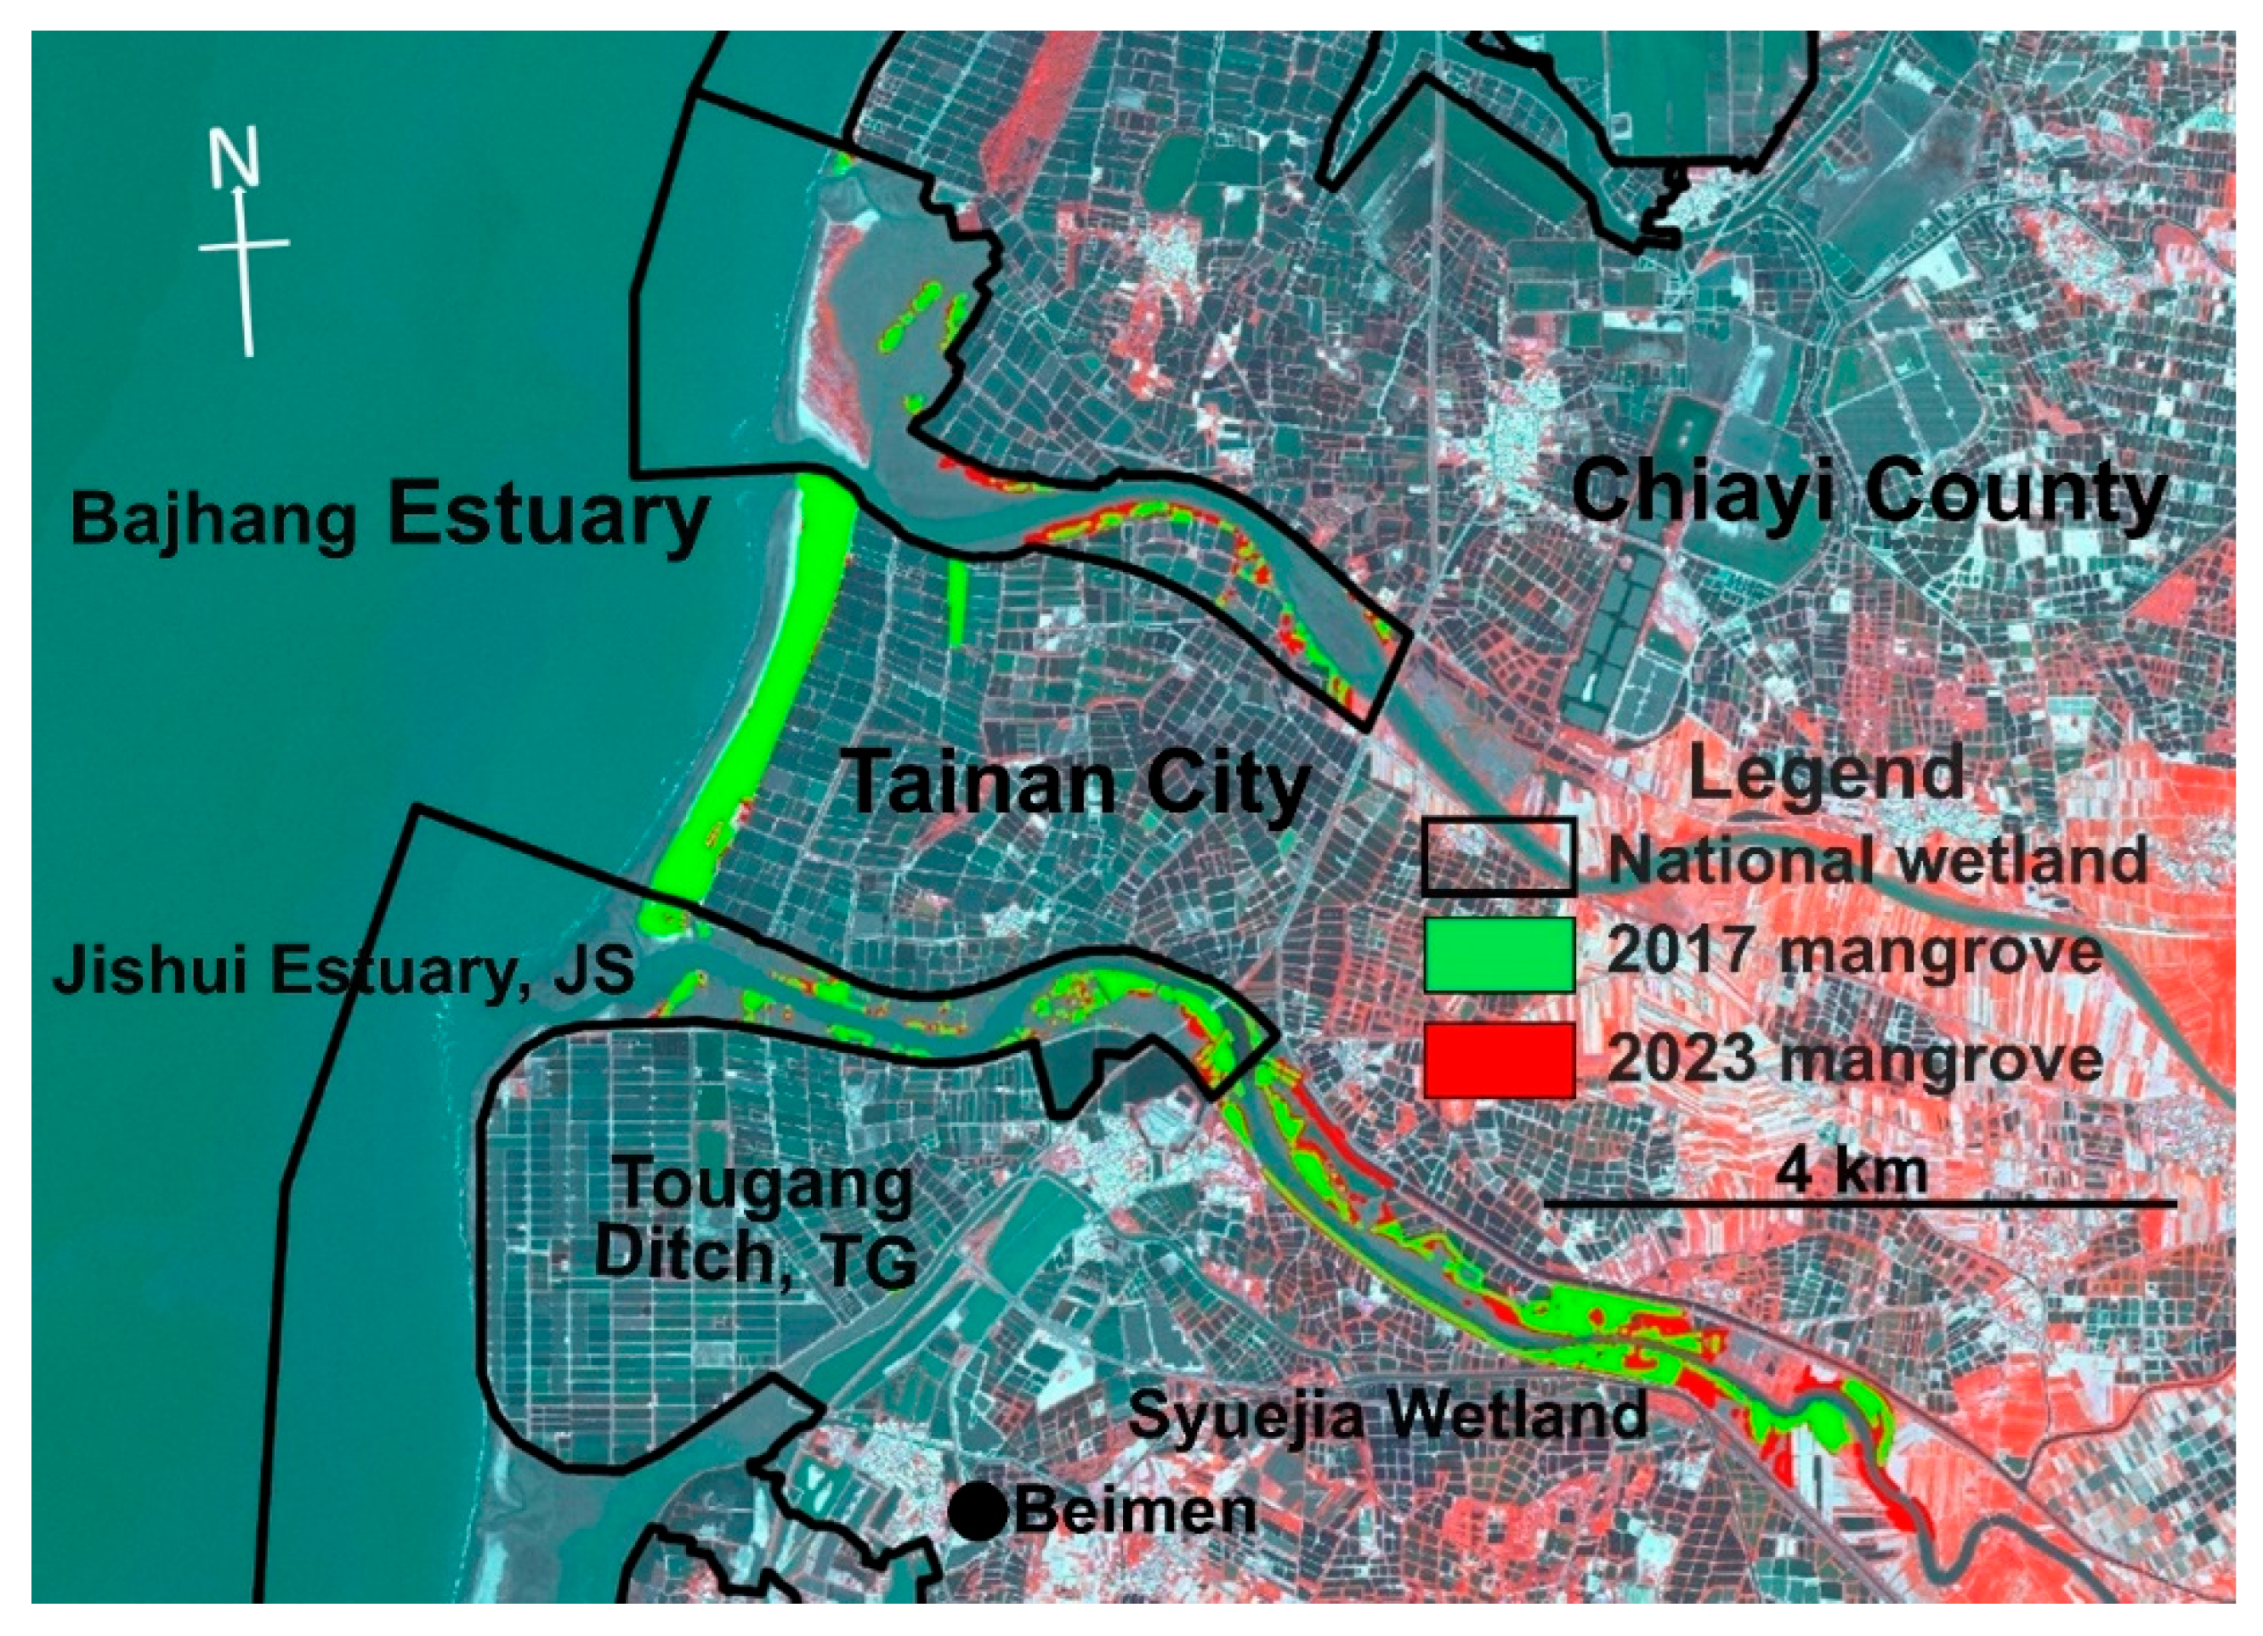
Figure 13.
Vertex of the quadratic polynomial (estimated maximum value). Cumulative land subsidence for each study site.
Figure 13.
Vertex of the quadratic polynomial (estimated maximum value). Cumulative land subsidence for each study site.
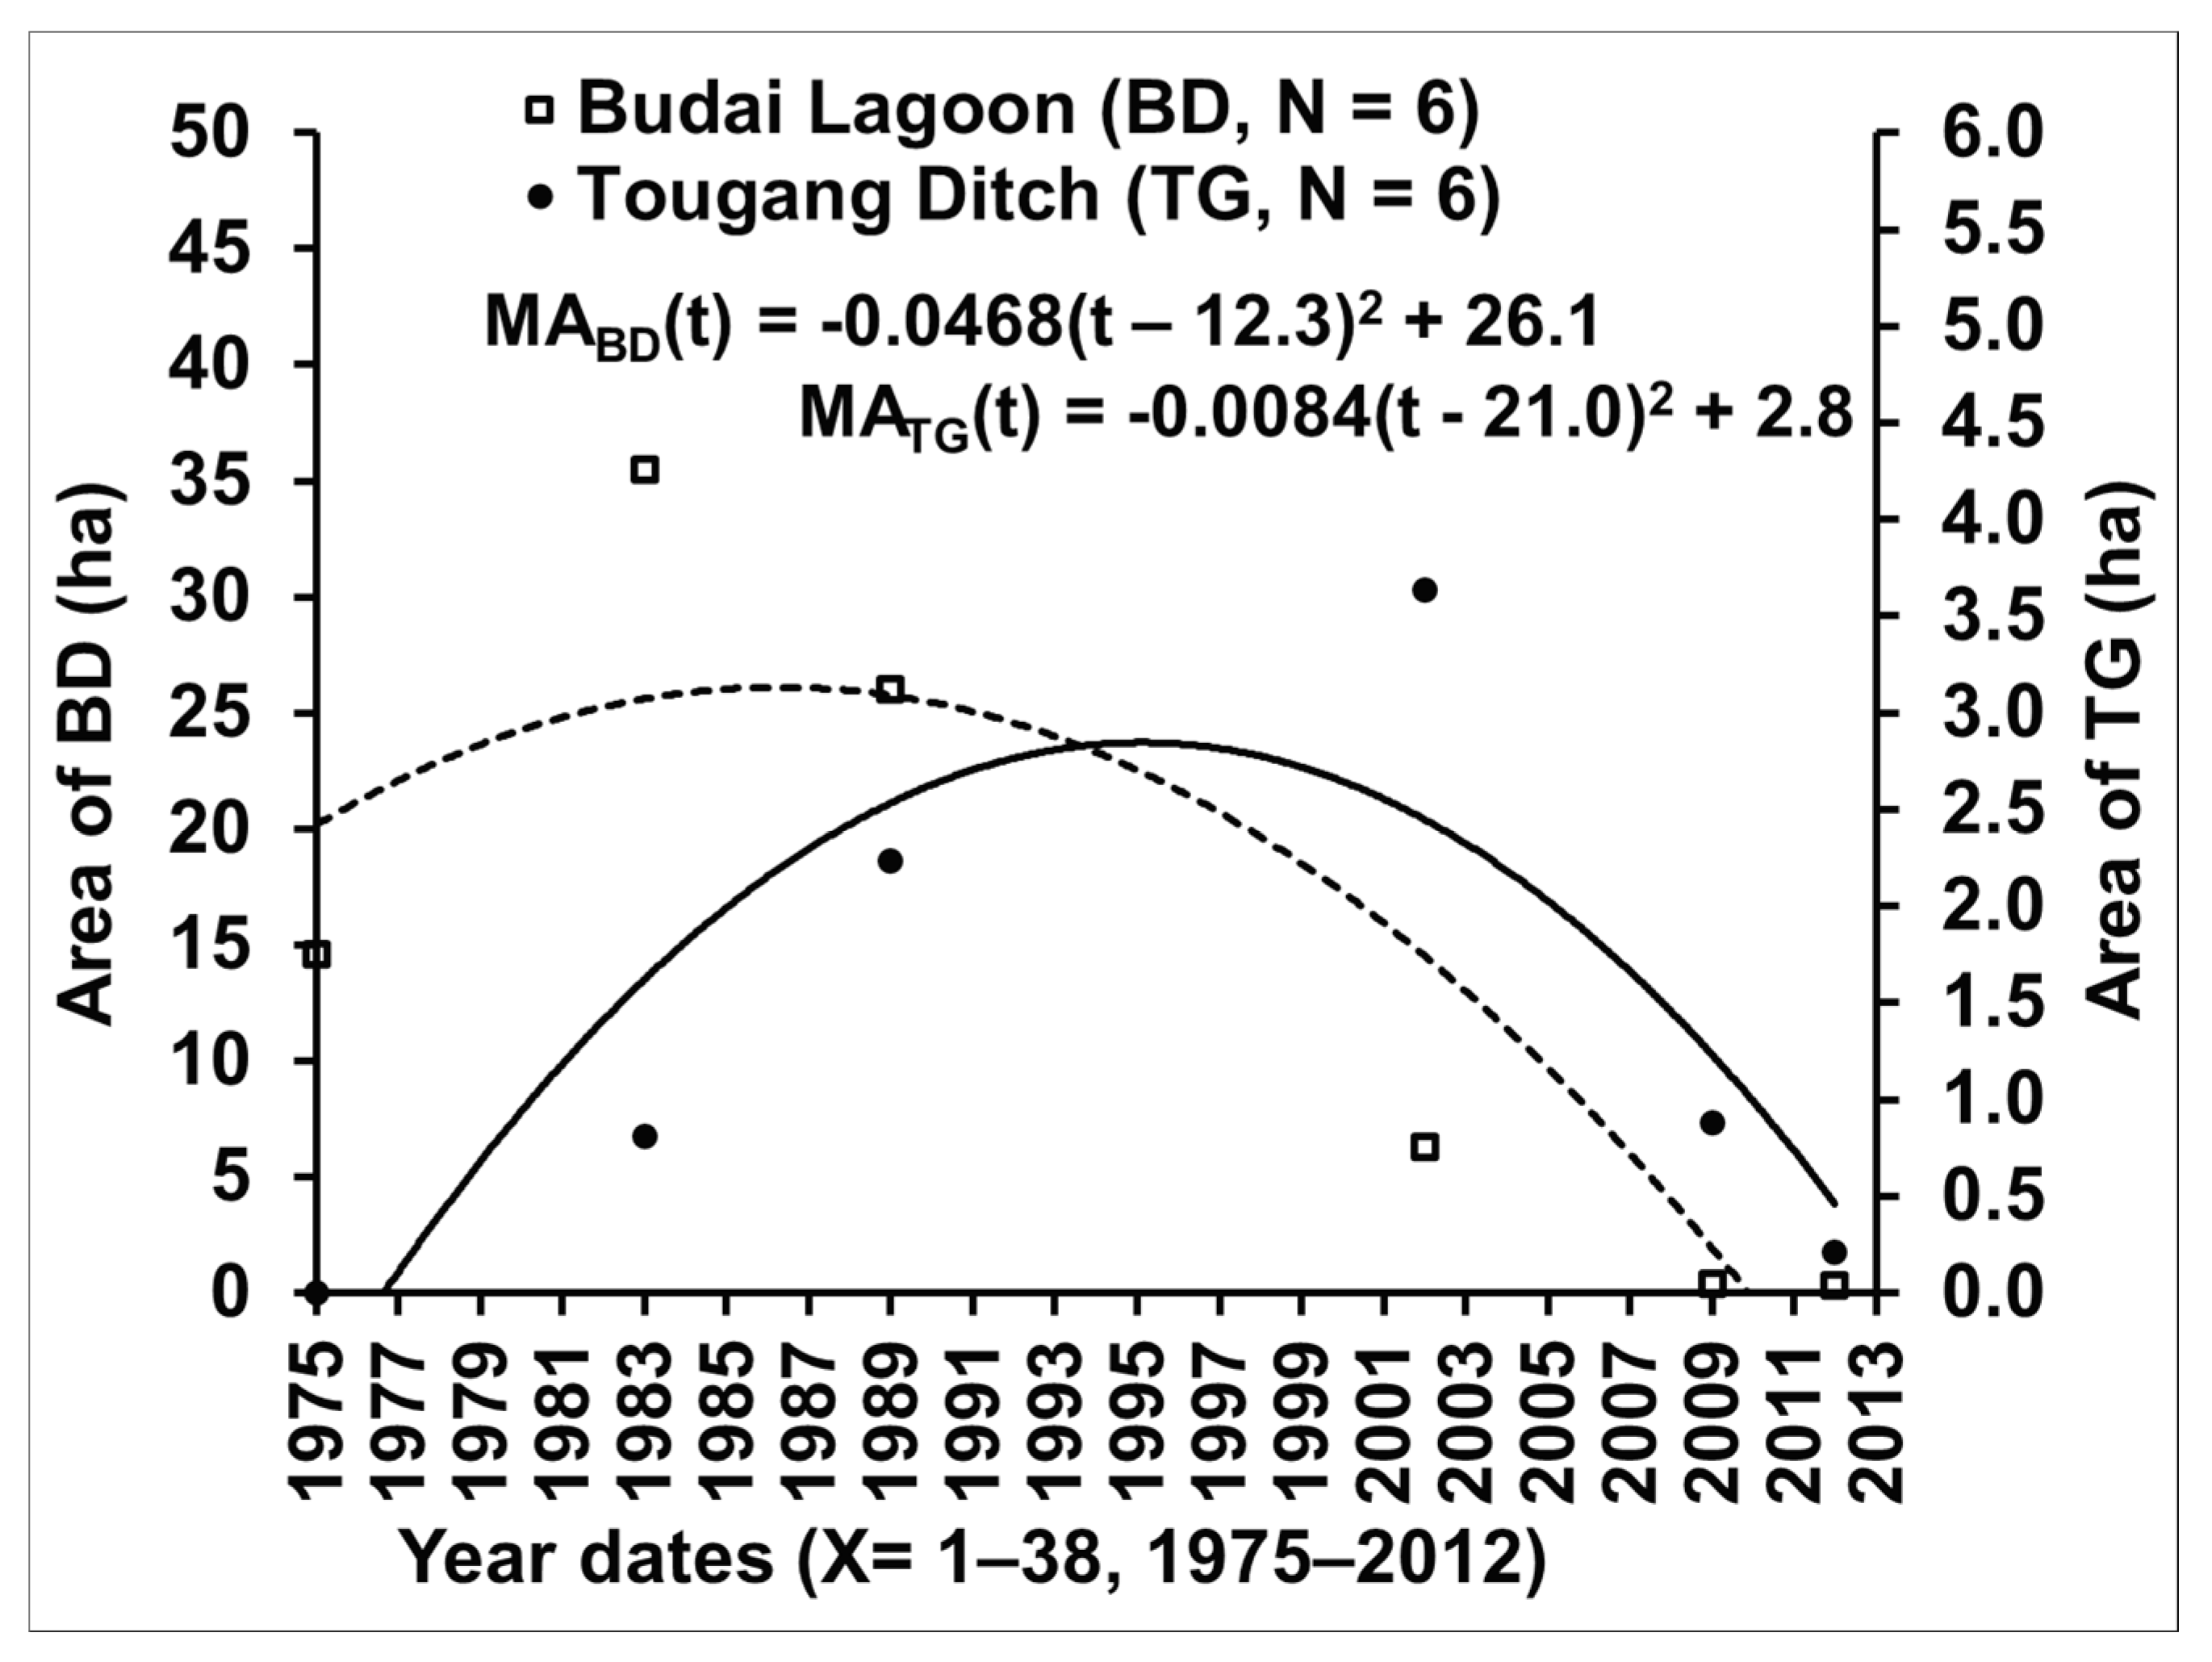
Figure 14.
Changes in mangrove areas at Jishui Estuary subsites from 1983 to 2012.
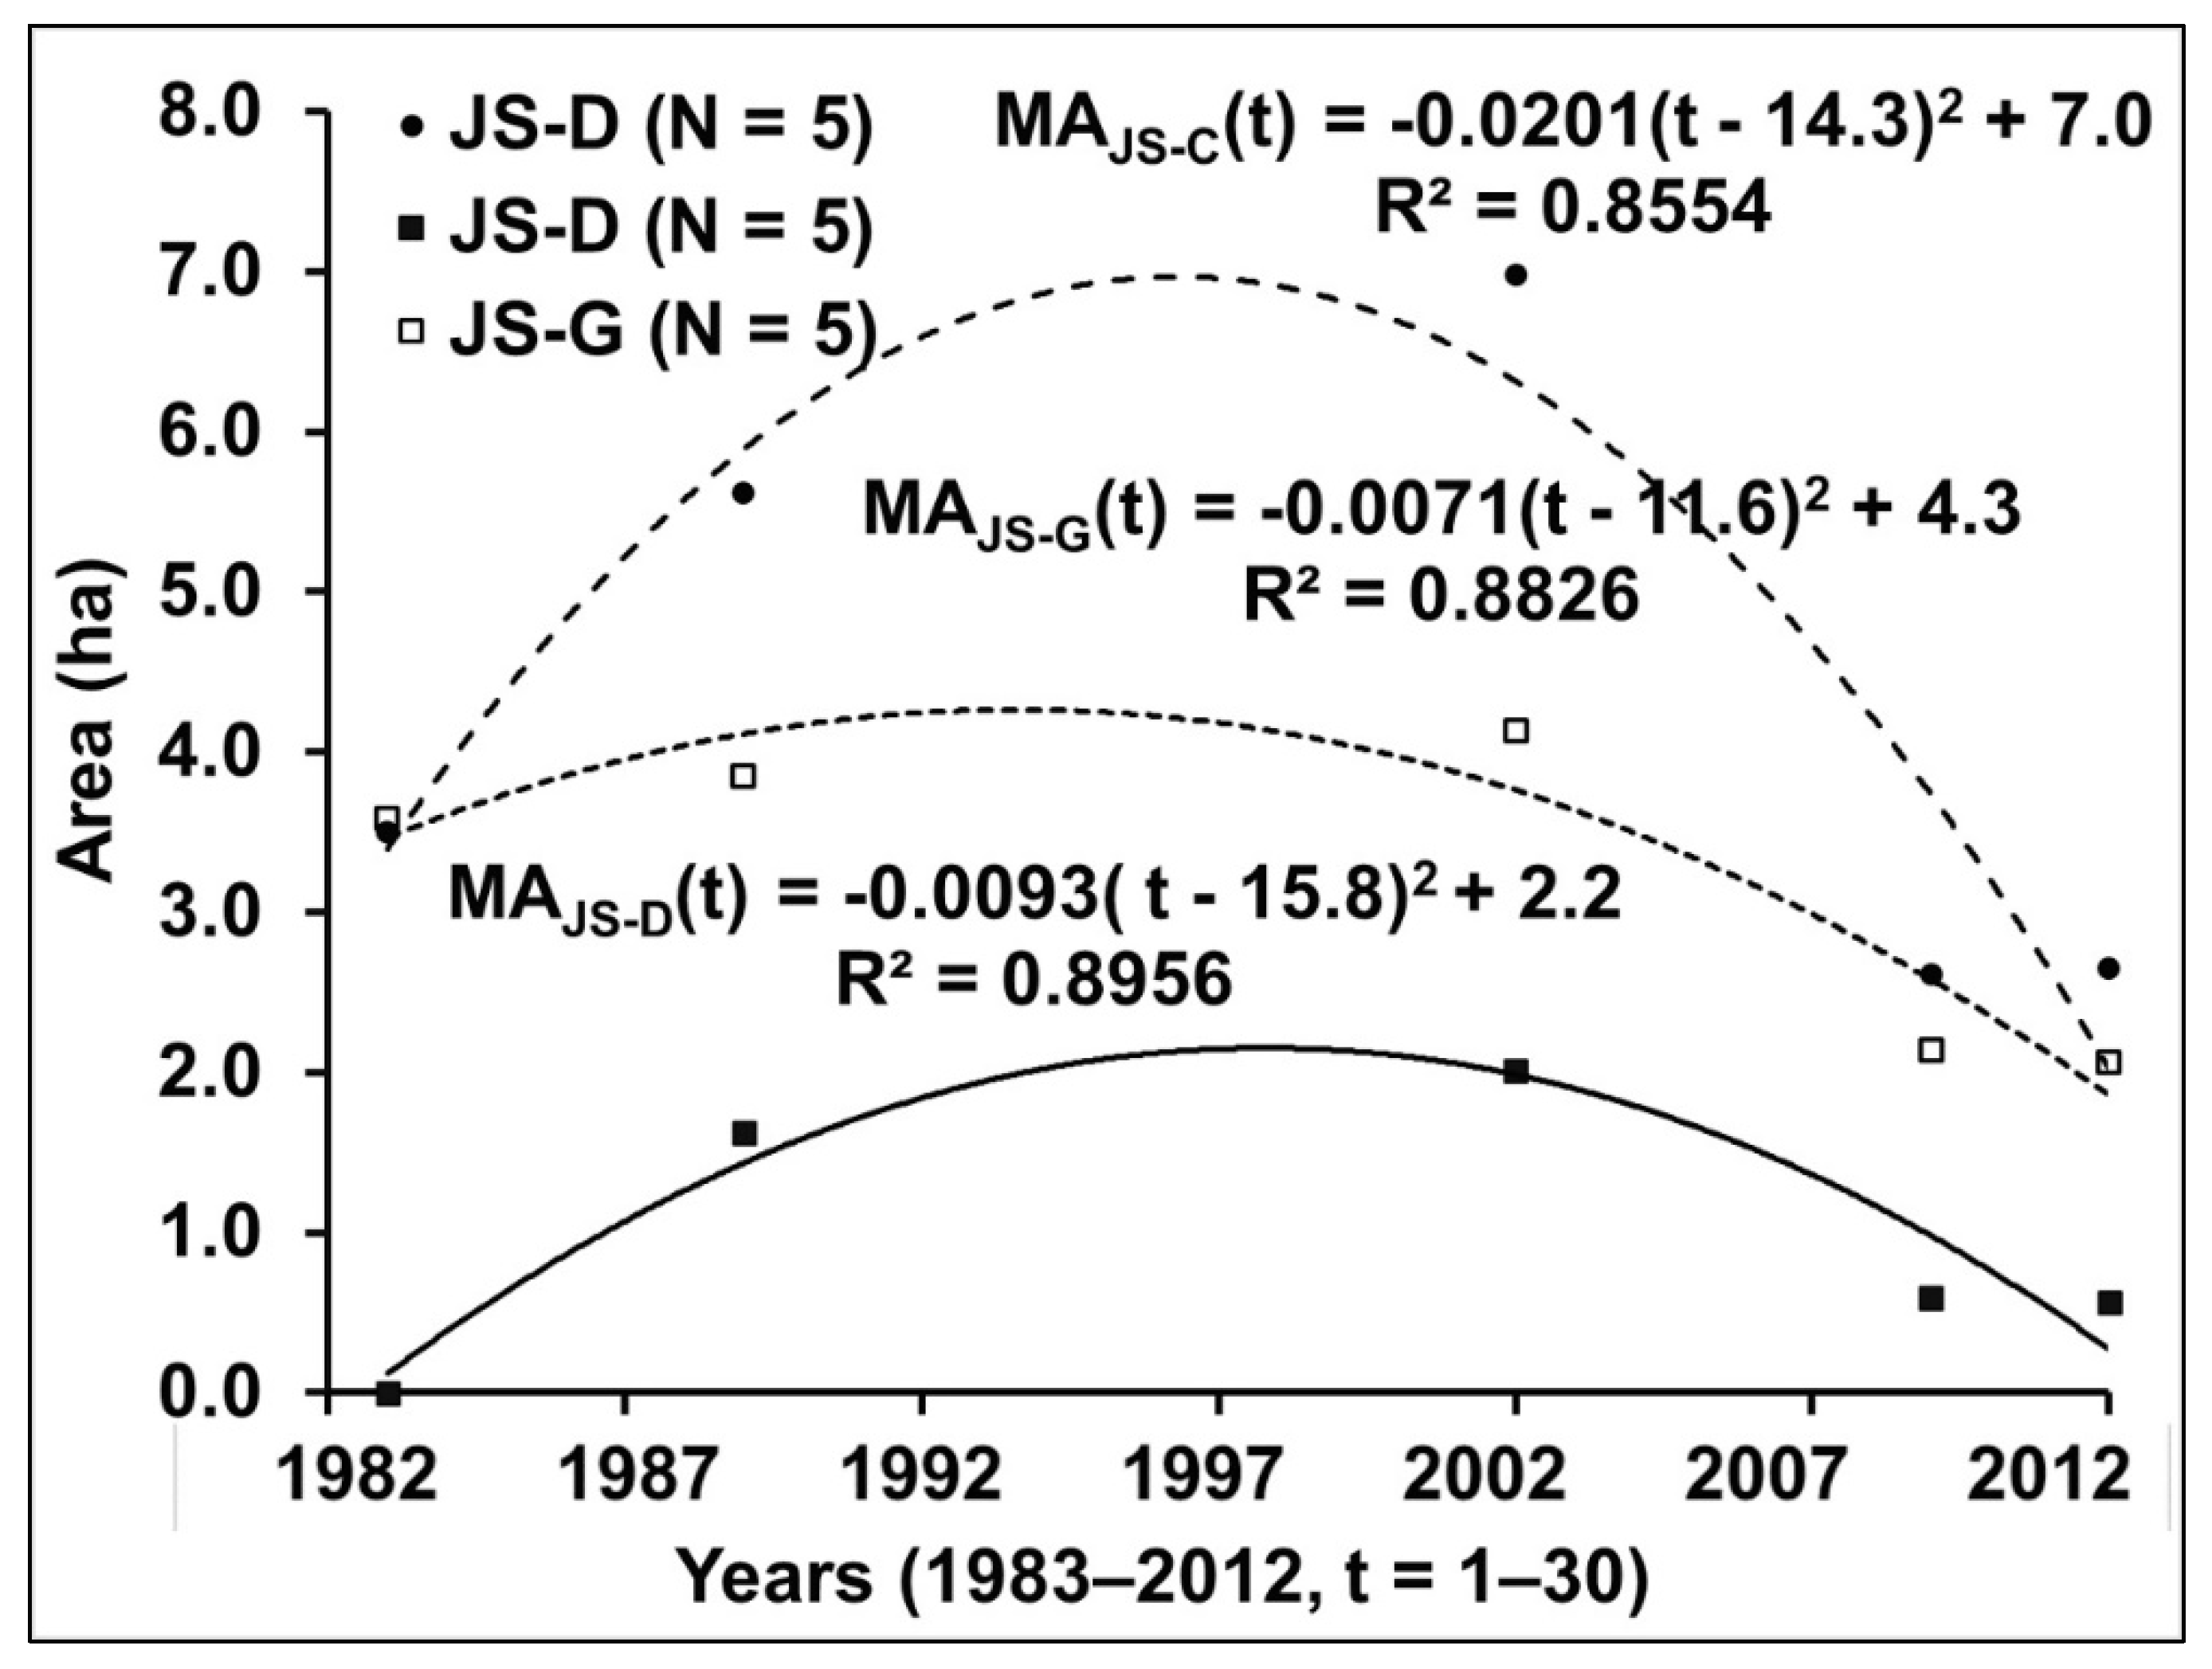
Figure 15.
Distribution of mangroves and windbreak forests from the Beigang River (Chiayi County) to the Jiangjun River (Tainan City), as per data collected on 22 February 2025.
Figure 15.
Distribution of mangroves and windbreak forests from the Beigang River (Chiayi County) to the Jiangjun River (Tainan City), as per data collected on 22 February 2025.
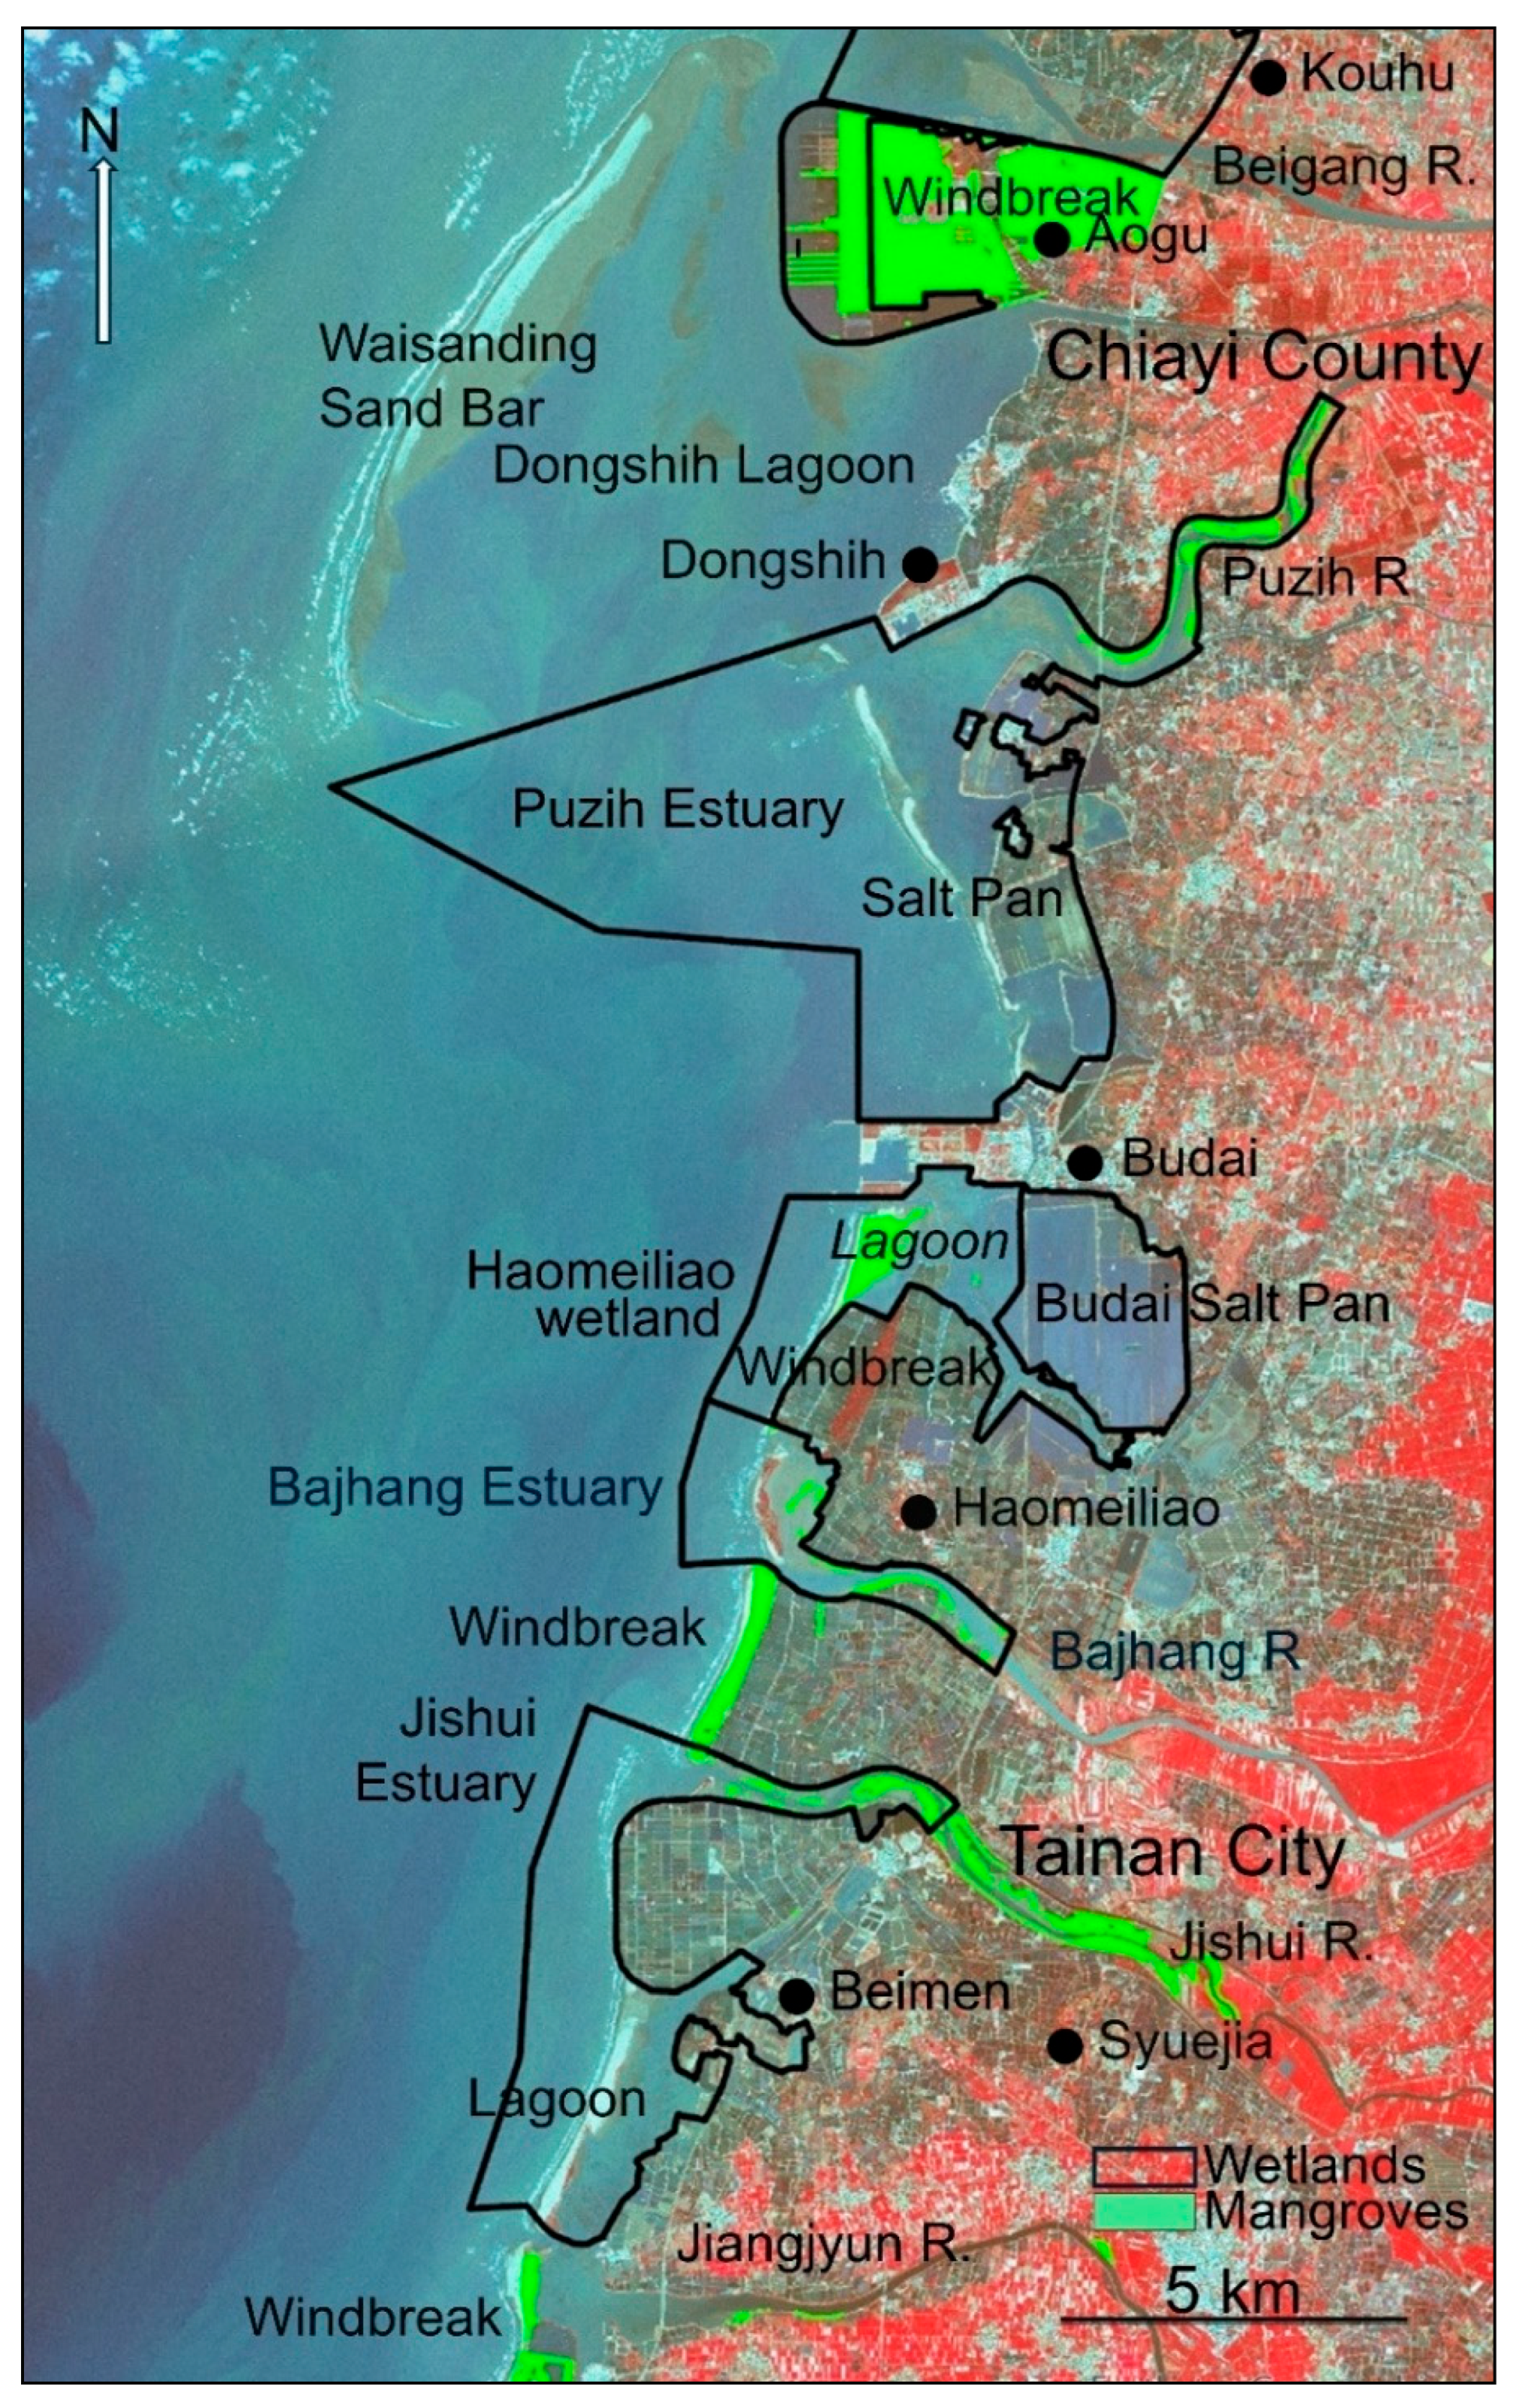
Figure 16.
Estimated time of death for mangroves at Jishui Estuary and Tougang Ditch. Mangroves at Sihcao Wetland were referenced to estimate the time of death for those at Jishui Estuary and Tougang Ditch.
Figure 16.
Estimated time of death for mangroves at Jishui Estuary and Tougang Ditch. Mangroves at Sihcao Wetland were referenced to estimate the time of death for those at Jishui Estuary and Tougang Ditch.
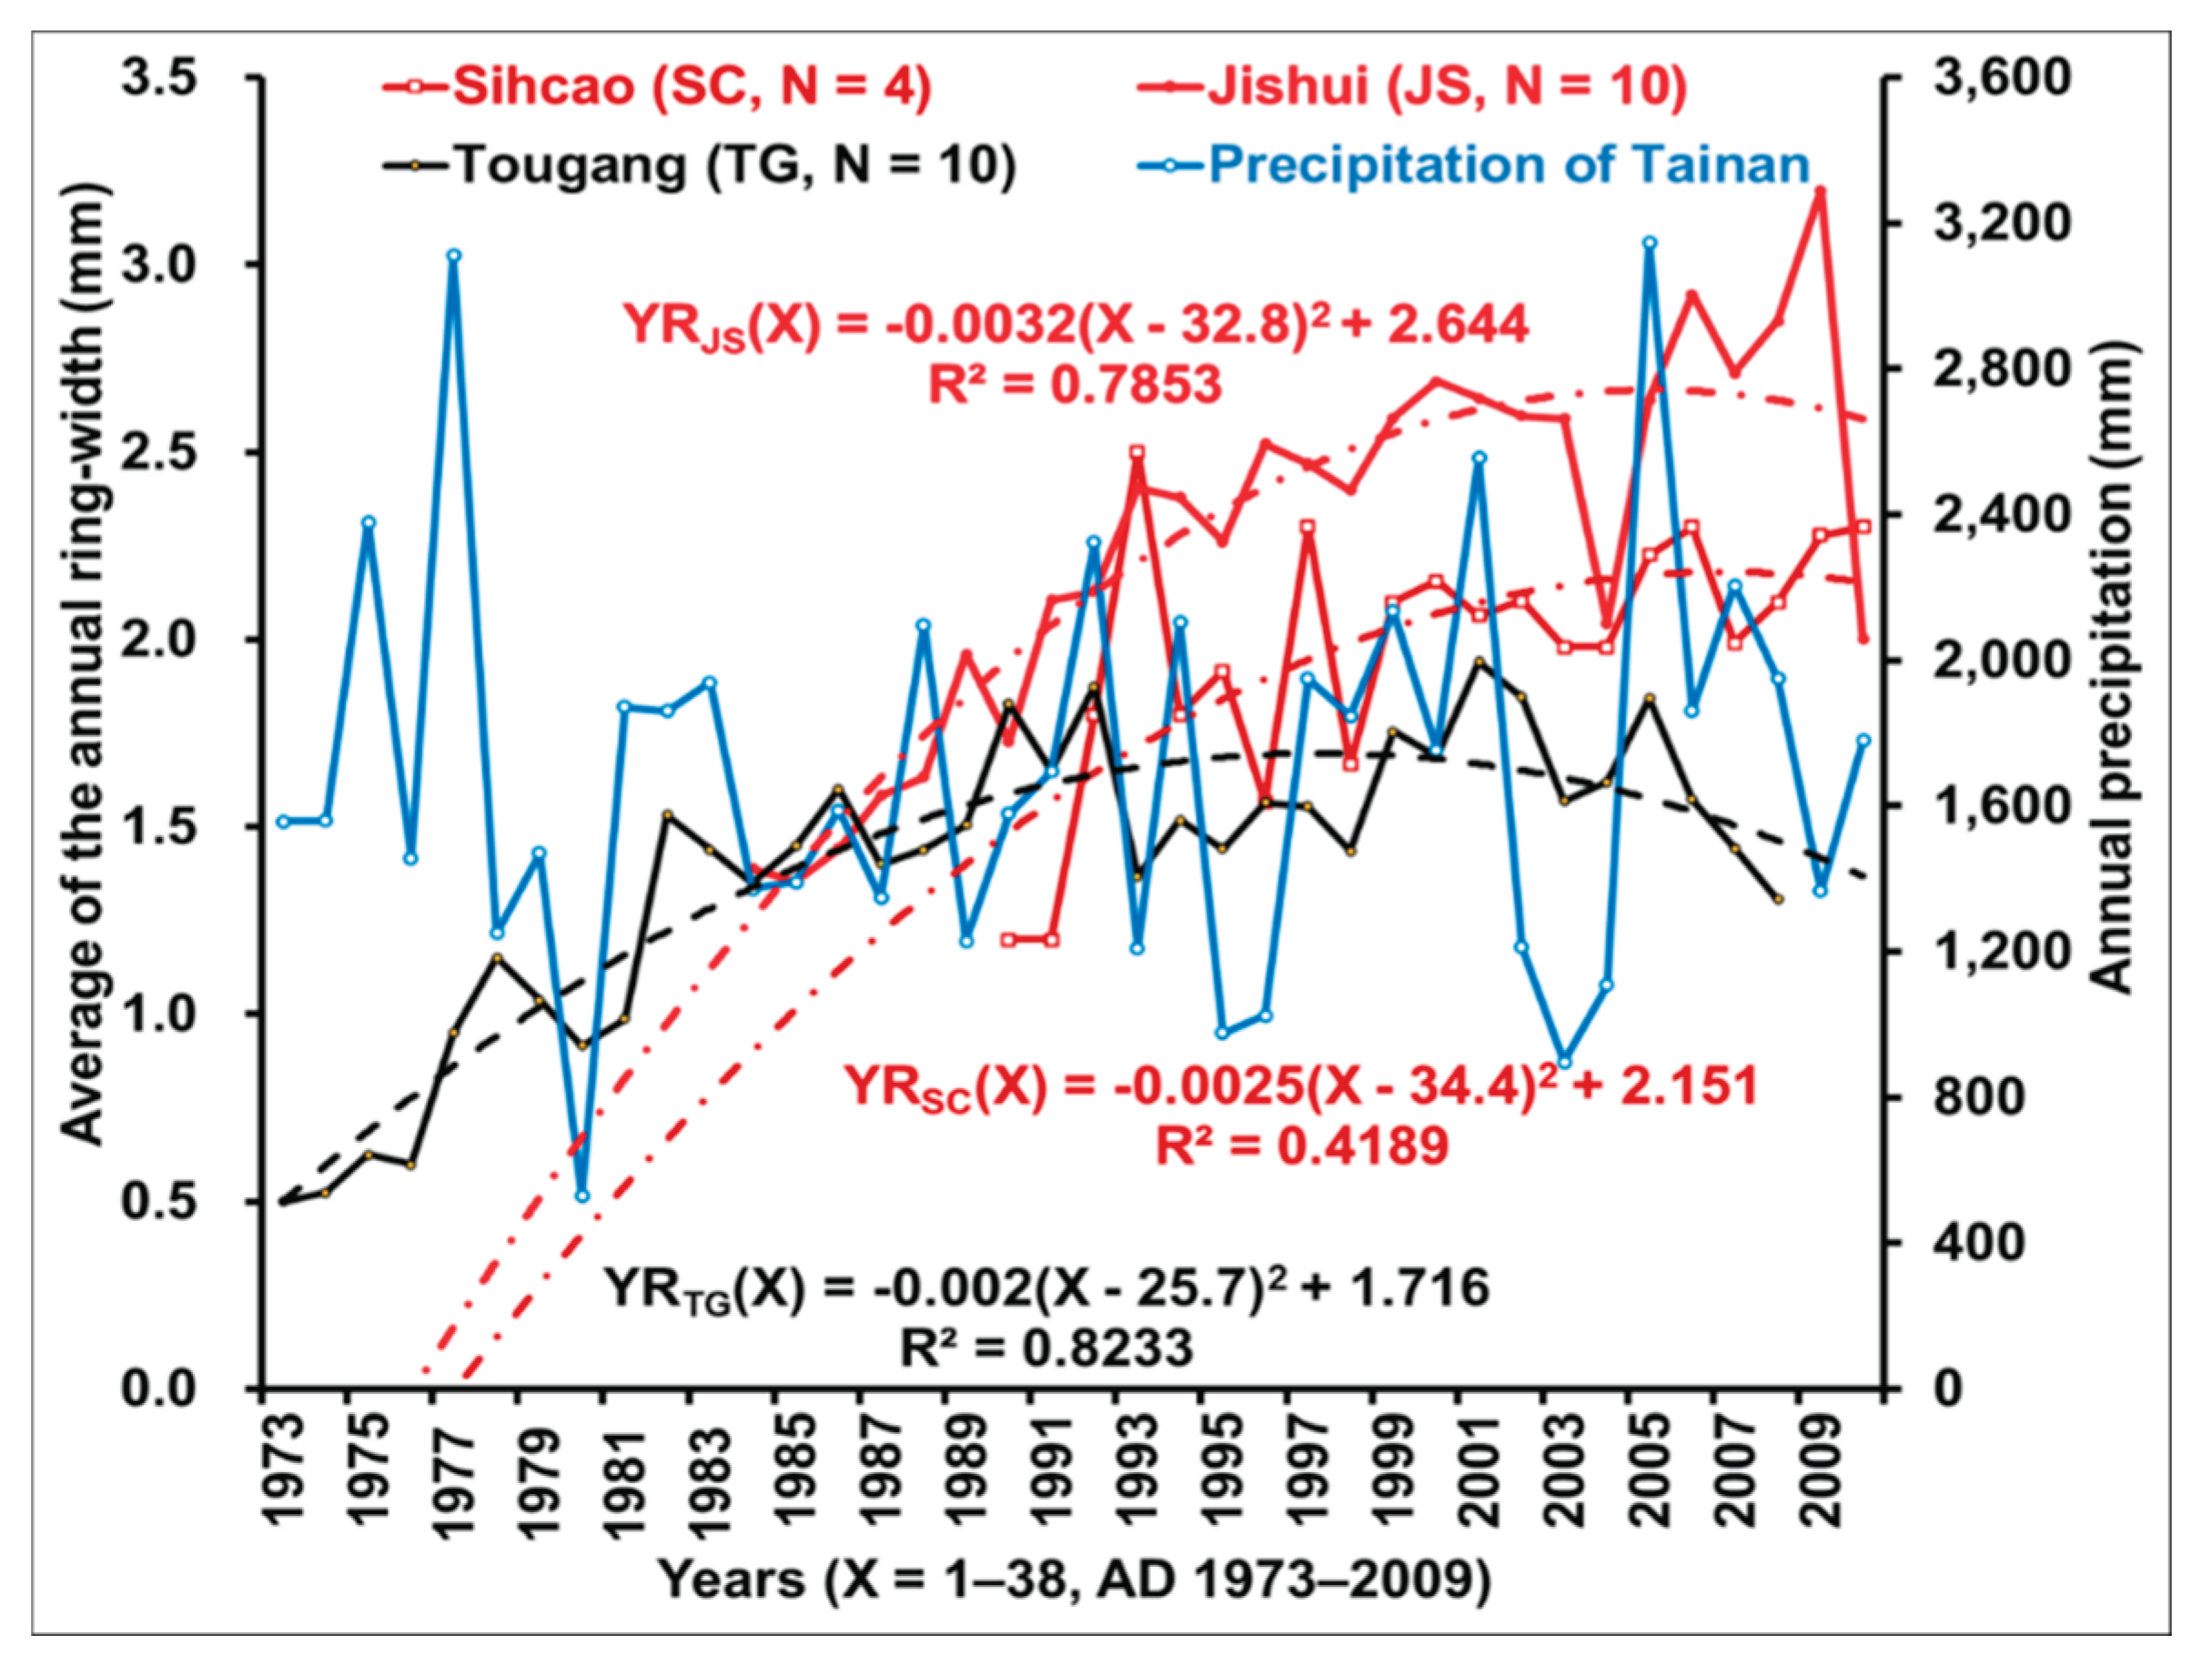

Table 1.
Cumulative subsidence along the west coast of Taiwan from 1975 to 2023.
| County/City | Township | WGS84-E | WGS84-N | Cum. Subsidence (cm) |
|---|---|---|---|---|
| Changhua | Shengang | 120.4864 | 24.1551 | -23.3 |
| (1979-2023) | Xianxi | 120.4406 | 24.1346 | -18.7 |
| Lukang | 120.4796 | 24.048 | -66.4 | |
| Fuxing | 120.4171 | 24.0355 | -71.4 | |
| Erlin | 120.3752 | 23.9064 | -146.6 | |
| Fangyuan | 120.3751 | 23.9064 | -121.8 | |
| Dacheng | 120.2832 | 23.8608 | -266.9 | |
| Yunlin | Mailiao | 120.2245 | 23.7638 | -248.2 |
| (1975-2023) | Taixi | 120.1846 | 23.6859 | -283.0 |
| Sihu | 120.1826 | 23.6995 | -275.0 | |
| Kouhu | 120.1406 | 23.5589 | -247.9 | |
| Shuilin | 120.1949 | 23.5169 | -226.6 | |
| Chiayi | Dongshih | 120.1674 | 23.4154 | -233.6 |
| (1986-2023) | Budai | 120.1780 | 23.4154 | -179.4 |
| Yizhu | 120.1824 | 23.3069 | -180.3 | |
| Tainan | Beimen | 120.1563 | 23.3019 | -153.3 |
| (1987-2023) | Syuejia | 120.2021 | 23.2659 | -104.0 |
| Cigu | 120.1316 | 23.1305 | -50.2 | |
| Aninan | 120.1742 | 23.023 | -55.7 |
Reference: Data (2024) collected from the Water Resources Agency, Ministry of Economic Affairs.
Table 2.
Mangrove area along the southwest coast of Taiwan from 1975 to 2025 (ha).
| Sampling sites | Abbr. | 1975 | 1983 | 1989 | 2002 | 2009 | 2012 | 2017 | 2023 | 2025 |
|---|---|---|---|---|---|---|---|---|---|---|
| Dongshih Lagoon | DS | 25.2 | 14.7 | — | 0 | |||||
| Budai Lagoon | BD | 14.6 | 35.5 | 26 | 6.3 | 0.4 | 0.3 | 0.1 | ||
| Jishui Estuary | JS | 21.4 | 9.1 | 12.7 | 18.2 | 11.2 | 15.4 | 23.1 | 32.4 | 34.8 |
| Tougang Ditch | TG | 0 | 0.8 | 2.2 | 3.6 | 0.9 | 0.2 | 0.2 | 0.1 | 0.1 |
| Total | 61.2 | 60.1 | 40.9 | 28.1 | 12.5 | 15.9 | 118.7 | 32.5 | 34.9 |
Note: “—“ indicates a lack of maps for corresponding years. The afforestation site of Beimen Lagoon is outside the Luzhugou embankment. Notably, it is dead now because of land subsidence.
Table 3.
Association between the Avicennia marina mangrove forest and land subsidence along the west coast of Taiwan.
Table 3.
Association between the Avicennia marina mangrove forest and land subsidence along the west coast of Taiwan.
| Sites | AVG ± SD (mm) | Peak of sites (mm) | Similarity to annual rainfall (%) | Max. of trend line | Year of max. | Cumulative subsidence (cm) | Annual subsidence (cm) |
|---|---|---|---|---|---|---|---|
| JS | 2.27 ± 0.50 | 3.20 | 83.4 | 2.644 | 2005 | −153.3 | −4.34 |
| SC | 1.98 ± 0.34 | 2.50 | 81.0 | 2.151 | 2007 | −47.5 | −1.43 |
| TG | 1.38 ± 0.39 | 1.94 | 78.4 | 1.716 | 1998 | −153.3 | −5.21 |
Disclaimer/Publisher’s Note: The statements, opinions and data contained in all publications are solely those of the individual author(s) and contributor(s) and not of MDPI and/or the editor(s). MDPI and/or the editor(s) disclaim responsibility for any injury to people or property resulting from any ideas, methods, instructions or products referred to in the content. |
© 2026 by the authors. Licensee MDPI, Basel, Switzerland. This article is an open access article distributed under the terms and conditions of the Creative Commons Attribution (CC BY) license (http://creativecommons.org/licenses/by/4.0/).
Copyright: This open access article is published under a Creative Commons CC BY 4.0 license, which permit the free download, distribution, and reuse, provided that the author and preprint are cited in any reuse.


