
Submitted:
13 November 2023
Posted:
13 November 2023
You are already at the latest version
Abstract
Mangrove forests play a vital role in maintaining the ecological balance of coastal regions. Ac-curately assessing changes in their ecosystem service value (ESV) requires more than precise mangrove distribution data, an appropriate set of evaluation methods is also needed. In this study, we obtain the spatial distribution and structural changes of mangrove forests based on Sentinel-2 imagery and build a mangrove forest ESV evaluation system by combining spatial pattern and the millennium ecosystem services. The results showed that: (1) the area of mangroves in Guangxi increased from 6245.15 ha in 2016 to 6750.01 ha to 2020, with a net increase of 504.81 ha which mainly concentrated in Lianzhou Bay, Tieshan Harbour and Dandou Bay; (2) the ESV of mangrove forests was 379.85 million U.S. dollars (USD) in 2016 and 413.13 million USD in 2020; (3) the value of fishery, soil conservation, wave absorption, and pollution purification comprise the largest proportion of the ESV of mangrove forests. From 2016 to 2020, mangroves in Guangxi had demonstrated a positive development trend and was undergoing a process of recovery. Results and conclusions of this study provide valuable insights and information to facilitate a more profound comprehension of the relationship between the mangrove forest and its ecological significance.
Keywords:
mangrove
; spatial structure
; ecosystem service value
; remote sensing
; Guangxi
1. Introduction
Mangrove forests, which are found in intertidal zones of tropical and subtropical regions, are among the most valuable and productive ecosystems on the earth [1]. They provide unique ecosystem services such as wave energy reduction, coastal erosion prevention, water purification and biodiversity protection [2,3]. Mangrove forests also contribute to poverty alleviation and food security, including food and raw material provision, recreation and tourism opportunities, and extreme events moderation [4]. Thus, they are enormously relevant to sustainable living [5]. To better understand services and benefits that mangroves provide to people and how the services change under different scenarios, it is necessary to assess economic value of mangroves as natural capital [6]. The valuation of ecosystem services is also a quantitative tool for decision makers and conservation advocates in assessing the extents of recovery or degeneration of mangrove ecosystem [2].
Ecosystem valuation is an approach to assign monetary values to an ecosystem with its key ecosystem goods and services, generally referred to as Ecosystem Service Value (ESV) [7]. The aim of such an exercise is to inform policy or management decisions by providing a better understanding of what services and benefits an ecosystem provides to people and how the services might change under different management scenarios [6]. They highlight who benefits, how they benefit, and where they benefit. In addition, ESV assessment can improve ecosystem management through the enhanced recognition of these values in decision-making. It can also improve knowledge for informed decision-making, raise awareness on blue forest ecosystems, and to foster cooperation among blue forest stakeholders [8].
There are numerous studies on ESV of coastal ecosystems [9,10,11]. However, it is challenging to accurately measure mangrove forest ESV due to three reasons. Firstly, meta-analysis-based methodologies for large scales [12,13] could cause variability and inconsistency in local-scale assessments. When an ESV database containing hundreds of estimates was constructed in a large-scale study, yet there may not be enough quality data for local-scale assessment. Besides, applying large-scale ESV result to a small study area may cause inappropriate [14]. Secondly, previous studies on the change of ESV of mangrove forests were usually mixed with surrounding ecosystems [15], they tend to put emphasis on the linkages land use land cover and ESV change of a natural reserve [7], rather than focus on the mangrove forests. Thirdly, landscape patterns of mangrove forests were rarely considered, which is likely to result in significant differences in the economic value assigned. Luke M. Brander shows that when mangroves become more abundant within a given region, their productivity increases, but on the other hand most ecosystem services require minimum thresholds of area [13]. The functional value of a habitat is far from consistent and may depend on its patch size and spatial location [16].
Spatial distribution and landscape pattern are essential to accurately assess ESV of mangrove forests [17]. Remote sensing has been extensively applied to obtain spatial information of mangrove forests [18]. To date, Landsat series imagery is the most widely used data for mapping large-scale coastal land covers [19], since the image has a 30m/60m resolution and can be continuously available for more than 40 years [20]. However, there are several shortcomings on mangrove maps. First, it is difficult to obtain images during low tide period due to the coarse temporal resolution (over 16 days). Second, landscape patterns of smaller mangrove forest patches might not be accurately discriminated with a 30 m spatial resolution. Thus, Sentinel-2 images which can be free accessed with a 10 m resolution and dense temporal resolution (2-5 days) are suitable [21]. Especially when combined with the computing capability provided by Google Earth Engine, an accurate spatial distribution with more details can be obtained [22]. However, there is no mangrove ESV assessment based on Sentinel-2 derived spatial data.
To address the above-mentioned issues, this study assessed ESV of mangrove forests in Guangxi. The objectives of this study are (1) obtaining the spatial distribution and structure of mangrove forests from 2016 to 2020 based on Sentinel-2 imagery; (2) building a mangrove forest ESV evaluation system by combining spatial pattern and the Millennium Ecosystem Assessment (MA); (3) providing analyses of ESV changes from 2016 to 2020 along the coasts of Guangxi, China.
2. Materials and Methods
2.Study area
As illustrated in Figure 1, the study area is located in the southwest portion of mainland China and the northern region of Beibu Gulf (21°24'-22°01'N and 107°56'-109°47'E). The mean annual temperature and precipitation varying from 22 ℃ to 23 ℃ and 1500mm to 2000mm, respectively. It belongs to the tropical monsoon oceanic climate zone with high temperature and rainy conditions. Tides across the study area are diurnal, with an average tidal range of 2.24 m [23].
In the coasts of Guangxi, there are two national mangrove reserves (Shankou National Mangrove Nature Reserve and Beilun Estuary National Mangrove Nature Reserve) and one provincial mangrove reserve (Maowei Sea Mangrove Reserve). Seven species of mangrove forests are living alone the coasts, among which Aegiceras comiculatum, Avicennia marina, Kandelia candel, and Aegiceras comiculatum are occupying over 90% of the total [24]. Other species such as Rhizophora stylosa and Bruguiear gymnorrhza are rarely distributed [25]. Mangroves distributed in the Lianzhou Bay, Maowei Bay and Zhenzhu Bay are typical estuary mangroves. Qinzhou Bay has a unique island group of mangroves. The largest urban mangroves and sandy mangroves of China are distributing along the coasts of Beihai.
2.Sentinel-2 data acquisition and pre-processing
In this study, Sentinel-2 images were chosen to monitor the change in Guangxi mangrove forests from 2016 to 2020. The Sentinel-2 mission has two polar-orbiting satellites (Sentinel-2A and Sentinel-2B) that provide high resolution optical imagery. These satellites revisit the same place every 2-5 days. They both carry MultiSpectral Instrument (MSI) sensor that offers 13 spectral bands. Only four bands (Bands 2, 3, 4, and 8) with 10 m spatial resolution were employed, it can effectively improve the delineation of mangrove ecosystem classes, especially identifying mangrove patches with a small area or narrow shapes [23].
In order to select the low tide period images, by comparing with the tide table provided by the China Maritime Service Network (https://www.cnss.com.cn/), we analyze the tidal state of the study area when the satellite transit. And the Level-2A product of Sentine-2 Multispectral Instrument (MSI) images were downloaded from the Copernicus Open Access Hub (https://scihub.copernicus.eu/dhus), which means per-pixel radiometric measurements are provided in surface reflectance with all parameters to transform them into radiances [26]. Lastly, each image was clipped using a 5-km buffer zone along the coastline.
2.Field Investigation and other data
From 2016 to 2020, we conducted three times of field investigations in the coast zones of Guangxi, the field work included using Real Time Kinematic to lay out 10m×10m quadrats, recording mangrove species and land covers, recording GPS coordinates and taking aerial photography with a drone at low tide. Besides, most of the mudflat areas of mangrove forests were inaccessible to reach, we also select some sample points from high-resolution Google Earth images.
These sample collections contain 424 and 537 mangrove and non-mangrove points respectively, 400 of which are selected as training samples during the classification process, and the remaining sample points are used for the image validation in 2016 and 2020. In addition, the coastline data from 2016 to 2020 were manually drawn on Google Earth Pro software.
2.Object-based image analysis and Random Forest classification
Object-based image analysis refers to setting certain homogeneous standard parameters according to the spectral information and shape information of the image [27]. It also segments the remote sensing image to form an image object. Image segmentation can directly influence the efficiency and accuracy of classification results [28]. The classification results avoid the "salt and pepper" phenomenon, and have good integrity and high classification accuracy [29].
In this study, multi-scale segmentation was selected, which is one of the most useful segmentation algorithms. And the eCognition software (version 9.0) was used as the operating platform. By systematically adjusting different segmentation scales and segmentation parameters until mangrove regions were separated from water, combined with visual interpretation, the segmentation scale, segmentation shape, tightness parameters are 20, 0.2, 0.8, respectively.
Random Forest is an ensemble learning algorithm based on decision trees, it has been demonstrated its usefulness and robust in image classification [30]. It includes the following steps:(1) by randomly selecting samples from the training samples, the number of decision trees (ntree) is generated. (2) by object-based image analysis, a number of spatial features is provided, and the number of predictive variables (mrty) which defines the best partition in each node of decision trees is determined as the square root of the number of the input features [31]. (3) the final classification result is derived from majority votes based on ntree.
In this study, Random Forest was also run in eCognition (version 9.0). We set the ntree to 150, and the parameter mrty is 4. After obtaining initial interpretation results, we inspected the results and adjusted the omitted or incorrect mangrove objects by visual interpretation. Lastly, the isolated small patches which smaller than 500 m2 were merged with the largest adjacent patch.
2.Spatial structure of mangroves
On a landscape scale, the spatial structure of mangroves refers to the spatial distribution pattern of mangroves in regions (such as bays, etc.). It is the spatial distribution and combination of mangrove patches with different sizes, shapes and attributes. Cultivating a good spatial structure and realizing its maximum comprehensive value is the goal of mangrove protection, management and development. In this study, combined with the spatial structure of mangrove distribution in Guangxi [32](LI Chungan.2015), the indices shown in Table 1 are used to describe the spatial structure of mangroves.
2.Assessment of ESV
In this study, the ecosystem services of Guangxi’s mangroves were concluded into 4 categories and 10 types based on the criterion of the MA, as shown in Table 2. To directly compare ESV of 2016 and 2020, the values were standardized into the common metric of 2016 U.S. dollars (USD) per ha per year. The value in year of 2020 was firstly adjusted to 2016 values by the GDP deflators [33], and then converted to 2016 USD.
- (1)
- Material production value
The material production function refers to the various products that people can obtain from the ecosystem, including fresh water, food fuel, medical supplies and so on. The material production function is closely related to human beings, and the shortage of these products can have direct or indirect adverse effects on human well-being. This study mainly considers the wood production value and natural aquatic product output value of mangroves.
① Wood production
According to the Guangxi Autonomous Region Mangrove Resource Protection Regulation, logging mangroves is not allowed in mangrove reserves, and in other areas it is subject to strict supervision and restrictions. Therefore, the value of wood production is calculated based on the growth of living standing trees, and the market value method is used to calculate the value of wood production. The value of the growth of mangrove living trees can be expressed as:
where Vwood is the value of the wood production service, G is the annual volume growth of standing tree, A is the total area of mangrove; P is the market price.
② Fishery
Mangrove forests provide a wealth of aquatic products for mankind, mainly including Sipunculus, Phascolosma esculenta, Ostrea rivularis, Meretrix meretrix and other fishes. Aquaculture is generally widely distributed on tidal flats. Considering the availability of data, we use the fishery output value per unit area to calculate the value fishery provided by mangrove forests [36]. The equation for calculating the value of fishery is as follows:
Where VFishery is the value of the fishery, A is the total area of mangrove, Pf is the value of mangrove fishery per unit area.
- (2)
- Soil conservation value
Soil conservation has the most directly positive effect on the growth and development of trees and the control of soil erosion, which mainly refers to the soil consolidation and the fertilizer conservation. The soil consolidation mainly refers to reducing soil erosion and maintaining soil. It can be measured by the cost of excavating earthwork. And the value of the soil consolidation can be calculated based on the alternative engineering method. The fertilizer conservation mainly refers to protecting the soil from the loss of soil fertility which caused by soil erosion. It can be measured by multiplying the sum of the total amount of N, P, and K of the soil topsoil (0-31cm). The value of the conserve the soil can be expressed as:
Where VSoil and VFertilization are the value of the soil consolidation and fertilizer conservation, X1 is the erosion index of bare soil, X2 is the erosion index of woodland, P1 is the cost of excavating earthwork, Pb is the density of topsoil, SNPK is the content of N, P and K, d is the topsoil of thickness (0.31m), P is the price of the fertilizer.
- (3)
- Wave absorbing revetment
The long-term impact of tides and floods make mangrove have unique morphological characteristics. Their intertwined developed root systems form a stable network system, which enable mangrove to grow more firmly on the tidal flat and form tight fence on the beach. The value of Guangxi mangroves for local disaster mitigation and seawall protection can be estimated by applying the shadow engineering method. The equation for calculating the value of wave absorbing revetment is as follows:
Where Vwave is the total value of the wave absorbing revetment, Li is the length of the two kinds of mangrove shoreline, the di is the weighting factor (0.7-1.0), C1 is the ecological benefits provided by mangroves per unit distance per year, C2 is the cost of repairing the dam.
- (4)
- Climate regulation
The climate regulation of the mangrove ecosystem has both positive effects and negative effects. The positive effect mainly refer to its carbon fixation and oxygen release function, that is, the function of absorbing CO2 in the atmosphere through photosynthesis and releasing O2. And the negative effects mainly refer to the emission of greenhouse gas CH4. In this study, the afforestation cost and carbon tax method were used to evaluate the value of climate regulation. The equation is as follows:
Where A is the area of the mangrove, T is the carbon tax, C is the average annual carbon sequestration in mangrove, M is the average annual oxygen release from mangroves, Po is the industrial oxygen price, Q is Annual emission flux of mangrove methane per unit area and 21 is the warming potential value of methane [45].
- (5)
- Pollution purification
The pollution purification value service refers to the value generated by the decomposition and reduction of various invasive harmful substances in wetlands. Mangrove wetland plants and understory soil have the ability to absorb various pollutants and a strong purification effect on pollutants, purify water quality, reduce red tides [30]. The method of pollution prevention cost was used to evaluate the value of pollution purification. The equation is as follows:
Where V is the value of the pollution purification, A is the area of the mangrove and S is the purification value of mangrove pollution per unit area [36].
- (6)
- Water conservation
Wetlands can accumulate excess precipitation and release it slowly, so that precipitation can be redistributed in time and space. The mangrove wetland’s water conservation is to provide water for local residents in the form of shallow groundwater, so its value can be calculated by storing the same amount of water in the reservoir. The shadow price method was chosen to calculate the value of surface water resources. The equation is as follows:
Where VWater is the value of water conservation, R is the water storage capacity of mangrove wetland per unit area and Pw is the cost of unit water storage capacity [40].
- (7)
- Habitat
Mangrove wetland ecosystem is an ideal living environment for various marine organisms, benthos and seabirds. The wetland is rich in biological species, which plays an important role in ecosystem succession and biological evolution. Therefore, the protection value of biodiversity is the most important part which can’t ignore. The outcome reference method was used in this paper to calculate the value of the habitat. The equation is as follows:
Where VHabitat is the value of the habitat, A is the area of the mangrove and Ph is the value of biodiversity per unit area [41].
- (8)
- Nutrient accumulation
Mangrove distributed in coastal areas has high productivity. It is important for the production of mangrove wetland ecosystems. The accumulation of nutrients is mainly the accumulation of N, P and K, so its value can be calculated with the same amount of fertilizer. The value of the nutrient accumulation can be expressed as:
Where VNutrient is the value of the nutrient accumulation, St is the total nutrient retention in the mangrove ecosystem and P is the price of the fertilizer [35].
- (9)
- Scientific research and education
The mangrove flora with viviparous phenomenon, the rich species diversity, high biomass and high productivity of the mangrove wetland system have attracted experts and scholars from different fields to conduct research on mangroves, which have extremely high scientific research, cultural and educational value. However, the research funds invested by researchers and the time to conduct research are difficult to obtain, and their value are difficult to quantify. Therefore, the outcome reference method was used in this paper to calculate the value of the scientific research and education. The equation is as follows:
Where VScience is the value of the scientific research and education, A is the area of the mangrove and Ps is the scientific and educational value of wetland per unit area [42].
- (10)
- Recreation
The tourism function means that the ecosystem or landscape provides a place for human viewing and recreation, which to satisfy the psychological and spiritual pursuit of tourists. The rich animal and plant resources of the mangrove ecosystem provide good conditions for the development of tourism activities. However, at present, most of the mangrove scenic spots in Guangxi are distributed in nature reserves, and most of them are open to the public for free, and the tourism value of mangroves in other areas is difficult to directly count. Therefore, it is difficult to directly calculate its tourism value. So we took the research results of others as a reference to calculate the value generated by recreation. The calculation equation is as follows:
Where VRecreation is the value of the recreation, A is the area of the mangrove and Pr is the recreation value per unit of wetland area in Guangxi [41].
3. Results
3.1. Accuracy assessment
Based on the verification samples, two confusion matrices were generated to assess the accuracy of the 2016 and 2020 mangrove classification results (Table 3). The overall accuracies were all exceeded 90% and the Kappa coefficients were all exceeded 0.8, which indicated that the classification results and the verification data have good consistency.
3.Spatial distribution and structure of Guangxi’s mangroves
The spatial distribution of mangrove forests in Guangxi are shown in Figure 2. The mangrove forests mainly concentrated in Zhenzhu Harbour, Fangcheng Bay, Maowei Sea, Dafeng River, Lianzhou Bay, Tieshan Harbour and Dandou Bay. The coastline of Guangxi has increased slightly from 1686.66 km to 1724.48 km during 2016-2020. And the area of mangrove has increased by 8% from 6245.15 ha to 6750.01 ha.
Quantitatively analyze the spatial distribution and evolution of mangroves in Guangxi through the spatial structure characteristics of mangrove forests. As shown in Table 4, from 2016 to 2020, based on the changes of coastlines and mangroves, the corresponding mangrove shorelines and shoreline mangroves have increased by 3.19% and 4.69%, respectively. The abundance of mangrove has increased by 5.71% and the number of patches has increased by 4.13%. The average area of mangrove patches increased by 3.8%, and the ideally distributed mangrove increased by 4.20%.
3.Variations of ESV
Table 5 shows changes of values of different ecosystem services, the total service value of mangroves changed from 379.85 million USD in 2016 to 413.13 million USD in 2020. The proportion of each service is obtained by dividing its own value by the total service value. As illustrated in Figure 3, the value of provisioning service accounted for more than 33% of the total value. The proportion of the value of provisioning service decreased. The value of fishery keeping at about 32.6%, but the value of the wood decreased. The main reason is that the decline in the market price of logs in Guangxi has exceeded the increase brought about by the increase in the area of mangroves. Provisioning services accounted for 33.72% of the total value in 2016, and the proportion of provisioning service in the total value in 2020 decreased by 0.36% compared to 2016.
The proportion of regulating service remained 60% and slightly increased from 2016 to 2020. Among the regulating service, fertilizer conservation and wave absorbing revetment are always the main service function, which indicating mangrove forests have unique ecosystem services. The reason for the increase oxygen release is that the average price of Chinese oxygen market in 2020 (91.23 USD) will increase significantly compared with 2016 (63.27 USD), reaching 44.2%. In 2016, the value of regulating services accounted for 60.59% of the total services value. And in 2020, it increased to 60.80%.
The value of cultural service accounted and supporting service for only 2.55% and 3.1% of the total value, respectively. The reason for the increase in habitat and recreation is that the value of ecosystem services per unit area in China in 2020 (236.38 USD) has increased compared with 2016 (227.63 USD), up to 3.9%. Due to the significant increase in the area of mangrove forests, the net change of ESV were found positive. However, the annual ESV changed slightly, only increased from 60823 to 61204 USD.
4. Discussion
4.Factors driving changes in spatial characteristics
To improve the protection and management of mangroves, optimize their spatial layout, and realize their ecological and environmental value, in-depth research on their spatial structure at the landscape scale is essential [46]. In addition to the three basic landscape pattern indices - mangrove area, patch number, and patch area, this study also analyses the shoreline of mangroves, shoreline mangrove, ideally distributed mangrove, and mangrove abundance.
Table 4 illustrated that, over the five-year period from 2016 to 2020, the increase in abundance provides a more intuitive indicator of the mangrove growth, as compared to measuring their number by area which can lead to vague and incomparable results at the scale of bays or protected areas. Since mangroves are often distributed along the coastline, the length of the coastline can serve as an indicator of mangrove distribution. The relative abundance not only facilitates the comparison of mangroves in different regions during the same period, but also of mangroves in the same region with significant differences in different periods.
The measurement of mangrove shoreline, shoreline mangrove, and ideal mangrove distribution provides a more intuitive depiction of the spatial scale and ecological value of mangroves. For instance, the efficacy of mangroves in wave absorbing revetments is related to characteristics such as the stand structure, distance from the embankment and patch width [32]. From this perspective, it is easy to understand why certain indicators were selected to indicate a more ideal spatial distribution of mangroves and how the spatial structure impacts the ecological value of mangroves.
4.The rationality and existing problems of selecting evaluation index
This study provides a comprehensive and quantitative estimation of the ecological service value of mangrove forests in Guangxi. This estimation will enhance the understanding of the ecological service function of mangroves and the correlation between mangroves and sustainable living. We divided the ecosystem service functions into provisioning service, regulating service, supporting service, and cultural service. After considering the principles of scientific, representative, comprehensiveness, conciseness, and operability, we selected 10 indicators for a quantitative evaluation of the ecosystem services. The selected indicators not only fulfill the evaluation objectives, but also meet the objectives and requirements of mangrove ecosystem evaluation. Each indicator is independent of the others, avoiding data double counting caused by information overlap.
To account for the challenges related to data collection and time constraints in the evaluation process, result-reference methods have been used for some parameters in this study. This method considers the similarity between the evaluated object and the reference object. The higher the similarity, the better the result. However, according to Lautenbach [47], errors in ecosystem valuation can arise due to the diversity and spatial heterogeneity of ecosystems. For instance, the coastal area of Guangxi has a significant number of aquaculture ponds, making it challenging to assess the value of mangroves in contribution to fisheries in the corresponding area. Despite the inclusion of fishery as an indicator of mangrove ecosystem service value, the direct impact of mangroves on aquaculture cannot be fully measured. Research has shown that the presence of mangroves in coastal areas may increase the survival rate of coastal shrimp farming by 15-35% compared to areas without mangroves [48]. Thus, the calculated results in this aspect are most likely lower than the actual value.
The relationship between the size of mangroves and their value per unit area is complex. On the one hand, increasing the area of mangroves may lead to reduced marginal returns, while on the other hand, most ecosystem services require a threshold area for good functioning, implying that value increases with size [13]. These factors must be considered in more detailed research. Furthermore, there is a general trend that larger mangrove patches can provide greater ecosystem service supply compared to smaller fragmented patches. Future research using appropriate methods and parameters will be necessary to further assess the practical value of mangrove ecosystem.
4.Threatened situations
The protection, management, and restoration of wetlands have become important global issues to be addressed. Over the time scale of this study, the impact of human socioeconomic activities on the land use types and landscape structure of mangrove wetland ecosystems in Guangxi is evident. In China, during the early 1990s, the ecological and economic values of mangrove ecosystems began to gain widespread recognition and public acknowledgement. As a result, a series of relevant laws and regulations were formulated during this period to protect mangrove resources [49].
Despite these efforts, the issues surrounding wetlands protection, management, and restoration are still evident [50], including the hazards of diseases and insect pests due to a single community structure, fouling biological hazards such as barnacles, the invasion of alien species like plants, and interference from human factors such as coastal development and construction, sea reclamation, excessive human pollution, overuse, and seawall construction.
5. Conclusions
During 2016-2020, the area of mangrove in Guangxi increased from 6245.15 ha to 6750.01 ha, with a net increase of 504.81 ha which mainly concentrated in Lianzhou Bay, Tieshan Harbour and Dandou Bay. This study aims to explore the spatial distribution and structural changes of mangroves in Guangxi from the perspectives of mangrove abundance, mangrove coastline, ideally distributed mangroves, and other related factors. The results indicate that the average area of mangroves, ideally distributed mangroves, mangrove coastline, and mangrove abundance in Guangxi all increased, suggesting that the mangrove ecosystem in Guangxi is developing well and undergoing a process of recovery. Moreover, the fragmentation degree of the mangrove ecosystem has been reduced.
In this study, the ESV of Guangxi mangrove forests have been evaluated in 2016 and 2020, the total ESV of mangrove increased from 379.85 million USD to 413.13 million USD. The value of fishery, soil conservation value, wave absorbing revetment and pollution purification occupy the largest proportion, in addition to the increase in the area of mangroves, people's awareness of its ecological value is also an important reason. The proposed approach and present results of this study could significantly contribute towards a better understanding of the relationship between the spatial structure and distribution of mangroves in Guangxi and their ecological value.
Author Contributions
Conceptualization, Xiaohai Zhang; Data curation, Rong Zhang; Formal analysis, Rong Zhang; Investigation, Kedong Wang, Chuanpeng Zhao and Rong Zhang; Methodology, Kedong Wang; Project administration, Xiaohai Zhang and Chuanpeng Zhao; Resources, Xiaohai Zhang, Zongming Wang and Mingming Jia; Software, Mingming Jia; Supervision, Xiaohai Zhang, Zongming Wang and Mingming Jia; Validation, Chuanpeng Zhao and Zongming Wang; Visualization, Chuanpeng Zhao and Mingming Jia; Writing – original draft, Kedong Wang; Writing – review & editing, Kedong Wang and Xiaohai Zhang.
Funding
This research was funded by by the National Natural Science Foundation of China (42171379, 42201422), China Postdoctoral Science Foundation (No. 2022M713132), and the National Earth System Science Data Center (www.geodata.cn).
Data Availability Statement
Sentinel-2 satellite data comes from European Space Agency (https://scihub.copernicus.eu/dhus). The data presented in this study are available on request from the corresponding author.
Acknowledgments
The authors would like to acknowledge the comments of reviewers and the Editorial Board. They also would like to thank Prof. Mingming Jia from the Northeast Institute of Geography and Agroecology for generously providing the field data used in this study.
Conflicts of Interest
The authors declare no conflict of interest.
References
- Myint, S.W.; Giri, C.P.; Wang, L.; Zhu, Z.; Gillette, S.C. Identifying Mangrove Species and Their Surrounding Land Use and Land Cover Classes Using an Object-Oriented Approach with a Lacunarity Spatial Measure. GIScience & Remote Sensing 2008, 45, 188–208. [Google Scholar] [CrossRef]
- Mukherjee, N.; Sutherland, W.J.; Dicks, L.; Hugé, J.; Koedam, N.; Dahdouh-Guebas, F. Ecosystem Service Valuations of Mangrove Ecosystems to Inform Decision Making and Future Valuation Exercises. PLoS ONE 2014, 9, e107706. [Google Scholar] [CrossRef] [PubMed]
- Zeng, H.; Jia, M.; Zhang, R.; Wang, Z.; Mao, D.; Ren, C.; Zhao, C. Monitoring the Light Pollution Changes of China’s Mangrove Forests from 1992-2020 Using Nighttime Light Data. Frontiers in Marine Science 2023. [CrossRef]
- Cherrington, E.A.; Griffin, R.E.; Anderson, E.R.; Hernandez Sandoval, B.E.; Flores-Anderson, A.I.; Muench, R.E.; Markert, K.N.; Adams, E.C.; Limaye, A.S.; Irwin, D.E. Use of Public Earth Observation Data for Tracking Progress in Sustainable Management of Coastal Forest Ecosystems in Belize, Central America. Remote Sensing of Environment 2020, 245, 111798. [Google Scholar] [CrossRef]
- Lovelock, C.E.; Barbier, E.; Duarte, C.M. Tackling the Mangrove Restoration Challenge. PLoS Biol 2022, 20, e3001836. [Google Scholar] [CrossRef] [PubMed]
- Pendleton, L.; Mongruel, R.; Beaumont, N.; Hooper, T.; Charles, M. A Triage Approach to Improve the Relevance of Marine Ecosystem Services Assessments. Mar. Ecol. Prog. Ser. 2015, 530, 183–193. [Google Scholar] [CrossRef]
- Sannigrahi, S.; Chakraborti, S.; Joshi, P.K.; Keesstra, S.; Sen, S.; Paul, S.K.; Kreuter, U.; Sutton, P.C.; Jha, S.; Dang, K.B. Ecosystem Service Value Assessment of a Natural Reserve Region for Strengthening Protection and Conservation. Journal of Environmental Management 2019, 244, 208–227. [Google Scholar] [CrossRef]
- Himes-Cornell, A.; Grose, S.O.; Pendleton, L. Mangrove Ecosystem Service Values and Methodological Approaches to Valuation: Where Do We Stand? Front. Mar. Sci. 2018, 5, 376. [Google Scholar] [CrossRef]
- Cao, L.; Li, J.; Ye, M.; Pu, R.; Liu, Y.; Guo, Q.; Feng, B.; Song, X. Changes of Ecosystem Service Value in a Coastal Zone of Zhejiang Province, China, during Rapid Urbanization. IJERPH 2018, 15, 1301. [Google Scholar] [CrossRef] [PubMed]
- Ligate, E.J.; Chen, C.; Wu, C. Evaluation of Tropical Coastal Land Cover and Land Use Changes and Their Impacts on Ecosystem Service Values. Ecosyst Health Sustain 2018, 4, 188–204. [Google Scholar] [CrossRef]
- Yang, Q.; Liu, G.; Hao, Y.; Zhang, L.; Giannetti, B.F.; Wang, J.; Casazza, M. Donor-Side Evaluation of Coastal and Marine Ecosystem Services. Water Research 2019, 166, 115028. [Google Scholar] [CrossRef] [PubMed]
- De Groot, R.; Brander, L.; Van Der Ploeg, S.; Costanza, R.; Bernard, F.; Braat, L.; Christie, M.; Crossman, N.; Ghermandi, A.; Hein, L.; et al. Global Estimates of the Value of Ecosystems and Their Services in Monetary Units. Ecosystem Services 2012, 1, 50–61. [Google Scholar] [CrossRef]
- M. Brander, L.; J. Wagtendonk, A.; S. Hussain, S.; McVittie, A.; Verburg, P.H.; De Groot, R.S.; Van Der Ploeg, S. Ecosystem Service Values for Mangroves in Southeast Asia: A Meta-Analysis and Value Transfer Application. Ecosystem Services 2012, 1, 62–69. [CrossRef]
- Gaodi, X.; Lin, Z.; Chunxia, L.; Yu, X.; Wenhua, L. Applying Value Transfer Method for Eco-Service Valuation in China. Journal of Resources and Ecology 2010, 1, 51–59. [Google Scholar] [CrossRef]
- Camacho-Valdez, V.; Ruiz-Luna, A.; Ghermandi, A.; Berlanga-Robles, C.A.; Nunes, P.A.L.D. Effects of Land Use Changes on the Ecosystem Service Values of Coastal Wetlands. Environmental Management 2014, 54, 852–864. [Google Scholar] [CrossRef] [PubMed]
- Harborne, A.R.; Mumby, P.J.; Micheli, F.; Perry, C.T.; Dahlgren, C.P.; Holmes, K.E.; Brumbaugh, D.R. The Functional Value of Caribbean Coral Reef, Seagrass and Mangrove Habitats to Ecosystem Processes. In Advances in Marine Biology; Elsevier, 2006; Vol. 50, pp. 57–189 ISBN 978-0-12-026151-2.
- Li, Y.; Wen, H.; Wang, F. Analysis of the Evolution of Mangrove Landscape Patterns and Their Drivers in Hainan Island from 2000 to 2020. Sustainability 2022, 15, 759. [Google Scholar] [CrossRef]
- Tian, J.; Wang, L.; Li, X.; Gong, H.; Shi, C.; Zhong, R.; Liu, X. Comparison of UAV and WorldView-2 Imagery for Mapping Leaf Area Index of Mangrove Forest. International Journal of Applied Earth Observation and Geoinformation 2017, 61, 22–31. [Google Scholar] [CrossRef]
- Luo, J.; Ni, G.; Zhang, Y.; Wang, K.; Shen, M.; Cao, Z.; Qi, T.; Xiao, Q.; Qiu, Y.; Cai, Y.; et al. A New Technique for Quantifying Algal Bloom, Floating/Emergent and Submerged Vegetation in Eutrophic Shallow Lakes Using Landsat Imagery. Remote Sensing of Environment 2023, 287, 113480. [Google Scholar] [CrossRef]
- Matejicek, L.; Kopackova, V. Changes in Croplands as a Result of Large Scale Mining and the Associated Impact on Food Security Studied Using Time-Series Landsat Images. Remote Sensing 2010, 2, 1463–1480. [Google Scholar] [CrossRef]
- Zhang, R.; Jia, M.; Wang, Z.; Zhou, Y.; Wen, X.; Tan, Y.; Cheng, L. A Comparison of Gaofen-2 and Sentinel-2 Imagery for Mapping Mangrove Forests Using Object-Oriented Analysis and Random Forest. IEEE J. Sel. Top. Appl. Earth Observations Remote Sensing 2021, 14, 4185–4193. [Google Scholar] [CrossRef]
- Zhao, C.; Jia, M.; Wang, Z.; Mao, D.; Wang, Y. Toward a Better Understanding of Coastal Salt Marsh Mapping: A Case from China Using Dual-Temporal Images. Remote Sensing of Environment 2023, 295, 113664. [Google Scholar] [CrossRef]
- Ghorbanian, A.; Zaghian, S.; Asiyabi, R.M.; Amani, M.; Mohammadzadeh, A.; Jamali, S. Mangrove Ecosystem Mapping Using Sentinel-1 and Sentinel-2 Satellite Images and Random Forest Algorithm in Google Earth Engine. Remote Sensing 2021, 13, 2565. [Google Scholar] [CrossRef]
- Zhang, L.; Xu, S. Discussion about the Eco-function of Mangrove Wetlands of Beibu gulf of Guangxi Zhuang Nationality Autonomous Region. Anhui Agri. Sci. Bull. 2010, 16, 134–136. [Google Scholar] [CrossRef]
- Li, C. Quantitative distribution of mangroves in Guangxi Zhuang Autonmous Region. Journal of Beijing Forestry University 2004, 26, 47–52. [Google Scholar] [CrossRef]
- Jia, M.; Wang, Z.; Mao, D.; Ren, C.; Wang, C.; Wang, Y. Rapid, Robust, and Automated Mapping of Tidal Flats in China Using Time Series Sentinel-2 Images and Google Earth Engine. Remote Sensing of Environment 2021, 255, 112285. [Google Scholar] [CrossRef]
- Jia, M.; Wang, Z.; Mao, D.; Ren, C.; Song, K.; Zhao, C.; Wang, C.; Xiao, X.; Wang, Y. Mapping Global Distribution of Mangrove Forests at 10-m Resolution. Science Bulletin 2023, 68, 1306–1316. [Google Scholar] [CrossRef] [PubMed]
- Powers, R.P.; Hay, G.J.; Chen, G. How Wetland Type and Area Differ through Scale: A GEOBIA Case Study in Alberta’s Boreal Plains. Remote Sensing of Environment 2012, 117, 135–145. [Google Scholar] [CrossRef]
- Guo, X.; Zhang, C.; Luo, W.; Yang, J.; Yang, M. Urban Impervious Surface Extraction Based on Multi-Features and Random Forest. IEEE Access 2020, 8, 226609–226623. [Google Scholar] [CrossRef]
- Belgiu, M.; Drăguţ, L. Random Forest in Remote Sensing: A Review of Applications and Future Directions. ISPRS Journal of Photogrammetry and Remote Sensing 2016, 114, 24–31. [Google Scholar] [CrossRef]
- Vuolo, F.; Neuwirth, M.; Immitzer, M.; Atzberger, C.; Ng, W.-T. How Much Does Multi-Temporal Sentinel-2 Data Improve Crop Type Classification? International Journal of Applied Earth Observation and Geoinformation 2018, 72, 122–130. [Google Scholar] [CrossRef]
- Li, C.; Xia, Y. ; Dai, huabing Temporal Analysis on Spatial Structure of Mangrove Distribution in Guangxi, China from 1960 to 2010. Wetland Science 2015, 13, 265–275. [Google Scholar] [CrossRef]
- Kang, N.; Hou, L.; Huang, J.; Liu, H. Ecosystem Services Valuation in China: A Meta-Analysis. Science of The Total Environment 2022, 809, 151122. [Google Scholar] [CrossRef] [PubMed]
- China Forestry and Grassland Statistical Yearbook; China Forestry Publishing House: Beijing, 2020.
- Han, W.; Gao, X.; Lu, C.; Lin, P. The Ecological Values of Mangrove Ecosystems in China. Ecologic Science 2000, 19, 40–45. [Google Scholar]
- Fan, H.; Zhang, Y.; Zou, L.; Pan, L. A study on the baseline value of the Chinese mangrove services and allocation of the value to individual tree. Acta Ecologica Sinica 2022, 42. [Google Scholar] [CrossRef]
- Liu, J.; Lu, Y.; Liu, B.; Cui, H. Relationship Between Land Use and Soil Erosion in Guangxi Zhuang Autonomous Region. Bulletin of Soil and Water Conservation 2018, 38, 41–46. [Google Scholar]
- Guangxi Statistical Yearbook; China Statistics Press: Beijing, 2020.
- Zhang, H.; Chen, C.; Zhang, H.; Zhang, L.; Jia, G. Evaluation of Value of Wetland Ecosystem Services of Zhangjiang Estuary Mangrove National Nature Reserve. Wetland Science 2013, 11, 108–113. [Google Scholar] [CrossRef]
- Lu, X. Wetland protection and management; Chemical Industry Press: Beijing, 2004. [Google Scholar]
- Xie, G.; Zhang, C.; Lei, M. ; Chen, wenhui; Li, S. Improvement of the Evaluation Method for Ecosystem Service Value Based on Per Unit Area. Journal of Natural Resources 2015, 30, 1243–1252. [Google Scholar] [CrossRef]
- Chen, Z.; Zhang, X. Value of Ecosystem Services in China. Chin.Sci.Bull. 2000, 45, 870–876. [Google Scholar] [CrossRef]
- Costanza, R.; d’Arge, R.; Groot, R. de; Farber, S.; Grasso, M.; Hannon, B.; Limburg, K.; Naeem, S.; Robert, V. O’Neill; Jose Paruelo; et al. The Value of the World‘s Ecosystem Services and Natural Capital. Nature 1997, 387, 253–260. [Google Scholar] [CrossRef]
- National Agricultural Products Cost Return Assembly The Price Department of the State Development and Reform Commission of China; China Statistics Press: Beijing, 2020.
- Chen, S.; Wen, Z. Estimating Forest Ecosystem Service Function of Carbon Sequestration and Oxygen Release in Guangxi Province. Journal of Agro-Forestry Economics and Management 2016, 15, 557–563. [Google Scholar] [CrossRef]
- Ellison, A.M.; Felson, A.J.; Friess, D.A. Mangrove Rehabilitation and Restoration as Experimental Adaptive Management. Front. Mar. Sci. 2020, 7, 327. [Google Scholar] [CrossRef]
- Lautenbach, S.; Kugel, C.; Lausch, A.; Seppelt, R. Analysis of Historic Changes in Regional Ecosystem Service Provisioning Using Land Use Data. Ecological Indicators 2011, 11, 676–687. [Google Scholar] [CrossRef]
- Anneboina, L.R.; Kavi Kumar, K.S. Economic Analysis of Mangrove and Marine Fishery Linkages in India. Ecosystem Services 2017, 24, 114–123. [Google Scholar] [CrossRef]
- Jia, M.; Wang, Z.; Zhang, Y.; Ren, C.; Song, K. Landsat-Based Estimation of Mangrove Forest Loss and Restoration in Guangxi Province, China, Influenced by Human and Natural Factors. IEEE J. Sel. Top. Appl. Earth Observations Remote Sensing 2015, 8, 311–323. [Google Scholar] [CrossRef]
- Wang, X.; Xiao, X.; Xu, X.; Zou, Z.; Chen, B.; Qin, Y.; Zhang, X.; Dong, J.; Liu, D.; Pan, L.; et al. Rebound in China’s Coastal Wetlands Following Conservation and Restoration. Nat Sustain 2021, 4, 1076–1083. [Google Scholar] [CrossRef]
Figure 1.
Location of the study area. (a) Beilun Eastuary National Mangrove Nature Reserve; (b) Maowei Sea Mangrove Reserve; (c) Shankou National Mangrove Nature Reserve.
Figure 1.
Location of the study area. (a) Beilun Eastuary National Mangrove Nature Reserve; (b) Maowei Sea Mangrove Reserve; (c) Shankou National Mangrove Nature Reserve.
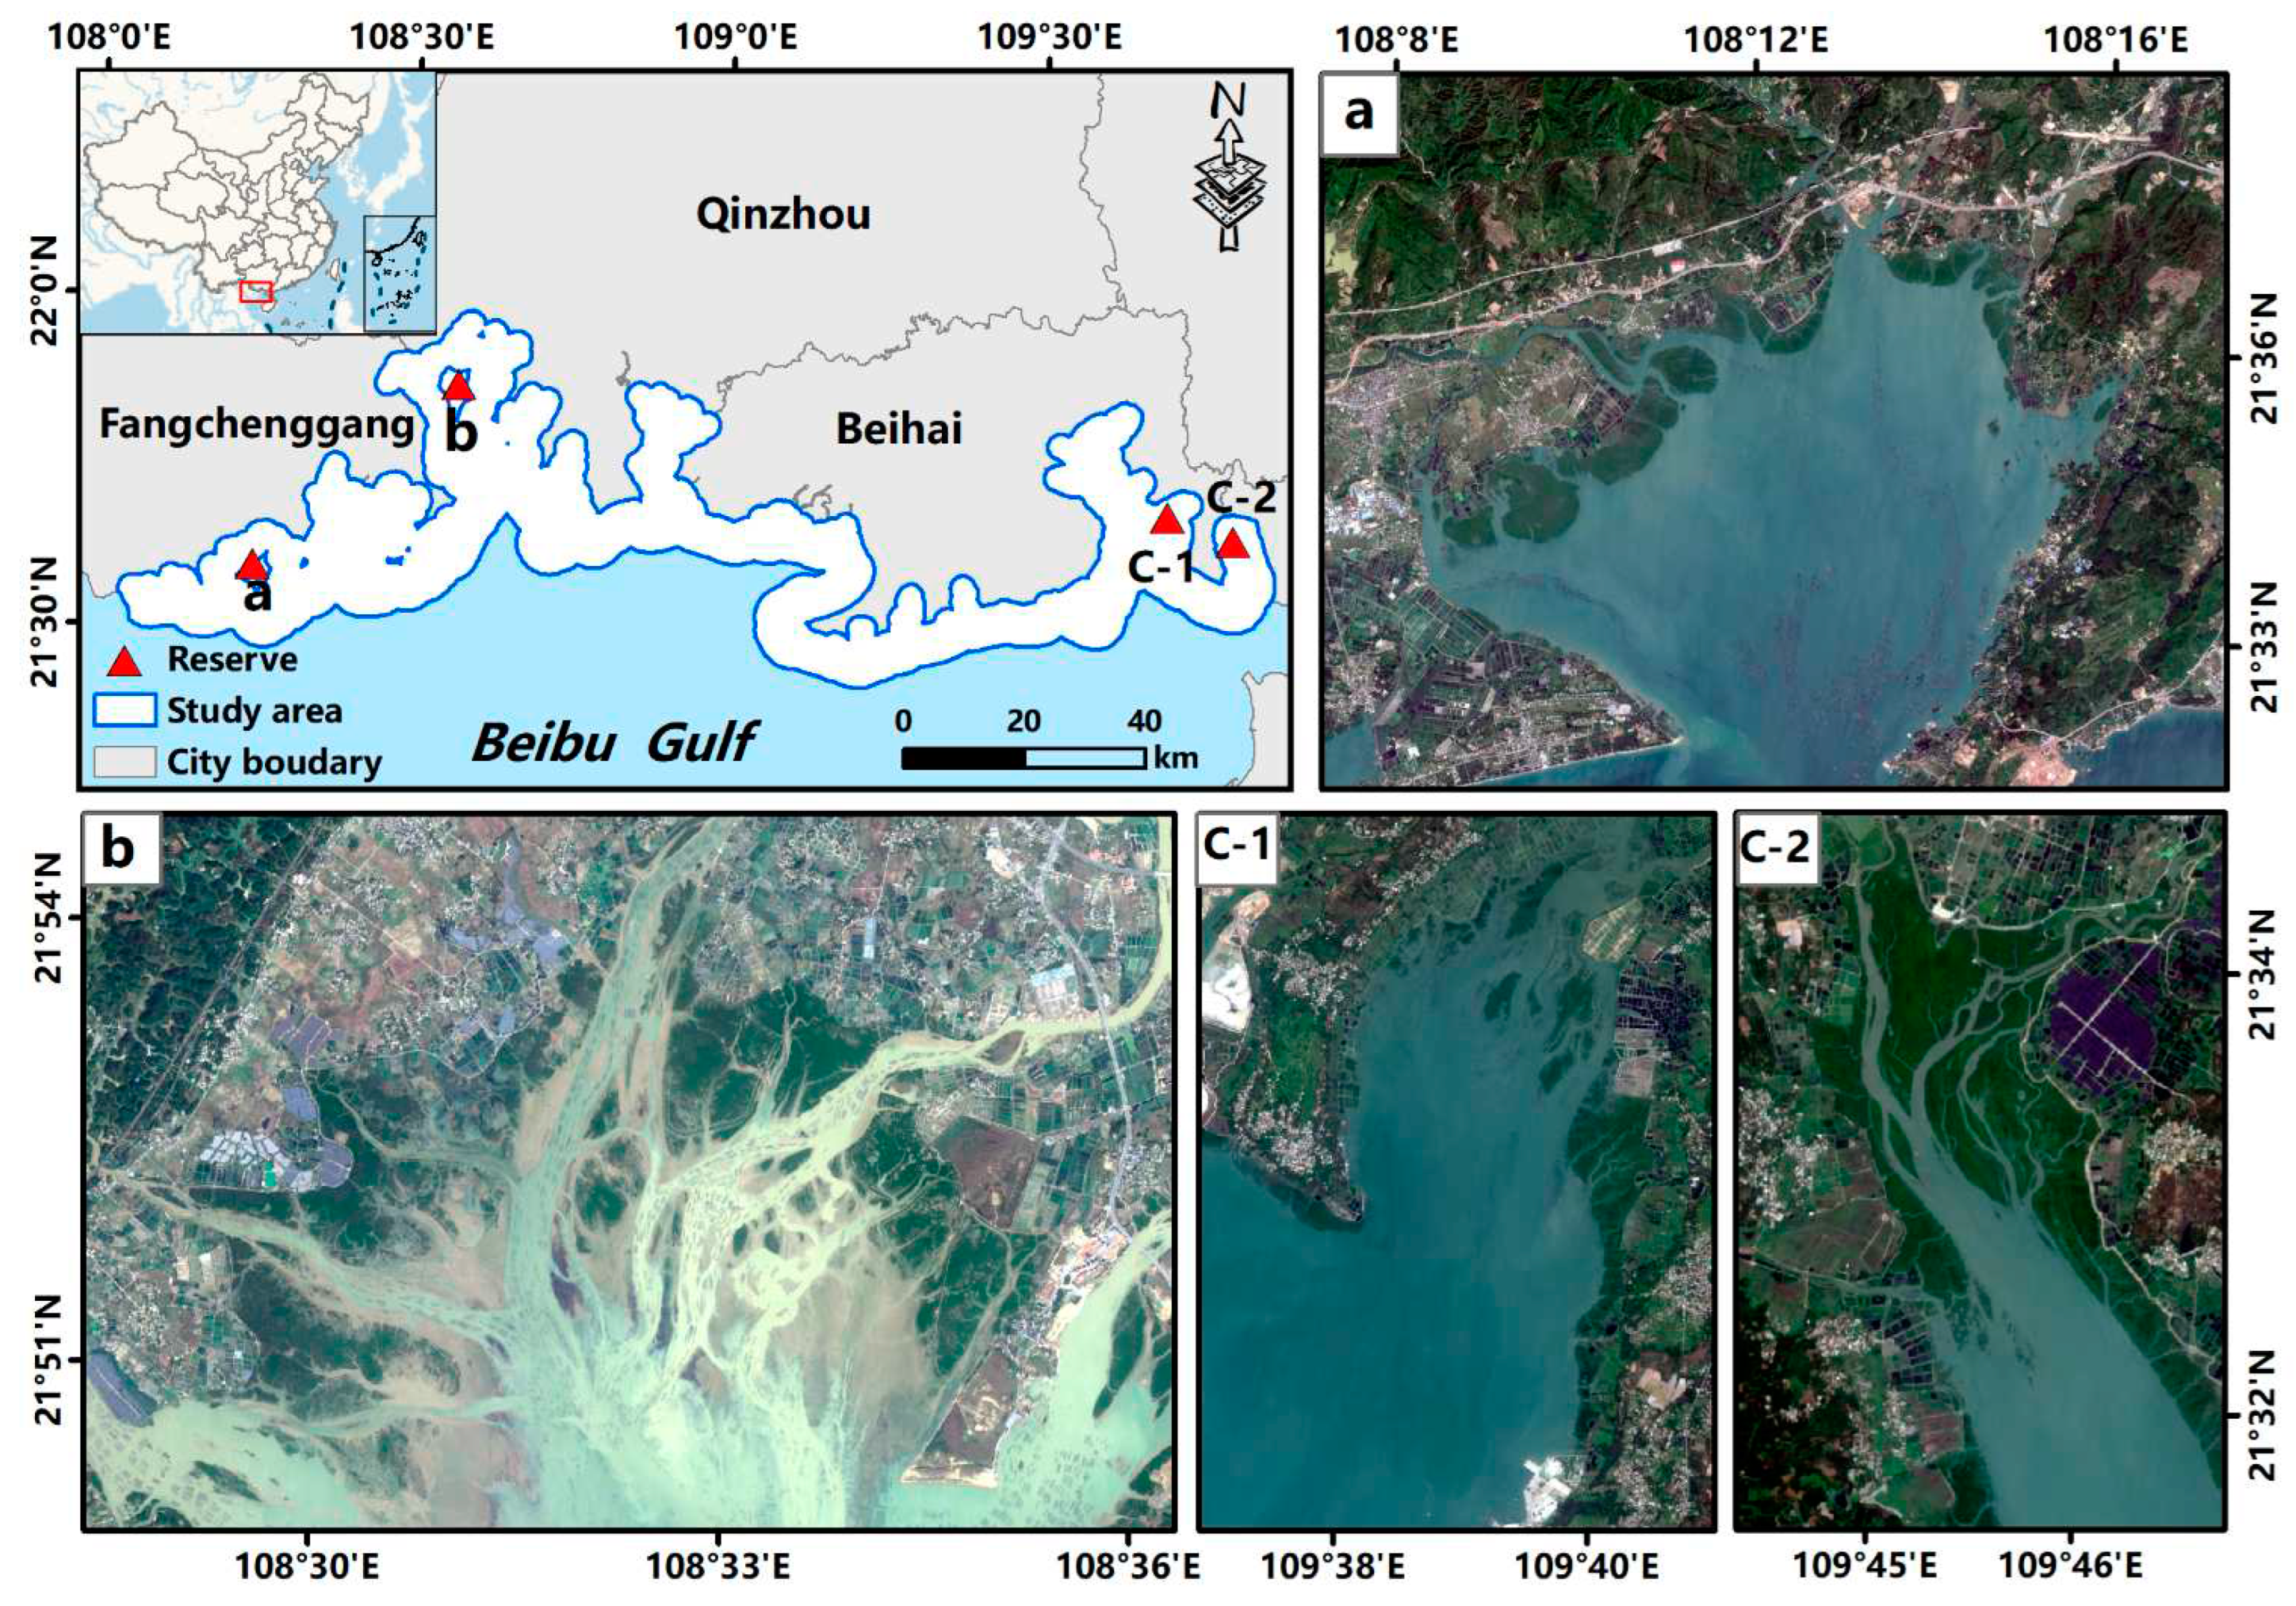
Figure 2.
Spatial dynamics of mangrove forests along the coasts of Guangxi in 2016 and 2020.
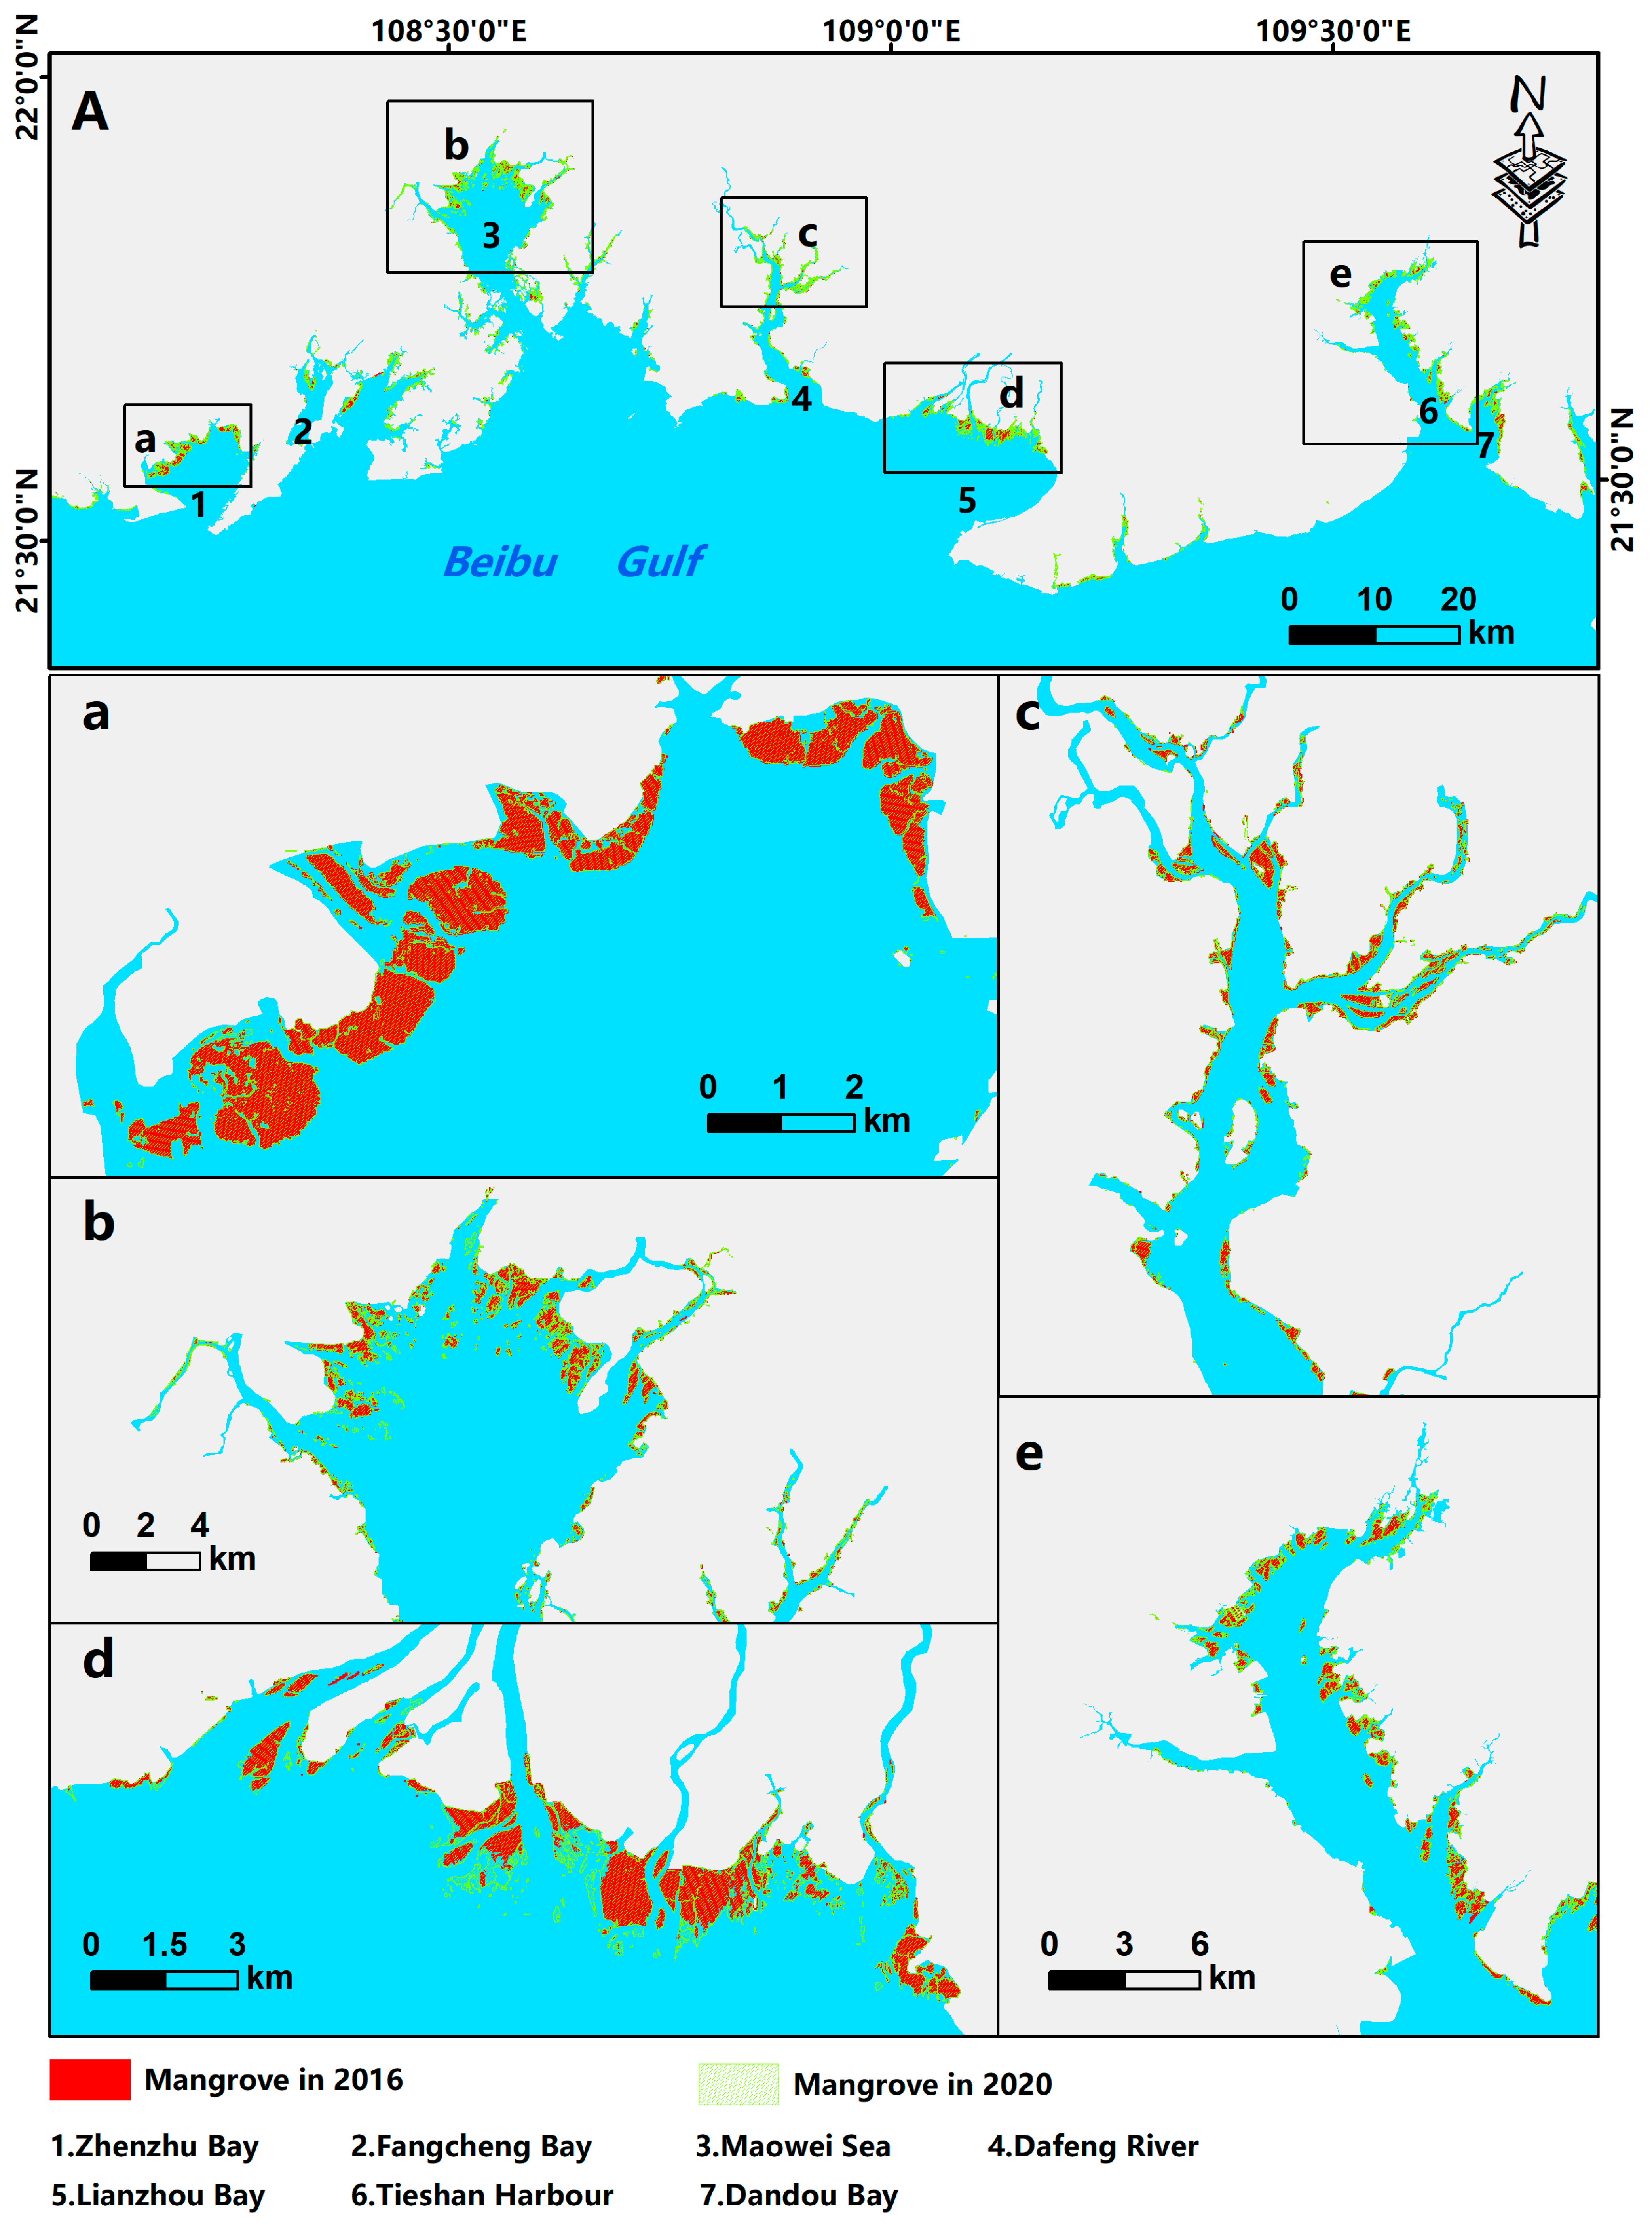
Figure 3.
Structure of ecosystem of ESV in Guangxi, 2016-2020 (in red color, million USD).
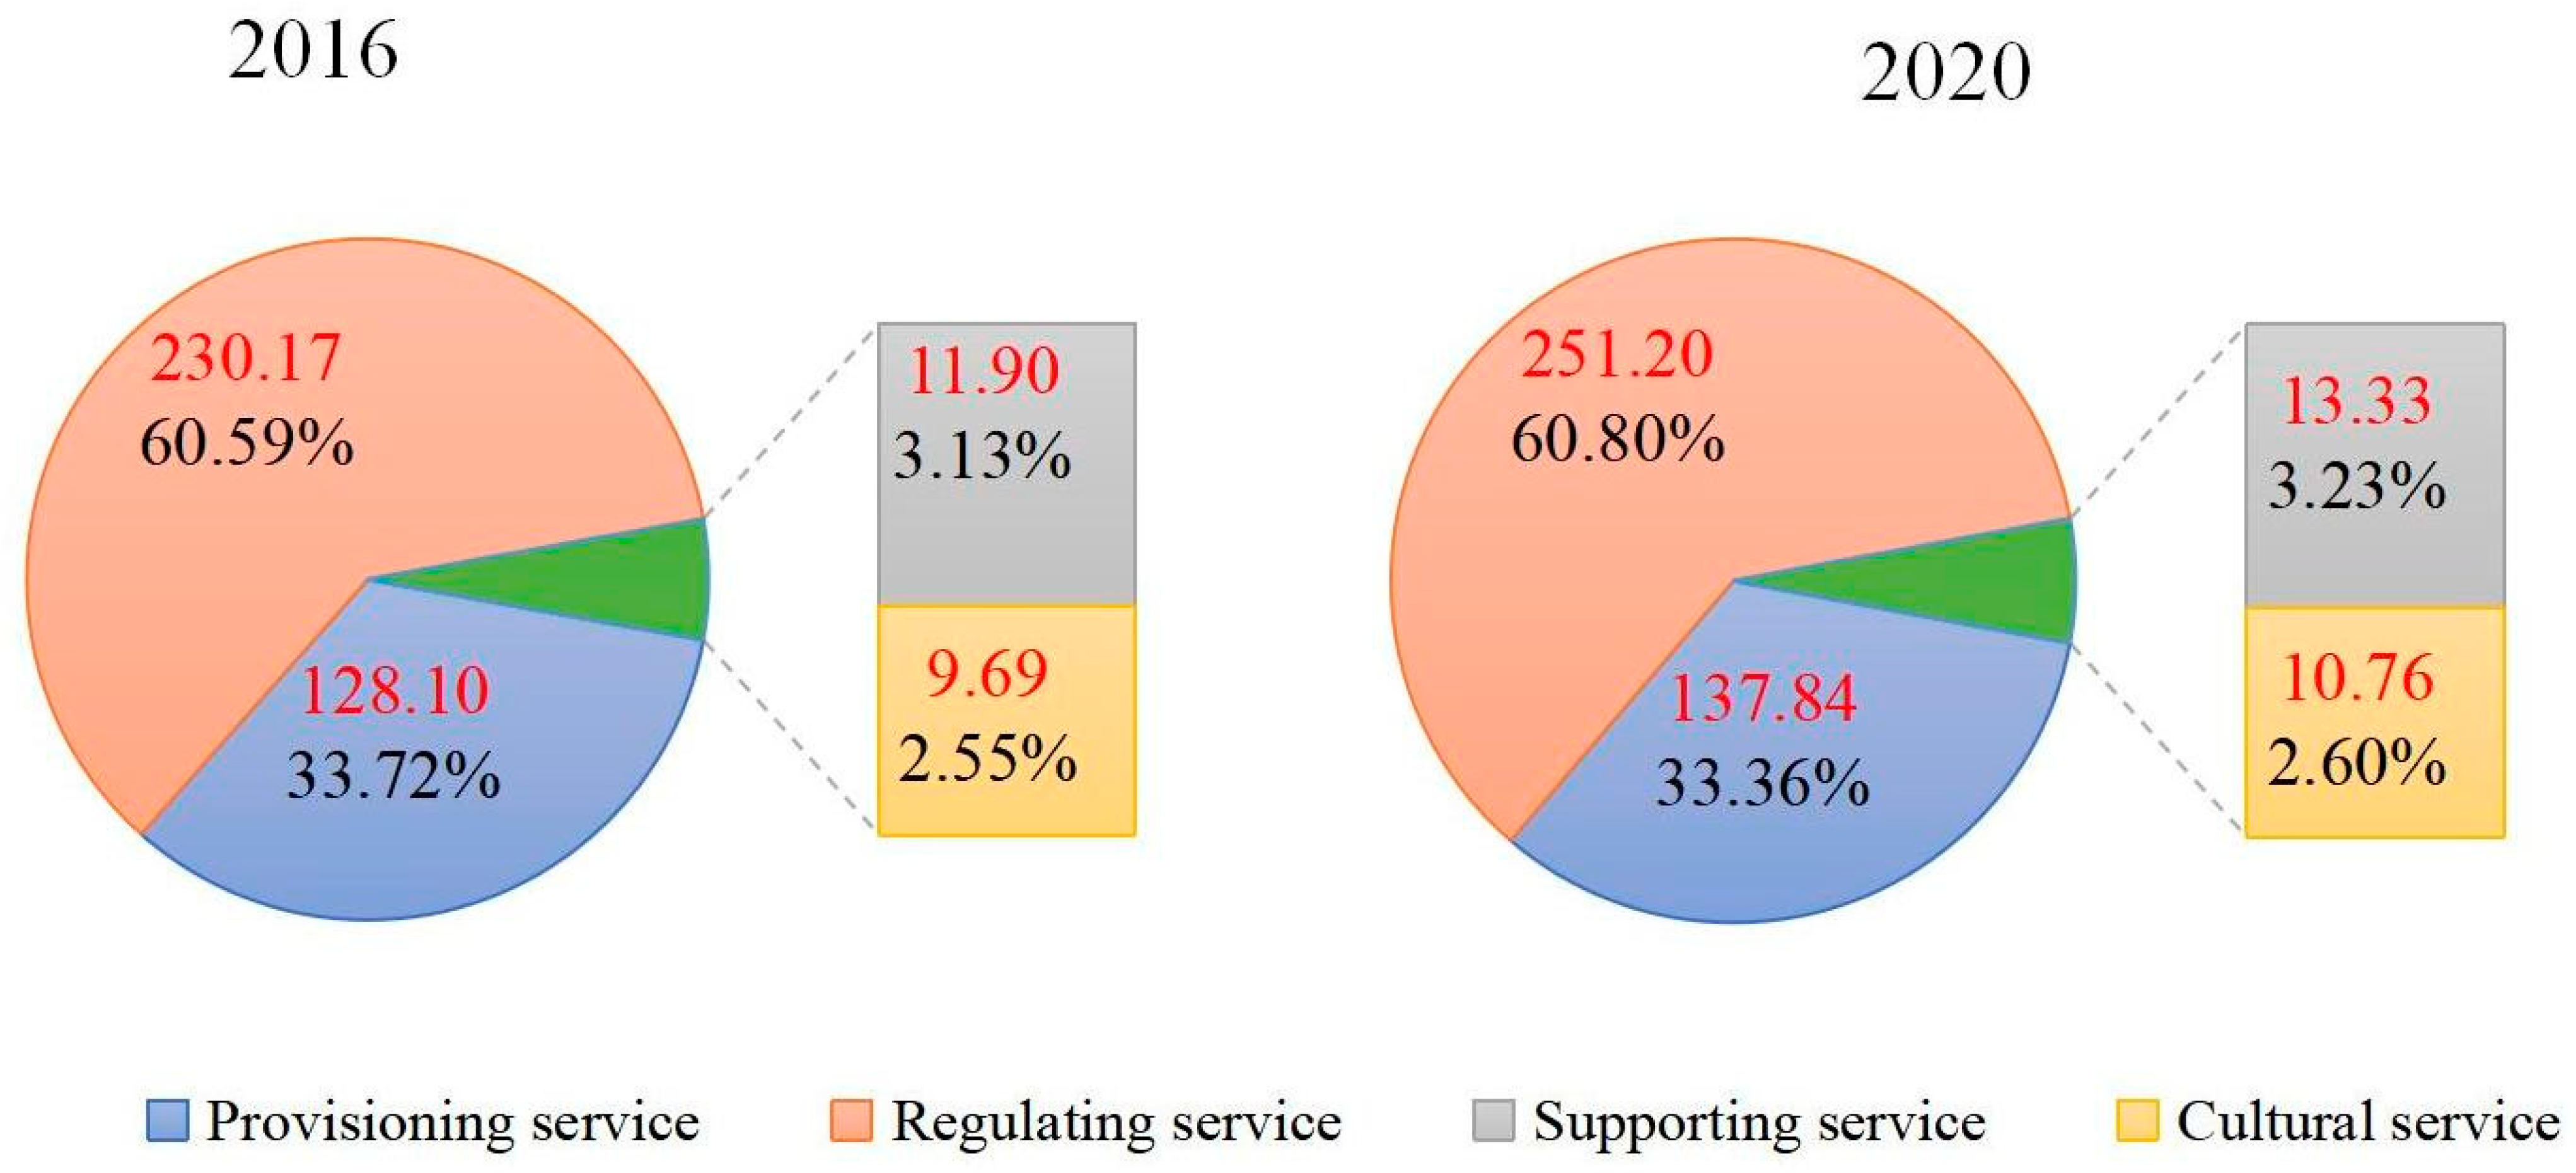

Table 1.
Spatial structure of mangrove.
| Structure | Description |
|---|---|
| Abundance of mangrove | The area of mangroves per unit length of coastline (ha/km). |
| Number of patches | The number of mangrove patches. |
| Average patch area | The average area of all mangrove patches (ha). |
| Mangrove shoreline | Shoreline with mangroves (km) |
| Shoreline mangrove | Mangroves with a minimum distance between the landward boundary and the coastline less than 30 m. |
| Ideally distributed mangrove | Shoreline mangrove with a patch width ≥100 m and coverage ≥0.4 |
Table 2.
Indicators, calculation criterion and data source for evaluating ESV of mangrove.
| Category | Type | Evaluation index | Data source and reference |
|---|---|---|---|
| Provisioning service |
Material production value | Wood production | [34] [35] |
| Fishery | [36] | ||
| Regulating service | Soil conservation value | Soil conservation | [37] [38] |
| Fertilizer conservation | [36] | ||
| wave absorbing revetment | Mangrove shoreline | [39] | |
| Climate regulation | CO2 |
[36] |
|
| O2 | |||
| CH4 | |||
| Pollution purification | Degrade pollutants | ||
| Water conservation | Water | [40] [38] |
|
| Supporting service |
Biodiversity Conservation | Habitat | [41] |
| Nutrient accumulation | Nutrient | [35] | |
| Culturalservice | Cultural | Scientific research and education | [42] [43] |
| Recreation | Recreation | [41] [44] |
Table 3.
Confusion matrix of mangrove classification results.
| Year | Type | mangrove | non- mangrove |
Total | User's accuracy |
Producer's accuracy |
Overall accuracy |
Kappa coefficient |
|---|---|---|---|---|---|---|---|---|
| 2016 | mangrove | 210 | 14 | 224 | 93.75% | 89.36% | 93.05% | 0.86 |
| non- mangrove |
25 | 312 | 337 | 92.58% | 95.71% | |||
| 2020 | mangrove | 215 | 9 | 224 | 95.98% | 92.67% | 95.37% | 0.90 |
| non- mangrove |
17 | 320 | 337 | 94.96% | 97.26% |
Table 4.
Changes of spatial structures during 2016-2020.
| Spatial structures | Year of 2016 | Year of 2020 | Proportion of Changes |
|---|---|---|---|
| Abundance of mangrove (ha/km) | 3.70 | 3.91 | 5.71% |
| Number of patches (pcs) | 1018 | 1060 | 4.13% |
| Average patch area (ha) | 6.14 | 6.37 | 3.80% |
| Mangrove shoreline (km) | 578.90 | 597.37 | 3.19% |
| Shoreline mangrove (ha) | 5436.97 | 5692.19 | 4.69% |
| Ideally distributed mangrove (ha) | 5114.972 | 5201.398 | 4.20% |
Table 5.
Changes of ESV during 2016-2020 (unit: million USD).
| Service | 2016 | 2020 | ||
|---|---|---|---|---|
| Value | Proportion | Value | Proportion | |
| Wood | 3.44 | 0.90% | 3.10 | 0.75% |
| Fishery | 124.66 | 32.82% | 134.74 | 32.61% |
| Soil consolidation | 0.12 | 0.03% | 0.13 | 0.03% |
| Fertilizer conservation |
81.11 | 21.35% | 87.66 | 21.22% |
| Wave absorbing revement | 54.20 | 14.27% | 55.60 | 13.46% |
| Carbon fixation | 25.85 | 6.81% | 27.65 | 6.69% |
| Oxygen release | 11.98 | 3.15% | 18.66 | 4.52% |
| Methane release | -1.31 | -0.35% | -1.42 | -0.34% |
| Pollution purification | 38.42 | 10.11% | 41.52 | 10.05% |
| Water conservation | 19.80 | 5.21% | 21.40 | 5.18% |
| Habitat | 11.19 | 2.95% | 12.56 | 3.04% |
| Nutrient accumulation | 0.71 | 0.19% | 0.77 | 0.19% |
| Scientific research | 2.97 | 0.78% | 3.21 | 0.78% |
| Recreation | 6.72 | 1.77% | 7.55 | 1.83% |
| Total | 379.85 | 413.13 | ||
Disclaimer/Publisher’s Note: The statements, opinions and data contained in all publications are solely those of the individual author(s) and contributor(s) and not of MDPI and/or the editor(s). MDPI and/or the editor(s) disclaim responsibility for any injury to people or property resulting from any ideas, methods, instructions or products referred to in the content. |
© 2023 by the authors. Licensee MDPI, Basel, Switzerland. This article is an open access article distributed under the terms and conditions of the Creative Commons Attribution (CC BY) license (http://creativecommons.org/licenses/by/4.0/).
Copyright: This open access article is published under a Creative Commons CC BY 4.0 license, which permit the free download, distribution, and reuse, provided that the author and preprint are cited in any reuse.


