
Submitted:
03 July 2024
Posted:
04 July 2024
You are already at the latest version
Abstract
The marine region of the Zhongjieshan Islands is an essential component and location for enhancement and release in Zhoushan Fishing Ground. The scientific assessment of the target species' ecological carrying capacity serves as the foundation for augmentation and release efforts. Based on data from the 2021-2022 survey of biological resources in the waters of Zhongjieshan islands, the Ecopath model was built to analyze the trophic structure, energy flow, and overall characteristics of the ecosystem, as well as the ecological carrying capacity of the main enhancement and releasing species, Larimichthys crocea and Sepiella maindroni. The ecosystem's functional groups had trophic levels ranging from 1 to 3.48, with an average energy transfer efficiency of 8.11% and total flow of 2125.905 t·km-2. The ratio of total primary output to total respiration is 1.713. Zhongjieshan Islands' ecosystem was currently at an embryonic stage. The ecological carrying capacity of Larimichthys crocea and Sepiella maindroni was calculated to be 0.2325 t·km-2 and 0.1617 t·km-2, separately or individually. Larimichthys crocea and Sepiella maindroni showed enormous potential for development and release. The findings offered essential data for ecological studies on the waters of Zhongjieshan Islands, as well as a reference for enhancement and release efforts in this area.
Keywords:
Ecopath model
; Enhancement and releasing
; Trophic level
; Ecological carrying capacity
; Energy flow
1. Introduction
Zhongjieshan Islands(30°06' ~ 30°13'N, 122°36' ~ 122°48'E) are located in the eastern part of Zhoushan Archipelago, in the East China Sea,which is the central area of Zhoushan fishing ground [1].The Zhongjieshan Islands contiguous to the Huangdayang Sea and the Daiquyang Sea. There are many islands and reefs in this sea area, which are affected by the Taiwan Warm Current and the Yellow Sea Cold Water Mass, and are rich in food and biological communities, being the important habitats, growing and breeding places and migratory passages for major economic fish in the East China Sea [2].In recent years, due to human interference and high fishing pressure, the biological habitat in the waters of Zhongjieshan Islands has been destroyed, and fishery resources, particularly the resources of Larimichthys crocea and Sepiella maindroni in the East China Sea's "four major fish products," have declined significantly. In order to protect and restore the ecological environment and fishery resources in the sea area of Zhongjieshan Islands [3], the management department has successively established the national marine special protection area of Zhongjieshan Islands in Putuo, Zhejiang Province, the national marine ranching demonstration area of Zhongjieshan Islands in Putuo, the fishery resource proliferation and release protection area of Zhoushan fishing ground, and the spawning ground.The population of target species such as Larimichthys crocea and Sepiella maindroni in this sea area has shown signs of recovery, and has achieved good ecological and economic benefits. Ecological capacity assessment is the premise of scientific proliferation and release activities. As the population dynamics of artificially released species affect the stability of the released marine ecosystem, it is necessary to evaluate the number of released species in order to scientifically and effectively increase the supplementary population of fishery resources [4,5,6]. However, the ecological capacity of major releasing species such as Larimichthys crocea and Sepiella maindroni in the Zhongjieshan Islands has not been systematically studied.
The balance model known as the ecopath model is founded on the idea of nutrient dynamics. It describes energy flow and determines ecological parameters by constructing an ecosystem model [6]. Polovina [7] developed the Ecopath model initially in 1984. Following a slow and steady progression,it was applied to a variety of ecosystems to analyze their stability and maturity characteristics, so as to achieve the comparison between different ecosystems [8]. It can also be used to assess a species' ecological potential. The Ecopath model has been applied extensively in bays and lakes in China [9,10], bays [11,12,13,14] and offshore areas [15,16,17,18].This study builds the Ecopath ecosystem energy flow model in the sea region of Zhongjieshan Islands based on the previous survey data of fisheries resources and ecological environment, in order to examine the energy flow structure and general characteristics of the ecosystem, evaluate the ecological capacity of the main releasing species such as Larimichthys crocea and Sepiella maindroni, and provide the basis for the proliferation and release activities and fishery management of the sea area, and provide scientific reference for the construction of marine ranching.
2. Materials and Methods
2.1. Data Sources
In the spring (April), summer (July), autumn (October) of 2021, and winter (January) of 2022, a survey of fishery resources and ecological environment was conducted in the sea area of Zhongjieshan Islands. A total of 18 survey stations were set up (Figure 1). Data collection and sample analysis were carried out by the Marine Survey Specification ( GB / T 12763.6-2007 ) [19] and Marine Fishery Resources Survey Specification ( SC/T 9403-2012 ) [20].
2.2. Calculation Parameters
As defined by the Ecopath model, ecosystems are divided into a series of interrelated ecological functional groups [21,22], essentially covers the trophic structure and energy flow of the entire ecosystem [23]. The ecological model implies that the energy inputs and outputs of each functional group are balanced according to the first law of thermodynamics with the following linear equations:
where Bi is the biomass of Group i [21], (P / B)i is the ratio of production to biomass of Group i [21], EEi is the eco-nutritional efficiency of Group i, Bj is the biomass of predator j, (Q/B)j is the ratio of consumption to biomass of Group j [21], DCij is the proportion of prey j in the diet of predator i [21], EXi is the output of Group i. In the Ecopath model, any three of the four parameters Bi, (P/B)i, (Q / B) j and EEi can be used as parameter inputs, and the remaining unknowns can be calculated by the model [24].
2.3. Division of Functional Groups
Based on biological characteristics, feeding characteristics, habitat, economic value, and biomass, these species are categorized into 21 functional groups (Table 1). Among them, Larimichthys crocea and Sepiella maindroni are the main fishery resources in the waters of Zhongjieshan Islands; and are also the main species of proliferation and release in this sea area. In this paper, they are divided into functional groups separately for ecological capacity assessment. Harpadon nehereus is the most dominant species and the highest biomass species in this survey, and it is also divided into functional groups separately. Other functional groups include phytoplankton, zooplankton, macroalgae, pelagic planktonic food fish, pelagic planktonic food fish, pelagic mixed food fish, demersal mixed food fish, demersal nekton food fish, demersal invertebrate food fish, cephalopods, crabs, shrimps, stomatopods, benthic mollusks, other benthic organisms, polychaetes, echinoderms, and detritus. These functional groups are able to represent the entire flow of energy in the ecosystems of the Middle Jieshan Islands.
2.4. Source of Functional Group Parameters
In the Ecopath model, the flow of energy is represented by the wet mass (t·km-2) in the system. [23]The biomass parameters of each functional group of the model were derived from the sampling survey of fishery resources in the waters of Zhongjieshan Islands. The P/B value of fish is equal to the instantaneous total mortality rate Z [25], Z=M+F, M is the natural mortality coefficient, F is the fishing mortality coefficient, and M is estimated by Pauly’s empirical formula [26]. Fish Q/B values were counted from a multiple regression model of caudal fin shape ratio [27,28]. For the functional groups that are difficult to determine the P/B and Q/B values, this paper mainly refers to the similar functional groups in the models of Sanmen Bay [12], Yangtze Estuary [29], and the East China Sea [30] with similar latitudes and ecosystem characteristics. The DC data of the food composition matrix were derived from the stomach content analysis of samples collected during the survey [31], the stomach content analysis of samples from adjacent sea areas [32,33,34,35,36,37,38], and the Fishbase database [39]. Ecological trophic efficiency (EE) is defined as the proportion of energy contributed to the overall ecosystem by the production of a given functional group [40]. Calculated by the model. The catch is based on fishery production monitoring data.
2.5. Source of Functional Group Parameters
The principle of balance in ecological models is to equalize the inputs and outputs of ecosystems [21]. After inputting the known parameters into the model, the EE is usually greater than 1 [22]. Due to the functional group produces more than it consumes, the EE value should be between 0 and 1. In order to obtain the reasonable values for other parameters of the ecosystem, the ratio of production to biomass, the ratio of consumption to biomass, and the food composition of each functional group should be adjusted to make the model in a balanced state [24].
The Pedigree index is used to evaluate the overall quality of the input parameters of the model. The Pedigree index varies from 0 to 1. The higher the Pedigree index, the higher the accuracy of the parameters [7,21].
In this paper, PEREBAL pre-test was used to test the biomass (B), the ratio of production to biomass (P/B), the ratio of consumption to biomass (Q/B) and the ratio of production to consumption (P/Q) before model equilibrium to check the consistency of the model (Link,2010). According to the principles of mass conservation and thermodynamic conservation, the Ecoapth model after pre-test was adjusted through a series of logical constraints to achieve ecological and thermodynamic equilibrium. (Heymans atal, 2016 )
2.6. Ecological Capacity Estimation
According to the principle of Ecopath model, the biomass distribution of Larimichthys crocea and Sepiella maindroni is increased in a certain proportion. When the EE of a functional group in the model is greater than or equal to 1 [24], the model loses balance. At this time, the biomass of Larimichthys crocea and Sepiella maindroni is the ecological capacity of the sea area.
2.7. Ecosystem Index
Mixed trophic impact (MTI) reflects the effect of biomass changes in functional groups on other functional groups [41,42]. Ecosystem maturity is represented by Finn's cycle index (FCI) [43], Connectance index (CI) [44], and System omnivory index (SOI) [45]. The connectivity index (CI) and the system omnivory index (SOI) are indicators that reflect the complexity of the ecosystem function group association [46]. The values of each parameter are output by Ecopath software.
3. Results
3.1. Nutrient Structure and Energy Flow Conversion Efficiency between Trophic Levels
According to the estimation of the model, the trophic level of the ecosystem function group in the waters of Zhongjieshan Islands ranged from 1 to 3.48 (Table 2), among which the highest trophic level of Larimichthys crocea was 3.48, and the trophic level of Sepiella maindroni was 3.45. The trophic level of fish was 2.42-3.48, the trophic level of shrimp and crab was 2.65-2.67, and the trophic level of cephalopod was 3.10.
The energy flow between the trophic levels of the ecosystem in the waters of Zhongjieshan Islands is shown in Figure 3, and the energy flow of the system is mainly concentrated in the first five trophic levels. The total primary production of the system is 782.4t·km-2·a-1, of which 406.1 t·km-2·a-1 is transferred to the second trophic level, and 273.9t·km-2·a-1 is transferred to the second trophic level. The total energy flowing into the detritus reached 599.4 t·km-2·a-1, most of which came from primary producers at 376.3 t·km-2·a-1.
3.2. Energy Transfer Efficiency
As can be seen from Table 4, the total average energy conversion efficiency of the ecosystem in the Zhongjieshan Islands is 8.11%. The total energy conversion efficiencies of energy supplied by producer phytoplankton and macroalgae between trophic levels from the second to the fifth trophic level were 2.81%, 13.04%, 10.4% and 11.49%, separately or individually. The conversion efficiency of energy provided by detritus among different trophic levels was 6.1%, 11.46%, 10.86%, and 11.23%, separately or individually. The conversion efficiency of total energy flow from the first to the second trophic level is 4.13%, and from the second to the third trophic level is 12.11%. The average nutrient conversion efficiency of the grazing food chain based on phytoplankton and macroalgae was 7.25%, and the average nutrient conversion efficiency of the detritus food chain was 9.12%.
3.3. Evaluation of Ecological Capacity of Larimichthys crocea and Sepiella maindroni Proliferation
The trophic levels of Larimichthys crocea and Sepiella maindroni were 3.48 and 3.45, separately or individually, which were the two species with the highest trophic level in the energy flow model of Zhongjieshan Islands. Larimichthys crocea mainly feeds on shrimps, stomatopods, and benthic invertebrates, and the increase in biomass will correspondingly increase the survival pressure of the prey. At present, the biomass of Larimichthys crocea is 0.0058 t/km2. When its biomass exceeds 0.2325 t / km2, the EE of benthic invertebrate food fish is greater than 1, and the model is imbalance. Therefore, the ecological capacity of Larimichthys crocea in Zhongjieshan Islands was 0.2325 t/km2. Sepiella maindroni mainly feeds on shrimp and demersal invertebrate-feeding fish. At present, the biomass of Sepiella maindroni is 0.0052 t/km2. When its biomass exceeds 0.1617 t/km2, the EE of benthic invertebrate food fish is greater than 1, and the model is unbalanced. Therefore, the ecological capacity of Sepiella maindroni in Zhongjieshan Islands was set as 0.1617 t/km2 in this study. The ecological capacity of Larimichthys crocea and Sepiella maindroni in the ecosystem is calculated as shown in Table 5 and Table 6.
3.4. Food Contact and Mixed Nutrition Effects between Functional Groups
The material flow diagram of the ecosystem in the waters of the Zhongjieshan Islands shows that the functional groups within the ecosystem are closely related. Benthic mollusks, polychaetes and echinoderms play a pivotal role throughout the ecosystem. They are the bridge between primary producers and high-trophic consumers. The nutrient flow of the ecosystem in the waters of Zhongjieshan Islands is based on detritus and grazing.
The mixed trophic relationship among the functional groups of the marine ecosystem in Zhongjieshan Islands is shown in Figure 3. Phytoplankton, macroalgae and detritus are the main nutrient sources in the waters of Zhongjieshan Islands, and the increased of their biomass has a proactively impact on other functional groups. Detritus had a positive effect on polychaetes, echinoderms and other benthic organisms, and phytoplankton had a positive effect on benthic mollusks and zooplankton. The trophic level of Larimichthys crocea is high, which is affected by the predator-prey relationship, and has a negative impact on the leading fish. Sepiella maindroni has a pessimistic impact on the bottom mixed feeding fish. Other benthic organisms have a negative impact on the polychaete functional group. Shrimp had a pessimistic effect on the functional group of the oropods.
3.5. Comparison of Ecosystem Characteristics before and after the targetSep Species Reached the ecological Capacity
The ecosystem characteristics of Larimichthys crocea and Sepiella maindroni before and after reaching ecological capacity in Zhongjieshan Islands are shown in Table 7. At present, the total ecosystem flow of the Zhongjieshan Islands sea area has reached 2125.905t/(km2·a), of which 34.9 % comes from the total ecosystem consumption 743.93t/(km2·a), 15.3 % comes from the total output 325.77 t/(km2·a), 21.4 % comes from the total respiration 456.789t/(km2·a), and the remaining 28.1 % flows to debris 599.412 t/(km2·a). After the Larimichthys crocea and Sepiella maindroni reached the ecological capacity, the total consumption, total respiration and total flux of the system increased with the increase of ecological capacity, but the yield and the total amount of debris decreased with the increase of ecological capacity. The net primary productivity and total biomass were 782.4 t/(km2·a) and 41.908 t/(km2·a), separately or individually. Total primary production / total respiration (TPP/TR), total primary production / total biomass (TPP/TB), and net ecosystem production represent ecosystem maturity. These indexes decreased after reaching the proliferation capacity.The connectivity index and the omnivorous index of the ecosystem food web in the Zhongjieshan Islands were 0.454 and 0.241, separately or individually. The Finn's cycle index was 8.24, and the average Finn path length of the system was 2.717. After the biomass of Larimichthys crocea and Sepiella maindroni reached the proliferation capacity, CI remained unchanged, SOI increased, and FCI decreased.
4. Discussion
4.1. Capacitymodel Quality Evaluation
The Pedigree index is used to evaluate the credibility of the model itself. Morissette analyzed more than 150 models and found that the index ranged from 0.16 to 0.68 [47]. In this study, the Pedigree index of the marine ecosystem in the waters of Zhongjieshan Islands was 0.416, which was at a medium level. In the process of inputting parameters, the feeding composition, the ratio of P/B, and the ratio of Q/B of all fish are difficult to obtain. Therefore, most of the values refer to the research data of the adjacent sea area, and the reference data have a certain influence on the credibility of the model. In future model research, more experimental data should be obtained as much as possible, and more samples should be collected to reflect the real ecological community structure more objectively and accurately.
4.2. Ecosystem Trophic Level and Conversion Efficiency
By determining the trophic structure of ecosystems, energy flow and energy conversion efficiency, it is feasible to assess the ecosystem structure and general system characteristics through analysis. The nutrient structure in the ecosystem reflects the basic energy flow of the ecosystem [48,49]. The energy flow within the waters of the Zhongjieshan Islands ecosystem is predominantly focused on the initial five trophic levels. In this context, approximately 65.9% of the total energy flow is directed towards the first trophic level, while about 32.4% of the total energy flow is allocated to the second trophic level.It shows that the energy flow efficiency of the first and second trophic levels is high, and the energy flow is mainly between low trophic species. The total conversion efficiency of the ecosystem in the Zhongjieshan Islands is 8.112%, which is lower than 10% of Lindeman's [50], and the adjacent ecosystems, such as 13% of the Sanmen Bay [12] and 9.3% of the Yangtze Estuary [29], indicating that a large amount of primary productivity cannot enter a higher level of nutrient flow, and the energy flow in the system needs to be further improved.
Zhongjieshan Islands is high, such as Larimichthys crocea and Sepiella maindroni. The nutrient conversion efficiency of shrimp is also high. Shrimp is an important food species in the waters of Zhongjieshan Islands. Larimichthys crocea and Sepiella maindroni feed on a large amount of shrimp. In addition, the nutrient conversion efficiency of crabs is low, indicating that more crab production is not used by higher trophic levels but directly flows into debris after death. This may be due to the low biomass of crab-eating functional groups, such as demersal nekton-eating fish. Compared with other ecosystems, the nutrient conversion efficiency of zooplankton and organic debris in the ecosystem of Zhongjieshan Islands was higher. This may be caused by the large amount of zooplankton and organic debris consumed by fish in the waters of Zhongjieshan Islands.
4.3. Ecosystem Characteristics of Zhongjieshan Islands Sea Area
It can effectively describe the characteristics and energy flow of ecosystems by comparing them with ecosystems with the same latitude or similar characteristics [41]. The total ecosystem flow in the waters of Zhongjieshan Islands is 2127.119t/(km2·a), which is lower than that in the adjacent sea area of Sanmen Bay [11](6407.44 t/(km2·a)), Yangtze River Estuary (4191.228t/(km2·a)) [29], Xiangshan Port [51](2226.605t/(km2·a)). Total primary productivity / total respiration ( TPP/TR ) represents the maturity of the system [43]. In a mature ecosystem, there is no overproduction recycling problem, the total production and total respiration are comparable, TPP / TR is close to 1, and NSP is close to 0. When the total production exceeds the total respiration, TPP/TR is greater than 1, indicating that the ecosystem is unstable [52]. The TPP/TR of the waters Zhongjieshan Islands ecosystem is 1.713, indicating that the waters of Zhongjieshan Islands ecosystem is in an immature state and is greatly disturbed.The TPP / TB value of the system is high, which is 18.669, indicating that the system is in the early stage of development. At the same time, the TPP/TB value is higher than 1, indicating that the greater the development vitality of the system [53].The ecosystem vitality of the Zhongjieshan Islands is higher and the development speed is faster. The difference between the total primary production and total respiration of the system is the net production of the system. The closer the value is to 0, the more mature the system is [21]. The ecosystem's net production in the waters of Zhongjieshan Islands is 325.611, which is much larger than 0, indicating that the system is not mature. The proportion of material recycling in the FCI ecosystem is an indicator of ecosystem stability. A higher FCI indicates greater ecosystem stability, as cited in [44]. The FCI of the Zhongjieshan Islands ecosystem stood at 8.24%, which was higher than that in the adjacent Sanmen Bay and the Yangtze Estuary, indicating that the stability of the Zhongjieshan Islands was low. SOI and CI are related to the complexity of the food web [52]. SOI and CI in the waters of Zhongjieshan Islands are relatively low, which is similar to other immature ecosystems such as Sanmen Bay [12] and Yangtze Estuary [29], this suggests that the food web structure in the sea area of Zhongjieshan Islands is uncomplicated, leading to a low level of ecosystem stability.
4.4. Analysis of Ecological Capacity of Larimichthys crocea and Sepiella maindroni Proliferation
Restocking is putting artificially cultured fish, shrimp and crab seedlings into natural waters, which is the main method to supplement fishery resources and repair the ecological environment, to achieve the purpose of increasing resource replenishment and achieving ecological and economic benefits [54,55]. The waters of Zhongjieshan Islands is one of the main proliferation and release areas of Zhoushan City and Zhoushan fishing ground.Larimichthys crocea and Sepiella maindroni are the main species of proliferation and release. In 2022, the number of Larimichthys crocea released in the waters of Zhongjieshan Islands reached 14.23 million, and the discharge of Sepiella maindroni was 21 million fertilized eggs. After years of continuous proliferation and release, the resources of Larimichthys crocea and Sepiella maindroni in the waters of Zhongjieshan Islands have been restored, but this survey found that the biomass was 0.0058t·km-2and 0.0052 t·km-2, respectively, which was still at a low level. Ecopath ecosystem model can be used to effectively evaluate the ecological capacity of releasing species [51,56].The ecological carrying capacity of Larimichthys crocea and Sepiella maindroni were estimated to be 0.2325t·km-2 and 0.1617t·km-2, respectively. The existing biomass of Larimichthys crocea and Sepiella maindroni accounted for 2.4 % and 3.2% of the ecological capacity estimated by the model, respectively. Therefore, Larimichthys crocea and Sepiella maindroni had great proliferation potential. Due to the high trophic level of Larimichthys crocea and Sepiella maindroni, they are Sepat the top predator in the system, and the increase of their biomass will cause great pressure on the bait organisms. The calculation of ecological capacity of Larimichthys crocea and Sepiella maindroni plays a guiding role in scientific and effective proliferation and release activities.
5. Conclusions
Based on the survey data of fishery resources and ecological environment in the waters of Zhongjieshan Islands, historical data, statistical yearbook data and literature data, this study, we constructed an Ecopath model of the marine ecosystem of the waters of Zhongjiaoshan Islands, and quantitatively analyzed the structure and function of the marine biomes in the waters of Zhongjiaoshan Islands, and evaluated the proliferation ecological capacity of Larimichthys crocea and Sepiella maindroni. In the process of assessing the ecological reproduction capacity, the interspecific competition, the relationship between prey and predators, and the impact of proliferation and release activities on the entire ecosystem were considered. It provides a scientific basis for the proliferation and release activities in the waters of Zhongjieshan Islands, which is conducive to formulating a reasonable proliferation and release plan for Zhongjieshan Islands and promoting the sustainable development of fisheries. There are also some shortcomings in this study, such as the small amount of data, and only one year of data to calculate. The actual proliferation and release activities need to combine theoretical data with the actual situation.
Author Contributions
For research articles with several authors, a short paragraph specifying their individual contributions must be provided. The following statements should be used “Conceptualization, Y.Q.; methodology, Y.Q.; software, Y.Q.; validation, Y.Q.; formal analysis, Y.Q.; investigation, Z.W.,J.L.,Y.Z. and Z.L.; resources, Z.W.,J.L.,Y.Z. and Z.L.; data curation, K.X.,Q.D.,Q.Z. and Y.J.; writing—original draft preparation, Y.Q.; writing—review and editing, M.W.,Y.Z; supervision, Y.Z.; project administration, Y.Z.; funding acquisition, Y.Z. All authors have read and agreed to the published version of the manuscript.” Please turn to the CRediT taxonomy for the term explanation.
Funding
This research received no external funding.
Informed Consent Statement
Written informed consent has been obtained from the patient(s) to publish this paper.
References
- Liang, J.; Wang, W.D. Diel and seasonal variation in fish communities in the Zhongjieshan marine island reef reserve. Fish Res 2020, 227, 105549. [Google Scholar] [CrossRef]
- Cai, L.N.; Tang, R. The spatial-temporal consistency of chlorophyll-a and fishery resources in the water of the Zhoushan archipelago revealed by high resolution remote sensing. Front Mar Sci 2022, 9, 1022375. [Google Scholar] [CrossRef]
- J, J.L.; Quan, Y.B. Assessment of marine ranching ecological development using DPSIR-TOPSIS and obstacle degree analysis: A case study of Zhoushan. Ocean Coast Manage 2023, 244, 106821. [Google Scholar]
- Han, D.Y.; K, R. Effects of jellyfish and black seabream releasing on marine ecosystems: A mass balance approach for the coastal area of southern Zhejiang, China. Ocean Coast Manage 2024, 248, 106948. [Google Scholar] [CrossRef]
- Yang, W.; Zhang, Z.Y. Ecosystem-based fishery management that accounts for trade-offs between fishing and enhancement stocking: A case study of Juehua Island in the Bohai Sea. Ecol Indic 2023, 156, 111081. [Google Scholar] [CrossRef]
- Heymans, J.J.; Coll, M. Best practice in Ecopath with Ecosim food-web models for ecosystem-based management. Ecol Model 2016, 331, 173–184. [Google Scholar] [CrossRef]
- Polovina, J.J. The ECOPATH model and its application to French Frigate Shoals. Coral Reefs 1984, 3, 1–11. [Google Scholar] [CrossRef]
- Srithong, N.; Jensen, K.R. Application of the ecopath model for evaluation of ecological structure and function for fisheries management: A case study from fisheries in coastal Andaman Sea, Thailand. Reg Stud Mar Sci 2021, 47, 101972. [Google Scholar] [CrossRef]
- Li, Y.K.; Liu, N.S. Analysis on the ecosystem structure and function of Lake Taihu based on Ecopath model. Chin. J. Appl. Ecol 2014, 25, 2033–2040. [Google Scholar]
- Yu, J.; Liu, J.R. Analysis on the ecosystem structure and function of Lake Qiandao based on Ecopath model. Acta Hydrobiologica Sinica 2021, 45, 308–317. [Google Scholar]
- Lin, Q.; Li, X.S. Ecological carrying capacity of Chinese shrimp stock enhancement in Laizhou Bay of East China based on Ecopath model. Chin. J. Appl. Ecol 2013, 24, 1131–1140. [Google Scholar]
- Kong, Y.F.; Yin, C.J. Ecosystem structure and function of Sanmen Bay based on Ecopath model. Chin. J. Appl. Ecol 2022, 33, 829–836. [Google Scholar]
- Huang, M.Y.; Xu, S.N. Assessment of ecological carrying capacity of Sparus macrocephalus in Daya Bay based on an ecopath model. J.Fish. Sci. Chin. 2019, 26, 1–13. [Google Scholar] [CrossRef]
- Ren, X.Y.; Liu, Y. Ecosystem structure in the Haizhou Bay and adjacent waters based on Ecopath model. Haiyang Xuebao, 2020, 42, 101–109. [Google Scholar]
- Chen, Z.Z.; Qiu, Y.S. Structure and function of Beibu Gulf ecosystem based on Ecopath model. J.Fish. Sci. Chin 2008, 3, 460–468. [Google Scholar]
- Wu, Z.X.; Zhang, X.M. Structure and function of Lidao artificial reef ecosystem in Rongcheng of Shandong Province, East China: An evaluation based on Ecopath model. Chin. J. Appl. Ecol 2012, 23, 2878–2886. [Google Scholar]
- Hong, X.F.; Chen, Z.Z. Analysis of ecological carrying capacity of reef organisms in Qilianyu Islands based on Ecopath model. J.Trophical Oceanography 2022, 41, 15–27. [Google Scholar]
- Chen, Z.Z.; Qiu, Y.S. Assessment of the food-web structure,energy flows,and system attribute of northern South China Sea ecosystem. Acta Eco 2010, 30, 4855–4865. [Google Scholar]
- General Administration of Quality Supervision, Inspection and Quarantine of the People’s Republic of China, Standardization Administration of the People’s Republic of China. Specifications for oceanographic survey- Part 6: Marine biological survey (GB/T 12763.6-2007). Beijing: Standards Press of China, 2007: 1-159.
- Ministry of Agriculture and Rural Affairs of the People’s Republic of China. Technical specification for marine fishery resources survey (SC/T 9403-2012). Beijing: China Agriculture Press, 2012: 1-31.
- Christensen, V.; Pauly, D. Ecopath ⅠⅠ - a software for balancing steady-state ecosystem models and calculating network characteristics. Ecol. Model 1992, 61, 169–185. [Google Scholar] [CrossRef]
- Christensen, V.; Walters, C.J. Ecopath with Ecosim: methods, capabilities and limitations. Ecol. Model 2004, 172, 109–139. [Google Scholar] [CrossRef]
- Pauly, D. Fish population dynamics in tropical waters: A manual for use with programmable calculators. ICLARM Studies and Reviews 1984, 8, 1–325. [Google Scholar]
- Christensen, V.; Walters, C.J. Ecopath with Ecosim: A User’s Guide. Fisheries Centre, University of British Columbia, 2005, 12, 154. [Google Scholar]
- Gulland, J.A. The fish resources of the ocean. Rome (Italy) FAO, 1970; 1-255.
- Pauly, D. On the interrelationships between natural mortality, growth parameters, and mean environmental temperature in 175 fish stocks. Ices J Mar Sci 1980, 39, 175–192. [Google Scholar] [CrossRef]
- Palomares, M.L.D.; Pauly, D. Predicting food consumption of fish populations as functions of mortality, food type, morphometrics, temperature and salinity. Mar Freshwater Res, 1998, 49, 447–453. [Google Scholar] [CrossRef]
- Palomares, M.L.; Pauly, D. A multiple regression model for predicting the food consumption of marine fish populations. New Zeal J Mar Fresh 1989, 40, 259–273. [Google Scholar] [CrossRef]
- Lin, Q.; Jin, X.S.; Guo, X.W. Study on the structure and energy flow of the Yangtze River estuary and adjacent waters ecosystem based on Ecopath model. J. Hydroecol. 2009, 30, 28–36. [Google Scholar]
- Li, Y.K.; Yu, N.; Chen, L.Q. Ecological modeling on structure and functioning of southern East China Sea ecosystem. Prog.Fish. Sci. 2010, 31, 30–39. [Google Scholar]
- Liu, M.Z.; Yang, F.; Jiang, R.J. Trophic niche and potential carbon source of three reef-associated fishes of Zhongjieshan Islands. Chin. J. Appl. Ecol. 2023, 34, 1130–1136. [Google Scholar]
- Yang, F.; Liu, M.Z.; Jiang, R.J. Study on the feeding ecology of Larimichthys crocea in the Ma’an Archipelago based on biomarker and stomach content analysis. J.Fish. Sci. Chin. 2023, 30, 247–258. [Google Scholar]
- Wang, J. Feeding ecology of four commercial fishes in Zhoushan Islands. Masteral dissertation. Zhoushan: Zhejiang Ocean Univ, 2022.
- Zhang, Q.H.; Cheng, J.H.; Xu, H.X. The fishery resources and sustainable utilization in the East China Sea and southern Yellow Sea. Shanghai: Fudan University Press.2007: 1-633.
- Li, D.; Li, S.H.; Xu, J.T. Feeding habits of Coilia nasus in the waters near Yangtze Estuary. Chin.J. Ecol 2023, 1–11. [Google Scholar]
- Dou, S.Z.; Yang, J.M. Feeding habit and seasonal variation in food contentof Cynoglossus semilaevis (Günther). Acta Ecol 1992, 12, 368–376. [Google Scholar]
- Zhang, Z.P.; Xue, J.L.; Wang, M.Q. Trophic niches of three common carnivorous mollusca in artificial reef area. Haiyang Tongbao 2022, 41, 588–592. [Google Scholar]
- Wang, C.Q.; Tang, J.H.; Xiong, Y. Feeding habits of Miichthys miiuy in Jiangsu costal waters. J. Zhejiang. Ocean Univ. (Nat. Sci. Ed.) 2020, 39, 372–378. [Google Scholar]
- Froese, R.; Pauly, D. FishBase [EB/OL] (2023-06) [2023-09-27]. http://www.fishbase.org.
- Ivlev, V.S. Experimental ecology of the feeding of fishes. New Haven: Yale University Press, 1961, 1-302.
- Power, M.E.; Tilman, D.; Estes, J.A. Challenges in the quest for keystones. Bioscience 1996, 46, 609–620. [Google Scholar] [CrossRef]
- Hannon, B. The structure of ecosystems. J Theor Biol 1973, 41, 535–546. [Google Scholar] [CrossRef] [PubMed]
- Finn, J.T. Measures of ecosystem structure and function derived /from analysis of flows. J Theor Biol 1976, 56, 363–380. [Google Scholar] [CrossRef] [PubMed]
- Ulanowicz, R.E. Growth and Development: Ecosystem Phenomenology. 1986, Springer Verlag, New York.
- Pauly, D.; Soriano-Bartz, M.L.; Palomares, M.L.D. Improved construction, parametrization and interpretation of steady-state ecosystem models. InTrophic models of aquatic ecosystems. ICLARM Conference Proceedings 1993, 26, 1–13. [Google Scholar]
- Odum, E.P. The strategy of ecosystem development. Science 1969, 164, 262–270. [Google Scholar] [CrossRef]
- Morissette, L. Complexity, cost and quality of ecosystem models and their impact on resilience: A comparative analysis, with emphasis on marine mammals and the Gulf of St. Lawrence. PhD Thesis. Vancouver: University of British Columbia, 2007.
- Christensen, V.; Walters, C.J.; Pauly, D. Ecopath with ecosim: A user’s guide. Vancouver: University of British Columbia, 2008, 1-112.
- Pauly, D.; Soriano-Bartz, M.L.; Palomares, M.L.D. Improved construction, parametrization and interpretation of steady-state ecosystem models. Proceedings of the ICLARM Conference on Trophic Models of Aquatic Ecosystems 1993, 26, 1–13. [Google Scholar]
- Lindeman, R.L. The trophic-dynamic aspect of ecology. Ecology 1942, 23, 399–418. [Google Scholar] [CrossRef]
- Yang, L.L.; Jiang, Y.Z.; Yuan, X.W. Ecological carrying capacity of typical enhancement species in Xiangshan Bay. Mar. Fish. 2016, 38, 273–282. [Google Scholar]
- Christensen, V. Ecosystem maturity towards quantification. Ecol Model 1995, 77, 3–32. [Google Scholar] [CrossRef]
- Odum, E.P. The strategy of ecosystem development: an understanding of ecological succession provides a basis for resolving man’s conflict with nature. Science, 1969, 164, 262–270. [Google Scholar] [CrossRef] [PubMed]
- Morvezen, R.; Boudry, P.; Laroche, J. Stock enhancement or sea ranching? Insights from monitoring the genetic diversity, relatedness and effective population size in a seeded great scallop population (Pecten maximus). Heredity 2016, 117, 142–148. [Google Scholar] [CrossRef] [PubMed]
- Grant, W.S.; Jasper, J.; Bekkevold, D. Responsible genetic approach to stock restoration, sea ranching and stock enhancement of marine fishes and invertebrates. Rev Fish Biol Fisher, 2017, 27, 615–649. [Google Scholar] [CrossRef]
- Odum, E.P.; Barrett, G.W. Fundamentals of ecology. Philadelphia: Saunders 1971, 3, 5. [Google Scholar] [CrossRef]
Figure 1.
The station diagram of surveys in the waters of Zhongjieshan Islands .
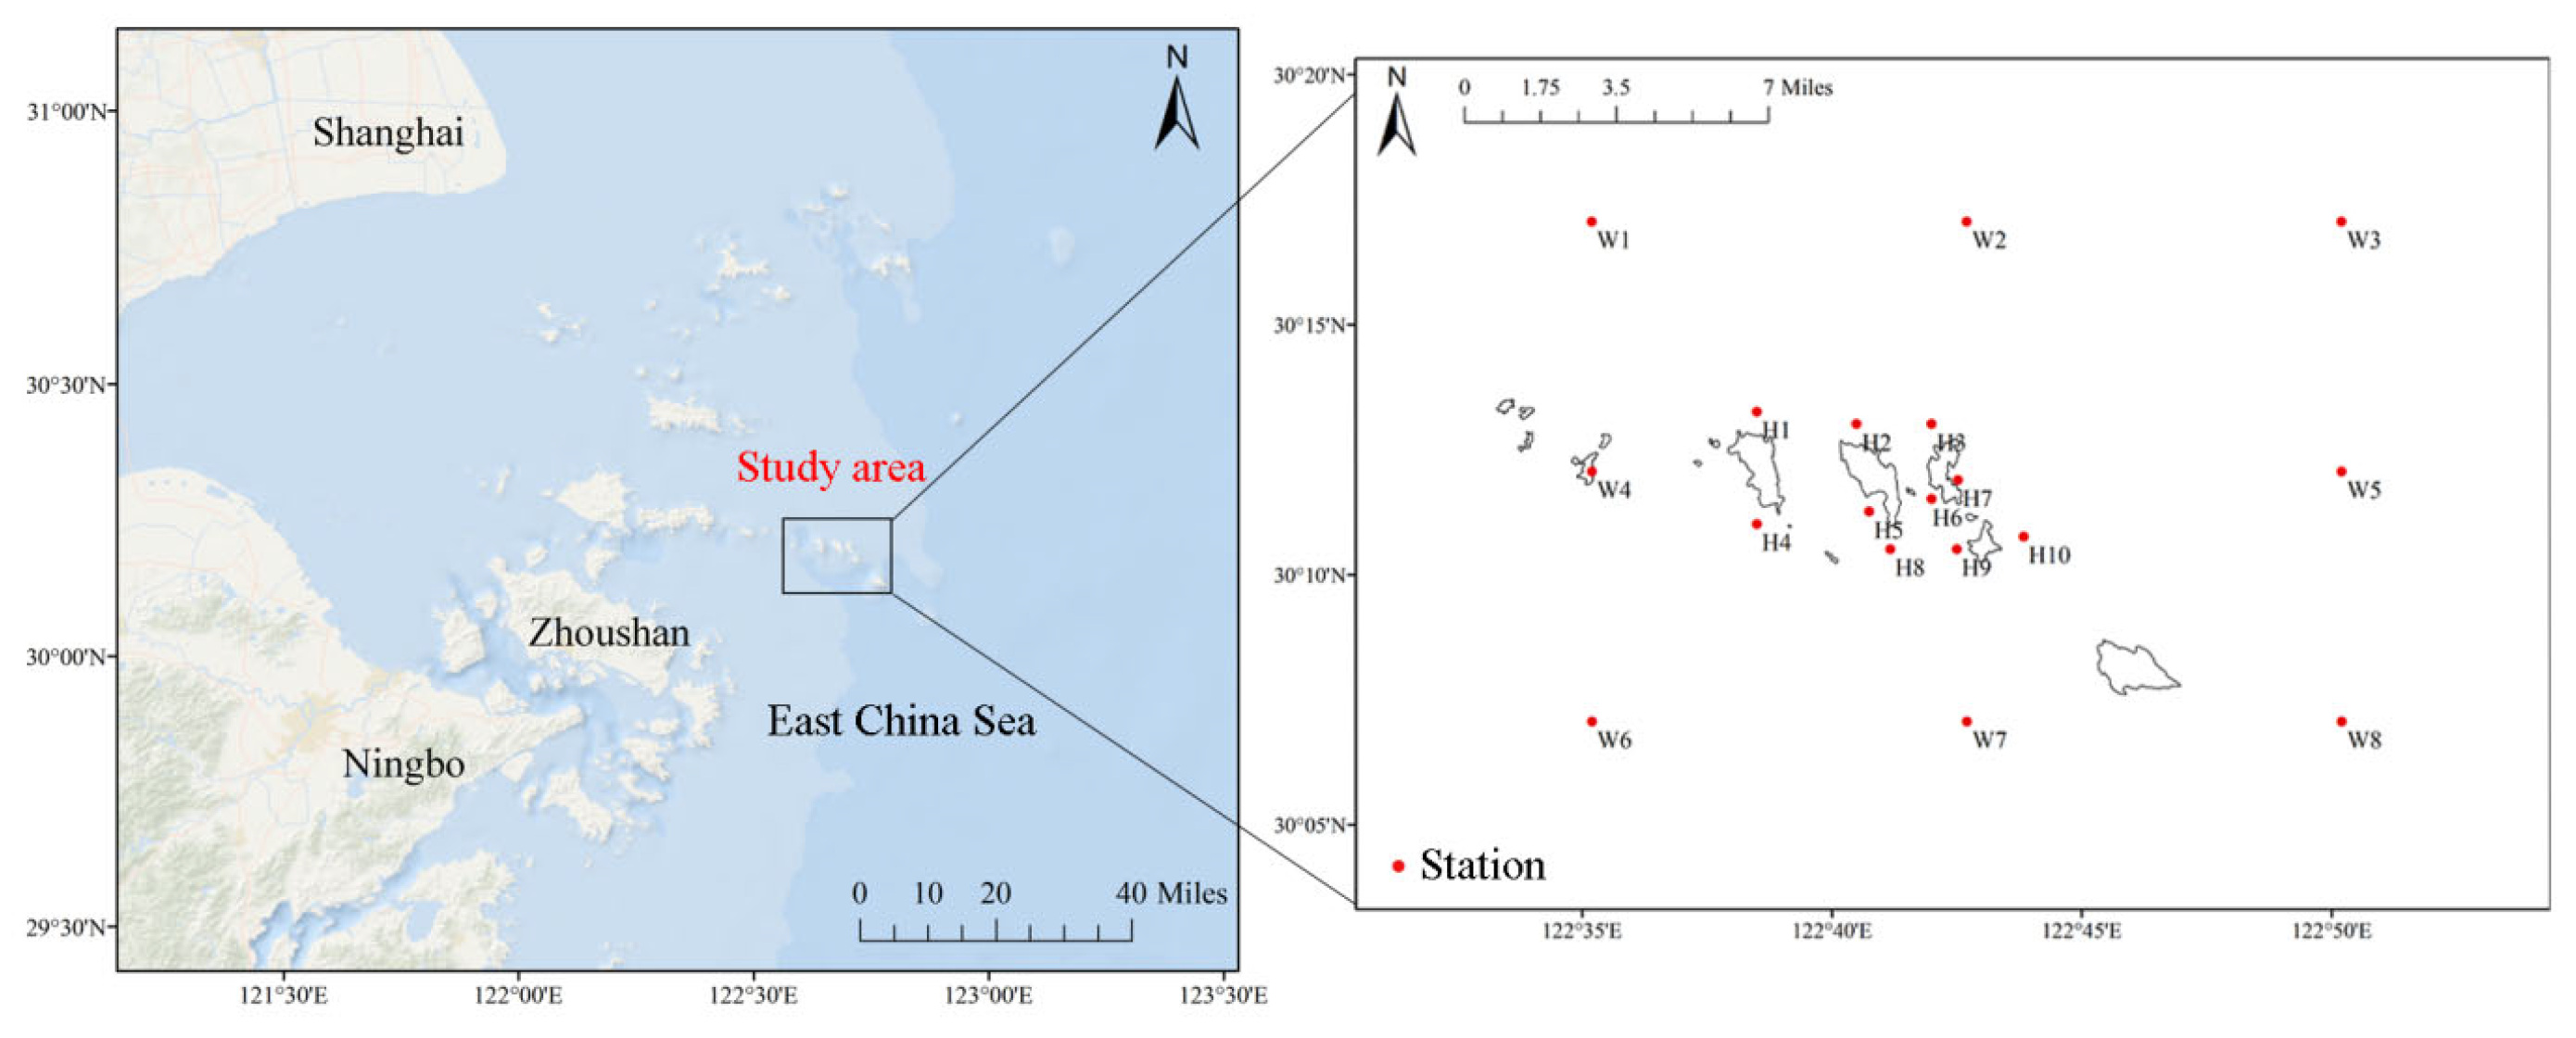
Figure 2.
Energy flow between trophic levels of the marine ecosystem in the waters of Zhongjieshan Islands.
Figure 2.
Energy flow between trophic levels of the marine ecosystem in the waters of Zhongjieshan Islands.
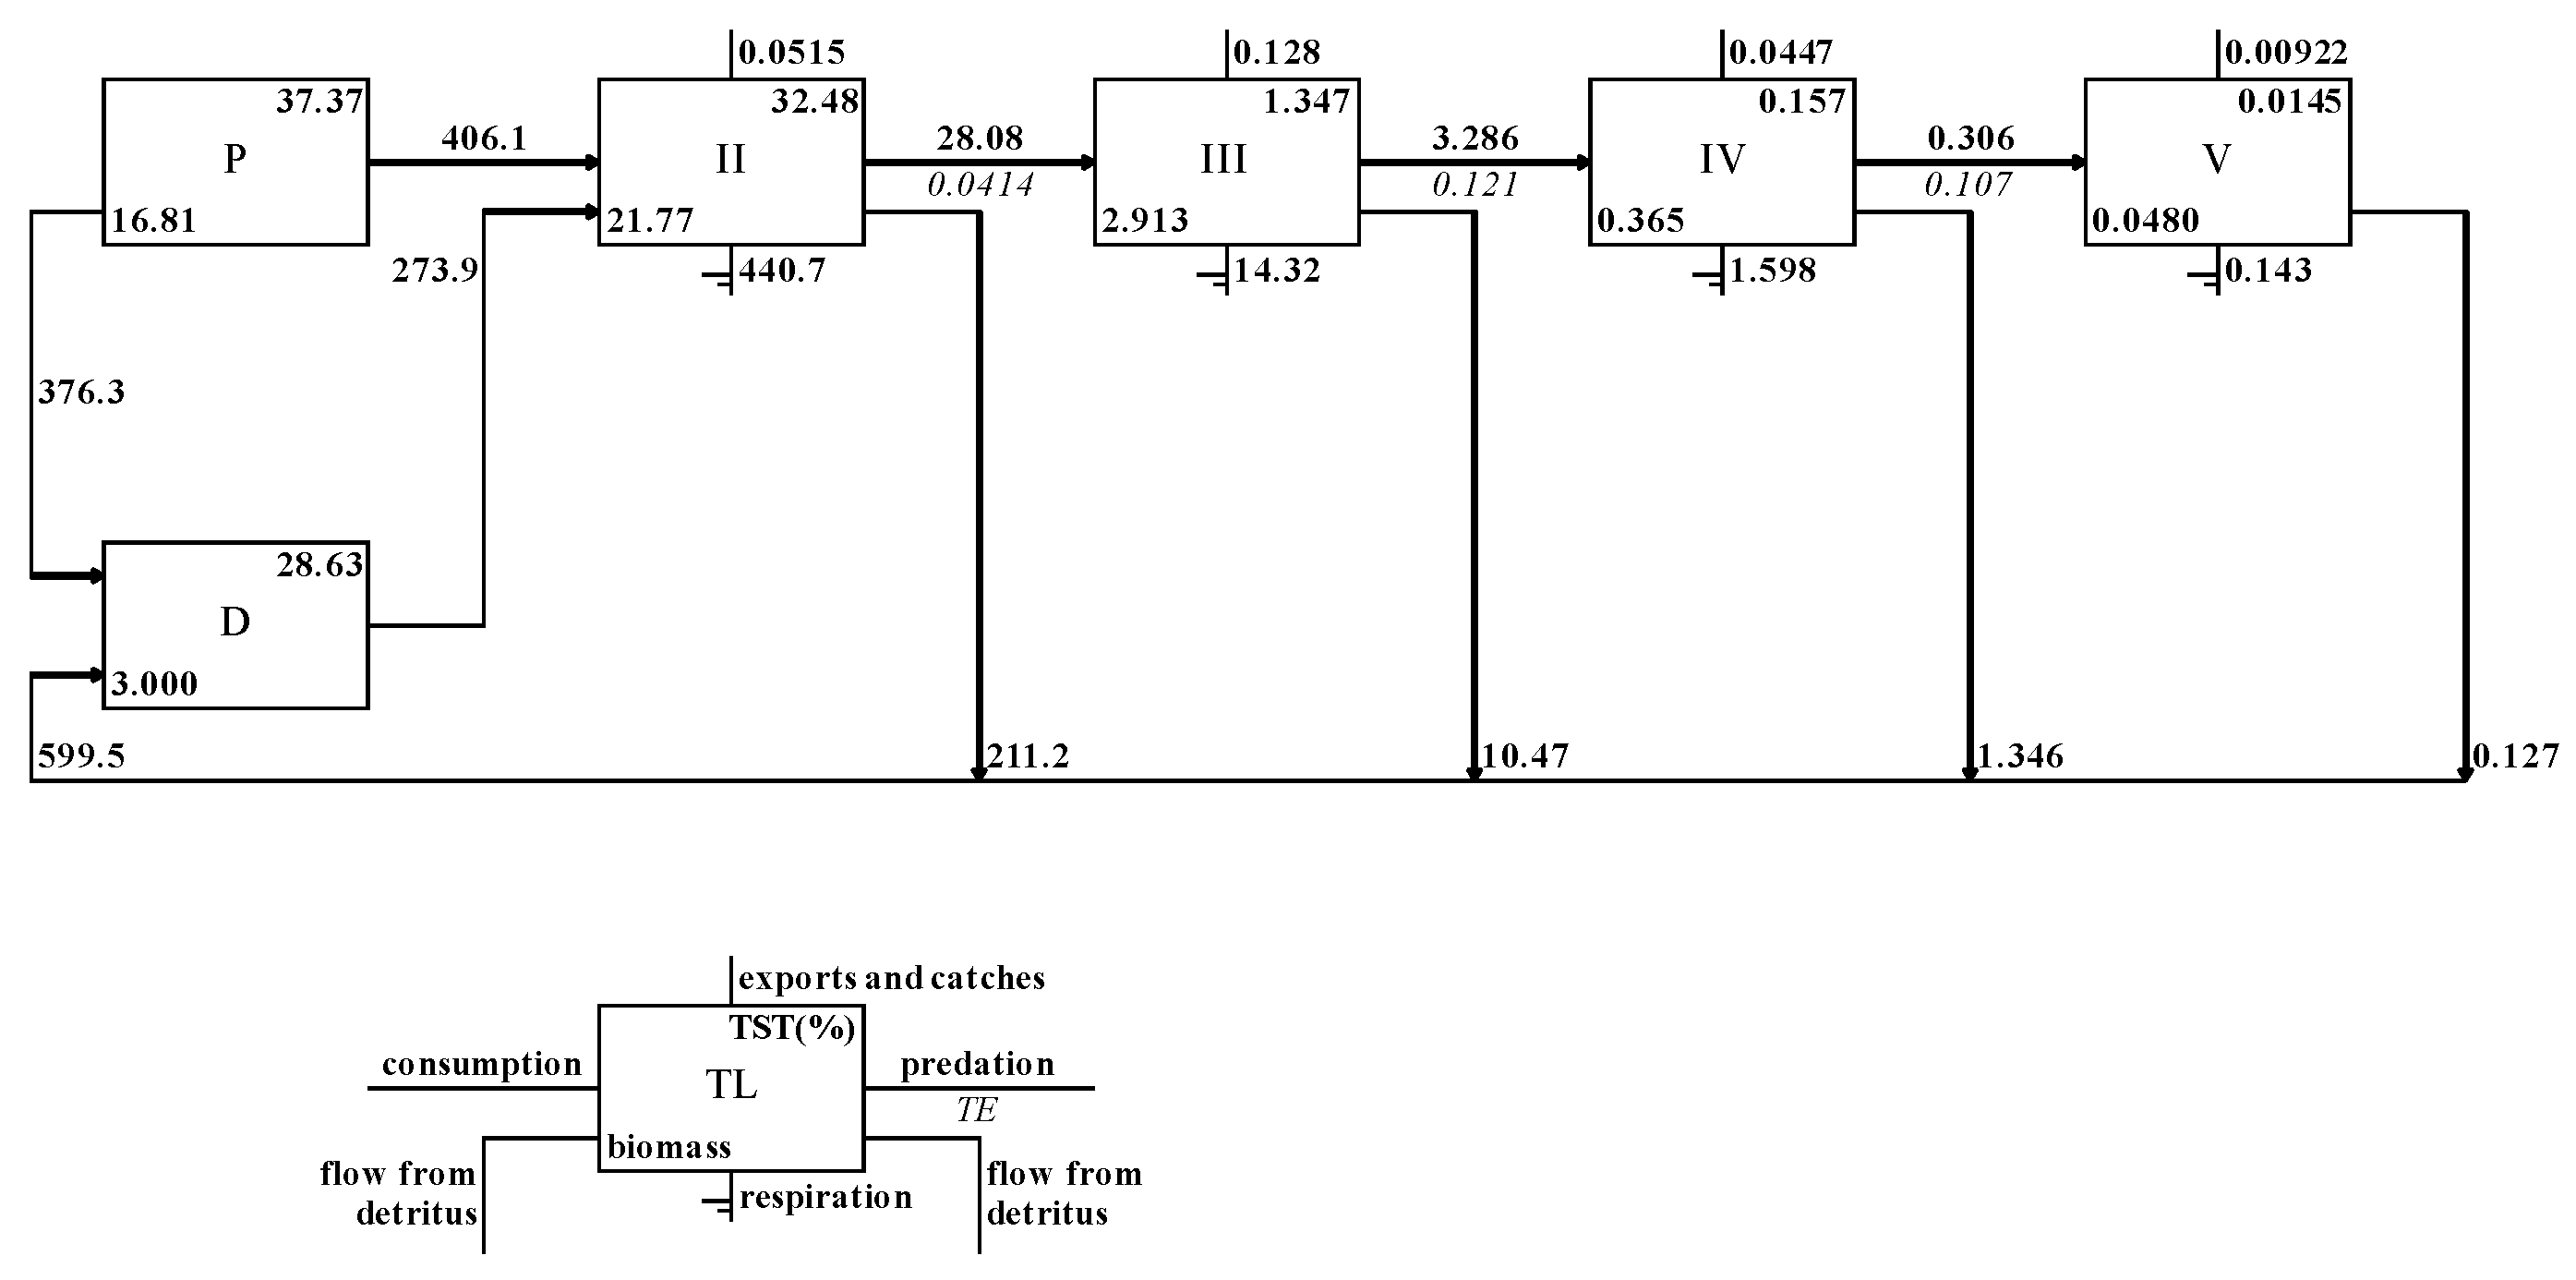
Figure 3.
Ecopath flow diagram in the waters of Zhongjieshan Islands.

Figure 4.
Mix trophic impact analysis of functional groups in the Ecopath model of the ecosystem in the waters of Zhongjieshan Islands.
Figure 4.
Mix trophic impact analysis of functional groups in the Ecopath model of the ecosystem in the waters of Zhongjieshan Islands.
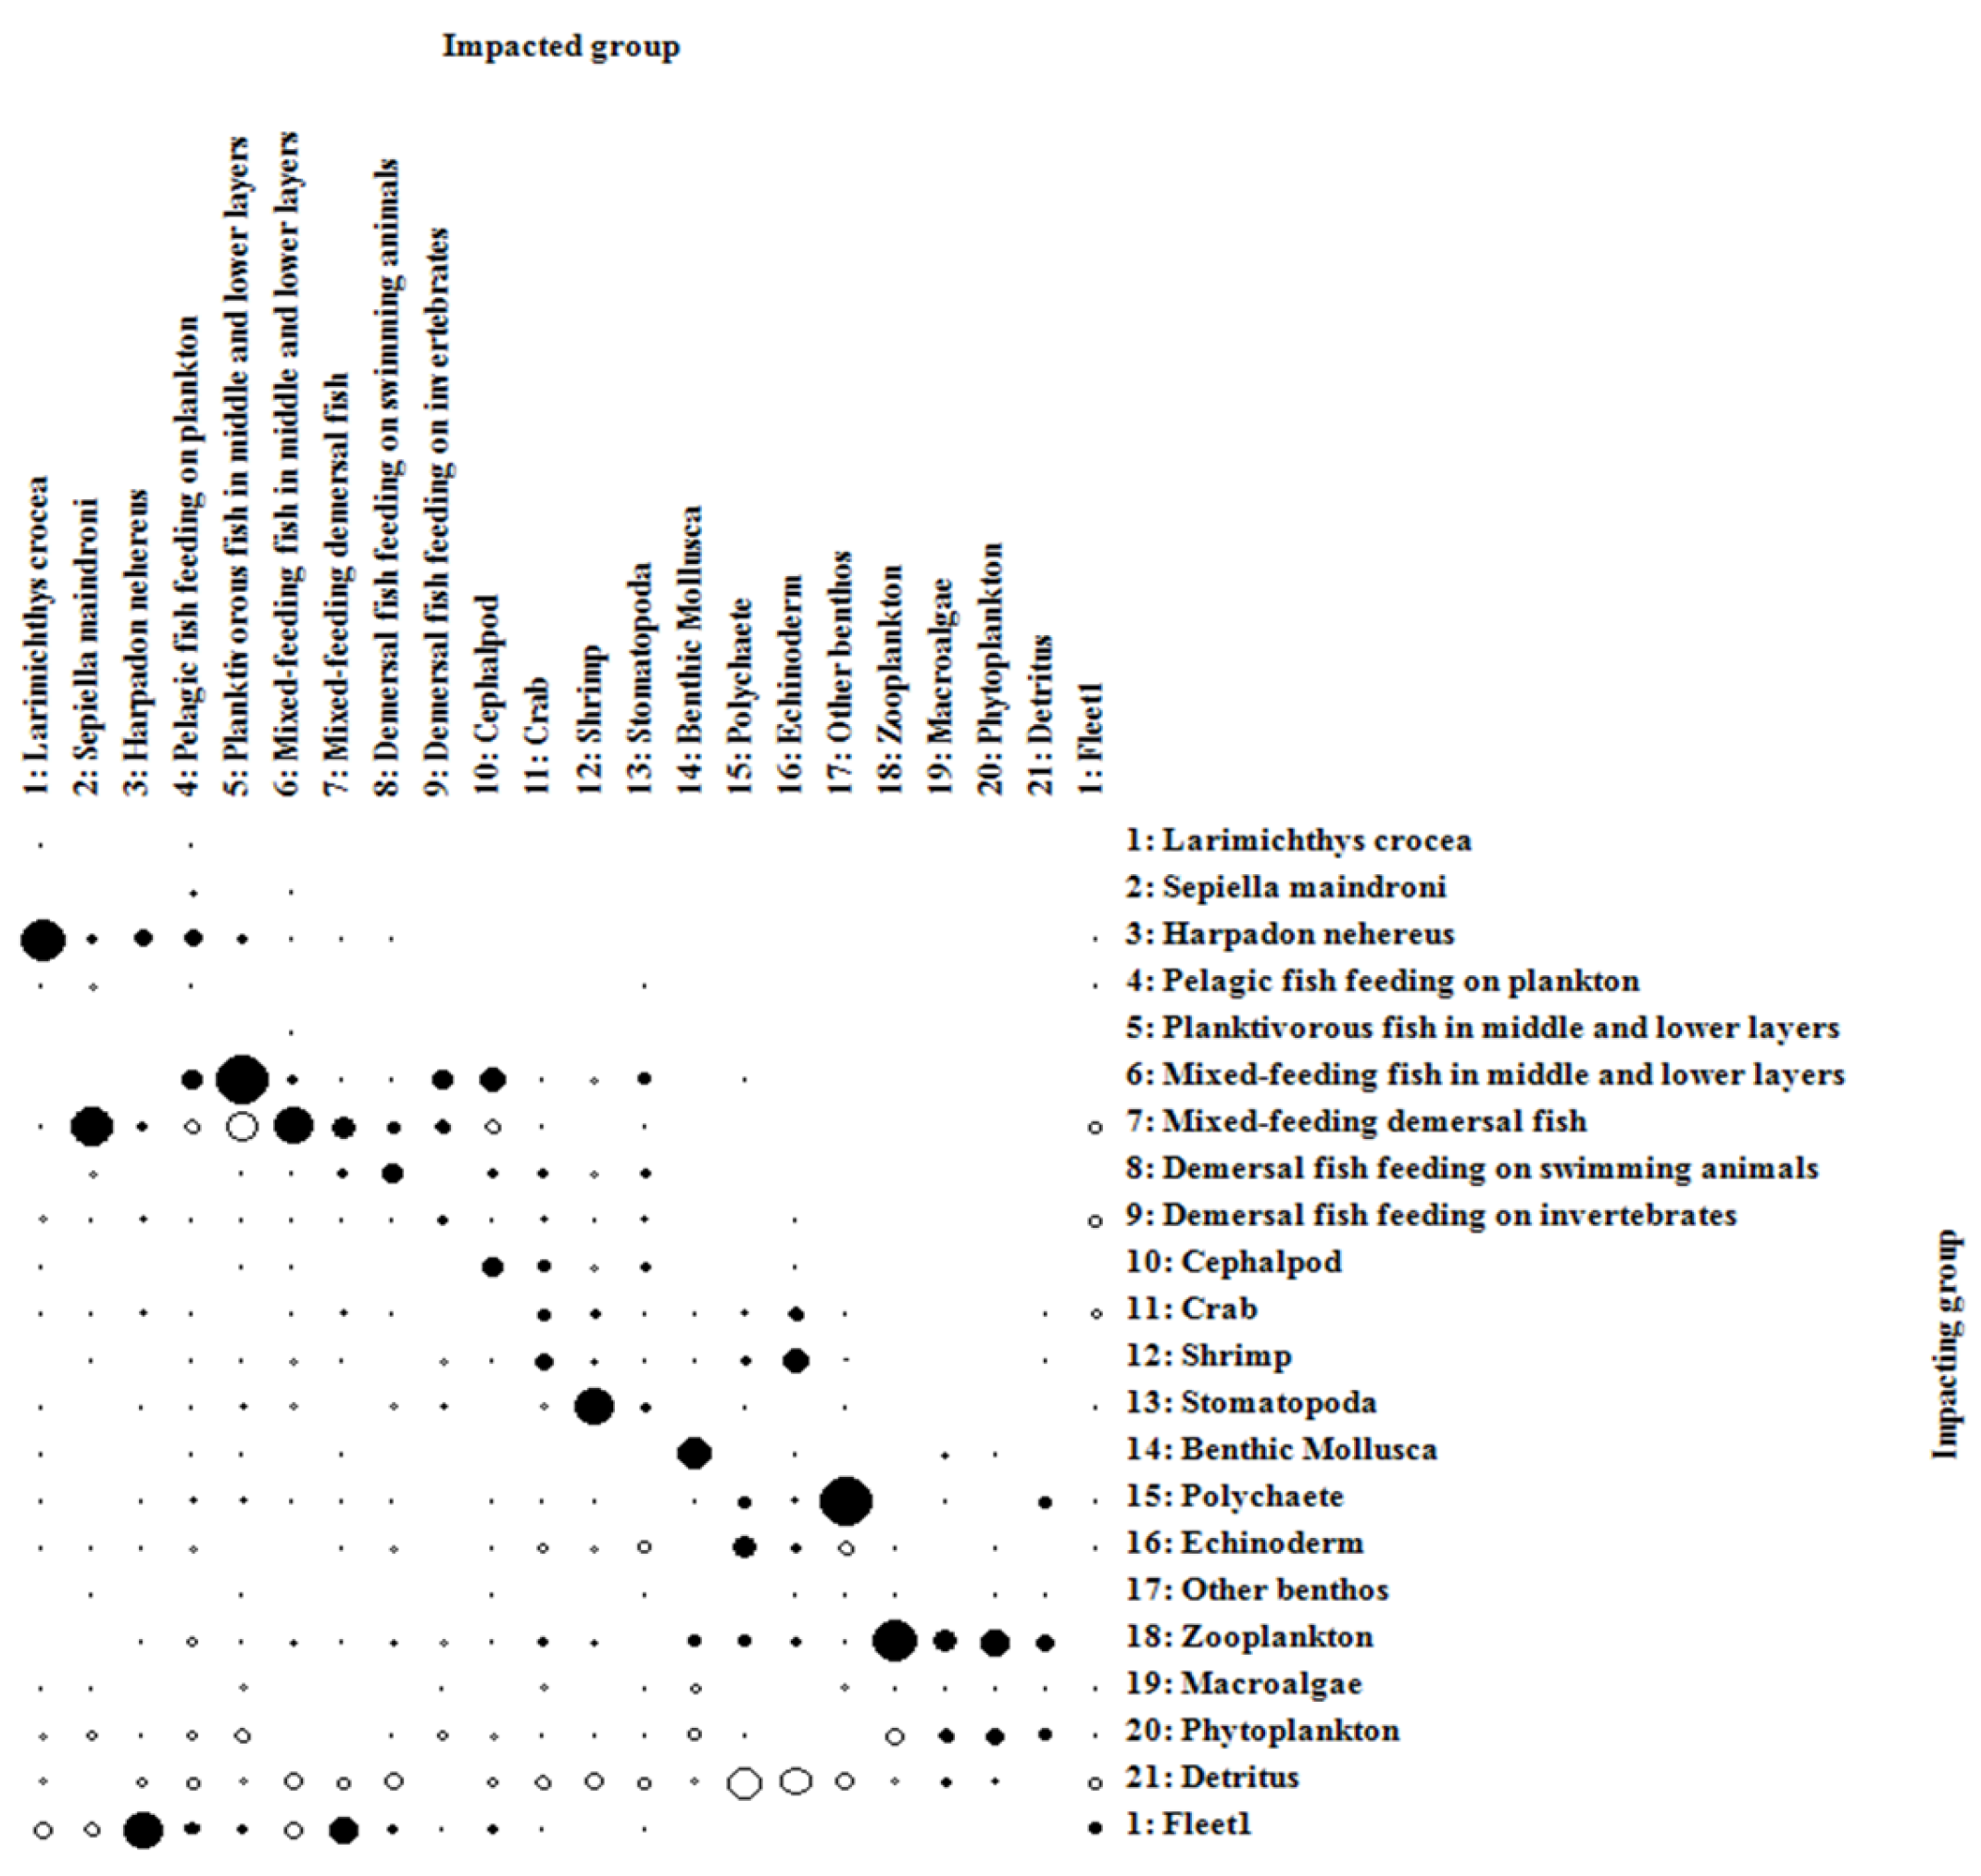

Table 1.
The primary species composition of functional groups in the Ecopath model of the waters of Zhongjieshan Islands' aquatic ecosystem.
Table 1.
The primary species composition of functional groups in the Ecopath model of the waters of Zhongjieshan Islands' aquatic ecosystem.
| NO. | Functional group | Main species |
| 1 | Larimichthys crocea | Larimichthys crocea |
| 2 | Sepiella maindroni | Sepiella maindroni |
| 3 | Harpadon nehereus | Harpadon nehereus |
| 4 | Pelagic fish feeding on plankton | Konosirus punctatus、Thryssa kammalensis、Coilia nasus、Coilia mystus、Benthosema pterotum、Engraulis japonicus、Trachurus japonicus、Acropoma japonicum、Ilisha elongata |
| 5 | Planktivorous fish in middle and lower layers | Collichthys lucidus、Setipinna taty、Larimichthys polyactis、Sphyraena pinguis、Johnius belengerii |
| 6 | Mixed-feeding fish in middle and lower layers | Sillago sihama、Pampus echinogaster |
| 7 | Mixed-feeding demersal fish | Lophiomus setigerus、Lophius litulon、Dasyatis akajei、Dasyatis laevigatus、Dasyatis bennetti、Raja porosa、Dasyatis navarrae、Arius arius、Dasyatis sinensis |
| 8 | Demersal fish feeding on swimming animals | Trichiurus japonicus、Hapaloyenys mucronatus、Conger myriaster、Psenopsis anomala、Takifugu xanthopterus、Plotosus lineatus、Johnius distinctus、Takifugu vermicularis、Sebastiscus marmoratus、Pisodonophis cancrivorus、Chrysochir aureus |
| 9 | Demersal fish feeding on invertebrates | Gobiidae、Cynoglossidae、Chelidonichthys kumu、Jaydia lineata、Lepidotrigla alata、Erisphex pottii、Lagocephalus lunaris |
| 10 | Cephalpod | Uroteuthis duvaucelii、Octopus fangsiao、Abralia multihamata、Loliolus beka、Octopus ovulum、Lusepiola birostrata、Euprymna morsei、Amphioctopus marginatus、Loliolus uyii、Octopus variabilis |
| 11 | Crab | Lauridromia dehaani、Scylla paramamosain、Charybdis acuta、Portunus trituberculatus、Charybdis bimaculata、Charybdis feriata |
| 12 | Shrimp | Palaemon gravieri、Metapenaeus ensis、Parapenaeopsis hardwickii、Trachysalambria curvirostris、Fenneropenaeus penicillatus、Solenocera crassicornis等 |
| 13 | Stomatopoda | Oratosquilla oratoria、Anchisquilla fasciata、Dictyosquilla foveolata等 |
| 14 | Benthic mollusks | Gastropod、Bivalvia |
| 15 | Polychaete | Nereidida、Lindworm |
| 16 | Echinoderm | Ophiuroidea、Echinoidea、Holothuroidea |
| 17 | Other benthos | Isopoda、Gammaridea、Mysida等 |
| 18 | Zooplankton | Copepod、Hydromedusae、Sagittidae |
| 19 | Macroalgae | Macroalgae |
| 20 | Phytoplankton | Bacillariophyta、Pyrrophyta、Cyanobacteria |
| 21 | Detritus | Detritus |
Table 2.
Output parameters from Ecopath model of the ecosystem of the waters of Zhongjieshan Islands.
Table 2.
Output parameters from Ecopath model of the ecosystem of the waters of Zhongjieshan Islands.
| No. | Functional group | Trophic level |
Biomas (t·km-2) |
P/B (a-1) |
Q/B (a-1) |
EE | P/Q |
| 1 | Larimichthys crocea | 3.48 | 0.0058 | 1.8 | 6.5 | 0.772 | 0.277 |
| 2 | Sepiella maindroni | 3.37 | 0.0052 | 3.5 | 8.5 | 0.741 | 0.412 |
| 3 | Harpadon nehereus | 3.45 | 0.26 | 2.38 | 8.1 | 0.511 | 0.294 |
| 4 | Pelagic fish feeding on plankton | 2.81 | 0.09 | 2.1 | 10.0 | 0.181 | 0.21 |
| 5 | Planktivorous fish in middle and lower layers | 2.42 | 0.034 | 2.55 | 9.05 | 0.3 | 0.282 |
| 6 | Mixed-feeding fish in middle and lower layers | 3.22 | 0.2 | 2.3 | 5.0 | 0.384 | 0.46 |
| 7 | Mixed-feeding demersal fish | 3.30 | 0.26 | 1.62 | 5.0 | 0.295 | 0.324 |
| 8 | Demersal fish feeding on swimming animals | 3.12 | 0.08 | 2.0 | 8.0 | 0.336 | 0.25 |
| 9 | Demersal fish feeding on invertebrates | 3.08 | 0.22 | 2.4 | 6.0 | 0.748 | 0.4 |
| 10 | Cephalpod | 3.10 | 0.125 | 3.1 | 8.0 | 0.518 | 0.387 |
| 11 | Crab | 2.67 | 0.69 | 3.7 | 12.0 | 0.13 | 0.308 |
| 12 | Shrimp | 2.65 | 0.44 | 8.9 | 30.0 | 0.406 | 0.297 |
| 13 | Stomatopoda | 2.91 | 0.57 | 3.2 | 11.0 | 0.295 | 0.291 |
| 14 | Benthic Mollusca | 2.11 | 6.72 | 2.8 | 7.0 | 0.328 | 0.4 |
| 15 | Polychaete | 2.04 | 3.148 | 6.73 | 23.35 | 0.31 | 0.288 |
| 16 | Echinoderm | 2.14 | 6.679 | 1.2 | 3.7 | 0.769 | 0.342 |
| 17 | Other benthos | 2.12 | 2.81 | 1.7 | 8.6 | 0.93 | 0.198 |
| 18 | Zooplankton | 2.05 | 3.0 | 25.0 | 180.0 | 0.495 | 0.139 |
| 19 | Macroalgae | 1.00 | 13.0 | 7.5 | - | 0.755 | - |
| 20 | Phytoplankton | 1.00 | 3.805 | 180.0 | - | 0.486 | - |
| 21 | Detritus | 1.00 | 3.0 | - | - | 0.457 | - |
Note : ' - ' means that there is no corresponding input value.
Table 3.
Nutritional conversion efficiency between trophic levels of the marine ecosystem of Zhongjieshan Islands.
Table 3.
Nutritional conversion efficiency between trophic levels of the marine ecosystem of Zhongjieshan Islands.
| Source | Trophic level | ||||
| Ⅰ | Ⅱ | Ⅲ | Ⅳ | Ⅴ | |
| Producer | - | 2.81 | 13.04 | 10.4 | 11.49 |
| Detritus | - | 6.10 | 11.46 | 10.86 | 11.23 |
| All flows | - | 4.13 | 12.11 | 10.66 | 11.34 |
| Proportion of total flow originating from detritus: 0.43 | |||||
| Transfer efficiencies | |||||
| From primary producers: 7.25% | |||||
| From detritus: 9.12% | |||||
| Total: 8.11%lar | |||||
Table 4.
Effects of increased biomass of Larimichthys crocea on nutritional efficiency of demersal fishes feeding on invertebrates.
Table 4.
Effects of increased biomass of Larimichthys crocea on nutritional efficiency of demersal fishes feeding on invertebrates.
| Biomass multiples | Biomass (t/km2) | Biomass of demersal fishes feeding on invertebrates(t/km2) | EE of demersal fish feeding on invertebrates |
| 1 | 0.0058 | 0.22 | 0.748 |
| 30 | 0.174 | 0.22 | 0.935 |
| 35 | 0.203 | 0.22 | 0.967 |
| 40 | 0.232 | 0.22 | 0.999 |
| 40.1 | 0.2325 | 0.22 | 1.00 |
| 40.5 | 0.2349 | 0.22 | 1.002 |
Table 5.
Effects of increased biomass of Sepiella maindroni on nutritional efficiency of demersal fishes feeding on invertebrates.
Table 5.
Effects of increased biomass of Sepiella maindroni on nutritional efficiency of demersal fishes feeding on invertebrates.
| Biomass multiples | Biomass(t/km2) | Biomass of demersal fishes feeding on invertebrates(t/km2) | EE of demersal fish feeding on invertebrates |
| 1 | 0.0052 | 0.22 | 0.748 |
| 10 | 0.052 | 0.22 | 0.824 |
| 30 | 0.1248 | 0.22 | 0.941 |
| 31 | 0.1279 | 0.22 | 0.946 |
| 31.1 | 0.1617 | 0.22 | 1.00 |
| 32 | 0.1289 | 0.22 | 1.008 |
Table 7.
Ecosystem characteristic parameters of Larimichthys crocea and Sepiella maindroni before and when they reached ecological carrying capacity in the waters of Zhongjieshan Islands.
Table 7.
Ecosystem characteristic parameters of Larimichthys crocea and Sepiella maindroni before and when they reached ecological carrying capacity in the waters of Zhongjieshan Islands.
| Parameters | Current values | Values of Larimichthys crocea under carrying capacity | Values of Sepiella maindroni under carrying capacity |
| Sum of all consumption (SC)/ [t/(km2·a)] | 743.93 | 745.408 | 745.265 |
| Sum of all exports (SEX)/ [t/(km2·a)] | 325.77 | 324.999 | 324.987 |
| Sum of all respiratory flows (TR)/ [t/(km2·a)] | 456.789 | 457.559 | 457.571 |
| Sum of all flows into detritus (TDET)/ [t/(km2·a)] | 599.412 | 598.642 | 598.63 |
| Total system throughput (T)/ [t/(km2·a)] | 2125.905 | 2126.608 | 2126.453 |
| Calculated total net primary production (NPP)/ [t/(km2·a)] | 782.4 | 782.4 | 782.4 |
| Total primary production /total respiration (TPP/TR) | 1.713 | 1.71 | 1.71 |
| Net system production (NSP)/ [t/(km2·a)] | 325.611 | 324.841 | 324.829 |
| Total biomass (excluding detritus, TB)/ [t/(km2·a)] | 41.908 | 42.135 | 42.064 |
| Total primary production/Total biomass (TPP/TB) | 18.669 | 18.569 | 18.6 |
| Total biomass/total throughput (TB/T) | 0.02 | 0.02 | 0.02 |
| Mean trophic level of the catch (TL) | 3.123 | 3.123 | 3.123 |
| Connectance Index (CI) | 0.454 | 0.454 | 0.454 |
| System Omnivory Index (SOI) | 0.241 | 0.243 | 0.25 |
| Finn’s Cycling Index (FCI) | 8.24 | 8.216 | 8.217 |
| Finn’s mean path length (MPL) | 2.717 | 2.718 | 2.717 |
Disclaimer/Publisher’s Note: The statements, opinions and data contained in all publications are solely those of the individual author(s) and contributor(s) and not of MDPI and/or the editor(s). MDPI and/or the editor(s) disclaim responsibility for any injury to people or property resulting from any ideas, methods, instructions or products referred to in the content. |
© 2024 by the authors. Licensee MDPI, Basel, Switzerland. This article is an open access article distributed under the terms and conditions of the Creative Commons Attribution (CC BY) license (http://creativecommons.org/licenses/by/4.0/).
Copyright: This open access article is published under a Creative Commons CC BY 4.0 license, which permit the free download, distribution, and reuse, provided that the author and preprint are cited in any reuse.


