
Submitted:
31 December 2025
Posted:
01 January 2026
You are already at the latest version
Abstract
This study investigated the degradation and contamination behavior of 41 real-world operational Marine Diesel Fuel samples, conforming to ELOT ISO 8217:2024 (DFA category). Samples were sourced directly from land-based supply tanks. To assess fuel degradation, a comprehensive suite of parameters was evaluated, including fuel characteristics such as viscosity and density. Inductively Coupled Plasma Optical Emission Spectrometry (ICP-OES) was employed for elemental analysis to determine the content of wear and other metallic contaminants. Elevated concentrations of various metals were detected, suggesting potential leaching from system components within the storage infrastructure. Notable elemental concentrations included Iron (Fe up to 1.38 mg/kg), Copper (Cu up to 0.401 mg/kg), Lead (Pb up to 0.358 mg/kg), Aluminum (Al up to 0.218 mg/kg), Zinc (Zn up to 1.331 mg/kg), Nickel (Ni up to 0.172 mg/kg), Calcium (Ca up to 8.054 mg/kg), Sodium (Na up to 0.332 mg/kg), Phosphorous (P up to 0.602 mg/kg), and Silicon (Si up to 8.249 mg/kg). The presence of these contaminants in marine fuels, if bunkered, poses a significant risk of impaired engine performance, including injector fouling and ash formation. Critically, this study suggests that FAME content is not the primary driver of the observed oxidation and subsequent metallic degradation.
Keywords:
marine diesel fuel
; wear metals
; FAME
; viscosity
1. Introduction
Nowadays Marine diesel fuel categories DMA, DFZ and DFB according to ELOT ISO 8216-1:2024 [1], are used in global shipping, has being blended with Fatty Acid Methyl Esters (FAMEs) in order to encourage sustainability and to reduce emissions. Although FAME has benefits for environment, its integration into conventional marine diesel systems introduces a range of challenges, particularly technical challenges, regarding the degradation of fuel, corrosion of metallic infrastructure, and problems due to contamination during the storage and the use. All the above-mentioned issues may be explained by the chemical reactivity of components of biodiesel, due to its oxygenated composition, its unsaturated components as unsaturated esters, and its tendency to become oxidized and hydrolyzed. However, the FAME content should not be invariably considered a sufficient indicator, or proxy, for assessing the presence of elements within the fuel that signify degradation or decomposition.
The current study examined forty-one (41) operational marine diesel samples containing FAME, up to 7% v/v, coming from land-based supply tanks. A detailed physicochemical evaluation was conducted, including organoleptic properties such as color and odor, but also crucial fuel characteristics such as density, viscosity, water content, flash point, sulfur content, cetane index, and distillation curve characteristics. Simultaneously, an Elemental composition was executed through an Inductively Coupled Plasma Optical Emission Spectrometry (ICP-OES), highlighting elevated concentrations of contaminants such as metals: Fe (up to 1.38 mg/kg), Cu (up to 0.401 mg/kg), Pb (up to 0.358 mg/kg), Al (up to 0.218 mg/kg), Zn (up to 1.331 mg/kg), Ni (up to 0.172 mg/kg), Ca (up to 8.054 mg/kg), Na (up to 0.332 mg/kg), P (up to 0.602 mg/kg), and Si (up to 8.249 mg/kg).
The study underscores that FAME content in real-world marine diesel fuels is at concentrations reaching at (7% v/v), which is not high enough to independently cause the degradation level which was observed. Thus, since fuel degradation occurs, the observed degradation is not primarily due to the biodiesel itself, but it is contributed to external issues as environmental and operational stressors. This conclusion was supported by the team of Sterpu et al. [2]. They investigated the behavior in corrosion of different metals (copper, brass, aluminum, zinc, and stainless steel). These metals were exposed to various biodiesel-blended fuels such as from 0% biodiesel (B0) to 100% biodiesel (B100) under controlled conditions of immersion for prolonged duration up to 20 weeks (or for 3360 hours). The findings of their work demonstrated that the corrosion behavior is not analogous to FAME content, since metals which were introduced into B20–B60 biodiesel-diesel blends presented a greater corrosion than that as neat biodiesel (B100). These results indicate that the chemical interactions between biodiesel and marine diesel supports a more corrosive environment. Simultaneously, Total Acid Number (TAN) of the operational fuels was also analyzed, before and after immersion, and a significant increase of its value was observed, especially in biodiesel-blended fuels with higher biodiesel concentration. This acidic behavior is a result of oxidation processes and hydrolysis reactions, which are accelerated by the exposure to oxygen, to moisture, and to the leaching of metals. All the above mentioned encourage that the storage conditions and the environmental exposure are more crucial factors than biodiesel content alone in determining the risks of corrosion.
Environmental and Operational Factors in Fuel Deterioration such as temperature, humidity, and the exposure to oxygen are critical factors to the degradation of biodiesel-diesel blends. Engeländer et al. team revealed that a long-term biodiesel storage at temperatures of (40 °C) drove to a decrease in oxidation stability, an increased density, and the formation of oxidation byproducts and polymerized esters [3]. These changes in diesel composition can cause filter clogging, deposits, and other performance problems in engine. The study highlighted that additives use can improve oxidation stability, but their effectiveness is dependent on the composition of fuel and the conditions of storage, encouraging the statement that external factors are more influential than FAME content by itself.
Similarly, Saltas et al. revealed that biodiesel aging drives to the formation of deposits in common rail fuel injection systems [4]. Specifically, when metal leaching occurs oxidative compounds are present. These deposits can lead to the deterioration of flow, to issues concerning engine performance, and wear, when FAME content is with the existence of poor practices in storage.
The team of Vergara-Juarez et al. investigated the aluminum electrochemical behavior in biodiesel environments under non-oxygen conditions [5]. The team recorded that the chemical composition of esters specifically the degree of unsaturation in esters influences the mechanisms of corrosion. Regarding the mass loss assays the study investigated that saturated Methyl Stearate generated the highest rate of corrosion, while the incorporation of unsaturated esters such as Methyl Oleate and Methyl Linoleate showed a reduction of corrosion due to the degradation products’ volatility and the protective surface layers formation. The findings of that study highlight that low FAME concentration and specifically, the existence of unsaturated esters influences the corrosion processes, underscoring the importance of ester chemical composition not only for its oxidation stability of biodiesel but also for its compatibility with metallic components of infrastructure.
The role of metal leaching in fuel degradation was documented in Bibliography. The interactions between biodiesel and metallic components in infrastructure during the storage period can drive to leaching of metal ions into the fuel. The contaminants which are metals, can function as catalysts for oxidation processes, promoting the degradation of fuel and reducing the performance of engine. This aligns with the findings, which supported that the aging of biodiesel drives to the formation of deposits in common rail fuel injection systems, when metal leaching and oxidized compounds are present [4]. In the present study this phenomenon was revealed, where ICP-OES analysis showed elevated levels of metals such as Ferous (Fe), Copper (Cu), Lead (Pb), Aluminum (Al) and Zinc (Zn).
The team of Norouzi et al. examined the influence of temperature, dissolved oxygen, and water content on the corrosion of aluminum and copper in diesel-type fuels [6]. The team recorded that water content which is absorbed is a crucial parameter for promoting corrosion processes through accelerating the degradation processes of biodiesel blends and increasing at the same time the acidity. It is worth underscoring that the consequences were detrimental when water and oxygen were simultaneously present. As well as the oxygen-free environments indicated a lower corrosion rate. Also, metal like copper has shown a higher tendency to attack in comparison to aluminum. This may be justified by the strong copper catalytic activity in processes concerning oxidation of biodiesel. Contrary to aluminum which is more protected by its passive films. The findings of the work underscore the significance of protocols to control the moisture content and oxygen concentration during the fuel storage, handling and transportation in order to eliminate the corrosion processes of engine components.
The team of Heryana et al. examined material compatibility factors. Specifically, the effects of corrosion in diesel-biodiesel blends and in diesel-biodiesel-HVO blends on various metals used in fuel storage systems [7]. Particularly, their findings shown that stainless steel (SS 304) and carbon steel (SA 516) were susceptible to surface degradation after immersion in biodiesel-blended fuels. As well as instrumental analysis which was done by Scanning Electron Microscope (SEM) and Energy Dispersive Spectroscopy (EDS) analysis verified that the presence of localized pitting and oxide layers revealed that prolonged exposure leads to an accelerated deterioration of surface. Thus, this statement underscores the significance of material compatibility and controlled storage conditions.
Another significant risk as described in the literature is Microbiologically Influenced Corrosion (MIC). Specifically, microbial contamination sets risks towards diesel fuels which contain a biodiesel content, such as marine fuel which contains 7% v/v biodiesel. As referred to in literature, Kuna et.al. explained that the storage tanks which contain biodiesel-diesel blended fuels are favourable conditions for MIC growth [8] but this is not a rule as explained by Kalligeros et al. [9]. Specifically, the microbial growth is benefitted at the fuel–water interface since microorganisms are feeder with water and hydrocarbons. The procedure has to do with the biofilms formed producing their metabolic products such as organic acids and other corrosive compounds, creating localized aggressive environments, promoting corrosion processes of the walls of the carbon steel tank. The FAME’s hygroscopicity is another crucial parameter since it increases the retention of water into the fuel composition and accelerates microbial growth. This is in alignment with the findings of Komariah et al., specifically the team shown that neat biodiesel (B100) promoted the rate of corrosion processes in the material of storage infrastructure since its chemical composition [10]. Neat biodiesel includes a high-water content, being susceptible to oxidation, and to the formation of acids. This study underscores that the corrosion is dependent on the tank material such as carbon steel versus stainless steel and towards the environment of storage, the exhibition towards moisture, air, and temperature variations (increases and decreases). However, this paper does not contribute the corrosion processes to microbial growth, although it gives attention to the physicochemical degradation procedures.
In the work of Papavinasam et al., it was recorded that the causes of degradation were because of the entry of air during storage containing moisture and due to the contamination of fuel with water during the processes of transportation [11]. The water accumulation promotes microbial proliferation, driving to MIC, since biodiesels have a biological origin and a higher potential for supporting microbial proliferation compared to mineral fuels as fossil-based diesels.
Sediment formation is another crucial parameter investigated during FAME storage conditions, influencing the fuel quality and engine behavior. As referred in literature, sediments formed by the crystallization of heavyweight chemical compounds including in biodiesel, precipitating in cold environments such as monoacylglycerols and sterol glycosides [12]. These substances become solid causing the clogging of filters, fouling of fuel injectors, and formation of deposits in engine walls. These sediments themselves are not identified as corrosion promoters, but other types of deposits in FAME chemical composition, as products from microbial action such as organic acids and hydrogen sulfide could accelerate corrosion processes on metals.
A similar finding was recorded from Sultanbekov et.al. who examined the formation of sediment in storage tanks for petroleum products and the team underscored that the formed sediment at the bottom of tanks accelerated the environmental corrosion, promoting the degradation of the walls of the steel tanks [13]. The team supported that the deposits attribute to a type of corrosion as localized, known as pitting, difficult type to detect, decreasing the service life of the tank. The current study does not address biodiesel and does not determine the galvanic cells formation. This before-mentioned finding is in compliance with the formation of sediment and a discoloration happened during biodiesel storage in tanks from carbon steel and galvanized steel recommending that the contamination is related with the oxidation products and the interactions of metallic compounds [10].
Beyond the storage systems, the degradation of engine components is influenced more by operational conditions than FAME content. In bibliography, a variety of metals were studied such as aluminum, copper, and iron alloys. A comprehensive study on the corrosion of diesel engine components exposed to biodiesel-based fuels highlighted that biodiesel exposure leads to increased wear and surface degradation, especially for aluminum and copper-based alloys [14]. These consequences are not only because of the chemical composition of biodiesel but are also affected by its aging, its exposure to oxygen, and the byproducts such as free fatty acids that are generated through oxidation. The authors revealed that factors such as oxidation stability, additive formulation, and the compatibility of biodiesel with material play a significant role, determining in turn the extent of corrosion in engine systems. Another study shown that while biodiesel can influence corrosion, the primary drivers are environmental and operational conditions, temperature, humidity, and exposure to oxygen [15]. All these findings support the conclusion that material compatibility and storage conditions are more critical than FAME content alone.
The Influence of Blended fuels and the Environmental Exposure was further examined by Simbi et al. who recorded that the blending of biodiesel with petroleum-based fuels changes the elemental composition and moisture content, affecting the tendency for corrosion and storage stability [16]. The findings of the study recommend that biodiesel-petrol blends may present different degradation behaviors which depend on the ratio of blending and the environmental conditions. This reinforces more the conclusion that external conditions play a significant role rather than FAME content alone, influencing fuel degradation.
The thermal and UV-Induced Degradation of fuels was studied in bibliography. Environmental factors such as the exposure to elevated temperatures and UV light are exacerbating the chemical and physical instability of biodiesel. FAME succumbs to increasing degradation under the above-mentioned conditions, increasing the acid value, the viscosity, and the deposits’ formation [17]. The changes of physicochemical parameters not only influence the performance of engine but also contribute to the sludge and varnish formation in engine fuel systems, despite the FAME concentration. Studies underscored the necessity of additive formulation and fuel stabilization in tanks, mitigating the degradation level and the risks for corrosion, significantly improving the long-term storage stability of biodiesel and lessening the corrosive effects of biodiesel on metallic surfaces [18].
Overall, the present study verifies that the degradation and contamination of DMF blended with FAME are not primarily driven by the biodiesel concentration itself, but rather by a combination of factors such as environmental factors, condition of storage, and material compatibility. The presence of elevated levels of contaminants such as metallic components, microbial growth, and thermal degradation contribute to the fuel quality deterioration and poor infrastructure integrity.
The present work examined the physicochemical degradation and the elemental contamination of marine diesel DFA category comes from land-based supply tanks, utilizing comprehensive fuel analysis and ICP-OES instrumental analysis. It underscored the necessity for continuous monitoring, the continuous evaluation of infrastructure compatibility, and standardized protocols for storage in order to confirm the safety and efficiency utilization of biodiesel-blended diesel fuels in marine sector. Future research should target on enhancing the protocols of storage, enhancing microbial control, and developing corrosion-resistant materials and being tailored for biodiesel-blended diesel fuels.
2. Materials and Methods
2.1. Collection of Samples and Preparation Process
Forty-one (41) operational marine diesel fuel samples, known as DMF, as specified into the International Standards ELOT ISO 8216-1:2024 [1] and ELOT ISO 8217:2024 [19,20] with up to 7% v/v FAME [21], were collected from land supply tanks that were used for bunkering operations. The ELOT EN ISO 3170 [22] sampling procedures were followed. All the samples had a code (Sample Code) which was followed for traceability issues for all over the analysis. The samples were filtered in order to remove dust, particulate matters in alignment with the protocols of ASTM D4057 [23]. After homogenizing and filtering, the samples were stored in sealed bottles of glass at environmental temperature of 20°C, avoiding the light and the possibility of degradation or any kind of contamination from microbes during the period of experiments.
2.2. Density
Density is a crucial parameter for the assessment of fuel quality. This key parameter affects the energy content, the efficiency of combustion and the compatibility with engine fuel system circulation. The density of marine fuel samples was studied at a standard temperature of 15°C in accordance with the standard ELOT EN ISO 12185 [24]. The Measurements were conducted with a digital density meter instrument. Firstly, the density meter was calibrated with air and then with distilled water, used as a costless reference standard. The Density values were given in kilograms per cubic meter (kg/m³) as unit. The readings of the density meter were executed in double in order to verify the findings for every sample. The final reading recorded was on average.
2.3. Elemental Analysis of Fuel Composition via ICP-OES
Inductively Coupled Plasma Optical Emission Spectrometry (ICP-OES) was used to define the content of metals into the marine samples. Crucial metals and impurities were investigated through the elemental profile of the fuel samples in order to examine how these contaminants may influence the chemical stability of fuel, the combustion in engine, and the rate of corrosion processes. An instrumental analysis was done using ICP-OES. Specifically a multi-element analysis was executed for each sample, including the following elements were measured: Aluminum (Al), Calcium (Ca), Chromium (Cr), Copper (Cu), Iron (Fe), Magnesium (Mg), Sodium (Na), nickel (Ni), Phosphorus (P), Lead (Pb), Silicon (Si), Tin (Sn), Vanadium (V), Zinc (Zn), Barium (Ba), Lithium (Li), Manganese (Mn), Molybdenum (Mo), Potassium (K), Silver (Ag), and Titanium (Ti). Through the measurement, calibration curves were done for quality control, using blanks and Certified Reference Materials (CRMs) [25,26].
2.4. Determination of Water Content
The concentration of water of every marine sample was measured according to the ELOT EN ISO 12937 [27]. This measurement was conducted using the Karl Fischer titration method (volumetric). The Karl Fischer titration method is a method with high accuracy determining amounts of water even in traces in hydrocarbon composition. This method is based on the reaction of water with the Karl Fischer reagent, which includes in methanol the following components: iodine, sulfur dioxide, and pyridine/base, under the total absence of water. All the measurement values were in milligrams per kilogram (mg/kg). During the measurement of water content, the use of CRMs and system calibration checks were executed in order to verify the Quality control. According to the International Standard ELOT ISO 8217 [19], the maximum threshold which is allowable in marine diesel fuels is 200 mg/kg.
2.5. Flash Point Determination
The Pensky-Martens closed cup method was used for the flash point measurement. The process used was in alignment with ELOT EN ISO 3679 [28]. The flash point measurement is a key parameter for safety during storage conditions, handling, transportation and adulteration of fuel. This test method determines the lowest temperature where the vapors of fuel ignite momentarily, when the fuel sample is, under specific conditions, exposed to flame. Double measurements were carried out, and the final values were on average of recorded readings. According to the International Standard ELOT ISO 8217 [19], the minimum limit value, allowable in marine diesel fuels, is 60°C.
2.6. Viscosity Measurement
Viscosity is classified into two types of kinematic and dynamic viscosity. Viscosity is a key parameter for marine diesel fuel influencing the atomization of fuel, the lubrication of injectors, and the whole fuel performance during the combustion in marine diesel engines. Kinematic viscosity was studied at 40°C using a capillary viscometer and the process was in alignment with ELOT EN ISO 3104 [29]. The method records the time in order to a fixed volume of fuel flow via a calibrated glass capillary under gravity. The viscosity values were recorded in centistokes (cSt). According to International Standard ELOT ISO 8217 [19] the acceptable range is between 2.0 and 6.0 cSt.
2.7. Cetane Index Measurement
The cetane index is a calculated index and it is an indirect measure of ignition delay and the smoothness of combustion in diesel engines. The minimum limit of cetane index for marine distillate fuels, as determined by ELOT ISO 8217 [19], is 46. The higher values are related to shorter ignition delays, showing an improved engine performance at low temperatures, and low level of emissions. Regarding the test method ISO 4264 [30] as defined in ELOT ISO 8217 [19], a four-variable formula was used to assess the ignition quality of diesel fuels. The measured value of cetane index was calculated using the density at 15°C and the characteristics of the distillation curve, specifically the recovering temperatures, at which percentages of 10% v/v (T10), 50% v/v (T50), and 90% v/v (T90) of the marine fuel are vaporized, condensed and recovered.
2.8. Determination of Distillation Curve Characteristics
The profile of distillation curve gives information about the volatility of fuel, the behavior of fuel at low temperatures, cold-start behavior, the completion of combustion, and the possibility of the formation of residue and soot. The characteristics of the distillation curve of marine samples were studied in alignment with the test method ELOT EN ISO 3104 [29] via an automatic distillation analysis. Specifically, the temperature, at which percentages of volume of the fuel are vaporized, condensed and recovered, are recorded: T10, T50, T90, T95 are the temperatures where 10% v/v, 50%v/v, 90%v/v, and 95%v/v of the marine fuel sample is recovered. Also, the recovery at 250°C and 350°C were reported, as the percentage of volume of the fuel has been distilled at the corresponding temperatures. ELOT ISO 8217 [19] specifications determine that the distillate at 250°C must be less than 65% v/v, the distillation percentage at 350°C must exceed 85% v/v and the temperature of the recovered 95% v/v (T95) must not exceed 360°C.The data gathered in the present study were from automated distillation analyzers equipped with sensors for temperature and the analyzers are tested with certified reference marine fuels.
2.9. Samples Assessment via Organoleptic and Macroscopic Properties
These key properties are the preliminary indications of fuel chemical deterioration, adulteration and contamination from microbes. Inspection of all samples was carried out, especially for color, odor, phase separation and sediment formation.
2.10. Content Analysis of Fatty Acid Methyl Esters
FAME concentration in marine diesel fuels influences the fuel oxidation stability, hygroscopicity, flow properties at low temperatures, and the corrosion rate. In alignment with the test method ELOT EN 14078 [31], the concentration of FAME on volume basis in marine diesel fuel sample was measured using instrumental analysis, specifically Fourier Transform Infrared (FTIR) spectroscopy. The method determines the absorption band of the ester carbonyl group (C=O) which is approximately at 1745 cm⁻¹. This group defines the quantity of biodiesel content in biodiesel- diesel blends. The calibration was executed via standards with known FAME content covering the range of 0 to 10% v/v.
2.11. Data Analysis and Quality Assurance
The analysis data of the present study was done in double for repeatability and reproducibility issues of the used methods, and the average value was presented.
2.12. Viscosity Model
The viscosity of the mixture was modeled using a nonlinear exponential function of the form:
where y is the viscosity, α is scaling coefficient, and f(composition) is a linear combination of the concentrations of the constituent elements:
y=α.f(composition)),
f(composition)=b_1 x_1+b_2 x_2+⋯+b_1 x_1,
A logarithmic transformation was applied to linearize the model, simplifying parameter estimation. This approach allows the prediction of viscosity for different compositions within the studied concentration ranges.
3. Results
3.1. Evaluation of Marine Fuel Quality
The quality of marine diesel fuel is critical for the performance of engine, the safety during operation, and being compliant with environment. In the present study a comprehensive examination of 41 operational real-world marine diesel-biodiesel blended fuel was conducted. Specifically, DFA blends containing 7% v/v biodiesel, 93% v/v diesel were collected from various storage tanks, bunkering stations, and emergency reservoirs across Greece. The analysis of tested samples was done according to the International European, National (Hellenic) and ASTM standard documents including distillation characteristics (ELOT EN ISO 3104), content of water (ELOT EN ISO 12937), density and viscosity was also measured, and elemental analysis of samples via ICP-OES analysis, and macroscopic checking. The results are evaluated following the International and National Standard EN ISO 8217:2024 for marine distillate and residual fuels.
The aim of the present study is to find a way to quickly identify possible contamination, to assess the stability of fuel, and to evaluate the influence of prolonged storage on fuel quality. The findings revealed a variability in fuel quality behavior, especially with two samples indicating water ingress, potential microbial activity, metal contamination even in traces, and oxidative degradation as shown through physical and chemical properties. All the above-mentioned can affect engine performance and the completeness of combustion.
The macroscopic examination of marine fuels revealed that most samples were clear and with a color from yellow to orange, showing a satisfying initial fuel quality. An exception was the sample 38, since sediment formation was visible into it, confirming advanced degradation. The macroscopic presentation of the samples is depicted in Figure 1 and the sample 10 which had a high concentration of moisture losing its bright and clear appearance.
The dataset from the present study records a range of physical and chemical properties which are critical parameters in order to evaluate the quality of marine fuels and their compliance of petroleum distillates, like marine diesel according to relevant International standard specifications.
3.2. Density as a Parameter for Fuel Performance
Density is a critical property influencing the performance of engine and the efficiency of fuel. A detailed analysis was conducted on 41 marine diesel-biodiesel fuel samples, measured for density determination at 15°C as defined by standardized methods (ELOT EN ISO 12185). The density range which is accepted was defined from 820 to 890 kg/m³. The results achieved show that the majority of samples were in agreement with this range, indicating consistent fuel quality and agreement with the standards of industry. (as shown in Figure 2) The Figure 2 is named as Density Measurement and the vertical scale of the graph ranges from about 820 kg/m³ to 860 kg/m³. The x-axis covers the sample with numbers from 1 to 41, showing a sequence of Marine diesel fuels. The pattern shown is that the density increases in a steep way from approximately 825 kg/m³ at sample 7 to 856.1 kg/m³ as recorded in sample 10, then a plateau is formed around 826.4 to 860 kg/m³ for the rest of samples. It is worth noticing that sample 10, showing a high density of 856.1 kg/m³, which is justified by a high-water content of 1,200 mg/kg, revealing a severe contamination that influence the performance of engine and the fuel storage stability. Sample 7 (826.4 kg/m³) is the lower limit, which potentially justifying fuel blending or sourcing issues. Quality concerns were identified, although other samples were within the acceptable density range. Specifically, sample 38 contained visible sediment, and sample 39, despite a density of 838.7 kg/m³, which was acceptable, indicated extreme contamination with elevated levels of metals and non-metals agents such as Calcium (Ca), Zinc (Zn), and Phosphorus (P), implying adulteration or cross-contamination. Also, the samples 34 and 22 demonstrated lower densities with values of 830.2 and 828.7 kg/m³ correspondingly, something which needs attention to identify or not the presence of small molecular weight hydrocarbons to strengthen the safety and efficiency in marine fuel operations.
3.3. Viscosity and Fuel System Compatibility
Viscosity is a key parameter influencing the atomization of fuel and the lubrication of injection systems in marine diesel engines. The marine diesel samples were examined according to the National and International Standard ELOT EN ISO 8217, which defines an acceptable range between 2.0 to 6.0 cSt. All the samples show compliance with that range, indicating acceptable properties of flow. Figure 3 is named as Viscosity Measurement and the vertical axis ranges from 2.362 - 3.952 cSt. The overall pattern of Figure 3 indicated an upward tendency. Sample 1 shown a viscosity of 3.426 cSt, sample 2 of 2.557 cSt, sample 3 of 3.449 cSt, and the viscosity values for other samples such as sample 5 of 2.966 cSt, sample 11 of 2.878 cSt, sample 18 of 3.181 cSt, sample 21 of 3.312 cSt, sample 35 of 3.458 cSt, and sample 41 of 3.247 cSt. All the above-referred samples demonstrated good rheological behavior. On the other hand, sample 10 was an outlier with a high viscosity of 3.952 cSt, but not remarkably close to the upper acceptable limit. The density of sample 10 was recorded at 856.1 kg/m³. These values may be justified by the high-water content reaching 1,200 mg/kg, which may cause poor combustion and may damage fuel systems.
As well as a few samples such as Sample 7 showed viscosity of 2.364 cSt and Sample 19 with a value of 2.501 cSt, although they were in agreement with the acceptable limits that were measured lower than 2.6 cSt. It is worth noticing further that Samples 38 and 39, although their viscosities were 3.069 cSt and 2.996 cSt respectively, the samples demonstrated visible sediment and high contamination, verifying the statement that the viscosity alone does not reflect the overall quality of fuel. The average value of all the marine diesel fuel samples was estimated, and it was determined at 2,901cst.
3.4. Distillation Profile
All marine diesel samples analyzed have recovered 65% v/v at 250 °C. The 85% v/v recovery was achieved at 350 °C, and also the T95 value was below the 360 °C. Examining the dataset the recovery of 250 °C ranged from 29.5% v/v to 48% v/v, the 350 °C recovery from 87% to 97.5% v/v, and T95 fluctuated from 343 °C to 354 °C. Thus, the sample examined were in accordance even with the specification limits of ELOT EN 590 automotive diesel specifications, showing that the fuels are operational.
The samples were assessed by their volatility, and three behavioural families were recorded. The most volatile group contains the following nine samples with the following encoding: 11, 12, 13, 14, 15, 19, 20, 29 and 34. In this family, the samples start to boil in a low temperature as shown by T10 value since it was between 168 °C and 204 °C, such as 11 (168 °C), 12 (174 °C), 13 (193 °C), 14 (205 °C), 15 (188 °C), 19 (206 °C), 20 (210 °C), 29 (198 °C) and 34 (198 °C). These values imply an excellent behavior of fuel at low temperatures satisfying an easy engine start-up at low temperatures and smoothness in engine warm-up, although the volatility in high front-end recovery may set risks for fuel vaporization in higher temperatures climate conditions. Regarding the Sample 34, its T10 value is recorded at 198 °C, which is rather light, but showing a T50 value of 260 °C, indicating the mid-range fractions. This sample is classified at this group, since the profile of distillation curve is characterized by the early initial boiling point.
The other broad behavioral family is the mid-range family, including the following samples: 1, 2, 3, 4, 5, 6, 9, 16, 18, 21, 22, 23, 24, 25, 26, 31, 32 and 33. The dataset shown that T10 values are between 193 °C and 220 °C. The T90 values lied in the range of 315 °C and 341 °C and T95 were between 347 °C and 354 °C. The yield at 250 °C was from 30% v/v to 44 % v/v and at 350 °C was from 95% v/v to 97 % v/v recovery. These fuels include a light fraction satisfying engine cold start-up, a mid-section fraction showing stable combustion and a heavy-end fraction supporting an adequate flash point and stability during storage. In the case of sample 4, the T10 values were at 170 °C, which is a rather low value, but it lies in this category because the other characteristics belong to the mid-range pattern.
A heavier-front fraction includes samples 7, 8, 27 and 28. Evaporation starts up in the range of 205 to 217 °C. Specifically, the sample 7 at 216 °C, sample 8 at 217 °C, sample 27 at 217 °C and sample 28 at 217 °C. The half of the fuel has distilled in the range of 254–278 °C, such as 254 °C for sample 7, 254 °C for sample 8, 278 °C for sample 27 and 278 °C for sample 28. The recovery at 250°C was recorded between 30 % and 32 % v/v, specifically 32 % v/v for sample 7 and 30.5 % v/v for sample 8. As well as the recovery at 350 °C was in the range of 94.5–96 % v/v, showing 94.5 % v/v for sample 7 and 96 % v/v for sample 8, 27 and 28. T90 values were between 334 °C to 339 °C and T95 between 347 °C to 354 °C. It is worth noticing that the higher values of initial boiling temperatures enhance the flash point indication and the fuel thermal stability, being a significant advantage for vessels which demand long-term fuel storage.
Sample 30 is characterized as an outlier. Although the T95 value was recorded at 354 °C, the yield 350 °C was at only 87 % v/v, being the lowest value noted in the dataset, implying an abnormal percentage of high heavy-tail fraction, which may be justified by the water ingress, or any contamination from residual oil or incomplete refining processes. If this marine diesel fuel is used without treatment, the exhaust gases may produce smoke, formation of soot and injectors fouling and deposits on combustion chambers. In such fuel, the treatment demands blending with a lighter fuel.
Regarding the other samples from 35 to 41 they were not succumbed to the determination of the characteristics of distillation profile. It is worth noticing that the other physicochemical properties such as density measurement, viscosity, water content and flash-point determination were within DFA specifications as determined in the National and International Standard ELOT ISO 8217:2024. Their organoleptic appearance was good without the sediment formation. It is logical to conclude that the missing samples were within the specification limits.
Summarizing, except from the heavy-tailed marine diesel fuel as Sample 30, and sample 10 which was with a significant water content of 1200 mg/kg, the rest samples showed conventional distillation characteristics for DFA fuel, attributing to an adequate cold-start performance, combustion smoothness, thermal stability and storage stability, being in compliance with the ELOT ISO 8217 for marine diesel fuels.
3.5. Water Content and Fuel Quality Risks
Another parameter which was assessed was the water content calculated by ELOT ΕΝ ISO 12937. This is a critical parameter especially for biodiesel-blended fuels. Water contamination in fuel can lead to corrosion, microbiological growth, and operational issues like filter blocking or injector damage. According to the results’ dataset, most samples which were examined showed a low water content, not exceeding the value of 200 mg/kg which was an acceptable value. In Figure 4 the Water Concentration is plotted on the vertical axis, covering the range from 0 to 1,200 ppm. The horizontal axis, x-axis represents the Marine sample numbers, covering from 1 to 41. The overall pattern follows the subsequent trend as Values are near ~150 ppm showing an outlier at 1,200 ppm. However, Sample 10 was an outlier. It included an extremely high level of water content reaching 1,200 mg/kg, surpassing typical limits of operation. This high concentration of water is alarming because it reveals either a corrosive tank with bad housekeeping practices or FAME oxidation and hydrolysis processes, by forming free fatty acids and glycerol with corrosive character, facilitating electrochemical corrosion processes. The lowest water content, 70 mg/kg is depicted in sample No. 25. Varying levels were shown in other samples, samples with lower values, 50 mg/kg such as sample No. 28 and others with higher values, 80 mg/kg and 100 mg/kg but still within limits such as sample No. 30 and No.33, respectively. For sample No. 38, sediment was present, forming a second phase, pointing to an advanced degradation.
3.6. FAME Content and Oxidative Stability
All the samples have FAME content around 7.0% v/v. For a variety of samples measurements shown 7.1%, 7.0%, 6.8%, and 6.7% v/v. It is worth noticing that even small variations in FAME content can influence stability to oxidation, and to hygroscopicity, and flow properties at low temperatures.
Sediment was measured for sample No. 38. Sediment in generally diesel fuels can come from oxidative processes, the growth of microbes or the presence particulate matters from poor filtration. The presence of sediment sets risks such as clogging of filters, fouling of injectors, and engine wear. Due to biodiesel-diesel blended fuel (FAME) are susceptible to oxidative processes. Inappropriate housekeeping practices will accelerate such processes. As an example, storage of the fuel for a prolonged period without stabilizers.
3.7. Elemental Contamination - ICP-OES Analysis
The measurements of the marine diesel fuel samples via Inductively Coupled Plasma Optical Emission Spectrometry (ICP-OES) highlighted a variety of metals by recording not only the high-quality excellent fuels, but also those influenced by strong contamination, degradation pathways, or poor handling.
In the current work, it was observed from the samples’ analysis that higher viscosity is an indicator of fuel behavior. The higher fuel viscosity is strongly correlated with a high concentration of metal content, recommending that the physical fuel properties can serve as a reliable indicator of its chemical purity and contamination level.
This before-mentioned correlation is confirmed by the SPSS analysis, a statistical analysis through showing a significant positive relationship between viscosity and total contamination (r = 0.361, p = 0.022), as well as moderate to strong associations between viscosity values and key metallic compounds as Copper (r = 0.152), Iron (r = 0.299), Magnesium (r = 0.419), and Lead (r = 0.551). The correlation coefficient (R-value) measures the strength and direction of a linear relationship between the two variables, ranging from -1 (perfect negative) to +1 (perfect positive), with 0 indicating no relationship. The p-value indicates the statistical significance of this relationship, determining the probability that the observed correlation is due to chance. A p-value below the chosen 5% (0.05) significance level suggests the correlation is statistically significant and likely not a random occurrence.
These findings may be justified by the statement that while the metal contents elevated, the internal resistance of the fuel increases, giving as result a greater viscosity. This phenomenon was strongly confirmed in the case of transition metals and elements which are used as additives. This phenomenon can be explained by the physicochemical behavior of metal ions in hydrocarbon matrices: multivalent ions such as Fe³⁺, Cu²⁺, and Al³⁺ form hydrated complexes and interact with polar compounds or organic ligands, increasing molecular interactions and fluid resistance.
Additionally, suspended oxides of metals, colloidal particles, and categories of insoluble byproducts from degradation stages attribute to the increase of contamination load and to the thickening of the fuel, strengthening the correlation of rheological properties and elemental content. The strongest correlations between total contamination and higher viscosity values were observed for:
- • Phosphorus (r = 0.722, p < 0.001),
- • Calcium (r = 0.679, p < 0.001), and
- • Zinc (r = 0.595, p < 0.001).
All these metallic compounds are components of lubricating oil as additives, particularly they are included into Zinc dialkyldithiophosphate (ZDDP). According to the current results, there is a rather strong correlation between Phosphorus and Calcium (r = 0.895, p < 0.001), denoting a contamination from possibly engine lube oil, which may happened due to handling transfer issues by cross-contamination from inadequate cleaning of tanks.
This statement is most evident in sample No. 39, which exhibited extreme levels of Calcium (8.054 mg/kg), Phosphorus (0.602 mg/kg), and Zinc (1.331 mg/kg), making it a clear outlier with severely compromised fuel quality. Thus, such contamination set operational risks, involving the formation, injector coking, and catalyst poisoning, all of which are exacerbated by the observed increased viscosity in the sample. Similarly, Samples 40 and 41 showed elevated levels of the same additive-related elements, confirming a recurring contamination issue that demands strict quality control and handling protocols.
The presence of Copper and Lead was nearly perfectly correlated (r = 0.996, p < 0.001), indicating a shared origin, most likely corrosion from Brass, Bronze, or Bearing materials in fuel system components, a process that also contributes to increased particulate load and viscosity. Similar pattern was observed for Iron, Magnesium, and Manganese indicated through a mutual relationship between higher values of viscosity and contamination, implying mechanical wear, rust, suspended particulates.
Silicon and Sodium frequently appeared together in increased concentrations. Their presence in sample No. 5, 6, 21, and 23, showed environmental contamination from airborne dust and potential seawater ingress likely due to poor sealing of tanks or poor storage.
Particularly, Sodium showed strong correlation with magnesium and other alkali metals, highlighting its origin from marine environments. On the contrary, sample No. 2 showed a minimal content of trace metals, indicating high purity fuels and simultaneously good practices during handling. As well as sample No 1, which was collected from the bottoms of the tank, presented a high calcium and copper content, implying the presence of additives and corrosion pathway. In case of Sample 3, a similar pattern was observed. An increased content of Calcium, Iron, and Barium was noticed, which is explained by additive use and mechanical wear, whereas sample No. 4 demonstrated low metal concentration and balanced properties, reflecting a satisfying fuel quality. As well as samples No 5 and 6 showed elevated Silicon, Iron, and Sodium, implying again environmental contamination. Sample No. 7 showed low density and high Tin and Silicon, implying light fuel fractions and a possible influence of additives into its composition, while sample No. 8 showed a moderate influence of metallic compounds such as Sodium and Potassium, which may be explained by detergent residues agents. Similar observations were in Samples No. 9 and No. 18 both exhibited high iron, silicon, and sodium, making strong concerns about wear and environmental exposure.
Sample No. 10 revealed high water concentration of (1,200 mg/kg), promoting in this way the formation of emulsions in marine fuel and simultaneously the microbial growth, leading to fuel instability and increased viscosity. Similarly, sample No. 11 showed high Iron, Sodium, and Chromium, indicating corrosion and wear. Sample No. 12 showed low contamination and acceptable quality, while samples No. 13 and 14 had elevated concentration of silicon and zinc, indicating dust ingress and corrosion from galvanized components. samples such as No. 15 and No. 17 showed extremely low metal content, showing excellent fuel quality. On the other hand, sample No. 16 showed elevated content of Copper and Vanadium which is possible explained as a type of wear maybe by heat exchanger contamination.
The recurring presence of Iron, Silicon, and Sodium in multiple samples reinforces issues correlated to wear of mechanical components and environmental exposure, all of them contribute to an elevated viscosity and poor fuel performance. Overall, the dataset presented in the current work shows that the viscosity value is not only a physical property but a significant medium showing contamination in a severe form, specifically when it is correlated with elemental analysis.
Similarly, samples No. 40 and 41 showed elevated levels of the same additive-related elements, confirming a recurring contamination issue that demands strict quality control and handling protocols. The presence of Copper and Lead was nearly perfectly correlated (r = 0.996, p < 0.001), indicating a shared origin, most likely corrosion from brass, bronze, or bearing materials in fuel system components, a process that also contributes to increased particulate load and viscosity. Iron, magnesium, and manganese showed strong mutual correlations and were linked to both viscosity and contamination, suggesting contributions from mechanical wear, rust, or suspended particulates.
The statistical analysis is in alignment with the observations in Figure 5, which depicts the viscosity measurements against total contamination from metallic compounds. In Figure 5 a red horizontal line represents the lower limit of significant contamination of 0.2 mg/kg. This is the threshold value which was determined by the injection system manufacturers for the automotive industry. Although there were two samples which were below the threshold, the rest surpassed the limit of metallic contamination of 0.2 mg/kg, setting risk in engine performance, reaching in one case even above 10 mg/kg. This finding underscores that the increase of viscosity is correlated with the metals presence and compounds used as fuel additives. All these contaminants influence the fuel chemical composition through promoting intermolecular interactions and driving to the thickening of fuel.
Thus, the statistical analysis and the graph verify that kinematic viscosity determined at 40 °C can be used as an indicator related with the purity of marine diesel. The monitoring of viscosity in a parallel way with elemental analysis provides the ability to detect in an early stage any kind of cross-contamination or adulteration with lubricating oil during handling, transportation and dispersion, as well as degradation of infrastructure-related issues, satisfying an integrated process in order to guarantee the quality of fuel and the performance of engine.
The nonlinear model presented in 2.12 was fitted to the measured viscosity data. The predicted viscosity values show good agreement with the experimental measurements, as illustrated in Figure 6, where measured versus predicted viscosities are plotted on a logarithmic scale. The scatter plot indicates that the model captures the trends of the data across the studied concentration ranges. Table Y summarizes the estimated model coefficients (α,b_i) along with the coefficient of determination (R^2=0.99863), which demonstrates the model’s accuracy in reproducing the observed viscosities. These results confirm that the proposed model provides a physically meaningful approximation for predicting the viscosity of different compositions within the tested ranges.
The findings show that Biodiesel - FAME concentration in marine diesel fuel is a factor, but the results indicated that the foremost drivers of fuel degradation and contamination are the housekeeping and environmental conditions during storage period and the corresponding compatibility of the infrastructure. This statement was verified through outliers which were faced such as introduction of water, contamination from lube oil, or the heavy ends presence as shown by the distillation curve characteristics. These issues elicited from handling and transportation and storage protocols and not exclusively by the FAME blend itself.
The thorough examination of samples showed that a significant example was the case of sample No. 10. An extreme concentration of water at 1,200 mg/kg verified that poor storage conditions can set risks for fuel chemical composition. Specifically, the water presence accelerates the hydrolysis of esters involved into FAME chemical composition, driving corrosive free fatty acids and glycerol, simultaneously promoting the electrochemical corrosion and facilitating a medium for microbial growth (MIC).
A similar finding was in the case of Sample 33 noticing a substandard parameter as flash point measurement. The flash point value measured at (58°C), suggesting risks regarding safety. This finding indicated that it is not an issue concerning fuel degradation FAME presence, but the results demonstrated contamination with lighter fractions of fuel, implying improper blending or cross-contamination during fuel handling and distribution.
The most compelling evidence for infrastructure-driven contamination elicits from Sample 39. In sample 39, significant important levels of metallic components such as Ca, Zn, and P are indicators of contamination from lube oil. This finding verifies that it is not a failure of the fuel chemical composition but an issue regarding the fuel handling system. This failure may be explicit by the poor cleaning of system distribution such as tanks or pipelines, which were earlier used for lube oil. This type of contamination sets operational risks, such as the fouling of injectors, the formation of ash, and the poisoning of the after-treatment exhaust catalysts. In the present study a strong correlation was recorded through the presence of these metallic elements and an increased viscosity (as shown in Table 1). Also, this finding suggests a practical tool for early investigation and detection since an increased viscosity in stored fuel may imply cross-contamination from lube-oil.
Another significant factor for fuel degradation is environmental exposure. Specifically, the Silicon and Sodium presence into samples 21 and 23 underscored this influence. These types of compounds are not components into fuel composition but pollutants coming from the environment, implying improper storage conditions highlighting that storage tanks are poorly sealed against seawater and dust particles. This finding is associated with problems in infrastructure and issues concerning the maintenance protocols.
The sample No.38 shown a visible sediment indicating a serious stability issue. The Sediment formation suggests a long-term oxidation which is promoted by the trace metals presence or the growth of microbes. This finding verifies that storage management is another critical parameter. This sediment is the consequence of long-term storage conditions, having fuel without stabilizers or biocides.
Overall, the current study suggests that the risks of fuel degradation and contamination are managed not by eliminating the biodiesel-FAME concentration, but by controlling the environment during storage conditions and by ensuring the compatibility of fuel with the infrastructure. Thus, the FAME content of 7% v/v is not the primary cause of the problems which are encountered. Concentrations of metallic compounds higher than > 0.2mg/kg, according to the car manufacturers’ investigation, leads to engine damage such as injector fouling, soot formation. All the marine samples investigated are depicted in Figure 7, Figure 8 and Figure 9 regarding the metallic compounds content in their chemical composition. Cornering Figure 6, Figure 7 and Figure 8 are represented by the figures showing contaminants’ concentration higher than 0,2 mg/kg in each sample examined.
4. Conclusions
The analysis of the forty-one real-world DFA marine diesel fuel samples denotes that the quality of fuel and its integrity are dependent on storage and handling processes and not by the FAME content. The measurements showed that while most samples were in compliance with the specification limits as determined in International Standard ISO 8217, a number of outliers were found, indicating issues concerning infrastructure and handling and distribution procedures. A critical outlier regarding safety was sample No. 10, which was found with a high-water content of 1,200 mg/kg extremely dangerous, and sample No. 33 which was a non-compliant sample regarding its flash point reaching of 58 °C.
As well as another critical outlier is sample No. 39, indicating high levels of metallic components such as Calcium, Zinc, and Phosphorus, implying the lube oil contamination. This sets risk of engine performance through the fouling of injectors, the formation of ashes, and the poisoning of catalysts. The above-mentioned issues suggest a detailed examination of the storage conditions, handling and distribution of fuel and the procedures of tank cleaning.
In the case of samples No 21 and No. 23, elevated levels of silicon and sodium were recorded, showing environmental contamination from dust particles or seawater ingress into marine fuels, which is justified by poor sealing of tanks and inadequate storage.
Regarding sample No. 38 the sediment formation demonstrates an issue as for stability, which is justified by long-term storage, implying the absence of fuel stabilizers or biocides in its fuel chemical composition, driving to oxidative processes or microbial growth.
A critical finding of the present work is the relationship between viscosity and key contaminants like the following metallic compounds as Calcium, Phosphorus, Zinc. This correlation is favorable since it provides a valuable tool for detection of fuel contamination in an early stage. Thus, the monitoring of viscosity value could be a cost-effective indicator to predict issues which may lead to engine damage with a significant cost. The findings of the precent study are practical for the maritime industry. To verify the safety and effectiveness of DFA marine fuels, the monitoring of fuel quality should be strict, giving special attention to the content of water, the flash point measurement, and viscosity value. Strict protocols for cleaning of tanks and distribution systems such as pipelines should be determined in order to prevent cross-contamination, especially from lube oil, and to ensure the adequate sealing of the storage tanks and simultaneously to prevent contamination from environmental factor ingress.
Additionally, fuel stabilizers and biocides are suggested in the case that prolonged storage is necessary. Additionally, a regular examination of the suitability of the infrastructure with biodiesel-diesel blended marine fuels seems to be a crucial parameter. The investigation of future research is to assess prolonged storage examining the degradation rate under environmental and operational conditions and to assess the effectiveness of stabilizer packages, especially for DF and RF category blended marine fuels, and research and develop materials which are corrosion-resistant and compatible with equipment for biodiesel-blended marine diesel storage.
Author Contributions
Conceptualization, S.K.; methodology, S.K.; software, G.V., D.Ch.; validation, S.K.., D.Ch. and G.V.; formal analysis, S.K.; investigation, S.K., D.Ch., G.V.; resources, S.K.; data curation, S.K.; writing—original draft preparation, D.Ch.; writing—review and editing, S.K., D.Ch., G.V.; visualization, S.K., D.Ch., G.V.; supervision, S.K.; project administration, S.K. All authors have read and agreed to the published version of the manuscript.” Please turn to the CRediT taxonomy for the term explanation.
Funding
This research received no external funding.
Acknowledgments
The authors would like to acknowledge the personnel from Greek General Chemical State Laboratory (G.C.S.L.) Directorate of Energy, Industrial and Chemical Products and Chemist Mr. Panagiotis Kotsokolos for their help to conduct the study.
Conflicts of Interest
The authors declare no conflicts of interests.
References
- ELOT ISO 8216-1:2024. Products from petroleum, synthetic and renewable sources — Fuels (class F) classification. Part 1: Categories of marine fuels. National Quality Infrastructure System, Hellenic Organization for Standardization, 2024, L. Kifisou 50, Peristeri, P.O. 121 33, Athens Greece.
- Sterpu, A.E., Simedrea, B.G., Chis, T.V., & Săpunaru, O.V. Corrosion Effect of Biodiesel-Diesel Blend on Different Metals/Alloy as Automotive Components Materials. Fuels 2024, 5(1), 17–32. [CrossRef]
- Engeländer, K., Duchowny, A., Blümich, B., & Adams, A. Analysis of Aging Products from Biofuels in Long-Term Storage. ACS Omega 2022, 7, 26256–26264. [CrossRef]
- Saltas, E., Bouilly, J., Geivanidis, S., Samaras, Z., Mohammadi Al., Iida, Y. Investigation of the Effects of Biodiesel Aging on the Degradation of Common Rail Fuel Injection Systems. Fuel 2017, 200, 357–370. [CrossRef]
- Vergara-Juarez, F., et al. (2024). Corrosion Induced on Aluminum by Biodiesel Components in Non-Oxygen Environments. Materials, 17, 1821. [CrossRef]
- Norouzi, S., Hazeri, K., Wyszynski, M. L., & Tsolakis, A. Investigation on the Effects of Temperature, Dissolved Oxygen and Water on Corrosion Behaviour of Aluminium and Copper Exposed to Diesel-Type Liquid Fuels. Fuel Processing Technology 2014, 128, 220–231. [CrossRef]
- Heryana, Y., Pamungkas, A., Romelan, R., Solikhah, M.D., Theofani, Barus, B.R., Wibowo, C.S., Supriyadi, F., Thahar, A., Wibowo, E., & Wan, S.S. Evaluation of Corrosion Effects in Diesel-Biodiesel and Diesel-Biodiesel-HVO Blends on Metals for Fuel Storage Systems. Corrosion Science and Technology 2024, 23(5), 352–364. [CrossRef]
- Kuna, M., Miszczyk, A. Risks Caused by Microbiologically Influenced Corrosion in Fuel Diesel Storage Tanks. 2024. [CrossRef]
- Kalligeros, S., Adonakos, P. The Bio-content of the Distillate Marine Fuel is not the only responsible factor for the microbiological growth. Hellenic Institute of Marine Technology, Book of Marine Technology 2022, 51-64. [CrossRef]
- Komariah, L. N., Dewi, T. K., & Ramayanti, C. Study on Corrosion Behavior of Storage Tanks Filled with Biodiesel and the Blends. IOP Conference Series: Materials Science and Engineering 2019, 543, 012033. [CrossRef]
- Papavinasam, S., Anand, A., Meenakshi, H. N., Krausher, J., Li, J., Liu, P., Mani, S. R., & Krishnamurthy, S. R. Corrosion of Metals in Biofuels. ECS Transactions 2011, 33(14), 1–19. [CrossRef]
- Głąb, J. Sediment as a Problem in FAME Storage. Journal of KONBiN 2016, 39. [CrossRef]
- Sultanbekov, R. R., Nazarova, M. N. I International Conference “Corrosion in the Oil and Gas Industry” 2019, 121. [CrossRef]
- Nguyen, X. P., & Vu, H. N. Corrosion of the Metal Parts of Diesel Engines in Biodiesel-Based Fuels. International Journal of Renewable Energy Development 2019, 8(2), 119–132. [CrossRef]
- Hoang, A.T., Tabatabaei, M., & Aghbashlo, M. A Review of the Effect of Biodiesel on the Corrosion Behavior of Metals/Alloys in Diesel Engines. Energy Sources Part A: Recovery, Utilization, and Environmental Effects 2020, 42(22), 2923–2943. [CrossRef]
- Simbi, I., Aigbe, O. U., Oyekola, O. O., Osibote, A. O. Chemical and quality performance of biodiesel and petrol blends, Energy Conversion and Management 2022, X, 15, 100256. [CrossRef]
- Borecki, M.; Geca, M.; Korwin-Pawlowski, M.L. Automotive Diesel Fuel Internal Stability Testing with the Use of UV and Temperature as Degradation Factors. Materials 2022, 15, 8548. [CrossRef]
- Sriprathum, S., Maneedaeng, A., Klinkaew, N., Sukjit, E. Comprehensive Analysis of Properties of Green Diesel. RSC Advances 2023, 13, 31460–31469. [CrossRef]
- ELOT ISO 8217:2024. Products from petroleum, synthetic and renewable sources - Fuels (class F) - Specifications of marine fuels. National Quality Infrastructure System, Hellenic Organization for Standardization, 2024, L. Kifisou 50, Peristeri, P.O. 121 33, Athens Greece.
- ELOT EN 590:2025. Automotive fuels - Diesel - Requirements and test methods. National Quality Infrastructure System, Hellenic Organization for Standardization, 2025, L. Kifisou 50, Peristeri, P.O. 121 33, Athens Greece.
- ELOT EN 14214:2012+A2:2019. Liquid petroleum products - Fatty acid methyl esters (FAME) for use in diesel engines and heating applications - Requirements and test methods. Hydrocarbon Liquids - Manual Sampling. National Quality Infrastructure System, Hellenic Organization for Standardization 2019, L. Kifisou 50, Peristeri, P.O. 121 33, Athens Greece.
- ELOT EN ISO 3170:2004. Hydrocarbon Liquids - Manual Sampling. National Quality Infrastructure System, Hellenic Organization for Standardization, 2004, L. Kifisou 50, Peristeri, P.O. 121 33, Athens Greece.
- ASTM D4057-22. Standard Practice for Manual Sampling of Petroleum and Petroleum Products. ASTM International 2022, 100 Barr Harbor Drive, PO Box C700, West Conshohocken, PA, 19428-2959 USA.
- ELOT EN ISO 12185:2024. Crude petroleum, petroleum products and related products - Determination of density - Laboratory density meter with an oscillating U tube sensor. National Quality Infrastructure System, Hellenic Organization for Standardization, 2024, L. Kifisou 50, Peristeri, P.O. 121 33, Athens Greece.
- UOP389-15. Trace Metals in Organics by ICP-OES. ASTM International 2015, 100 Barr Harbor Drive, PO Box C700, West Conshohocken, PA, 19428-2959 USA.
- UOP796-09. Silicon in Petroleum Liquids by ICP-OES. ASTM International 2009, 100 Barr Harbor Drive, PO Box C700, West Conshohocken, PA, 19428-2959 USA.
- ELOT EN ISO 12937:2000. Petroleum products - Determination of water - Coulometric Karl Fischer titration method. National Quality Infrastructure System, Hellenic Organization for Standardization, 2000, L. Kifisou 50, Peristeri, P.O. 121 33, Athens Greece.
- ELOT EN ISO 3679:2022. Determination of flash point - Method for flash no-flash and flash point by small scale closed cup tester. National Quality Infrastructure System, Hellenic Organization for Standardization, 2022, L. Kifisou 50, Peristeri, P.O. 121 33, Athens Greece.
- ELOT EN ISO 3104:2023. Petroleum products - Transparent and opaque liquids - Determination of kinematic viscosity and calculation of dynamic viscosity. National Quality Infrastructure System, Hellenic Organization for Standardization, 2023, L. Kifisou 50, Peristeri, P.O. 121 33, Athens Greece.
- ISO 4264:2018. Petroleum products — Calculation of cetane index of middle-distillate fuels by the four variable equation. International Organization for Standardization 2018, Chemin de Blandonnet 8, CP 401, 1214 Vernier (Geneva), Switzerland.
- ELOT EN 14078:2025. Liquid petroleum products - Determination of fatty acid methyl ester (FAME) content in middle distillates - Infrared spectrometry method. National Quality Infrastructure System, Hellenic Organization for Standardization, 2025, L. Kifisou 50, Peristeri, P.O. 121 33, Athens Greece.
Figure 1.
Macroscopic Analysis on color, odor, sediment formation and two- phase separation for 41 marine diesel fuels.
Figure 1.
Macroscopic Analysis on color, odor, sediment formation and two- phase separation for 41 marine diesel fuels.
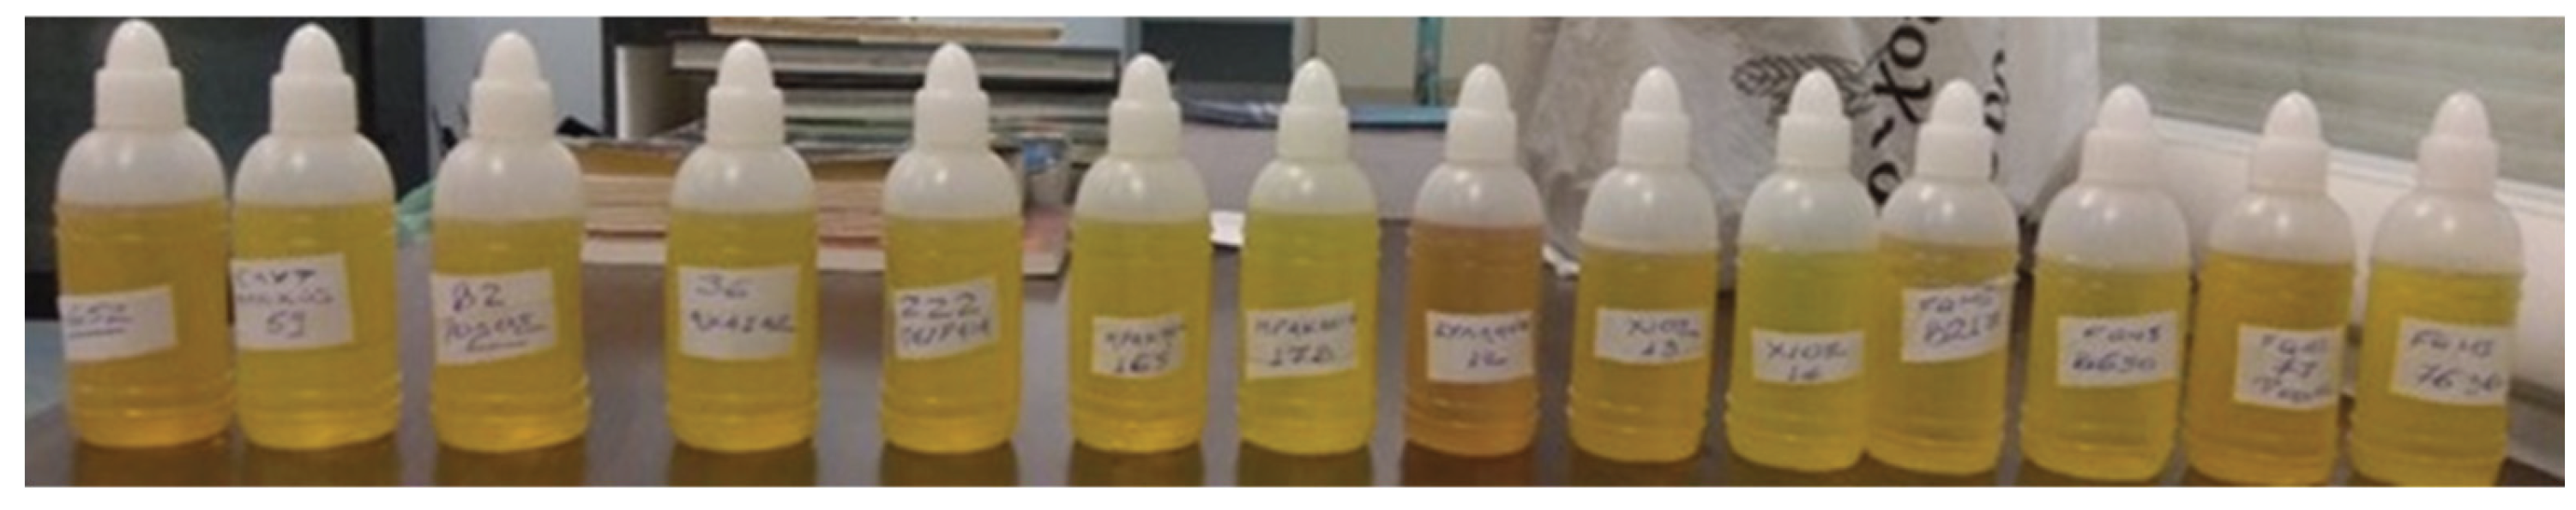
Figure 2.
The distribution of density values for the 41 marine diesel fuels.
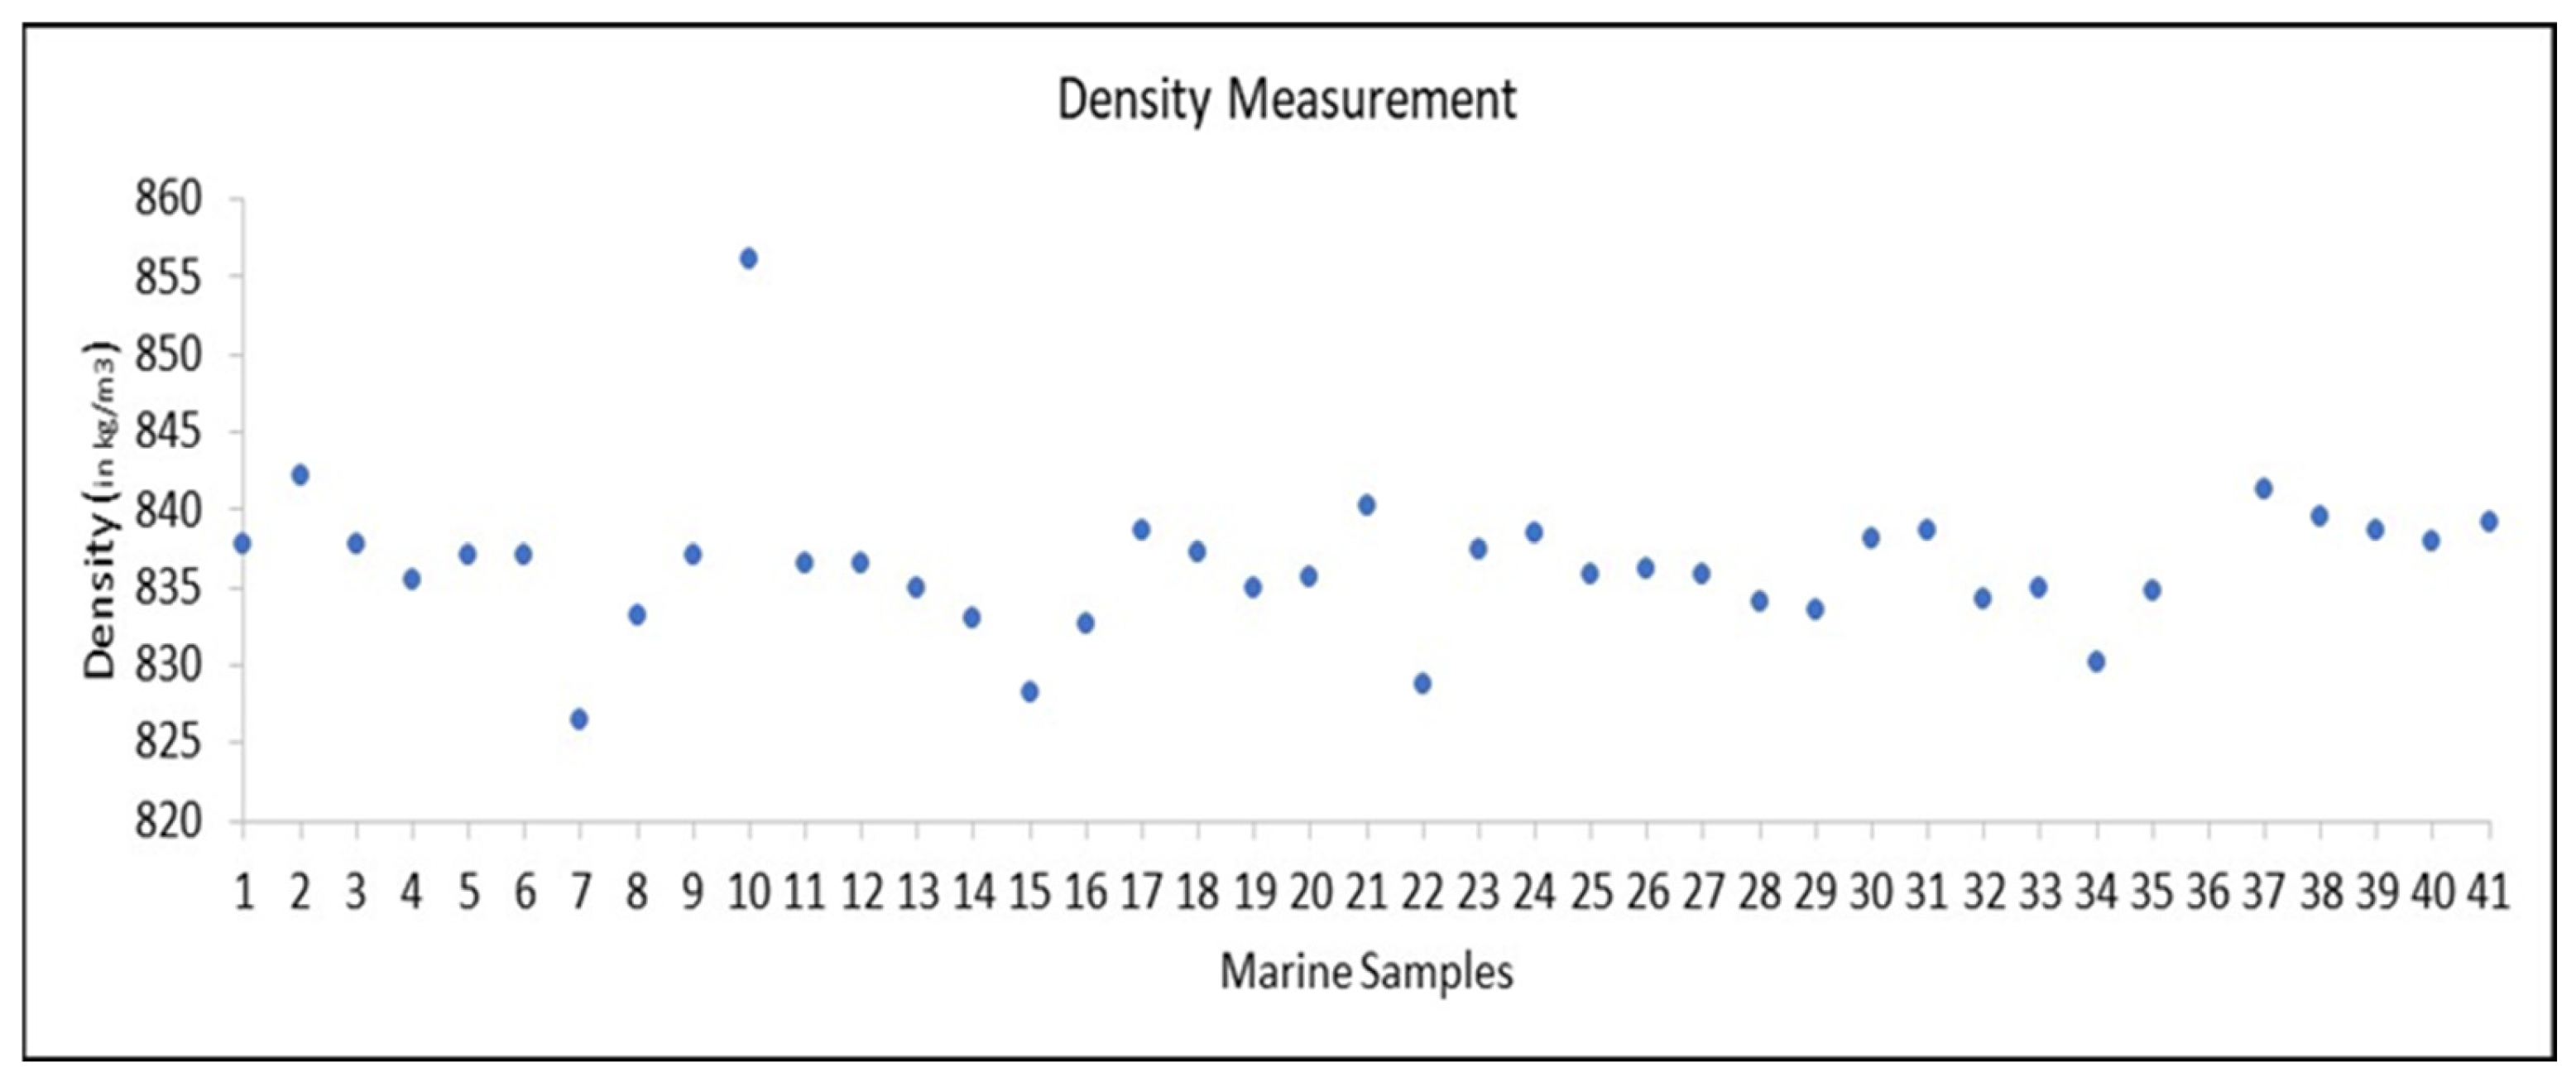
Figure 3.
The distribution of viscosity values for all marine diesel fuels.
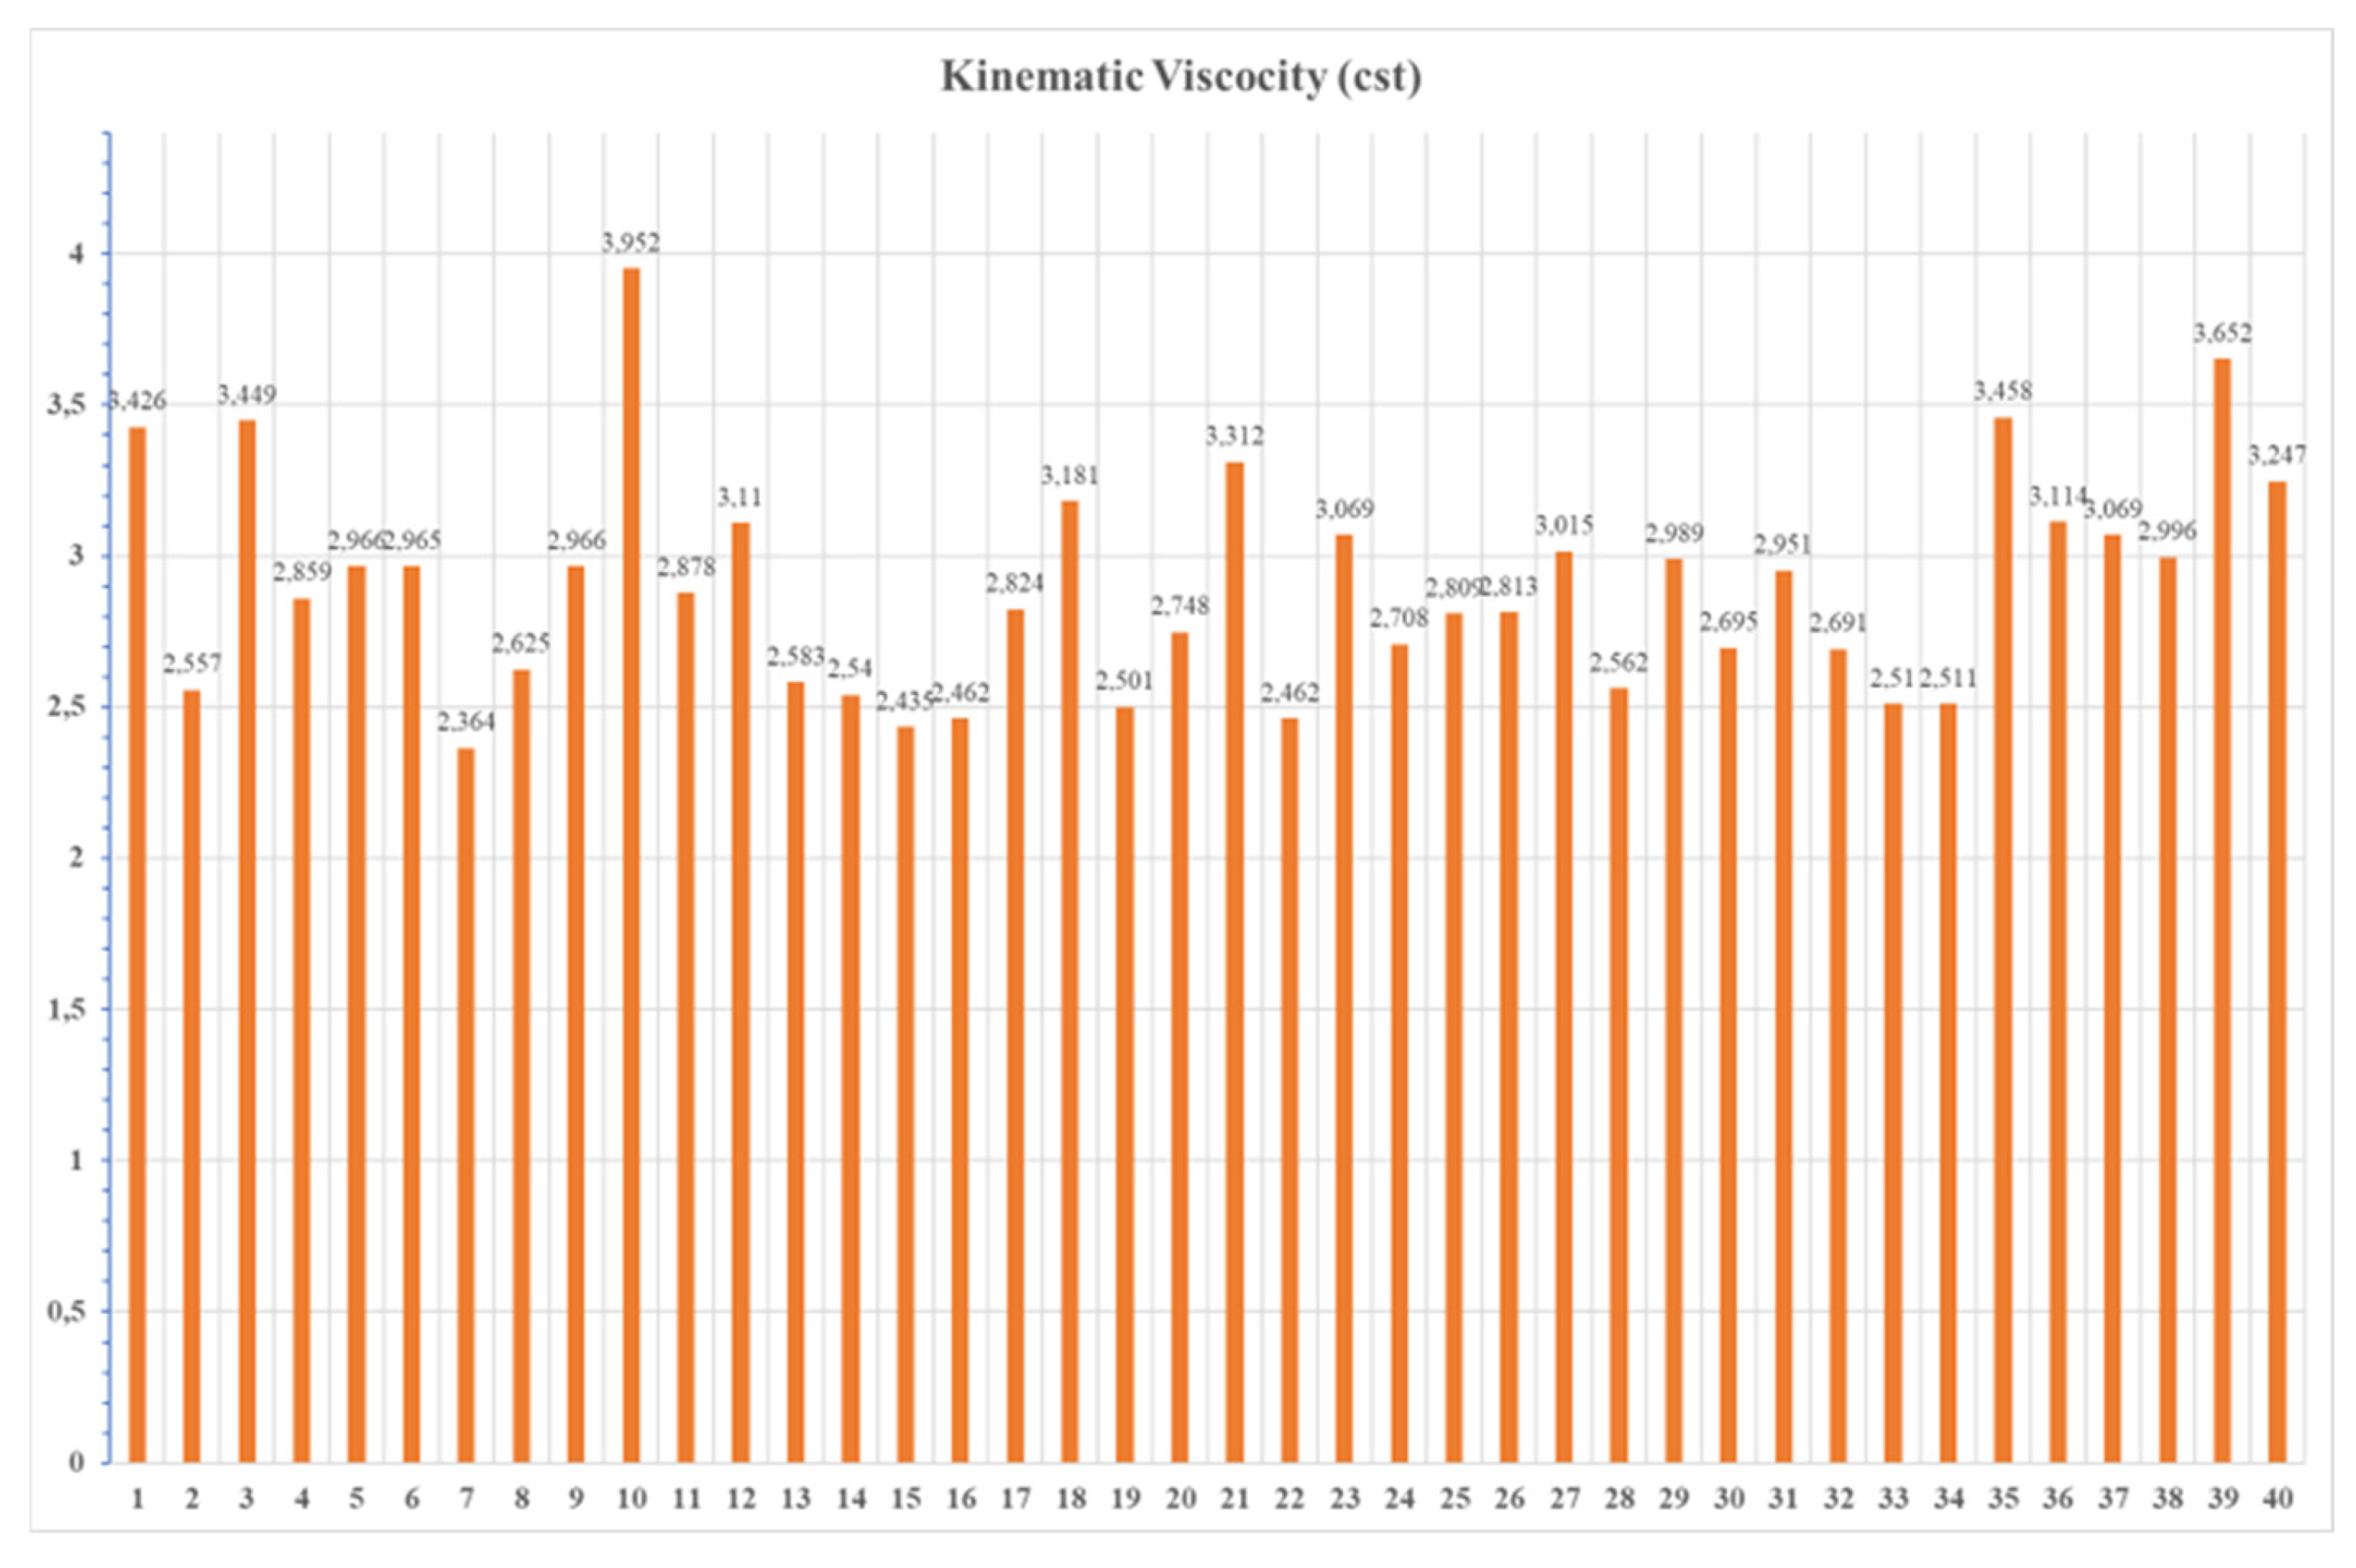
Figure 4.
The distribution of water content measurements in relation to the kinematic viscosity for the 41 marine diesel fuels.
Figure 4.
The distribution of water content measurements in relation to the kinematic viscosity for the 41 marine diesel fuels.
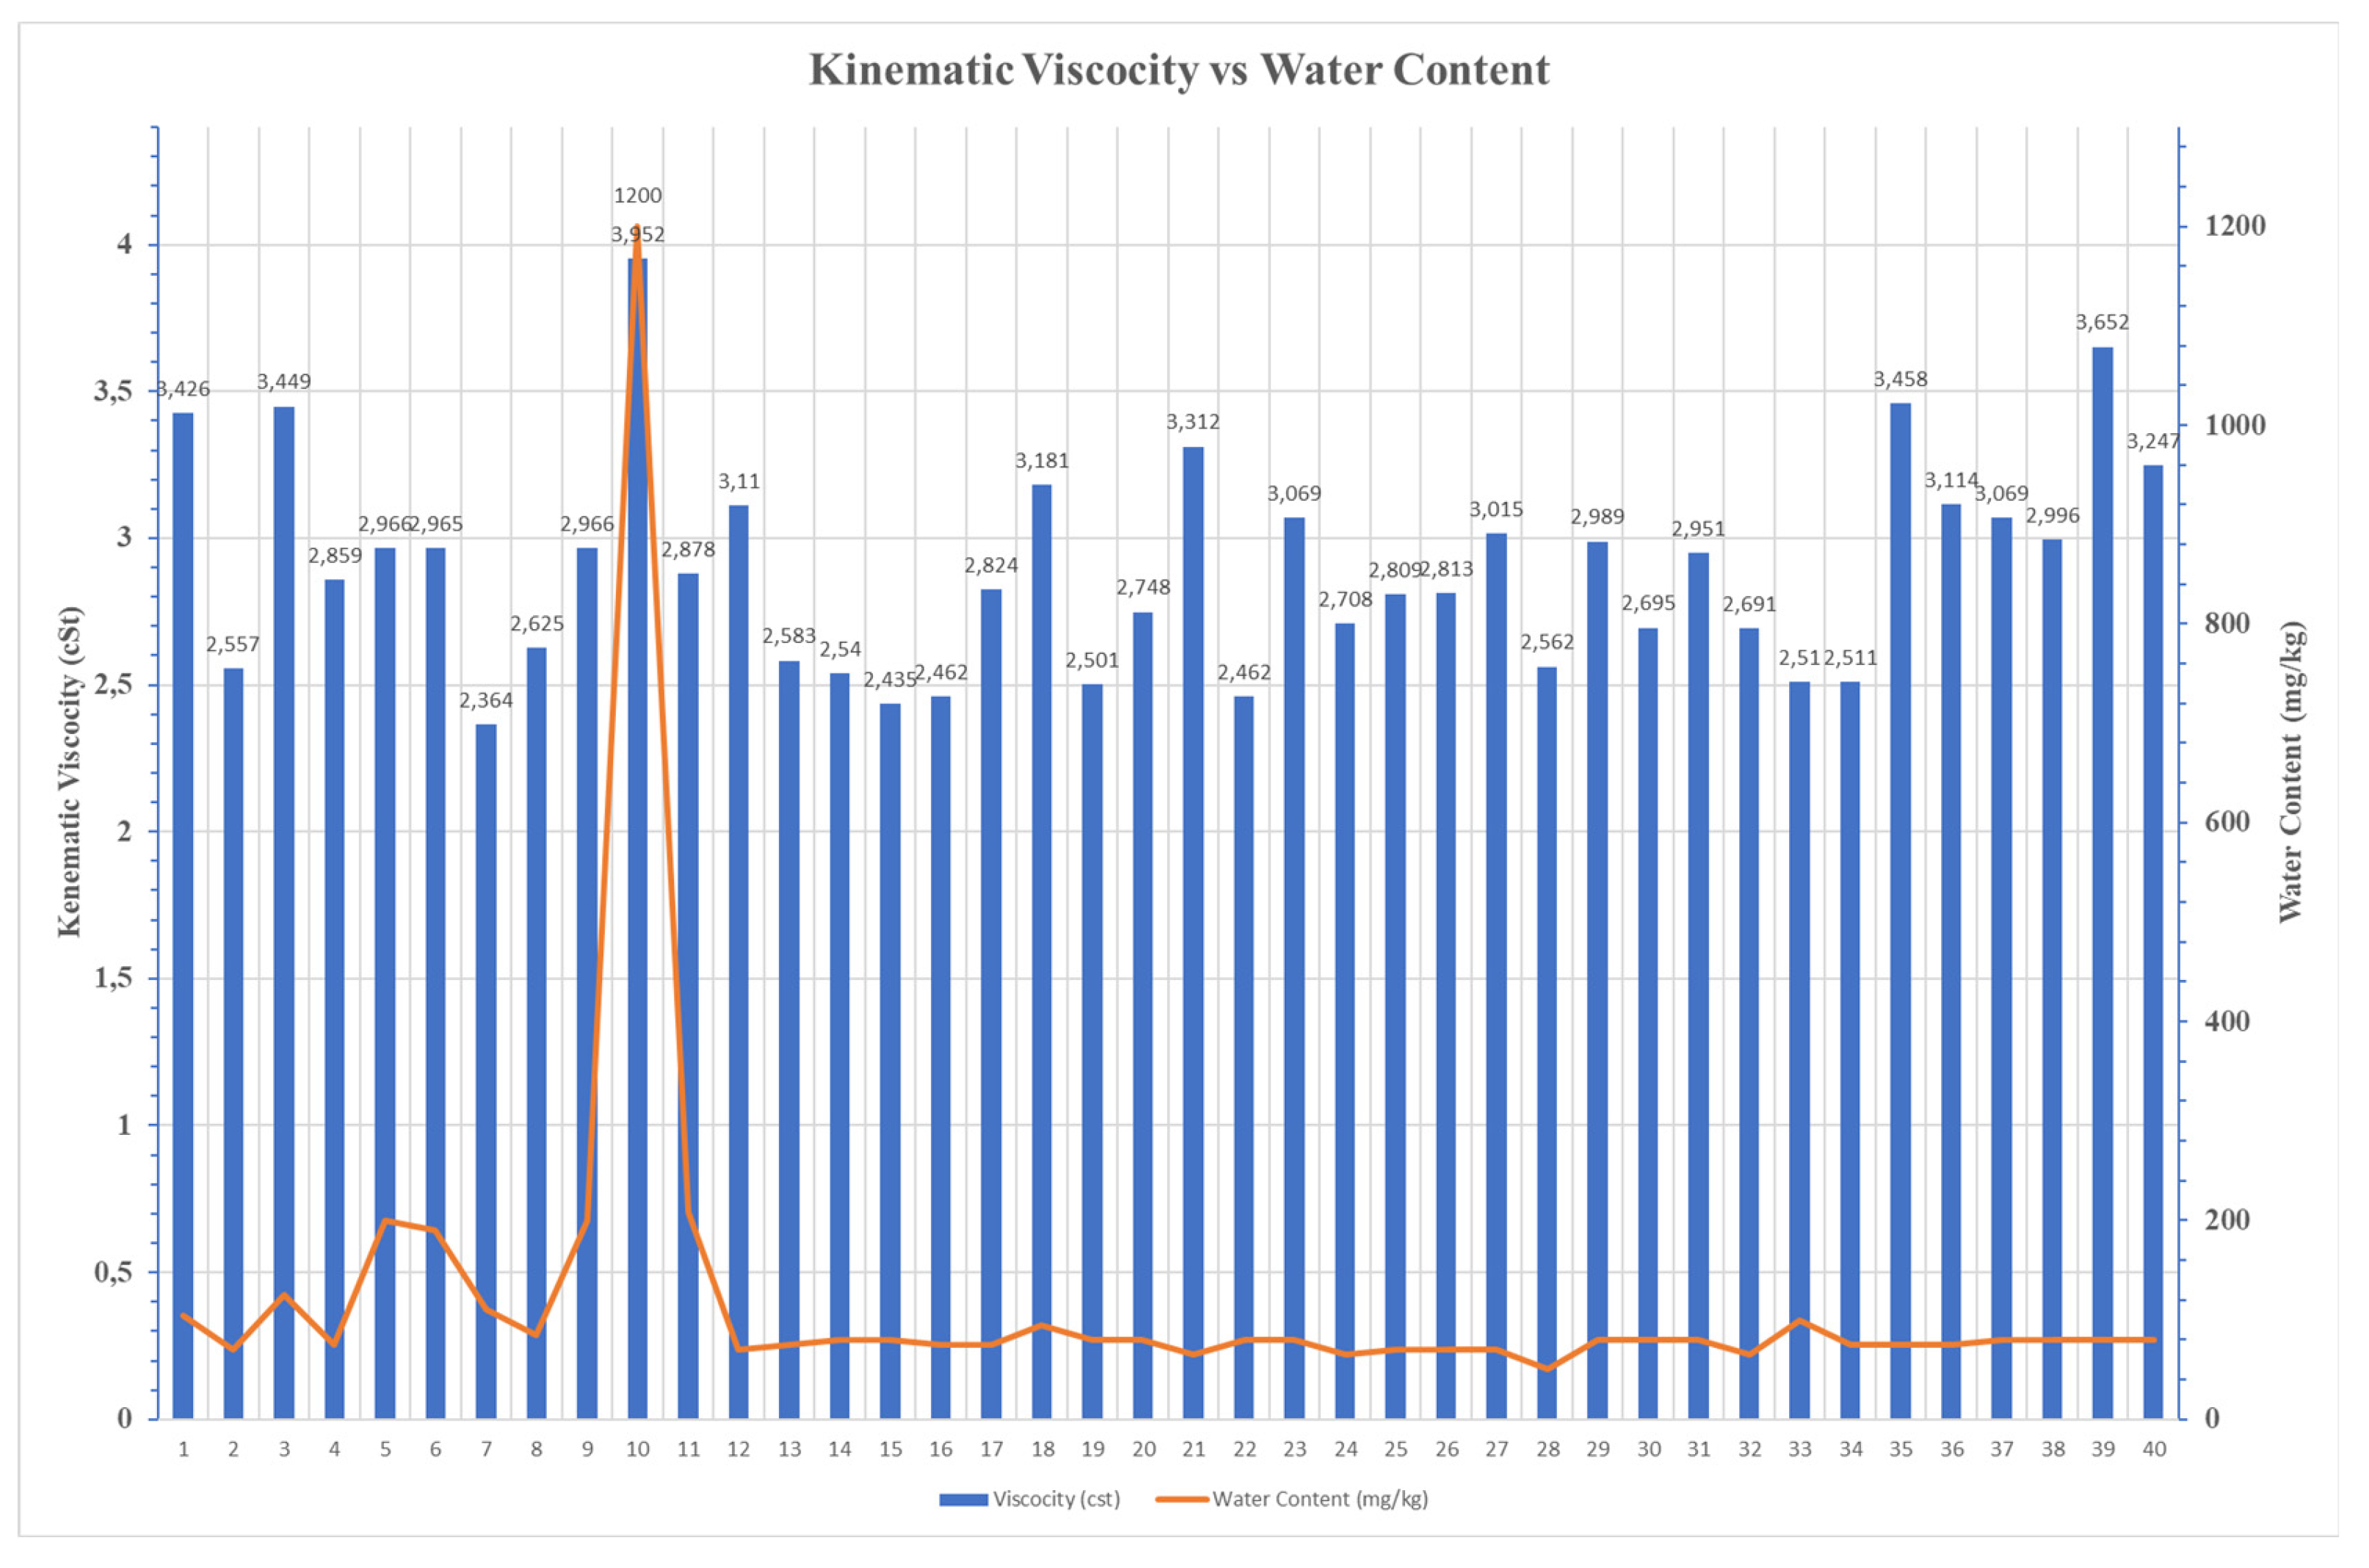
Figure 5.
Distribution of viscosity measurements versus total contamination from metallic compounds.
Figure 5.
Distribution of viscosity measurements versus total contamination from metallic compounds.
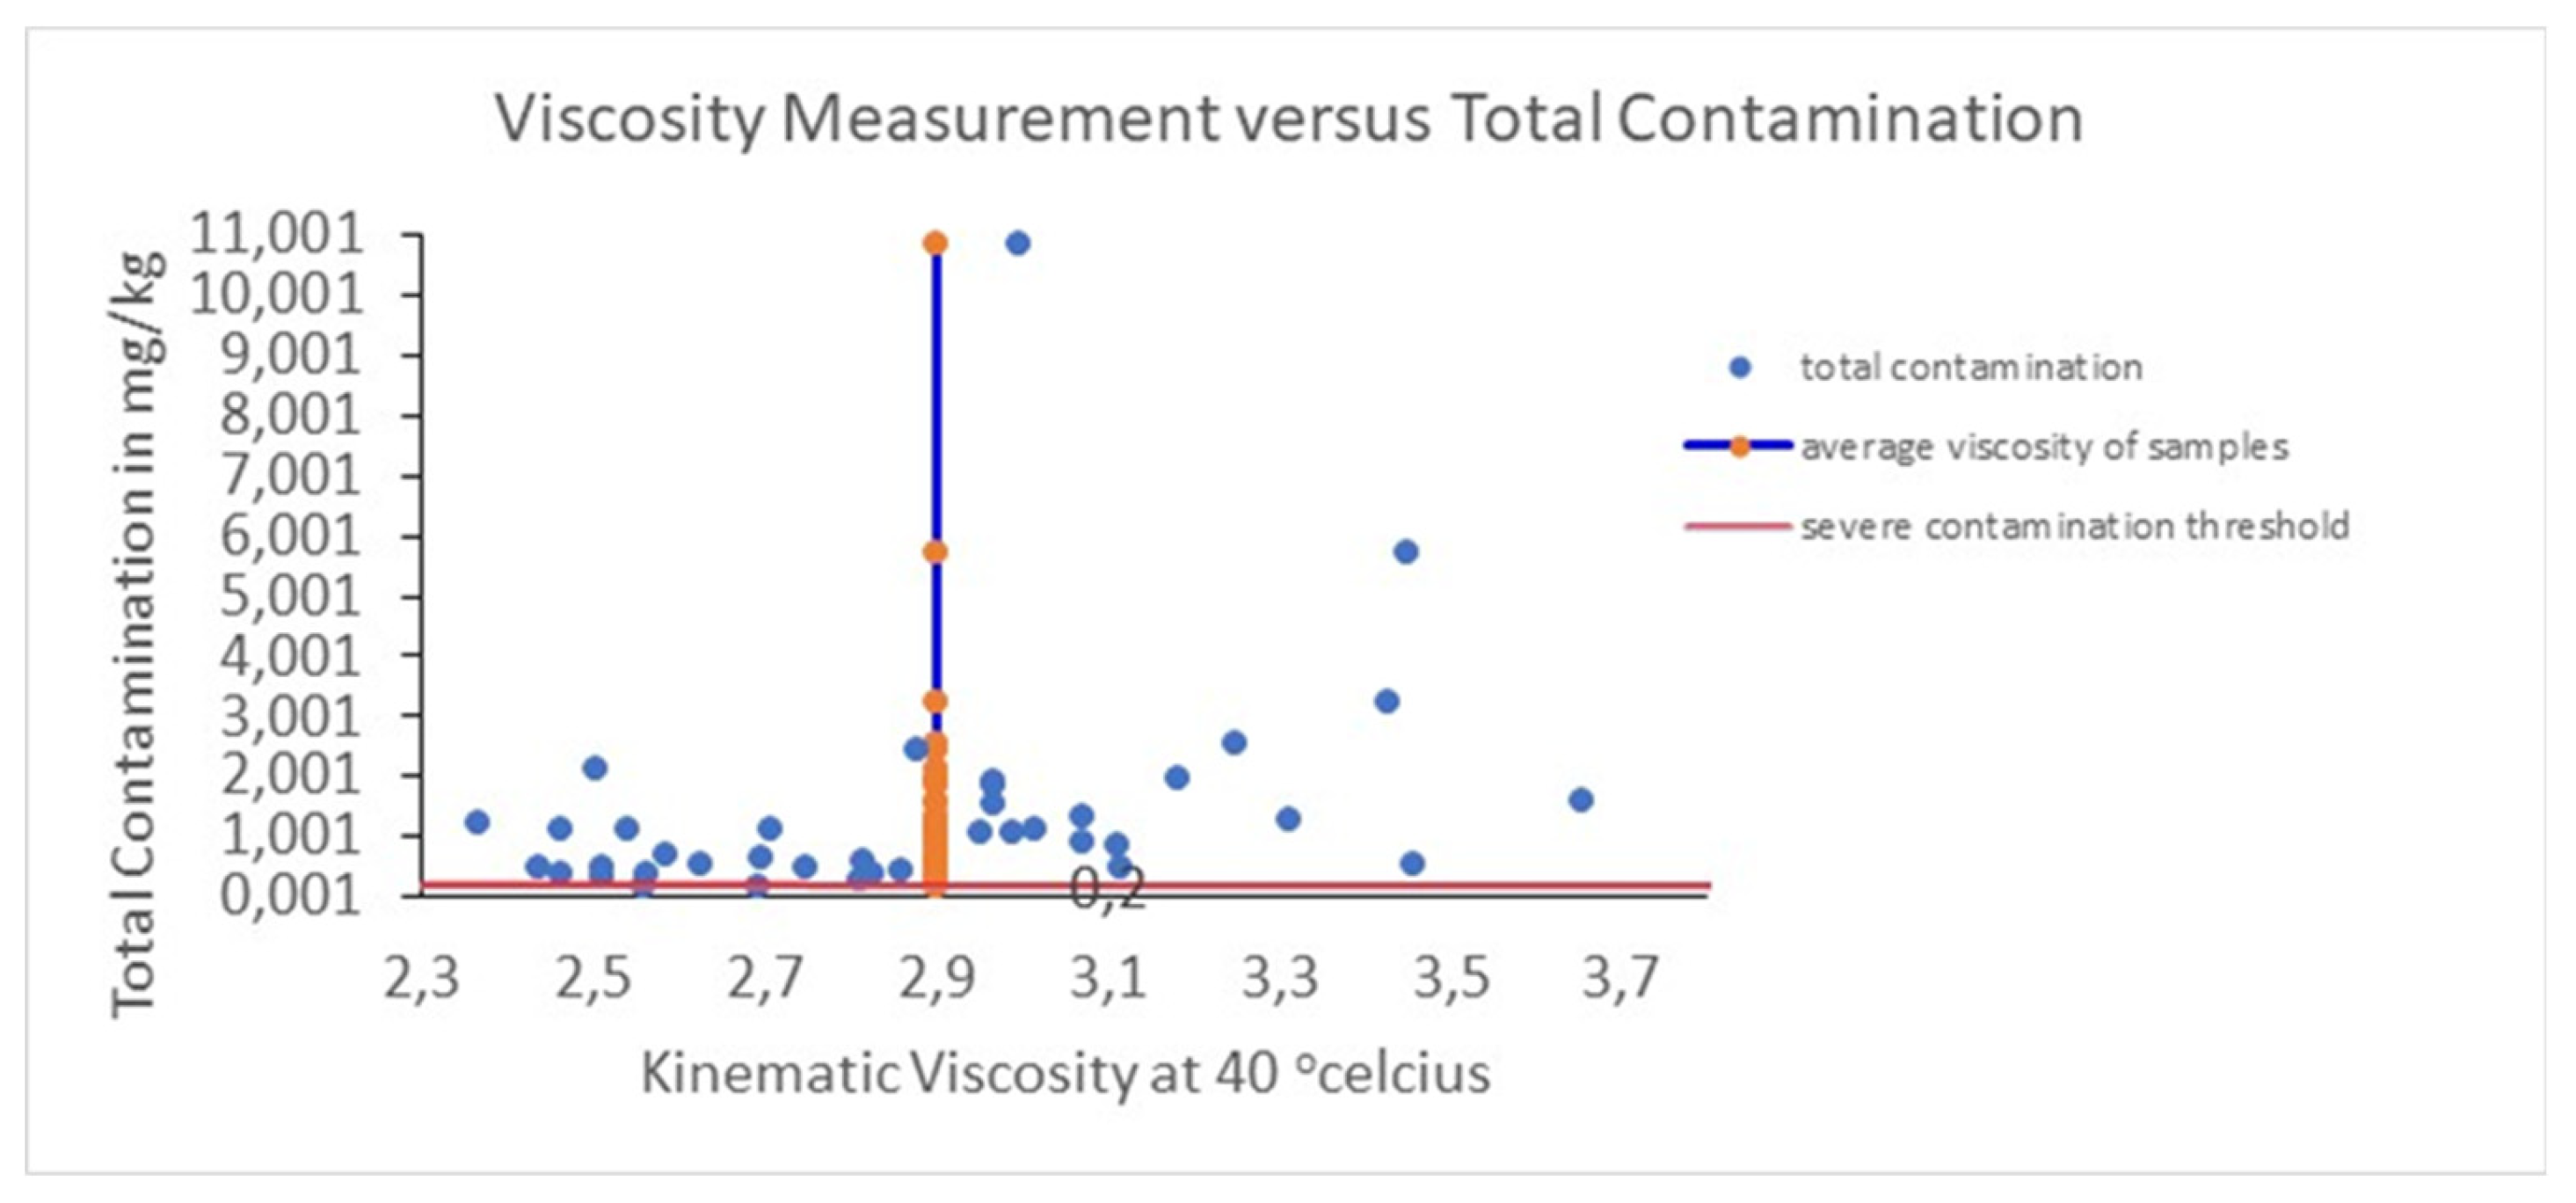
Figure 6.
Measured vs predicted viscosity values for the mixture. The dashed red line represents the ideal 1:1 correlation. Predictions are based on the nonlinear model y=α.exp(f(composition)). Data are shown on a logarithmic scale.
Figure 6.
Measured vs predicted viscosity values for the mixture. The dashed red line represents the ideal 1:1 correlation. Predictions are based on the nonlinear model y=α.exp(f(composition)). Data are shown on a logarithmic scale.
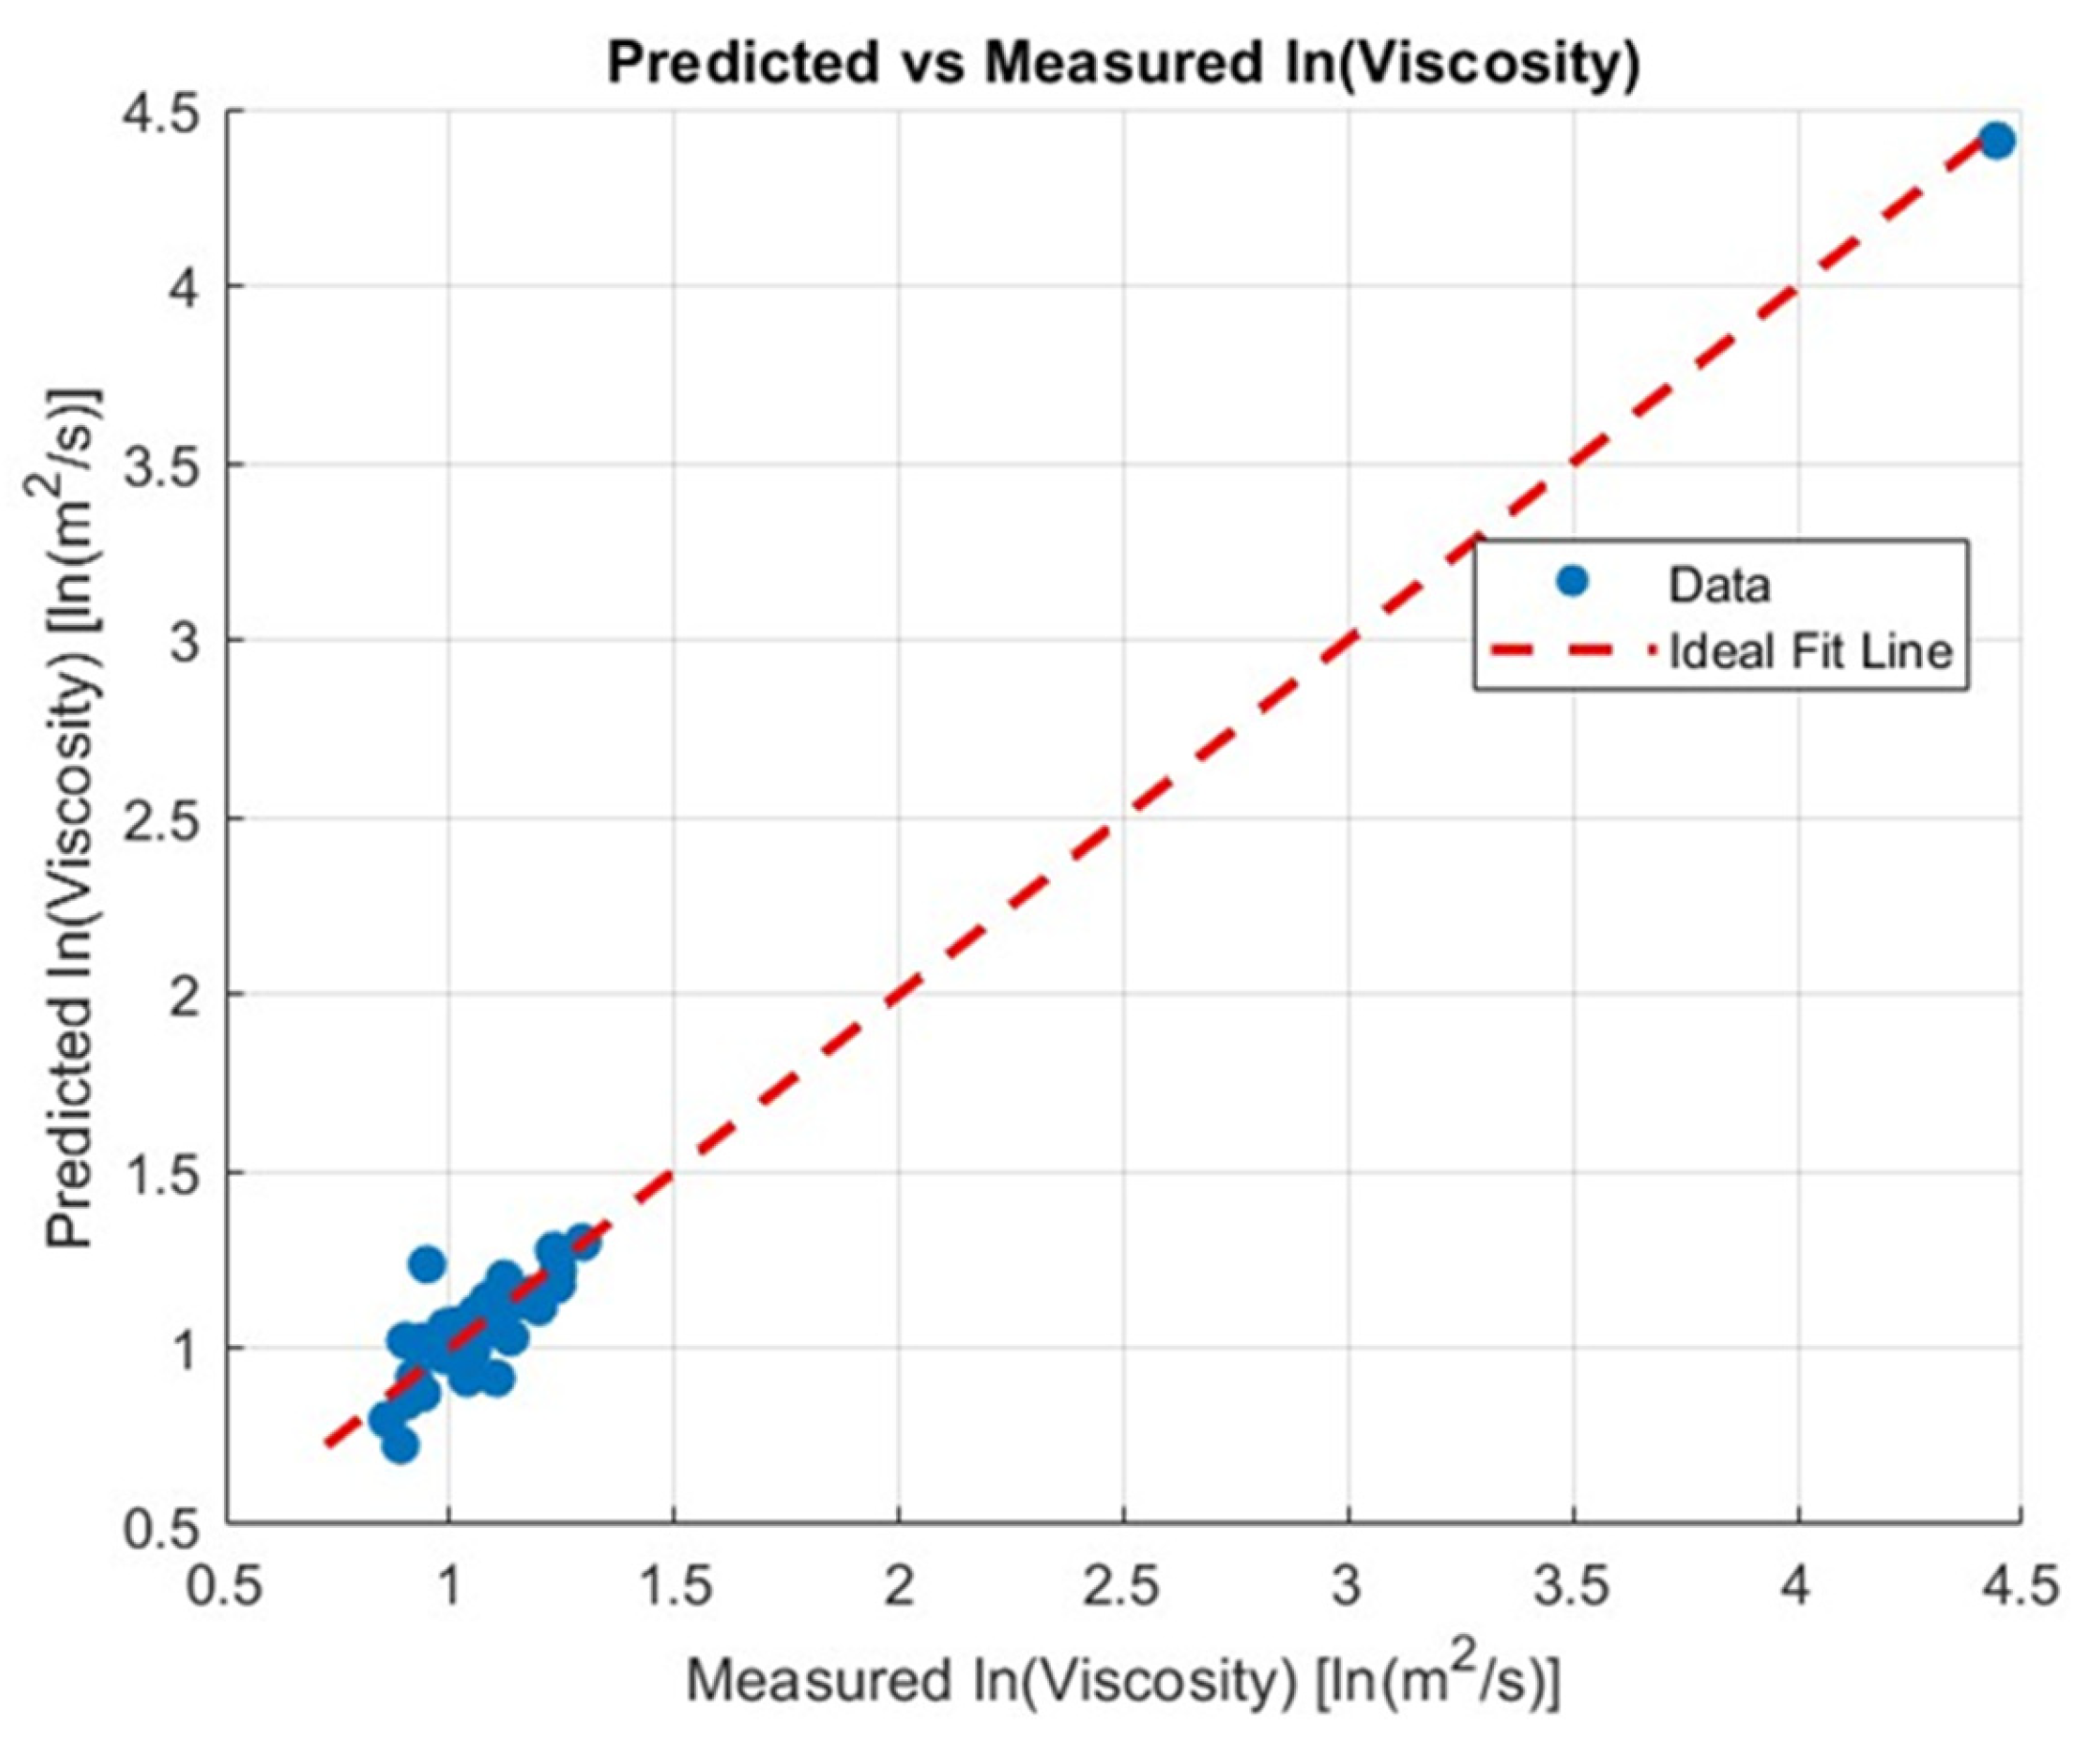
Figure 7.
Measurement of Metallic and non-metallic contaminants into chemical composition of marine diesel fuel samples.
Figure 7.
Measurement of Metallic and non-metallic contaminants into chemical composition of marine diesel fuel samples.
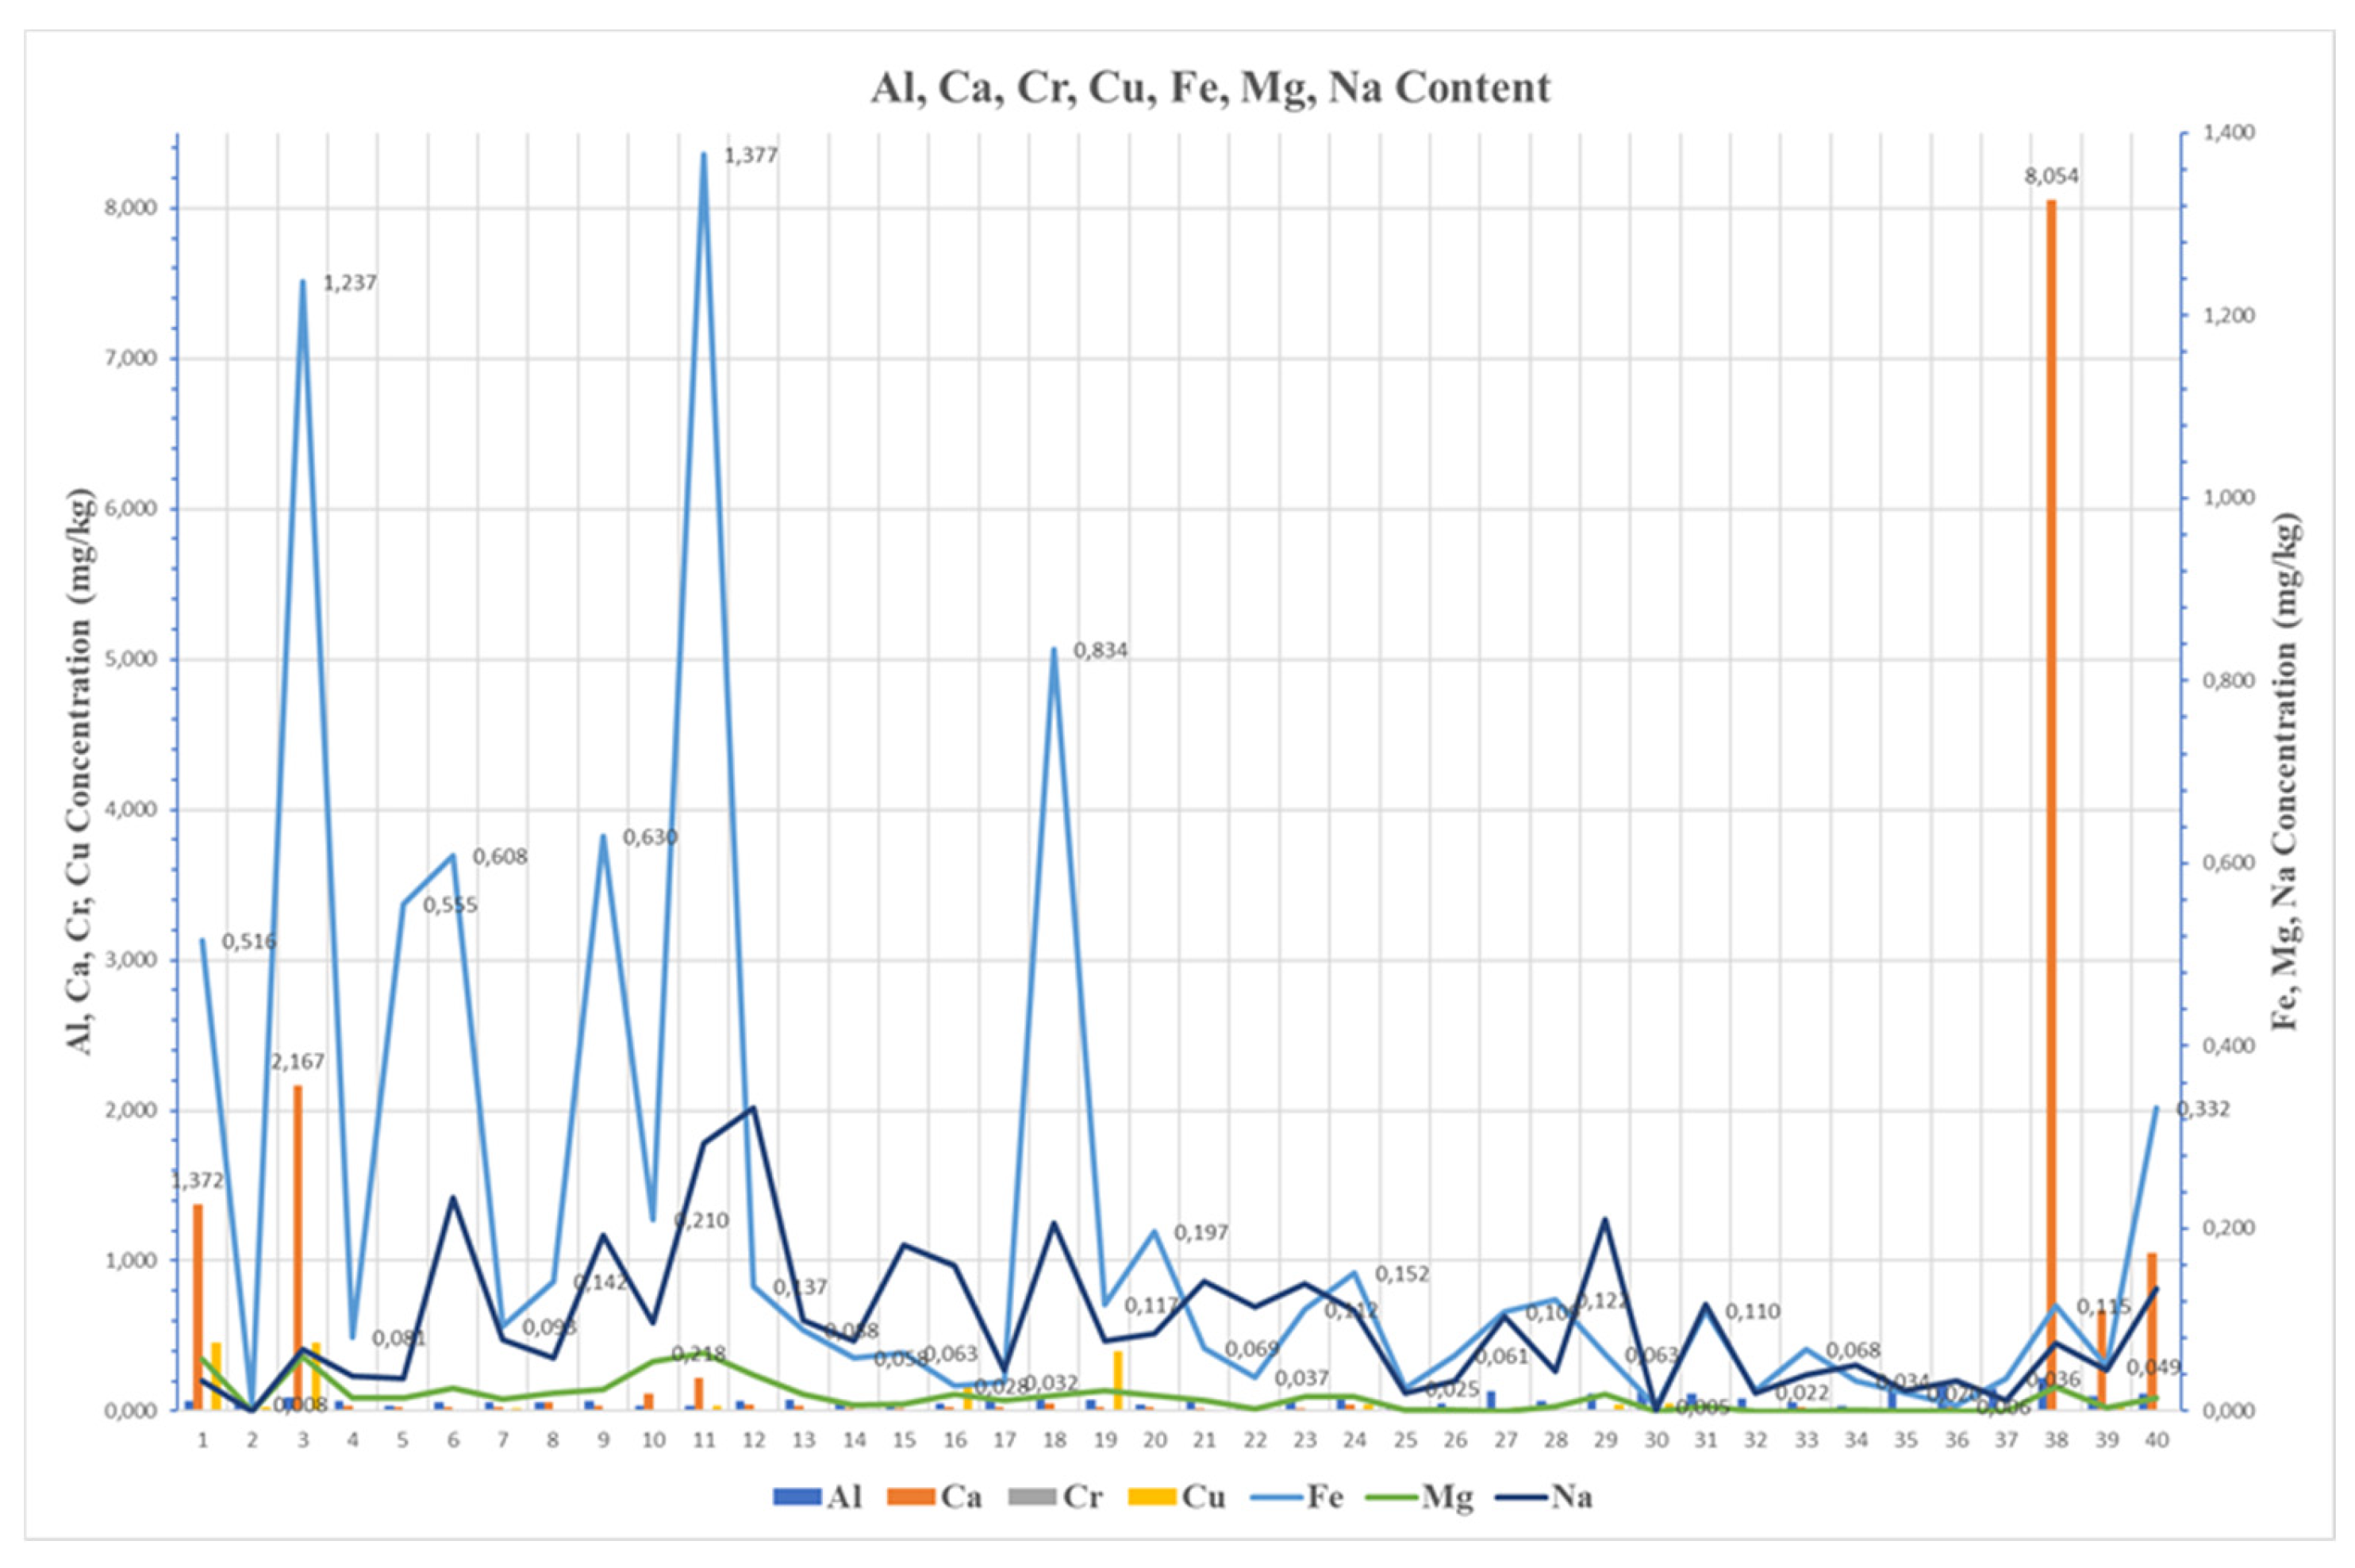
Figure 8.
Measurement of Metallic and non-metallic contaminants into chemical composition of marine diesel fuel samples.
Figure 8.
Measurement of Metallic and non-metallic contaminants into chemical composition of marine diesel fuel samples.
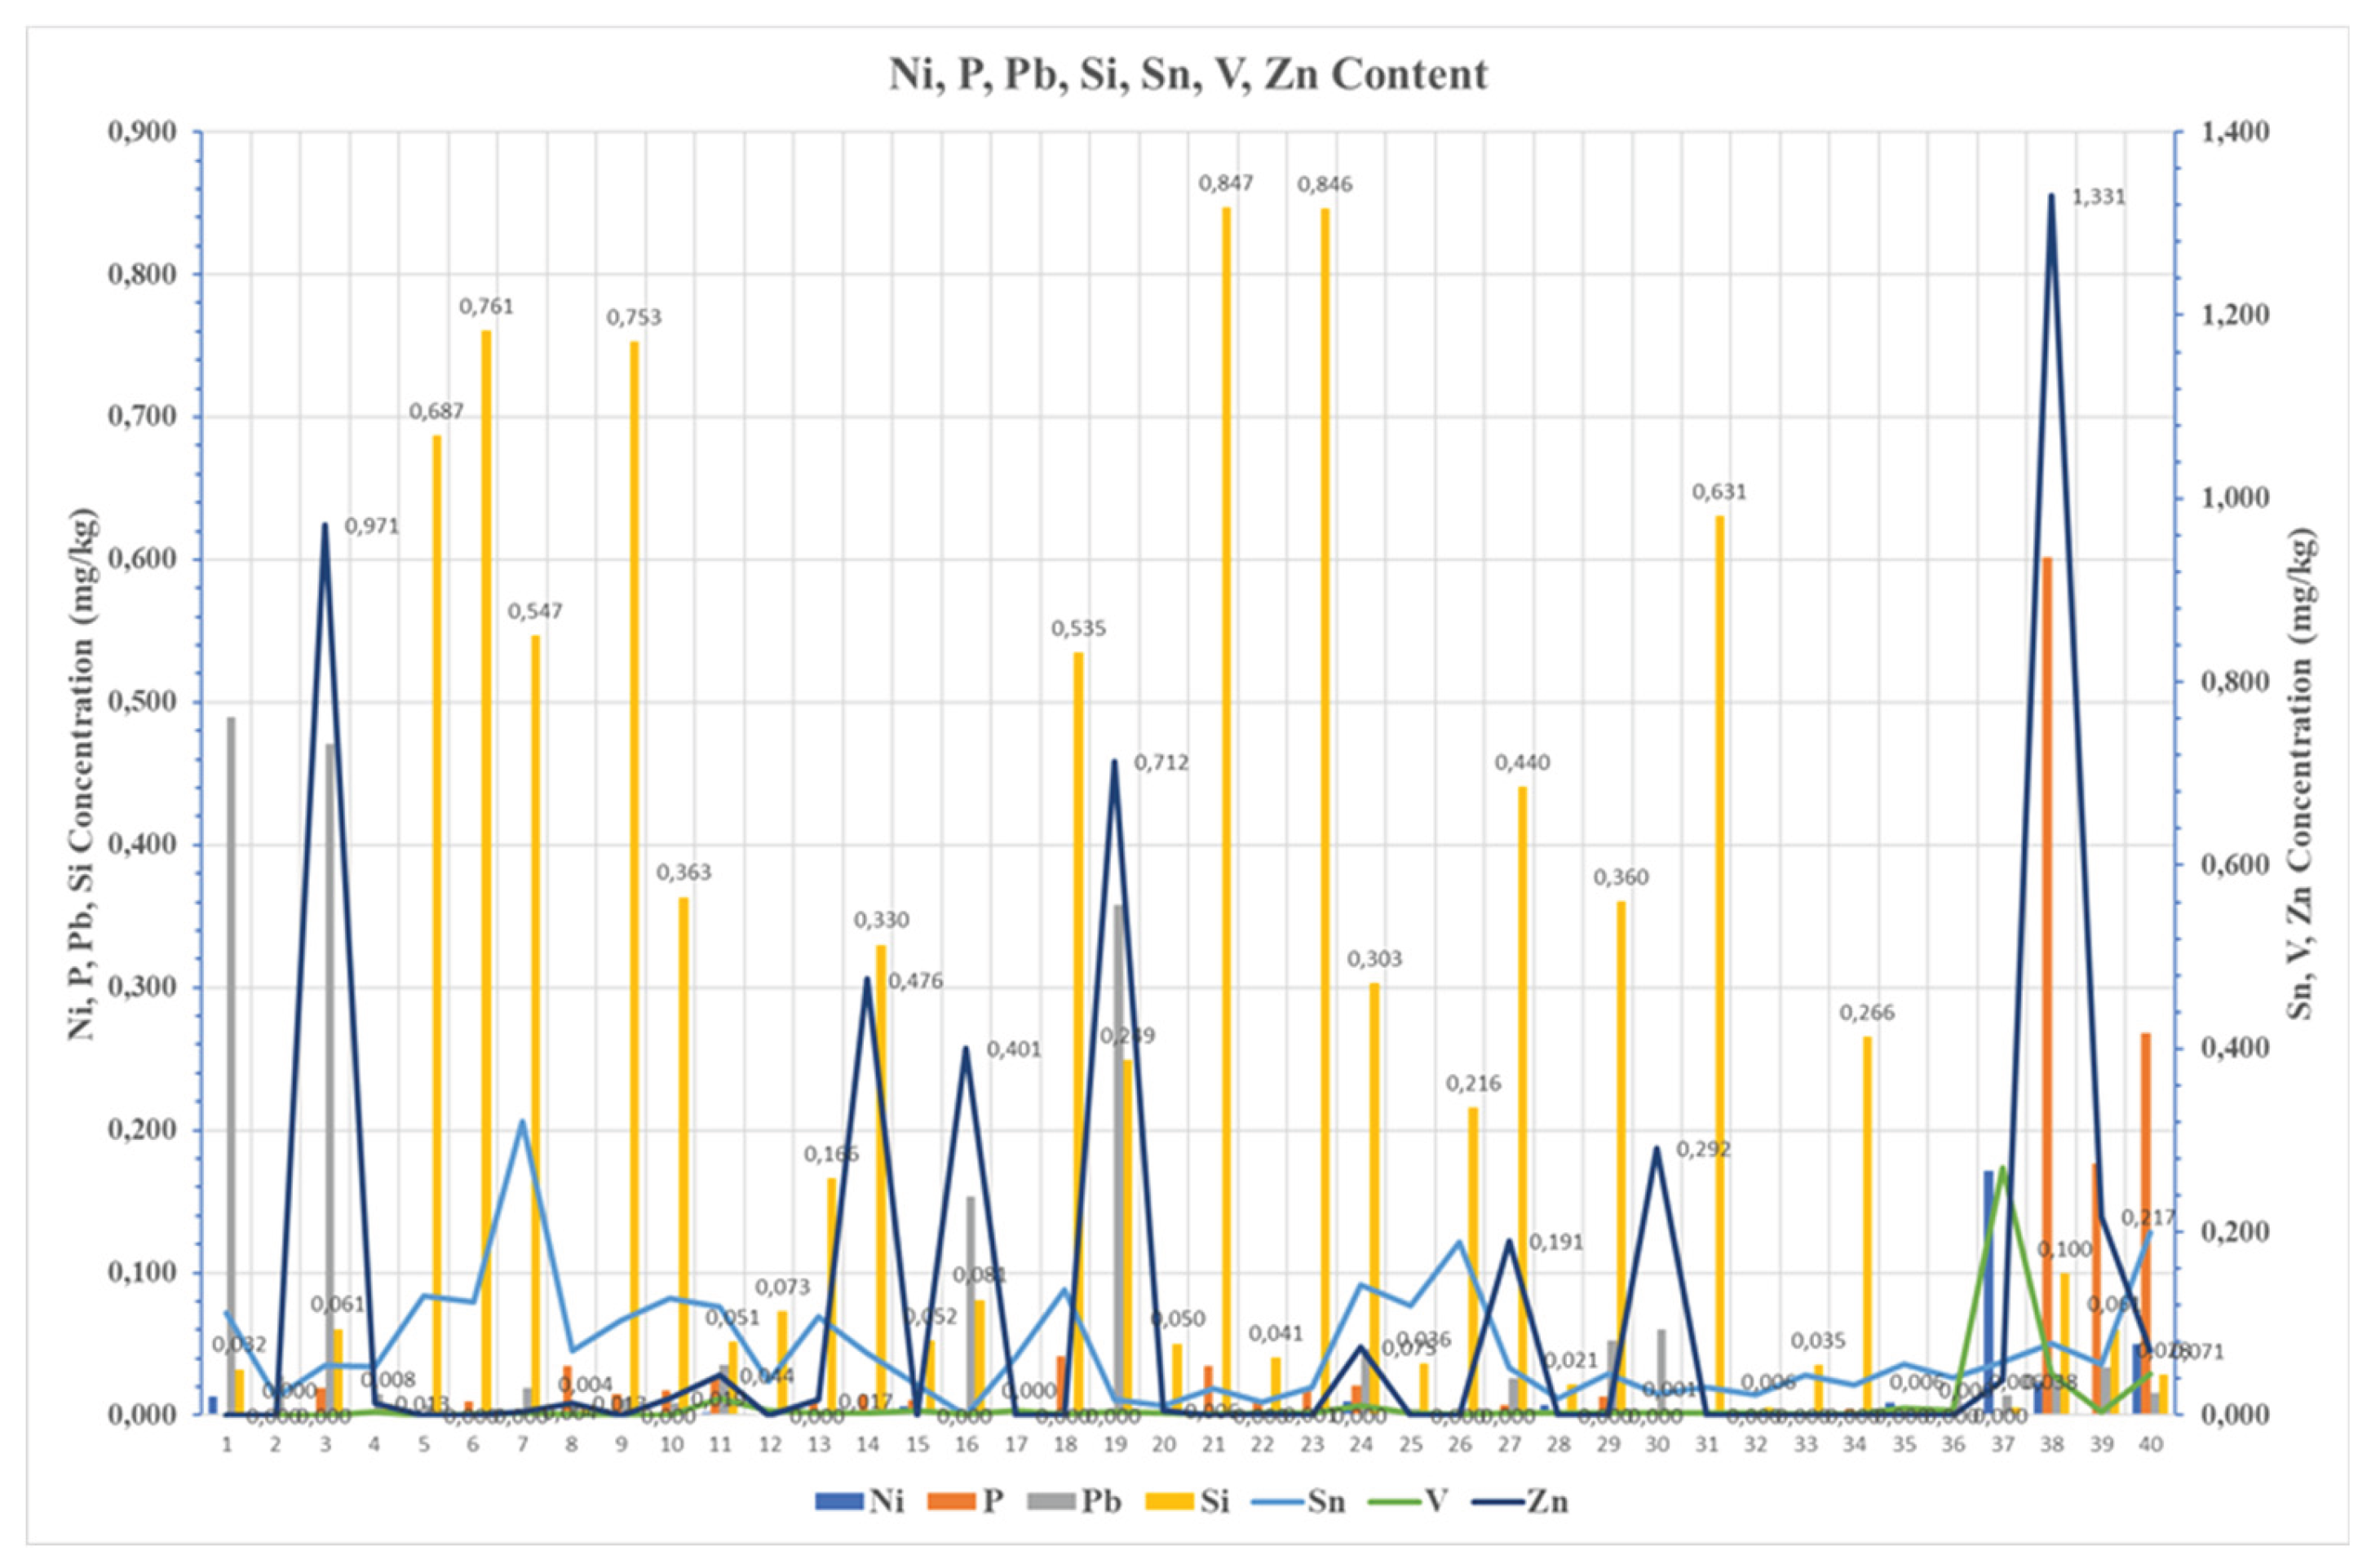
Figure 9.
Measurement of Metallic and non-metallic contaminants into chemical composition of marine diesel fuel samples.
Figure 9.
Measurement of Metallic and non-metallic contaminants into chemical composition of marine diesel fuel samples.
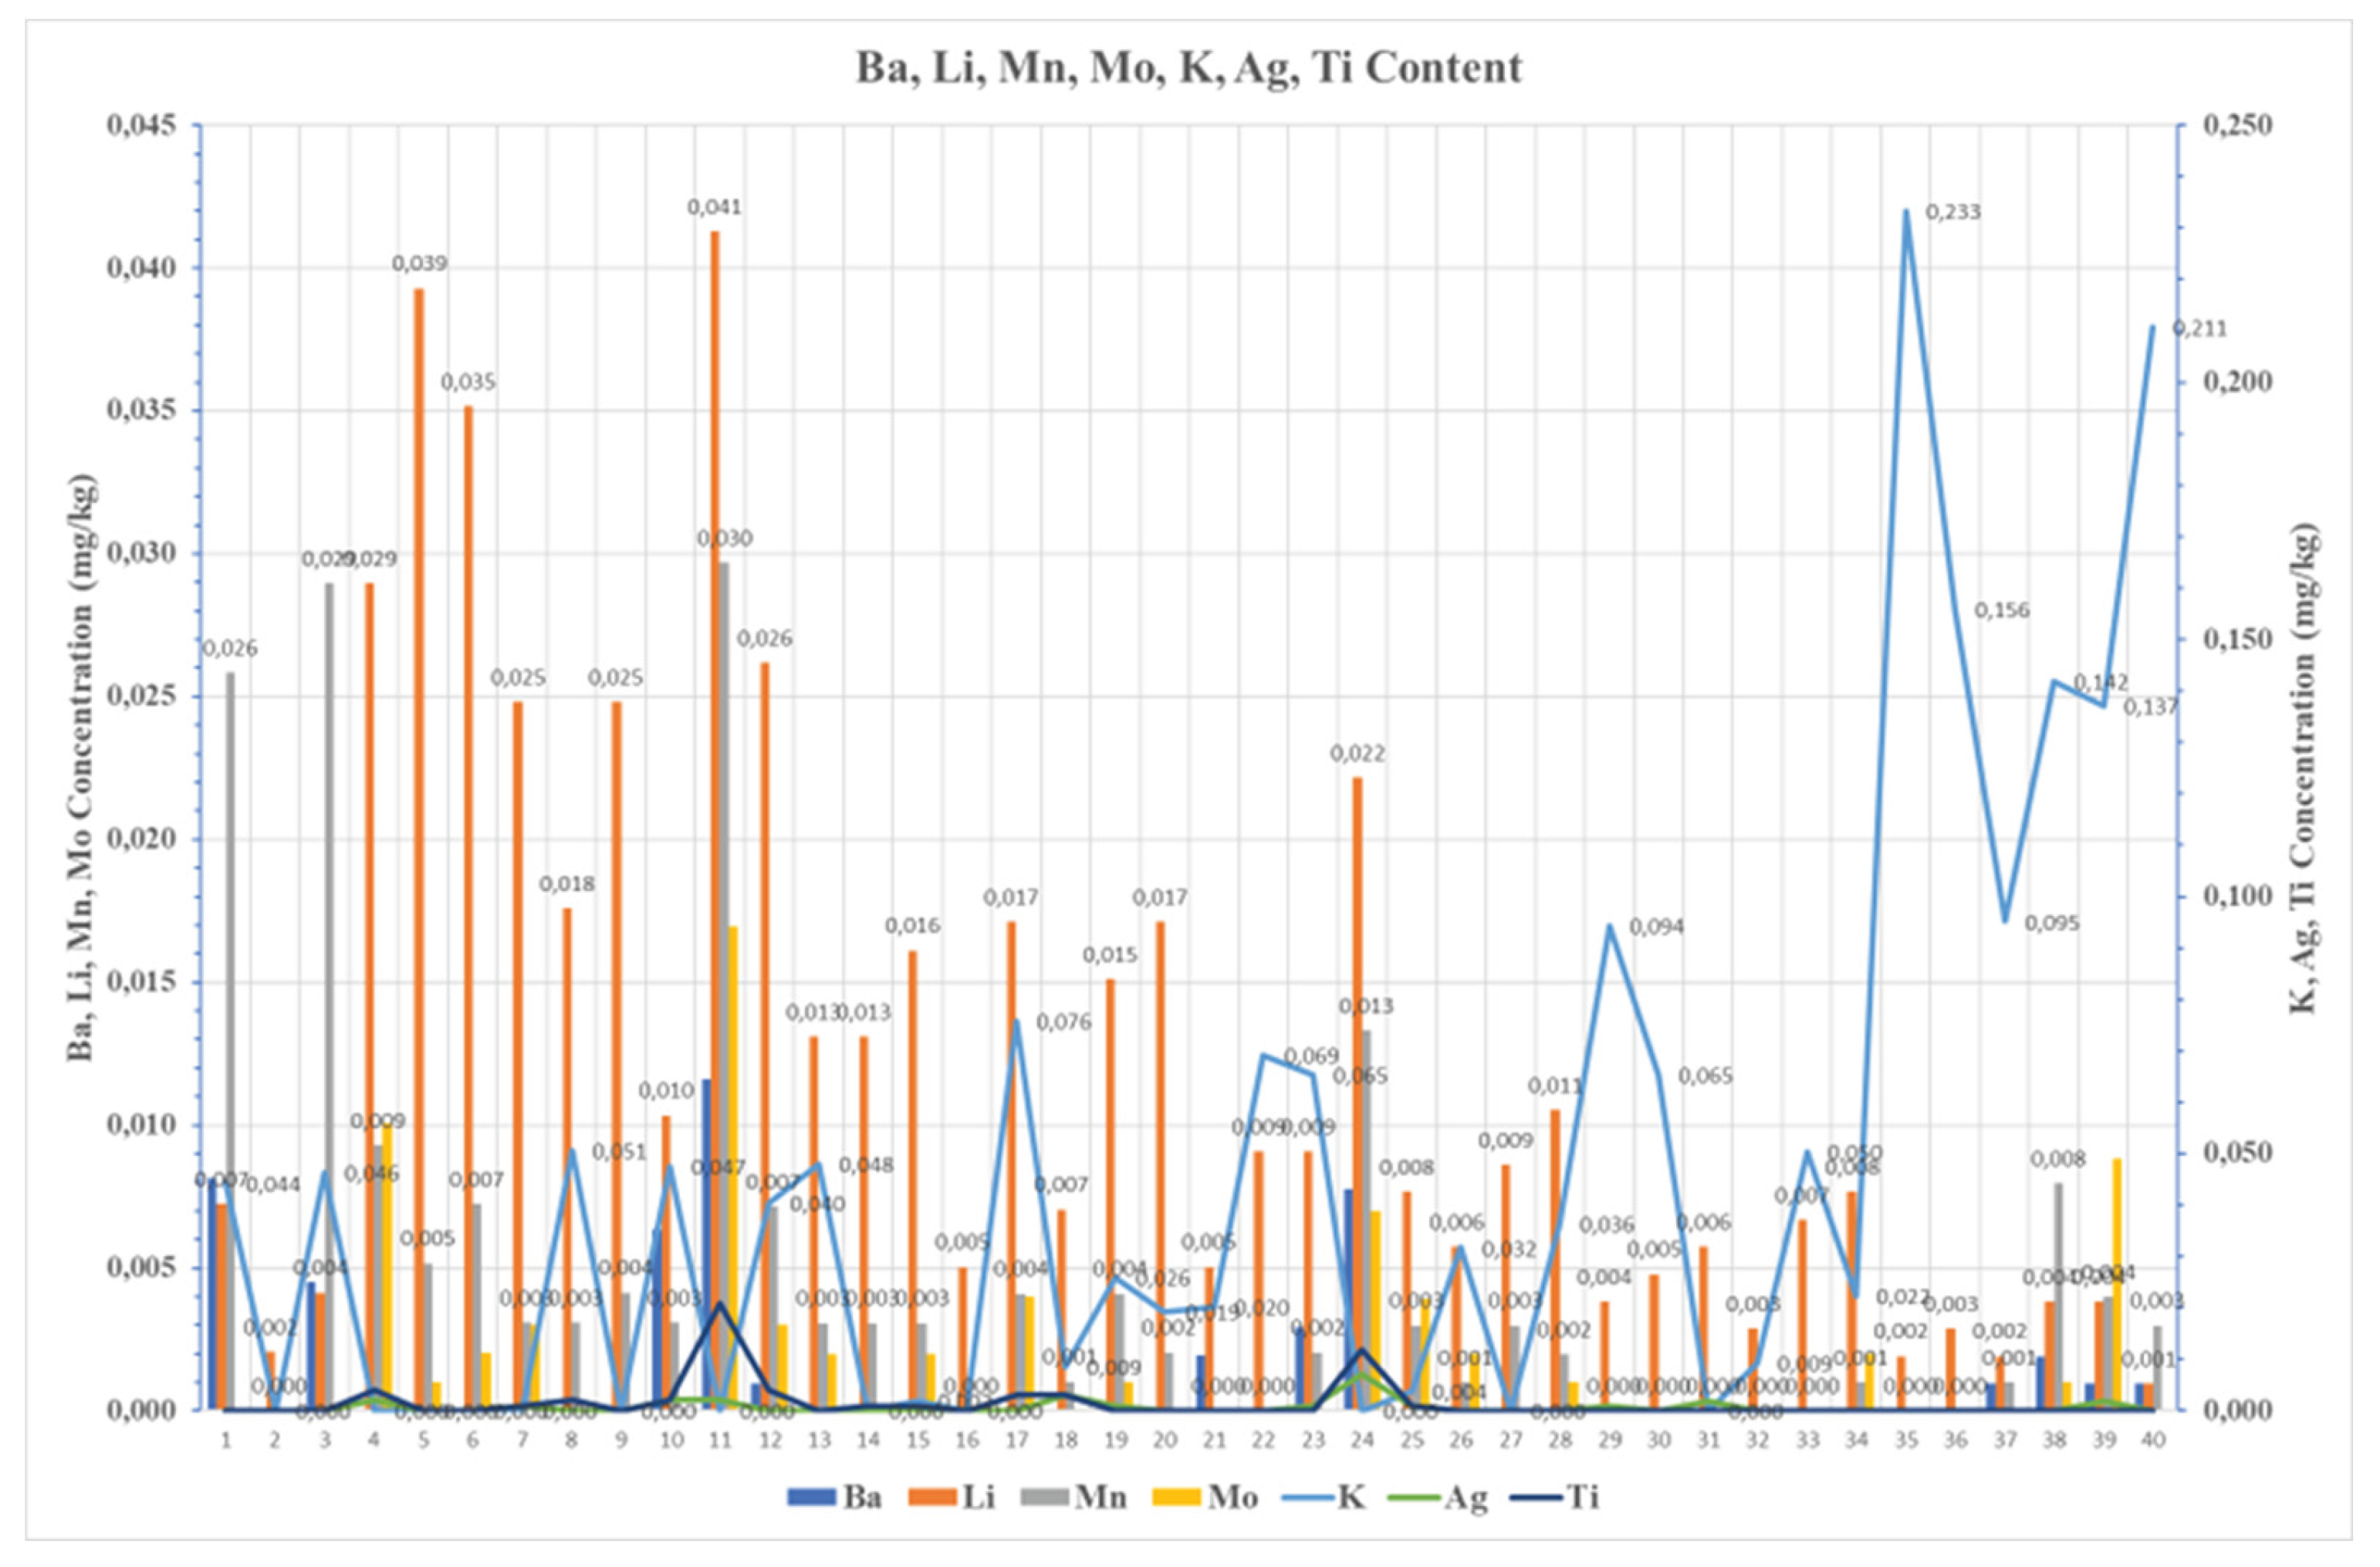

Table 1.
Summary of Marine Diesel Fuel Distillation Data.
| Volatility Family | High | Medium | Heavy Front | Outlier |
|---|---|---|---|---|
| Sample No. | 11-15, 19-20, 29, 34 |
1-6, 9, 16, 18, 21-26, 31-33 |
7, 8, 27, 28 |
30 |
| T10 (°C) | 168 – 205 | 193 – 220 | 205 – 217 | 216 |
| T50 (°C) | ~205 – 260 | 250 – 278 | 254 – 278 | 275 |
| T90 (°C) | 315 – 336 | 315 – 341 | 334 – 339 | 339 |
| T95 (°C) | 346 – 350 | 347 – 354 | 347 – 354 | 354 |
| Recovery at 250 °C (% v/v) |
34 – 44 | 30 – 44 | 30 – 32 | 32 |
| Recovery at 350 °C (% v/v) |
≥ 95 | 95 – 97 | 94.5 – 96 | 94.5 |
Disclaimer/Publisher’s Note: The statements, opinions and data contained in all publications are solely those of the individual author(s) and contributor(s) and not of MDPI and/or the editor(s). MDPI and/or the editor(s) disclaim responsibility for any injury to people or property resulting from any ideas, methods, instructions or products referred to in the content. |
© 2026 by the authors. Licensee MDPI, Basel, Switzerland. This article is an open access article distributed under the terms and conditions of the Creative Commons Attribution (CC BY) license.
Copyright: This open access article is published under a Creative Commons CC BY 4.0 license, which permit the free download, distribution, and reuse, provided that the author and preprint are cited in any reuse.


