
Submitted:
22 December 2025
Posted:
23 December 2025
You are already at the latest version
Abstract
The building sector accounts for approximately 30% of global energy use. The demand for energy-efficient, high-performance buildings is increasing given the increasing awareness of the climate crisis. The building envelope greatly influences overall building energy performance. Considering the broad shift from passive to adaptive systems, smart window technologies are attracting attention. Despite their potential, few scholars have examined occupant comfort in spaces with smart windows. This gap is addressed herein by comparatively analyzing occupants’ responses to thermal and visual environments in a room with a smart window (RoomSW) and a room with a conventional window (RoomCW) in a residential building in winter. The smart window is operated via a glare-prevention tint control strategy, whereby the tint level is adjusted stepwise when glare occurs. The results reveal that under thermal conditions comparable to those in an actual dwelling, winter-time smart window tinting for glare prevention does not decrease occupants’ thermal sensation or satisfaction. Regarding visual comfort, the conditions in both the RoomSW and RoomCW satisfy the minimum indoor illuminance requirements, but glare occurs in the RoomCW. The questionnaire results indicate greater satisfaction with the luminous environment in the RoomSW relative to the RoomCW. This difference is statistically significant (p < 0.05).
Keywords:
smart window
; thermal comfort
; visual comfort
; experiment
; survey
1. Introduction
The building sector accounts for 30% of global energy consumption and 27% of the total CO2 emissions; in the absence of appropriate measures, its share is projected to increase to approximately 70% by 2050 [1]. As the climate crisis driven by global warming becomes a tangible reality, the demand for energy-efficient, high-performance buildings continues to grow. Among the various components of a building, the envelope, in particular, significantly influences its overall energy performance. However, conventional passive envelope systems often exhibit suboptimal energy performance [2,3]. With the increasing conversion of passive systems into adaptive systems [4], smart window technologies have emerged.
Smart windows represent functional glazing systems that can be used to control solar radiation entering a building by adjusting the solar heat gain coefficient (SHGC) and visible transmittance (VT). These systems are classified into passive and active types depending on whether electrical power is required for their operation. The smart window applied in this study is an active suspended particle device (SPD) window, which operates on the principle that particles randomly dispersed in the off (tinted) state become aligned in the on (clear) state, allowing light to pass through. SPD smart windows are characterized by a very short switching (tinting) time and by the ability to finely adjust the transmittance at multiple levels according to the magnitude of the applied alternating current (AC) power. The operating principle of the smart window is illustrated in Figure 1, which shows its appearance in the tinted and clear states. By appropriately controlling the smart window in response to indoor and outdoor environmental conditions and occupant preferences, it is possible to achieve both energy savings and increased occupant comfort. With growing interest in green buildings and sustainable architecture and advances in related technologies, the smart window market is expected to expand in the future. According to a market research report by the International Market Analysis Research and Consulting (IMARC) group [5], the smart window market size is projected to increase from USD 1.2773 billion in 2023 to USD 3.88 billion in 2032, corresponding to a compound annual growth rate (CAGR) of approximately 12.7%.
Numerous scholars have conducted simulations and experiments focused on the multifaceted performance of smart windows. Mesloub et al. [6] evaluated the energy-saving potential and visual comfort improvement levels of SPD smart windows using the simulation tools Diva-for-Rhino and EnergyPlus. The smart window was operated under three control conditions, namely, fully clear, fully tinted, and automatically tinted according to incident solar radiation, and it was compared to a conventional window for each orientation. The simulation results were as follows: (1) in the fully tinted case, the cooling energy demand significantly decreased compared with that in the other cases, but the very low VT made it difficult to establish an adequate luminous environment, and (2) in the case where the window was automatically controlled to tint according to solar radiation, energy savings could be achieved while blocking glare and providing appropriate daylighting.
Masi et al. [7] conducted an experiment in a test room measuring 5.0 m in width and depth and 6.0 m in height to investigate the lighting and cooling energy-saving performance of smart windows. The results revealed that when the smart window was in a clear state, the lighting energy demand was the lowest and the cooling energy demand was the highest, leading to the greatest overall energy demand. In contrast, the case in which the window was tinted on the basis of the work plane illuminance reduced the total lighting and cooling energy demand by 3%, yielding the most favorable overall performance. Lee, Choi, and Song [8] installed an SPD smart window in a typical residential building and analyzed its effects on thermal and visual comfort and energy performance during the intermediate season (September–October) and the heating season (December) according to sky conditions and a tint control strategy. Four tint control cases were considered: fully clear (Case 1); tinting when the indoor air temperature exceeded 24°C (Case 2); tinting to maintain an indoor work plane illuminance of at least 200 lx (Case 3); and tinting to prevent glare while ensuring the minimum required illuminance (Case 4). The experimental results revealed that in the intermediate season, an automatic control strategy based on indoor work plane illuminance was considered effective, whereas in the heating season, an automatic control strategy triggered by glare occurrence was considered effective in terms of balancing visual comfort and heating energy performance. Ghosh, Norton, and Duffy [9] installed a conventional window and an SPD smart window in two cubic test boxes with dimensions of 0.7 m × 0.7 m × 0.7 m and evaluated daylighting performance under different sky conditions. Useful daylight illuminance (UDI), daylight factor (DF), and daylight glare index (DGI) were adopted as evaluation metrics. The results indicated that setting the transmittance of the SPD smart window to an intermediate level was effective for maintaining the UDI, DF, and DGI values within appropriate ranges.
Smart windows are still considered an emerging technology, and real-world applications remain relatively limited. For their wider use and adoption, it is necessary to evaluate their performance levels across various applications and establish appropriate control strategies. However, although smart windows adjust the SHGC and VT through tinting and directly influence occupants’ thermal and visual comfort levels, existing studies on smart windows have seldom addressed occupant comfort [10,11]. In addition, research analyzing how occupants actually perceive spaces where smart windows are applied is very scarce. To address this research gap, an experiment is conducted to investigate how the wintertime tinting of smart windows affects people, and occupants’ responses to thermal and visual environments in a space with a tinted smart window or a conventional window are compared and analyzed.
First, thermal and visual comfort evaluation indices for the occupants were examined, after which the evaluation items, indices, and test cases were defined. Participants were then recruited, and measurements and surveys were conducted in an experimental building where a smart window and a conventional window were installed. Data were collected on temperature, predicted mean vote (PMV), work plane illuminance, new daylight glass index (DGIN), and survey responses to the thermal and visual environments. These data were used to analyze the impacts of the wintertime tinting of smart windows on the perceived thermal and visual comfort levels of the occupants. The aims of this study were to promote the efficient use of smart windows and contribute to the realization of sustainable, high-performance buildings.
2. Review of Occupant Comfort Indicators
2.1. PMV
Thermal sensation is a concept that represents the perceived degree of cold or warmth, and ISO 7730 [12] and ASHRAE Standard 55 [13] define it using a seven-point scale from –3 to +3 (Table 1). An index that represents the thermal sensation of occupants on this seven-point scale is the PMV, for which the range from –0.5 to +0.5 is regarded as representing thermally comfortable conditions.
The PMV model, proposed by P.O. Fanger [14], is calculated by combining four physical environmental variables, i.e., air temperature, relative humidity, mean radiant temperature (MRT), and air velocity, and two personal variables, namely, metabolic rate (met) and clothing insulation (clo). By considering all six factors that influence thermal sensation, the PMV is distinguished from other indices, such as effective temperature (ET) and operating temperature (OT), and it enables the assessment of thermal sensation while considering diverse occupant activity and clothing levels. The use of the PMV is recommended only when the air velocity is less than 0.20 m/s, and is the PMV can be derived from Equations (1)–(4).
= metabolic rate (;
* 1 metabolic rate = 1 met =;
= effective mechanical power (;
= clothing insulation (;
* 1 clothing unit = 1 clo = W;
= clothing surface area factor;
= air temperature ;
= mean radiant temperature ;
= relative air velocity ;
= water vapor partial pressure (Pa);
= convective heat transfer coefficient ;
= clothing surface temperature.
2.2. DGIN
According to the International Commission on Illumination (CIE) [15], glare is classified into discomfort glare and disability glare. Discomfort glare refers to glare that causes discomfort without impairing the visibility or visual performance of the occupant. Conversely, disability glare refers to glare that temporarily causes a physical impairment of visual function such that the occupant cannot see a given object. To make appropriate use of the benefits of daylighting in buildings, glare control is essential. In contrast to research on disability glare, research on the mechanisms underlying glare discomfort, particularly glare caused by daylight, is limited [16,17], and because glare is inherently based on the subjective judgment of an occupant, evaluating both its occurrence and intensity is difficult. Nonetheless, several indices have been studied and developed to provide an objective evaluation of glare, including the unified glare rating (UGR), visual comfort probability (VCP), daylight glare probability (DGP), and daylight glare index (DGI). Among these parameters, DGP and DGI have been developed for the assessment of glare induced by daylight rather than electric lighting, and both are calculated using the same variables with different weights.
On the basis of experimental results obtained with an artificial large-area light source, Hopkinson [18] modified the British glare index (BGI) and proposed the DGI calculation formulas given in Equations (5) and (6). BGI, developed at a building research station, is an early index that was introduced for the quantitative assessment of glare. Subsequently, Chauvel [19] compared subjectively assessed glare with glare values derived from the calculation formulas and, by replacing in the denominator of Equation (6) with , redefined the expression for G (Equation (7)).
: Luminance of each segment of the light source ();
: Average luminance of environmental surfaces within the field of view ();
: Composition-weighted window luminance ();
: Solid angle of the light source ();
: Solid angle of the window ().
However, in these equations, deriving ,, , and using a luminance meter or imaging technique is not straightforward and suffers from limited accuracy, and additional data processing is required to define surfaces with uniform luminance levels. In relation to these issues, Nazzal [20] devised a method based on illuminance measurements instead of luminance. After further modification and refinement, the proposed DGIN [21], which enables the evaluation of discomfort glare caused by direct sunlight. A DGIN is an index that can be applied to nonuniform light sources that has been developed to better account for occupant comfort. The DGIN is obtained using Equation (8), and glare is considered to occur when its value exceeds 22 (Table 2). The variables related to Equation (8) are determined by Figure 2 and Equations (9)–(16).
, , and are the measured illuminance values.
X = a/2d, Y = b/2d
3. Materials and Methods
3.1. Evaluation Indicators and Case Definitions
As indicated in Table 3, the evaluation items and indices for thermal and visual comfort were defined. Temperature and thermal sensation were selected as evaluation items for thermal comfort, whereas glare and indoor illuminance were selected as evaluation items for visual comfort. For temperature, dry bulb and globe temperatures were adopted as objective evaluation indices. For thermal sensation, the PMV was used as an objective index, and the thermal sensation vote (TSV) and a questionnaire on satisfaction with the thermal environment were employed as subjective indices. For glare, the DGIN was adopted as an objective evaluation index, whereas for indoor illuminance, work plane illuminance was used as an objective index, and survey responses on perceived indoor brightness and brightness satisfaction were used as subjective indices. For thermal comfort, objective assessments based on dry bulb temperature, globe temperature, and PMV were compared with the subjective questionnaire responses of the subjects. For visual comfort, objective analyses of glare occurrence and illuminance adequacy were conducted using the DGIN and work plane illuminance, and these results were compared with the subjective questionnaire responses of the subjects.
From an energy performance perspective, in winter, it is advantageous not to tint smart windows because tinting can reduce solar heat gains and thereby increase heating energy consumption. However, even in winter, it is necessary to prevent glare by tinting the smart window. Previous research [8] has shown that in winter, a glare prevention tint control strategy that keeps the smart window clear under normal conditions and tints it in a stepwise manner when glare is likely to occur is the most effective strategy when both energy and comfort are considered. Accordingly, in this study, occupant thermal and visual comfort levels were evaluated with a glare prevention tint control strategy, which is expected to be widely applied as a smart window tint control approach for winter because it can maximize the benefits of smart windows.
A glare prevention tint control algorithm for the smart window was developed to maintain a horizontal work plane illuminance of at least 200 lx at the center of the room while preventing glare. The minimum indoor illuminance requirement was set in reference to the Korean Industrial Standard (KS A 3011) [22]. In the case study building, horizontal work plane illuminance and indoor vertical illuminance at the window plane were measured, and a regression equation was derived (Figure 3), from which it was confirmed that to ensure a horizontal work plane illuminance of at least 200 lx, the indoor vertical illuminance at the window plane had to be at least 1,814 lx. Accordingly, the VT values and tinting levels of the smart window were subdivided into ten steps according to the outdoor illuminance level (Table 4). For the smart window installed in this study, the VT ranged from a minimum of 0.013 in the fully tinted state to a maximum of 0.333 in the clear state, as shown in Table 9. For example, when the measured outdoor illuminance (outdoor vertical illuminance at the window plane) was 80,000 lx, the smart window tinted to a VT of 0.034 (tinting level 9), thereby reducing VT so that glare would not occur while maintaining a horizontal work plane illuminance of at least 200 lx at the center of the room.
The evaluation cases for thermal and visual comfort were all configured under the same environmental conditions. The thermal environment was controlled so that the PMV remained within ±0.5, a common control target for indoor thermal environments [13], to approximate typical residential indoor conditions. In the luminous environment, no electric lighting was used to evaluate daylighting performance, and the minimum indoor illuminance requirement was set to 200 lx [22]. Because glare prevention tint control was not activated under overcast conditions, the analysis was limited to clear days, as determined on the basis of sky conditions.
Sky conditions were determined from hourly total cloud cover data obtained from the Open MET Data Portal of the Korea Meteorological Administration (KMA) [23]. Total cloud cover represents the fraction of the sky dome covered by clouds, and the World Meteorological Organization (WMO) expresses cloud cover in eighths using the unit okta [24]. When clouds covered approximately 5/8 of the sky (5 oktas), direct solar radiation decreased sharply, whereas diffuse solar radiation still had a significant effect. The WMO classifies conditions with a cloud cover of 6/8 or more as cloudy (Table 5), and Matuszko [25] reported that the highest solar radiation intensity could be observed for total cloud cover levels between 3/8 and 6/8 because of the reflection and scattering effects of convective cumulus clouds. On the basis of the WMO classification and previous research findings, conditions with a total cloud cover of less than 6/8 were defined as clear days and those with 6/8 or more were defined as cloudy days.
3.2. Experimental Building
The case study building is a multifamily residential-type experimental building located in Sejong, Republic of Korea, and it is oriented to the southwest. Each floor consists of one 84 m² unit (Unit 101) and one 59 m² unit (Unit 102) (Figure 4). An SPD smart window was installed on the main façade of Unit 101, whereas a conventional double-glazed window was installed on the main façade of Unit 102. Bedroom 3 in Unit 101 (RoomSW, room with a smart window) and Bedroom 2 in Unit 102 (RoomCW, room with a conventional window) were selected as the experimental spaces because their floor areas were similar and their window sizes were identical, making them suitable for comparative analysis. No additional solar control devices were installed in the RoomSW or RoomCW, and the internal heat gains due to occupants, lighting, and equipment were kept the same in both rooms. The window performance characteristics for each room are summarized in Table 6.
3.3. Measurements
To evaluate the thermal and visual comfort levels of the occupants associated with smart window tinting, the experimental setup and instruments were arranged as shown in Figure 5. To measure thermal environmental variables, multifunctional environmental meters (Ⓘ, Ⓙ; model: Testo 480) were installed in the RoomSW and RoomCW at a height of 0.6 m at the center of each room, positioned 1.0 m away from the window. The dry bulb temperature, globe temperature, and PMV were recorded at 1-minute intervals, and the met and clo values were entered according to the conditions of the occupants who responded to the TSV questionnaire. To measure the luminous environmental variables, illuminance sensors (Ⓐ–Ⓗ; model: TR-74Ui) were installed. The data collected from illuminance sensors Ⓑ, Ⓒ, Ⓔ, and Ⓕ installed on the front and rear surfaces of the shields (Figure 5(c)), together with the data from sensors Ⓖ and Ⓗ attached to the indoor side of the window, were used to calculate the DGIN, whereas illuminance sensors Ⓐ and Ⓓ installed at a height of 0.85 m above the floor were used to measure the indoor work plane illuminance. The dimensions of the shields and the locations of all the instruments were determined and set in accordance with the DGIN calculation method and procedures presented in previous research [21]. In addition, an illuminance sensor for operating the glare prevention tint control algorithm was installed separately outdoors. To avoid shading effects that could occur if it were attached directly to the window, it was mounted vertically on the exterior wall adjacent to the window. All illuminance data were recorded at 1-minute intervals.
3.4. Subjects
A total of 16 participants participated in the experiment. A preexperiment questionnaire was used to collect data on participants’ age, height, weight, personal preferences for thermal and luminous environments, and health conditions on the day of the experiment (Table 7). All questionnaire data were anonymized, and all participants provided consent for the use of their information. Participants were advised to refrain from strenuous exercise and alcohol consumption on the day before the experiment, and all of them underwent a 30-minute stabilization period [26] in a waiting area prior to the start of the experiment. Participants who normally wore glasses or contact lenses did so during the experiment. The experiments were conducted in accordance with the ethical principles of the 1964 Declaration of Helsinki [27]. All the participants were fully informed about the experimental procedures and details and were advised that they had the right to withdraw from the experiment at any time and for any reason.
3.5. Experimental Procedures
In December 2023 (winter), TSV, thermal environment satisfaction, brightness perception, and brightness satisfaction surveys were conducted a total of eight times (Table 8), with two participants taking part in each session. The sky conditions on each survey date were checked, and the survey dates corresponding to the thermal and visual comfort evaluation cases were organized as shown in Table 9.
Before entering the RoomSW and RoomCW, all participants spent a certain period in a waiting area for stabilization. The waiting area was controlled such that the PMV was within ±0.5 and the air velocity was below 0.2 m/s [13], and the horizontal illuminance was set to 400–500 lx using electric lighting. All participants wore clothing corresponding to an insulation level of 1.0 clo, and the metabolic rate was set to 1.0 met (seated, relaxed) [12]. As shown in Figure 6, the experiment was conducted such that two participants first spent 30 minutes stabilizing in the waiting area and then moved to the RoomSW and RoomCW, where they remained for 40 minutes. This process was repeated twice in a crossover manner (total duration of 140 minutes). Each participant experienced both the RoomSW and RoomCW once, resulting in two data sets per room being obtained for each experimental day.
Before the participants entered, both the RoomSW and RoomCW were kept open, and the thermal environment was adjusted using heating equipment so that the PMV was maintained within ±0.5. The surveys were conducted between 12:00 and 15:00, when solar radiation was relatively strong. After the participants entered, the doors were closed, and the experiment was conducted without electric lighting. Using heating equipment that automatically turned off upon reaching the target temperature and turned back on when the temperature fell below the target, the PMV in the experimental rooms was maintained within ±0.5 throughout the experimental period. From the time the participants entered the RoomSW and RoomCW, they responded to questionnaires on the TSV, their satisfaction with the thermal environment, the perceived brightness, and their satisfaction with the brightness at 10-minute intervals. The questionnaire scales for each evaluation item and a scene of the occupants completing the survey are shown in Figure 7. On the basis of the questionnaire results, the subjective responses of the occupants to the thermal and luminous environments were quantified.
3.6. Data Processing and Analysis
During the survey period, environmental variables related to thermal and visual comfort levels were measured at 1-minute intervals, and the questionnaire responses of the occupants were collected at 10-minute intervals. In accordance with the experimental schedule, which was designed so that the two participants alternated between the rooms, survey data for both thermal and visual comfort in the RoomSW and RoomCW were obtained from a total of six participants for each room (two participants per day over three days). At 10-minute intervals, the measurement data and the occupant questionnaire responses were collected and examined, and average values of each variable over the entire survey period were obtained.
Statistical analysis was performed using paired sample t tests in IBM SPSS Statistics®. Since each participant completed the questionnaire five times at 10-minute intervals from the time of entry, a total of 30 questionnaire responses were obtained for each survey item. When the number of data points was 30 or more, it could be assumed that both the sample and population followed a normal distribution; therefore, a separate normality test was not conducted. Under a specific directional hypothesis that when one group was either smaller or larger than the other, a one-tailed test was used. Conversely, a two-tailed test was used to examine whether there was a difference between the two groups without assuming any directionality, and the p value was checked accordingly. The significance level (α), which is the criterion for determining the p value, is generally set to 0.05 [28,29,30]. In this study, a result was regarded as statistically significant when the p value of the one-tailed test was less than 0.05.
In addition, the effect size was examined to determine the practical magnitude of the differences between groups. Effect size is an index used to assess statistical power, and in the case of t tests, Cohen’s d is typically used [31,32]. Cohen’s d is interpreted in terms of its absolute value, and it indicates how large the actual difference between groups is. A value of 0.2 ≤ Cohen’s d < 0.5 is interpreted as a small effect, 0.5 ≤ Cohen’s d < 0.8 as a medium effect, and Cohen’s d ≥ 0.8 as a large effect.
4. Results
4.1. Thermal Comfort
4.1.1. Dry Bulb and Globe Temperatures
On the three clear days analyzed (10, 17, and 24 December), the average tinting level of the smart window during the survey period (12:00–15:00) was level 8 (Figure 8), and Figure 9 shows the temperature indices over the 40-minute survey period. The dry bulb temperatures in the RoomSW and RoomCW (Figure 9(a)) ranged from approximately 19°C to 24°C, and the globe temperature (Figure 9(b)) ranged from 20°C to 25°C. Prior to the experiment, the indoor temperature range corresponding to the PMV within ±0.5 was identified and used to set the target temperature. The heaters were operated such that they switched off automatically upon reaching the setpoint and switched on again when the temperature fell below it. As a result, the dry bulb and globe temperatures varied within a certain range, and the mean dry bulb and globe temperatures during the survey period were 21.4°C and 22.3°C, respectively, in the RoomSW and 21.3°C and 22.1°C, respectively, in the RoomCW. Statistical analysis revealed that the differences in dry bulb and globe temperatures between the two rooms were not statistically significant, and the effect sizes were very small, indicating a minimal difference (Table 10).
4.1.2. Thermal Sensation
The thermal sensation indices during the 40-minute survey period are shown in Figure 9. The PMV values (Figure 9(c)) in both rooms were controlled to remain within ±0.5 throughout the survey, in accordance with the predefined environmental conditions, and the mean PMV values in the RoomSW and RoomCW were 0.0 and +0.1, respectively. With respect to the TSV responses of the occupants (Figure 9(d)), the TSV values in both RoomSW and RoomCW were within the comfort range except at the time of entry, and the occupants generally perceived the rooms to be cooler than those indicated by the PMV index. The mean TSV values were –0.5 and –0.4 in the RoomSW and RoomCW, respectively, indicating no substantial difference between the two spaces. In the case of thermal environment satisfaction (Figure 9(e)), large variations were observed depending on individual tendencies, and the mean satisfaction scores were 0.0 and –0.1 in the RoomSW and RoomCW, respectively, indicating no substantial difference between the two rooms, similar to the TSV responses. Statistical analysis revealed that the differences in PMV, TSV, and thermal environment satisfaction between the two rooms were not statistically significant, and considering the effect sizes, these differences could be interpreted as practically negligible (Table 10). Although the glare prevention tint control algorithm was in operation, the subjective thermal sensation and satisfaction of the occupants did not differ from those in the room with a conventional window. The results suggested that in the absence of a meaningful difference in the physical thermal environment, smart window tinting would not induce changes in the thermal sensation or satisfaction of the occupants, and its influence would likely be further reduced by the fact that the smart window was not in a fully tinted state.
4.2. Visual Comfort
4.2.1. Glare
The glare index data during the 40-minute survey period are shown in Figure 10. In the RoomSW, the DGIN (Figure 10(a)) remained below 22, the threshold for judging the occurrence of glare, throughout the survey, indicating that glare did not occur. In contrast, in the RoomCW, the mean DGIN exceeded 22 at all times, and when interpreted with reference to the median, the DGIN was above 22 in more than half of the cases, indicating that glare occurred. The mean DGIN values in the RoomSW and RoomCW were 9.6 and 24.1, respectively. Statistical analysis revealed that the difference in the DGIN between the two rooms was statistically significant (p < 0.001), and considering the effect size (Cohen’s d ≥ 0.8), this difference could be interpreted as very large in practical terms (Table 10).
4.2.2. Indoor Illuminance
The indoor illuminance data during the 40-minute survey period are shown in Figure 10. In the RoomSW, the indoor work plane illuminance (Figure 10(b)) remained between 200 lx and 600 lx throughout the survey period, satisfying the minimum illuminance requirement. In the RoomCW, the work plane illuminance ranged from 500 lx to 7,000 lx, showing much greater variation in the measured illuminance than in the RoomSW and generally exceeding the minimum required illuminance of 200 lx by a large margin. The mean work plane illuminance values were 342.7 lx in the RoomSW and 1,614.7 lx in the RoomCW. The mean values of the perceived brightness (Figure 10(c)) and brightness satisfaction (Figure 10(d)) of the occupants were +0.4 and +1.4, respectively, in the RoomSW and +1.5 and +0.2, respectively, in the RoomCW. On the basis of the response scales, the participants perceived RoomCW to be brighter than RoomSW was, whereas their level of satisfaction with the luminous environment was greater for RoomSW. Statistical analysis revealed that the differences in work plane illuminance, perceived brightness, and brightness satisfaction between the two rooms were statistically significant (p < 0.001). When the effect sizes were considered, the difference in work plane illuminance (Cohen’s d ≥ 0.8) was interpreted as very large in practical terms, whereas the differences in perceived brightness and brightness satisfaction (0.5 ≤ Cohen’s d < 0.8) were interpreted as medium or greater (Table 10). These results indicated that the participants clearly distinguished the brightness levels of the two rooms and that the magnitude of the difference in perceived brightness and satisfaction between the two spaces was substantial.
5. Discussion
This study aimed to provide appropriate control strategies and support the efficient operation of smart window technologies by analyzing the impact of wintertime smart window tinting on the perceived thermal and visual comfort levels of occupants. To this end, evaluation items, indices, and cases for thermal and visual comfort were defined. An experimental environment was established in a residential-style test building equipped with both a smart window and a conventional window. Data on the indoor temperature, PMV, DGIN, work plane illuminance, and occupant questionnaire responses related to thermal and visual comfort were collected to enable a comprehensive comparative analysis of the effects of smart window tinting on thermal and visual comfort. In the experiments, the smart window was operated under a glare prevention tint control strategy, in which the tint level was adjusted stepwise only when glare occurred. This technology could be widely applied as a smart window tint control method in winter. The main findings of this study were as follows:
- With respect to thermal comfort, the thermal environment in the occupied spaces was appropriately controlled so that the PMV remained within the target range of ±0.5. The dry bulb and globe temperatures were maintained within a certain range. According to the occupant survey results, in the test spaces reproducing the thermal environment of an actual dwelling, there was no substantial difference between RoomSW and RoomCW in terms of the thermal sensation and satisfaction levels of the occupants under the smart window glare prevention tint control strategy. The results of the paired-samples t test confirmed that the differences between RoomSW and RoomCW were not statistically significant (p > 0.05). Therefore, wintertime smart window tinting for glare prevention did not impair the thermal sensation or satisfaction of occupants.
- With respect to visual comfort, glare did not occur in RoomSW, whereas in the RoomCW, the DGIN exceeded 22, indicating the occurrence of glare. For the indoor illuminance, both RoomSW and RoomCW satisfied the minimum required illuminance of 200 lx. According to the occupant survey results, the participants were satisfied with the luminous environment in both RoomSW and RoomCW, with higher levels of satisfaction in RoomSW. These findings were confirmed to be statistically significant (p < 0.05).
The limitations of this study were as follows: Because the analysis was limited to clear days on which glare prevention tint control was implemented, it was not possible to secure a large sample size. To obtain reliable analytical results, it would be necessary to recruit additional participants and increase the sample size. In addition, the experimental exposure time was short and restricted; if the occupants were to stay for a longer period, as in an actual residential environment, the intermittent tinting of the smart window for glare prevention could influence their thermal and visual comfort. To further verify the validity of winter glare prevention tint control using smart windows, scholars should investigate occupant thermal and visual comfort levels during long-term exposure.
Author Contributions
Conceptualization, C.S.Y.; methodology, C.S.Y., L.S.J., and S.S.Y.; validation, C.S.Y.; formal analysis, C.S.Y. and S.S.Y.; investigation, C.S.Y.; resources, C.S.Y. and L.S.J.; data curation, C.S.Y.; writing—original draft preparation, C.S.Y.; writing—review and editing, C.S.Y., L.S.J., and S.S.Y.; visualization, C.S.Y.; supervision, L.S.J. and S.S.Y.; project administration, L.S.J.; funding acquisition, L.S.J. All authors have read and agreed to the published version of the manuscript.
Funding
This research was funded by a National Research Foundation of Korea (NRF) grant provided by the Korean government (MSIT), grant number RS-2023-00210963.
Institutional Review Board Statement
This study was conducted in accordance with the principles of the Declaration of Helsinki. Formal ethical approval was not required because the research involved a fully anonymized, minimal-risk survey that collected no personally identifiable or sensitive information.
Data Availability Statement
Data will be made available on request.
Acknowledgments
During the preparation of this work, the authors used ChatGPT (OpenAI) to improve the readability and flow of the manuscript. After using this tool, the authors reviewed and edited the content as needed and take full responsibility for the content of the publication. The authors gratefully acknowledge the participation of all subjects in the experiment.
Conflicts of Interest
The authors declare no conflicts of interest.
References
- International Energy Agency, The energy efficiency policy package: key catalyst for building decarbonisation and climate action – Analysis, (n.d.). Available online: https://www. iea.org/commentaries/the-energy-efficiency-policy-package-key-catalyst-for-buil ding-decarbonisation-and-climate.
- Anand, V., Kadiri, V.L. & Putcha, C. Passive buildings: a state-of-the-art review. J Infrastruct Preserv Resil 2023, 4, 3. [CrossRef]
- Brito-Coimbra, S., Aelenei, D., Gloria Gomes, M., & Moret Rodrigues, A. Building Façade Retrofit with Solar Passive Technologies: A Literature Review. Energies 2021, 14(6), 1774. [CrossRef]
- Favoino, F., Loonen, R.C.G.M., Michael, M., Michele, G.D., Avesani, S., (2022). 5 - Advanced fenestration—technologies, performance and building integration. In Rethinking Building Skins Transformative Technologies and Research Trajectories; Gaparri, E., Brambilla, A., Lobaccaro, G., Goia, F., Andaloro, A., Sangiorgio, A.; Woodhead Publishing, 2022, pp. 117–154. [CrossRef]
- IMARC Group. Smart Window Market Report by Technology, Type, Application, and Region, 2025; pp. 2024-2032.
- Mesloub, A., Ghosh, A., Touahmia, M., Albaqawy, G.A., Alsolami, B.M., Ahriz, A. Assessment of the overall energy performance of an SPD smart window in a hot desert climate. Energy 2022, 252. [CrossRef]
- Masi, R.F.D., Festa, V., Gigante, A., Ruggiero, S., & Vanoli, G.p. The incidence of smart windows in building energy saving and future climate projections. Energy Reports 2022, 8(16), 283–289. [CrossRef]
- Lee, S.J., Choi, S.Y., Song, S.Y. Suspended Particle Device Windows in Residential Buildings: Measurement-based Assessment of Comfort and Energy Performance for Optimal Control in Intermediate and Heating Season. Energy and Buildings 2024, 330. [CrossRef]
- Ghosh, A., Norton, B., Duffy, A. Daylighting performance and glare calculation of a suspended particle device switchable glazing. Solar Energy 2016, 132, 114–12. [CrossRef]
- Teixeira, H., Moret, A.R., Aelenei, D., Gomes, M.G. Literature review of solar control smart building glazing: Technologies, performance, and research insights. Building and Environment 2025, 274, 112784. [CrossRef]
- Rashidzadeh, Z., & Heidari Matin, N. A Comparative Study on Smart Windows Focusing on Climate-Based Energy Performance and Users’ Comfort Attributes. Sustainability 2023, 15(3), 2294. [CrossRef]
- International Organization for Standardization. 2005. Ergonomics of the thermal environment (ISO 7730).
- American Society of Heating, Refrigerating and Air-Conditioning Engineers. 2020. Thermal Environmental Conditions for Human Occupancy (ANSI/ASHRAE Standard 55).
- P. O Fanger, Jørn Toftum. Extension of the PMV model to non-air-conditioned buildings in warm climates, Energy and Buildings 2002, 34(6), 533–536. [CrossRef]
- International Commission on Illumination Publication 17.4. 1987. International Lighting Vocabulary.
- Osterhaus, W.K.E. Discomfort glare assessment and prevention for daylight applications in office environments, Sol. Energy 2005, 79, 140–158. [CrossRef]
- Clear, R. Discomfort glare: what do we actually know?. Light. Res. Technol. 2013, 45(2), 141–158. [CrossRef]
- Hopkinson, R.G. Architectural Physics: Lighting, HMSO: London, UK, 1963; pp.225–242.
- Chauvel, P., Collins, B., Dogniaux, R., Longmore, J. Glare from windows: current views of problem. Light Res Tech 1982, 14(1), 31–46. [CrossRef]
- Nazzal, A.A. A new daylight glare evaluation method, Introduction of the monitoring control and calculation method. Energy and Buildings 2001, 33, 257–256. [CrossRef]
- Nazzal, A.A. A new evaluation method for daylight discomfort glare. International Journal of Industrial Ergonomics 2005, 35(4), 295–306. [CrossRef]
- Korean Standards Association. KS A 3011: Recommended levels of illumination. Korean Industrial Standards, 1998.
- Korea Meteorological Administration. Available online: https://data.kma.go.kr/resources/html/en/aowdp.html. KMA Weather Data Service, Open MET Data Portal.
- World Meteorological Organization. Available online: https://worldweather.wmo.int/oktas.htm. World Weather Information Service, Definition of Oktas.
- Matuszko, D. Influence of the extent and genera of cloud cover on solar radiation intensity. Int. J. Climatol. 2012, 32, 2403–2414. [CrossRef]
- Wu, Z., Li, N., Schiavon, S. Experimental evaluation of thermal comfort, SBS symptoms and physiological responses in a radiant ceiling cooling environment under temperature step-changes. Building and Environment 2022, 224, 109512. [CrossRef]
- World Medical Association (WMA), WMA Declaration of Helsinki - Ethical Principles for Medical Research Involving Human Subjects, 64th WMA General Assembly, Fortaleza, Brazil, October 2013.
- Hajialiani, S., Rostami, F., Ahmadvand, M., Mirakzadeh, A. A., & Azadi, H. Assessment of effect size and social indicators sustainability in the context of international rural development projects in Iran: Using BACI framework. ESI 2025, 27, 100871. [CrossRef]
- Cui, C., Guo, Z., Liu, Y., Han, N., Song, J., Chen, Y., Zheng, Y., Sheng, C., Balmer, L., Li, H., Liu, R., Liu, L., Du, J., & Wu, Z. Tissue-specific distribution of microplastics in human blood and carotid plaques: A paired sample analysis. Environ. Int. 2025, 203, 109743. [CrossRef]
- Zhang, Y., & Altan, H. A comparison of occupant comfort in a conventional high-rise office block and a contemporary environmentally concerned building. Building and Environment 2011, 46(2), 535–545. [CrossRef]
- Salahuddin, M. F. Bridging theory and practice: Enhancing pharmacology education through simulation-based learning and statistical analysis training. Curr Pharm Teach Learn2025, 17(11), 102440. [CrossRef]
- Schreiber, J. B., & Amin, M. E. K. Core reporting expectations for quantitative manuscripts using independent and dependent t tests, one way ANOVA, OLS regression, and chi square. Curr Pharm Teach Learn 2025, 17(12), 102462. [CrossRef]
Figure 1.
Schematic of the operating principle and tinting/clear states under different modes.
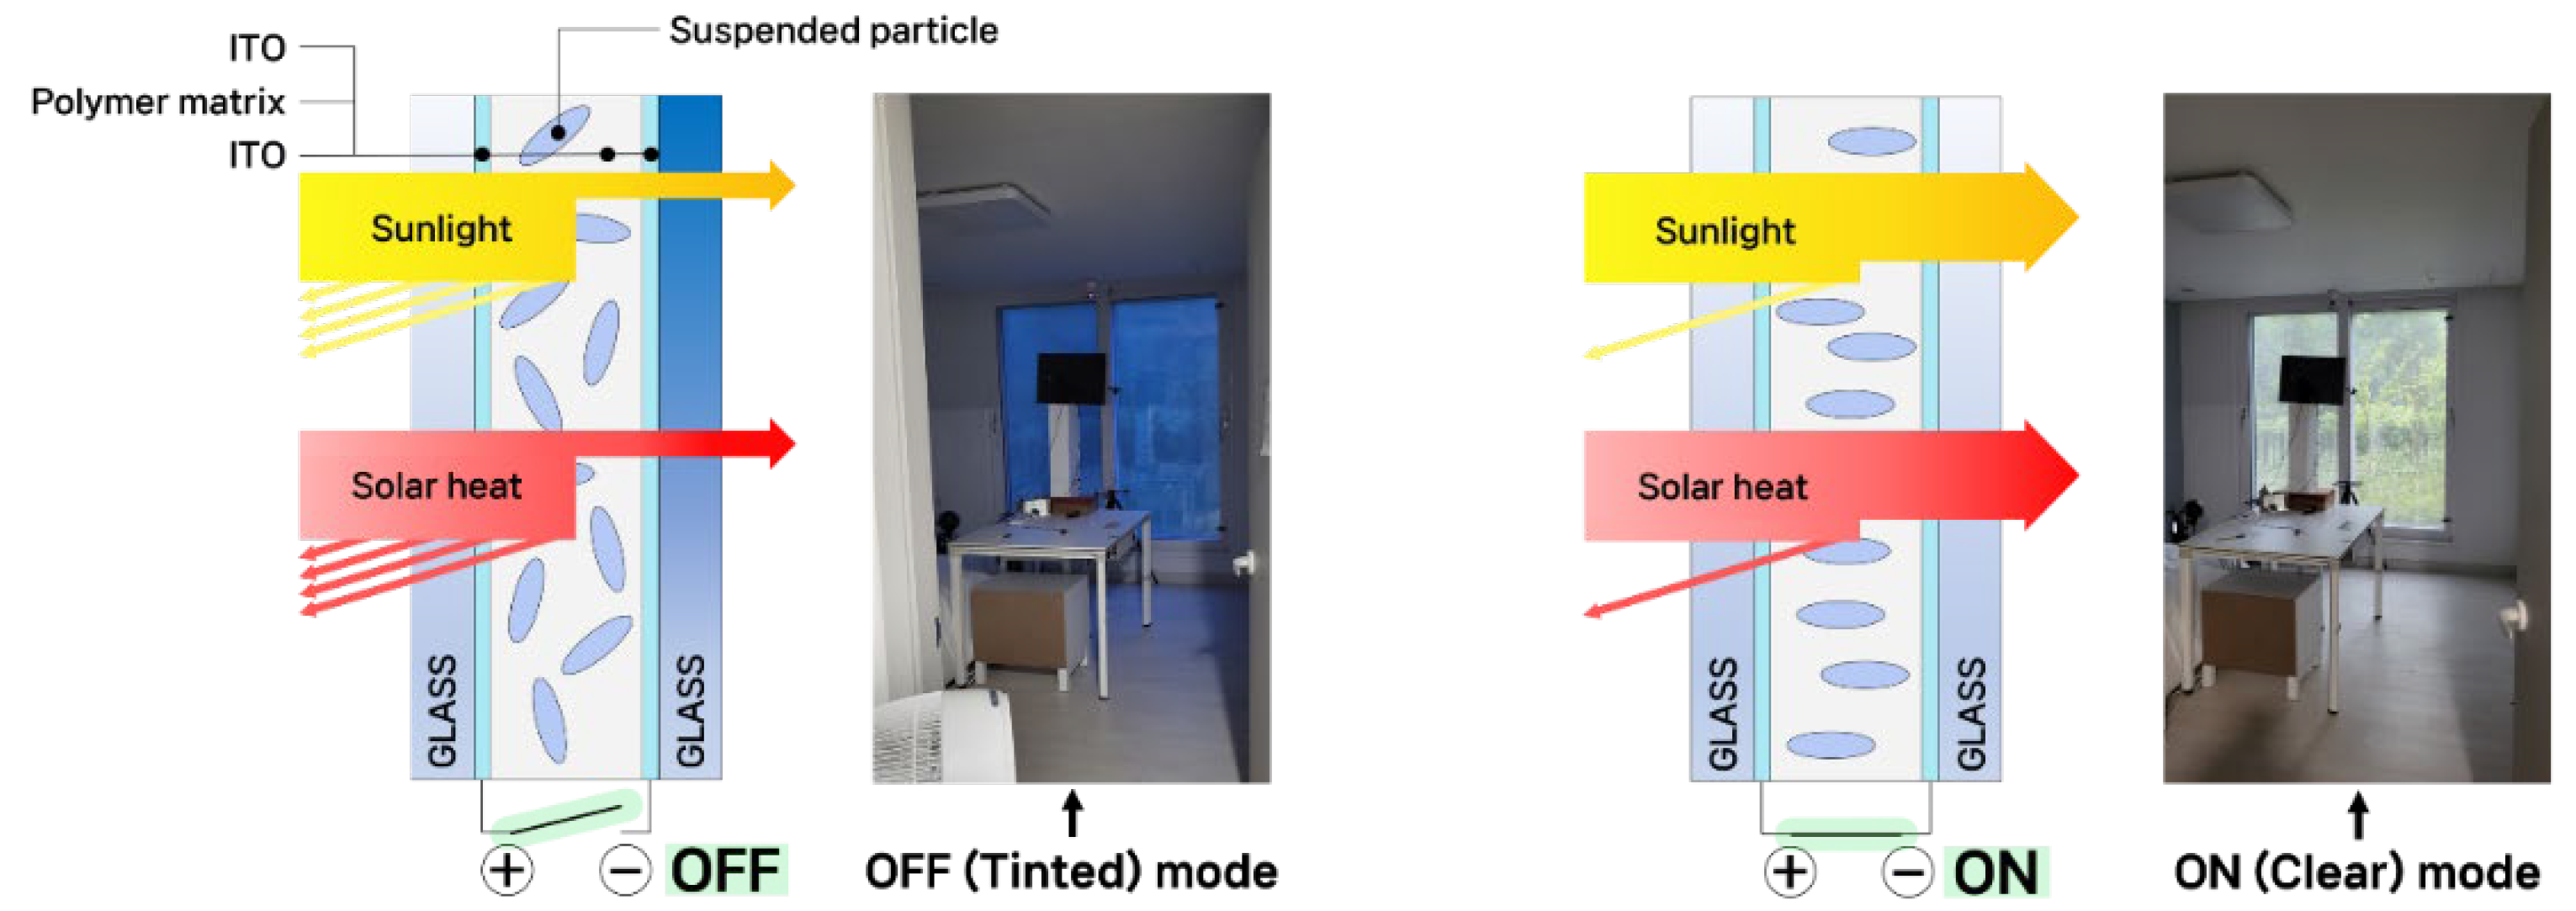
Figure 2.
Schematic diagram for the DGIN calculation. a is the width of the window; b is the height of the window, d is the distance between the window and the measurement position (m); and
Figure 2.
Schematic diagram for the DGIN calculation. a is the width of the window; b is the height of the window, d is the distance between the window and the measurement position (m); and
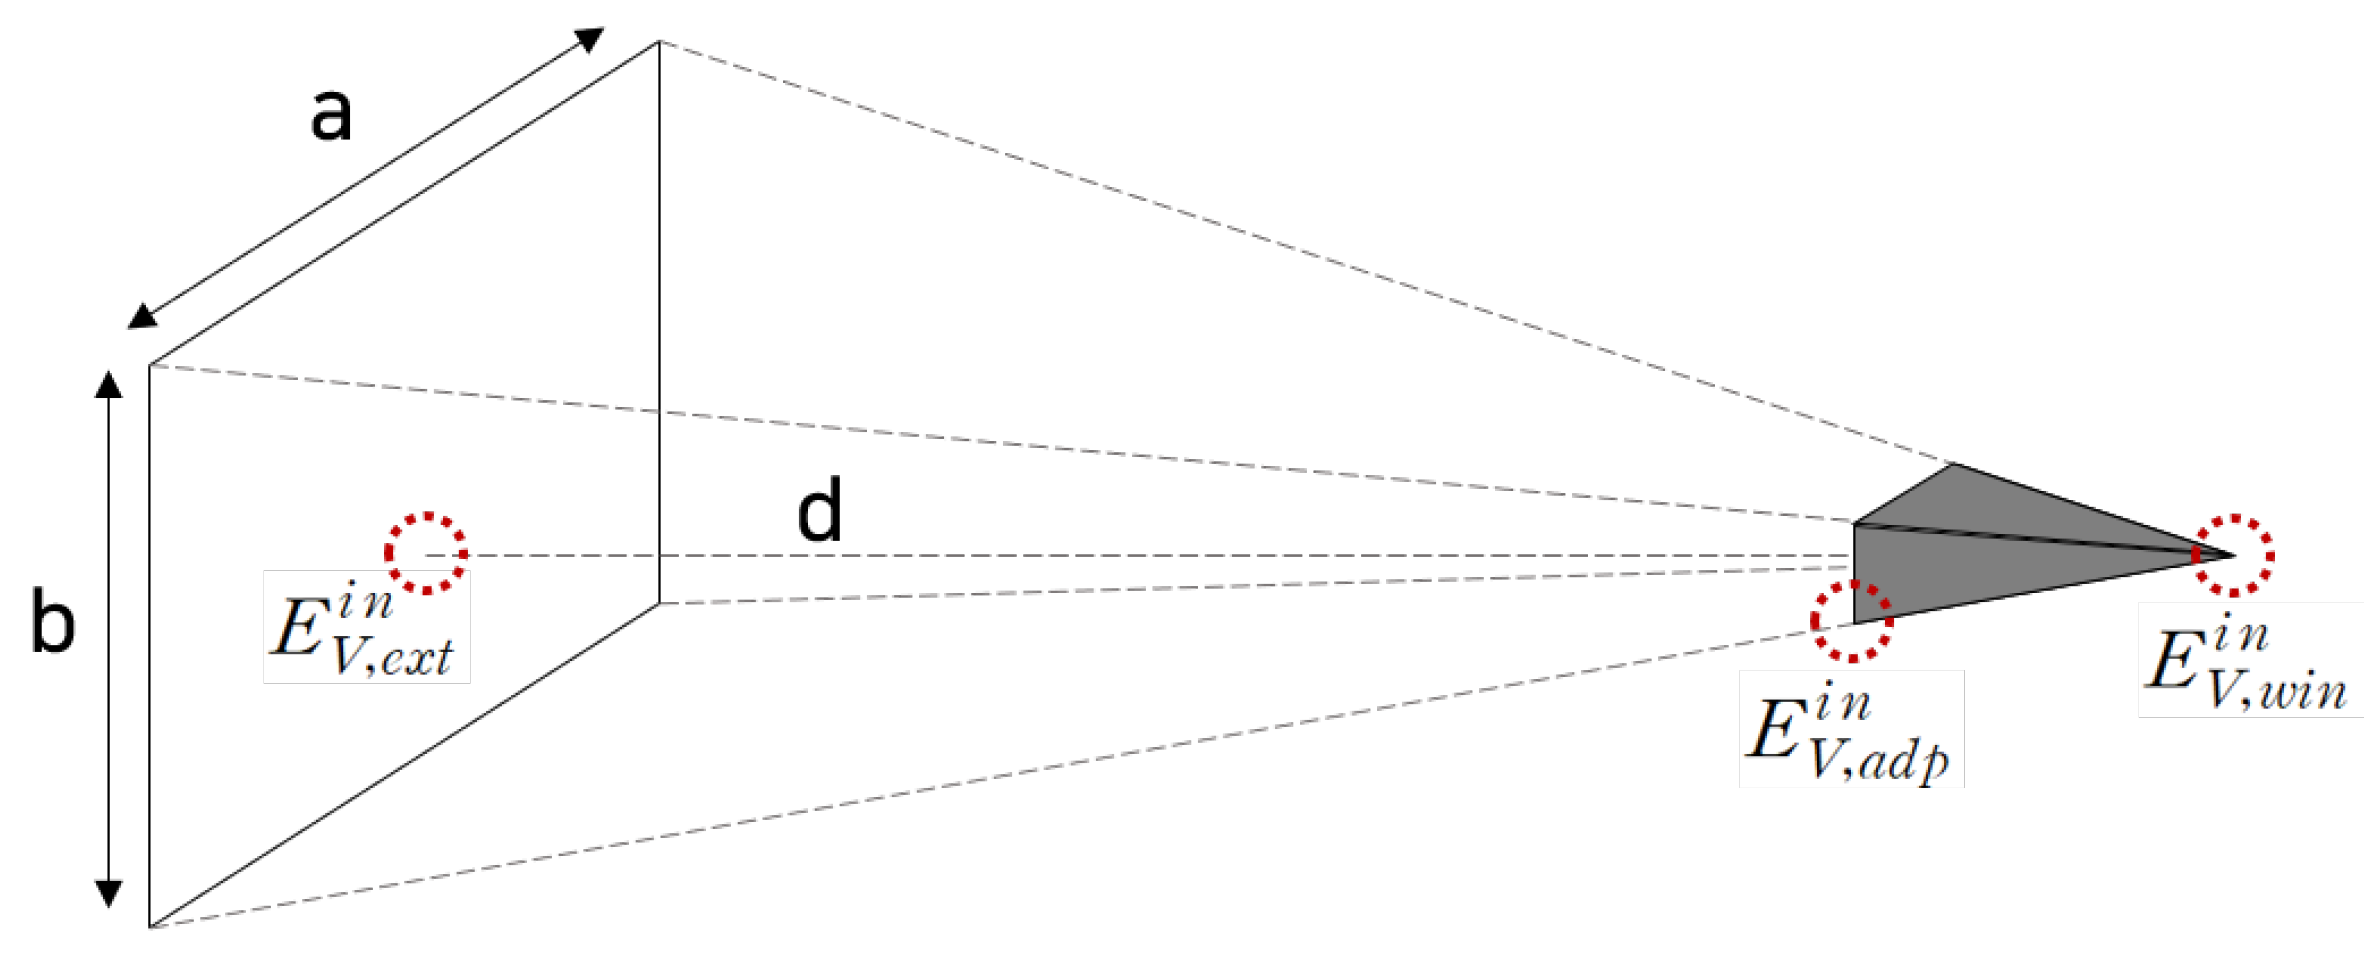
Figure 3.
(a) Cross-sectional diagram of illuminance measurement equipment installation. (b) Regression formula for indoor horizontal work plane illuminance and indoor vertical window plane illuminance.
Figure 3.
(a) Cross-sectional diagram of illuminance measurement equipment installation. (b) Regression formula for indoor horizontal work plane illuminance and indoor vertical window plane illuminance.
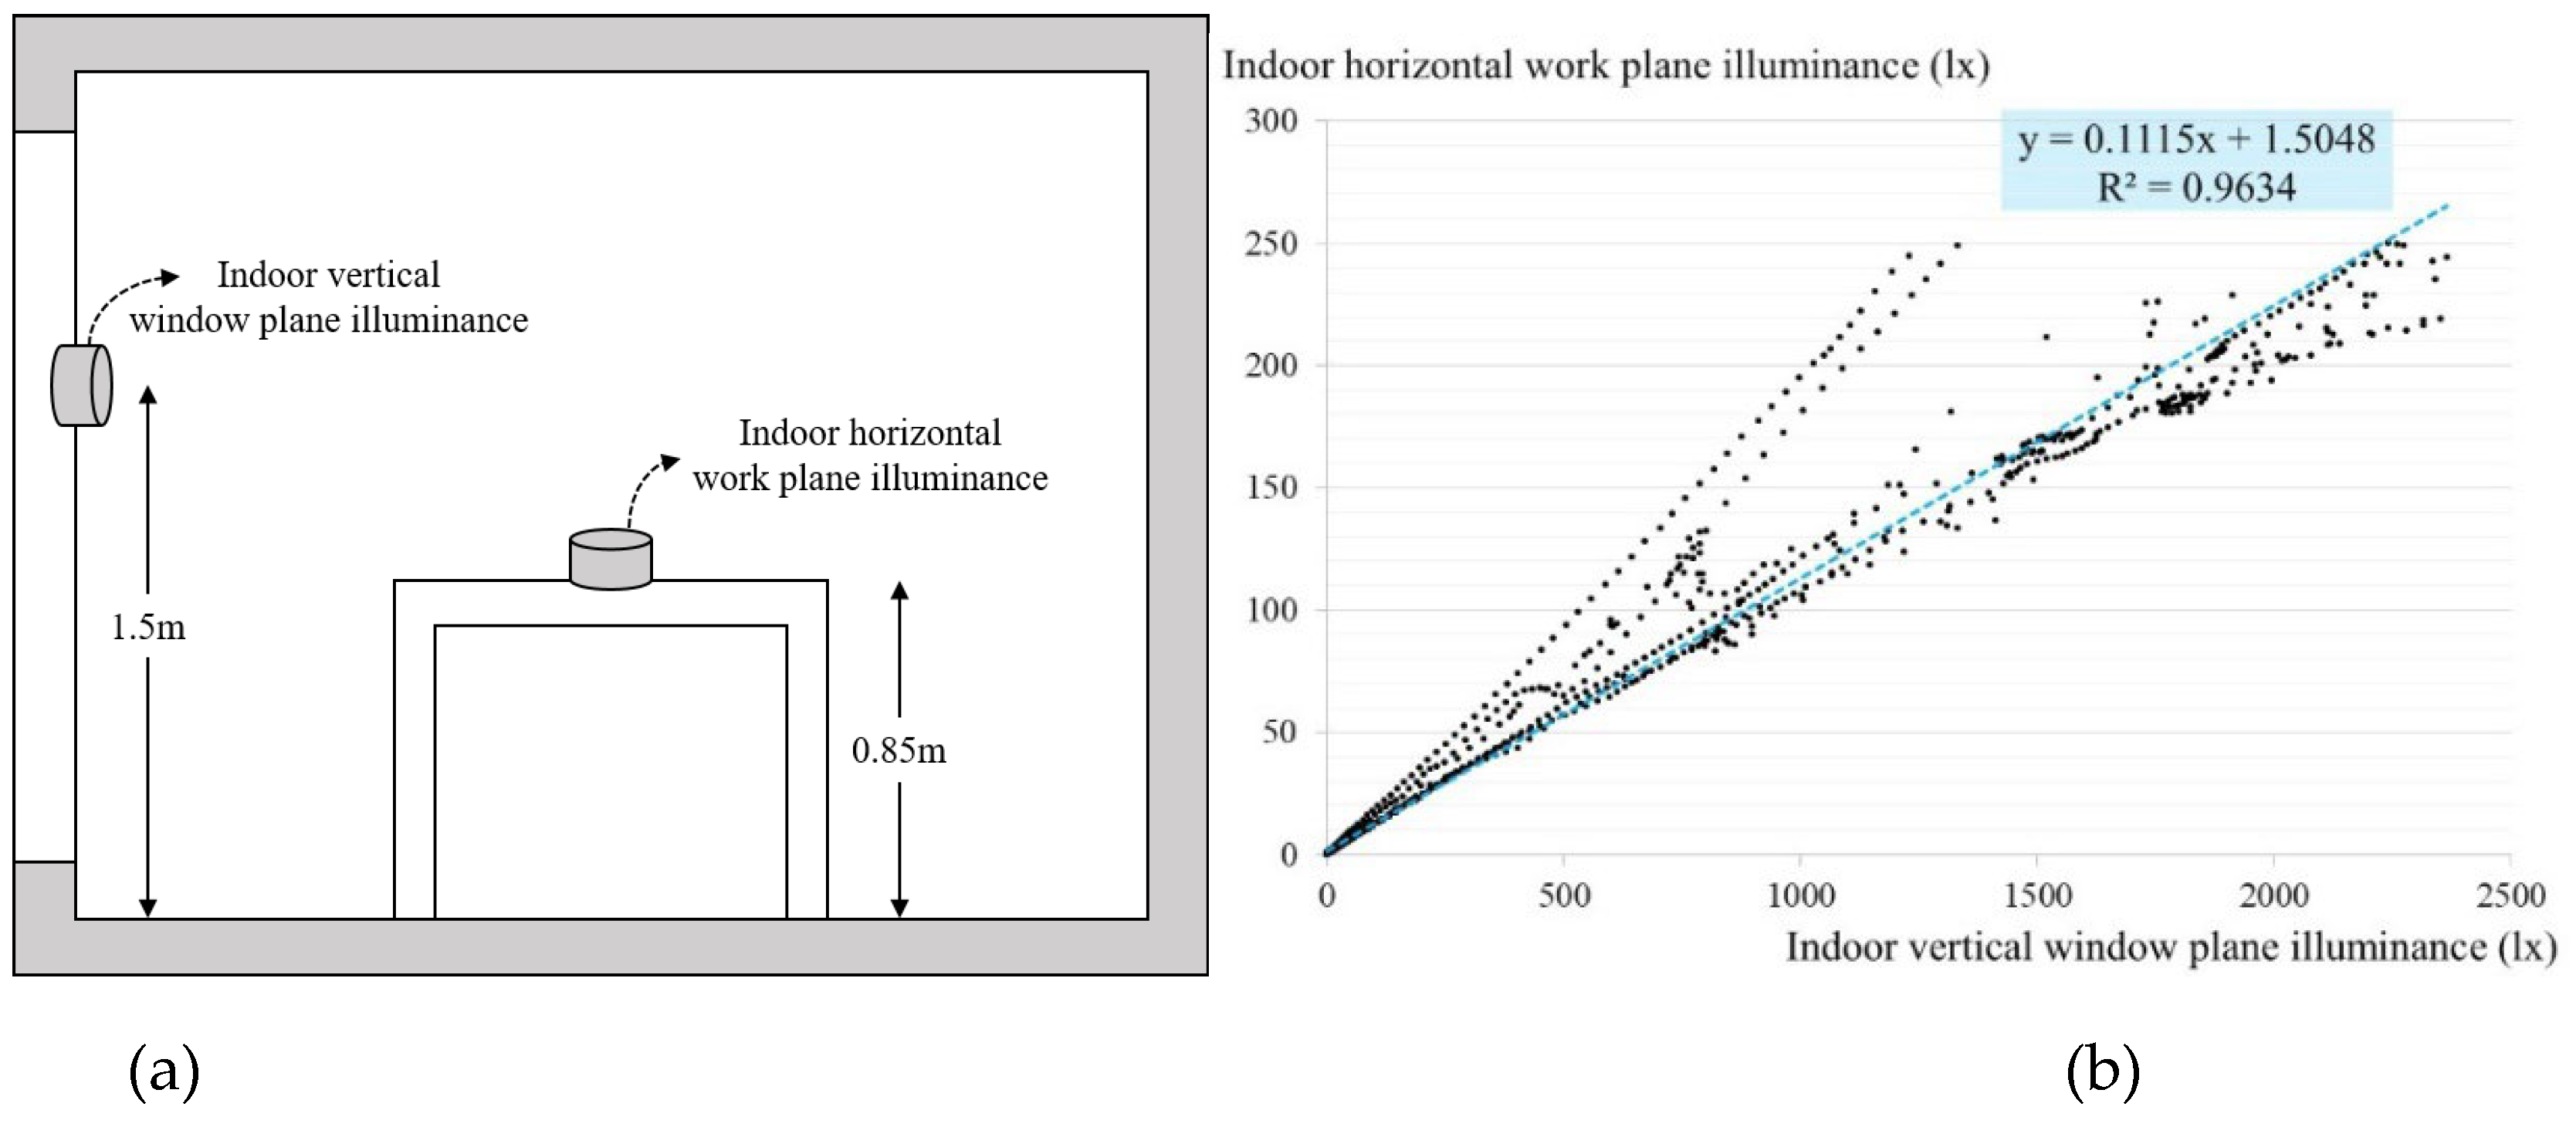
Figure 4.
Experimental building floor plan.
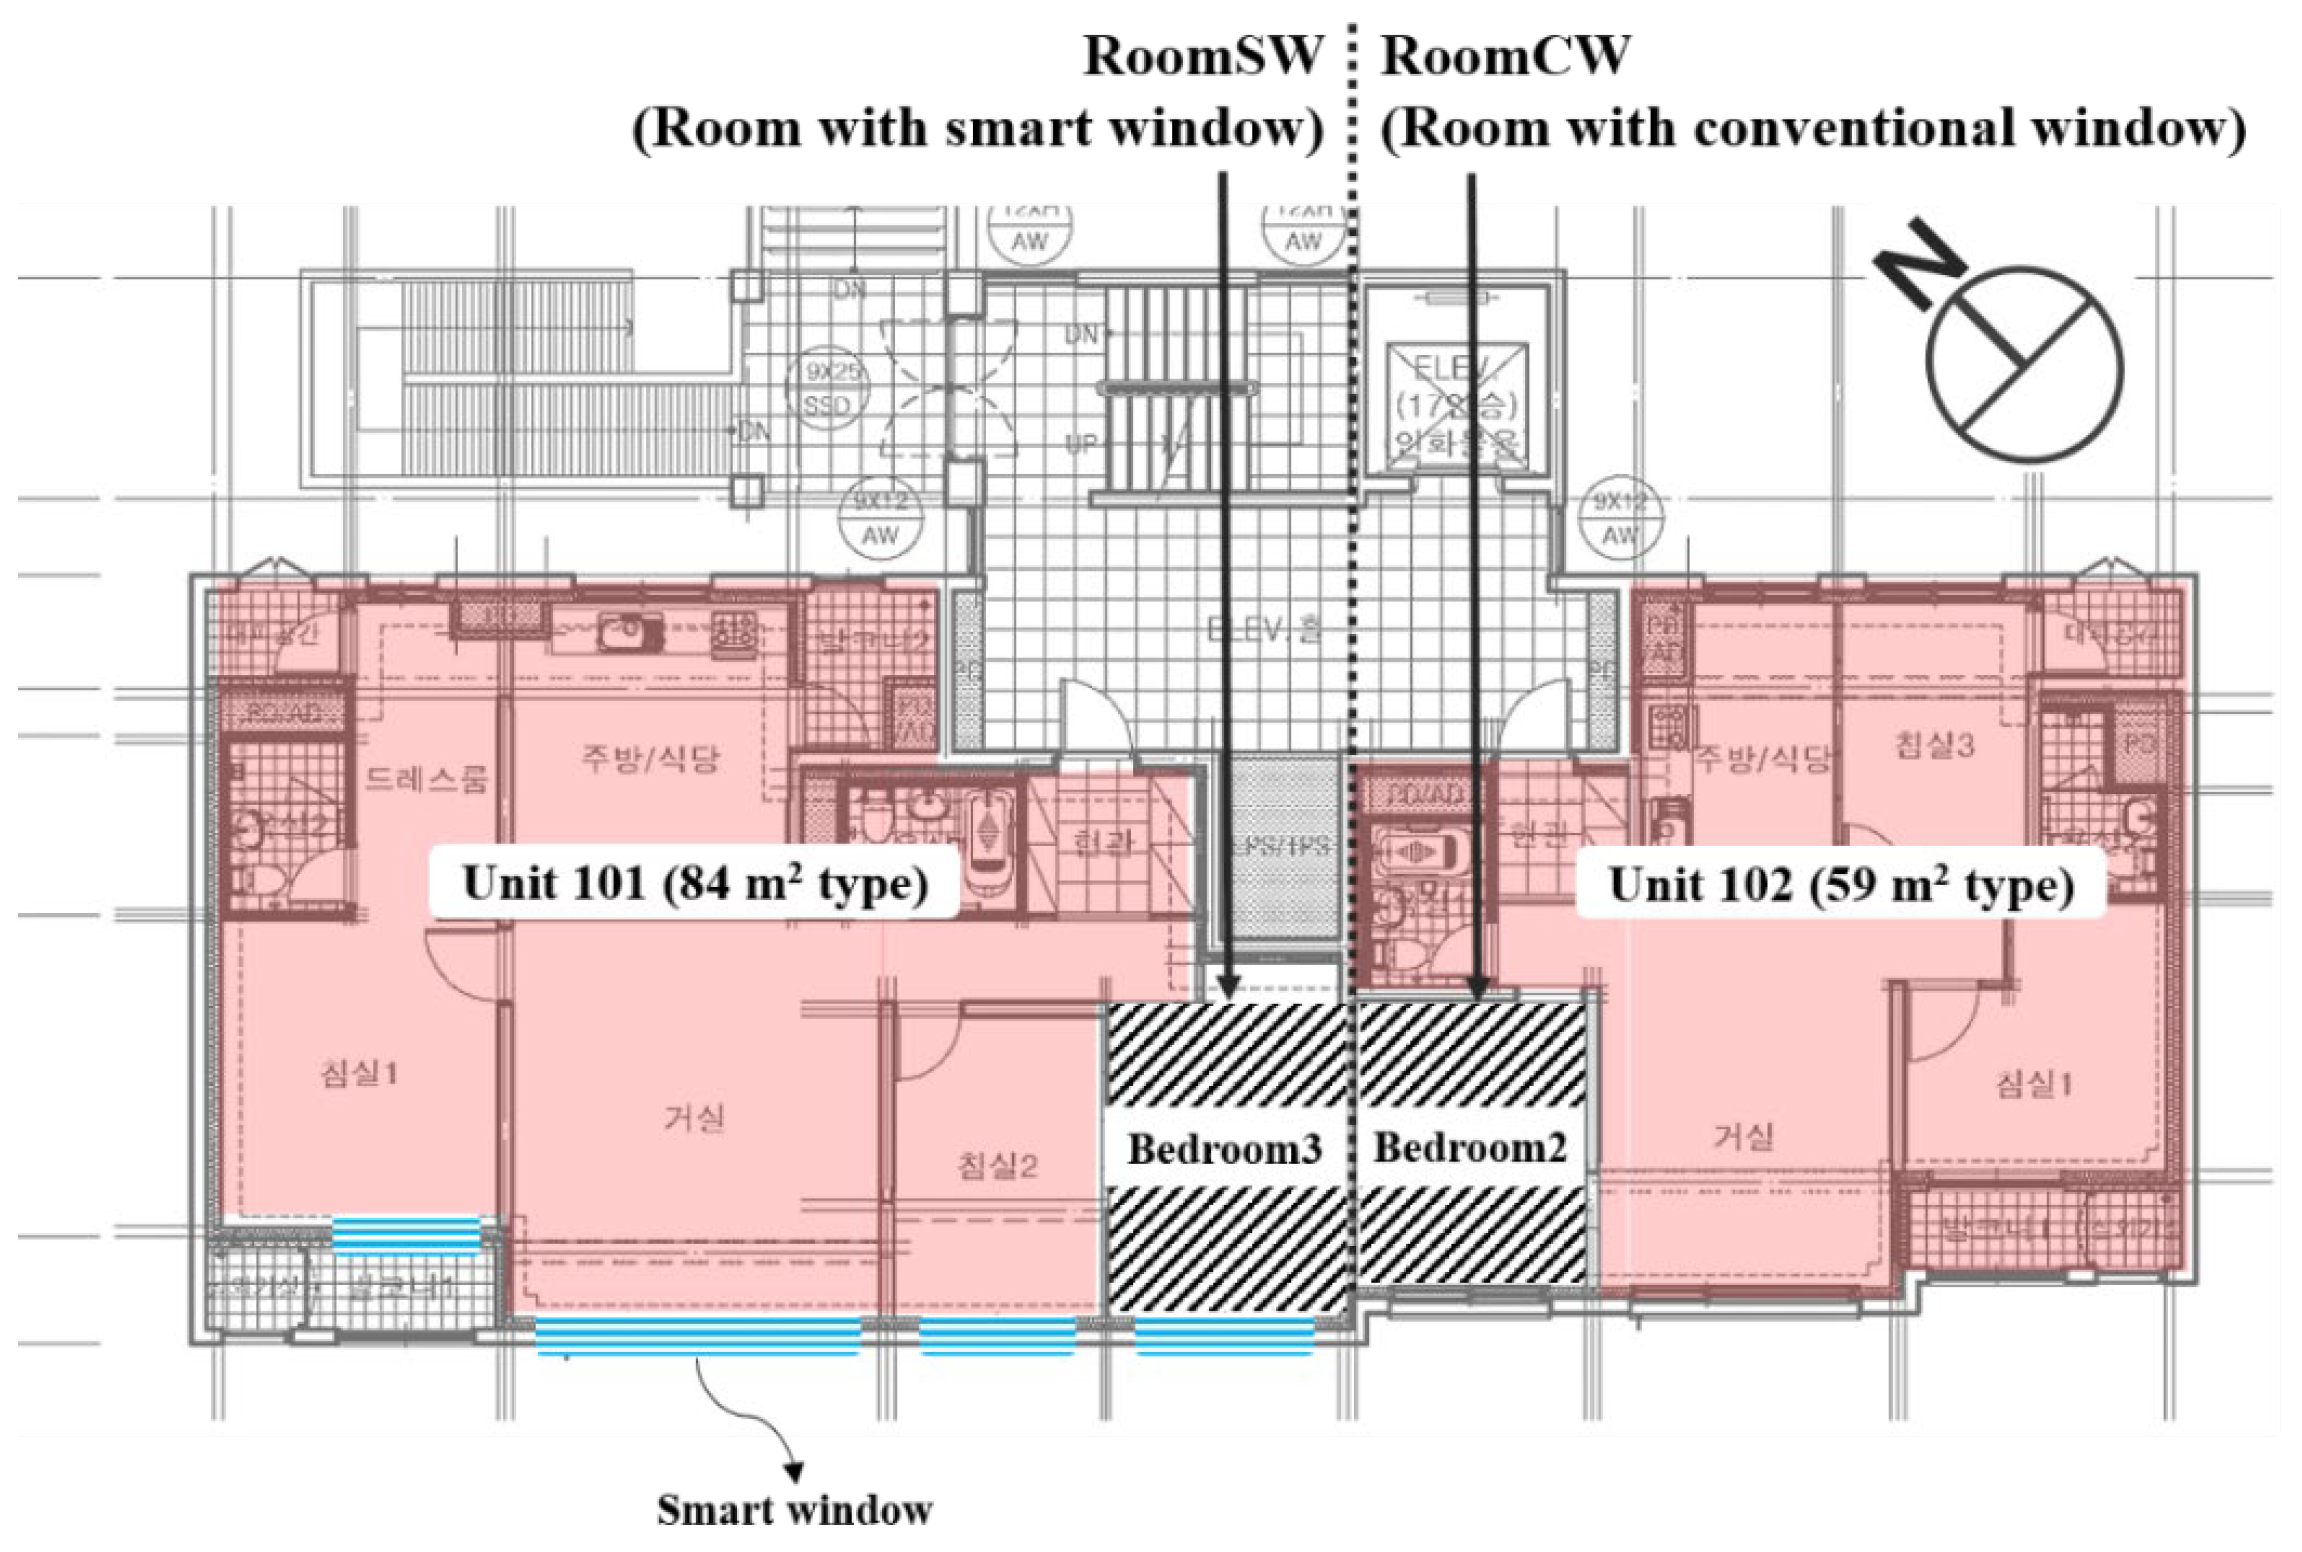
Figure 5.
(a) and (b) Equipment installation sections of Room SW and Room CW, respectively. (c) Shields. (d) Overall view of equipment installation (shown for Room SW).
Figure 5.
(a) and (b) Equipment installation sections of Room SW and Room CW, respectively. (c) Shields. (d) Overall view of equipment installation (shown for Room SW).
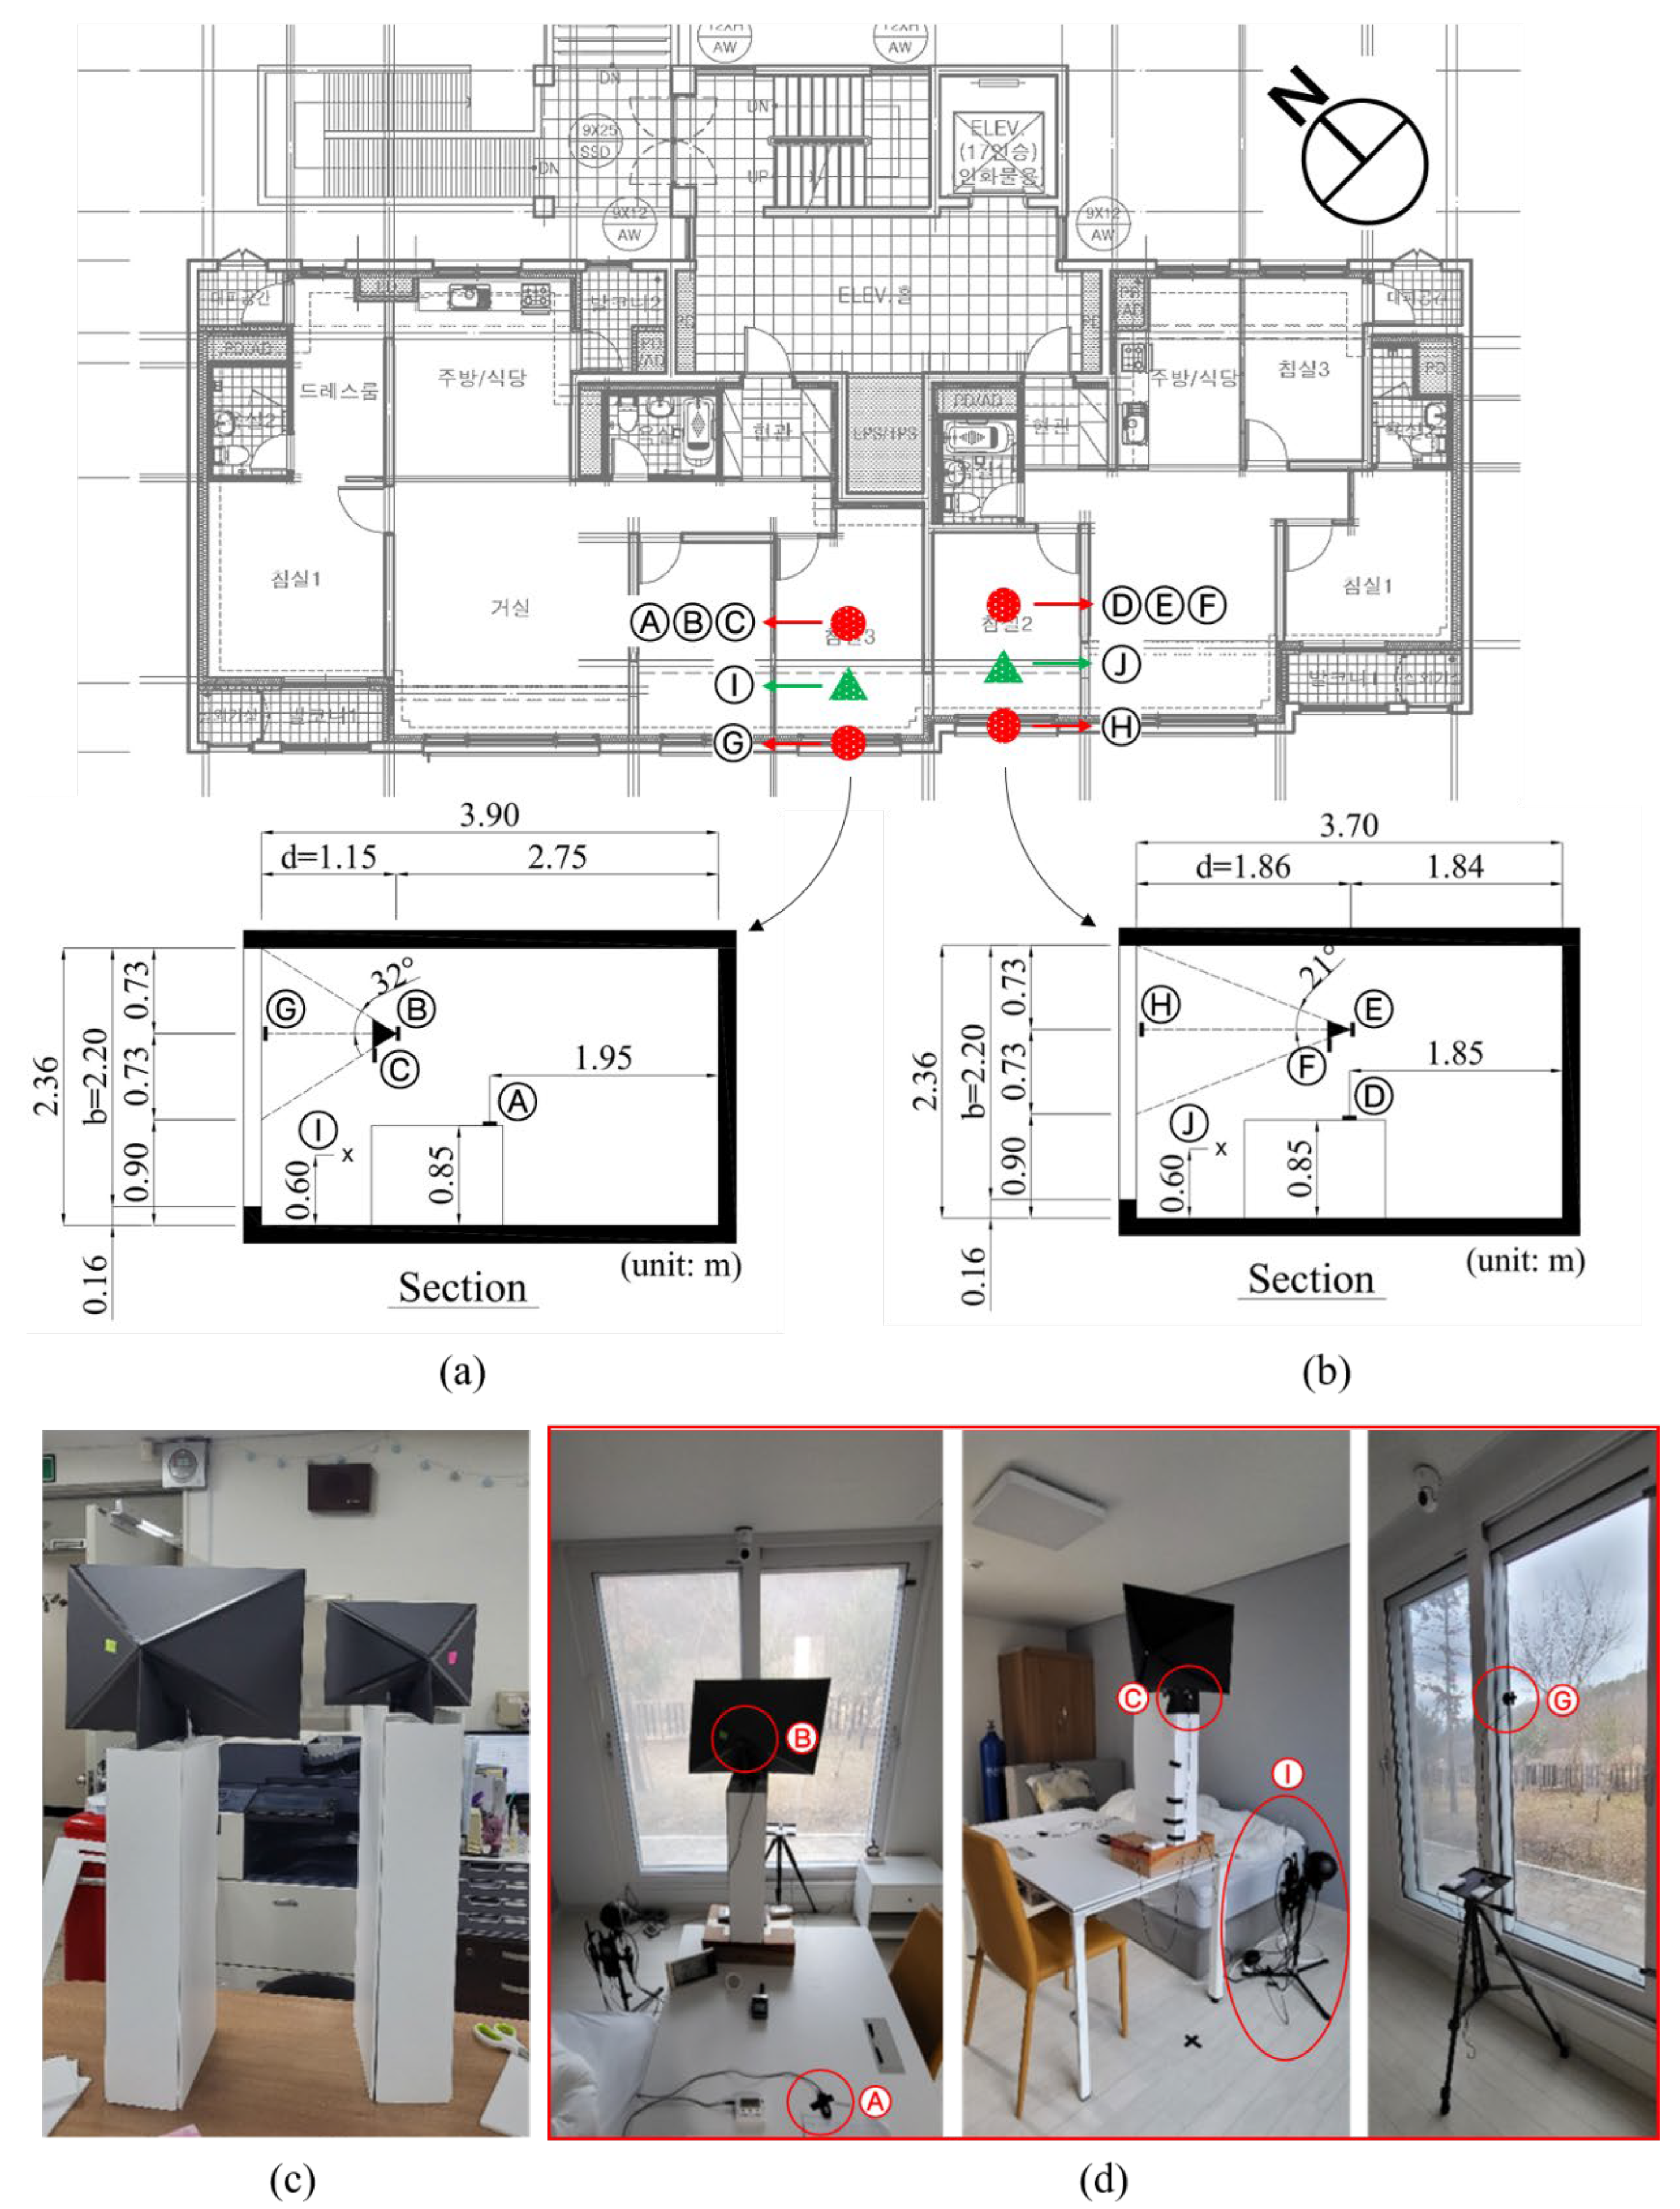
Figure 6.
Survey procedure diagram.
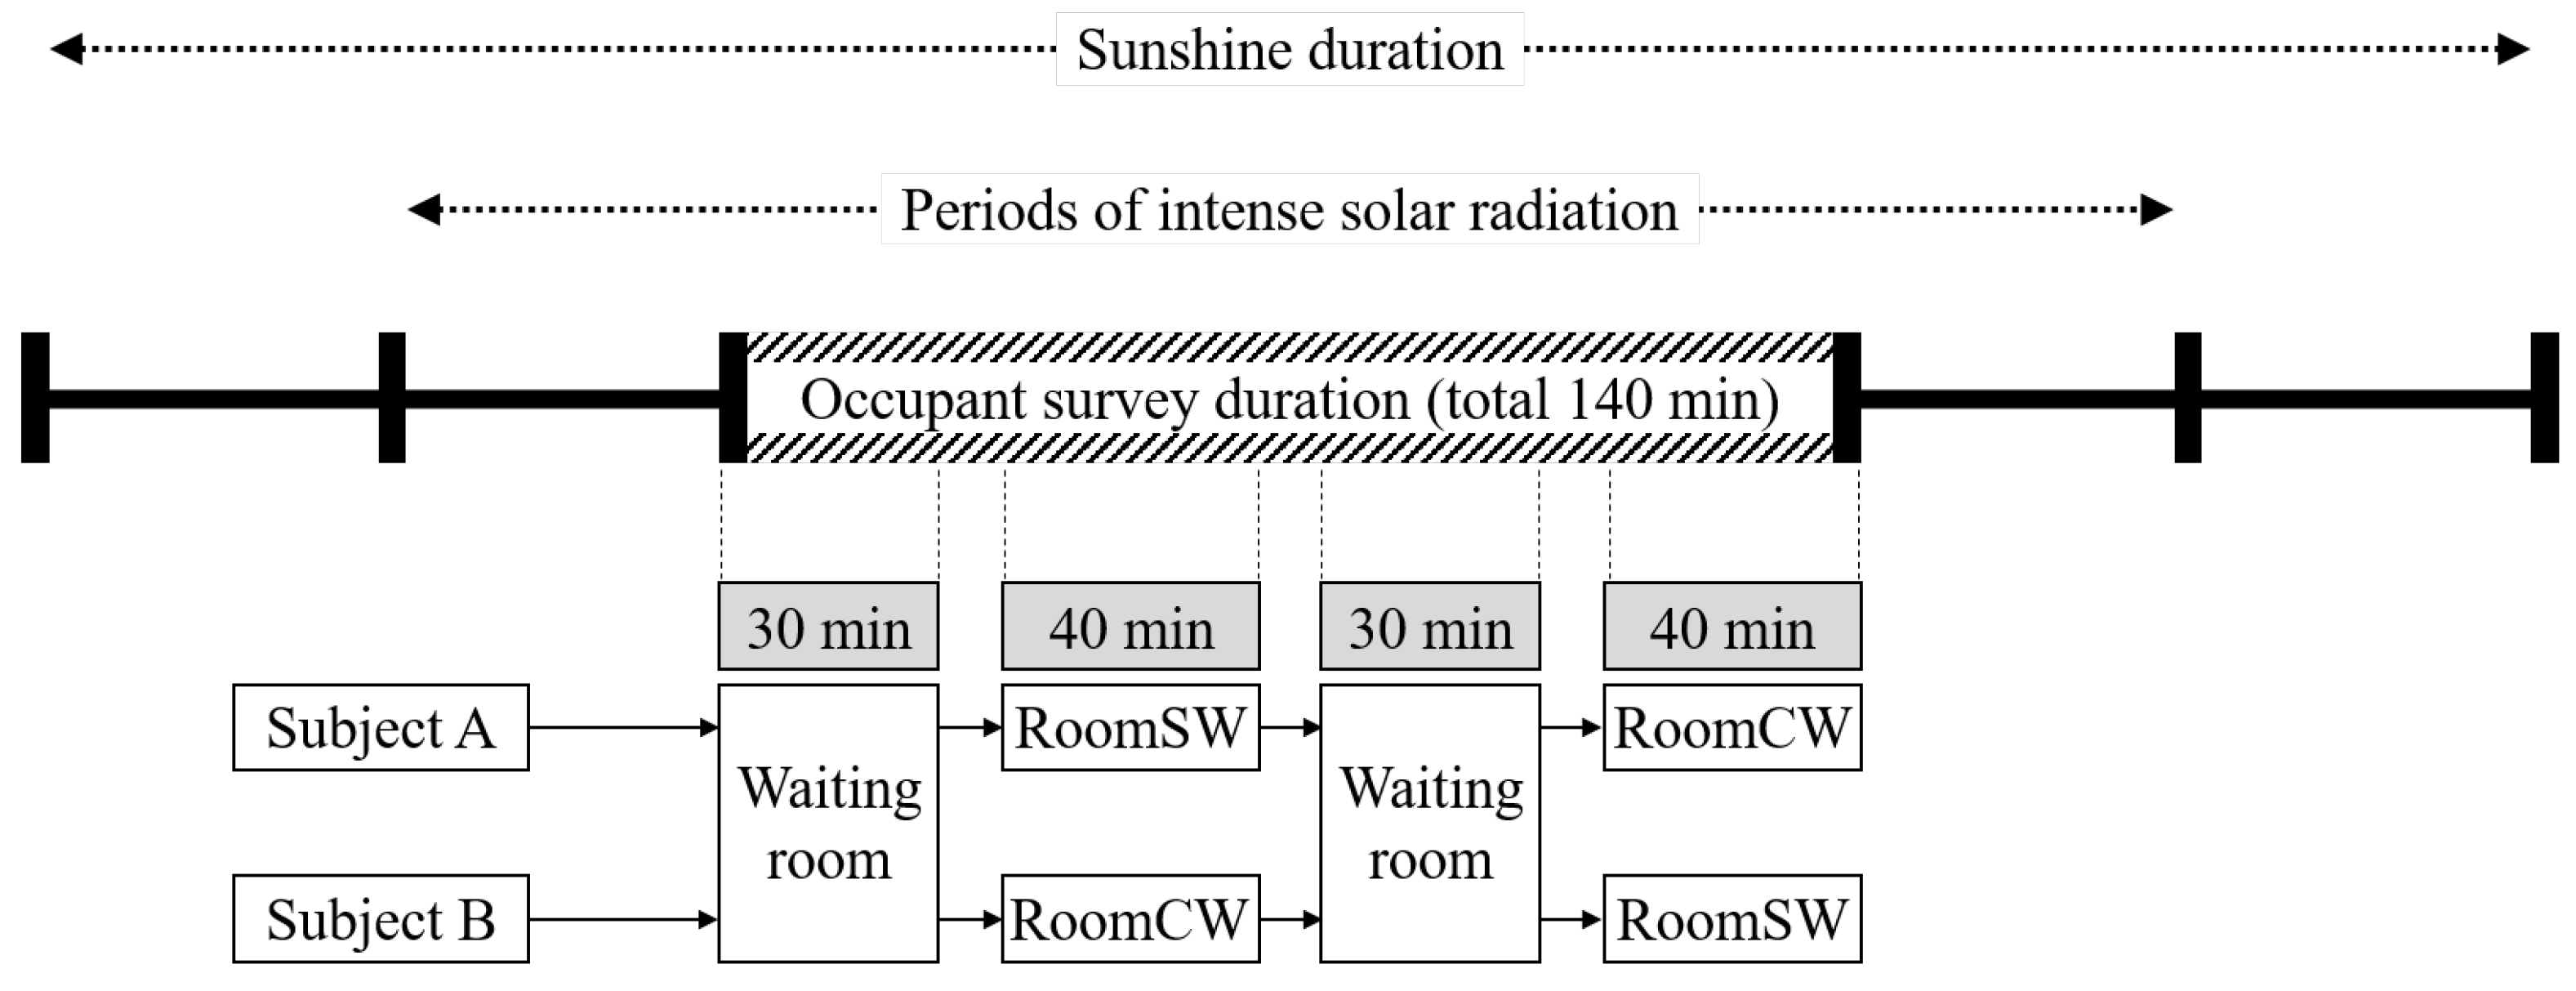
Figure 7.
(a) 7-point scales for TSV (top), brightness perception (middle), and satisfaction (bottom), and occupant surveys conducted in the (b) RoomSW and (c) RoomCW.
Figure 7.
(a) 7-point scales for TSV (top), brightness perception (middle), and satisfaction (bottom), and occupant surveys conducted in the (b) RoomSW and (c) RoomCW.
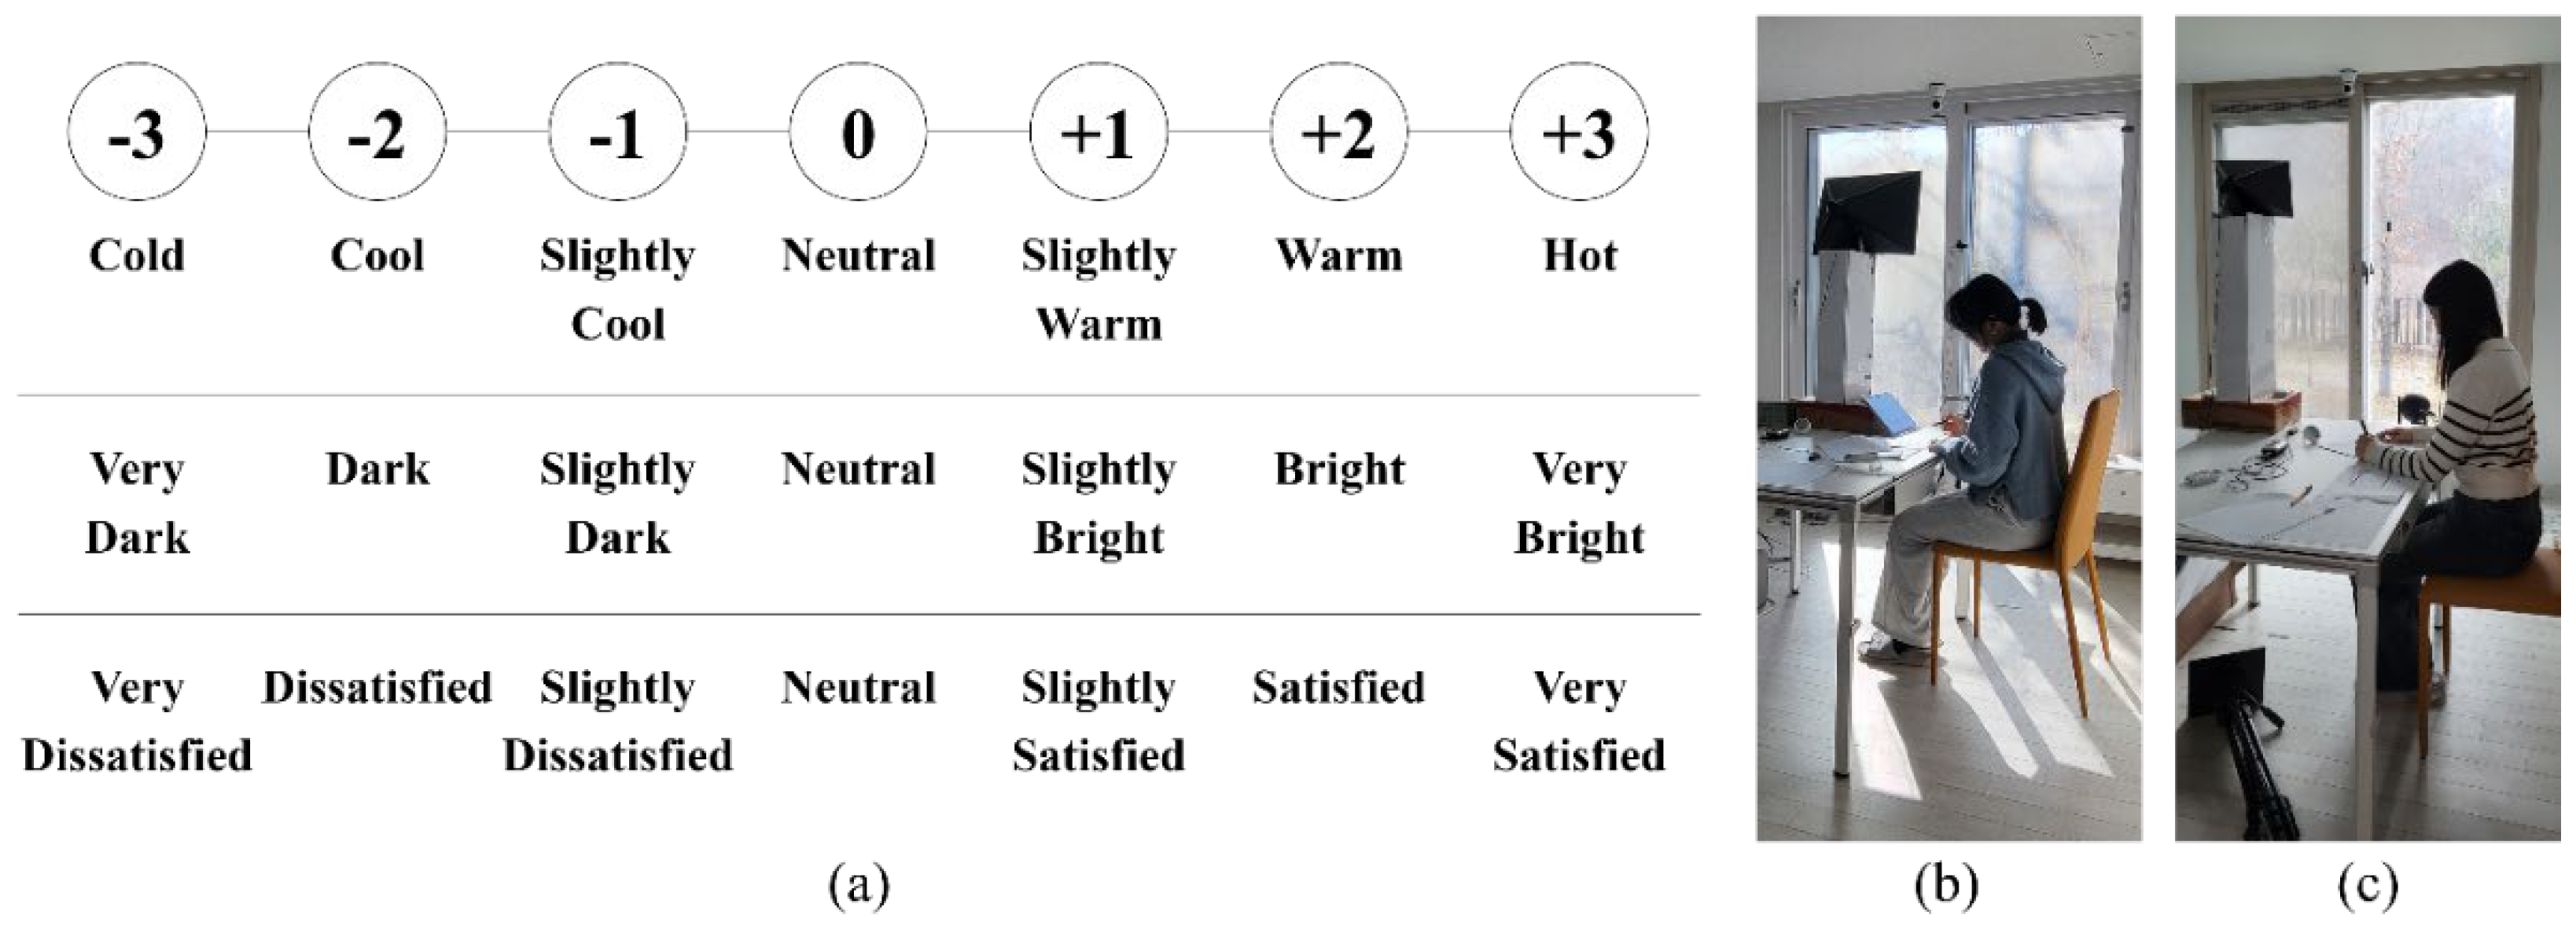
Figure 8.
Smart window tinting level during the survey period in RoomSW.
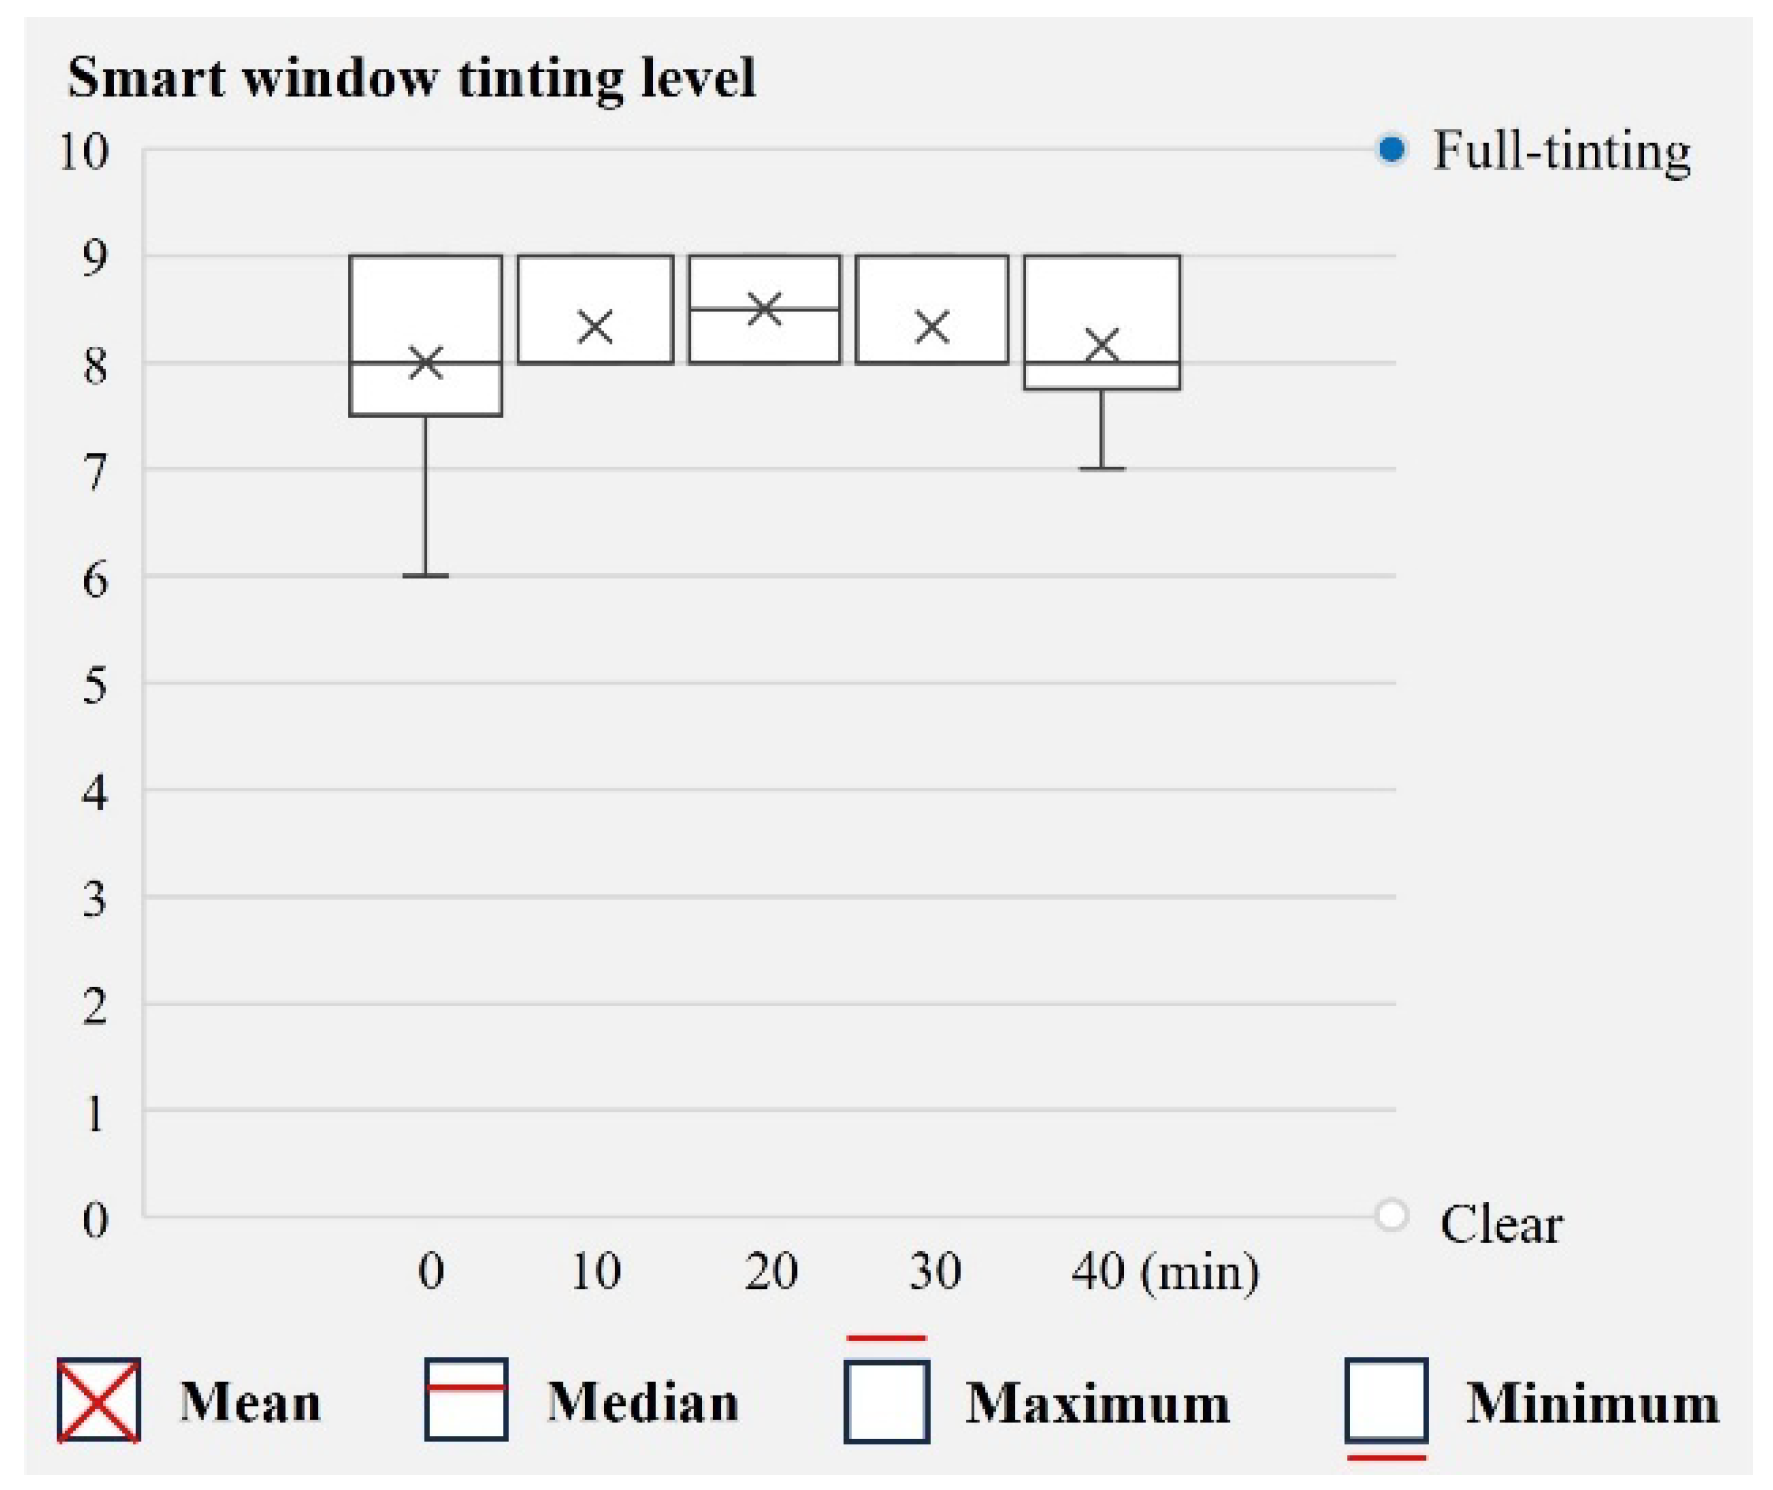
Figure 9.
Boxplots of thermal comfort indicators during occupancy in the RoomSW and RoomCW.
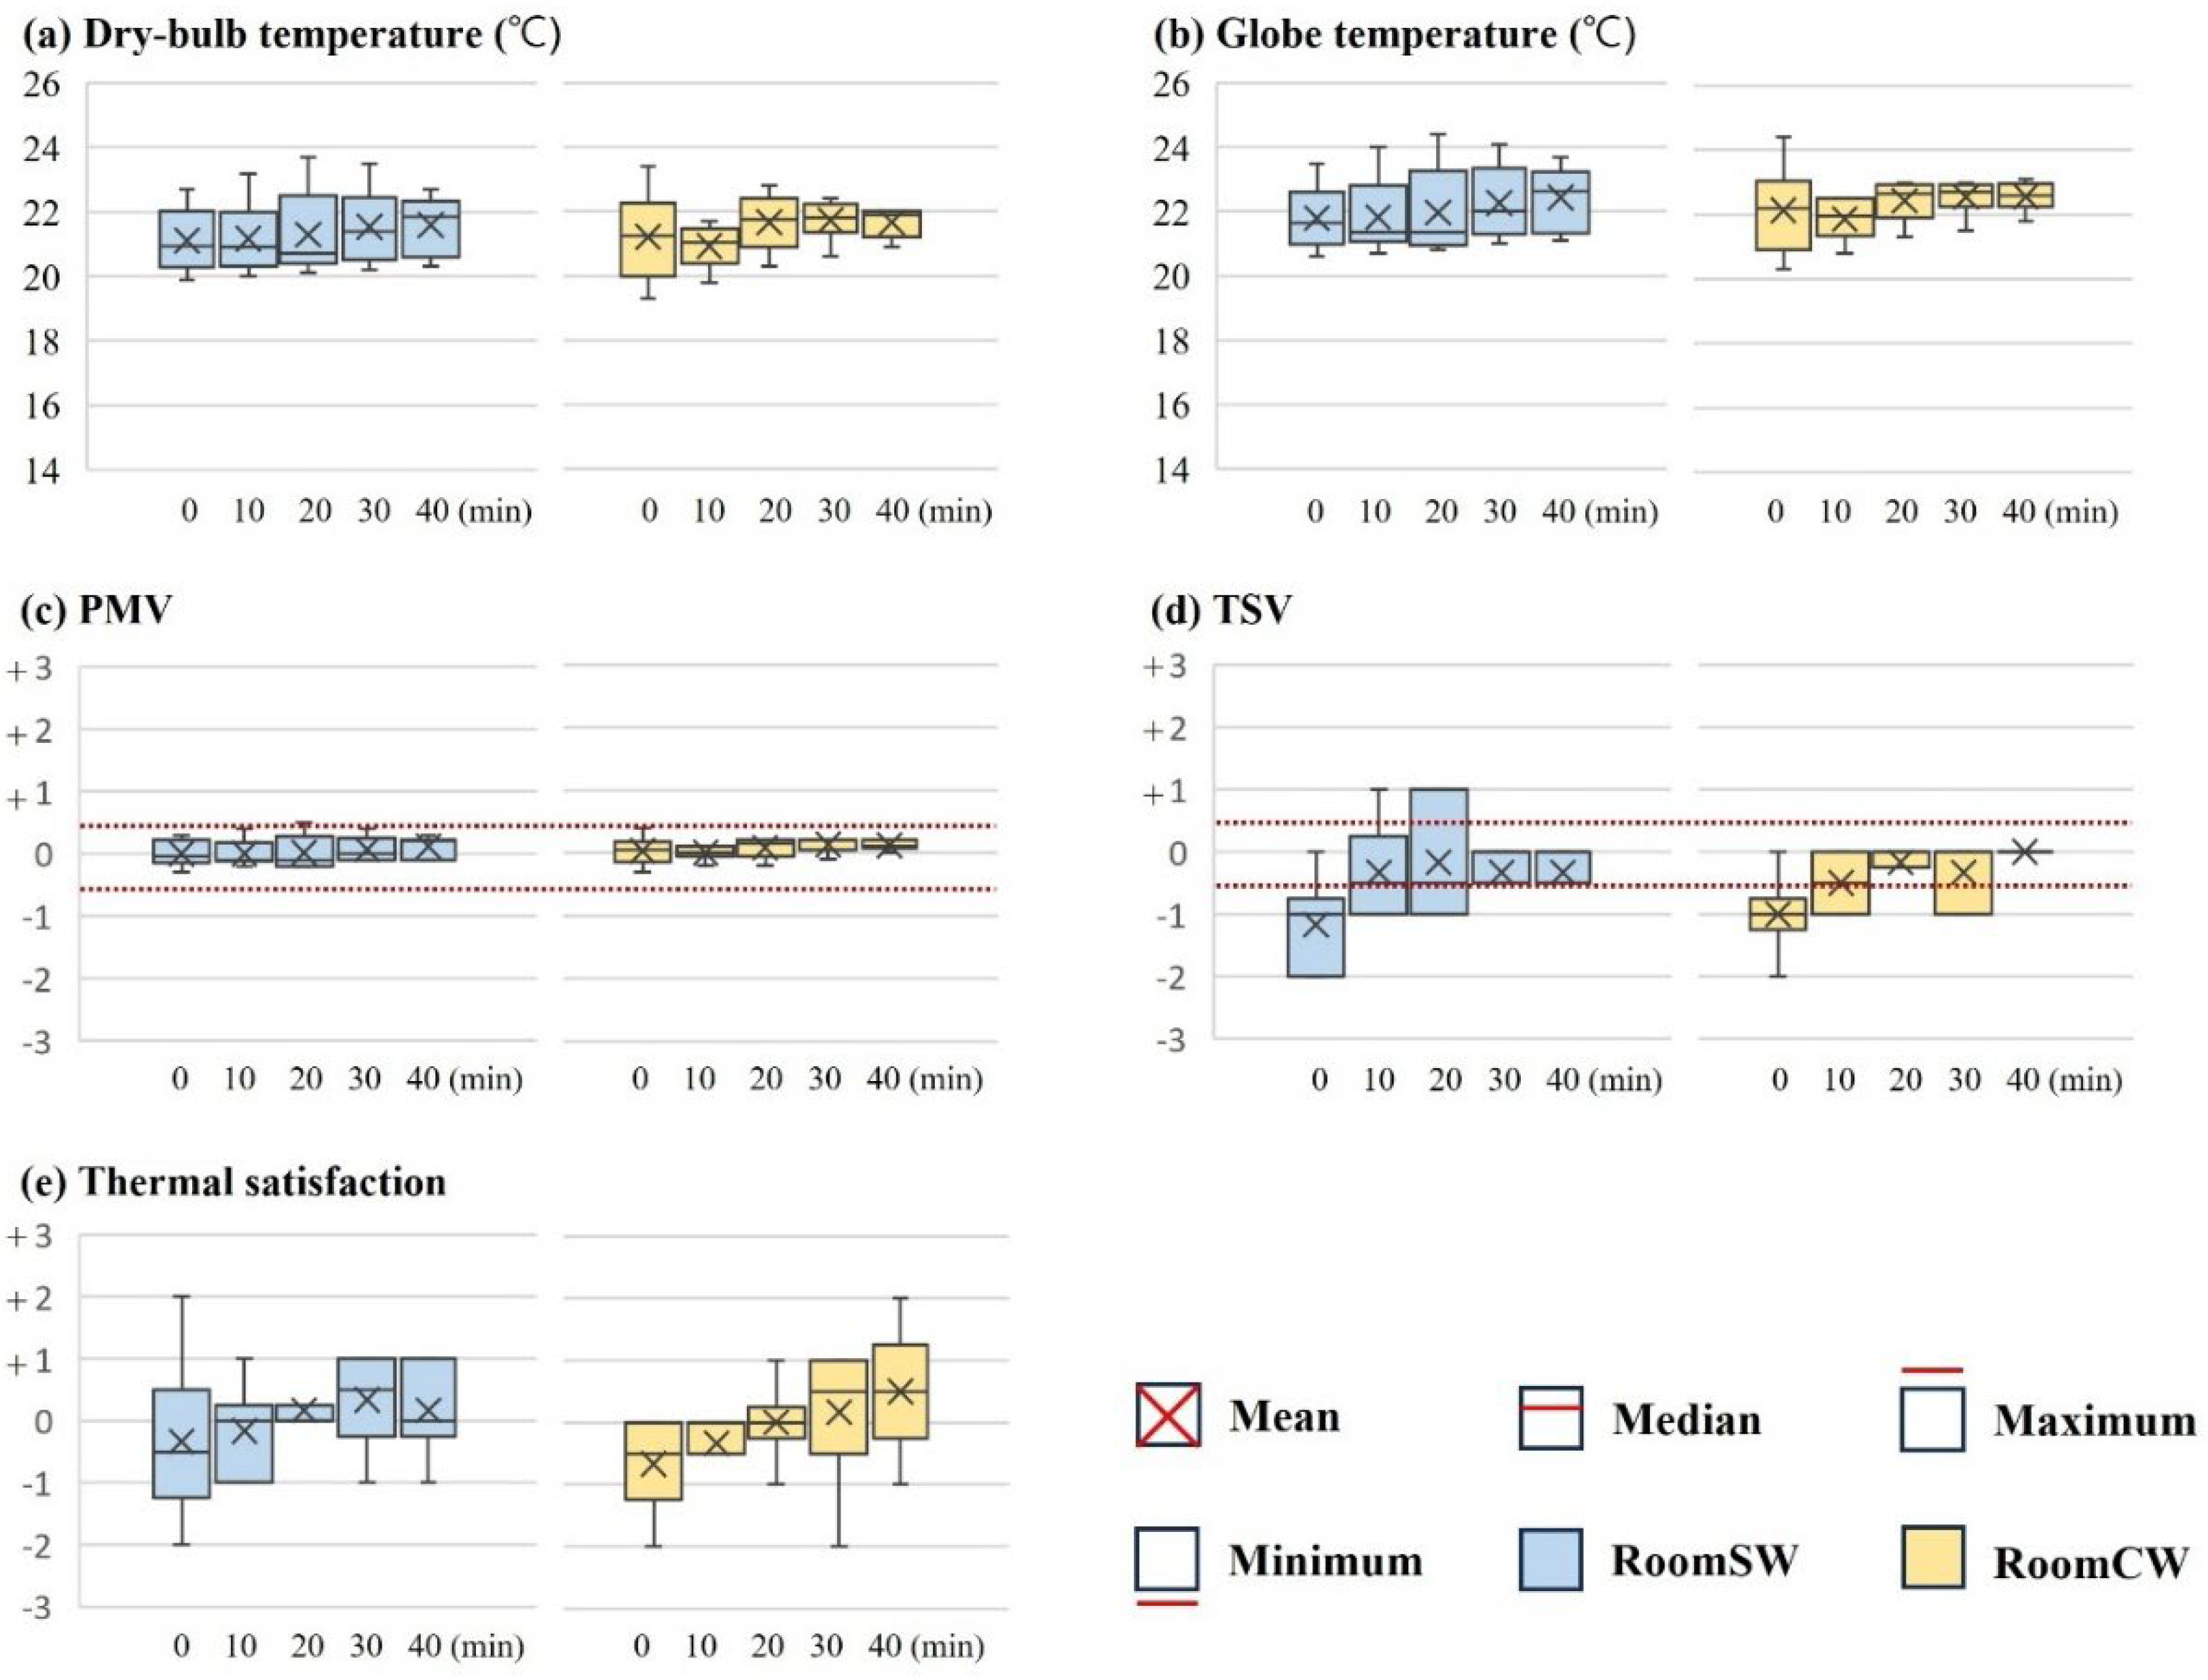
Figure 10.
Boxplots of visual comfort indicators during occupancy in the RoomSW and RoomCW.
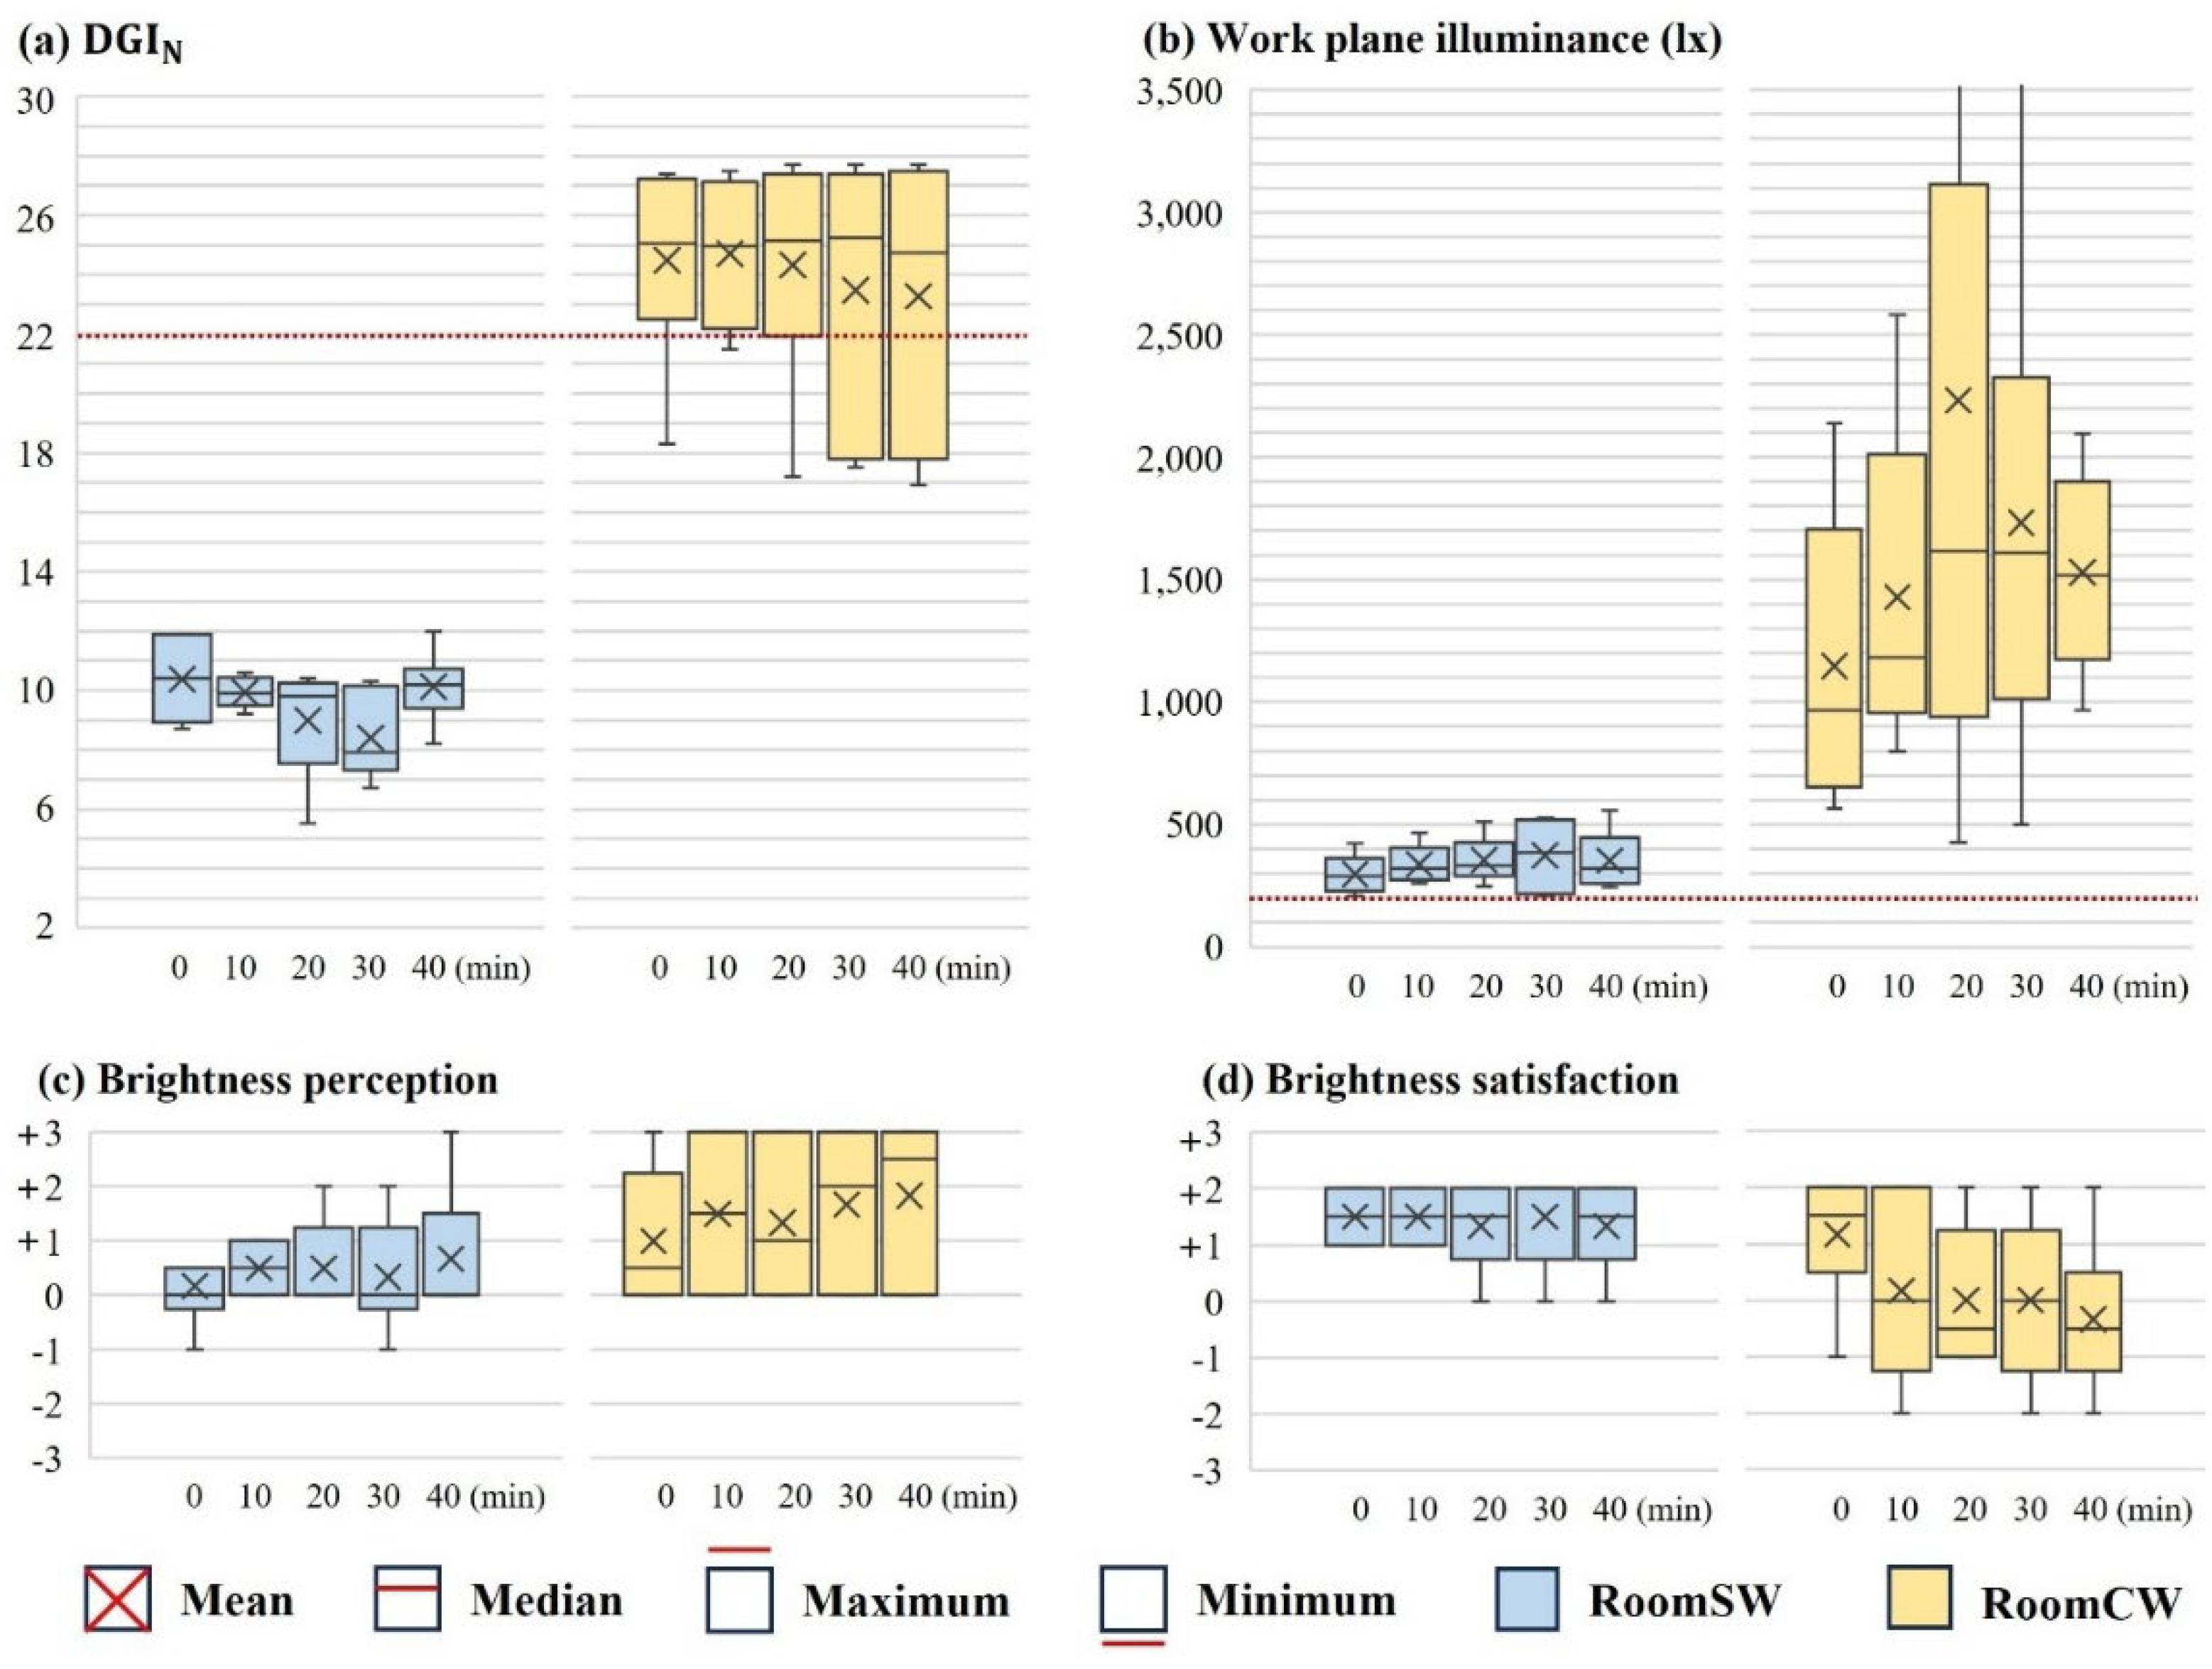

Table 1.
Thermal sensation scale.
| Value | Thermal sensation |
| -3 | Cold |
| -2 | Cool |
| -1 | Slightly cool |
| 0 | Neutral |
| +1 | Slightly warm |
| +2 | Warm |
| +3 | Hot |
Table 2.
DGIN scale.
| DGIN | Level of glare |
| 16 | Just perceptible |
| 18 | Perceptible |
| 20 | Just acceptable |
| 22 | Acceptable |
| 24 | Just uncomfortable |
| 26 | Uncomfortable |
Table 3.
Evaluation items and indicators.
| Category | Item | Indicator | Types of indicators | |
| Objective | Subjective | |||
| Thermal comfort | Temperature | Dry bulb temperature | O | |
| Globe temperature | O | |||
| Thermal sensation |
PMV | O | ||
| TSV and thermal environment satisfaction survey | O | |||
| Visual comfort | Glare | DGIN | O | |
| Indoor illuminance |
Work plane illuminance | O | ||
| Perceived brightness and brightness satisfaction survey |
O | |||
Table 4.
Smart window VT values and tinting levels based on outdoor illuminance.
| Outdoor illuminance (lx) | VT | Smart window tinting level |
| ≥ 139,476 | 0.013 | Level 10 (Full-tinting) |
| ≥ 53,330 | 0.034 | Level 9 |
| ≥ 17,270 | 0.105 | Level 8 |
| ≥ 11,700 | 0.155 | Level 7 |
| ≥ 9,397 | 0.193 | Level 6 |
| ≥ 7,990 | 0.227 | Level 5 |
| ≥ 7,284 | 0.249 | Level 4 |
| ≥ 6,768 | 0.268 | Level 3 |
| ≥ 6,455 | 0.281 | Level 2 |
| ≥ 6,254 | 0.290 | Level 1 |
| 6,254 > | 0.333 | Level 0 (Clear) |
Table 5.
Definition of oktas.
| Weather symbols | Oktas | Definition | Category |
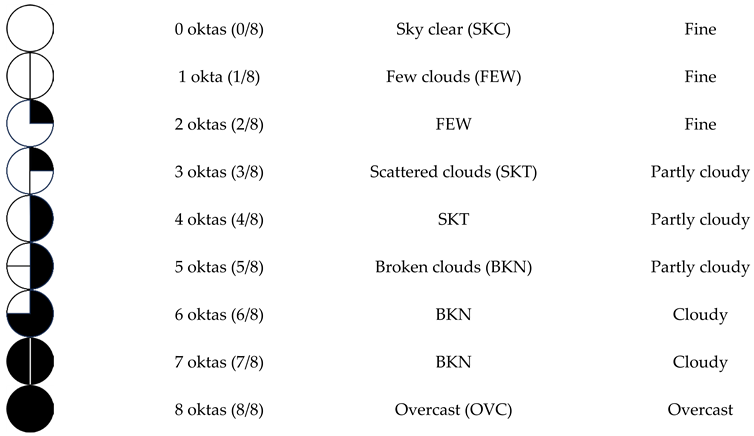 | |||
Table 6.
Performance values of the windows.
| SHGC | VT | |||
|---|---|---|---|---|
| RoomSW | Full tinting | 0.929 | 0.150 | 0.013 |
| Untinting (Clear) | 0.290 | 0.333 | ||
| RoomCW | 0.943 | 0.352 | 0.523 | |
Table 7.
Participant characteristics.
| Mean | Median | Min | Max | |
| Age | 33.4 | 25.0 | 21.0 | 59.0 |
| Height (cm) | 161.2 | 161.5 | 155.0 | 168.0 |
| Weight (kg) | 55.4 | 54.0 | 47.0 | 68.0 |
| BMI | 21.3 | 20.8 | 19.3 | 24.9 |
Table 8.
Survey dates and corresponding sky conditions.
| Survey dates | |||||||
| 12/03 | 12/06 | 12/10 | 12/13 | 12/17 | 12/20 | 12/24 | 12/31 |
| Cloudy | Cloudy | Clear | Cloudy | Clear | Cloudy | Clear | Cloudy |
Table 9.
Thermal and visual comfort evaluation cases and corresponding survey dates.
| Category | Case | Sky condition | Environmental condition | Survey date |
| Thermal comfort | Case WT1 | Clear day | Adjusted to maintain a PMV range of ±0.5 |
12/10, 12/17, 12/24 |
| Visual comfort | Case WV1 |
Table 10.
Statistical results of the paired samples t test for thermal and visual comfort indicators.
Table 10.
Statistical results of the paired samples t test for thermal and visual comfort indicators.
| Average | P value | Cohen’s d | ||
| Thermal comfort | RoomSW_DT – RoomCW_DT | -0.10 | 0.28 | 0.11 |
| RoomSW_GT – RoomCW_GT | -0.08 | 0.33 | 0.08 | |
| RoomSW_PMV – RoomCW_PMV | 0.01 | 0.36 | 0.07 | |
| RoomSW_TSV – RoomCW_TSV | +0.07 | 0.33 | 0.08 | |
| RoomSW_TS – RoomCW_TS | +0.13 | 0.30 | 0.10 | |
| Visual comfort | RoomSW_DGIN – RoomCW_ DGIN | -14.49 | <0.001 | 4.00 |
| RoomSW_WPI – RoomCW_WPI | -1271.02 | <0.001 | 1.08 | |
| RoomSW_BP – RoomCW_BP | -1.03 | <0.001 | 0.64 | |
| RoomSW_BS – RoomCW_BS | +1.03 | <0.001 | 0.68 |
DT: dry bulb temperature, GT: globe temperature, TS: thermal satisfaction, WPI: work plane illuminance, BP: brightness perception, BS: brightness satisfaction.
Disclaimer/Publisher’s Note: The statements, opinions and data contained in all publications are solely those of the individual author(s) and contributor(s) and not of MDPI and/or the editor(s). MDPI and/or the editor(s) disclaim responsibility for any injury to people or property resulting from any ideas, methods, instructions or products referred to in the content. |
© 2025 by the authors. Licensee MDPI, Basel, Switzerland. This article is an open access article distributed under the terms and conditions of the Creative Commons Attribution (CC BY) license.
Copyright: This open access article is published under a Creative Commons CC BY 4.0 license, which permit the free download, distribution, and reuse, provided that the author and preprint are cited in any reuse.


