
Submitted:
20 January 2025
Posted:
03 February 2025
You are already at the latest version
Abstract
Windows, accounting for 45% of overall heat loss, significantly influence a building’s energy performance. Evaluating window energy performance in existing buildings is therefore essential. This study aimed to assess the energy performance of windows to determine whether replacement is necessary. The assessment considered factors such as window location, height, orientation, and weather conditions in a high-rise residential building. A thermal camera was utilized for measurements, and statistical analyses were conducted on the collected data. Results indicated significant performance variations across building sides and floors, with differences at the 0.05 significance level attributed to temperature, wind speed, and direction. Findings suggest that implementing more efficient windows on upper floors—particularly from the fourth floor upward—is advantageous. Additionally, accounting for dominant wind speed and direction is crucial for optimizing window design and configuration.
Keywords:
window energy performance
; thermal analysis
; high-rise buildings
1. Introduction
The building sector plays a significant role in energy consumption, responsible for 30-40% of energy use in the world [1]. On the other hand, buildings are responsible for about 36-38% of overall CO2 emission [2]. Therefore, reducing energy consumption will not only decrease the energy cost of buildings but also reduce the potential harm to the environment. To reduce the energy consumption of a building, it requires studying a variety of effective factors including building structure and characteristics, weather conditions, occupancy, and their behavior [3] as well as building locations [4]. Additionally, [5]) believed that the energy performance of the building is based on all components of the building: lighting, HVAC system, controls, envelope, and equipment. According to [6], among building components, windows are the most significant components, which are responsible for 45% of overall heat loss in buildings (as a comparison, it is 8% for walls, 8% for roof, 9% for floor, 11% for thermal bridges, and 19% for air leakage). Further, windows account for 40% of overall cooling and heating loads of a building [7]. The stricter fenestration regulations of Florida, in energy provisions of their Building Code, mentioned the importance of windows in building energy consumption as well [8]. Therefore, optimizing the windows, as one of the main sources of energy loss, by considering the condition and features of a building as well as the area and localization of windows [6] would have a big contribution to energy efficiency in buildings.
To optimize window energy performance in buildings, accurate and comprehensive assessments are necessary. Many studies have been conducted about assessing and optimizing the different types of windows’ energy performance [8,9,10,11,12,13]. The results of these studies suggested simulating, calculating, or measuring as the approaches to assess the energy performance of windows. A literature review revealed that simulation is the most common approach in window studies. However, the measurement approach is the most accurate approach to assess window energy performance. In addition, the usefulness of the measurement approach has been determined not only for existing buildings but also for new buildings as benchmarks.
Even though simulation and computation-based methods are more common for studying windows energy assessment, the accuracy and credibility of these methods can be weak in comparison with the measurement method, which deals with real-life conditions. Furthermore, the accuracy rate of data and results of studies for the measurement methods are more acceptable. The collected data and results of the measurement tools can be used not only for assessing the energy performance of an existing building’s windows as well as window designing of new buildings. However, there are only a few studies that used measurement methods and none of them considered the best design and configuration of windows for a building. Due to the lack of precise studies in this area, comprehensive and detailed studies are required to determine an applicable and accurate measurement tool for this approach. Therefore, this study has considered all or any of the different variable factors and conditions such as window types, orientation, weather, and location for windows energy performance assessment regardless the method, to provide an implementable measurement method to determine if different windows are necessary for building energy performance. Developing a measurement approach for windows energy performance will improve applicable knowledge on building energy consumption that may yield better design and configuration of windows to reduce energy loss.
The studies of building energy consumption can be divided into three groups:
- (A)
- Studying the overall effect on building energy performance of different factors such as building characteristics, weather condition, and building’s orientation. For example, [14] assessed the effect of orientation on energy consumption of a small building by Building Information Modeling (BIM);
- (B)
- Studying on the energy performance of building components individually, such as wall, roof, windows, control system, HVAC system, and insulation; and
- (C)
- A synthesis of two approaches above, in which components of the building are studied with considering the features of the buildings.
Measurement is a rarely used method in window studies. This methodology requires a precise tool to measure the real data of windows energy performance. The infrared camera is one of the most common and useful tools in construction to detect deficiencies in a different part of the construction buildings. More importantly, the infrared thermography technique (IRT) has become popular in construction and buildings to identify thermal irregularities since 1987 [15]. According to [16], the accuracy of the infrared thermography technique (ITT) is higher than the heat flowmeter method.
Thermography and thermal camera have been widely used for different purposes as well as construction engineering and building thermal performance. For instance, in order to identify the subsurface structural deficiencies, [17] found the failure point of a concrete bridge in the UK by thermographic analysis. [18] believes the thermal camera is one of the useful methods to study the thermal characterization of glazing and windows. [19] identified some diverse insulation defects of campus buildings’ envelop using Fluke TI25 infrared hand-held camera and an ArduCopter 3DR Hexa-C drone. [20] generated the 3D reconstruction and discovered poor insulation and heat leakage of a building of Maryland university in a time-efficiently manner using a FLIR e4 camera and Parrot AR. Drone 2.0. [21] used multirotor hexacopter UAV with an IR camera to study the thermal performance of a new detached house. [22] obtained the external and internal surface temperatures of the building’s facades by infrared thermography to measure the heat loss through the envelope of the building. They showed that the air boundary layers’ thermal resistances vary during the day, and it’s also, greater than the suggested value by local regulation. [23] quantified the influence of parameters such as solar irradiation, wind, air and sky temperature, emissivity, and thermal transmittance (U-value) on the evaluation of thermal images by a numerical study. They determined that the minimum climatic history is needed to accurately interpret the thermal images.
According to [24,25] to study the buildings thermal performance, there can be two approaches: active thermography, which inspects building defects closely and focuses on analyzing the detail areas, and passive or statistic thermography, which examine unknown defects to realize the location of the problem. Due to the important role of windows in a building energy performance and lack of measurement approaches in windows assessment studies, active thermography can be considered as a practical tool to study the thermal performance of windows, quantitively.
This study hypothesized that weather conditions—including air temperature, wind speed, and direction—and window location, including orientation and height, significantly affect window energy performance. To evaluate this hypothesis, the following research objectives were pursued: (1) review various assessment methods for evaluating window energy performance, (2) conduct statistical analyses to determine whether wind direction, wind speed, window location, and height have a significant impact on energy loss, and (3) identify potential factors influencing window thermal performance while addressing the limitations of using a thermal camera as a measurement tool.
2. Materials and Methods
2.1. Study Site
To pursue the mentioned concerns, a thermographic survey was planned. The goal of this survey was to observe a thermal behavior of a building’s windows based on its location, height, orientation, and weather condition by using a thermal camera and provide an optional configuration based on the results. This building had to be a high-rise residential building due to its occupant’s uniformity. To this aim, Thompson Hall at North Dakota State University (NDSU) was chosen (Figure 1), which has 9 floors and 32 windows in each East and West sides and 48 windows in each North and South sides, and it’s located on the NDSU main campus in Fargo, North Dakota. North Dakota has a continental climate with low humidity, and nearly continuous wind [26]. Images were collected for windows of four sides of the building. Windows of this building are consisting of two separates frames permanently interlocked by a Termo-barrier. (Table 1).
2.2. Measuring Equipment
The equipment used in this research were:
- ICI infrared camera with a spectral sensitivity of 7 μm to 14 μm and accuracy of ±1 ℃ (Table 2).
- A measuring tape to measure the camera-object distance,
- 2” PVC pipe to hold the board in each image, and
- A 9 m (30 ft) pole to attach the camera and raise it to the desired height.

Table 2.
Technical specifications of the infrared camera used for this research.
| Characteristics | Description |
|---|---|
| Name | ICI 9640 |
| Detector Array | UFPA (VOx) |
| Pixel Pitch | 17 μm |
| Pixel Resolution | 640x480 |
| Spectral Band | 7 μm to 14 μm |
| Thermal Sensitivity (NETD) | < 0.02 °C at 30 °C (20 mK) |
| Frame Rate | 30 Hz P-Series |
| Dynamic Range | 14-bit |
| Temperature Range | -40 °C to 140 °C |
| Operation Range | -40 °C to 80 °C |
| Storage Range | -40 °C to 70 °C |
| Accuracy | ± 1 °C |
| Pixel Operability | > 99 %75 G Shock / 4 G Vibration |
| Dimensions (without lens) | 34 x 30 x 34 mm (H x W x D ± .5 mm) |
| Power | < 1 W |
| Weight (without lens) | 37 g |
| USB 2.0 for Power & DataBuilt-in ShutterAluminum Enclosure |
2.3. Weather Condition
According to the guidebook of [28], to detect missing heat, the temperature difference between the outside and the inside of the building should be at least 10 °C.
So, late fall was the closest best time to apply this criterion easily. In addition, since taking images might disrupt the students’ privacy, the imaging was done during winter break. Therefore, December 21, 22, and 23 were chosen to collect the data. The information about these days’ weather conditions is provided in Table 3. The reason for choosing three days to collect the data was to have more consistency and accuracy in the results by increasing the number of samples for statistical analysis.
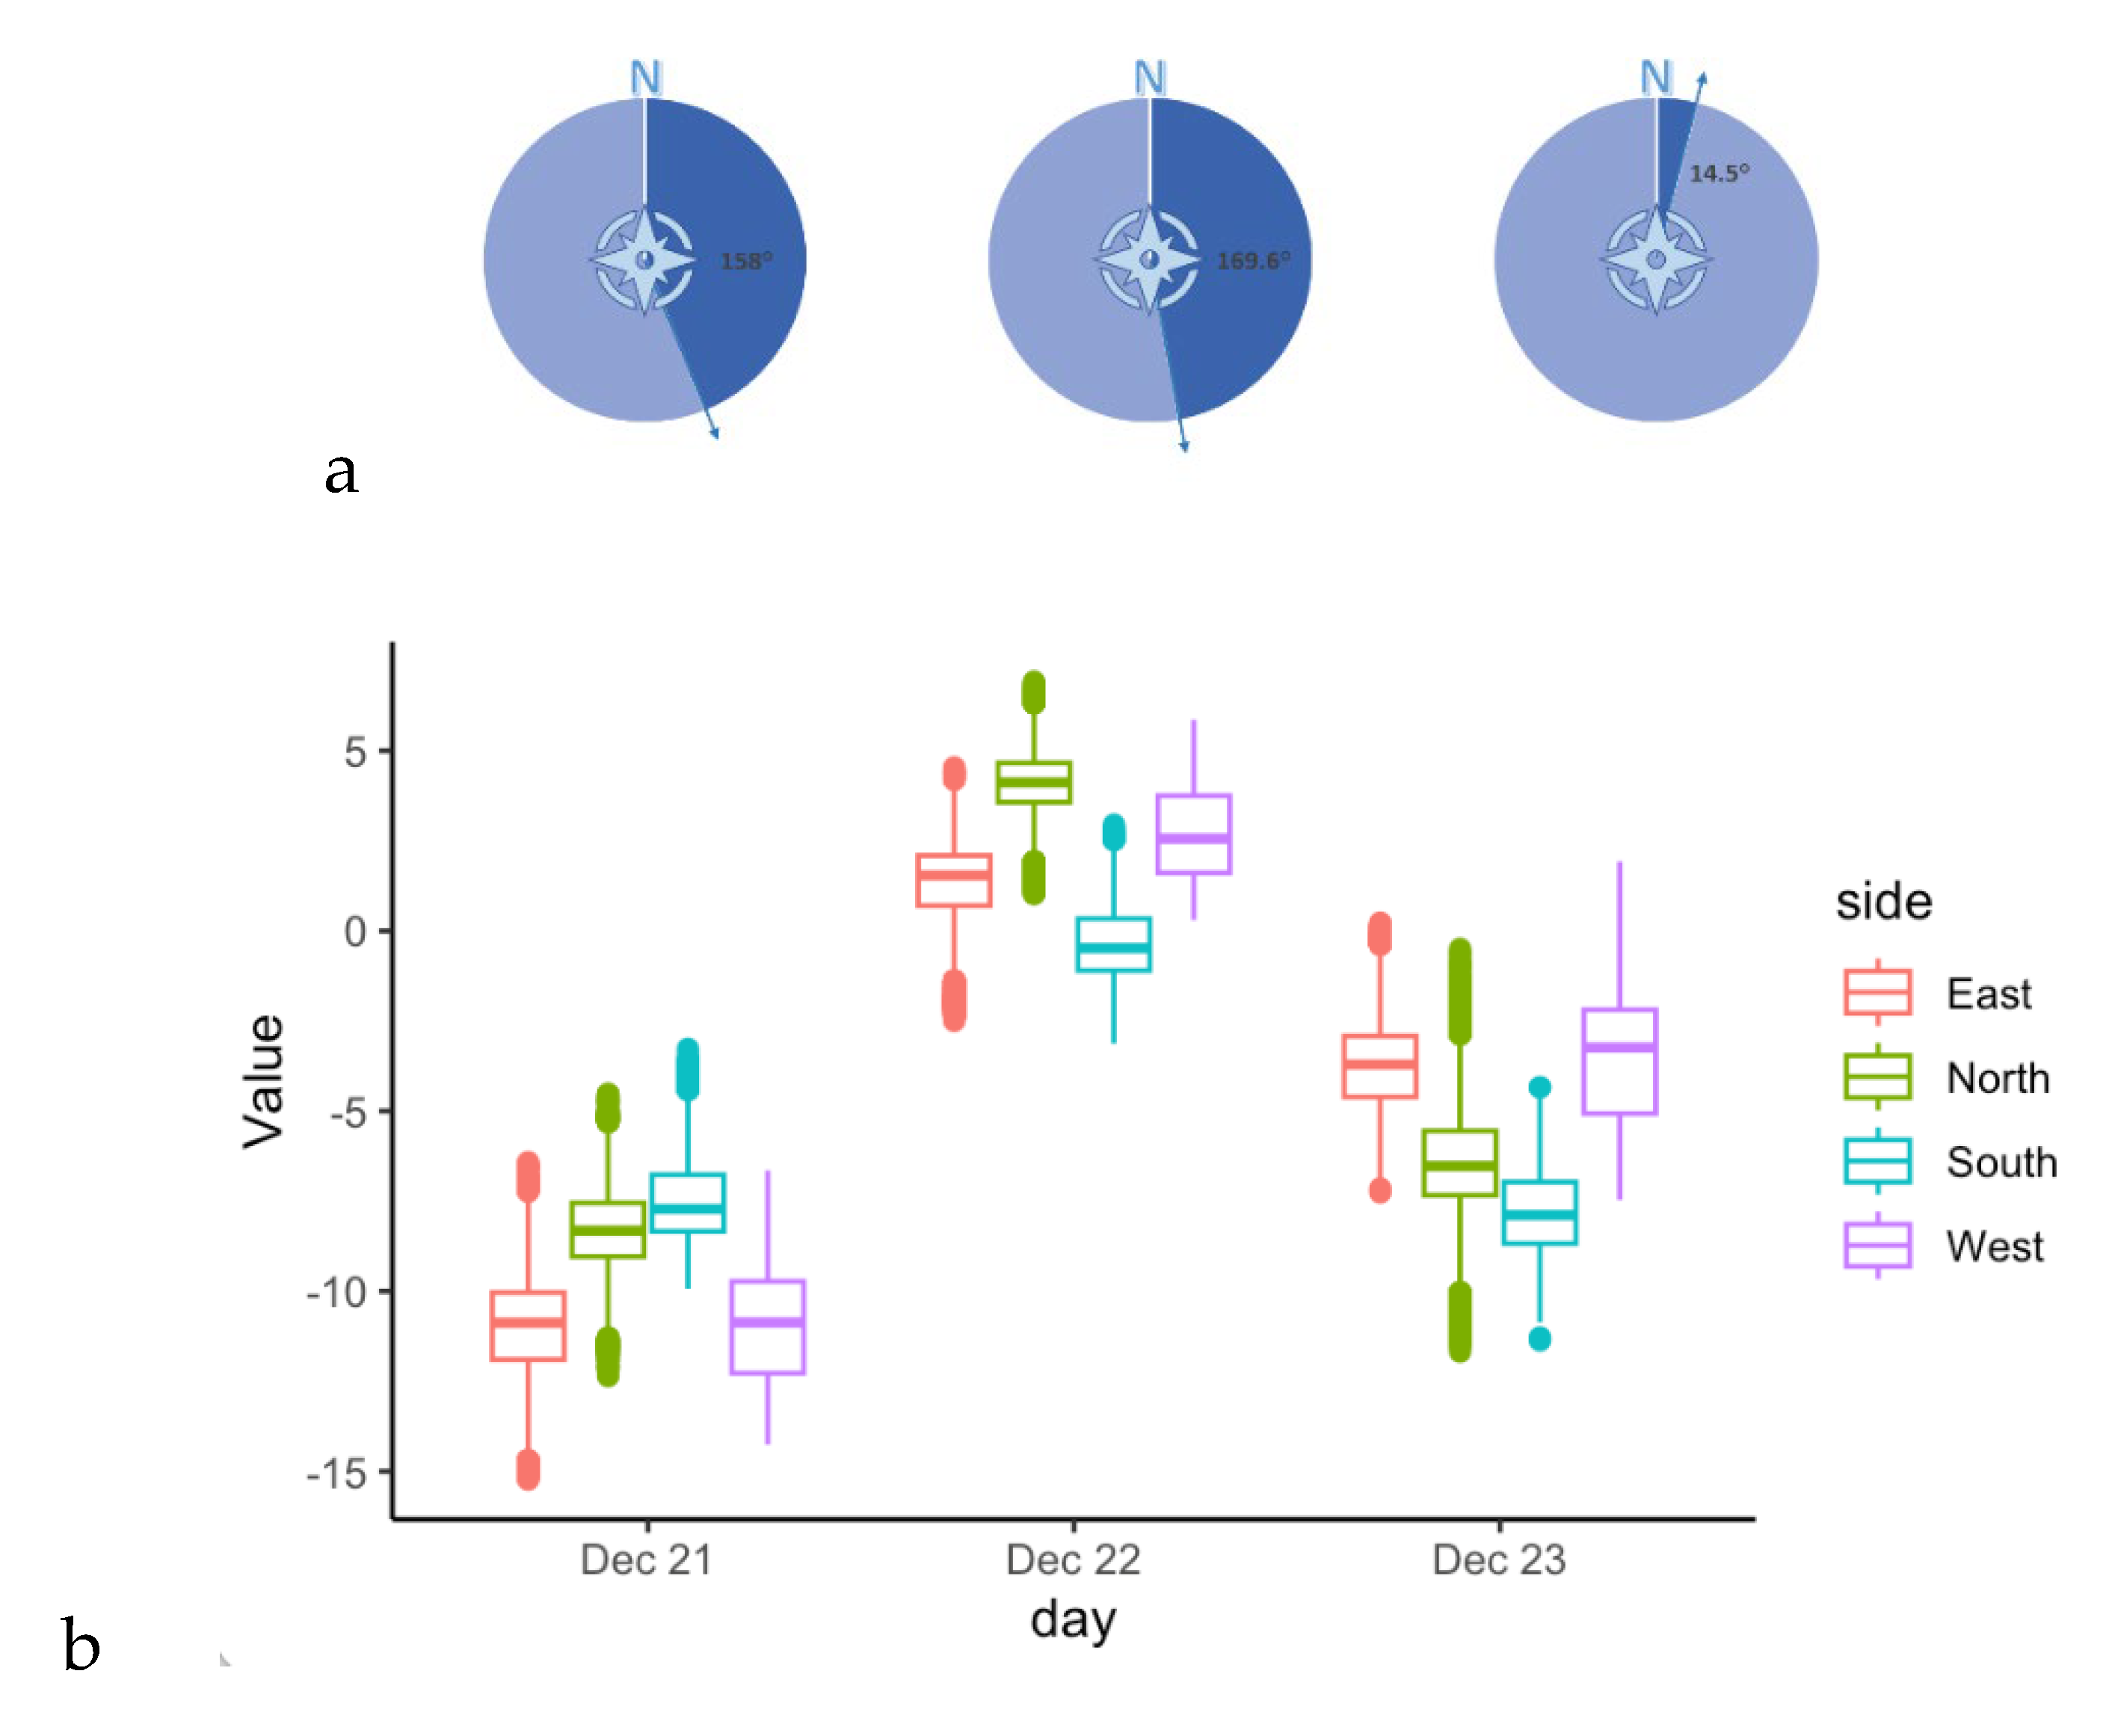
Wind affects the air pressure distribution on building surfaces, which controls the heat loss. Air movement is an important cause of energy loss from buildings. For instance, variation in overall surface heat transmission between high velocities (13.4 m/s) and very low velocities (1.3 m/s) is of the order of 30% for single pane glass. Thus, wind can cause about 10% of the total heat transfer to the environment. For wind speed of 2 m/s, the convection heat loss contributes 64% of total heat loss across the glass envelope whereas radiation contributes 36% of the total heat loss. In the current study, wind directions of studied dates obtained from NDAWN (https://ndawn.ndsu.nodak.edu/) weather station located at NDSU main campus for three-studied dates and are shown in Figure 2. In addition to the wind direction and speed, the shape of the building and its orientation to the wind strongly influence the wind velocities and flow characteristics in its vicinity and effect wind-flow pattern along each wall (Figure 3).
2.4. Measurement Criteria and Procedure
The study required the temperature of all rooms to be set of the same temperature at least 24 hours prior to data collection. Besides, based on Thermal Imaging Guidebook, when using a thermal imaging camera to find irregularities in the building’s thermal performance, the preferred difference in temperature between the inside of the building and the outside should be at least 10 °C. To follow this criterion, we asked the NDSU’s facility to set the temperature of all rooms at 20 °C (68 °F) at least 24 hours before data collection dates when the outside temperature was predicted to be less than 0 °C (Table 4). In addition, to have an equilibrium room temperature, all windows should not be blocked by a curtain or any other object during the time of data collection. However, we observed that some of the windows remained blind by curtains and some rooms had lights on, which were excluded from final data analysis.
To achieve enough height to capture proper images, a drone, a lifter, and a pole were discussed as alternatives. However, using drone and lifter was not considered because of the drone flight regulation on the safety issue and weather condition (below 10 oC). Thus, a long pole was used to raise the camera to about 9 m (30 ft) height that only allowed to measure thermal information of windows up to the 6th floor (including 5 rows of windows). Windows that were blocked by trees were not considered in analyses.
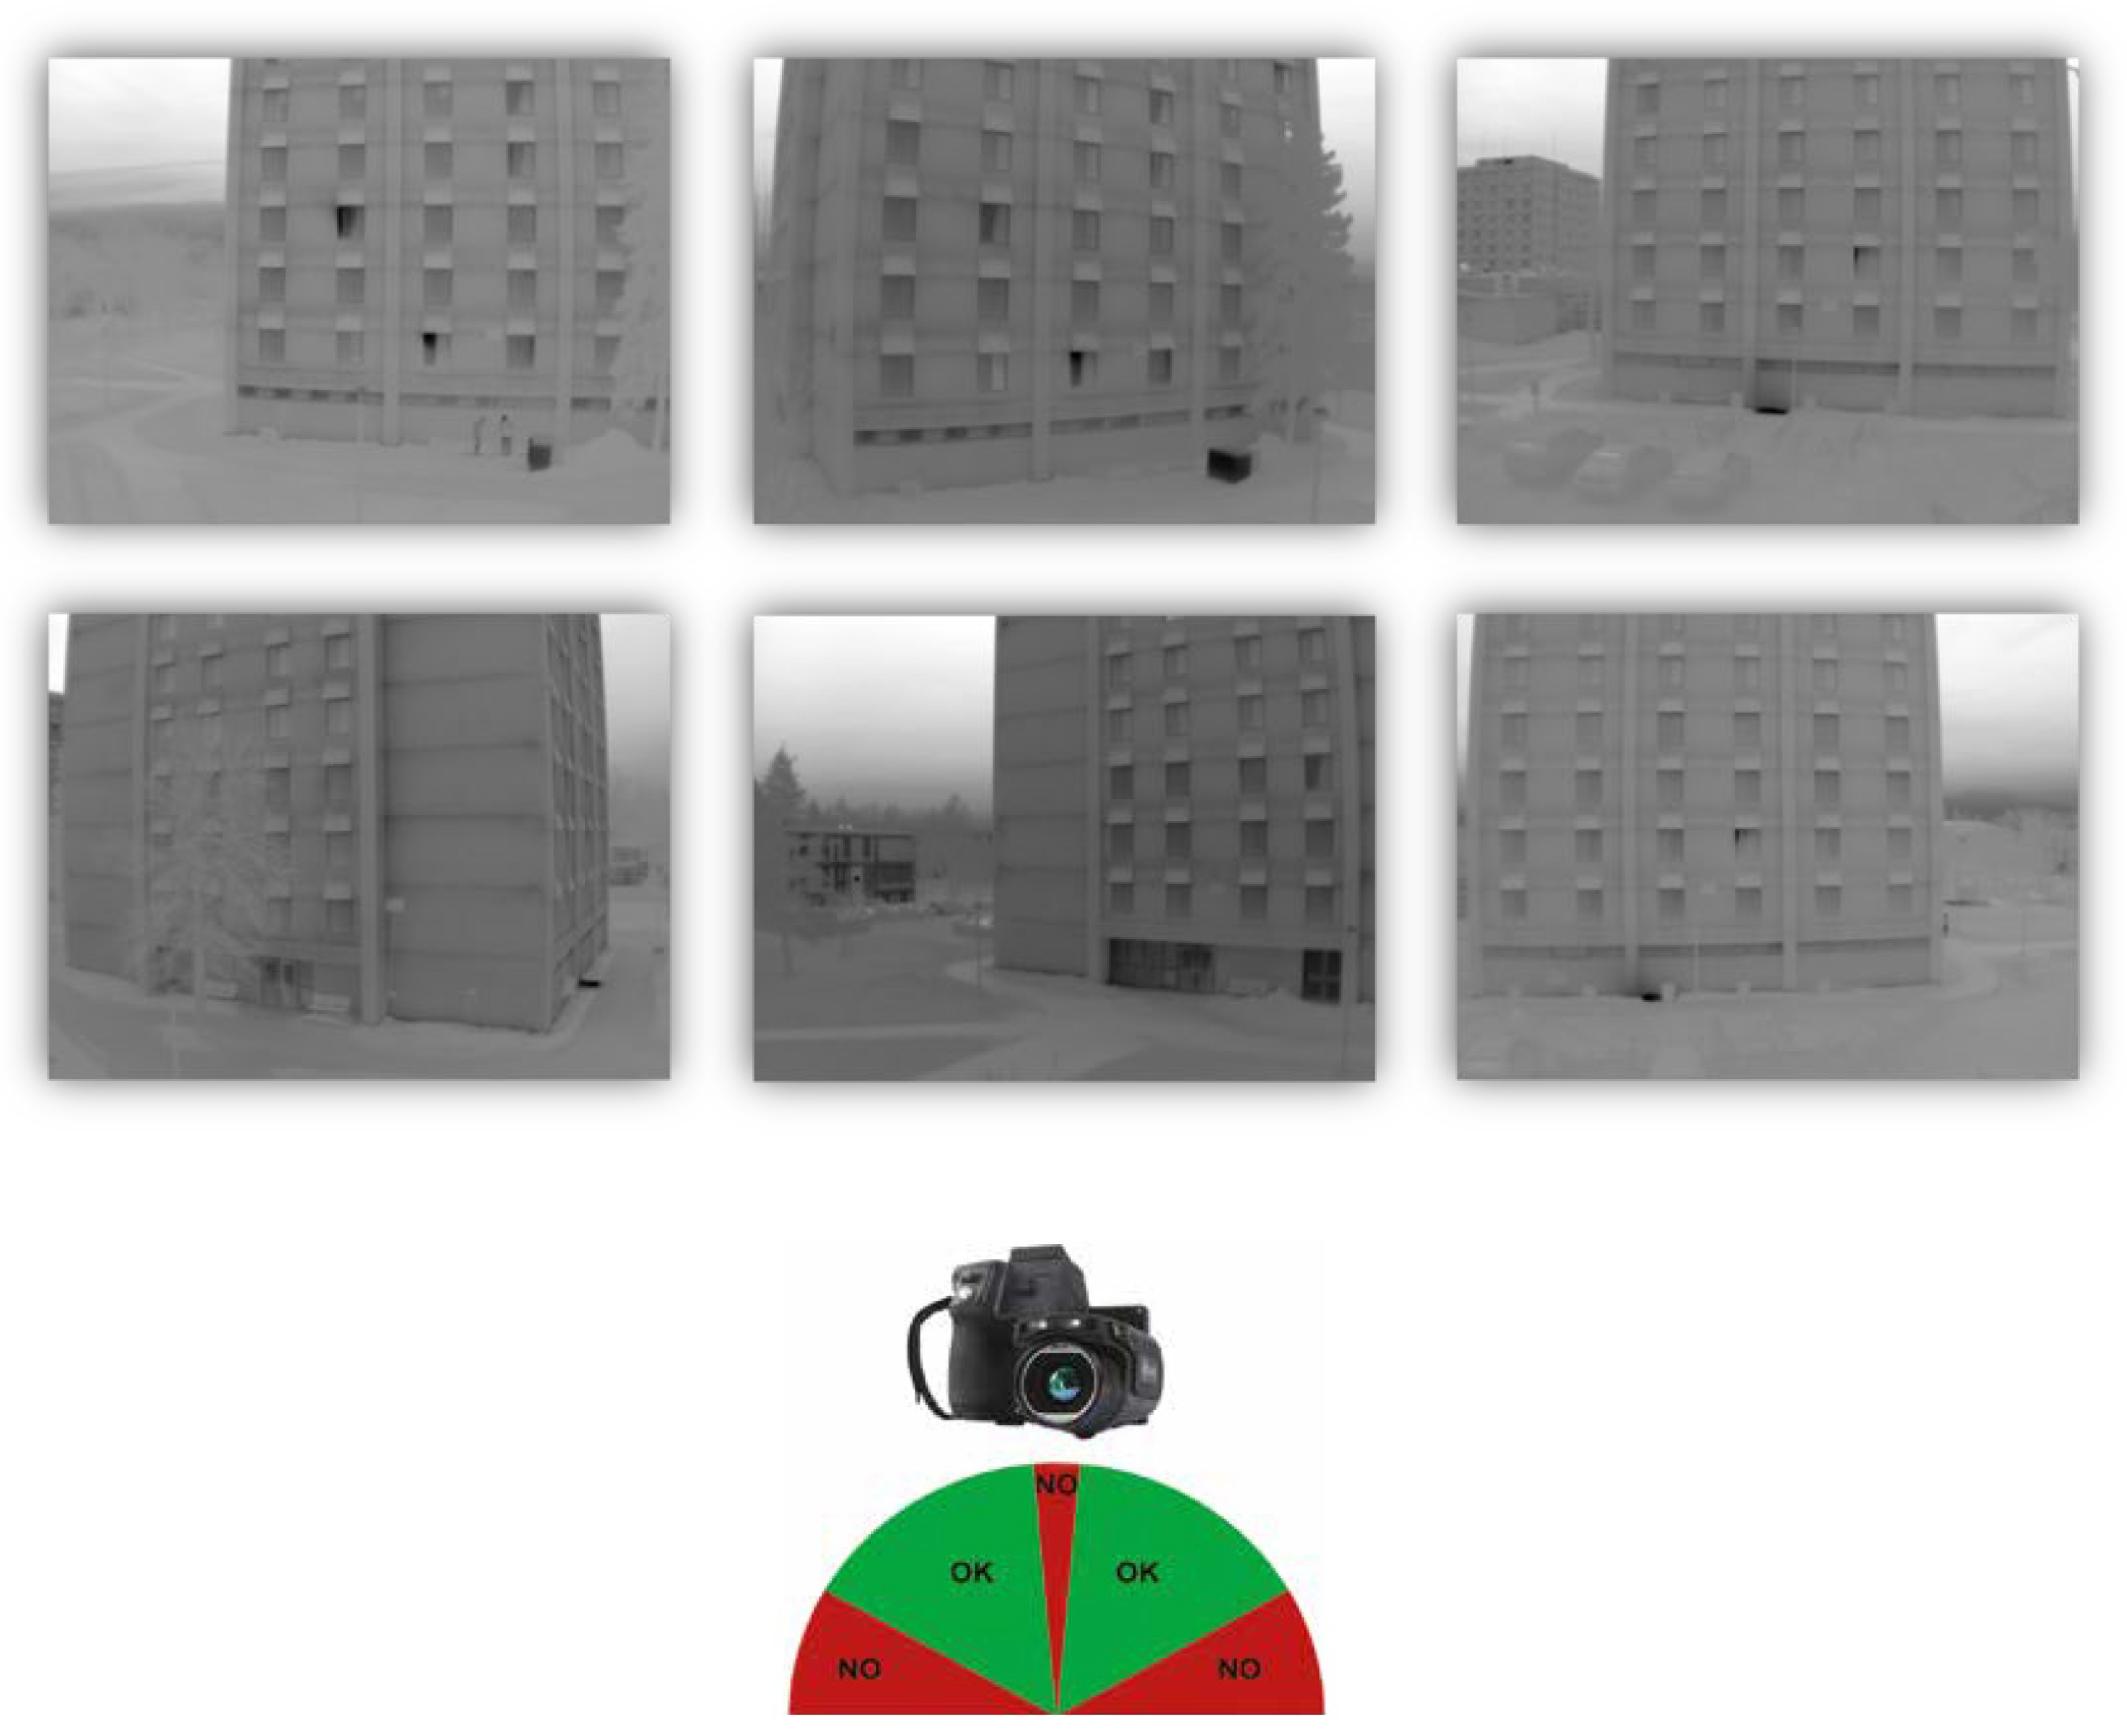
In order to have lower outdoor temperature and avoid direct radiation of the sun, [19] collected all infrared images early in the morning. According to [28], early morning is the preferred time to avoid sun reflection in cases the studied surfaces are highly reflective like glazing. Therefore, imaging for the current study was started at 6 a.m. every day, before sunrise, to prevent the possible reflection and errors caused by sunbeams and reflection from surrounding structures of the building. Surrounding structures of the building with different temperature can have a reflection on the glass, which cause the error in thermal images and results. To reduce the possibility of reflection on the glass during a thermographic survey, a viewing angle of 5°- 60° (0° is perpendicular) is recommended as shown in Figure 5 [28]. In order to avoid objects’ reflection on glazed surfaces, [22] suggested testing different angles ranging from 0° to 30° during thermal imaging. Therefore, a viewing angle of 5-60o was used in the current study.
The infrared camera measures the effect of temperature, not the temperature. So, it’s apparent temperature, which is the temperature value reported by the infrared camera. To make the results more comprehensible, the goal is to make the apparent temperature closer or equal to the actual temperature. To determine the actual temperature, we need to know the emissivity of the surface. To calibrate the camera and measure the reflected apparent temperature, [19,27] mounted a piece of black tape and aluminum foil near the target area. Then, by setting the emissivity of the black surface as 1, it would be easy to have an approximate actual temperature of the surface. Toward that end, the first step was fixing the blackboard on each side of the building in a way that it can be captured in each picture properly. Due to the harsh weather condition and the building’s limitation, it was not possible to stick the blackboard on each side of the building. Instead, a 2” PVC was used to hold the blackboard for each side during imaging time. Meanwhile, the camera, which was fixed on the 9 m (30 ft) pole, was set in a proper location. The proper location was determined to be about 27 m (90 ft) away from the building (Figure 5) for each side to have consistency between data of all sides of the building. More than fifteen images were taken from each side of the building in different angles, raging 5°- 60° (Figure 6), for each studied date to have enough replicates for accurate data analysis.
Figure 5.
Map of the building and approximate camera locations (source: google map).
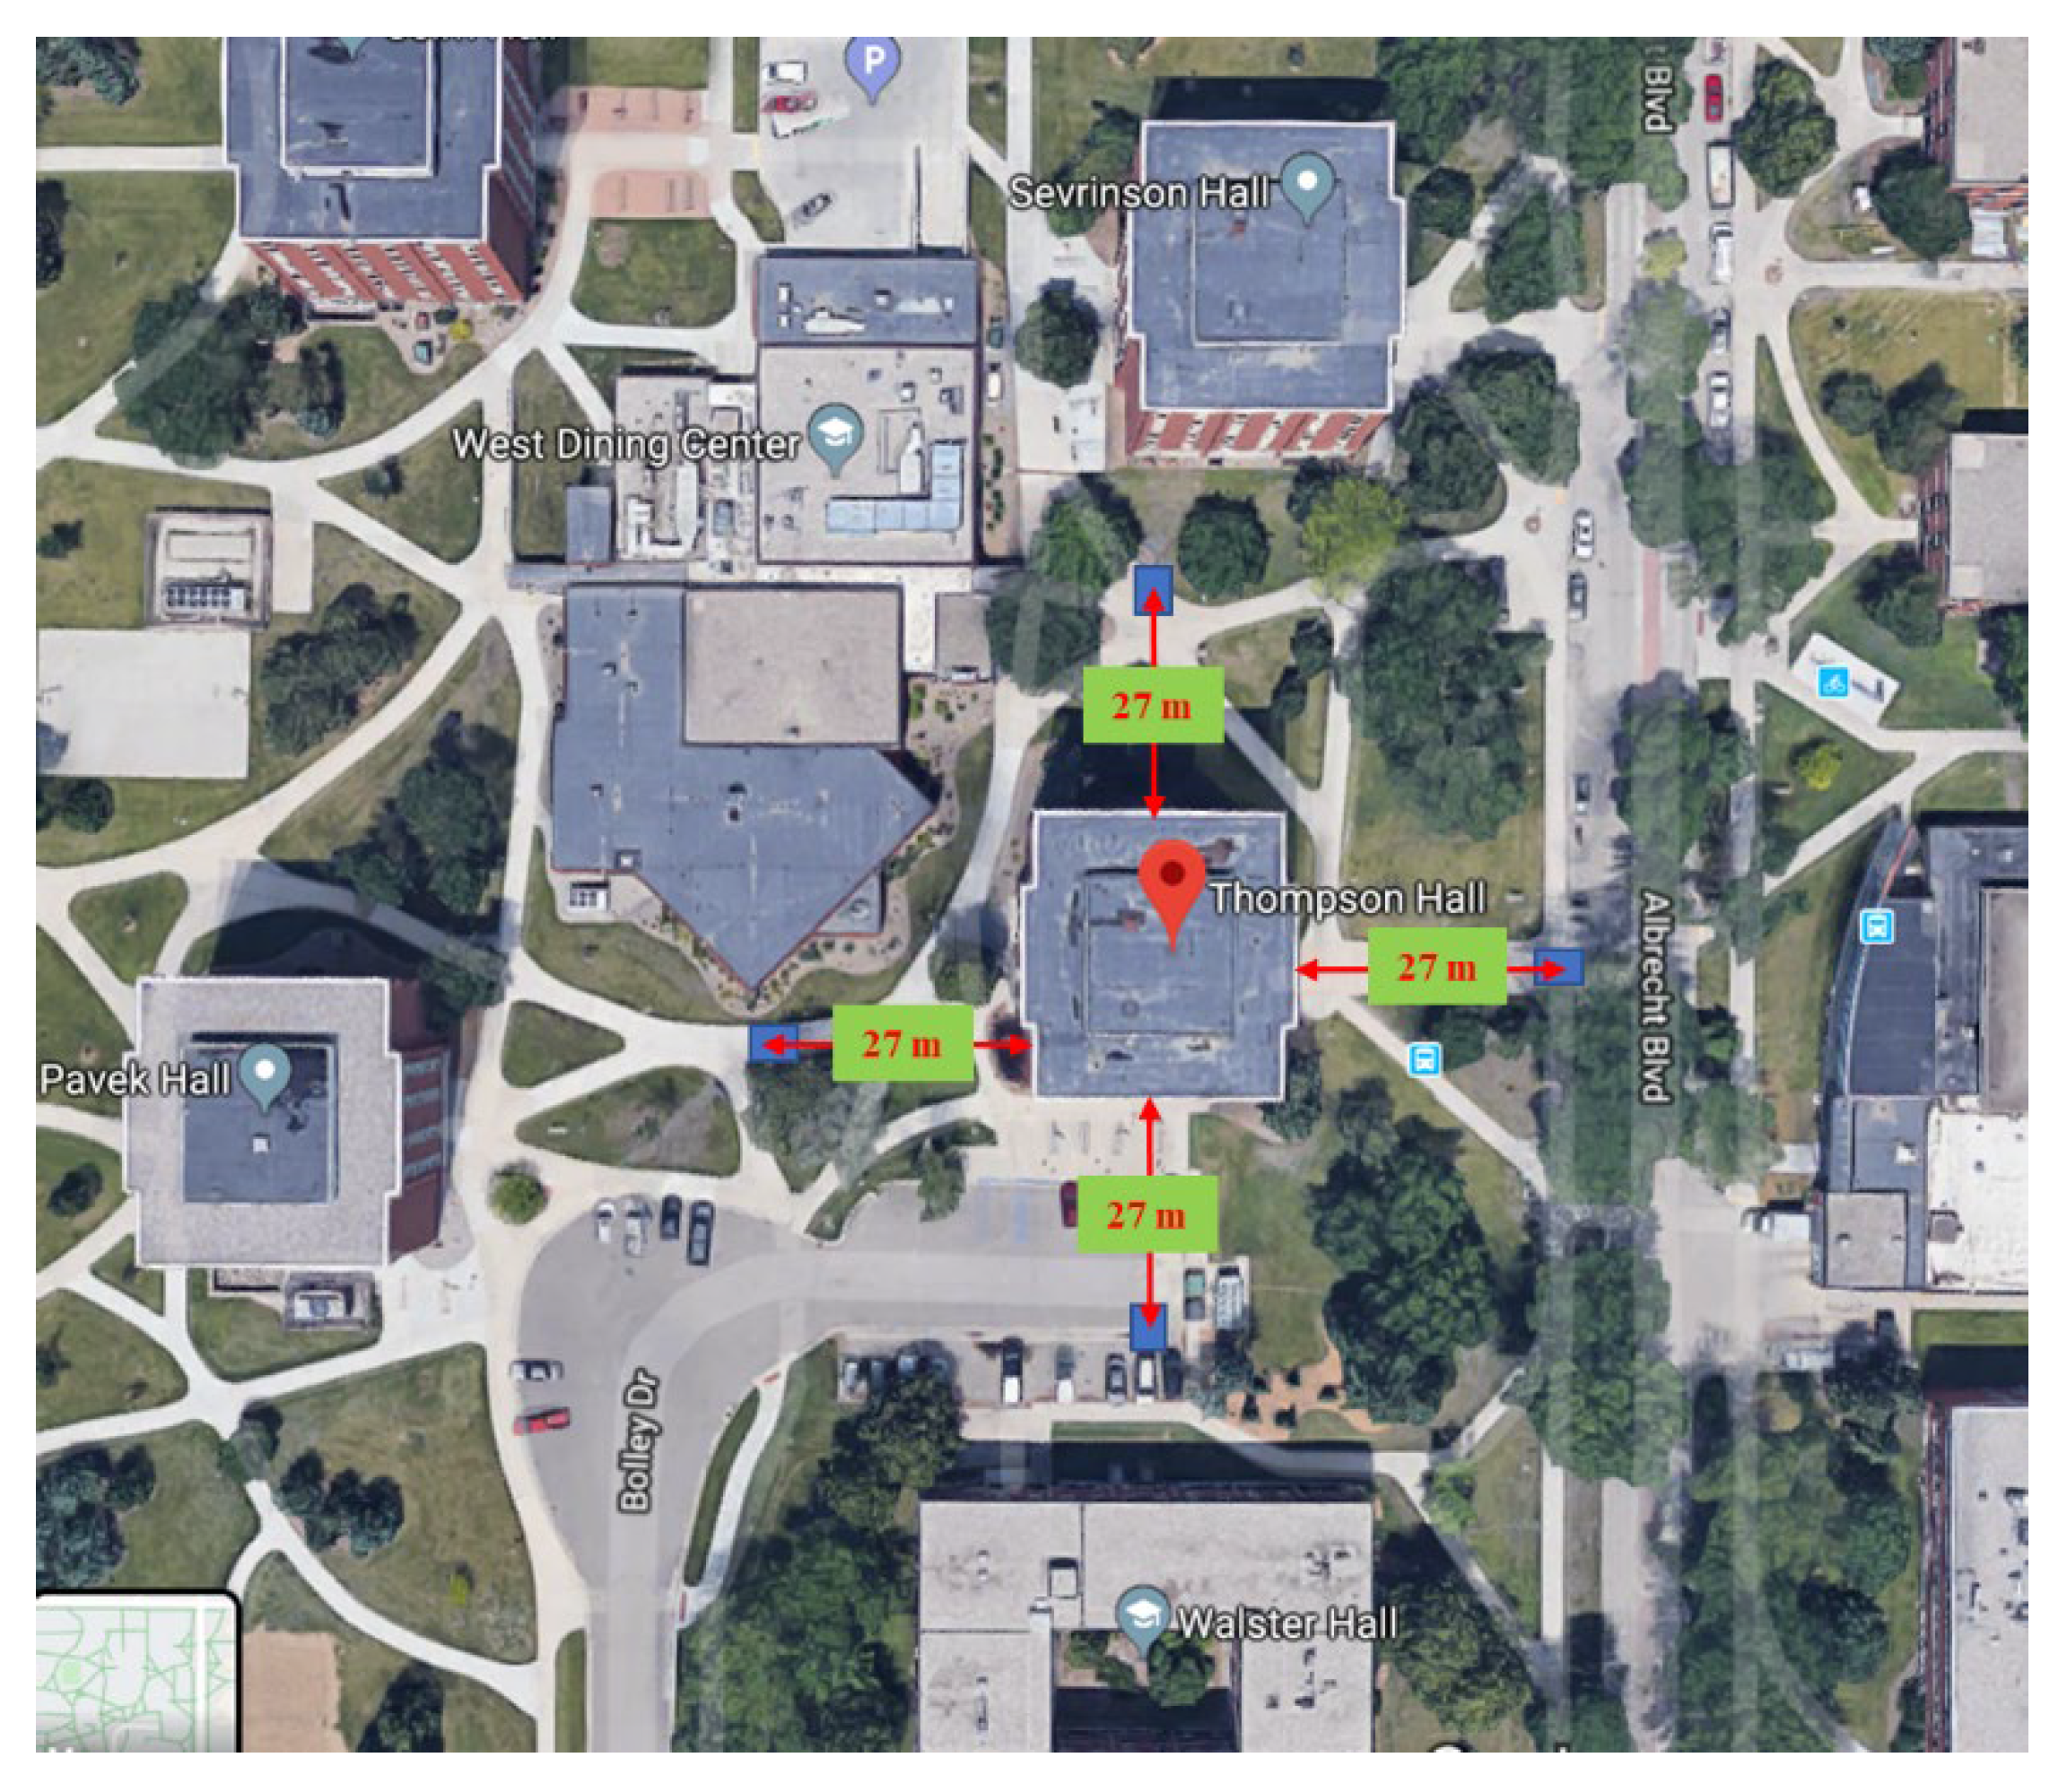
Figure 6.
Recommended angle for thermographic inspections of reflective surfaces [28] and images that have been taken from the study site.
Figure 6.
Recommended angle for thermographic inspections of reflective surfaces [28] and images that have been taken from the study site.
Determining the temperature based upon infrared energy emission is related to the object that emits the energy. Surface with higher temperature emit a lot of infrared energy where loss temperature objects emit less infrared energy.
The emissivity defines as the percent of infrared energy emitted by an object at any given temperature as compared to the theoretically perfect amount of infrared energy emitted by an object at the same temperature. The emissivity range between 0 to 1.0. In practice, the emissivity value of an object is influenced by the material, surface condition, and reflectivity. This variability makes the temperature measurement complex. An object that emits the theoretically perfect amount of infrared energy at any given temperature is called a blackbody, which is a perfect emitter. When an infrared thermometer is manufactured it is calibrated against a blackbody emitter. In current study, camera was recalibrated on-site to make sure the collected data from windows are accurate. Hence, to correct the emissivity of the measured images, from the IR Flash software toolset, a box shape was selected on the black body and the emissivity of the black body corrected to 1.
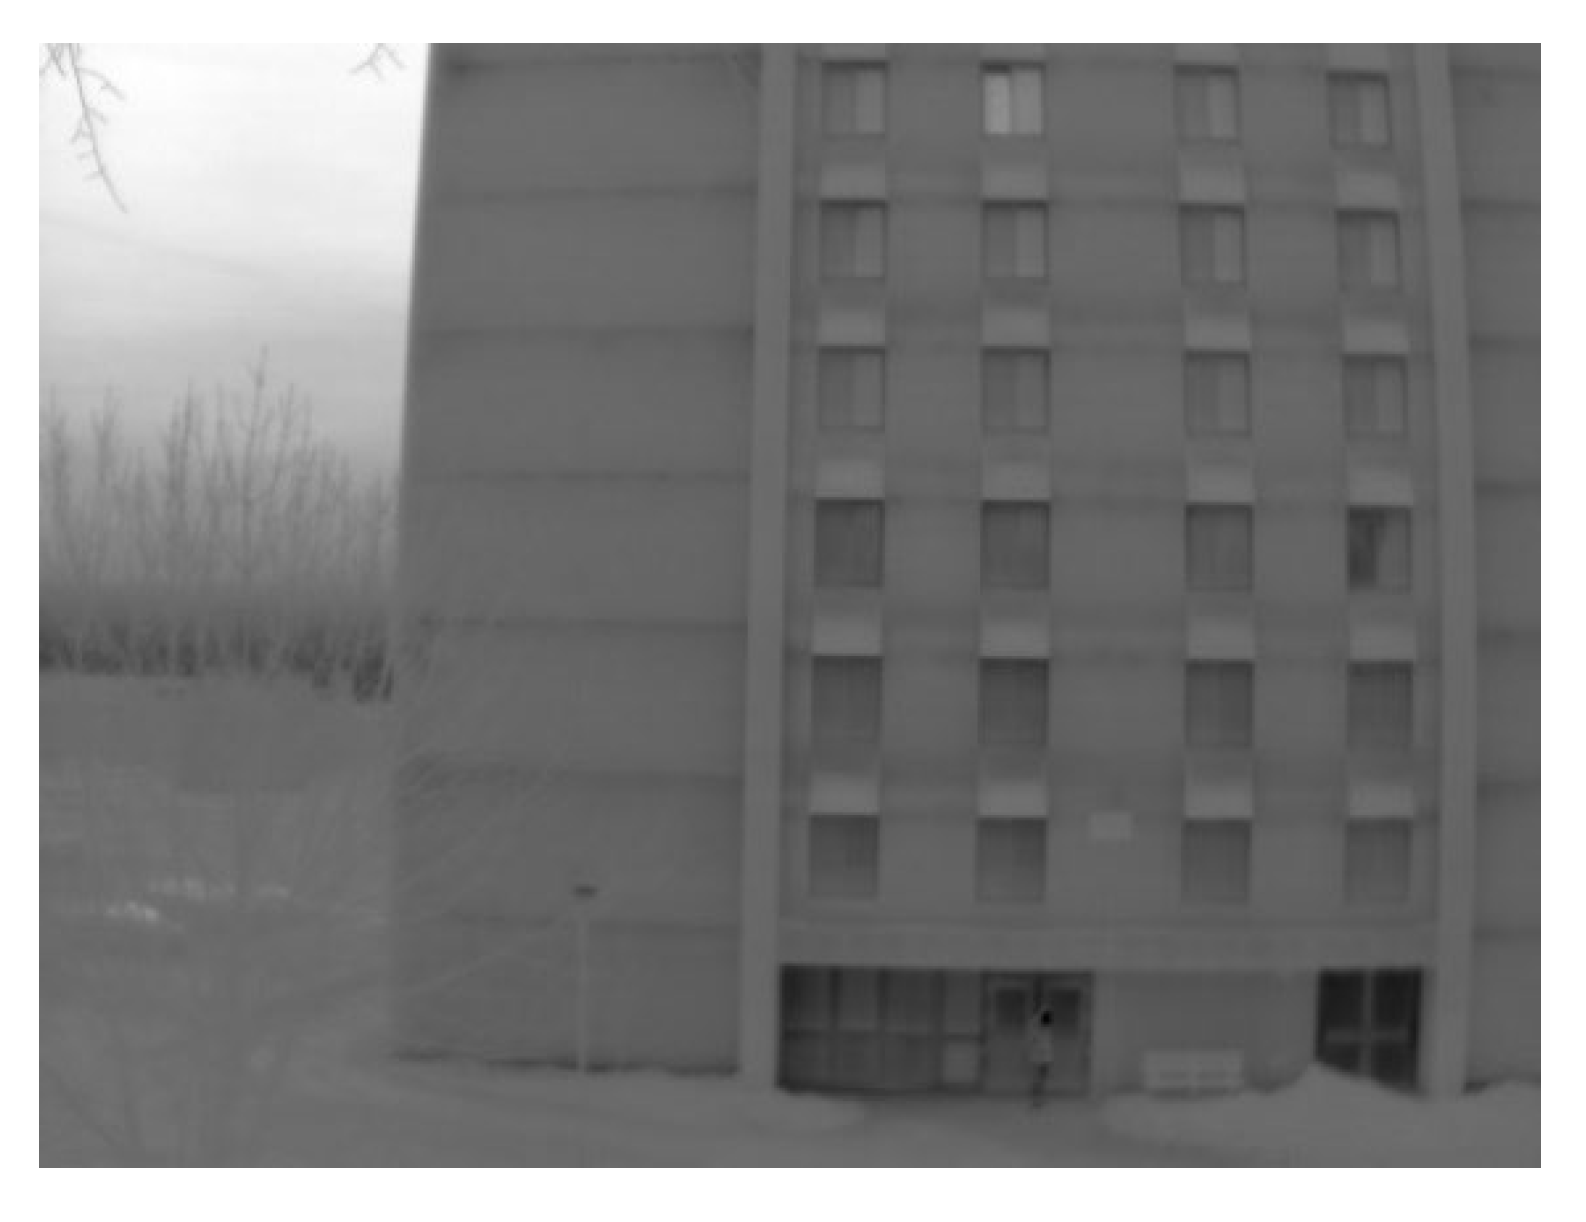
Three proper images were picked out of collected images for each side of the building and each data collection dates. The IR Flash software tool (Infrared Cameras Inc., Beaumont, TX) was used to transform the raw images to thermal values for each image. A box shape was selected and drawn for each window of the selected image, and temperature information of the window was exported as an Excel file that included temperature values of the image as a matric value for each 4 cm by 4 cm pixel of a window (Figure 7).
Figure 7.
Thermal image of East side of the Thompson Hall, NDSU, Fargo, ND.
Even though all six floors, which include five rows of target windows, had been asked to not be blind with curtains, some of the windows were still blind with curtains as well as most of the windows on the sixth floor with few rooms had lights on. Therefore, all sixth floor’s windows and windows with either blind curtain or light have been removed from the analyzed data. In addition, the condition of the West side was not proper to get accurate data since the building was blocked by a tree; thus, the number windows used from the West side was reduced significantly to keep the valid data. For detailed analysis and conclusion, the West side has not been considered. However, this side has not been ignored in analyzing the average of days to have more consistency in the overall results. Besides, some removed windows’ data including floor 6 have been discussed later in the dissertation to show the impact light, reflection, and curtain on the data. To process the exported Excel data from IR Flash software, analyze data, and create figures, an R program was developed in R Studio (Version 1.2.5033). The Excel file for each window from IR Flash software was imported to the R program using the Readxl package. The average, maximum, minimum, and standard deviation of all exported files for each window were obtained. In addition, the ggplot2 package was used for plotting, and various boxplots were created for each side, day, and floor of the building to compare the trend of temperature changes. Subsequently, this boxplot made possible to compare the temperature changes trend among floors, sides of the building, and study dates as well. To understand a combined effect of orientation, day, and height of the window on measured temperatures using the thermal camera, an ANOVA model was performed. To perform the ANOVA model for each day, the orientation of the building and floor and correlation between orientation and floor were considered. To build a model for all three-study dates, the day variable was added to the previously developed model. Although ANOVA is a powerful and useful parametric approach to analyze approximate normal distributed data with more than two groups, it does not provide any deeper insights into patterns or comparisons between specific groups. After a multivariate test, it is often desired to know more about the specific groups to find out if they are significantly different or similar. This step after the analysis is referred to as ’post-hoc analysis’ and is a major step in hypothesis testing. One common and popular method of post-hoc analysis is Tukey’s Test. Tukey’s test compares the means of all treatments to the mean of every other treatment and is considered the best available method in cases when confidence intervals are desired or if sample sizes are unequal. Therefore, Tukey’s multiple comparisons of means with a 95% family-wise confidence level were developed in R using Agricole package.
3. Results
3.1. Effect of Blind Curtain and Light Reflection
In any kind of thermal performance study, light and reflection cause errors in the results. To show the effect of light reflection and the blind curtain on the collected data, unfiltered data is discussed. However, having a blind curtain can be a case study itself to see the effect of the curtain on saving energy. Figure 8 shows the East side of the Thompson Hall including the RGB image, thermal image, and boxplot for the collected thermal values on December 21. The window that had a blind curtain is shown by an orange box. The sixth floor, which also had a blind curtain, is shown with a blue box. The boxplot of measured thermal values from each window clearly shows the effect of the blind curtain for the specific floor compared to the rest of the windows in the same row. The highlighted boxplot is belonging to the 4th window of the 3rd floor (left to right), which not only had a blind curtain but also was reflecting the outside light on the glass. Therefore, the boxplot of measured thermal value shows a higher standard deviation comparing to other windows.
Figure 8.
a) RGB image, b) thermal image, and c) boxplot of each window temperature range for each measured row for the East side of the building on December 21 (windows numbered from left to right).
Figure 8.
a) RGB image, b) thermal image, and c) boxplot of each window temperature range for each measured row for the East side of the building on December 21 (windows numbered from left to right).
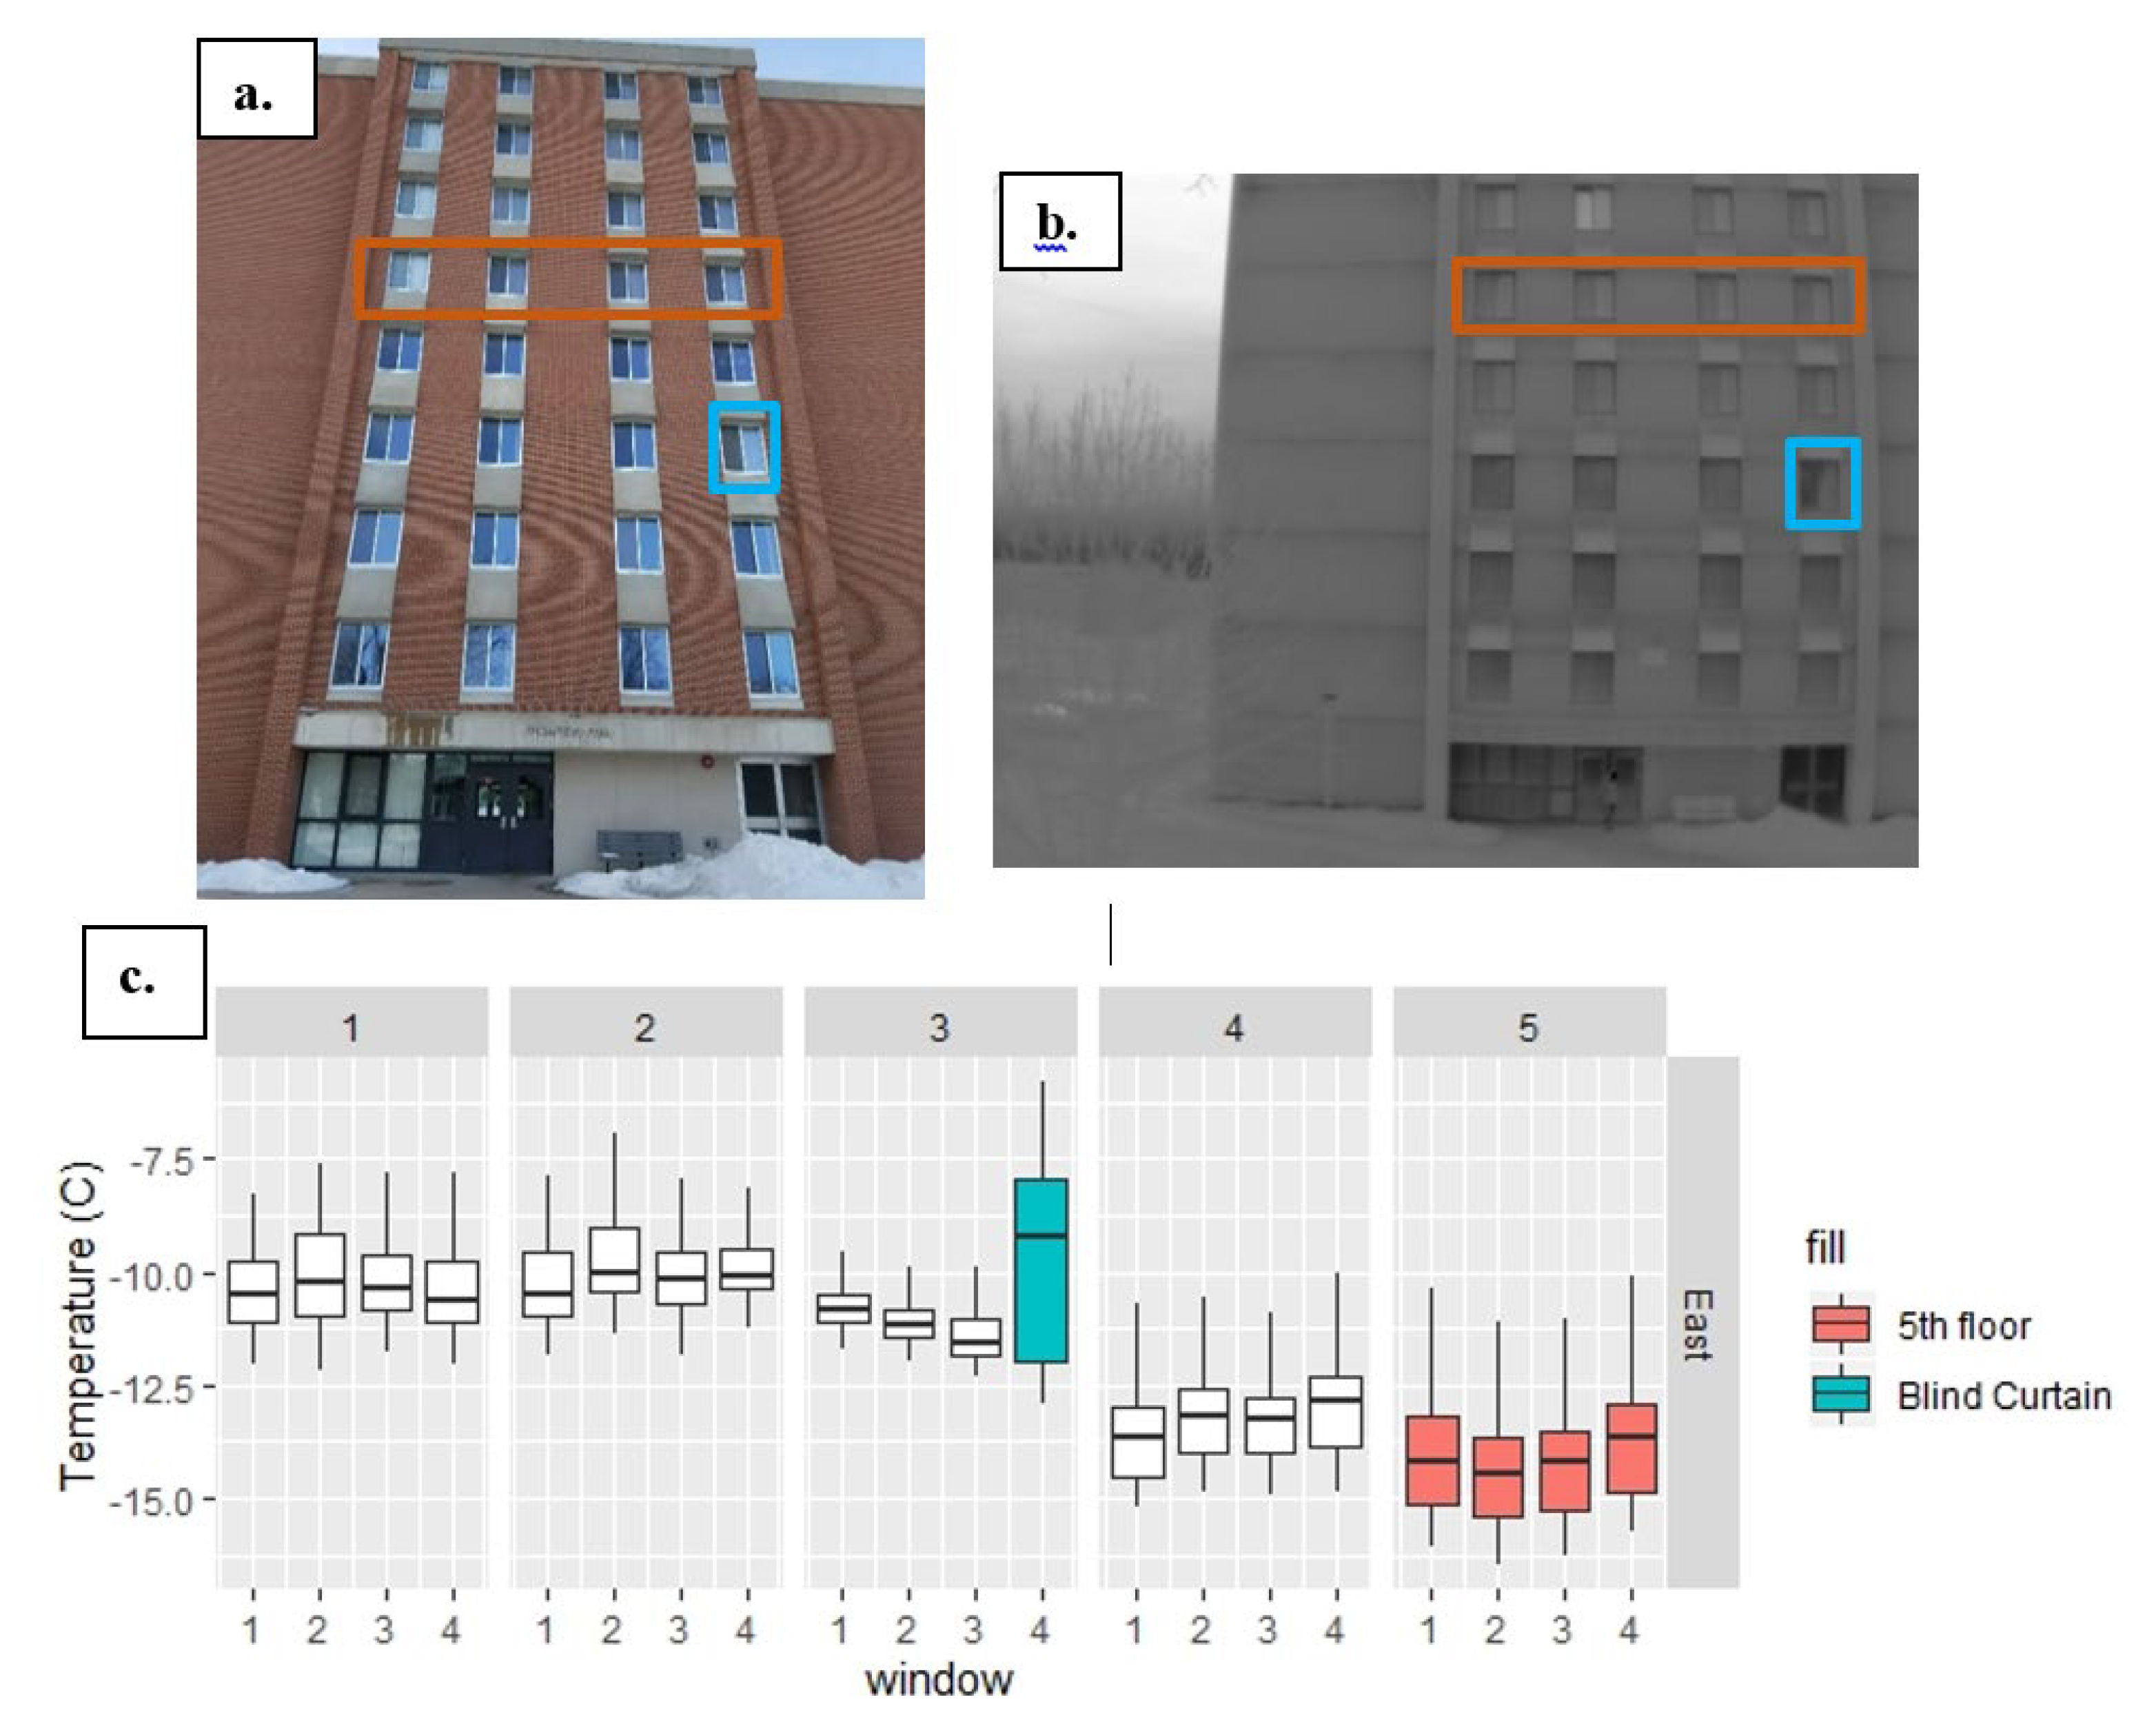
Figure 9 shows the South side of the building including RGB and thermal images. The boxplot shows the variation of the measured temperature for each window. As shown in Figure 9, the effect of the light bulb inside the room, blind curtain, and object, which acts as a curtain, is detectable. Comparing with other measured windows for the same row, the windows that had curtain or light on showed the highest range of temperature. In some cases, an anomaly in data was detected when the curtain was partially closed or window partially blocked by some object. Hence, these anomalies were excluded from the final analysis. For the East side of the building, the curtain was blind for the fifth floor and above.
Figure 9.
a) RGB image, b) thermal image, and c) boxplot of each window temperature range for each measured row for the South side of the building on December 21 (windows numbered from left to right).
Figure 9.
a) RGB image, b) thermal image, and c) boxplot of each window temperature range for each measured row for the South side of the building on December 21 (windows numbered from left to right).
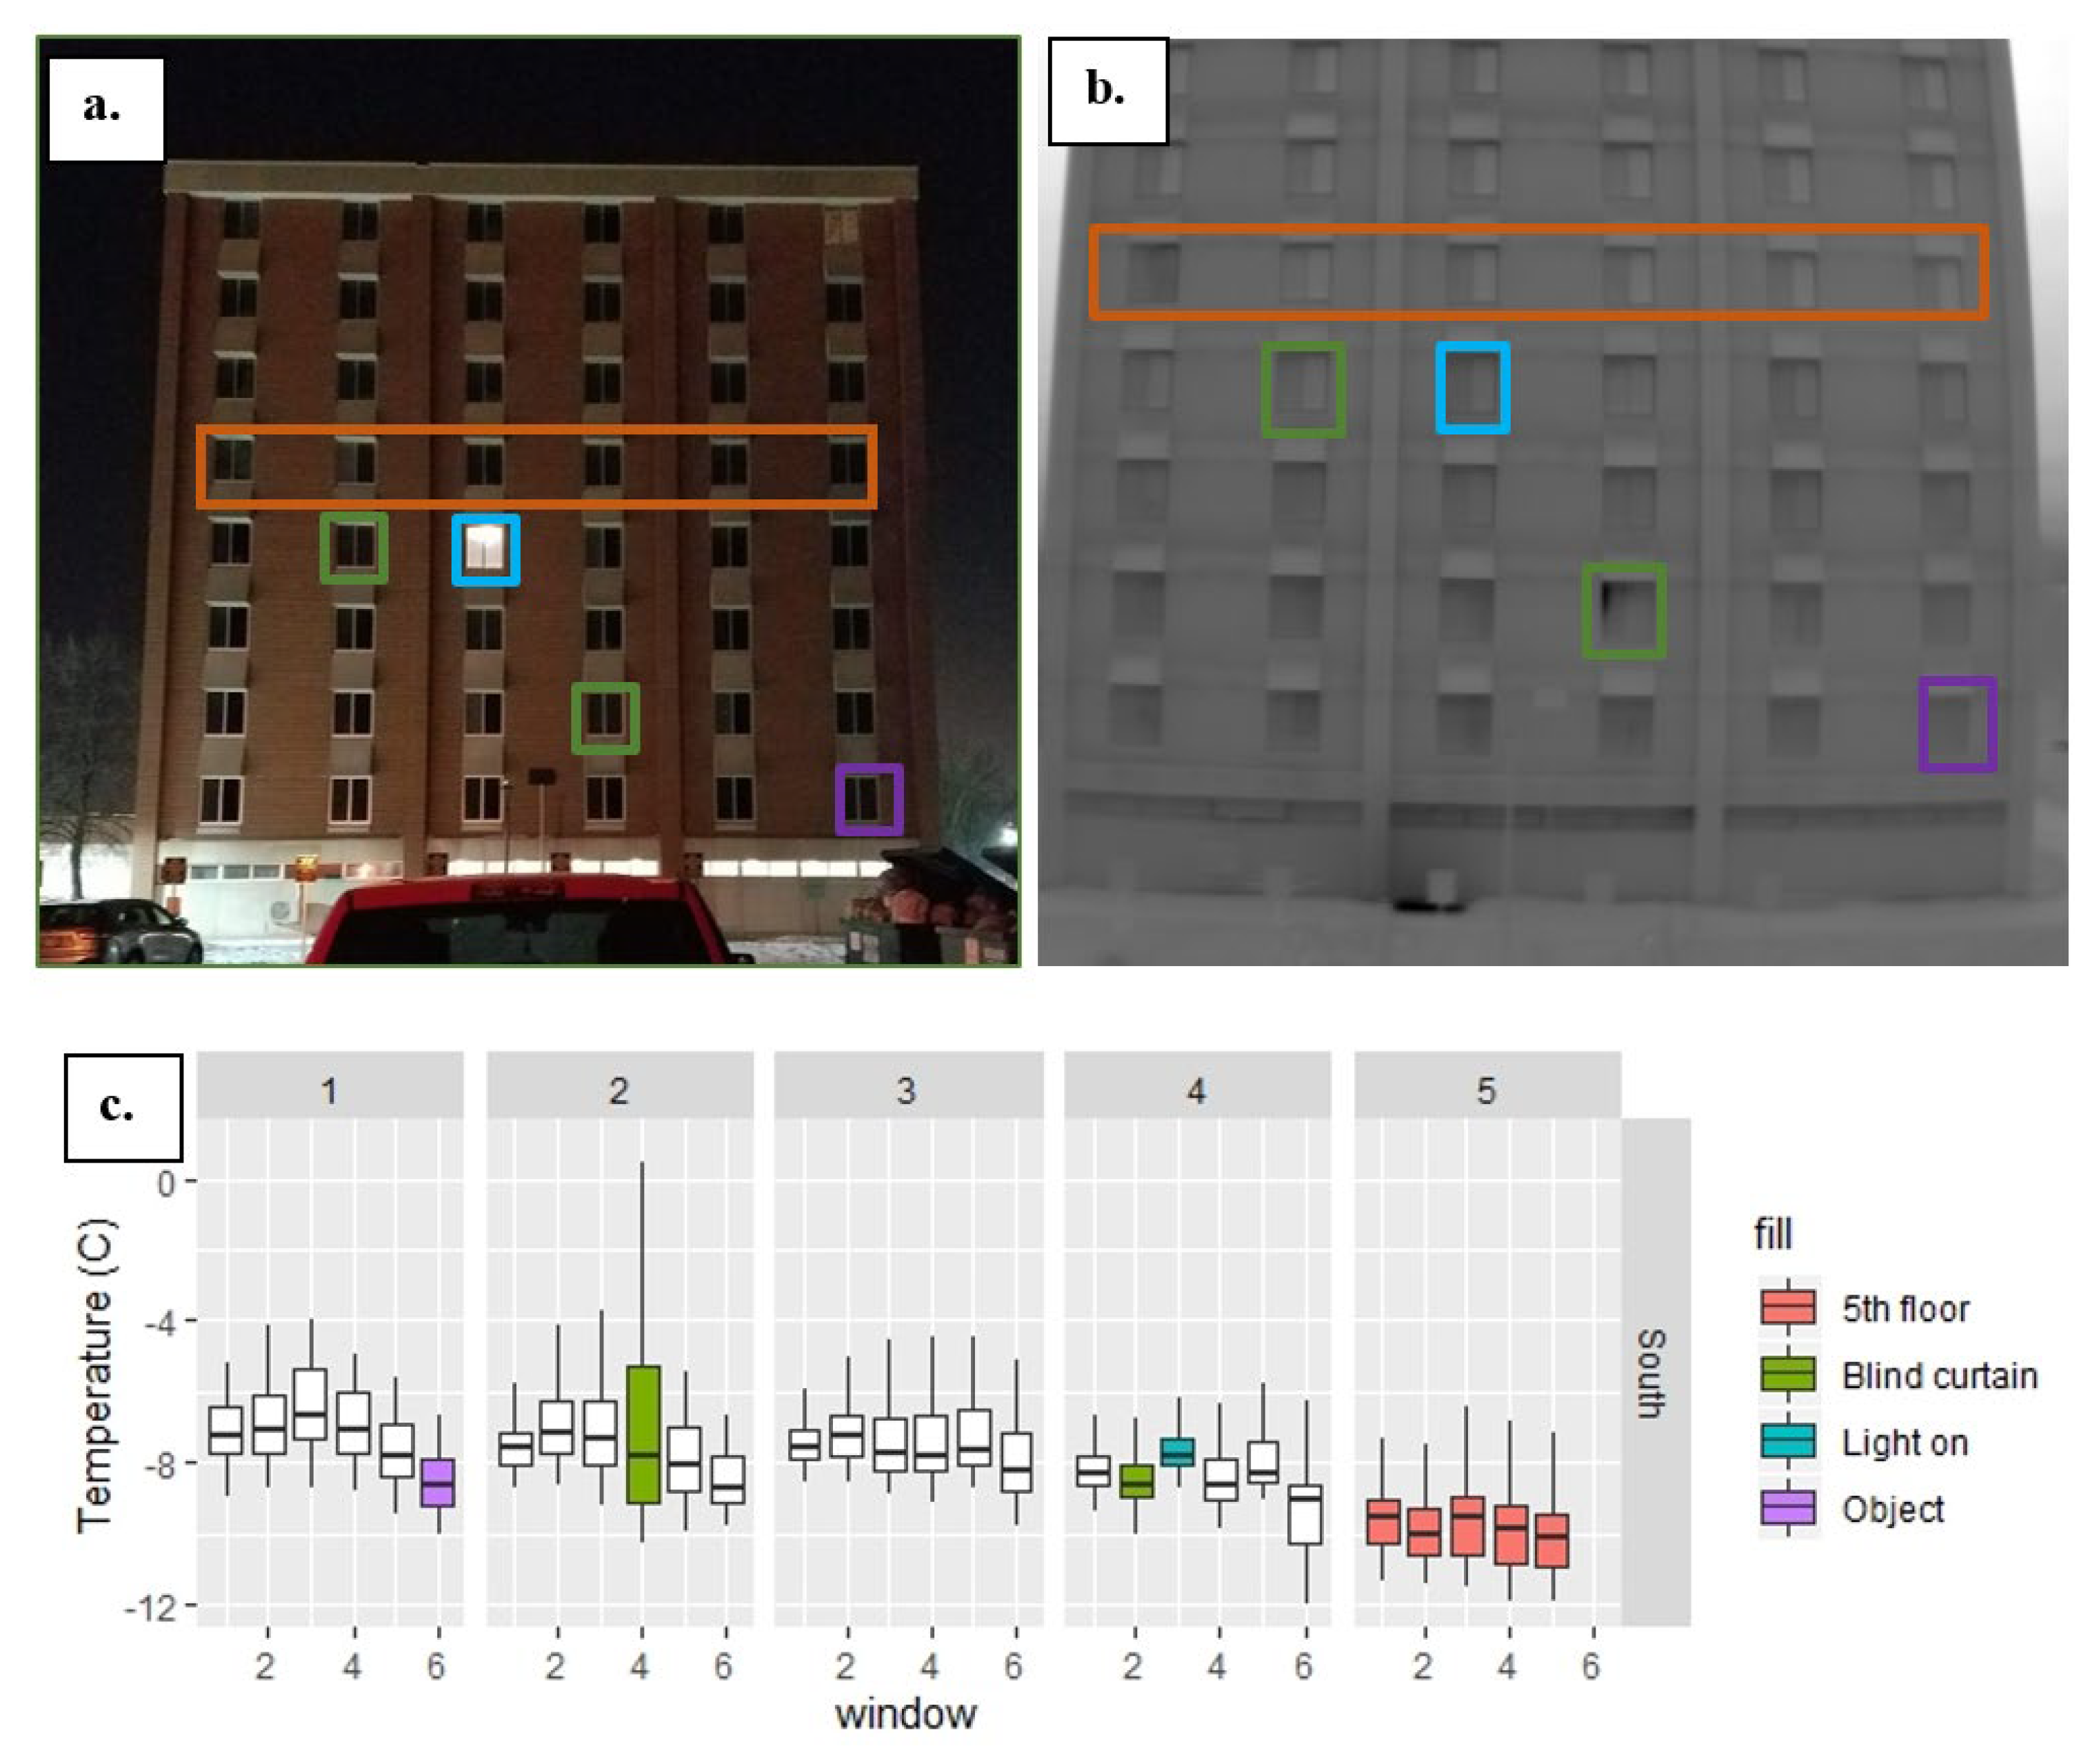
Figure 10 shows the North side of the building for December 22 including RGB image, thermal image, and boxplot for each window of each row. Since the tree blocked the right side of the building on the North side, only four windows were selected. On the other hand, the air temperature was warmer than the other two studied dates, and the range of measured temperature was higher than that for the other two days. Boxplots show the effect of blind curtain and light bulb inside the room in which increased the standard deviation or changed trend of measured data for each specific row (floor) of windows. In Figure 10.a, the reflection of landscape light blocked the view of the second window of the second row (floor). The effect of this object was removed by changing the angle of the image capturing and neglecting the effect of light on the windows’ reflection. For future works, it would be recommended to avoid any surrounding reflection.
Figure 10.
a) RGB image, b) thermal image, and c) boxplot of each window temperature range for each measured row for the North side of the building on December 22 (windows numbered from left to right).
Figure 10.
a) RGB image, b) thermal image, and c) boxplot of each window temperature range for each measured row for the North side of the building on December 22 (windows numbered from left to right).
3.2. Day-by-Day Comparison
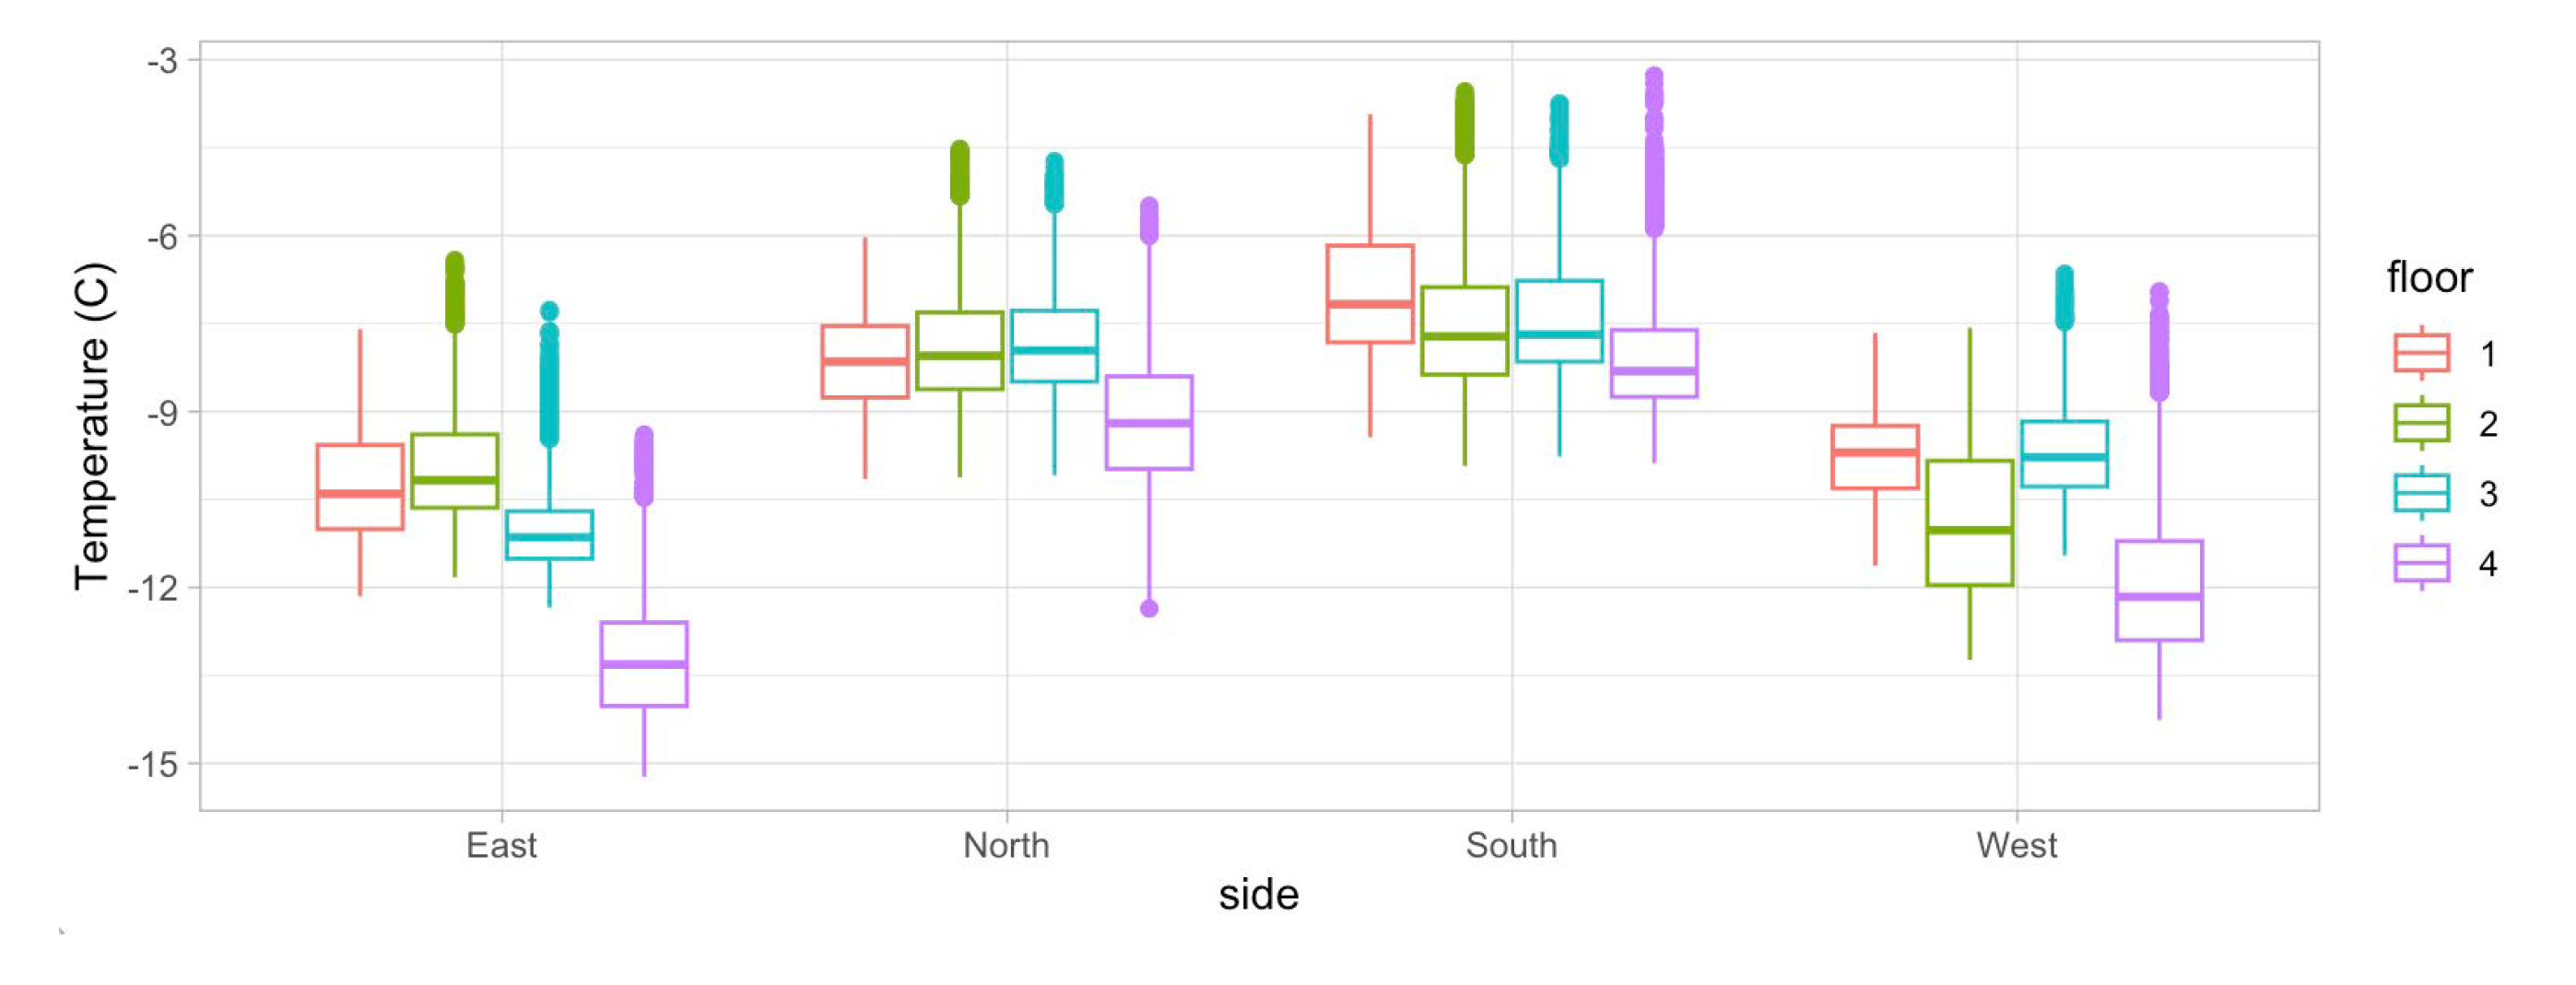
Day by day analysis was performed to understand each day’s variation and effect of building orientation and height on measured temperature. The windows with blind curtain, light on, and any blocking object were excluded from the final dataset. Figure 11 shows boxplots for each side of the building. This figure shows the average temperature of all windows on each floor of each side of the building on December 21. Despite the insignificant increments and decrements in the average temperature of windows between subsequent floors, there is a significant temperature decrement comparing the first and fourth row of windows. Even though the average air temperature increased from -8.7 to -8.5 °C above 9 m height, the wind speed increased 0.5 m/s at 10 m of the ground according to the weather information (Table 4). Therefore, the reason behind the decreasing average temperature of windows can be due to increment in wind speed above 10 m of the ground.
The wind direction (158 degrees) was from the Northwest side on Saturday, December 21 and the South side of the building was the only side that was not faced directly or partially to the wind. The wind chill was recorded as -14.5 oC, which caused to have a lower range of temperatures for all sides except the South. Moving from the first floor to the upper floors, the temperature decreased. This trend was either smooth for some sides such as the South, which was protected from the wind direction, or sudden such as other sides that were affected by the wind. Table 4 shows the result of the ANOVA test for the measured temperature by considering the floor, side of the building, and relationship of floor and side that affect measured temperature. As shown in the table, the floor and side of the building had a significant effect on the windows’ temperature. For both factors, the P-value was less than 0.05 that indicates a significant impact on the measured temperature. Results show a significant impact of each independent variable as well as the interaction between independent variables.
Figure 11.
The average temperature of all windows for each row of windows on different floors for four sides of the building on Saturday, December 21.
Figure 11.
The average temperature of all windows for each row of windows on different floors for four sides of the building on Saturday, December 21.
Due to the significant effect of the floor and side of the building as independent factors on the measured temperature, the result of the post-hoc test for each independent factor is discussed. Table 5 shows the statistical description for within-group analysis and the result of the post-hoc test of the measured temperature for each side of the building on December 21. The obtained average values for each side shows that the South side had the highest temperature compared to the other three sides of the building. The standard deviation of the measured temperature for each side is in the same range, which indicates that no outlier remained on the final dataset. The result of the post-hoc test indicates that despite the standard deviation of the average temperature for all four sides of the building was in the same range, there was a significant difference between all four sides of the building in terms of average measured temperature of the windows on December 21. In addition to that, there was a significant difference between the fourth floor average temperature compared to the other floors.
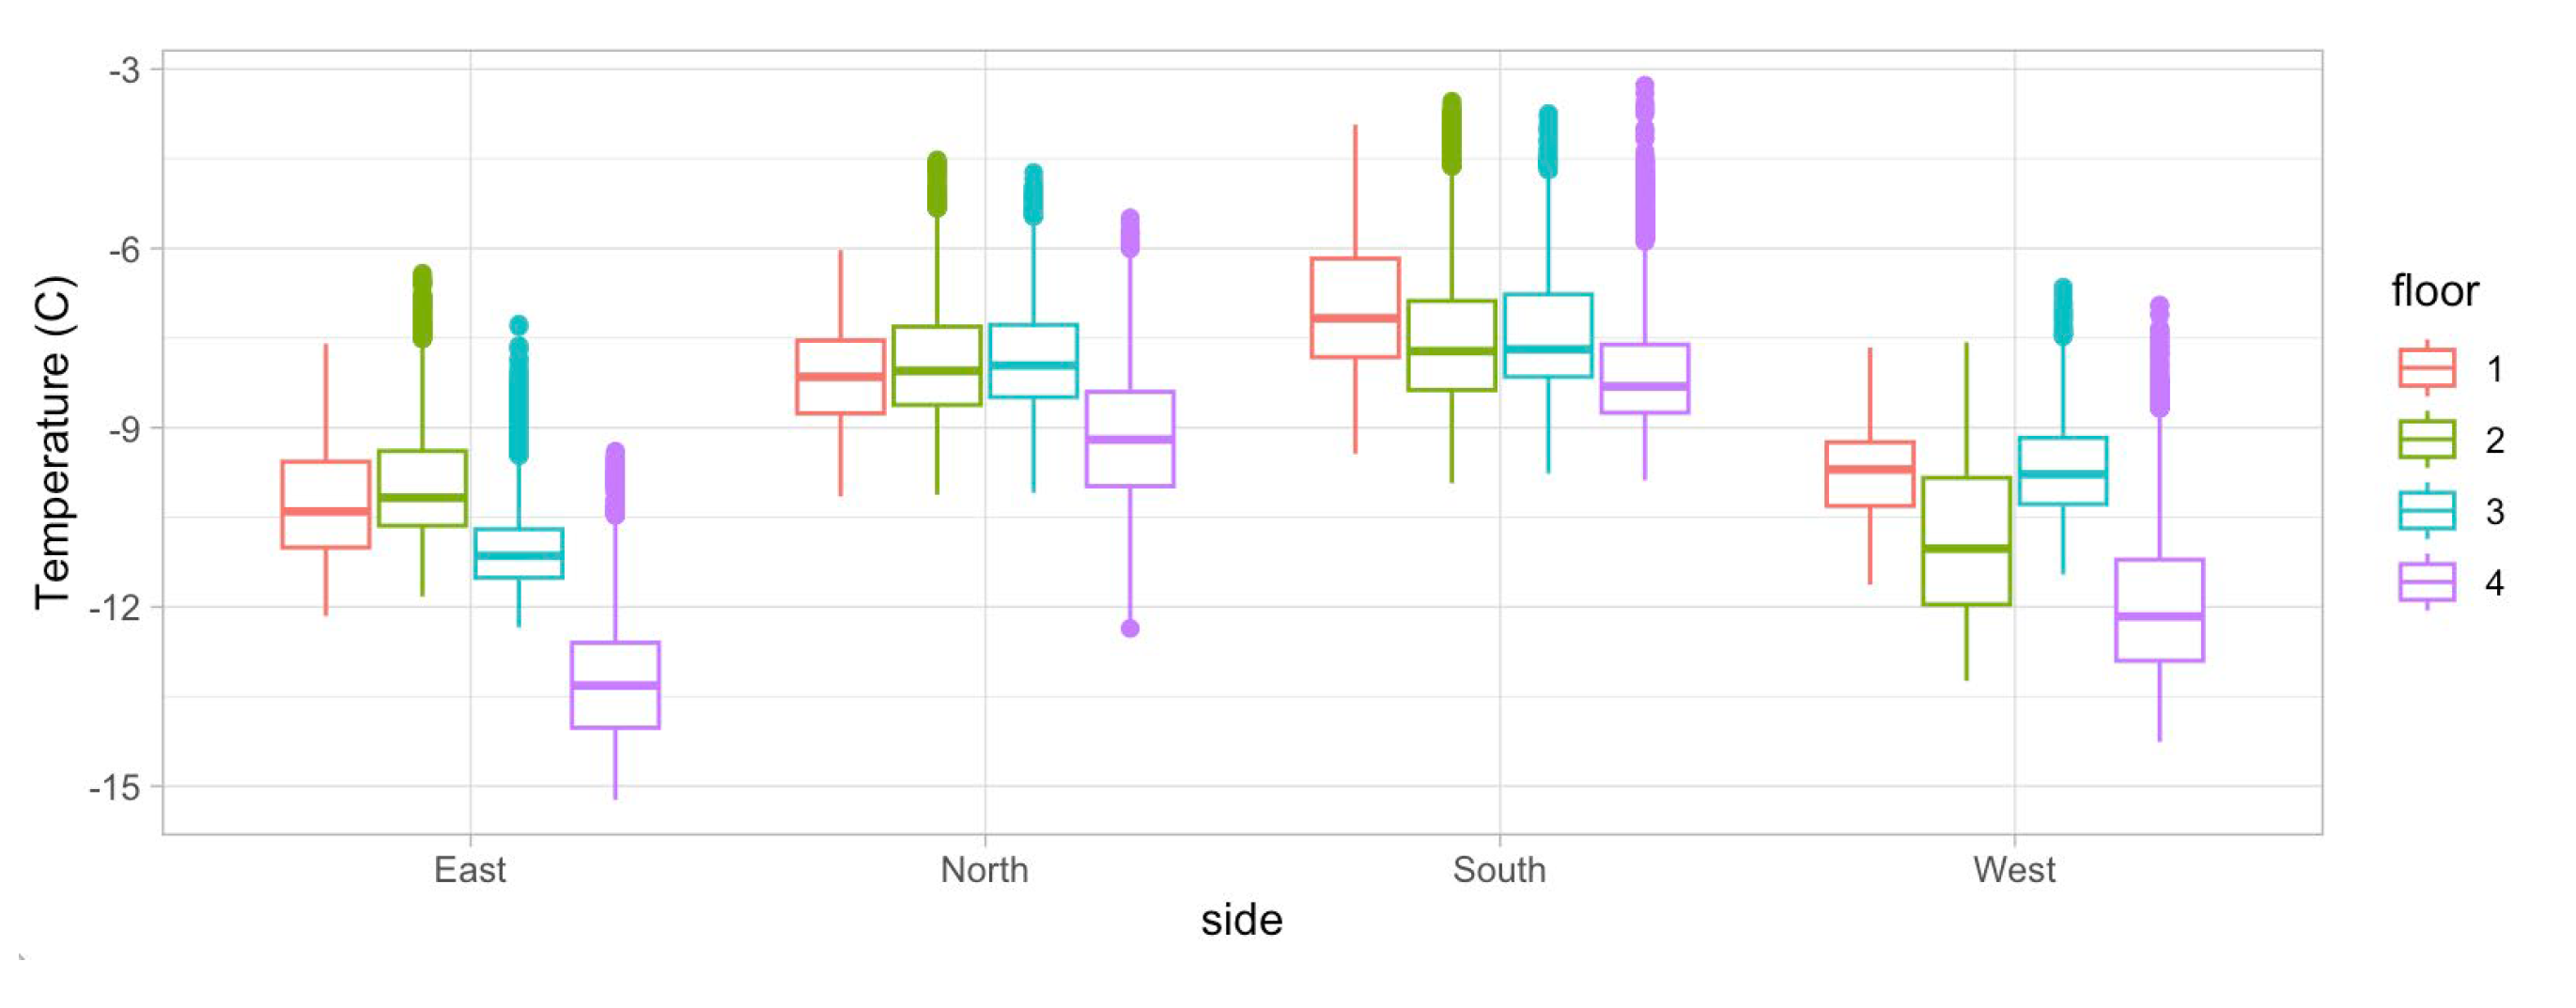
Figure 12 shows the average temperature of all windows on each floor of each side of the building on December 22. The explanation of the average thermal performance of the windows is like December 21. Besides, the patterns of the thermal changes between floors of each side are like the pattern of the same side as on December 21 at different temperatures. The temperature difference was because of the different average air temperatures on December 21 and December 22. However, the pattern between the building sides on December 21 was quite different from December 22. This arose from air temperature as well as wind speed difference between the two days.
Figure 11.
The average temperature of all windows for each row of windows on different floors for four sides of the building on December 22.
Figure 11.
The average temperature of all windows for each row of windows on different floors for four sides of the building on December 22.
The second day of study, December 22, had similar wind direction as December 21. However, the wind speed was 1.3 m/s higher than the first day and the average air temperature was 5.6 oC warmer than the first day. Therefore, the expected temperature for the windows should be higher than the first day. Both the North and West sides of the building were affected by wind direction. The wind chill was recorded as -8.7 oC, which caused to have a lower standard deviation of temperature for all sides of the building in comparison with day 1. The measured standard deviation between floors on December 22 was similar to the measured standard deviation between floors on December 21. Moving from the first floor to the upper floors, the temperature decreased. For December 22, a linear relationship was observed between each floor temperature of the South side of the building. This may be the result of milder air temperature on December 22 compared to that on December 21. Table 6 shows the result of the ANOVA test for the measured temperature by considering floor, side, and combination of floor and side as different factors that affect response value, which is temperature. The results of the ANOVA test shows that there were significant differences between the floors and sides of the building (P-value <0.05). Table 5.4 shows the statistical summary within a group of measured temperature for each side and floors of the building on December 22. Results of the post-hoc test using Tukey’s HSD method are shown with lower and uppercase letters in which values with the same letter are not significantly different.
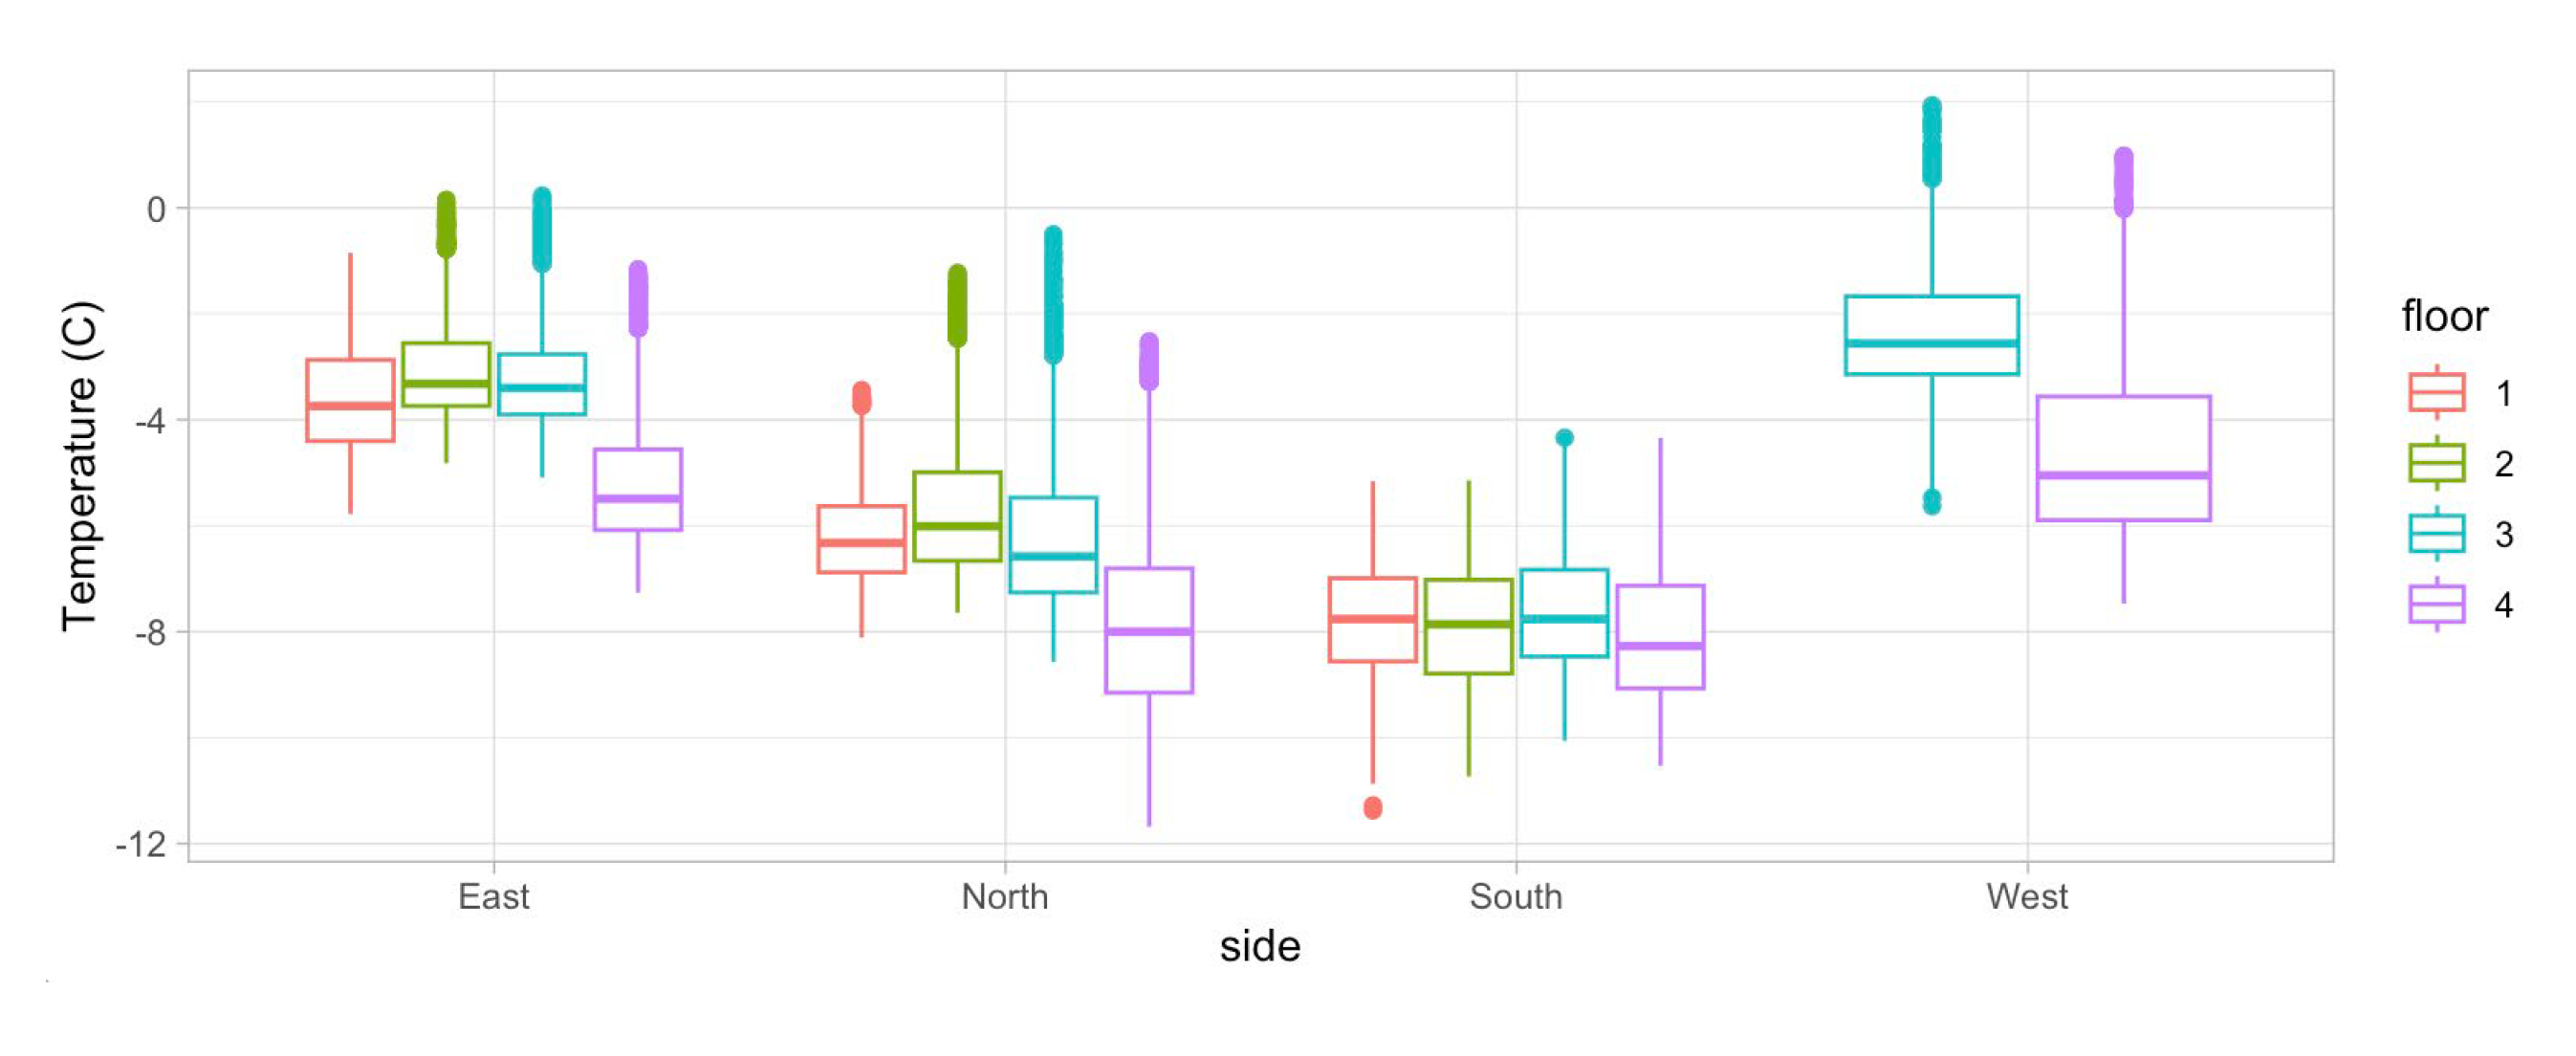
The pattern between the building sides on the third study day, Monday, December 23, was different from both the first and second days (December 21 and 22), which was likely caused by the different wind speed and direction. In contrast with the first and second study dates, the wind had Southwest direction (14.5 degrees), which affected mostly the South side of the building. The measured average air temperature was 2.5 oC lower than the second day (Sunday, December 22) and 3.1 oC higher than the first day (December 23). The patterns of thermal changes between floors of each side were like other study dates except for the South side, which was directly affected by the wind as well as by wind dynamic and movement on different sides of the building, especially around any openings. Figure 12 shows the trend of variation for each floor and side of the building for December 23.
Figure 12.
The average temperature of all windows for each row of windows on different floors for four sides of the building on December 23.
Figure 12.
The average temperature of all windows for each row of windows on different floors for four sides of the building on December 23.
The results of the ANOVA test for December 23 are shown in Table 5.5. Since the first two floors of the West side were excluded from the final analysis, the degree of freedom for floor and side combination reduced from nine to seven. The results of the ANOVA test were similar to before and showed significant differences between the floors and sides of the building. The results of post-hoc tests in Table 8 showed significant differences among floors as well as sides of the building. The statistical summary of the measured temperature for each side and floors are shown in Table 9.
4. Discussion
All three study dates’ datasets were combined to analyze overall differences and trends among sides and floors of the building, as well as understanding the effect of day on measured values. Figure 13 shows the averages of each day temperature range for each side of the building. Figure 13 illustrates that all sides followed a similar trend regarding weather variability. Table 10 shows the statistical summary of measured thermal values for each side of the building by considering three studied dates and all floors of the building. According to the Tukey’s HSD test to analyze within-group differences, there were no significant differences between West and South sides of the building in term of windows temperature; however, North and East side of the building had significant differences on windows temperature, as well as West and South sides of the building.
Figure 12.
a) Wind direction on each day of experiment.; b) Overall thermal performance of each studied dates for building directions.
Figure 12.
a) Wind direction on each day of experiment.; b) Overall thermal performance of each studied dates for building directions.
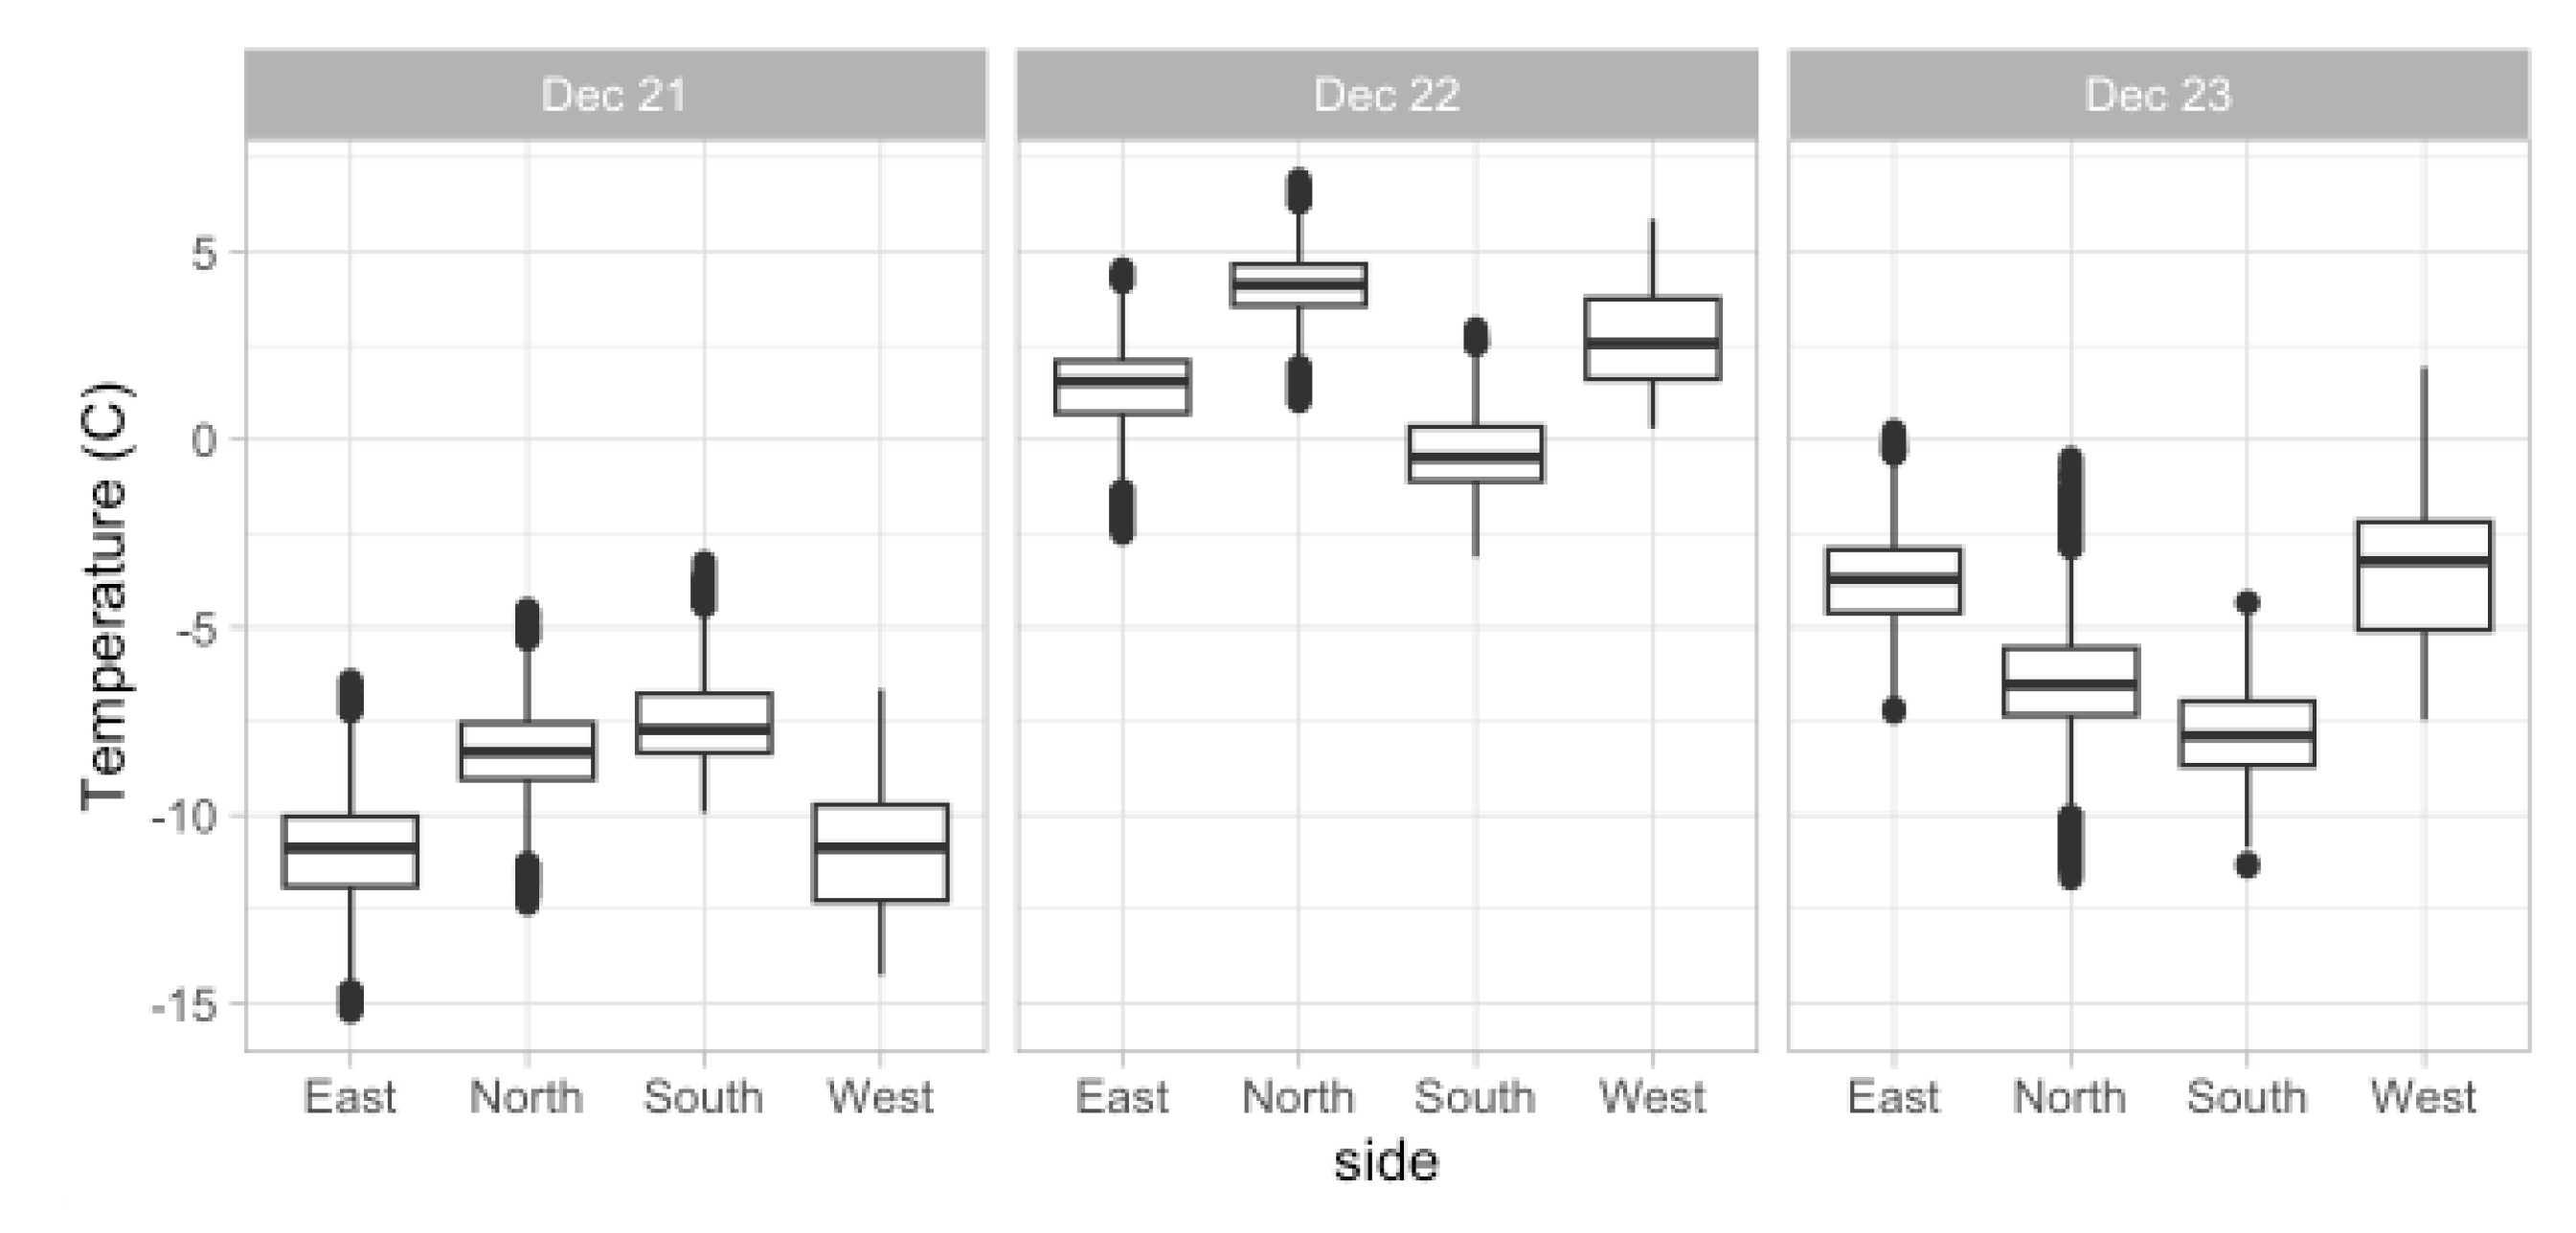
By using similar data used for Figure 12, Figure 13 depicts a different aspect of the weather variability in terms of the effect on measured temperature. As shown in the figure, all three days showed different variations and trends for different sides of the building. The air temperature and wind chill were different for the first two days of study, however, the wind direction stayed almost similar. The difference in measured temperature between the first two days in terms of a range of variation for each side was due to the air temperature differences. On the other hand, the trend was expected to be similar due to the similar wind direction. However, a different trend was observed for the South side, which showed a significantly lower range of temperature compared to the other sides of the building for the second day of data collection. This decrease in measured temperature may be affected by a change in wind speed and direction, as well as a change in air movement around the building. Comparing the third day of study (December 23) with the first two days (December 21 and 22), the difference in the trend of temperature for each side was obvious. Due to the wind direction on December 23, which was toward the South side of the building, the lower range of measured temperature was observed.
Figure 13.
Average temperature variation of each side of the building on three different study dates.
Figure 13.
Average temperature variation of each side of the building on three different study dates.
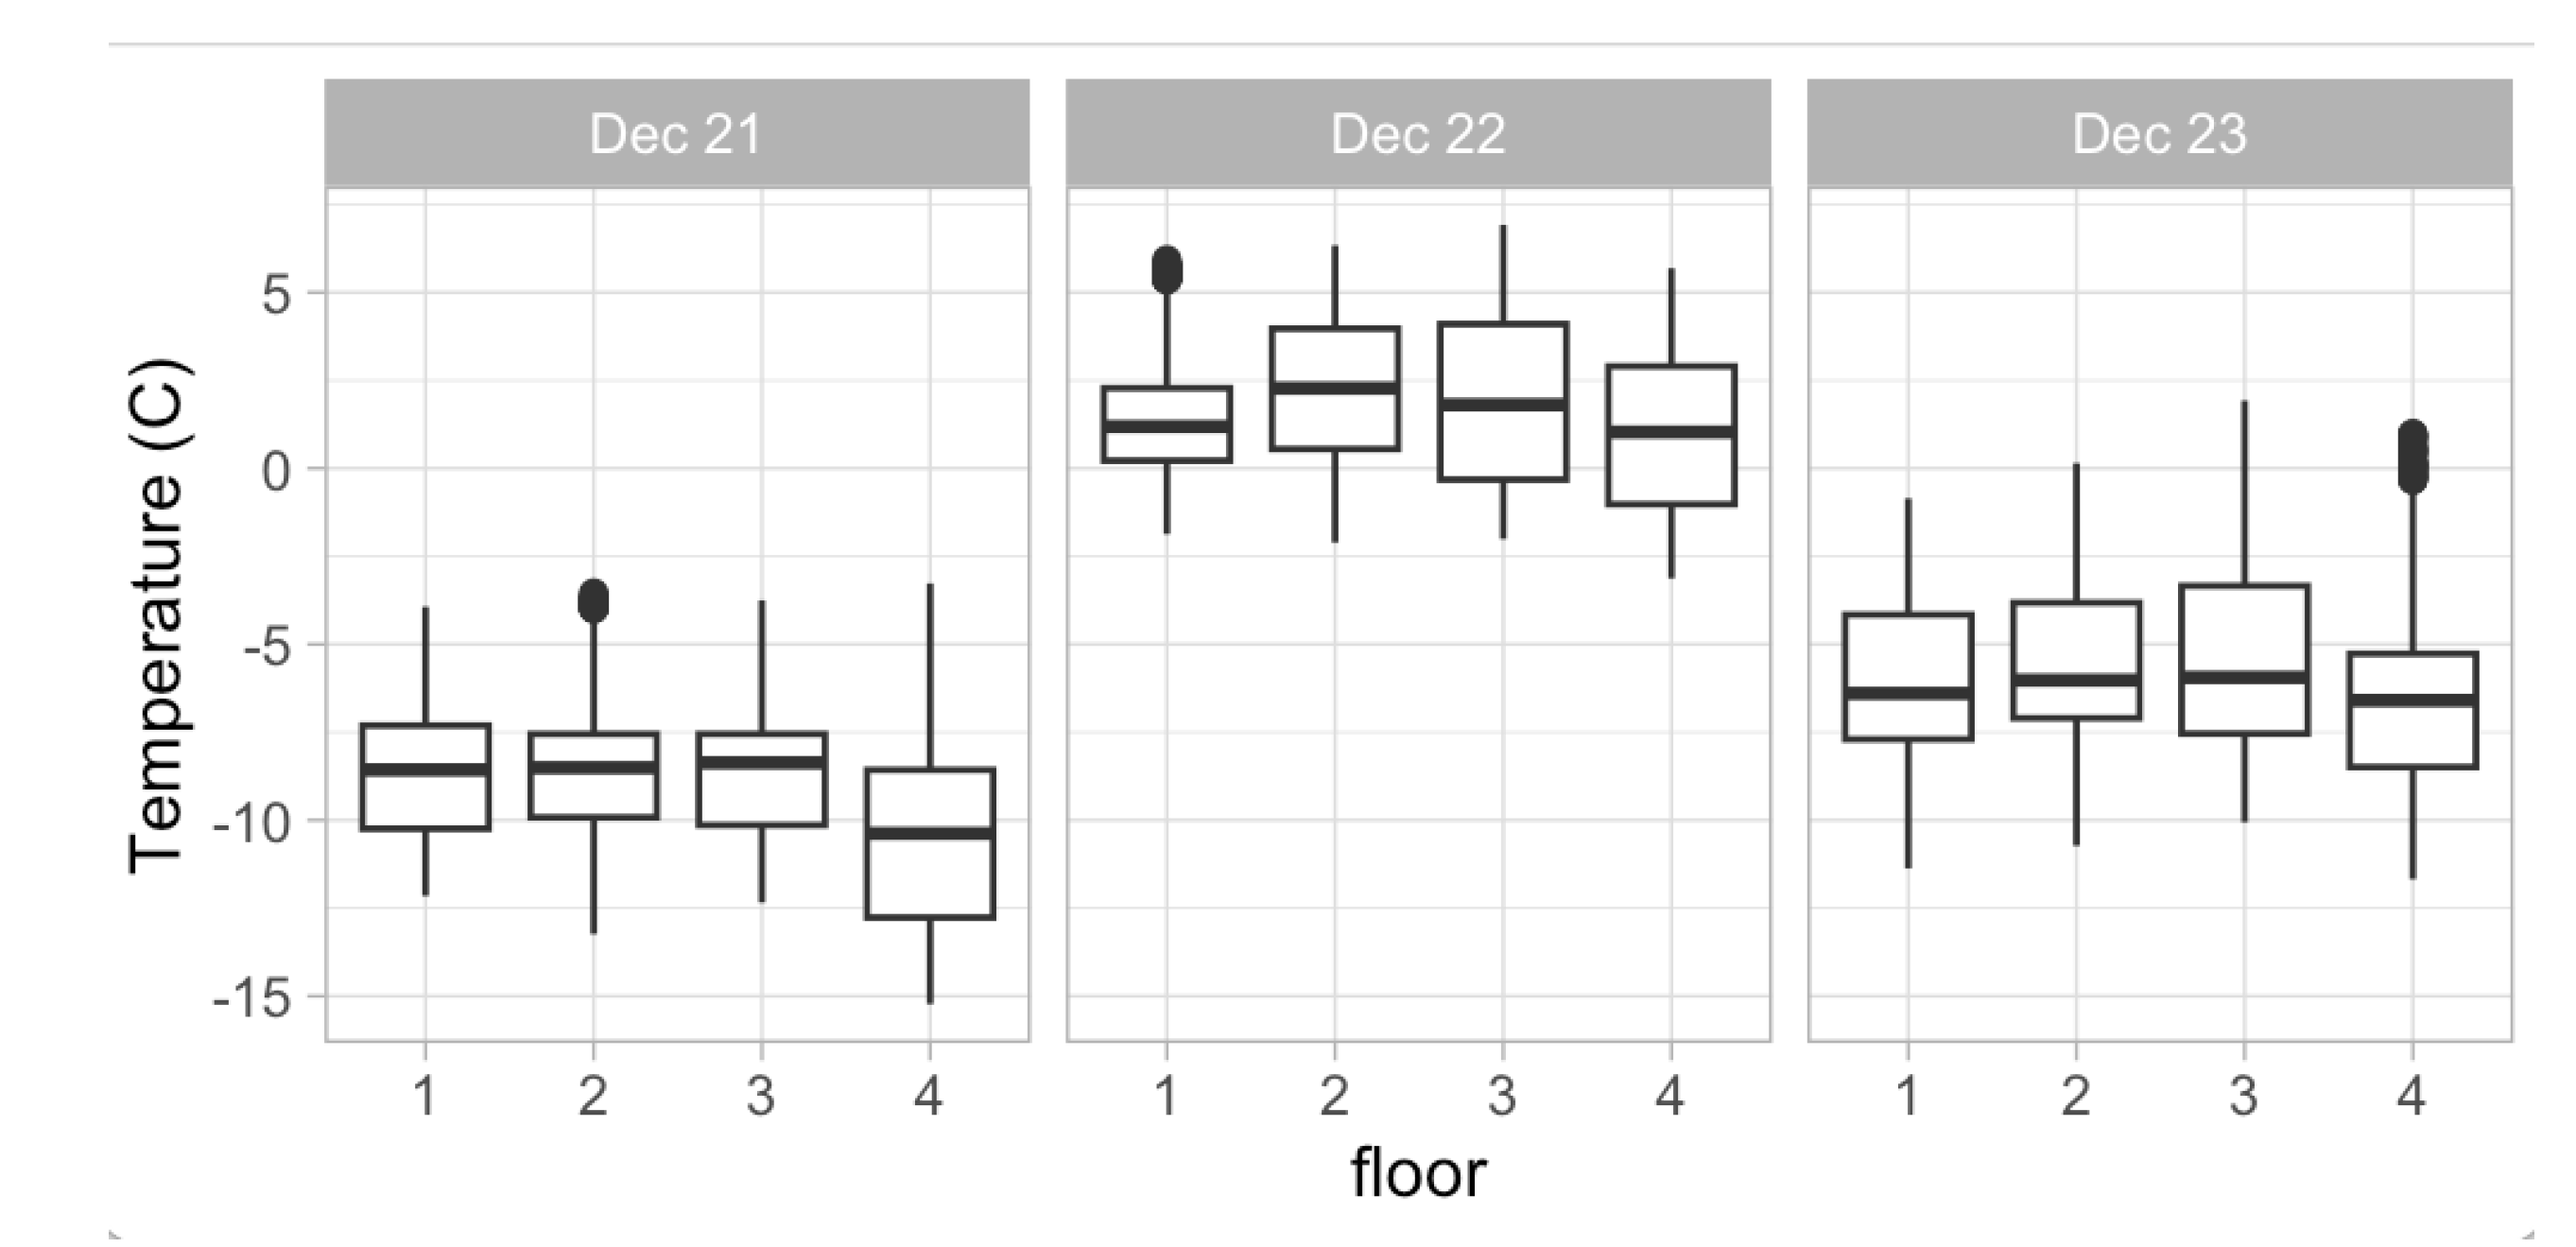
Comparing the difference between floors for all three-study dates showed that the trends between lower floors to the upper floors are similar. Sharp decreasing observed from the third floor to the fourth floor. However, the average range of temperatures between the first floor and the second floor is similar, the third floor was almost lower than the first two floors, and the fourth floor was lower than all floors. Figure 14 shows the range of average thermal variation for each floor of the building for three studied dates. Therefore, despite the insignificant increments and decrements in the average temperature of windows between subsequent floors, there was a significant temperature decrement comparing the first and fourth floor. Table 11 shows the Tukey’s HSD test results based on four floors average dataset. Using the ANOVA test, floors with a P-value greater than 0.05 had no significant difference in thermal performance.
Figure 14.
Average thermal performance of each row of the building for three different study dates.

Despite similar inside room temperature (20 °C) on all floors, measured windows temperature showed a decreasing trend by going upper floors. This reduction happened for most of the windows on different sides of the building as well as three studied dates. The temperature difference of the windows on subsequent floors might appear insignificant. However, comparing the window’s thermal performance of the first and fourth floor showed a significant reduction.
The East side of the building had the same pattern on average temperature from first to the fourth floor for every day since it was not affected by the wind. On average, there was a slightly lower temperature recorded for the first floor compared to the second floor. This lower temperature maybe is due to the snow coverage around the building. The existence of the snow surrounding the building can reduce the average temperature at a lower level close to the snow that may affect the measured temperature. Results of study indicated that, in order to make accurate measurement and prediction about building thermal-energy performance, the interaction between the building and the surrounding be taken into account [29].
In addition, perpendicularity of the thermal camera to the second row of the windows, which can cause a high reflection from the windows can be another reason for the higher recorded temperature for the second floor compared to the first floor. The North side of the building had a similar trend as the East side except for the second day of study where the temperature of the third floor was suddenly raised. This higher temperature partially observed for the third floor on the North side on the first study date. At the moment, there was no clear explanation of this phenomenon except the reflectance of the landscape light on the window of the third floor. Although the effect of any objects on reflectance was considered during the imaging process, some may exist that can affect the overall average. The South side of the building, especially on December 22, had different trends compared to the other sides of the building and this difference observed at previous figures and tables and showed significant differences on December 22 between the measured temperature among the floors. The West side was excluded from the final analysis due to the inconsistency of the measured values, existence of the tree, and limitation on imaging from a proper distance.
In summary, a thermal camera is a useful and precise tool for measurement to study the thermal performance of windows; however, it is a very sensitive tool and there are some limitations and considerations that should be applied precisely to reduce possible errors. Results of study by [30] showed the great performance for thermal camera for field study and indicated that the readings taken from the IR thermal camera and the IR thermometer were consistent with one another.
Results of ANOVA analysis and the post-hoc test revealed that weather condition including air temperature, wind speed and direction, and windows’ location including orientation, and height have a significant effect on window energy performance. When designing a building, it is important to consider how conditions around the building will alter local winds and thus, temperature differentials [31]. The wind can interact with buildings and speed up in local areas, especially when the parallel buildings create a channel, accelerate wind around building corners and through building openings.
Tall building exposed to oncoming wind can direct the higher-speed winds at higher elevations down the building that face to the street level [31]. Heat loss increases significantly on upper floors particularly from the 4th floor and above. In addition, not only building shape and height but also wind direction and speed have a considerable effect on air pressure and wind dynamic, which subsequently affects heat loss from windows. The East side was the only side that showed an almost similar pattern in its thermal performance with different temperature since it was the only side that didn’t face the wind in three days. North and South showed the coldest temperature which means more heat loss occasionally since they were facing the wind directly.
Any changes to any of the factors in a building such as temperature, wind speed, and wind direction can cause a very different result in windows’ heat loss. However, more studies are required to have more detailed results regarding wind dynamic and heat loss prediction. When a building obstructs wind flow, the wind exerts pressure on the building. On the other hand, the shape of building can affect the amount of wind pressure, and resultant wind force, that acts on its surface. Creating positive or negative pressure along the building surface and corners can cause various trend of heat loss [31]. Therefore, even by considering the dominant wind direction and speed, the best configuration can be applied for existing or any new building with the same condition and location.
5. Conclusions
The measurement method is a rarely used approach for a window energy assessment. The accuracy and credibility of the data and results can be more reliable since it includes real-life conditions. This study was focused on window energy performance due to its significant role in building energy consumption. The results of statistical analysis showed the accuracy and validity of the thermal camera as a measurement tool to study window energy performance. However, some limitations and factors must be considered. Significant differences in average windows temperature were observed among floors, except 1st and 2nd floors. Further, a significant temperature decrement was found by comparing the windows’ temperatures of the first floor and fourth floor. The results indicated that building height has a significant effect on window energy performance and the amount of heat loss by windows increases significantly in upper floors particularly from the 4th floor and above. Comparing sides of the building, the significant difference observed at 0.05 level for all three-studied dates. Wind speed and direction, as well as building height, which has considerable effects on air pressure and wind dynamic, were affected by the amount of heat loss from windows. Among the four sides of the building, the East side showed a similar pattern of window thermal performance because of the neutral wind effect. The coldest temperature was measured for North and South sides occasionally that indicates more heat loss due to the wind direction effect. However, weather variation made any conclusion impossible in terms of publishing any exact values. Hence, more studies are required to have more detailed results regarding wind dynamic and heat loss prediction. This study suggests using more efficient windows as well as various types of windows in building according to the height of the building and window, particularly from fourth floors and above. Considering dominant wind direction and wind speed would play a paramount role in the searching best configuration of window design and choice for a building.
Author Contributions
“Conceptualization, S.A.; methodology, S.A.; software, J.P.F. and J.G.; validation, S.A., J.P.F. and G.S.; formal analysis, S.A.; investigation, S.A and J.P.F.; resource J.P.F. and J.G.; data curation, S.A.; writing—original draft preparation, S.A.; writing—review and editing, S.A.; visualization, S.A.; supervision, J.P.F and J.G. All authors have read and agreed to the published version of the manuscript.”
References
- Lior, N. Sustainable Energy Development: The Present (2011) Situation and Possible Paths to the Future. Energy 2012, 43, 174–191. [Google Scholar] [CrossRef]
- Ahmad, A.S.; Hassan, M.Y.; Abdullah, M.P.; Rahman, H.A.; Hussin, F.; Abdullah, H.; Saidur, R. A Review on Applications of ANN and SVM for Building Electrical Energy Consumption Forecasting. Renewable and Sustainable Energy Reviews 2014, 33, 102–109. [Google Scholar] [CrossRef]
- Zhao, H.X.; Magoulès, F. A Review on the Prediction of Building Energy Consumption. Renewable and Sustainable Energy Reviews 2012, 16, 3586–3592. [Google Scholar] [CrossRef]
- Zhang, D.; Shah, N.; Papageorgiou, L.G. Efficient Energy Consumption and Operation Management in a Smart Building with Microgrid. Energy Conversion and Management 2013, 74, 209–222. [Google Scholar] [CrossRef]
- Kim, H.; Stumpf, A.; Kim, W. Analysis of an Energy Efficient Building Design through Data Mining Approach. Automation in Construction 2011, 20, 37–43. [Google Scholar] [CrossRef]
- Grynning, S.; Gustavsen, A.; Time, B.; Jelle, B.P. Windows in the Buildings of Tomorrow: Energy Losers or Energy Gainers? Energy and Buildings 2013, 61, 185–192. [Google Scholar] [CrossRef]
- U.S. Departament of Energy 2011 Buildings Energy Data Book. Office of Energy Efficiency and Renewable Energy 2012.
- Zeng, R.; Chini, A.; Srinivasan, R.S.; Jiang, P. Energy Efficiency of Smart Windows Made of Photonic Crystal. International Journal of Construction Management 2017, 17, 100–112. [Google Scholar] [CrossRef]
- Aydin, O. Conjugate Heat Transfer Analysis of Double Pane Windows. Building and Environment 2006, 41, 109–116. [Google Scholar] [CrossRef]
- Buratti, C.; Moretti, E. Glazing Systems with Silica Aerogel for Energy Savings in Buildings. Applied Energy 2012, 98, 396–403. [Google Scholar] [CrossRef]
- Huang, Y.; Niu, J. lei; Chung, T. ming Comprehensive Analysis on Thermal and Daylighting Performance of Glazing and Shading Designs on Office Building Envelope in Cooling-Dominant Climates. Applied Energy 2014, 134, 215–228. [Google Scholar] [CrossRef]
- Jonsson, A.; Roos, A. Evaluation of Control Strategies for Different Smart Window Combinations Using Computer Simulations. Solar Energy 2010, 84, 1–9. [Google Scholar] [CrossRef]
- Nielsen, T.R.; Duer, K.; Svendsen, S. Energy Performance of Glazings and Windows. Solar Energy 2000. [Google Scholar] [CrossRef]
- Abanda, F.H.; Byers, L. An Investigation of the Impact of Building Orientation on Energy Consumption in a Domestic Building Using Emerging BIM (Building Information Modelling). Energy 2016, 97, 517–527. [Google Scholar] [CrossRef]
- Balaras, C.A.; Argiriou, A.A. Infrared Thermography for Building Diagnostics. Energy and Buildings 2002, 34, 171–183. [Google Scholar] [CrossRef]
- Dall’O’, G.; Sarto, L.; Sanna, N.; Martucci, A. Comparison between Predicted and Actual Energy Performance for Summer Cooling in High-Performance Residential Buildings in the Lombardy Region (Italy). Energy and Buildings 2012, 54, 234–242. [Google Scholar] [CrossRef]
- Clark, M.R.R.; McCann, D.M.M.; Forde, M.C.C. Application of Infrared Thermography to the Non-Destructive Testing of Concrete and Masonry Bridges. In Proceedings of the NDT and E International; Elsevier, June 1 2003; Vol. 36, pp. 265–275.
- Lucchi, E. Applications of the Infrared Thermography in the Energy Audit of Buildings: A Review. Renewable and Sustainable Energy Reviews 2018. [Google Scholar] [CrossRef]
- Ariwoola, R.T.; Uddin, M.M.; Johnson, K. V. Use of Drone for a Campus Building Envelope Study.; 2016.
- Mauriello, M.L.; Froehlich, J.E. Towards Automated Thermal Profiling of Buildings at Scale Using Unmanned Aerial Vehicles and 3D-Reconstruction.; 2014; pp. 119–122.
- Krawczyk, J.; Mazur, A.; Sasin, T.; Stokłosa, A. Infrared Building Inspection with Unmanned Aerial Vehicles. Transactions of the Institute of Aviation 2015. [Google Scholar] [CrossRef]
- Marino, B.M.; Muñoz, N.; Thomas, L.P. Estimation of the Surface Thermal Resistances and Heat Loss by Conduction Using Thermography. Applied Thermal Engineering 2017. [Google Scholar] [CrossRef]
- Lehmann, B.; Wakili, K.G.; Frank, T.; Collado, B.V.; Tanner, C. Effects of Individual Climatic Parameters on the Infrared Thermography of Buildings. Applied Energy 2013, 110, 29–43. [Google Scholar] [CrossRef]
- Fox, M.; Coley, D.; Goodhew, S.; De Wilde, P. Thermography Methodologies for Detecting Energy Related Building Defects; Pergamon, 2014; Vol. 40, pp. 296–310;
- Fox, M.; Goodhew, S.; De Wilde, P. Building Defect Detection: External versus Internal Thermography. Building and Environment 2016, 105, 317–331. [Google Scholar] [CrossRef]
- Enz, J.W. NORTH DAKOTA TOPOGRAPHIC, CLIMATIC, AND AGRICULTURAL OVERVIEW By John W. Enz, January 16, 2003 Topographic Features: North Dakota Is Subdivided into Four Main Physiographic Regions: The; 2003.
- Dall’O’, G.; Sarto, L.; Panza, A. Infrared Screening of Residential Buildings for Energy Audit Purposes: Results of a Field Test. Energies 2013, 6, 3859–3878. [Google Scholar] [CrossRef]
- FLIR Systems Thermal Imaging Guidebook for Building and Renewable Energy Applications; 2011.
- Pisello, A.L.; Castaldo, V.L.; Poli, T.; Cotana, F. Simulating the Thermal-Energy Performance of Buildings at the Urban Scale: Evaluation of Inter-Building Effects in Different Urban Configurations. Journal of Urban Technology 2014, 21, 3–20. [Google Scholar] [CrossRef]
- Mohamad Omar, N.A.; Syed Fadzil, S.F. Analysis of Building Envelope Thermal Behaviour Using Time Sequential Thermography.; 2014.
- Fleming, S. Buildings and Wind, Waterloo, CA, 2015.
Figure 1.
Thompson Hall, Fargo, ND (source: google map).
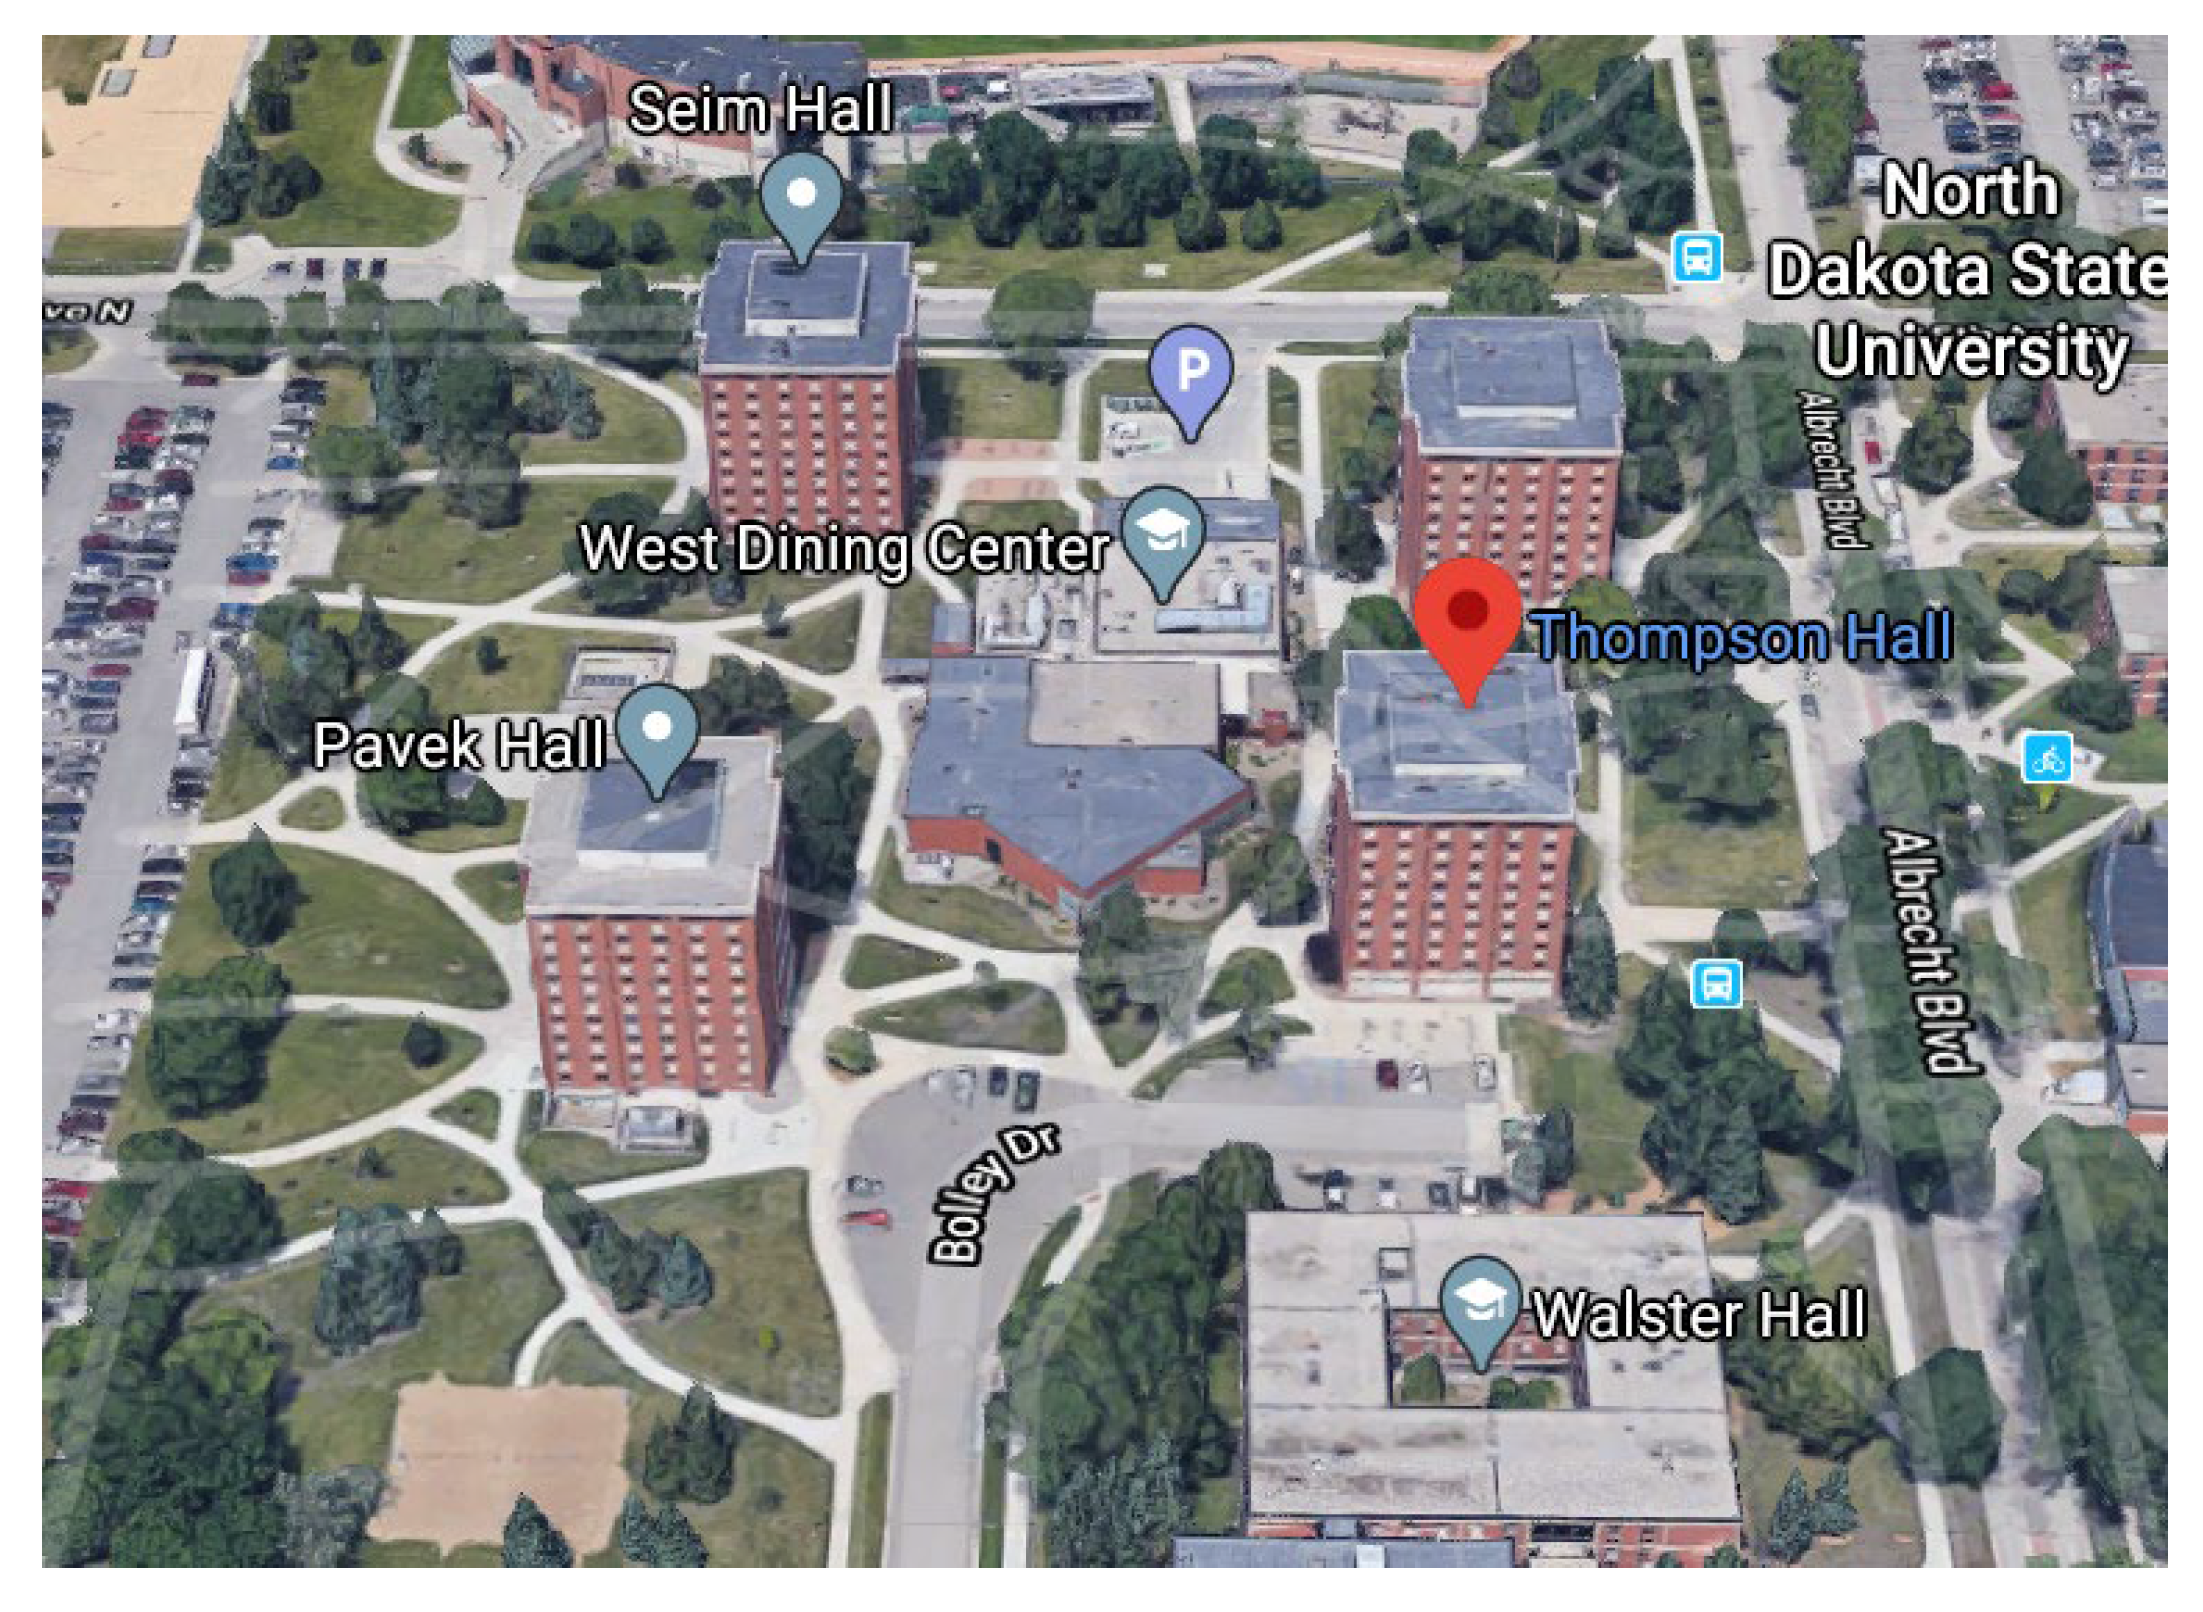
Figure 3.
Wind direction – from left to right: Saturday, Sunday, and Monday, respectively.
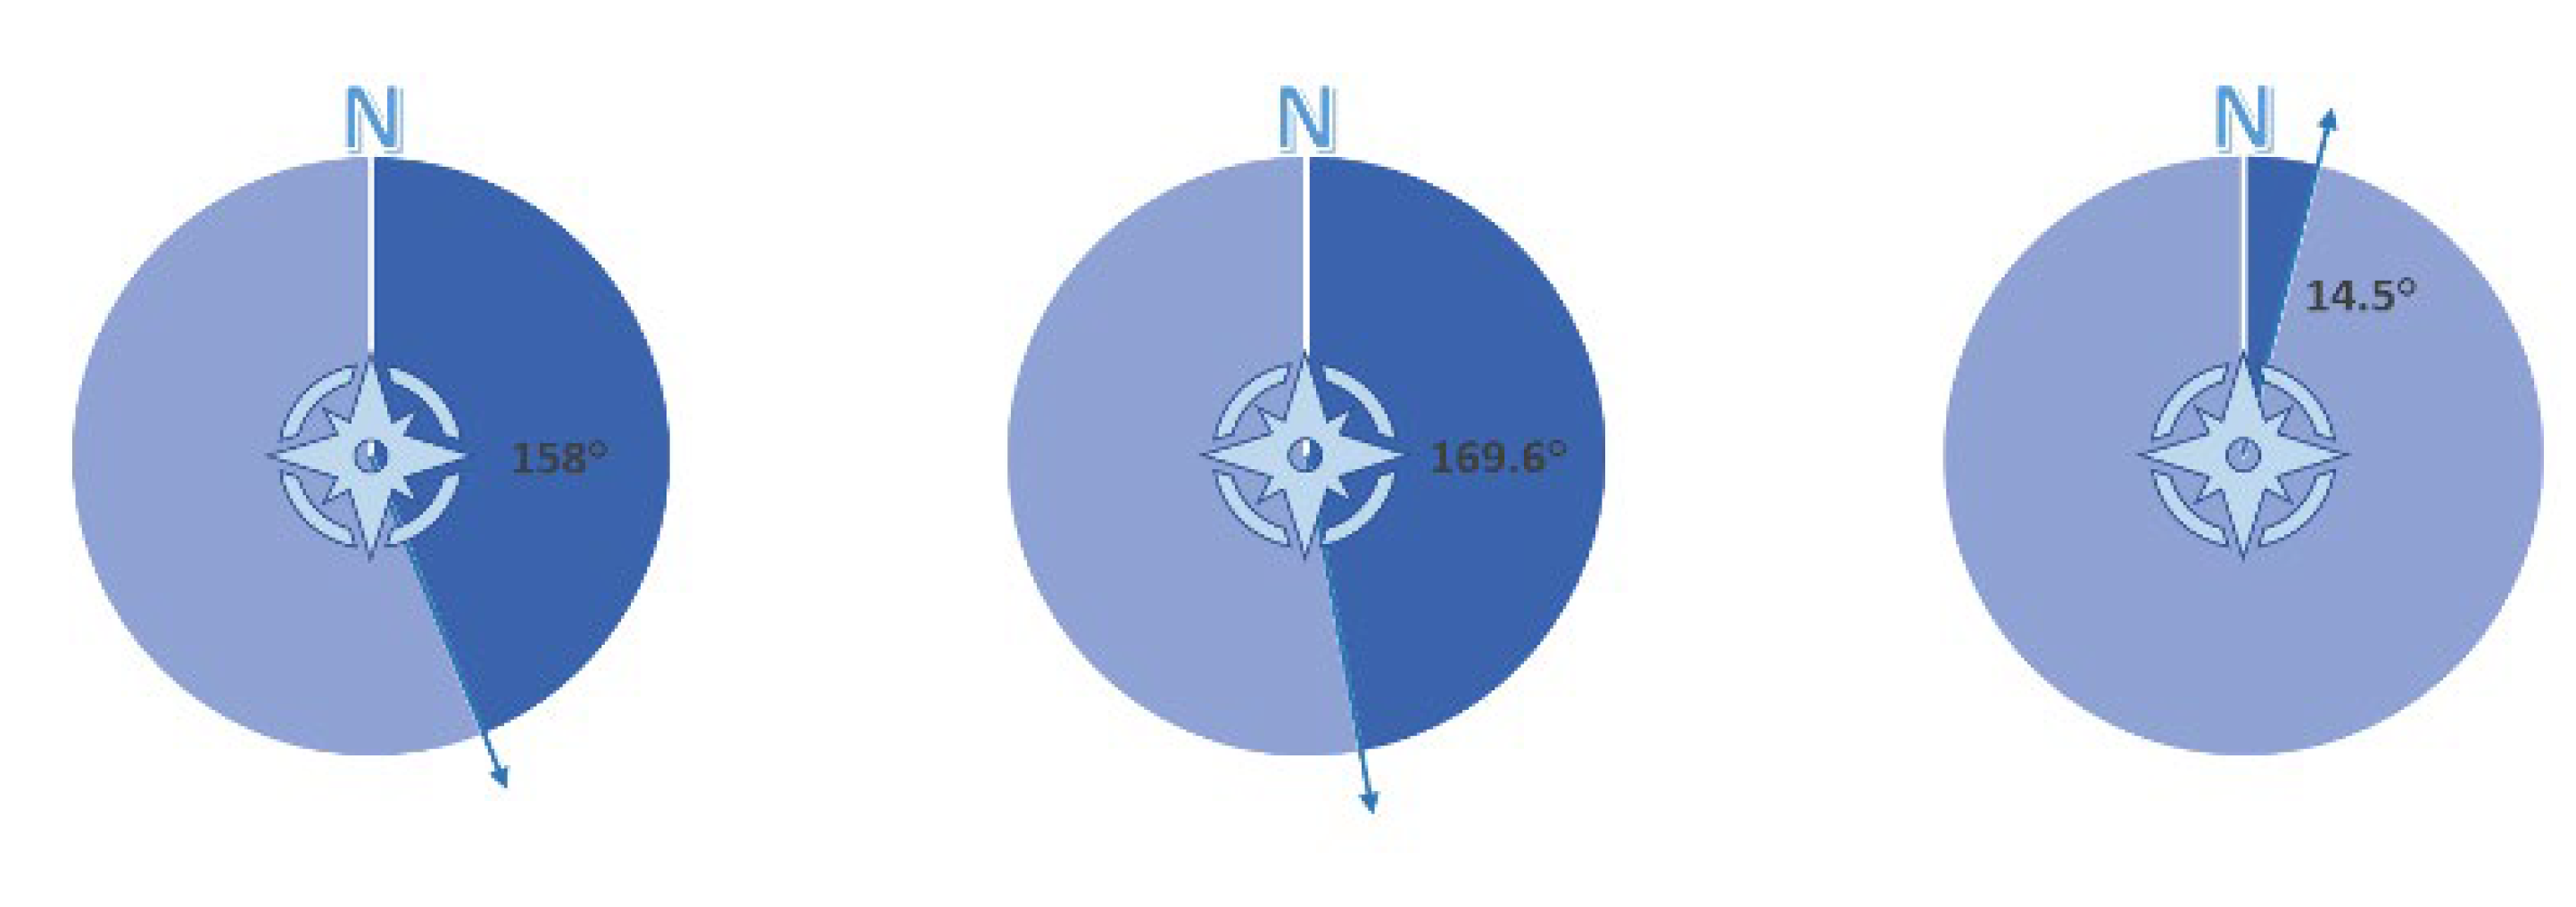
Figure 4.
Air turbulence around the building [21].
Figure 4.
Air turbulence around the building [21].
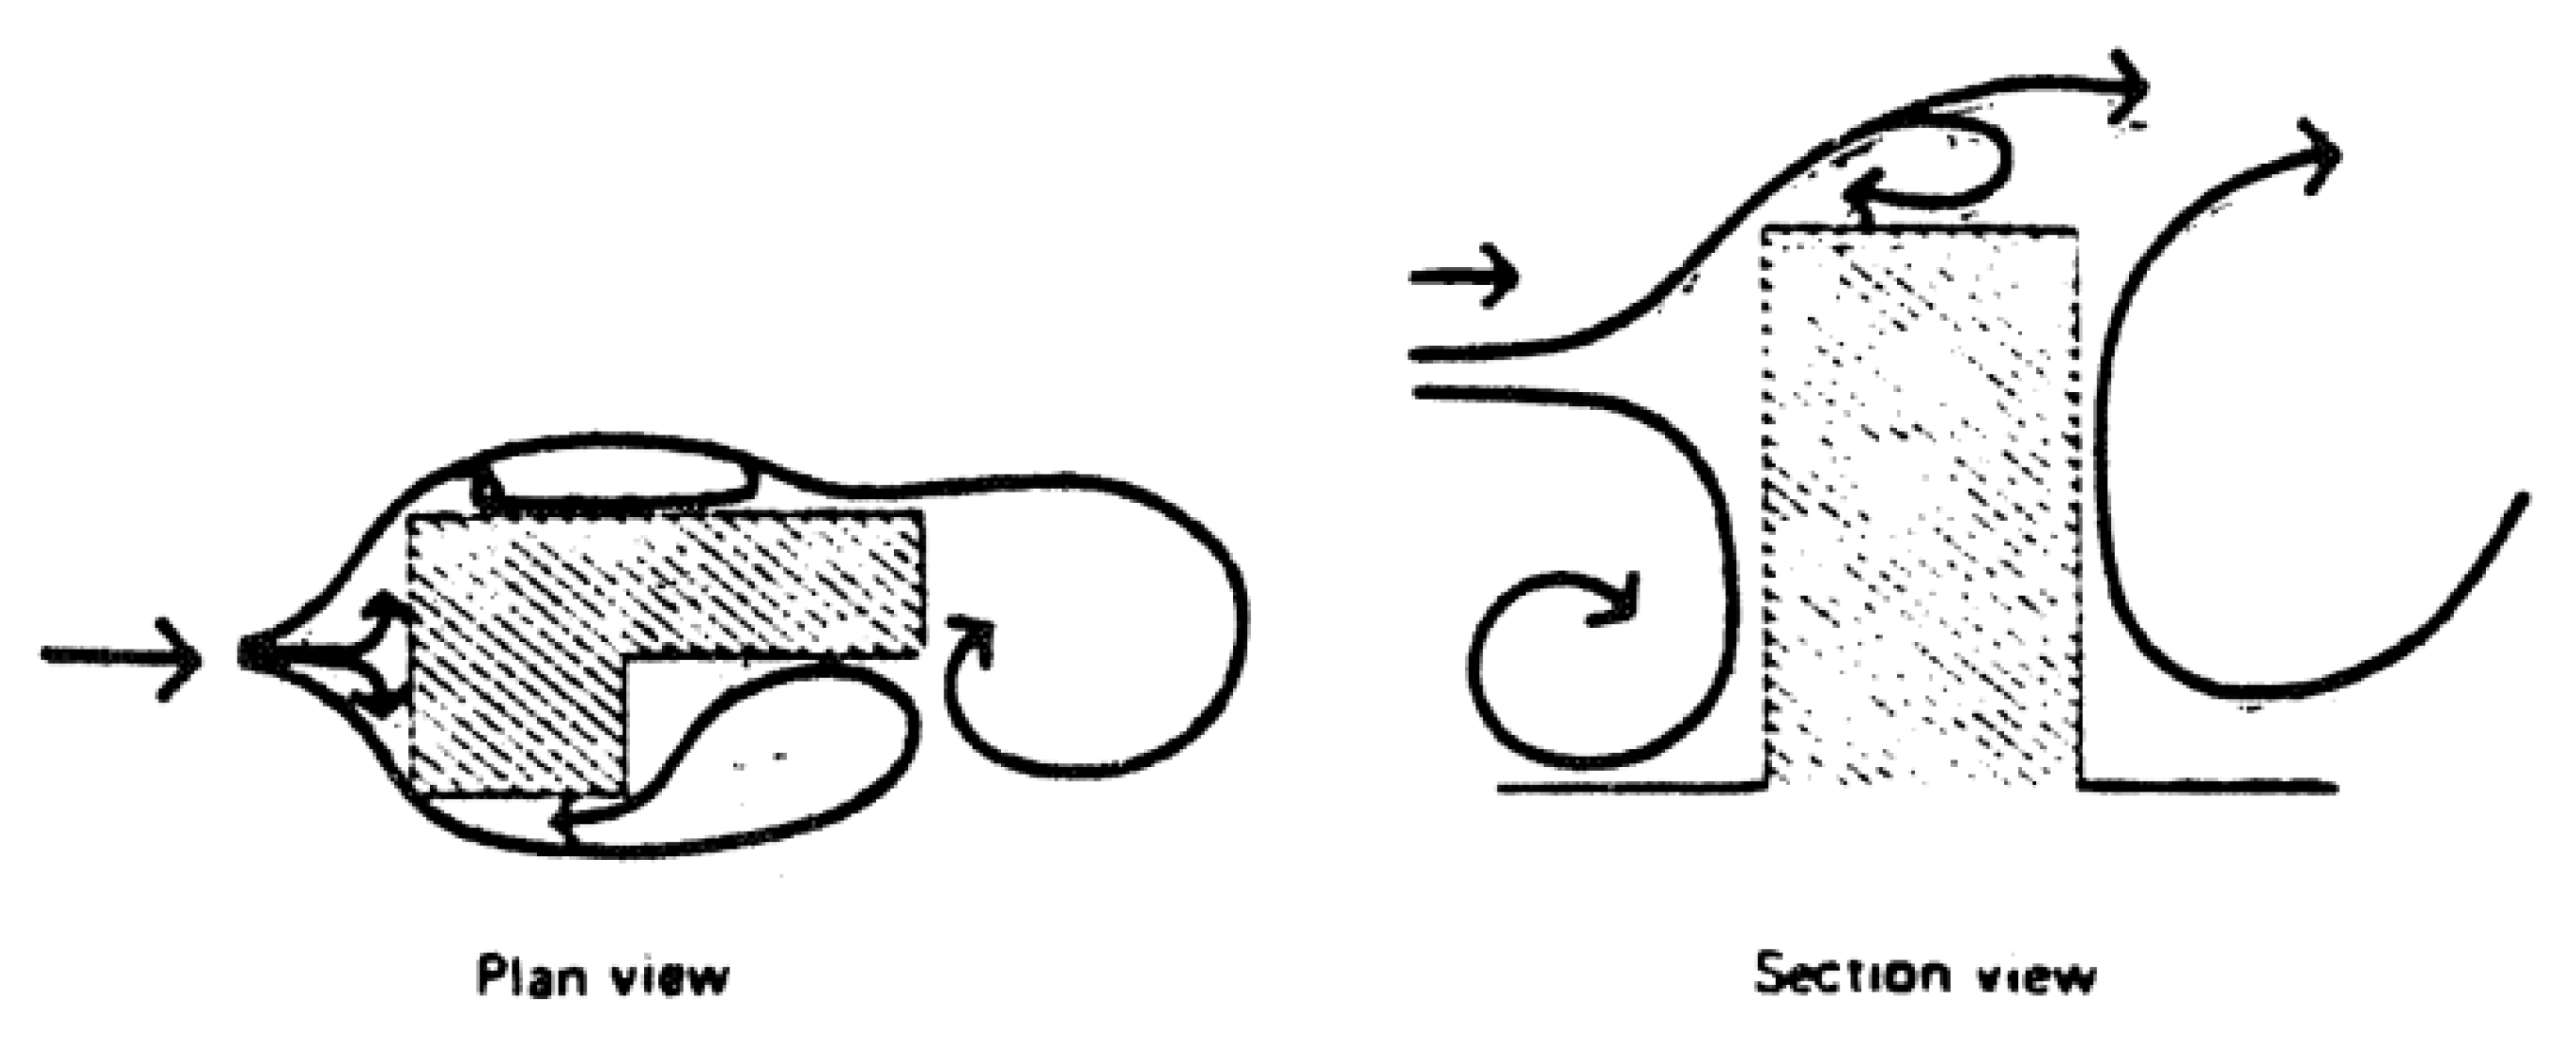
Table 1.
Parameters of Case Study project (Design guidelines and specification of Thompson Hall).
| Case study project | Thompson Hall |
|---|---|
| Built date | 1965-1966 |
| Windows | Architectural Window/AW class, NAFS-08 Fixed Sash Screen Frame: Aluminum |
| Glazing | DSB sheet glass set in vinyl glazing channel |
| Size of window | 4’ x 5’(1.21 m x 1.52 m) |
Table 3.
Weather information for studied dates.
| Day (last week of Dec.) |
Air Temp (oC) |
Air Temp at 9 m (oC) |
Wind Chill (oC) |
Wind Speed (m/s) |
Wind Speed at 10 m (m/s) |
Wind Direction (degree) |
|---|---|---|---|---|---|---|
| Saturday | -8.7 | -8.5 | -14.5 | 2.9 | 3.4 | 158 |
| Sunday | -3.1 | -2.7 | -8.7 | 4.1 | 4.7 | 169.6 |
| Monday | -5.6 | -5.4 | -11.3 | 3.6 | 4.2 | 14.5 |
Table 4.
The average temperature of all windows for each row of windows on different floors for four sides of the building on Saturday.
Table 4.
The average temperature of all windows for each row of windows on different floors for four sides of the building on Saturday.
| Factors | Df | Sum Sq | Mean Sq | F value | P-value | Significant |
|---|---|---|---|---|---|---|
| Floor | 3 | 28725 | 9575 | 7655 | <2e-16 | Yes |
| Side | 3 | 91941 | 30647 | 24501 | <2e-16 | Yes |
| Floor: Side | 9 | 7630 | 848 | 678 | <2e-16 | Yes |
| Residuals | 37000 | 46281 | 1 |
Table 5.
Statistical summary and results of post-hoc test for the average of measured temperature (oC) of each side and floor of the building on December 21.
Table 5.
Statistical summary and results of post-hoc test for the average of measured temperature (oC) of each side and floor of the building on December 21.
| Avg. (oC) | SD (oC) | Min (oC) | Max (oC) | |
|---|---|---|---|---|
| Side | ||||
| East | -11.1d | 1.7 | -15.2 | -6.4 |
| North | -8.3b | 1.3 | -12.4 | -4.5 |
| South | -7.5a | 1.2 | -9.9 | -3.3 |
| West | -10.9c | 1.6 | -14.3 | -6.6 |
| Floor | ||||
| 1 | -8.6A | 1.8 | -12 | -3.9 |
| 2 | -8.6A | 1.7 | -13 | -3.5 |
| 3 | -8.7A | 1.8 | -12 | -3.8 |
| 4 | -10.6B | 2.4 | -15 | -3.3 |
*Values with the same letters are not significantly different (Tukey’s HSD test, p < 0.05).
Table 6.
Result of ANOVA model for windows temperature for Sunday, December 22.
| Factors | Df | Sum Sq | Mean Sq | F value | P-value | Significant |
|---|---|---|---|---|---|---|
| Floor | 3 | 9080 | 3027 | 3948 | <2e-16 | Yes |
| Side | 3 | 106714 | 35571 | 46398 | <2e-16 | Yes |
| Floor: Side | 9 | 3982 | 569 | 742 | <2e-16 | Yes |
| Residuals | 31054 | 23808 | 1 |
Table 7.
Statistical summary and results of post-hoc test for the average of measured temperature (oC) of each side and floor of the building on Sunday, December 22.
Table 7.
Statistical summary and results of post-hoc test for the average of measured temperature (oC) of each side and floor of the building on Sunday, December 22.
| Factor | Avg. (oC) | SD (oC) | Min (oC) | Max (oC) |
|---|---|---|---|---|
| Side | ||||
| North | 4.11a* | 0.84 | 1.0 | 6.9 |
| West | 2.68b | 1.25 | 0.3 | 5.9 |
| East | 1.24c | 1.39 | -2.5 | 4.5 |
| South | -0.37d | 1.12 | -3.1 | 3.0 |
| Floor | ||||
| 1 | 1.42C | 1.5 | -1.9 | 5.9 |
| 2 | 2.27A | 2.0 | -2.1 | 6.3 |
| 3 | 2.05B | 2.3 | -2.0 | 6.9 |
| 4 | 0.96D | 2.3 | -3.1 | 5.7 |
*Values with the same letter are not significantly different (Tukey’s HSD test, p < 0.05).
Table 8.
Result of ANOVA model for windows temperature for Monday, December 23.
| Response/Value | Df | Sum Sq | Mean Sq | F | P-value | Significant |
|---|---|---|---|---|---|---|
| Floor | 3 | 7417 | 2472 | 1400 | <2e-16 | Yes |
| Side | 3 | 104547 | 34849 | 19734 | <2e-16 | Yes |
| Floor: Side | 7 | 4299 | 614 | 348 | <2e-16 | Yes |
| Residuals | 32364 | 57152 | 2 |
Table 9.
Statistical summary and results of post-hoc test for the average of measured temperature (oC) of each side and floor of the building on Monday, December 23.
Table 9.
Statistical summary and results of post-hoc test for the average of measured temperature (oC) of each side and floor of the building on Monday, December 23.
| Factor | Avg. (oC) | SD (oC) | Min (oC) | Max (oC) |
|---|---|---|---|---|
| Side | ||||
| East | -3.8b* | 1.4 | -7.3 | 0.23 |
| North | -6.4c | 1.8 | -11.7 | -0.5 |
| South | -7.8d | 1.2 | -11.4 | -4.34 |
| West | -3.4a | 1.9 | -7.5 | 1.93 |
| Floor 1 |
-6.0C | 2.1 | -11 | -0.85 |
| 2 | -5.7B | 2.2 | -11 | 0.15 |
| 3 | -5.5A | 2.5 | -10 | 1.93 |
| 4 | -6.7D | 2.2 | -12 | 0.98 |
*Values with the same letter are not significantly different (Tukey’s HSD test, p < 0.05).
Table 10.
Statistical summary of thermal performance (oC) for each side of the building.
| Side | Avg. (oC) | SD (oC) | n | Min. (oC) | Max. (oC) |
|---|---|---|---|---|---|
| East | -4.5 a* | 5.4 | 12 | -13.1 | 2.1 |
| North | -3.5 b | 5.7 | 12 | -9.2 | 4.5 |
| South | -5.2 c | 3.6 | 12 | -8 | 0.3 |
| West | -5.4 c | 6.1 | 8 | -11.9 | 4 |
Average thermal values with the same letter have no significant differences (Tukey’s HSD test, p < 0.05).
Table 11.
Average temperature differences (oC) between floors for three studied dates (December 21, 22, and 23).
Table 11.
Average temperature differences (oC) between floors for three studied dates (December 21, 22, and 23).
| Floors | Difference (oC) | Lower (oC) | Upper (oC) | P-value |
|---|---|---|---|---|
| 1-2 | 0.005 | -0.61 | 0.62 | 1 |
| 1-3 | 0.89 | 0.31 | 1.48 | 0* |
| 1-4 | -0.67 | -1.26 | -0.09 | 0.02* |
| 2-3 | 0.88 | 0.3 | 1.48 | 0* |
| 2-4 | -0.67 | -1.26 | -0.09 | 0.02* |
| 3-4 | -1.56 | -2.13 | -1.01 | 0* |
*P-values lower than 0.05 shows significant differences (Tukey’s HSD test, p < 0.05).
Disclaimer/Publisher’s Note: The statements, opinions and data contained in all publications are solely those of the individual author(s) and contributor(s) and not of MDPI and/or the editor(s). MDPI and/or the editor(s) disclaim responsibility for any injury to people or property resulting from any ideas, methods, instructions or products referred to in the content. |
© 2025 by the authors. Licensee MDPI, Basel, Switzerland. This article is an open access article distributed under the terms and conditions of the Creative Commons Attribution (CC BY) license (http://creativecommons.org/licenses/by/4.0/).
Copyright: This open access article is published under a Creative Commons CC BY 4.0 license, which permit the free download, distribution, and reuse, provided that the author and preprint are cited in any reuse.


