1. Introduction
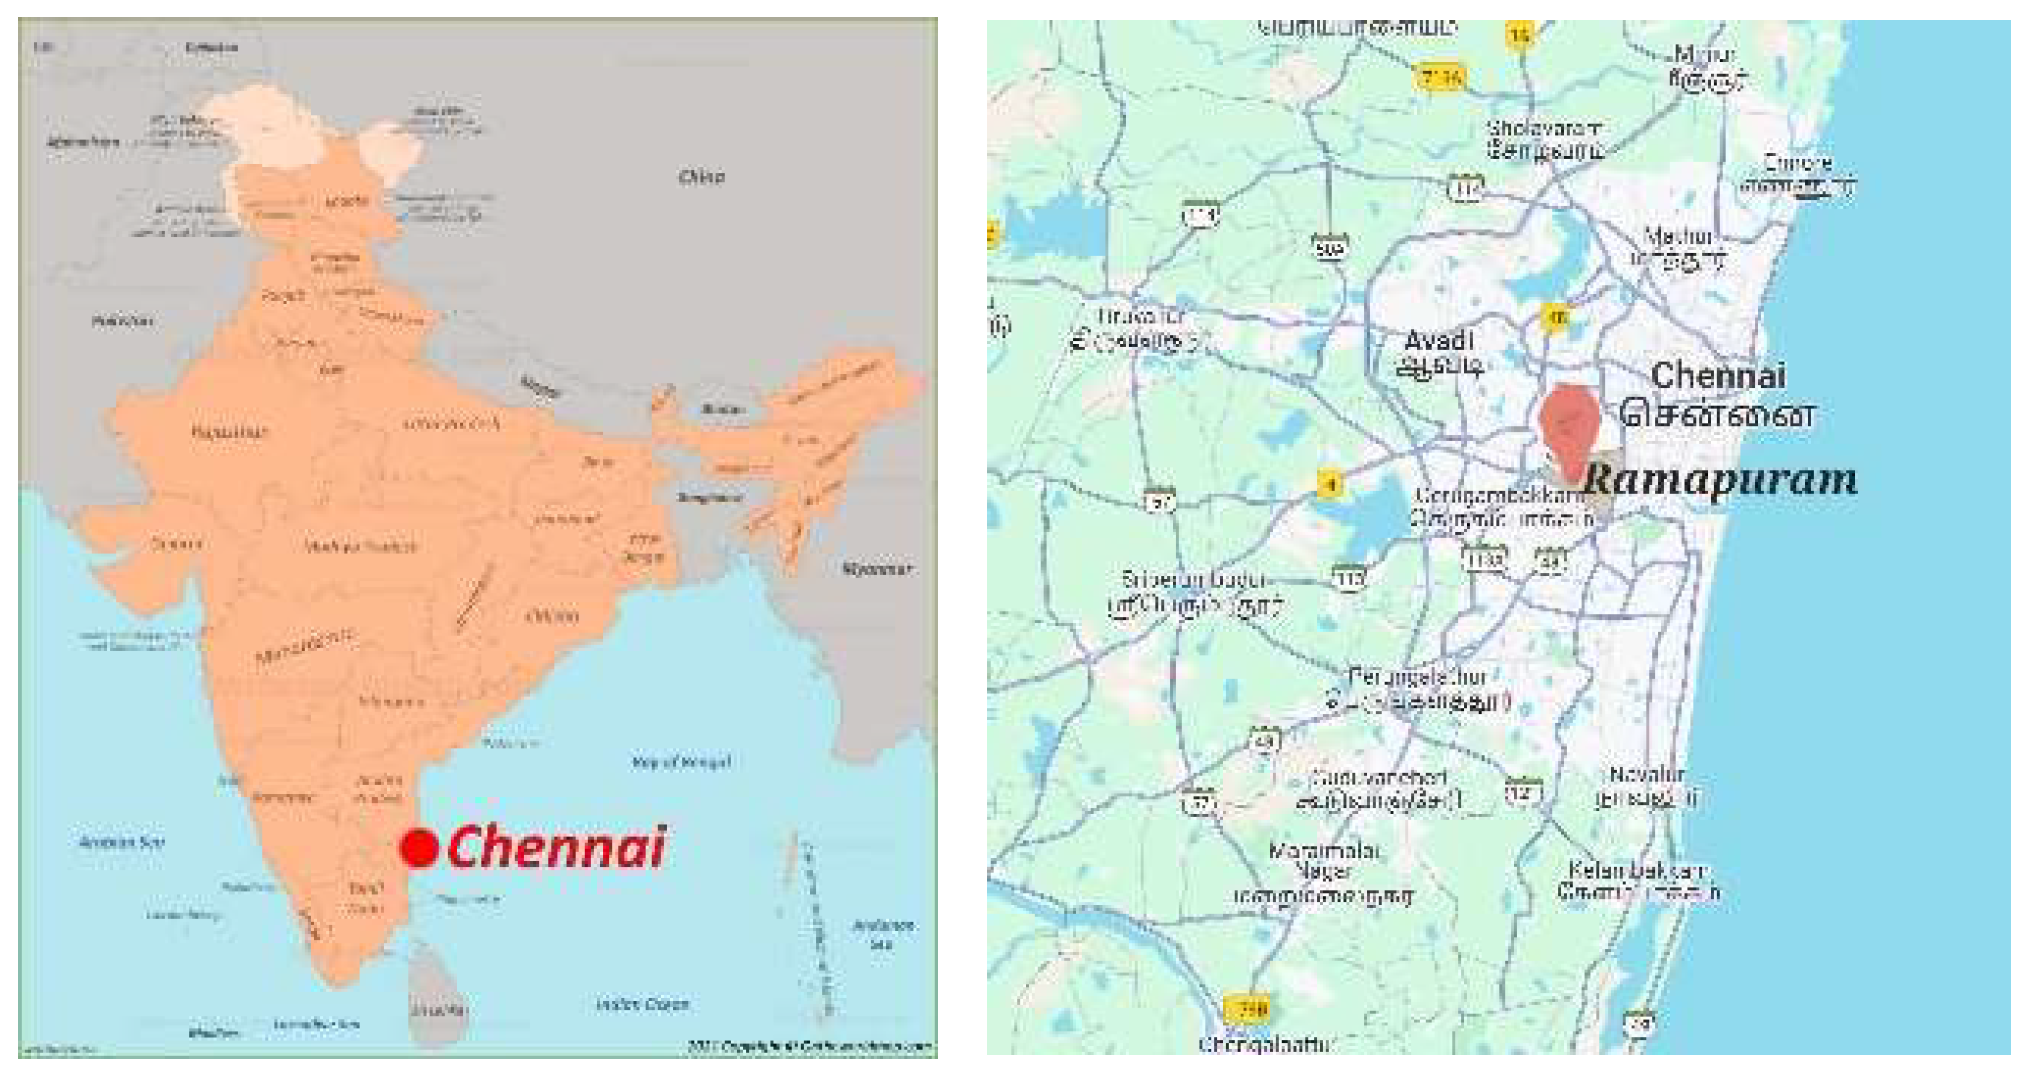
Chennai, the capital city of Tamilnadu, is located at 13.0827° N latitude and 80.2707° E longitude. (
Figure 1), The city attracts people from various backgrounds for many reasons including tourism, healthcare, employment, and education. It is a significant educational hub, home to numerous public and private institutions, including schools, colleges, and universities. Climate characteristics of Chennai: The city experiences a hot and humid climate [
1] Design strategies for hot and humid climates often present a contradiction: minimizing the size of openings to reduce heat gain while increasing their size to promote cross-ventilation poses a significant challenge. The influence of Marina Beach is an advantage in bringing the evening breeze to the city.
1.1. School Education in Tamilnadu
According to the 2011 Census of India, the literacy rate in Tamil Nadu is 80.09%, while in Chennai, it is 90.23%. There has been a steady increase in the number of schools as well as student enrolment. The school environment must be conducive to holistic learning for students [
25]. This research seeks to assess the current design of school environments in terms of daylight availability inside the classrooms since daylight has a significant impact on health and performance [
24]. During primary data collection, it was observed that all fans and lights remained on throughout the day, regardless of window conditions Some of the classrooms had their windows open and others closed for various reasons that are discussed later in this paper.
Tamilnadu’s school education department is taking a lot of initiatives for the upgradation of infrastructure in government schools. In the school education department policy note, 2024-25 -Demand no.43, the budget for the financial year 2024-25 is mentioned as a whooping amount of Rupees 44,042.08 crore. Some of the schools are retrofitted and new schools are being designed throughout the state. This situation makes this research meaningful as well as significant for society in achieving sustainable development goals.
2. Materials and Methods
2.1. Type of Research
This research combines case study and simulation methods to understand existing issues and provide optimized solutions based on site and daylight metrics.
2.2. Objectives
To evaluate the window-to-wall ratio of the existing classrooms
To evaluate the daylight performance for daylight metrics like illuminance, spatial daylight autonomy, and annual sun exposure
To study the influence of trees on daylight availability inside the classrooms
To find the relationship between orientation, location of the classrooms for different window-to-wall ratios, and the shading device configuration concerning daylight
2.3. Methodology
A literature review was conducted on school design, standards, governing bylaws, climate, daylight research, and simulation Primary data was collected on the site chosen for the study. The conditions were then run on a computational modeling simulation using Rhinoceros software with the Climate Studio plugin.
This study was conducted to examine how the orientation, window-to-wall ratio, and sunshade depth influence the average illuminance levels in classrooms. Illuminance was measured using a Konica Minolta lux meter at a work plane height of 0.75 meters. As the furniture layout varied between the classrooms, points of measurement were chosen on the tables that were next to the windows, door, and at the center of the classrooms.
2.4. Literature Review
Design recommendations for a hot humid climate zone from a study done in Africa suggest the following: 1) Raising the building on stilts to induce ventilation 2) orientating the building along wind direction for cross ventilation 3) Plant trees with large foliage with the trunk up to the window level can deflect breeze downwards 4) Large windows, if provided, need to be shaded [
2]
Research studies have firmly established that light can alter human circadian rhythms. Daylight can regulate the melatonin hormone that is responsible for sleep. The blue wavelength in the daylight is twice as effective as green to induce the sleep hormone. In today’s context, where many people suffer from insomnia and other sleep cycle disorders, exposure to morning light can advance the circadian clock, while evening light can delay it [
3]. Light can impact the neural transmitters like serotonin production which fluctuates during the winter. Both animals and human beings exhibit this behavior of depression when serotonin levels are low. Regular exposure to daylight can help regulate the disorder [
4]. Ooyen, Weijgert, and Begemann in their research concluded that vertical illuminance on the wall decided the preference of visually aided tasks like reading. Butler and Biner’s research suggests that university students preferred no windows for lecture halls compared to larger windows for dormitories [
5] In a study carried out during the year 2022 in China, it was found that there was an increase in Myopia especially in younger children who spent most of their time using mobile phones without the supervision of parents or adults at home; this is during the covid lockdown period when they spent minimum time outdoors and most of the time indoors with their gadgets [
6].
Knop et al., in their research, imply that the daylight entering through a window produces visual clarity and gives the impression of serenity compared to light from an artificial source creating a visual noise. windows with views can relieve stress and increase job satisfaction [
7]. In Pakistan, research was conducted to determine whether the physical environment of classrooms influences students’ academic performance. The results suggested that the good classroom environment kept the students motivated and also improved their performance [
8] Ma’bdeh S and Matar H conducted a simulation research for daylighting for a classroom in Jordan using Radiance software for designing a dynamic façade that can respond to illuminance levels of the classroom. For this, nine prototypes by varying the sill heights and window-to-wall ratios. The results indicated that the sill height’s influence was not significant but WWR was more pronounced on daylight glare probability [
9,
26].
This study builds upon existing literature by investigating daylight performance in classrooms within a compact urban site in Chennai, focusing on the influence of orientation, WWR, shading, and vegetation on indoor illuminance levels.
2.5. Study Area and Site Selection
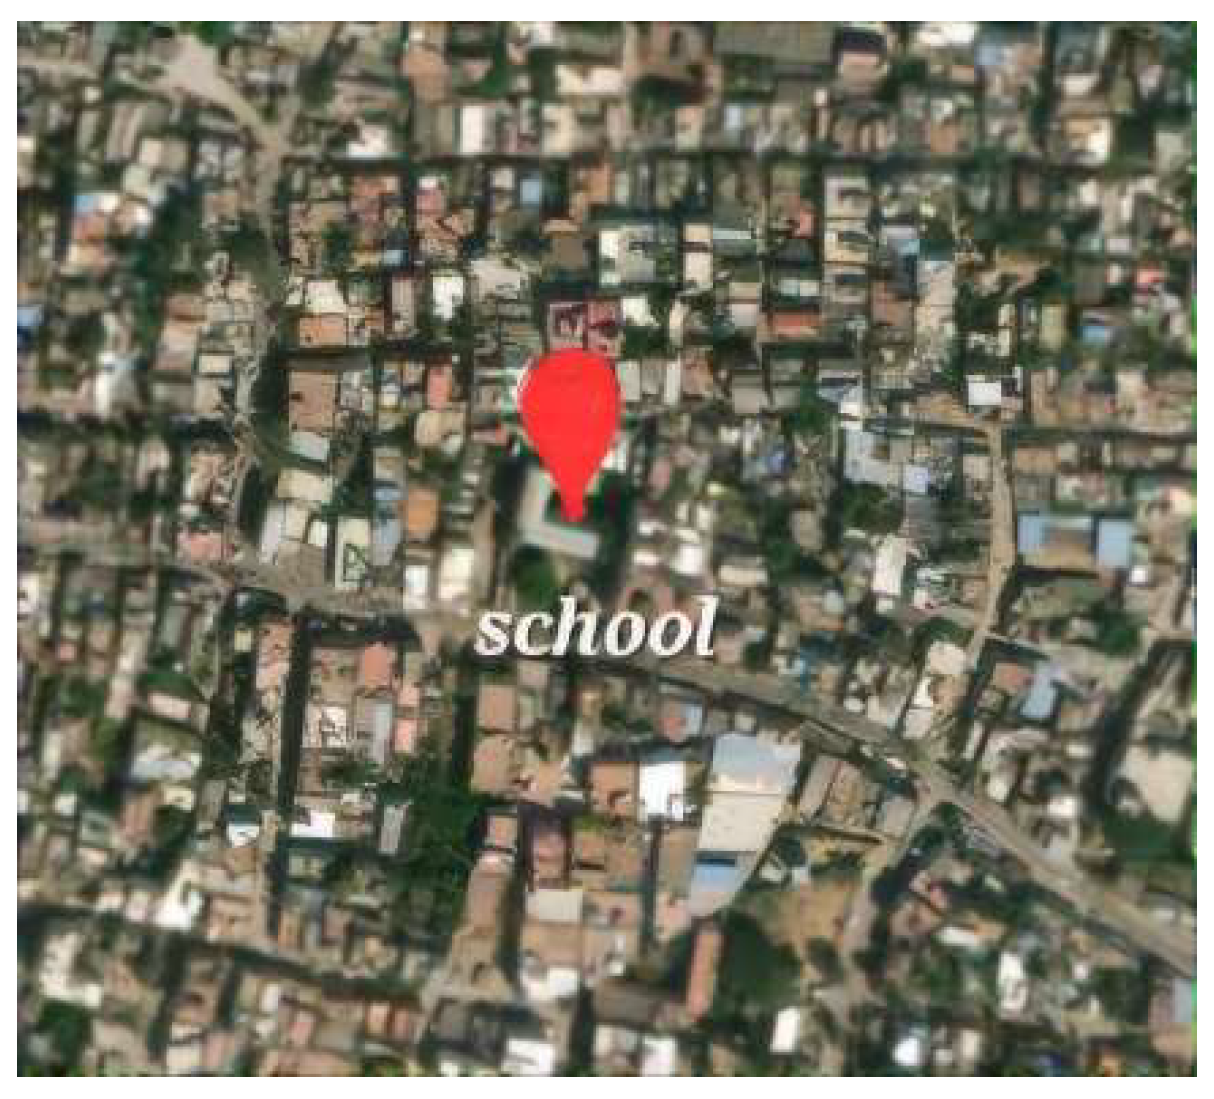
According to the Tamil Nadu Government Gazette, the minimum land requirement for a higher secondary school in the Chennai Metropolitan Development Area is 223 square meters (1 ground). For the research purpose, a compact site in an urban residential area was selected. The school is accessed via a 3-meter-wide street, located approximately 40 meters from a 5-meter-wide main road. Situated in Ramapuram (Figure 2) Chennai, the school is surrounded by residential buildings on all sides. (
Figure 3 and
Figure 4).
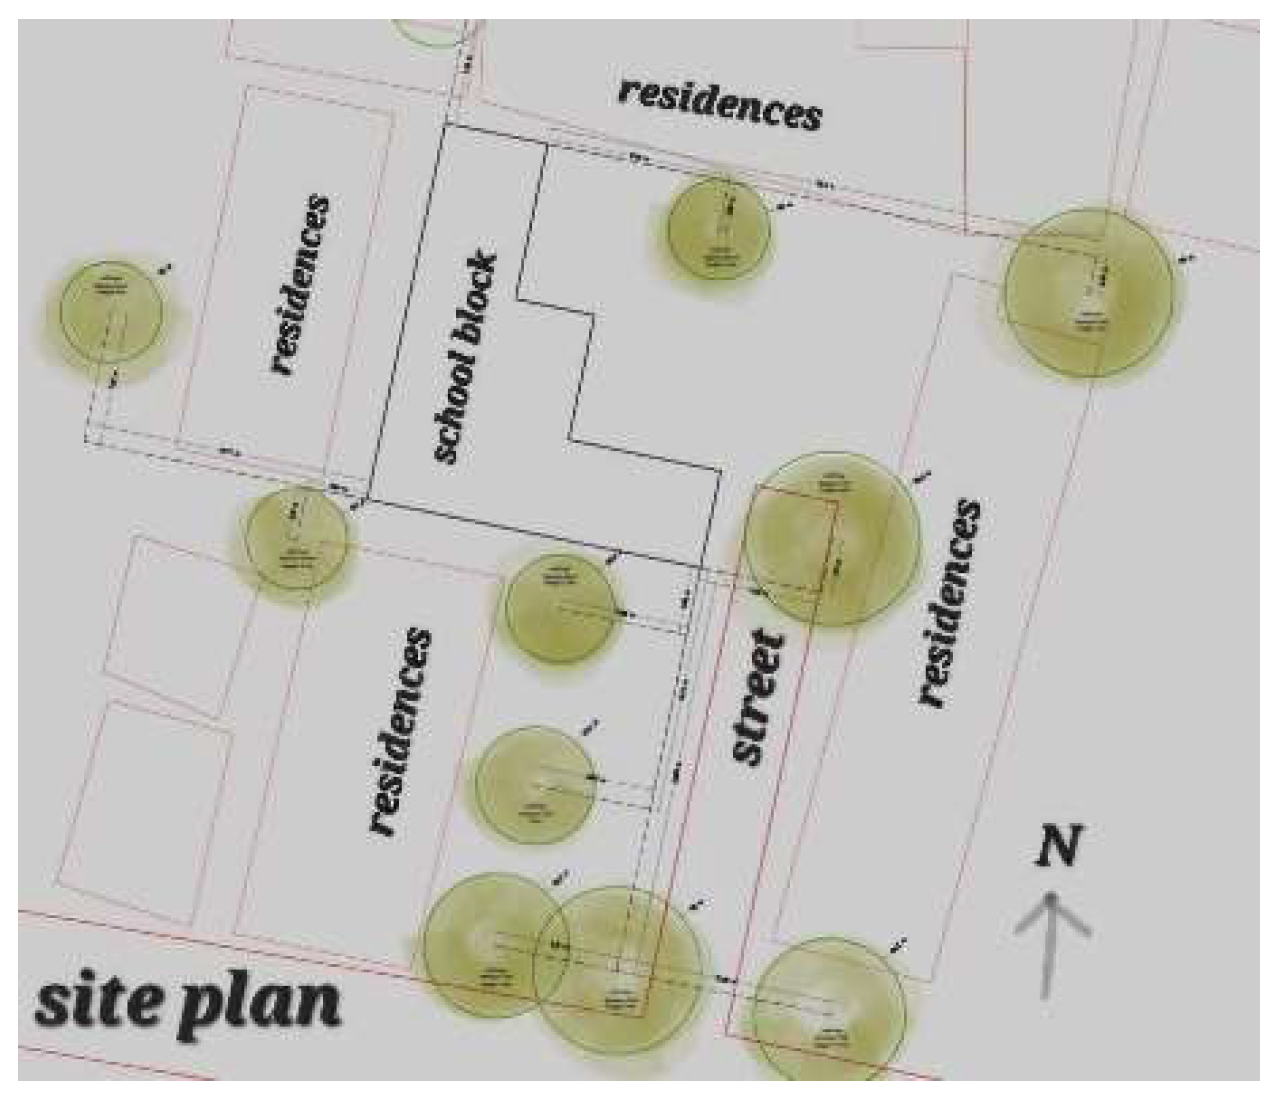
The total site area is 1120 square meters, with a 40% plot coverage and a 60% open space. The site has minimal vegetation, with only a few trees located along its southern boundary.
The placement of blocks along the periphery limits daylight access from all sides due to the site’s compactness. In a residential area, that is prone to expand, architects should anticipate that the surrounding buildings or obstructions would deter the daylight using mutual shading, both for the residences as well as the school. Even though there is a large open space, it does not do justice to the classroom daylight conditions
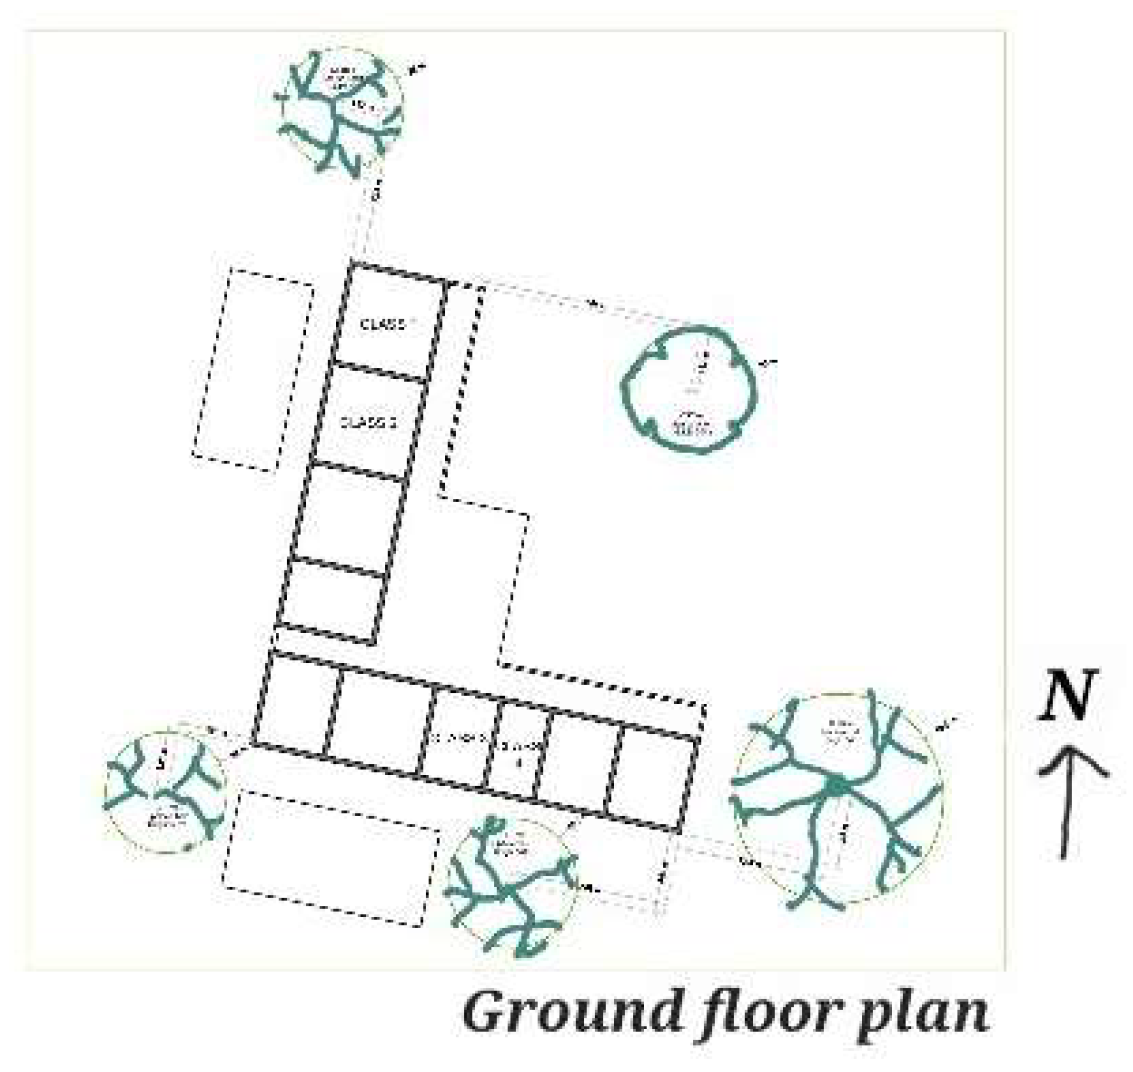
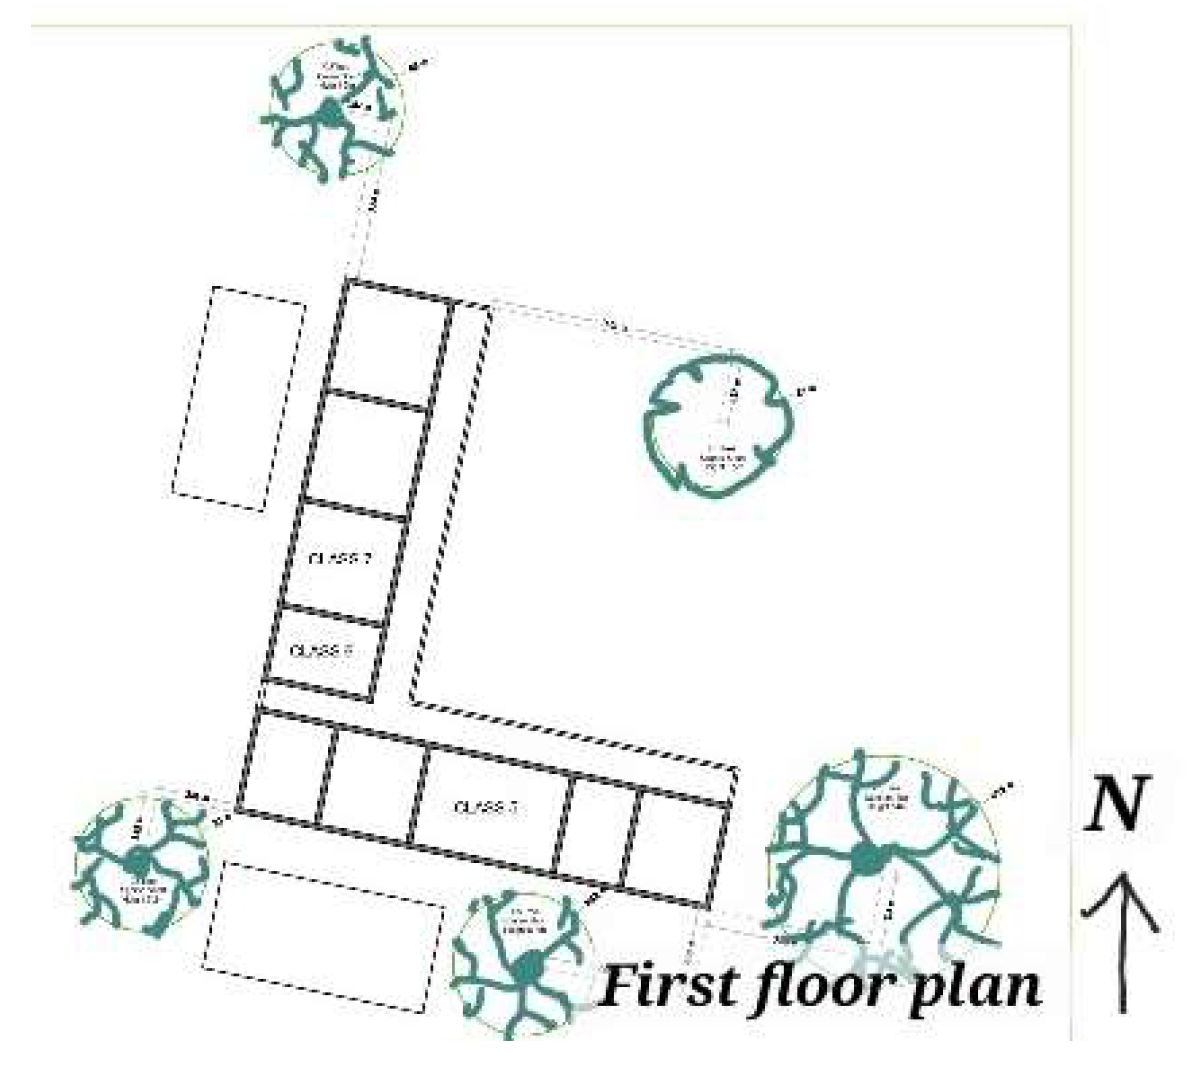
The building block does not have a true east-west or north-south orientation, as it is tilted at a negligible angle. It is assumed to be east-west and north-south for study purposes. The school operates under private management and accommodates students from kindergarten to grade XII. Architecturally, it follows an L-shaped spatial organization (
Figure 5 and
Figure 6) with classrooms arranged along a singly-loaded corridor. The open space within the site, measuring approximately 640 square meters, serves as a playground and assembly area.
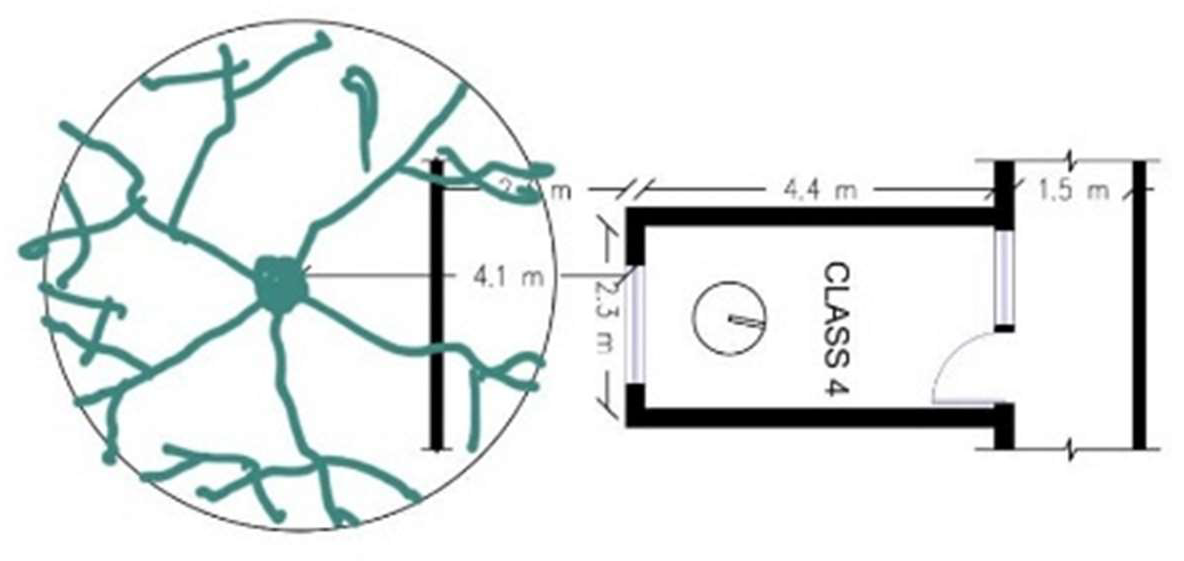
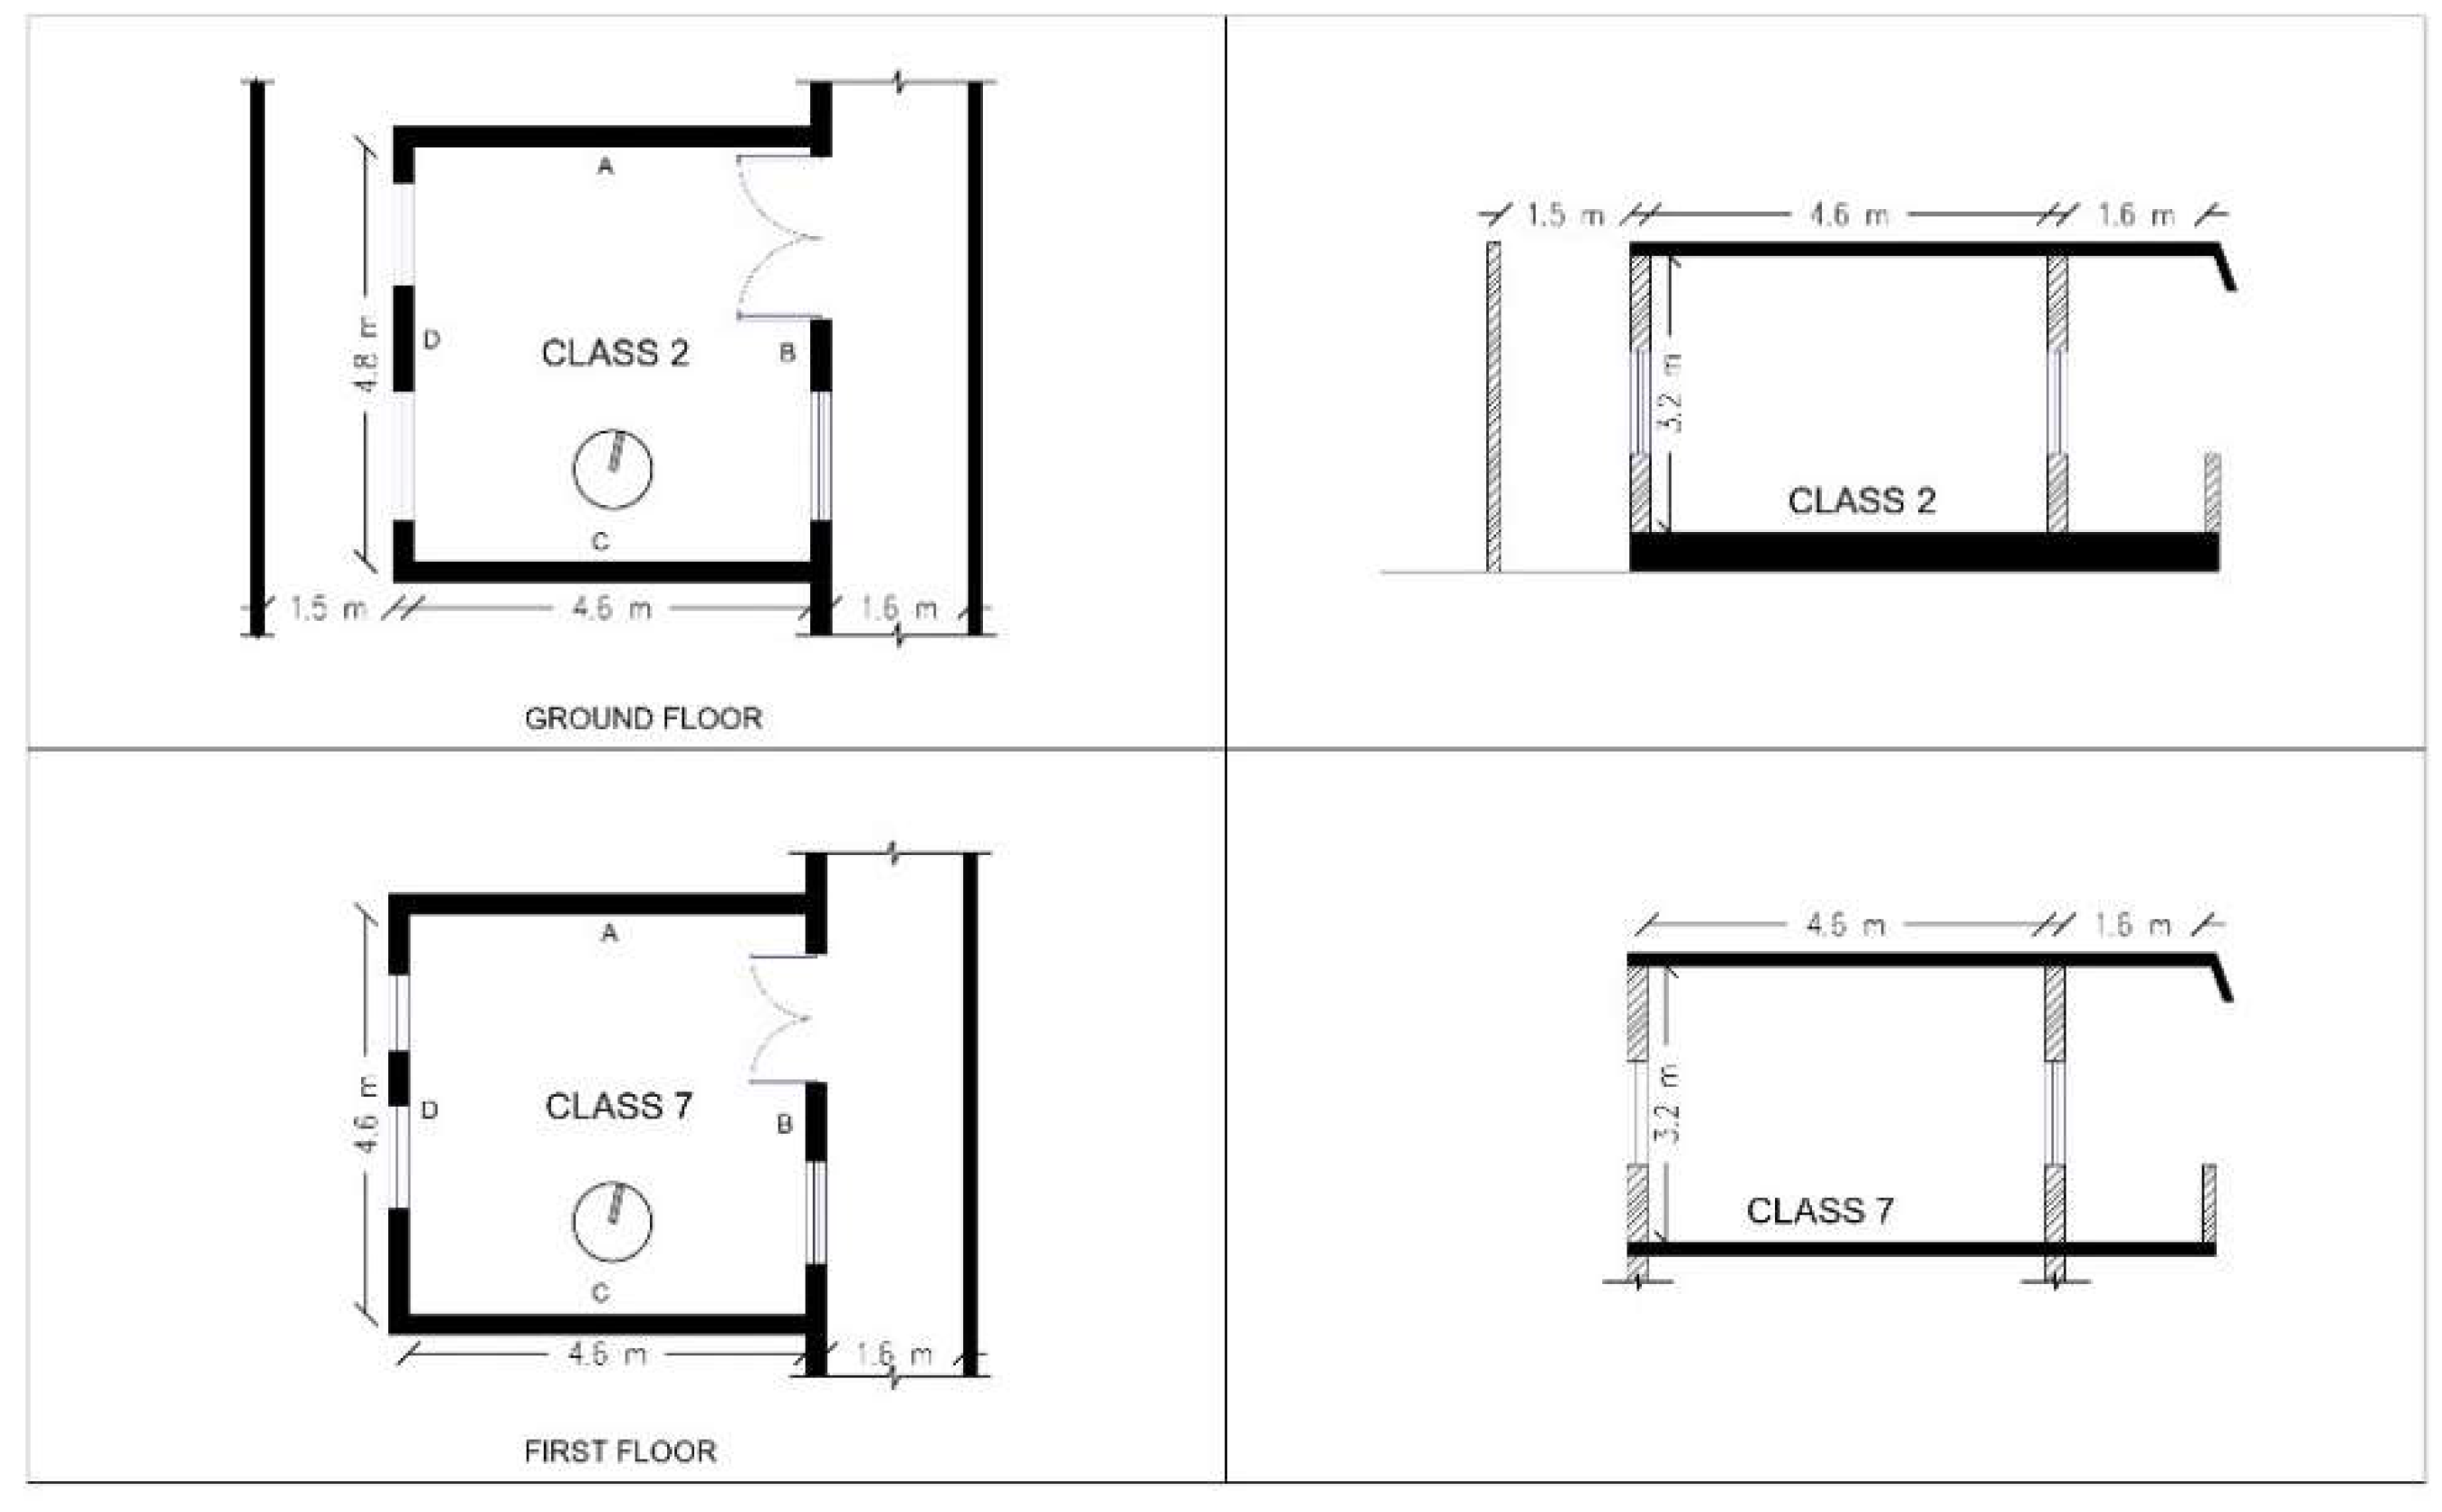
The classrooms have a rectangular layout Figures 7 and 9, with a 1.6-meter-wide corridor on one side and an open space on the other Figures 8 and 10. Casement windows act as the primary natural ventilation and daylight openings, supplemented by external sunshades that extend 0.6 meters from the façade. The ceiling height of each classroom is 3.2 meters, with a sill height of 0.8 m, a lintel of 2.4m, and a tree. at a distance of 4.2 m from the classrooms 4 and 5. The shadow cast by the tree has a significant impact on illuminance levels.
Figure 7.
Ground floor plan-Classroom 4.
Figure 7.
Ground floor plan-Classroom 4.
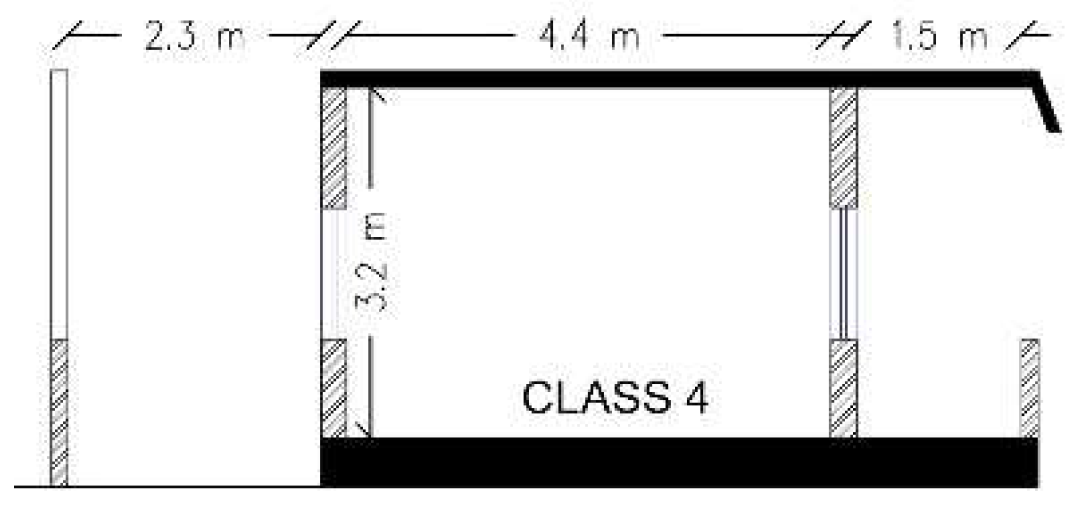
Figure 8.
Section -classroom 4.
Figure 8.
Section -classroom 4.
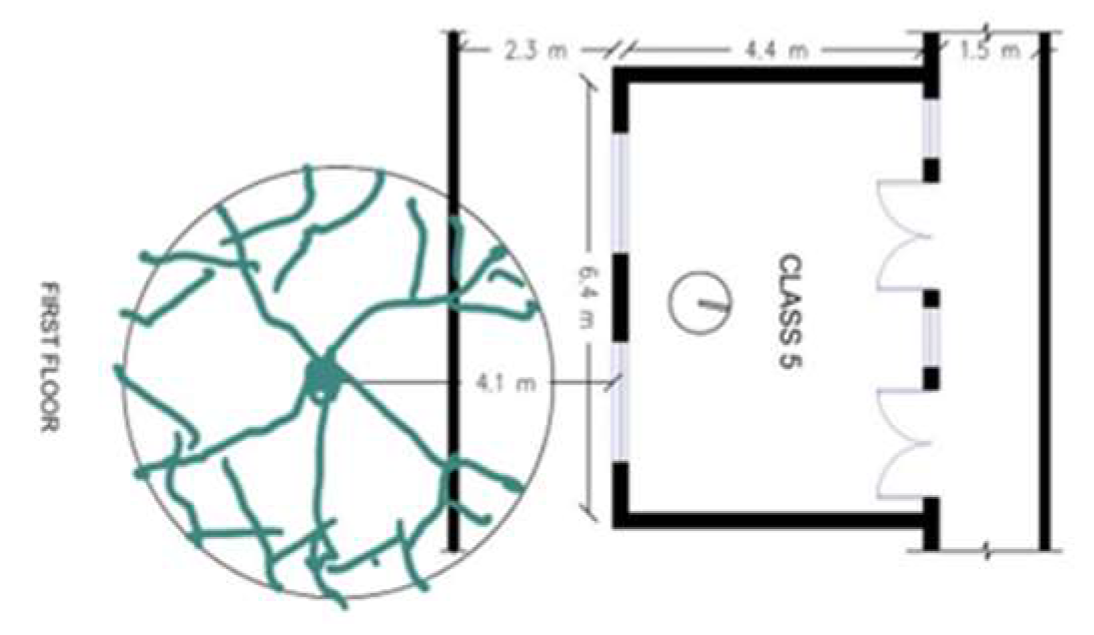
Figure 9.
First-floor plan-Classroom 5.
Figure 9.
First-floor plan-Classroom 5.
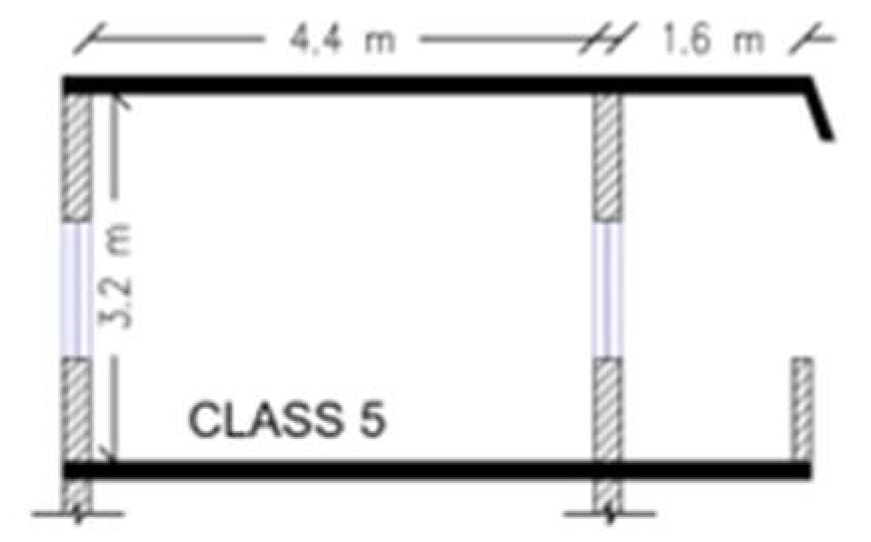
Figure 10.
Section -classroom 5.
Figure 10.
Section -classroom 5.
Xin Liu, et al. conducted simulation research on a south-facing wall in China by altering the sill heights. They found that as the sill height increased from 0.8 m to 1.6m, the maximum illuminance gradually decreased to 2148 lux but the minimum illuminance increased to 931 lux [
10] This means that the views to the outside would be compromised. The function of windows is not only to allow light into space but also to offer a view of the outside. The study of 5 public schools in Illinois by Dongying Li and William. C. Sullivan found that window views to greenery helped in reducing stress for the high school students and promoted attention restoration [
11].
2.6. Field Measurements
Illuminance levels were measured using a Konica Minolta lux meter at a standard work plane height of 0.75 meters to evaluate daylight performance Additional data on fenestration configuration, including window size and position were collected The window-to-wall ratio (WWR) of each classroom was calculated to verify compliance with the 20% minimum threshold established by daylighting standards
Table 1. Site parameters such as plot coverage, open space ratio, and built-up area were analyzed to assess their impact on daylight availability.
2.6.1. Discussions from Field Study
The classrooms have varied proportions and varied numbers of students. The smaller rooms had higher illuminance in some cases and in certain the illuminance was too low at the center of the classroom. The school has grown in many years from a high school to a higher secondary school. The layout is most common in many schools here, having classrooms along a singly-loaded corridor.
2.6.2. Influence of Adjacent Buildings on the West Side of the School and the Social Context
The windows on the western wall are typically kept closed to ensure privacy and reduce noise and odors from nearby residences that are 3.2 m away. Notably, only the east-west block of the school has a shorter distance to adjacent buildings. Similarly, the windows along the corridors are often shut, especially in the afternoons, to minimize heat and also the noise from the playground.
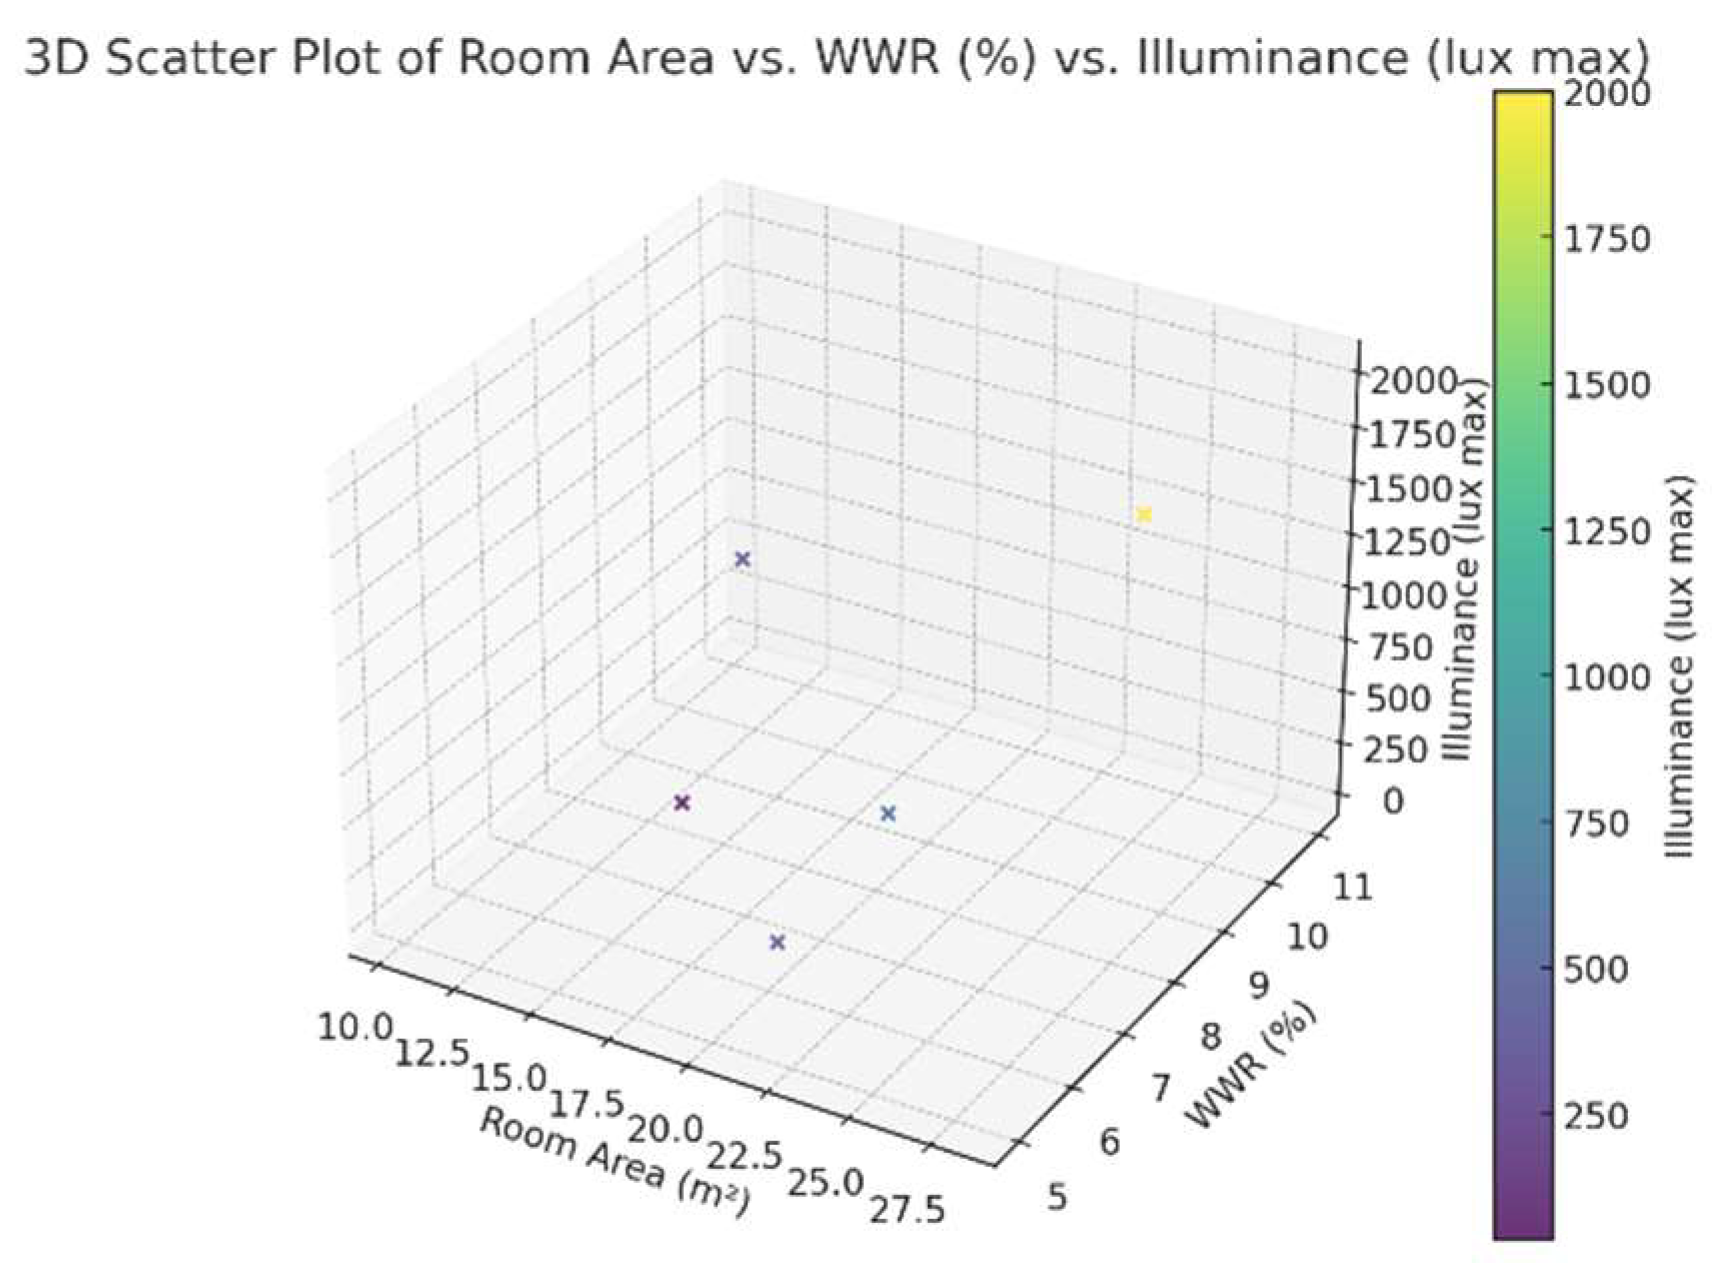
2.6.3. Room Area vs WWR vs Illuminance
Multivariable Relationship
Figure 11 3D scatter plot visualizes the correlation between room area (m
2), window-to-wall ratio (WWR %), and maximum illuminance (lux). The data points suggest a nonlinear relationship, indicating that both room area and WWR affect daylight availability in a complex manner.
Higher WWR % values tend to correspond with increased illuminance levels, confirming that larger window-to-wall ratios allow more daylight penetration. Larger room areas seem to contribute to higher illuminance values, but this trend is inconsistent, suggesting potential influences from factors such as window orientation, glazing type, or light reflectance within the space.
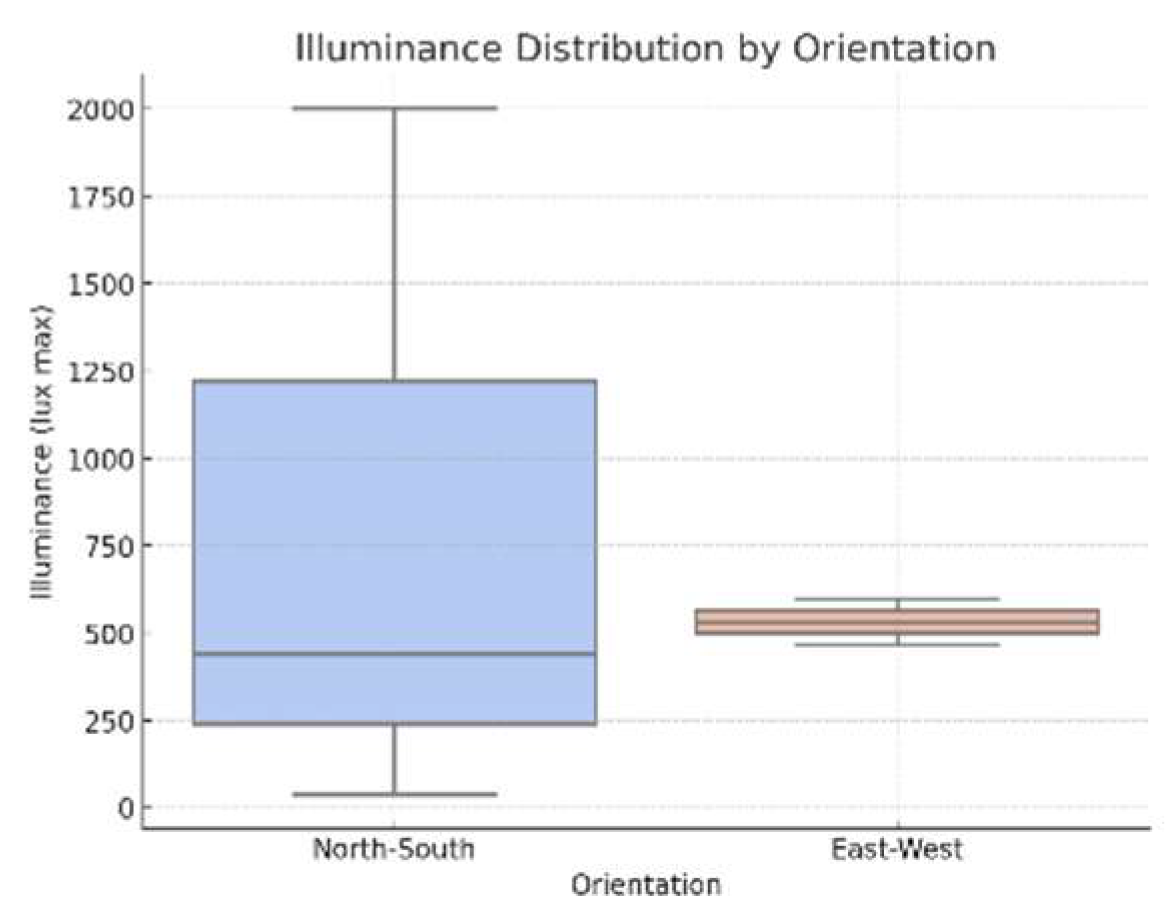
2.6.4. Illuminance Distribution by Orientation
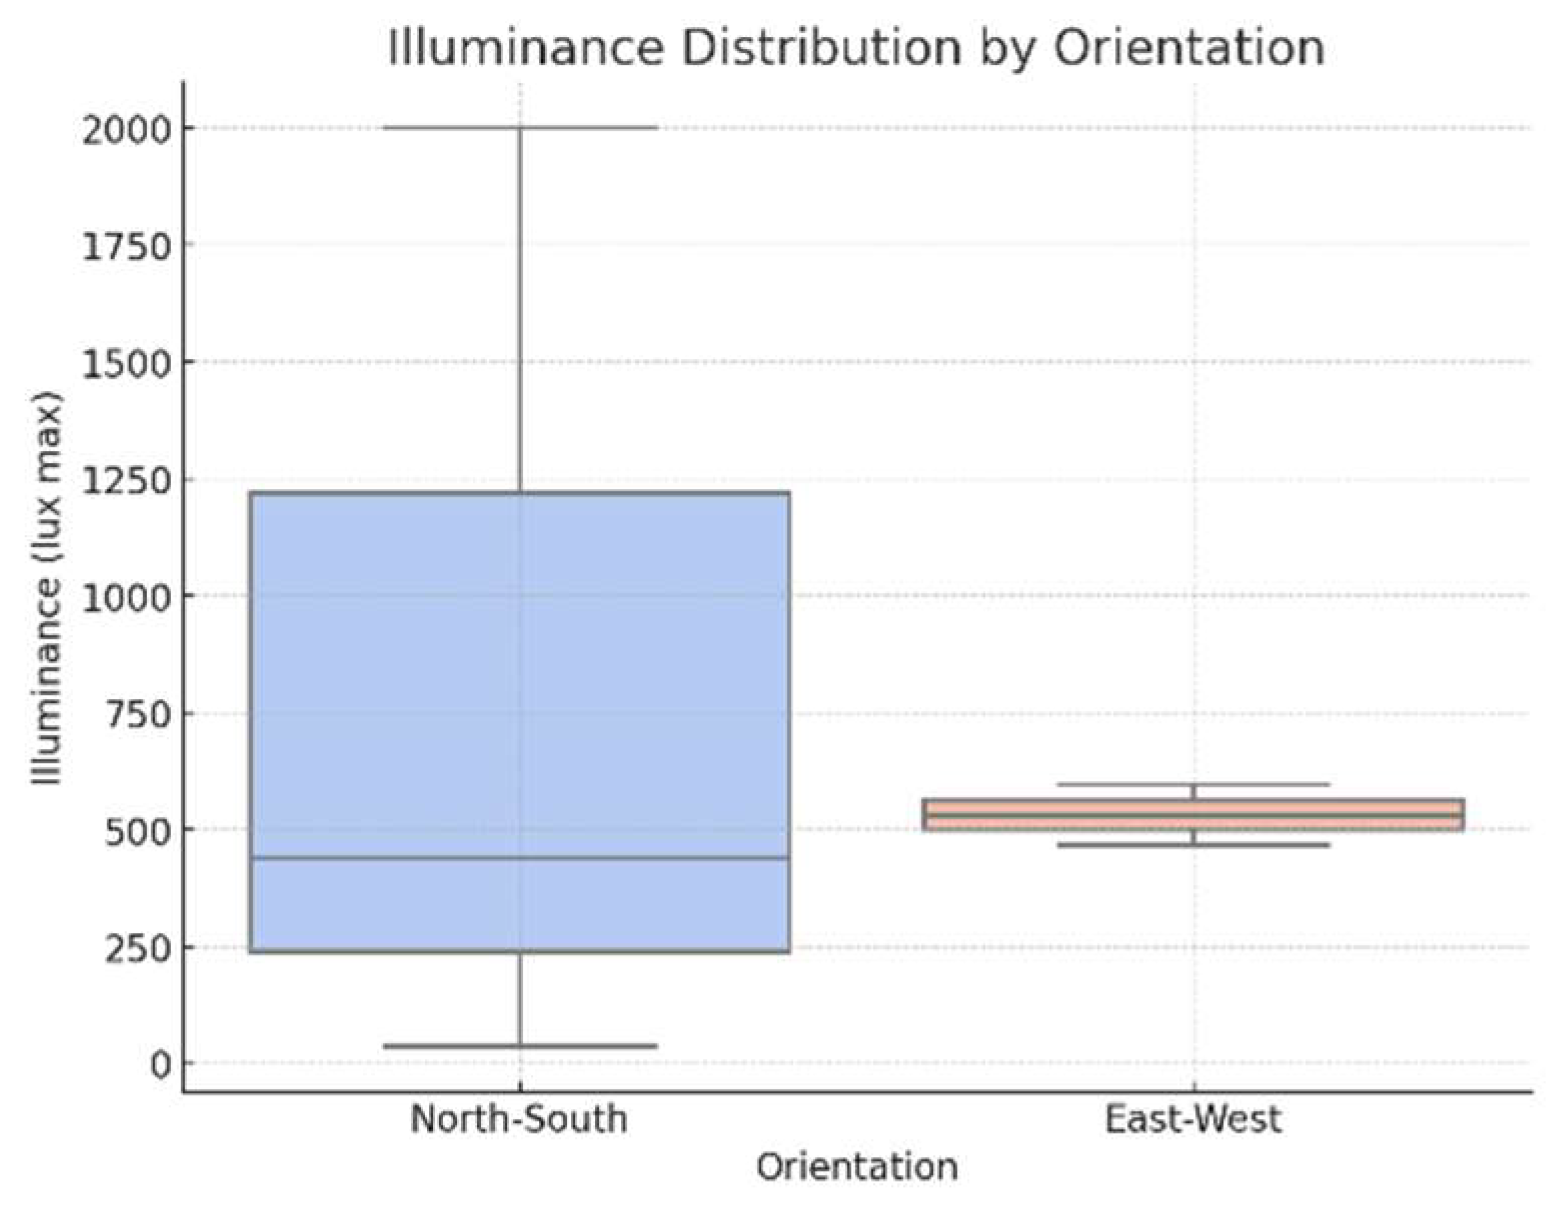
Statistical Spread & Variability (
Figure 1) The North-South orientation exhibits a significantly larger interquartile range (IQR), suggesting high variability in illuminance values. The East-West orientation, on the other hand, demonstrates a more compact IQR, indicating a more consistent and predictable distribution of light levels. The median illuminance in the North-South orientation is considerably higher than that of the East-West orientation, implying greater daylight penetration in this orientation. However, due to the wider spread, North-South orientation experiences fluctuations in illuminance levels, which may impact uniform daylight distribution.
2.6.5. Influence of Adjacent Buildings on the West Side of the School and the Social Context
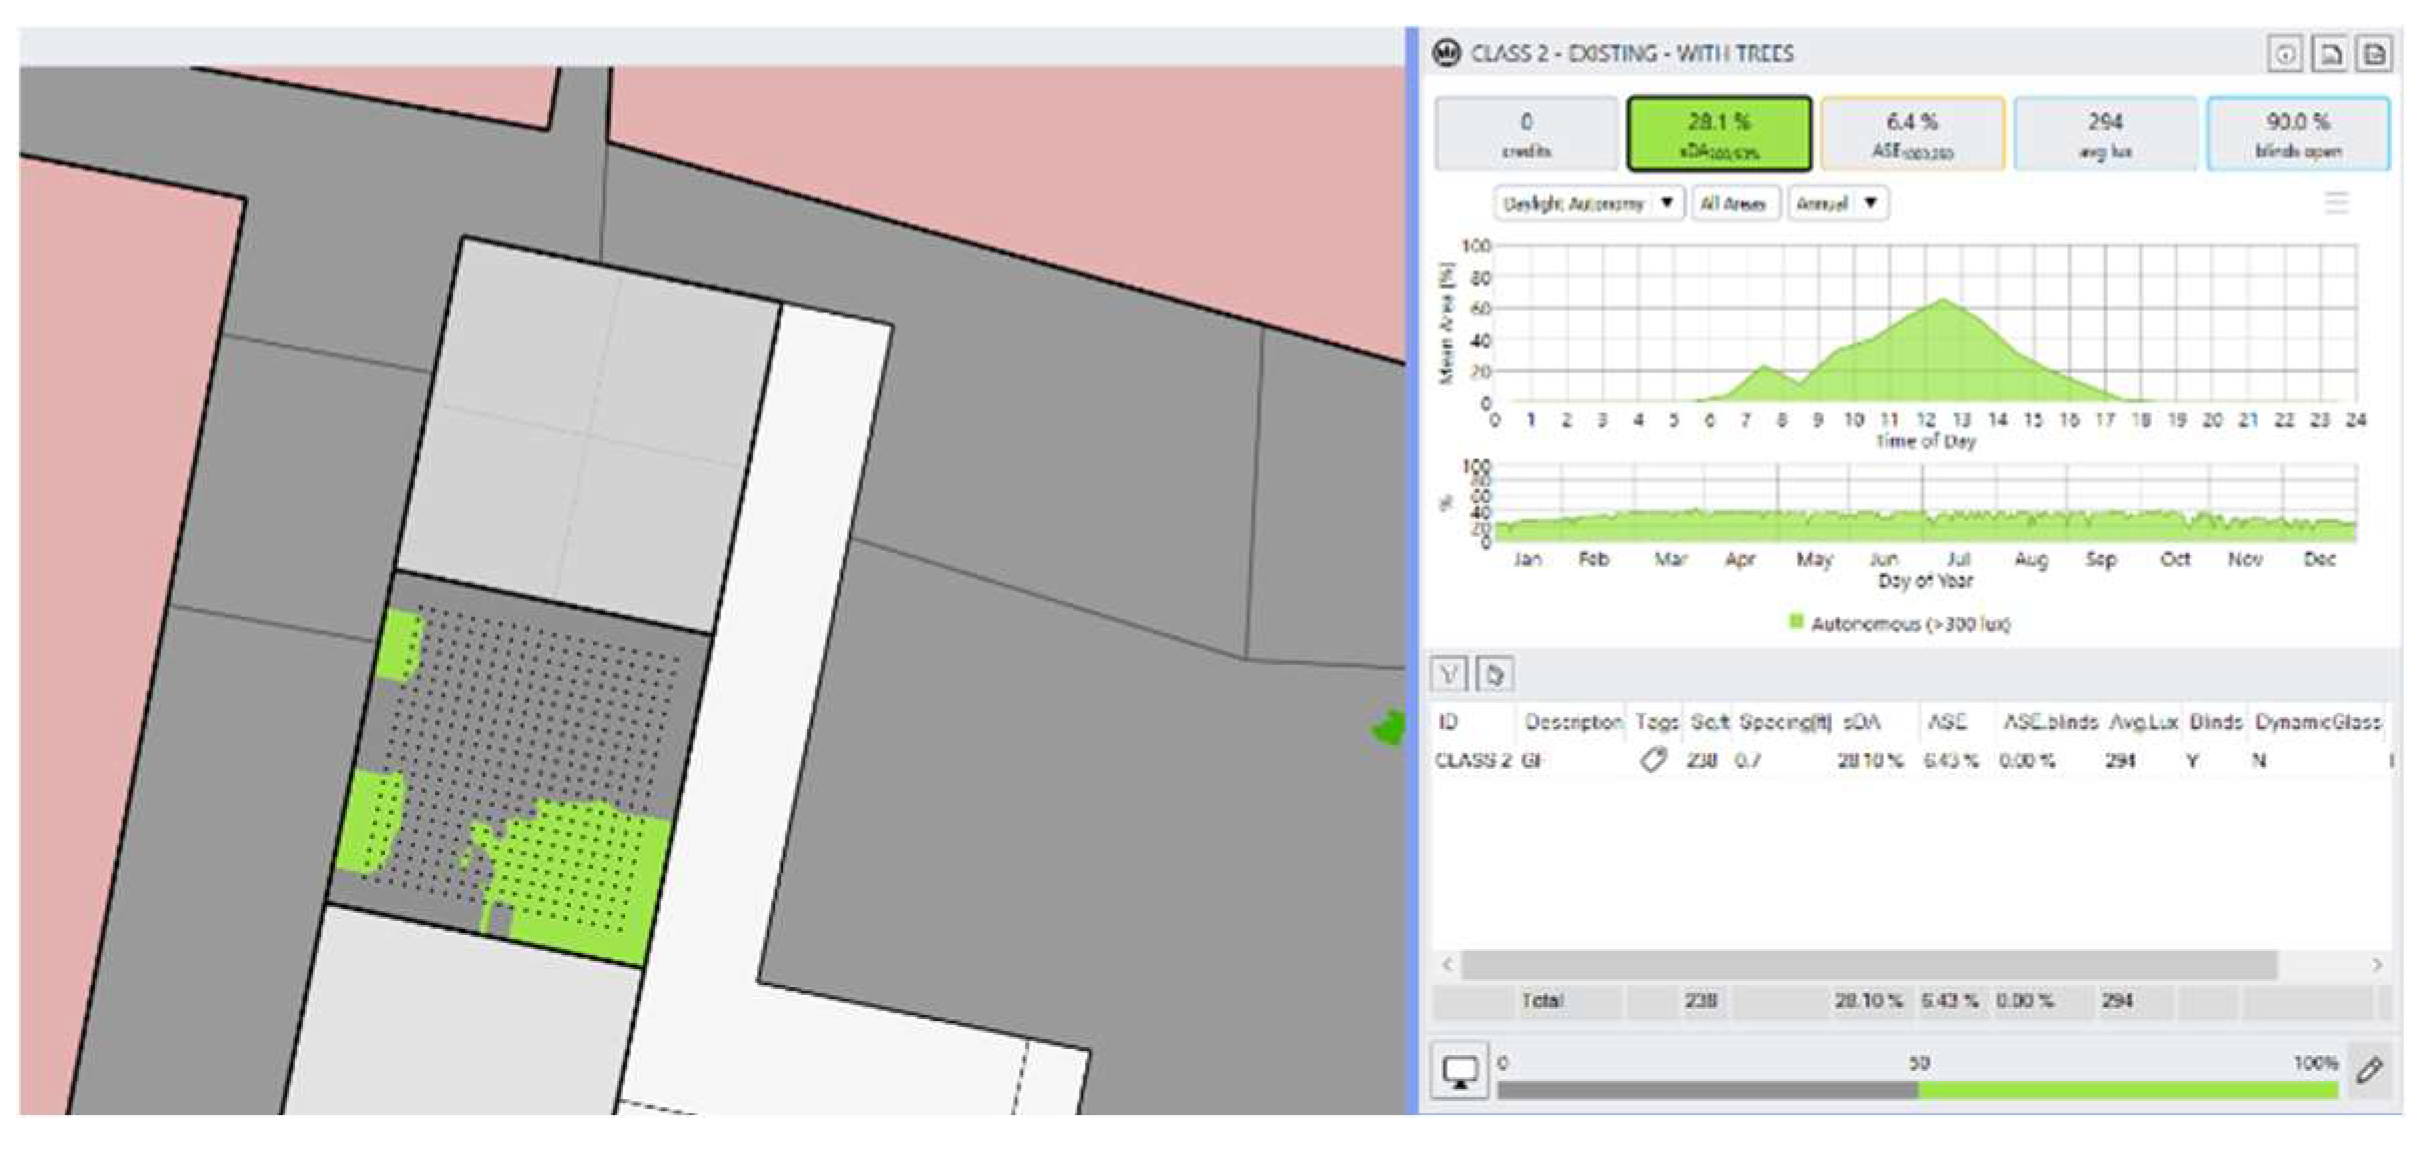
Some of the windows are kept closed in certain classrooms. Classroom 2 (
Figure 12) located on the ground floor, features an adjoining corridor that is 1.6 meters wide and includes an overhang on the eastern side.
Table 2.
Classroom 2 details from field measurements.
Table 2.
Classroom 2 details from field measurements.
| Classroom 2 Data from field measurements |
| Block |
Class |
Floor |
Length (m) |
Breadth (m) |
Area (m2) |
WWR (%) |
Illuminance lux (min) |
Illuminance
lux (max)
|
| North-south |
5 |
First |
6.4 |
4.4 |
28.16 |
8%
|
20 |
2000 |
| East-west |
7 |
First |
4.8 |
4.6 |
22.08 |
5%
|
30 |
467 |
| East-west |
2 |
Ground |
4.7 |
4.7 |
22.09 |
7%
|
20 |
596 |
| North-south |
3 |
Ground |
4.4 |
3.1 |
13.64 |
8%
|
15 |
37 |
| North-south |
4 |
Ground |
4.5 |
2.3 |
10.35 |
11%
|
60 |
440 |
The windows on the western wall are typically kept closed to ensure privacy and reduce noise and odors from nearby residences that are 3.2 m away. Notably, only the east-west block of the school has a shorter distance to adjacent buildings. Similarly, the windows along the corridors are often shut, especially in the afternoons, to minimize heat and also the noise from the playground.
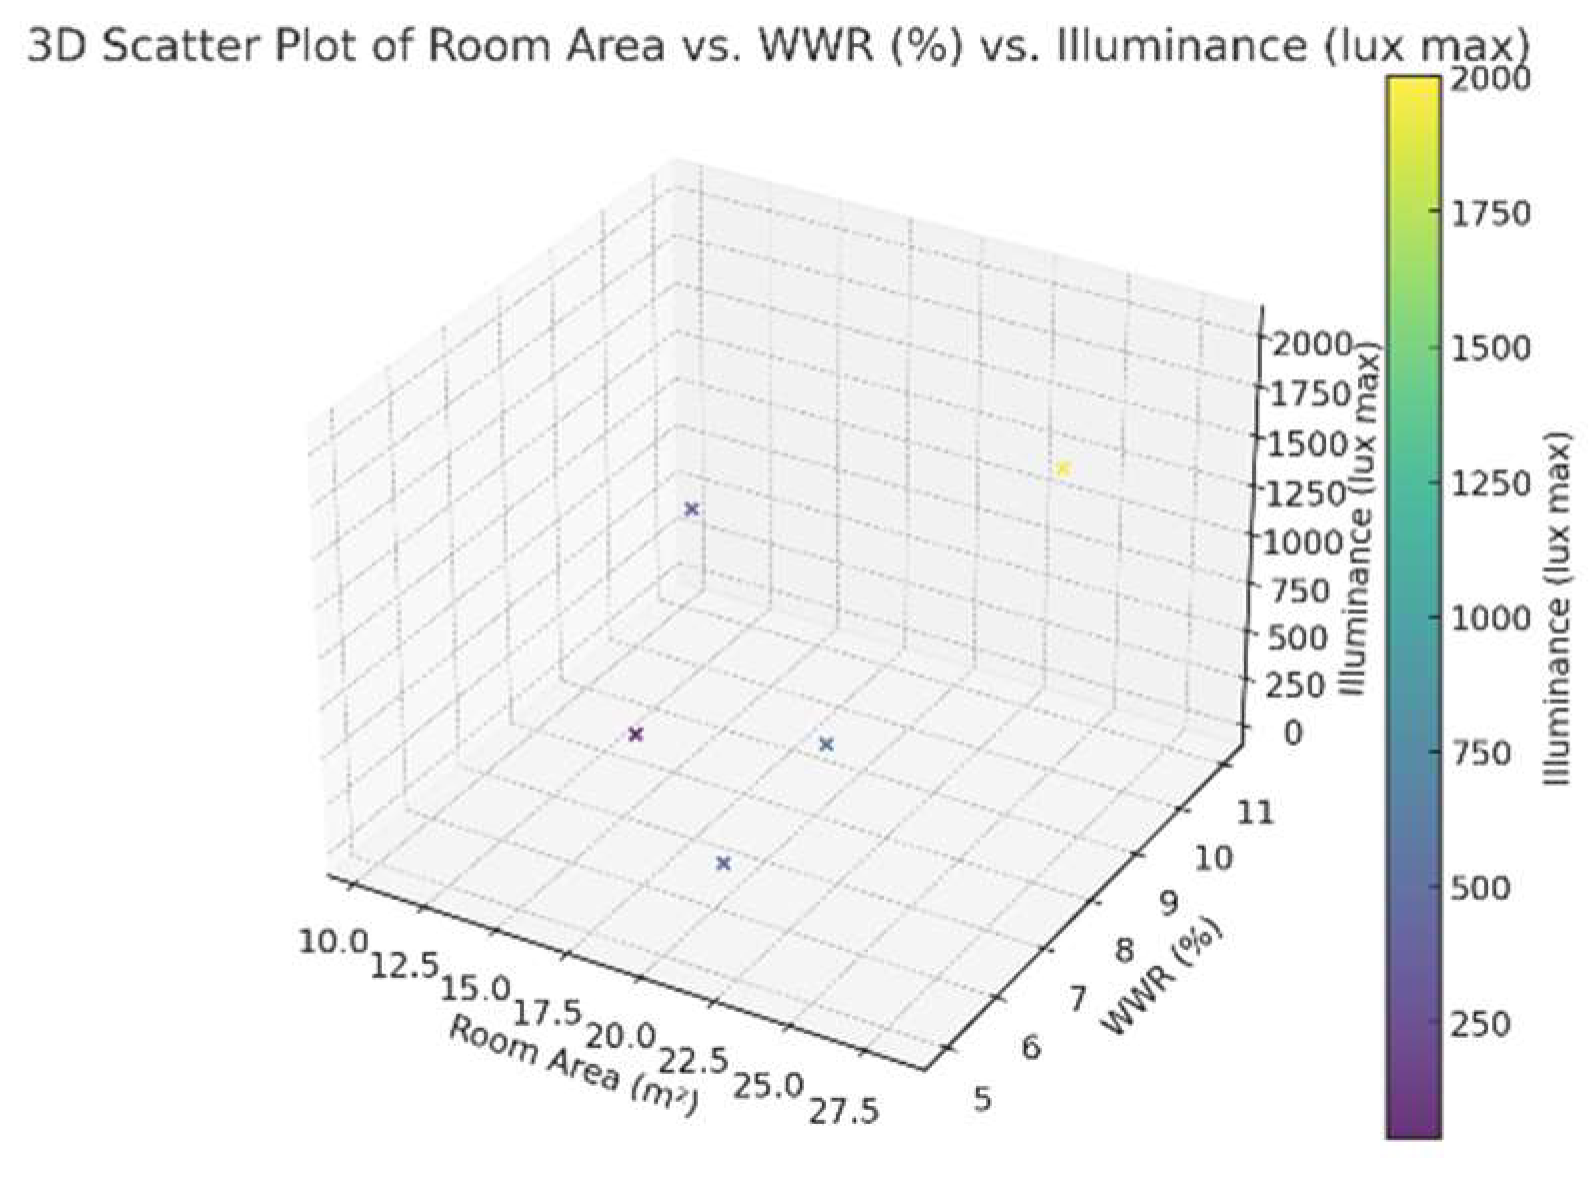
2.6.6. Room Area vs WWR vs Illuminance
Multivariable Relationship: The 3D scatter plot
Figure 13 visualizes the correlation between room area (m
2), window-to-wall ratio (WWR %), and maximum illuminance (lux). The data points suggest a nonlinear relationship, indicating that both room area and WWR affect daylight availability in a complex manner.
Higher WWR % values tend to correspond with increased illuminance levels, confirming that larger window-to-wall ratios allow more daylight penetration. Larger room areas seem to contribute to higher illuminance values, but this trend is inconsistent, suggesting potential influences from factors such as window orientation, glazing type, or light reflectance within the space.
2.6.7. Illuminance Distribution by Orientation
Statistical Spread & Variability
Figure 14: The North-South orientation exhibits a significantly larger interquartile range (IQR), suggesting high variability in illuminance values. The East-West orientation, on the other hand, demonstrates a more compact IQR, indicating a more consistent and predictable distribution of light levels. The median illuminance in the North-South orientation is considerably higher than that of the East-West orientation, implying greater daylight penetration in this orientation. However, due to the wider spread, North-South orientation experiences fluctuations in illuminance levels, which may impact the uniform daylight distribution.
2.6.8. Illuminance in the Classrooms Facing North-South
The classroom in the north-south block, Class 5 (First Floor) has an extremely high illuminance level (2000 lux), despite having a WWR of only 8%. This could be due to direct sunlight exposure or better external lighting conditions. Class 7 and Class 2 show a more balanced illuminance range (467–596 lux) with WWR values between 5-7%. These values align more closely with recommended classroom lighting (300-500 lux). The lower lux levels on the ground floor indicate shading effects from the ceiling (1.6 m wide) of the corridors and also the stage next to the corridor. There is no predominant vegetation on the site except for a few trees.
The North-South orientation shows a wider range of illuminance with extreme values, including a very high illuminance (~2000 lux). This suggests that direct sunlight exposure is more variable in North-South rooms. The East-West orientation shows lower and more consistent illuminance levels. This could be due to reduced direct sunlight penetration, possibly because of shading or indirect daylight.
2.6.9. Illuminance in Classrooms Having Different Sizes
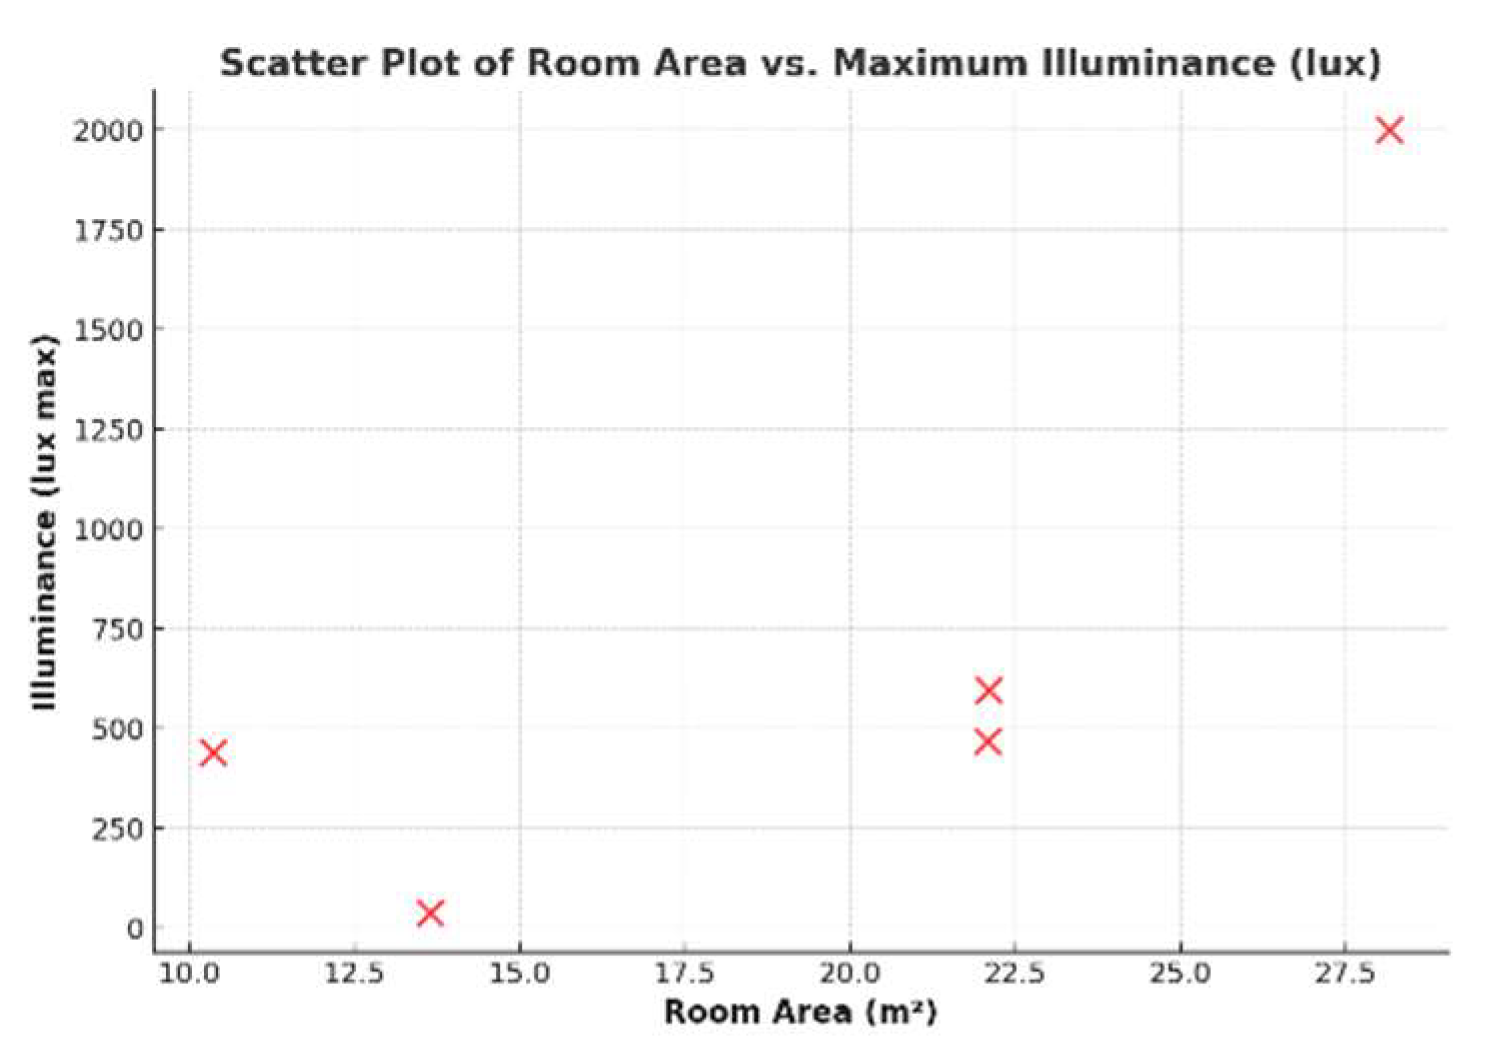
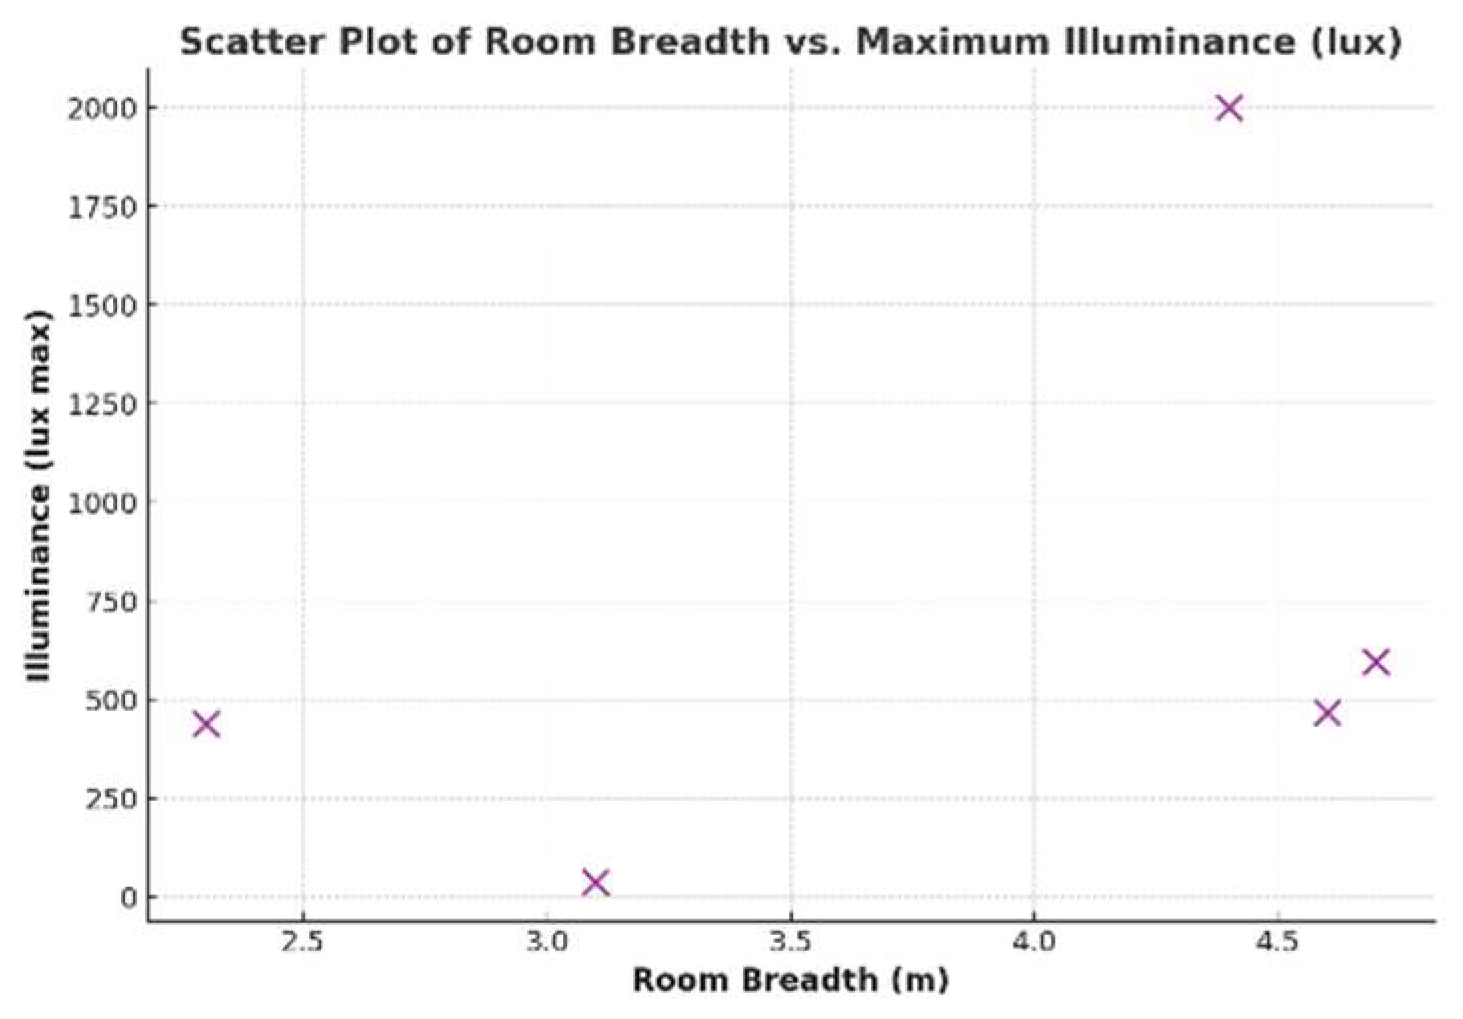
The plot
Figure 15 shows no clear trend indicating that larger rooms consistently receive more or less light. Illuminance varies significantly across different room sizes, suggesting other influencing factors like window placement, orientation, and external obstructions. The data does not show a clear trend indicating that increasing room breadth directly affects illuminance
Figure 16. Some rooms with similar breadths (~4.4 to 4.7 m) have widely varying illuminance levels. The highest illuminance (~2000 lux) appears for a 4.4m wide room, which may suggest direct sunlight exposure in that particular case.
By linear proportion scaling projection, assuming all the classrooms had 20% WWR, theoretically, we find that, for the North-South Block, Class 5 the illuminance (originally 2000 lux) is projected to reach 5000 lux, which could be excessively bright, and the North-South Block, Class 4 increased from 440 lux to ~800 lux, aligning with recommended lighting levels. This was checked with the digital model of the same condition and simulated other parameters in the virtual environment.
Figure 17.
Classroom 2 and classroom 7-plan and section.
Figure 17.
Classroom 2 and classroom 7-plan and section.
From the field data, a projection (
Table 3) was done to check the illuminance when WWR is set to 20% but, the values obtained were alarmingly high. These values would help understand the difference when it is computational simulation is done with other conditions.
3. Digital Modeling and Simulation
To supplement the field study, digital models of the selected classrooms were created using Rhinoceros 8 software, incorporating Ladybug, Grasshopper, and Climate Studio plugins. The window sizes and window-to-wall ratios (WWR) varied across classrooms. For the simulation, different parameters were analyzed, including WWR values of 20%, 40%, and 60%, sunshade depths ranging from 0 to 0.75 meters, and the presence or absence of trees on-site.
The study focused on evaluating illuminance levels (average minimum and maximum), Annual Sun Exposure (ASE), and Spatial Daylight Autonomy (sDA) for climate-based daylight modeling (
Table 4).
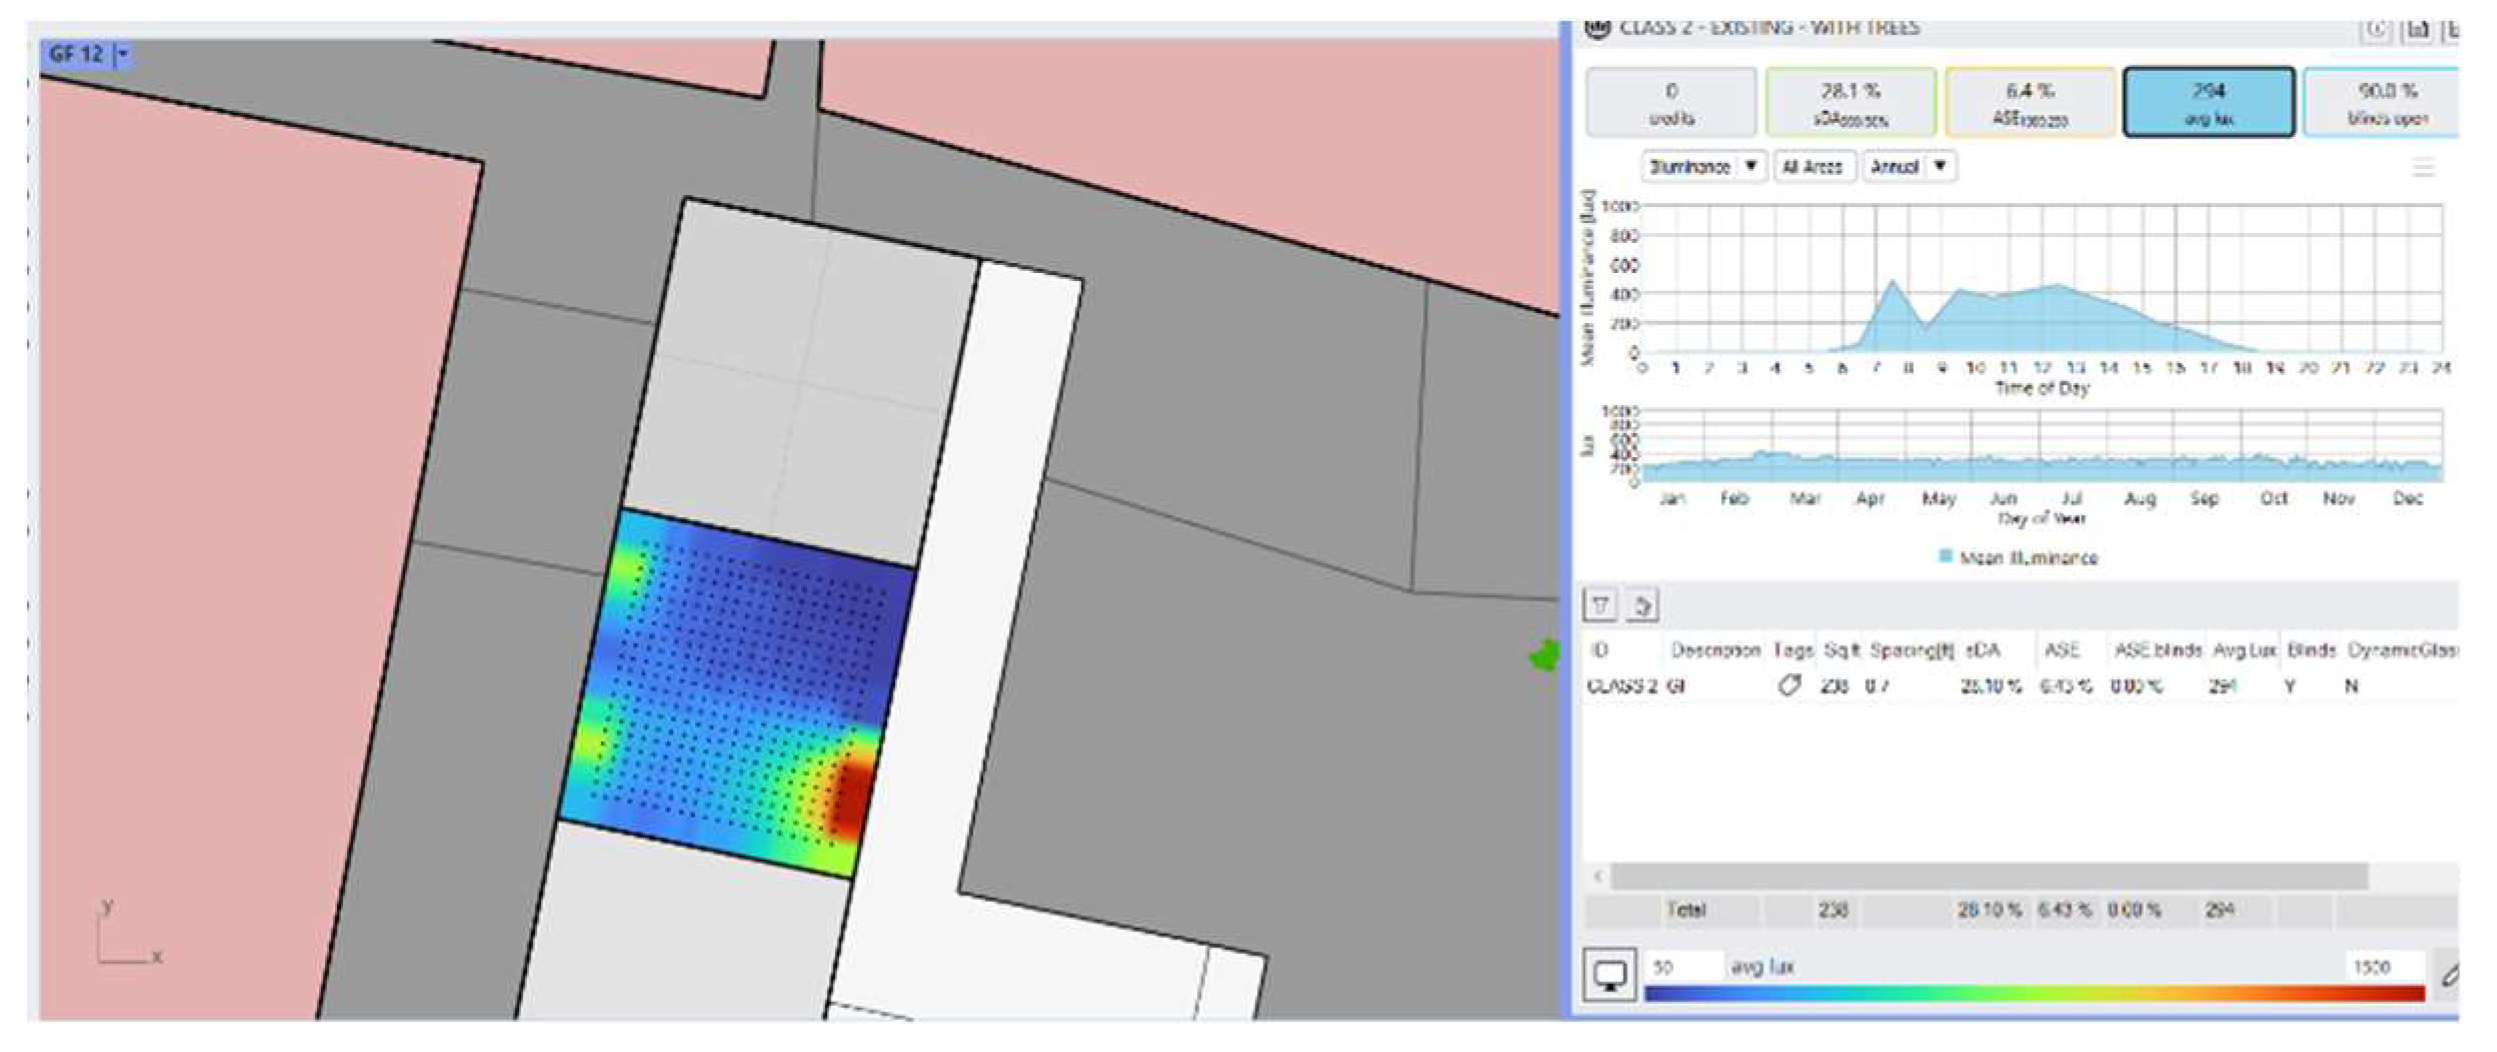
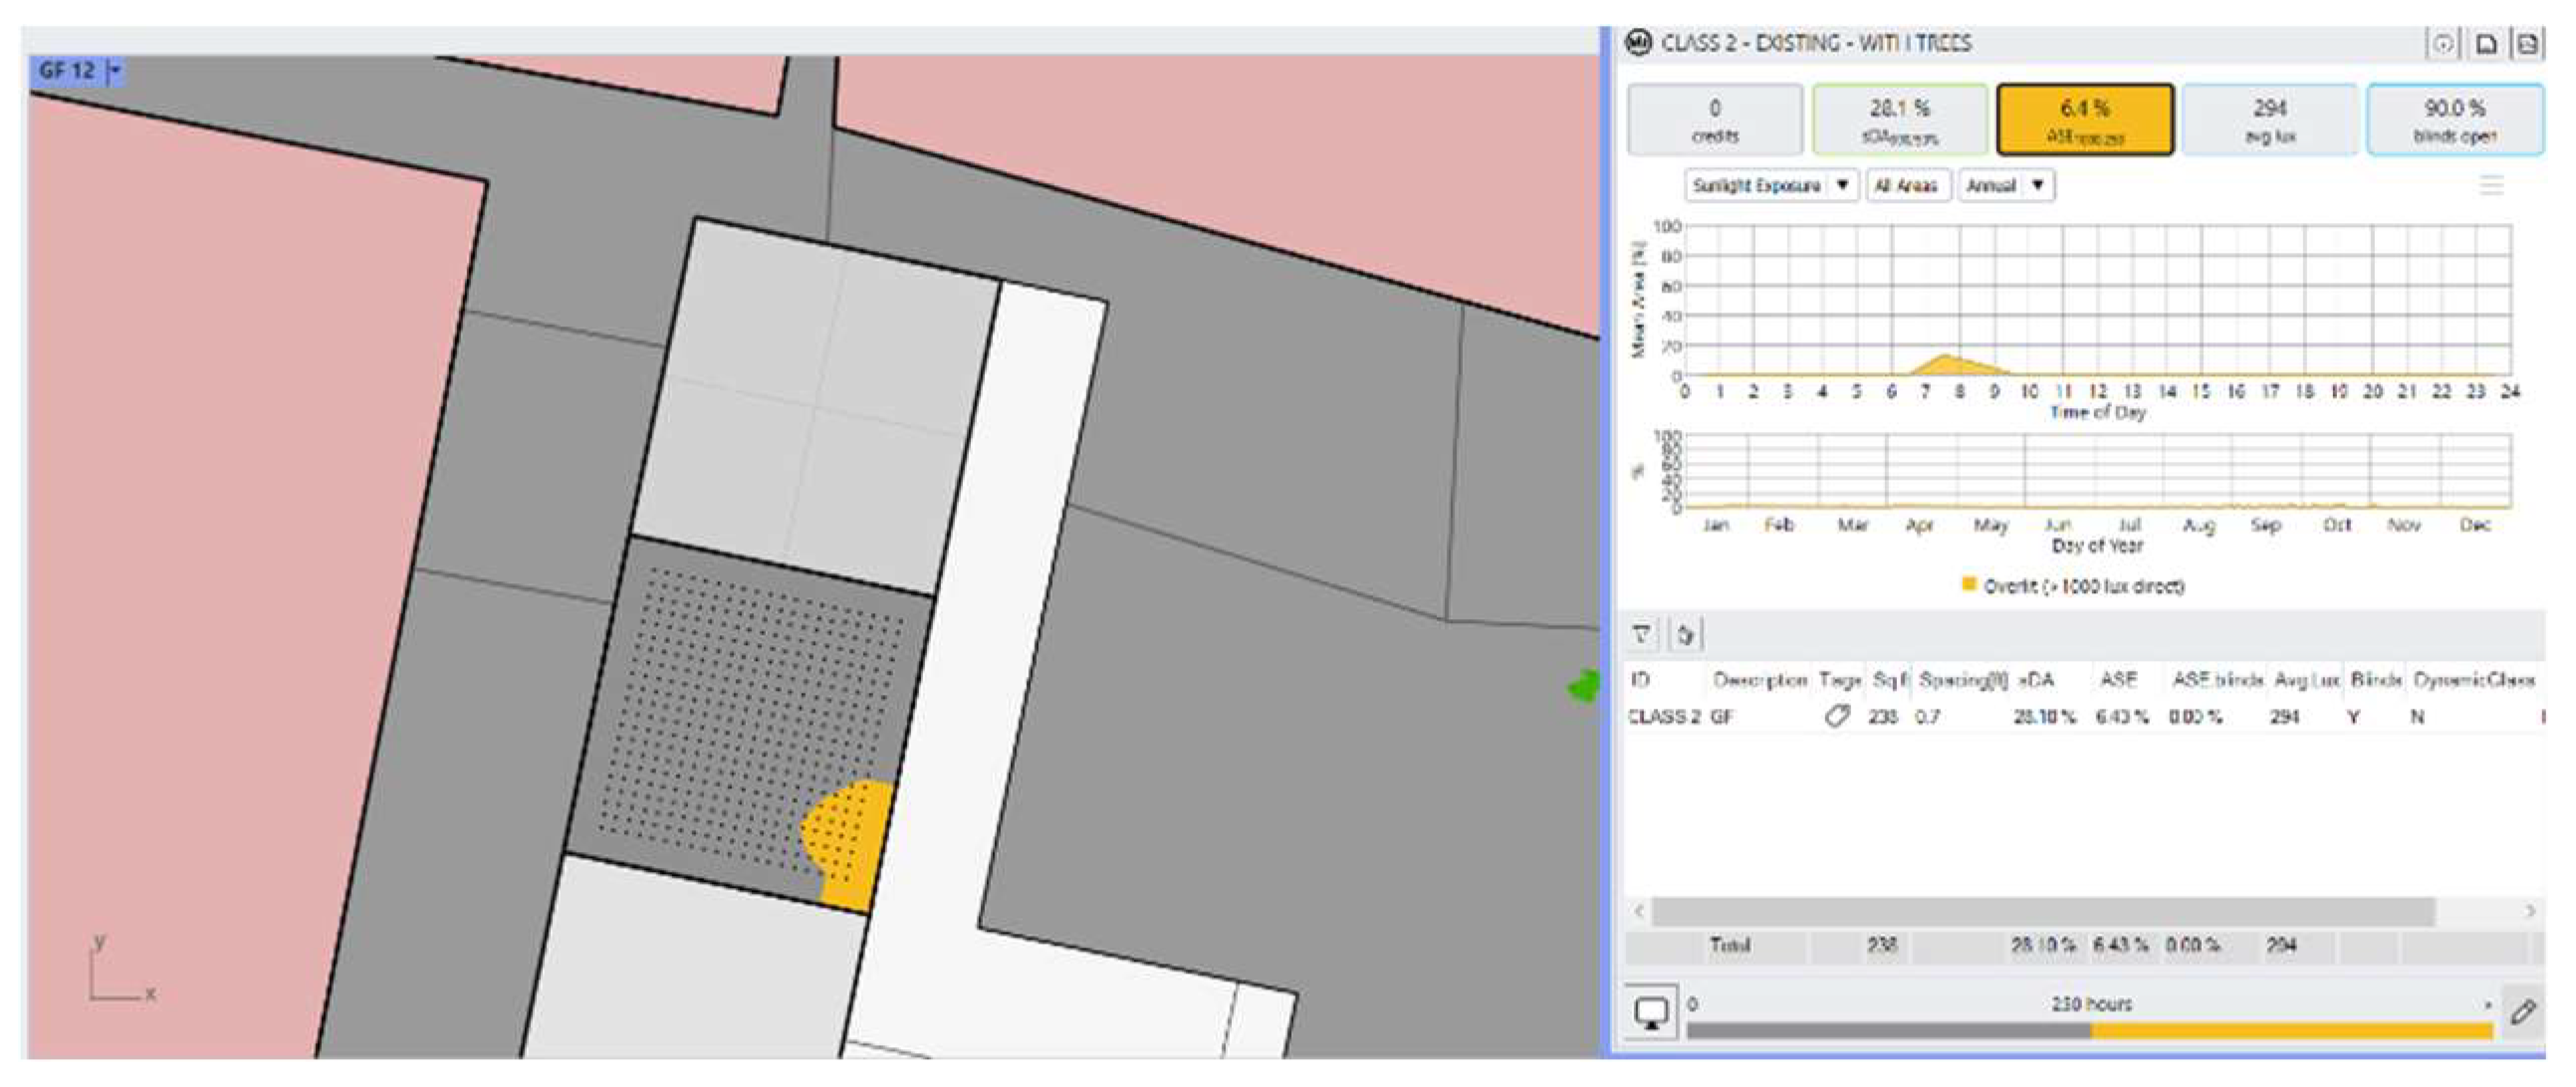
Illuminance is a photometric measure that quantifies the amount of light falling on a surface, expressed in lux. In educational institutions, a minimum illuminance level of 300 lux on the horizontal work plane is required to ensure adequate visual comfort and learning efficiency Spatial Daylight Autonomy (sDA) defines the percentage of floor area that receives a minimum of 300 lux for at least 50% of the annual occupied hours (8 AM–6 PM) on the horizontal work plane (typically 30 inches above the floor). It is expressed as a percentage [
23].
Alwetaishi and Mamdooh investigated the impact of WWR on energy load in school buildings in different climate zones. They recommend the maximum WWR for North facing wall in hot and humid Abha should be 40%, and 35% for south and east facing walls [
12].
3.1. Case 1: Same Orientation Versus Different Floor, Varying WWR, with and Without Trees
Classroom 5, with a WWR of 20% to 60%, experiences illuminance levels ranging from 1021 to 2041 lux, which may lead to glare issues. In contrast, Classroom 4, with a 20% WWR and the presence of trees, maintains a more balanced illuminance of 678 lux
Table 5. This highlights the need to optimize the WWR for Classroom 5 on the first floor to ensure better daylight control and reduce glare.
3.2. Case 2: Theoretical Projection vs. Simulated Results
By linear proportion scaling projection for 20% WWR for classroom 5, the maximum illuminance went high up to 5000 lux, whereas, in the simulation modeling (with and without trees), the average illuminance is below 1200 lux.
3.3. Case 3: Classrooms on the Same Floor but Different Orientations
Both classrooms 2 and 3 are located on the ground floor; while classroom 2 faces east, classroom faces north. They have been chosen to evaluate the effect of WWR, orientation, and sunshade depth on illuminance.
From the field measurement, classroom 2 (East-West) has a higher potential for daylight access but suffers from uneven lighting (large difference between max and min lux). Classroom 3 (North-South) maintains a more balanced daylight distribution, possibly due to more stable lighting conditions from indirect daylight.
3.4. Case 4: Classrooms on the Same Floor, Same Orientation and Different Sunshade Depth
When there is no sunshade, sDA is more pronounced in classroom 3 (93.9%) but ASE is above 10%, which is not good for visual comfort
Table 6. The ideal condition is when the sunshade depth is 0.75 m, sDA is 91.2% and ASE is only 1.3%.
For Classroom 2, the optimal condition is achieved with a 0.6m sunshade, resulting in an sDA of 56.7% and an ASE of 7.6%. Notably, the ASE remains unchanged across all three conditions for this classroom
Table 7. Simulations with varying WWR and sunshade depths indicate a significant increase in average illuminance for both orientations. For Classroom 2 with a 20% WWR, both 0.6m and 0.75m deep sunshades appear to be viable options. However, in Classroom 3, the illuminance levels are excessively high under all conditions. This suggests the need for distinct shading device strategies or the presence of trees to mitigate glare and optimize illumination levels.
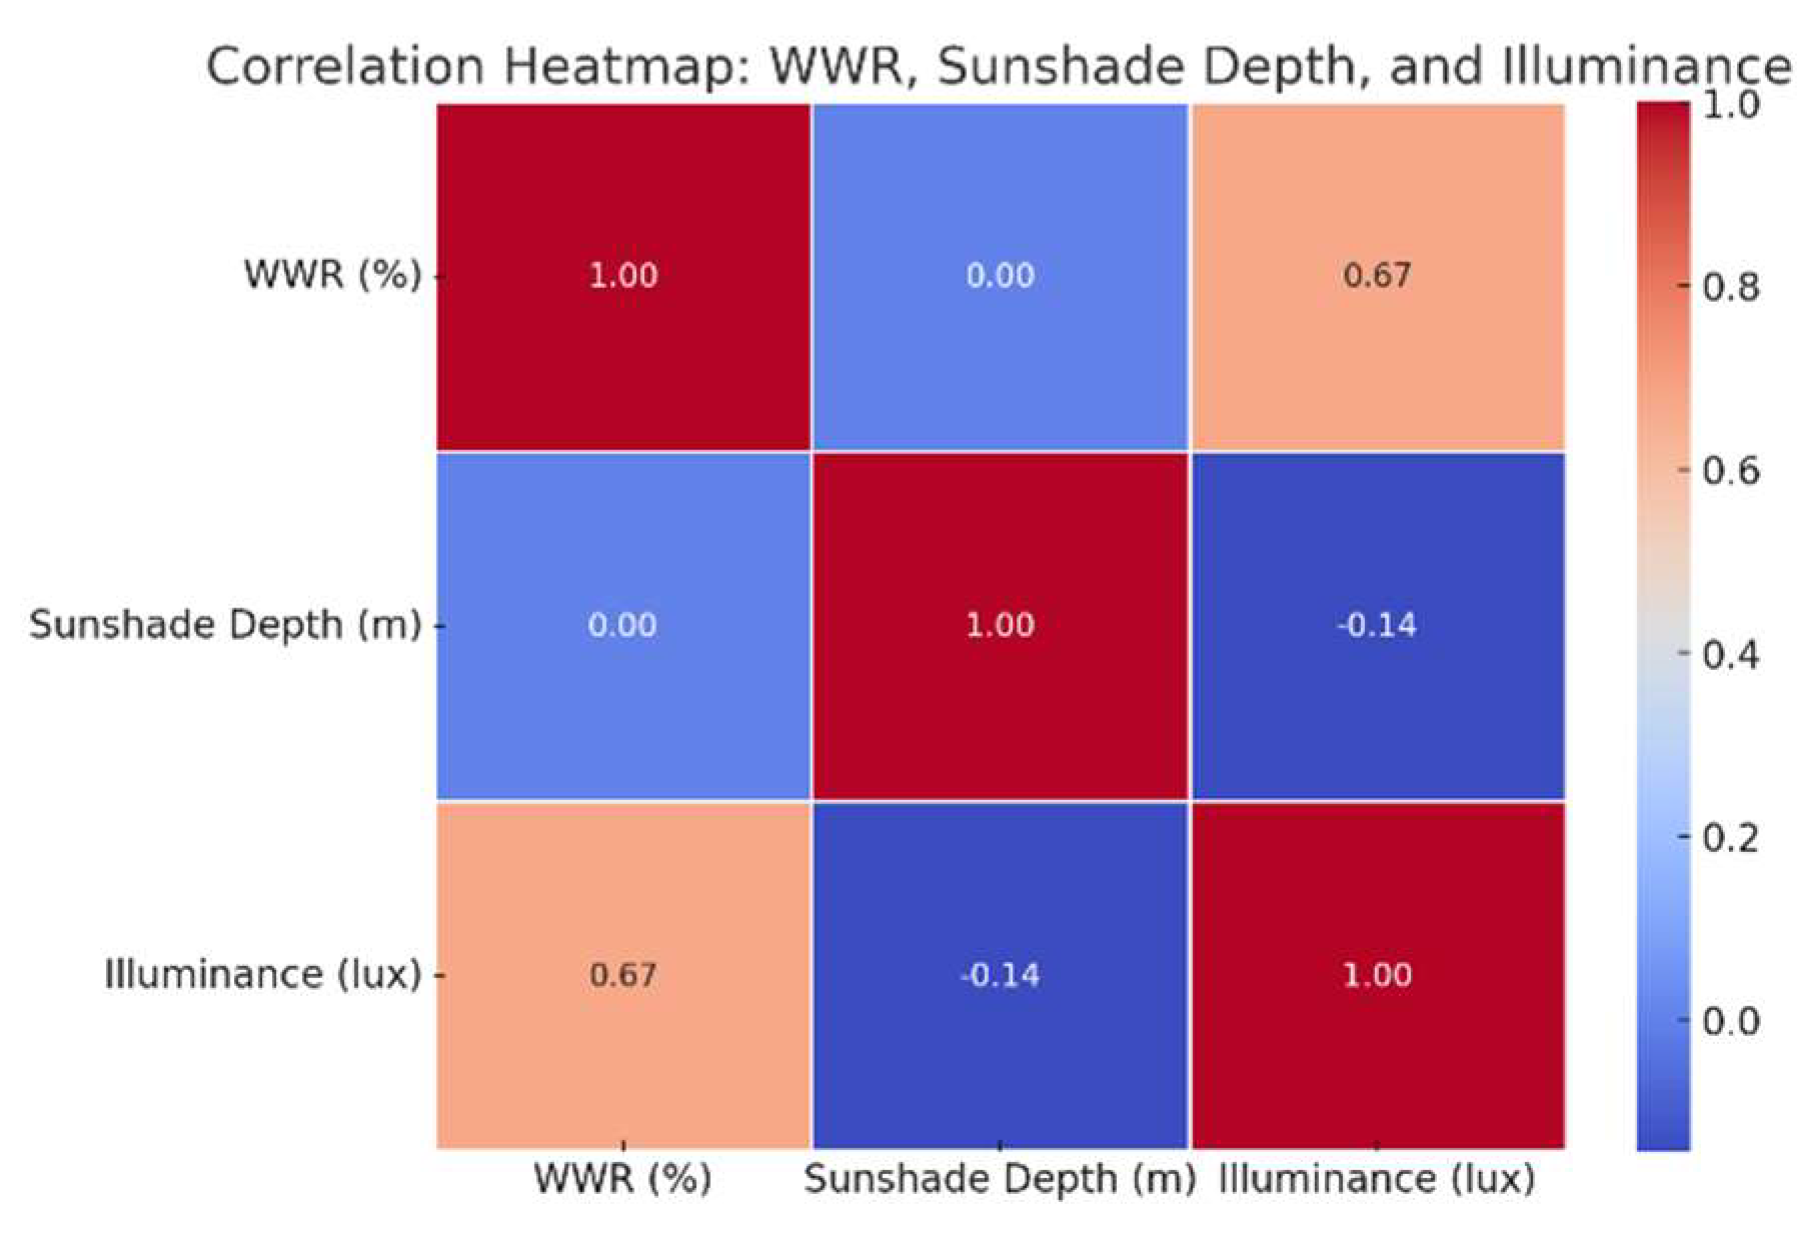
The correlation heat map
Figure 18 reveals a strong positive correlation (+0.98) between WWR and Illuminance, confirming that increasing WWR substantially enhances daylight levels. Additionally, there is a moderate negative correlation (-0.88) between Sunshade Depth and Illuminance, indicating that deeper sunshades reduce daylight penetration, though their impact is slightly less pronounced compared to the influence of WWR.
3.5. Case 5: Classrooms on the Same Floor, Different Orientations, and WWR
Classroom 3 (North-Facing) consistently records higher illuminance values than Classroom 2 (East-Facing) across all conditions
Table 8. High WWR (60%) leads to excessive daylight (1058-1688 lux), which can cause glare and discomfort. At 20% WWR, Classroom 2 has a more controlled daylight range, making it more suitable for optimal lighting conditions.
3.6. Case 6: Optimization for Expected 500 Lux Average Illuminance in East-West and North-South Facing Classrooms on the Ground Floor
Without trees, illuminance increases from 1119 lux (WWR 20%) to 2041 lux (WWR 60%).40% WWR provides a good balance (~1508-1647 lux), avoiding over-illumination. 60% WWR would require shading or diffused glazing to prevent excessive daylight and glare (
Table 9).
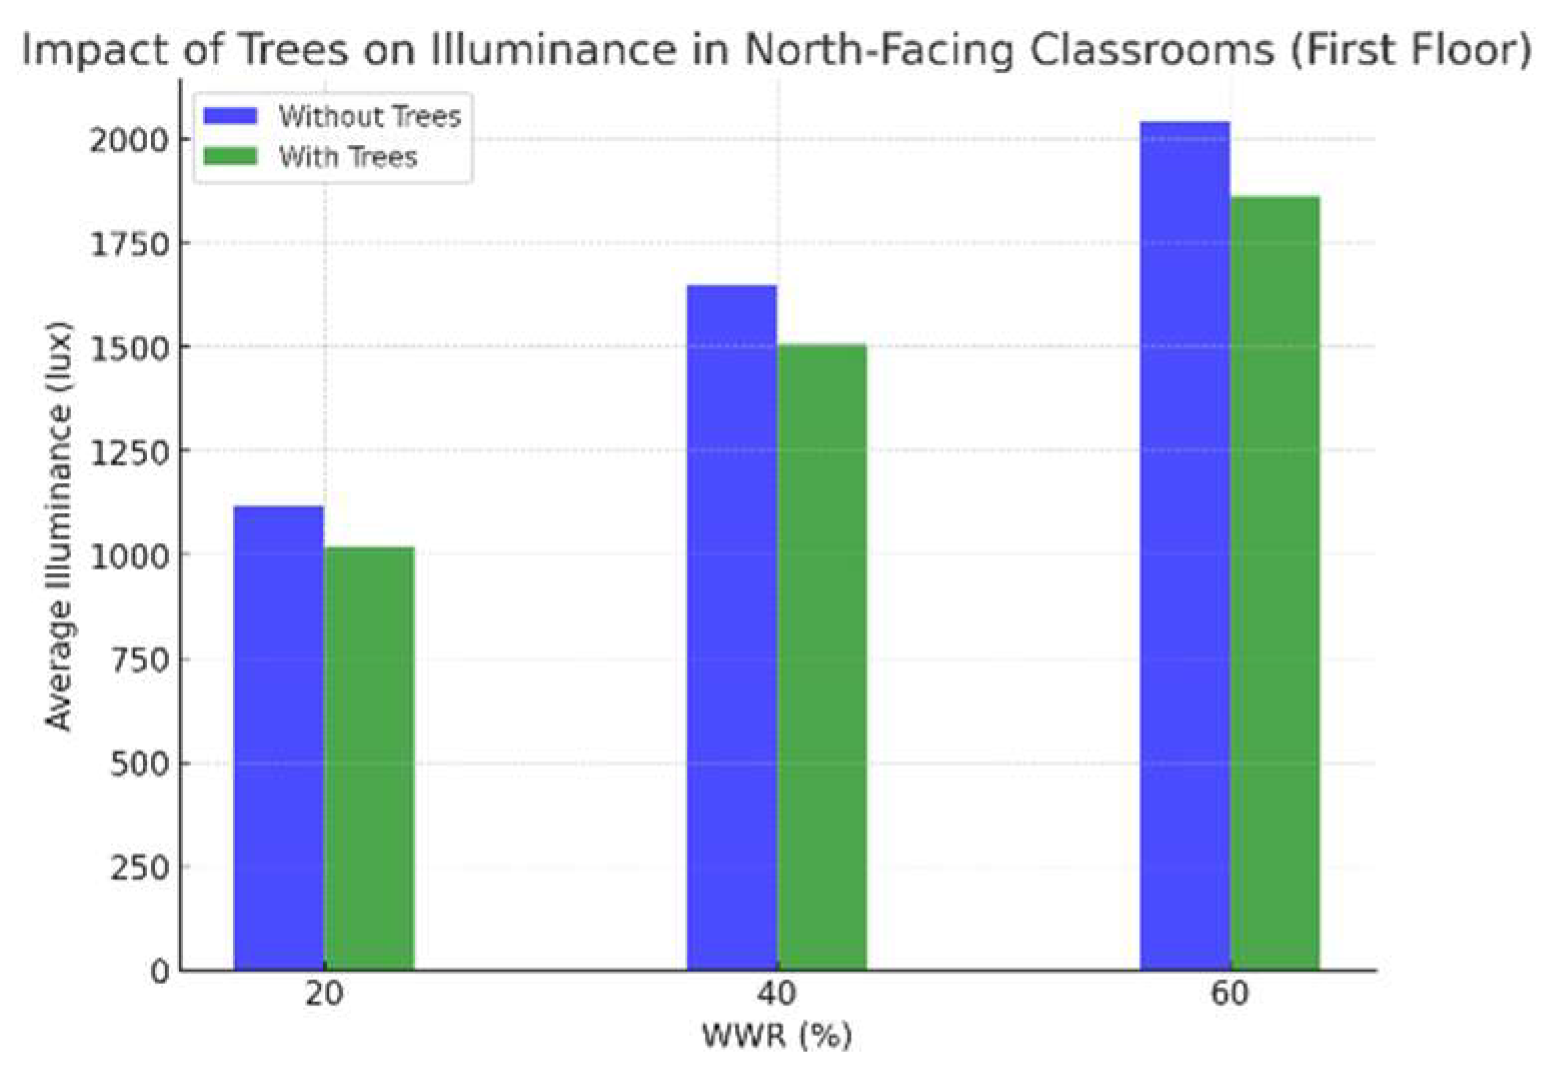
3.7. Impact of Trees on Illuminance
Even with the presence of trees, an increase in the window-to-wall ratio (WWR) results in higher illuminance levels. For instance, a WWR of 60% with trees (1863 lux) still provides more daylight than a WWR of 40% without trees (1647 lux).
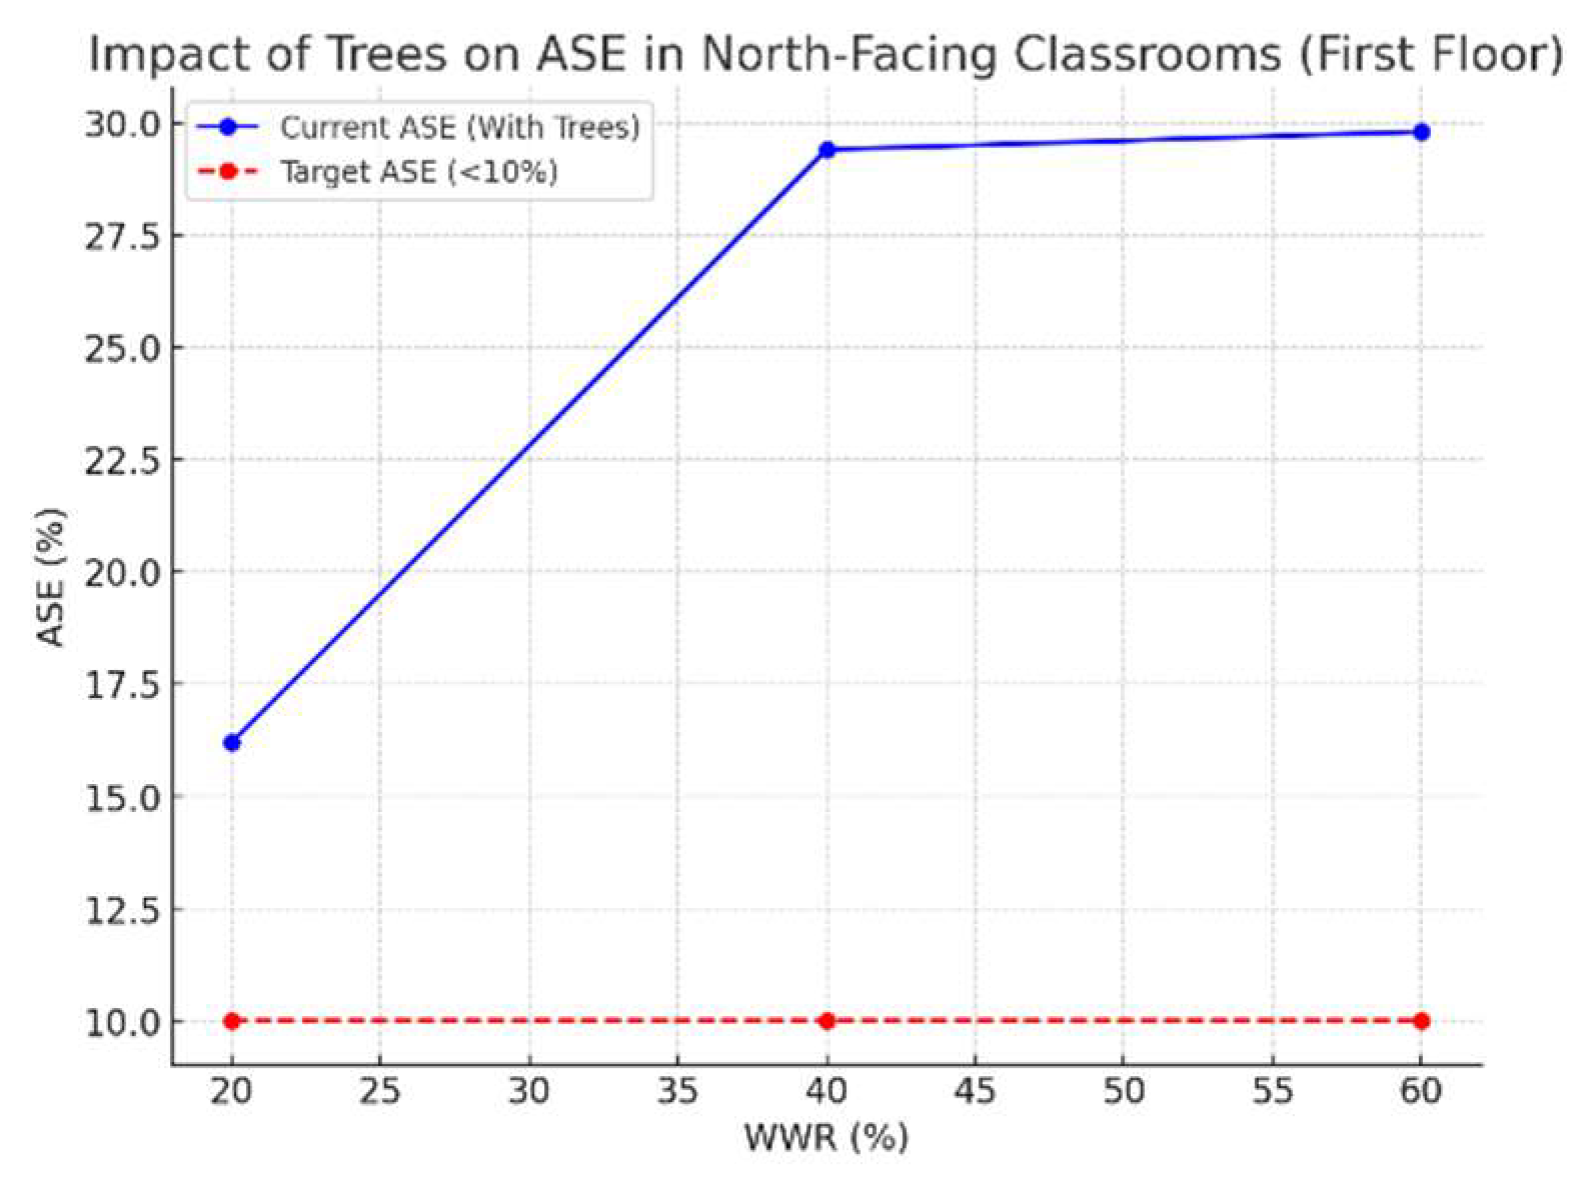
Similarly, Annual Sunlight Exposure (ASE) rises from 16.2% at WWR 20% to 29.8% at WWR 60%, demonstrating that larger window areas permit greater direct sunlight penetration despite the shading effects of trees
Figure 19. However, none of the WWR conditions achieve the target ASE threshold of less than 10%, indicating excessive sunlight exposure. To meet this standard, WWR values of 40% and 60% would require over a 66% reduction in direct sunlight penetration, emphasizing the need for strategic shading solutions such as deeper sunshades or diffused glazing
Figure 20.
4. Results and Conclusion
4.1. Classroom Orientation
North-South classrooms (e.g., Class 5, Class 4) exhibit higher variations in illuminance levels, while East-West classrooms (e.g., Class 2, Class 7) maintain stable and balanced daylight conditions, making them more suitable for classrooms.
4.2. Window-to-Wall Ratio (WWR)
For North-South facing classrooms, the optimal WWR could be 18%-24% to prevent excessive illuminance (e.g., Class 5 exceeding 2000 lux), and for East-West facing classrooms, optimal WWR: 25%-30%, as it allows sufficient daylight without excessive glare (e.g., Class 2 & 7 having 467–596 lux).
4.3. For Classrooms Without Trees
The WWR (Window-to-Wall Ratio) should not exceed 40% to avoid excessive daylight. For instance, a 60% WWR can result in illuminance levels exceeding 1500 lux.
4.4. Sunshade Depth
For North-South oriented classrooms, a minimum sunshade depth of 0.75m to 1m is recommended to reduce illuminance from extreme levels (e.g., from ~2000 lux to below 500 lux). For East-West oriented classrooms, a sunshade depth of 0.6m to 0.75m can achieve balanced lighting (around 500 lux) while reducing Annual Solar Exposure (ASE) to acceptable levels.
4.5. Vegetation and External Shading
The presence of trees significantly reduces glare and allows for a slightly higher WWR while maintaining appropriate daylight levels. Classrooms with trees can have 5% higher WWR than those without while maintaining ideal illuminance levels (~500 lux or 300 lux as required).
4.6. Glazing and Diffused Light Control
Classrooms with high Annual Solar Exposure (ASE > 10%) and high WWR conditions (above 40%), should integrate dynamic shading solutions to enhance visual comfort.
5. Limitations and Scope for Further Research
This study has not taken the other daylight metrics like daylight factor, and surface reflectance of different colors and materials in a classroom into account for simulation. There is scope for further research on thermal comfort, ventilation, energy analysis, and cost factors to achieve optimization. This study is limited to evaluating the Window-to-Wall Ratio (WWR) and its impact on Spatial Daylight Autonomy (SDA) and Annual Sun Exposure (ASE), as well as the influence of site vegetation on illuminance levels. It is important to note that WWR need not be uniform across all facades in any building typology. A clear understanding of obstructions, landscape features, and surrounding context is essential for effective daylight design
Funding
This research received no external funding.
Acknowledgments
The authors sincerely thank the school management for granting permission for the research.
Abbreviations
| ASE |
Annual Sun Exposure |
| sDA |
Spatial daylight autonomy |
| WWR |
Window -to-wall ratio |
| DF |
Daylight factor |
| IESNA |
Illuminating Engineering Society of North America |
| Avg - |
Average |
| IS |
Indian Standards |
| BIS |
Bureau of Indian standards |
Appendix A
Simulation on Rhinoceros with ClimateStudio
Figure A1.
Simulation in Rhinoceros 8 Spatial daylight autonomy for classroom 2.
Figure A1.
Simulation in Rhinoceros 8 Spatial daylight autonomy for classroom 2.
Figure A2.
Simulation in Rhinoceros 8 Illuminance spatial for classroom 2.
Figure A2.
Simulation in Rhinoceros 8 Illuminance spatial for classroom 2.
Figure A3.
Simulation in Rhinoceros 8 Annual sun exposure ASE for classroom 2.
Figure A3.
Simulation in Rhinoceros 8 Annual sun exposure ASE for classroom 2.
References
- Devadas, Monsingh D., and A. Lilly Rose. “Urban factors and the intensity of heat island in the city of Chennai.” In The seventh international conference on urban climate, vol. 29. 2009.
- SUSTAINABLE BUILDING DESIGN FOR TROPICAL CLIMATES Principles and Applications for Eastern Africa First published in Nairobi in August 2014 by UN-Habitat. Copyright © United Nations Human Settlements Programme 2014 HS/013/15E ISBN: 978-92-1-132644-4.
- A David C. Holzman T What’s in a Color? The Unique Human Health Effects of Blue Light-D 2010-J Environmental Health Perspectives-P A22-A27-V 118-N 1-R. [CrossRef]
- Gessler, Arthur & Bugmann, Harald & Bigler, Christof & Edwards, Peter & Guistina, Christina & Kueffer, Christoph & Roy, Jacques & Resco de Dios, Víctor. (2017). Light as a source of information in ecosystems.
- Veitch, J. A. (2001). Psychological processes influencing lighting quality. Journal of the Illuminating Engineering Society, 30(1), 124-140. [CrossRef]
- Dong L, Kang YK, Li Y, Wei WB, Jonas JB. PREVALENCE AND TIME TRENDS OF MYOPIA IN CHILDREN AND ADOLESCENTS IN CHINA: A Systemic Review and Meta-Analysis. Retina. 2020 Mar;40(3):399-411. PMID: 31259808. [CrossRef]
- Knoop M, Stefani O, Bueno B, et al. Daylight: What makes the difference? Lighting Research & Technology. 2020;52(3):423-442. [CrossRef]
- Qaiser Suleman; Ishtiaq Hussain “Effects of Classroom Physical Environment on the Academic Achievement Scores of Secondary School Students in Kohat Division, Pakistan” International Journal of Learning & Development ISSN 2164-4063 2014, Vol. 4, No. 1.
- Shouib Ma’bdeh;, Haneen Matar; Designing a dynamic fenestration to improve visual performance in educational spaces using daylight Periodicals of Engineering and Natural Sciences ISSN 2303-4521 Vol. 8, No. 3, September 2020, pp.1898-1910.
- Xin Liu, Yue Sun, Shuo Wei, Linlin Meng, Guanying Cao, Illumination distribution and daylight glare evaluation within different windows for comfortable lighting, Results in Optics, Volume 3,2021,100080,ISSN 2666-9501. [CrossRef]
- Dongying Li, William C. Sullivan, Impact of views to school landscapes on recovery from stress and mental fatigue, Landscape and Urban Planning, Volume 148, 2016, Pages 149-158, ISSN 0169-2046. [CrossRef]
- V.R.M. Lo Verso, F. Giuliani, F. Caffaro, F. Basile, F. Peron, T. Dalla Mora, L. Bellia, F. Fragliasso, M. Beccali, M. Bonomolo, F. Nocera, V. Costanzo, Questionnaires and simulations to assess daylighting in Italian university classrooms for IEQ and energy issues, Energy and Buildings, Volume 252, 2021,111433, ISSN0378-7788. [CrossRef]
- Alwetaishi, M.; Benjeddou, O. Impact of Window to Wall Ratio on Energy Loads in Hot Regions: A Study of Building Energy Performance. Energies 2021, 14, 1080. [CrossRef]
- Xin Zhang1, Jiangtao Du2, Steve Sharples3Ground Factors and Lighting Design in an Urban Area: Daylight Availability and Light Pollution Risk T2 - Proceedings of Building Simulation 2017: 15th Conference of IBPSA vol 15 ISSN - 978-1-7750520-0-5 C1 - San Francisco, USA J2 - Building Simulation SP - 793-801.
- Amrita Ghosh, Subhasis Neogi, Effect of fenestration geometrical factors on building energy consumption and performance evaluation of a new external solar shading device in warm and humid climatic condition, Solar Energy, Volume 169,2018,Pages 94-104,ISSN 0038-092X. [CrossRef]
- Amirhosein Ghaffarian hoseini, Umberto Berardi, Ali Ghaffarianhoseini, Thermal performance characteristics of unshaded courtyards in hot and humid climates, Building and Environment, Volume 87,2015,Pages 154-168,ISSN 0360-1323. [CrossRef]
- R N Syaheeza E M Husini F Arabi W N W Ismail M Z Kandar Secondary school classrooms daylighting evaluation in Negeri Sembilan, MalaysiaIOP Conference Series: Materials Science and Engineering vol. 401(2018) pp: 012024. [CrossRef]
- Rea, Mark S.. The IESNA lighting handbook: (2000}. https://api.semanticscholar.org/CorpusID:107139664.
- Gonidakis, D. N., Frangedaki, E. I., & Lagaros, N. D. (2024). Optimizing Daylight Performance of Digital Fabricated Adobe Walls. Architecture, 4(3), 515–540. [CrossRef]
- Ai, F. (2009). Reflected Daylighting in Schools An investigation into design principles of reflected daylighting in primary schools in the warm-dry climate of Iran. www.bl.uk.
- Reinhart, C. F., & Walkenhorst, O. (2001). Validation of dynamic RADIANCE-based daylight simulations for a test office with external blinds. Energy and Buildings, 33(7), 683–697. [CrossRef]
- Obralic, A., & Jeghel, S. (2021). The Case Study on Significance of Daylight in Classroom Setting at Sarajevo Campus. European Scientific Journal ESJ, 17(1). [CrossRef]
- Dalla Mora, T., Leorin, A., Nardo, G., Busatto, N., Peron, F., & Romagnoni, P. (n.d.). Daylight Performances in Typical Inner Spaces with Climate-Based Daylight Modelling Approach.
- Kweon, B. S., Ellis, C. D., Lee, J., & Jacobs, K. (2017). The link between school environments and student academic performance. Urban Forestry and Urban Greening, 23, 35–43. [CrossRef]
- Michael, A., & Heracleous, C. (2017). Assessment of natural lighting performance and visual comfort of educational architecture in Southern Europe: The case of typical educational school premises in Cyprus. Energy and Buildings, 140, 443–457. [CrossRef]
- Mohd Yazit, R. N. S. R., Husini, E. M., Khamis, M. K., Zolkefli, M. F., & Dodo, Y. A. (2020). Illuminance Level Measurement at Lower Working Plane Height in Islamic Religious School. Asian Journal of University Education, 16(3), 125–137. [CrossRef]
- Suleman, Q., Aslam, H. D., & Hussain, Dr. I. (2014). Effects of Classroom Physical Environment on the Academic Achievement Scores of Secondary School Students in Kohat Division, Pakistan. International Journal of Learning and Development, 4(1), 71. [CrossRef]
Figure 1.
Map of India Figure 2 Location of Ramapuram. (source: Maps of India).
Figure 1.
Map of India Figure 2 Location of Ramapuram. (source: Maps of India).
Figure 3.
Location of school (source: andrewmarsh.com).
Figure 3.
Location of school (source: andrewmarsh.com).
Figure 5.
Ground floor plan of the school.
Figure 5.
Ground floor plan of the school.
Figure 6.
First floor plan of the school.
Figure 6.
First floor plan of the school.
Figure 11.
Room area vs WWR vs Illuminance.
Figure 11.
Room area vs WWR vs Illuminance.
Figure 12.
Illuminance distribution by orientation.
Figure 12.
Illuminance distribution by orientation.
Figure 13.
Room area vs WWR vs Illuminance.
Figure 13.
Room area vs WWR vs Illuminance.
Figure 14.
Illuminance distribution by orientation.
Figure 14.
Illuminance distribution by orientation.
Figure 15.
Room area Vs Illuminance.
Figure 15.
Room area Vs Illuminance.
Figure 16.
Room breadth vs Illuminance.
Figure 16.
Room breadth vs Illuminance.
Figure 18.
Correlation heat map:WWR, sunshade depth and illuminance.
Figure 18.
Correlation heat map:WWR, sunshade depth and illuminance.
Figure 19.
Impact of trees on illuminance North facing rooms on the first floor.
Figure 19.
Impact of trees on illuminance North facing rooms on the first floor.
Figure 20.
Impact of trees on ASE -North facing classrooms -first floor.
Figure 20.
Impact of trees on ASE -North facing classrooms -first floor.
Table 1.
Classroom details from field measurements.
Table 1.
Classroom details from field measurements.
| Classroom size and respective illuminance in the site |
| Block |
Class |
Floor |
Length (m) |
Breadth (m) |
Area (m2) |
WWR (%) |
Illuminance lux (min) |
Illuminance
lux (max) |
| North-south |
5 |
First |
6.4 |
4.4 |
28.16 |
8%
|
20 |
2000 |
| East-west |
7 |
First |
4.8 |
4.6 |
22.08 |
5%
|
30 |
467 |
| East-west |
2 |
Ground |
4.7 |
4.7 |
22.09 |
7%
|
20 |
596 |
| North-south |
3 |
Ground |
4.4 |
3.1 |
13.64 |
8%
|
15 |
37 |
| North-south |
4 |
Ground |
4.5 |
2.3 |
10.35 |
11%
|
60 |
440 |
Table 3.
Projected illuminance from field study.
Table 3.
Projected illuminance from field study.
| Existing vs. projected Illuminance (without considering shading, window placement, and reflection properties) |
| Block |
Class |
Floor |
Area (m2) |
WWR (%) |
Illuminance lux (max) |
Projected Illuminance=
Current Illuminance x(Current WWR 20)
|
| North-south |
5 |
First |
28.16 |
8 |
2000 |
5000 |
| East-west |
7 |
First |
22.08 |
5 |
467 |
1868 |
| East-west |
2 |
Ground |
22.09 |
7 |
596 |
1702 |
| North-south |
3 |
Ground |
13.64 |
8 |
37 |
92 |
| North-south |
4 |
Ground |
10.35 |
11 |
440 |
800 |
Table 4.
Parameters for climate based daylight modelling.
Table 4.
Parameters for climate based daylight modelling.
|
Parameter for study
|
Threshold for educational purposes -classrooms
|
Guideline
|
| Illuminance for classrooms/ lecture theatres |
200-300-500 lux |
IS 3646 -1992 |
| ASE |
below 10% |
Climate-based daylight modeling |
| sDA |
50-100% |
Climate-based daylight modeling |
| Internal wall finish reflectance factors |
Ceiling –0.80-0.70,
Walls -0.7
Floor--0.5 |
IS.7942.1976 |
Table 5.
Analysis of WWR and Average Illuminance with and without trees – classrooms 4 and 5.
Table 5.
Analysis of WWR and Average Illuminance with and without trees – classrooms 4 and 5.
| Analysis of WWR and Average Illuminance Lux with and without trees |
| Classrooms facing North |
WWR (%) |
Average Illuminance in Lux (without Trees) |
Average Illuminance in Lux (with Trees) |
Average Illuminance Reduction (%) |
| Classroom 4 (Ground Floor) |
20 |
1028 |
678 |
34 |
| Classroom 4 (Ground Floor) |
60 |
1756 |
1225 |
30 |
| Classroom 5 (First Floor) |
20 |
1119 |
1021 |
8.7 |
| Classroom 5 (First Floor) |
60 |
2041 |
1863 |
8.7 |
Table 6.
Classroom size vs WWR vs Illuminance –Classroom 2 and 3.
Table 6.
Classroom size vs WWR vs Illuminance –Classroom 2 and 3.
| Classroom size vs WWR vs Illuminance |
| Classroom |
Block |
Size
m |
Floor |
WWR
% |
Average Illuminance lux (min) |
Average Illuminance
lux (max) |
| Classroom 2 |
East-west |
4.9 x 4.7 |
Ground |
40 |
20 |
596 |
| Classroom 3 |
North-south |
4.4 x 3.1 |
Ground |
34 |
60 |
440 |
Table 7.
Comparison of 20% WWR with Trees for GF Class 2 (East Facing) & Class 3.
Table 7.
Comparison of 20% WWR with Trees for GF Class 2 (East Facing) & Class 3.
| Comparison of 20% WWR with Trees for GF Class 2 (East Facing) & Class 3 |
| |
Block |
Shade (m) |
sDA (%) |
ASE (%) |
Avg Lux |
| Classroom 2 |
East-west |
0m |
75.50% |
7.60% |
530 |
| Classroom 3 |
North-south |
0m |
93.90% |
14.00% |
731 |
| Classroom 2 |
East-west |
0.6m |
56.70% |
7.60% |
444 |
| Classroom 3 |
North-south |
0.6m |
92.10% |
2.60% |
611 |
| Classroom 2 |
East-west |
0.75m |
53.80% |
7.60% |
442 |
| Classroom 3 |
North-south |
0.75m |
91.20% |
1.30% |
598 |
Table 8.
Ground floor- different orientations.
Table 8.
Ground floor- different orientations.
| Illuminance, sunshade depth, orientation and WWR |
| Ground floor |
Classroom 2 -East Facing |
Classroom 3 -North Facing |
| WWR |
20% |
40% |
60% |
20% |
40% |
60% |
| Sunshade depth (m) |
Avg Illuminance - lux |
Avg Illuminance - lux |
| 0m |
602 |
903 |
1058 |
954 |
1399 |
1688 |
| 0.6m |
520 |
802 |
969 |
892 |
1294 |
1543 |
| 0.75m |
518 |
792 |
955 |
873 |
1295 |
1514 |
Table 9.
Optimum conditions for Avg illuminance 500 lux.
Table 9.
Optimum conditions for Avg illuminance 500 lux.
| Optimum conditions for Avg Illuminance of 500 lux for different orientations on Ground Floor |
| Classroom |
Optimized WWR (%) |
Optimized Sunshade (m) |
Expected Avg Lux (Without Trees) |
Optimized WWR (%) |
Optimized Sunshade (m) |
Expected Avg Lux (With Trees) |
| East-west Facing (Classroom 2) |
25 |
0.75 |
500 |
30 |
0.6 |
500 |
| North Facing (Classroom 3) |
18 |
1 |
500 |
22 |
0.75 |
500 |
|
Disclaimer/Publisher’s Note: The statements, opinions and data contained in all publications are solely those of the individual author(s) and contributor(s) and not of MDPI and/or the editor(s). MDPI and/or the editor(s) disclaim responsibility for any injury to people or property resulting from any ideas, methods, instructions or products referred to in the content. |
© 2025 by the authors. Licensee MDPI, Basel, Switzerland. This article is an open access article distributed under the terms and conditions of the Creative Commons Attribution (CC BY) license (http://creativecommons.org/licenses/by/4.0/).