
Submitted:
26 November 2025
Posted:
27 November 2025
You are already at the latest version
Abstract
The concept of bioregions stands out among the various approaches to sustainable territorial development, which provides for the initiative of local communities in solving their sustainability issues. At the same time, the concept of bioregions is diverse in practice, focusing on organic farming, tourism, local culture and also nature protection. Therefore, a balanced approach to the development of bioregions, which considers the specific characteristics of a particular area and the needs of its local community, is important. The present research employed the Analytical Hierarchy Process (AHP) approach to analyse economic, ecological and social value added as the main criteria and their subordinate sub-criteria. As a result, three scenarios were designed: the Broad Integration Scenario, the Conservative Scenario and the Culture and Tourism Scenario. The dominant strategy has been found to be the Culture and Tourism scenario, focusing on tourism and local cultural values, which can contribute to increasing the consumption of local products and services, while preserving the values and ensuring a balanced approach to sustainable development. At the same time, the Broad Integration Scenario revealed that a broad approach, even an aggressive approach, to sustainable development was highly controversial, as it had the greatest dispersion in priority vector values. Bioregionalism, however, is a little-supported approach that does not gain support from either sustainability or rapid growth advocates. The results revealed the importance of a long-term approach to sustainable development and, at the same time, implicitly pointed to the role of public attitudes, both in terms of supply (through local community initiatives in bioregionalization) and demand, which could increase the consumption of bioregional products and services.
Keywords:
bioregions
; AHP
; scenario analysis
; sustainable development
; regional development
1. Introduction
The concept of bioregions is a relatively new innovative approach to the development of rural areas, which includes economic, social, environmental and ethical aspects [1,2,3,4]. At the political level, a biological region (bioregion) is defined as follows: a ‘bio district’ is a geographical area where farmers, the public, tourist operators, associations and public authorities enter into an agreement for the sustainable management of local resources, based on organic principles and practices. The aim is to maximise the economic and sociocultural potential of the territory. Each ‘bio district’ includes lifestyle, nutrition, human relations and nature considerations (On an Action Plan for the Development of Organic Production. European Commission, Brussels, 25/03/2021, COM (2021) 141 final). Under this system, organic farming as a practice and the farmers who practice it play a key role [4,5]. The academic literature on bioregions [6] has increased with the growth of their popularity in Europe; however, there are still not many research studies, mainly focusing on case studies and their comparisons [7,8,9,10]. The experience of the first bioregion (Cilento Bio-district in Italy) has been analysed by several authors [7,11]. Some of the research studies are devoted to the classification and identification of bioregions [7,12]. The concept of bioregions has also been researched as a tool for implementing the circular economy [13]. The concept of agroecology, which has gained attention in Italy, has been studied in comparison with the concept of bioregions, thus finding similarities between the two approaches [14,15]. In fact, there has been an increase in the basis of academic literature in recent years, which, in the opinion of the authors, indicates the topicality of the concept of bioregions. This trend is further complemented by the authors’ recent studies on the economic impact of local food systems, which provide additional context for understanding the potential of the bioregion approach in regional development [16,17].
Although the concept of bioregions is increasingly being analysed in the academic literature and several approaches to its interpretation, categories and applications have been identified, there is still a lack of tools in the scientific discourse that would allow us to quantitatively compare different development scenarios for bioregions and to determine which factors are most relevant in specific areas. The development of bioregions is a multidimensional process affected by economic, social, cultural and environmental aspects, and the interdependence of the factors varies considerably across regions. Consequently, a methodology is needed that allows us to set priorities in a structured and reasoned way, align qualitative and quantitative information and base decisions on expert ratings. This methodological gap is especially indicated by the approaches identified by the literature review, for example, classifications of bioregions and case studies provide valuable insight into the development of the concept, yet they do not provide a tool that would allow us to systematically assess the potential development opportunities for bioregions in new, not yet established areas, as is necessary in the case of Latvia. For this reason, there is a tendency in research to seek multivariate evaluation methods [7,12,18], which would help to translate the concept of bioregions into a workable planning tool.
A methodological approach to sustainable development planning has been proposed by Assiri et al. (2021) [18]. His research aimed to develop a methodology that would help to identify areas that are suitable for applying the bioregional approach in a region. The researchers propose to include in the indicators biological and agricultural characteristics, as well as environmental, social and economic criteria, as these aspects have a significant impact on the development potential and sustainability of an area. Based on this approach, the authors of the present research have developed a new multifactorial measure – the Ecoregional Vocation Index (EVI) –, which makes it possible to assess the suitability of an area for the creation of a bioregion there. The bioregional approach is used to highlight the territorial dimension of sustainable development, with particular emphasis on the link with organic farming and other sustainable forms of production. An example of the research results was implemented in 29 municipalities in Italy, Bologna Apennines, Emilia Romagna region. The EVI provides reasoned information to policymakers and other stakeholders to develop sustainable spatial planning strategies that involve a combination of many factors to promote territorial integration in a bioregion. This problem has also been raised by a research study by Assiri et al. (2021) [18], which revealed the need to use multidimensional criteria assessment methods to identify the suitability of areas for the formation of bioregions there.
Strategies for the development of areas, including bioregions, are essential to identify real factors that can create a relative advantage for bioregions. Using site-specific indicators, it is possible to cluster areas through identifying potential bioregional development pathways that focus on tourism, organic farming, education and nature protection, as well as identify those without pronounced prerequisites for the creation of bioregions and areas where intensive production generates too many benefits that limit the development of bioregions [19]. At the same time, the use of such an analytical approach depends on expert evaluation.
The Analytic Hierarchy Process (AHP) [20,21] is relatively widely used in territorial development and policymaking, representing an effective approach to complex decision-making related to the prioritization of various aspects of development and the allocation of resources [22,23,24]. In a research study on territorial development priorities for the municipality of Zawidz (Poland) [25] used AHP for spatial planning, including decision-making, as the method providing a structured and systematic approach to decision-making based on ratings by industry experts. The research study showed how AHP helps to identify priority pathways for land use by employing proper indicators and methodology, thereby leading to a comprehensive assessment of factors. The case of Zawidz municipality demonstrates that AHP can be applied in practice to select the most optimal uses for land in the municipal territory, thus improving the efficiency and transparency of decision-making. Similarly, AHP has been used in Poland to prioritise land consolidation in rural areas with severe fragmentation of agricultural land [26]. The research study was conducted in the municipality of Sławno, where land fragmentation significantly limited the development of agricultural production. Using AHP, the research study identified rural areas and village territories where consolidation could make the largest contribution, thus increasing land use efficiency and access to modern agricultural technologies. However, Palka et al. (2020) [27] have focused on the effectiveness of strategic territorial planning in Lyon, France, and Copenhagen, Denmark, using AHP.
Therefore, the present research aims to identify scenarios for the development of bioregions in the regions of Latvia using AHP, considering the importance of various dimensions and promoting a balanced approach to sustainable development at all levels.
2. Materials and Methods
Based on the basic principles of the bioregional approach and their potential impact on territorial development, an AHP model was designed as part of the present research to determine which factors and scenarios generate the highest value added if forming bioregions in Latvia.
To perform a competent and professionally balanced assessment of the scenarios, experts were selected by the authors after evaluating the experience of each expert and the role of the represented institution in bioregional development. The experts represented: the Ministry of Agriculture of the Republic of Latvia (RoL) that is responsible for agricultural policy and setting national strategic priorities; the Ministry of Smart Administration and Regional Development of the RoL responsible for regional policymaking and governance; the Latvian National Centre for Culture that represents the dimension of preservation of culture and traditions, which is essential for strengthening the identity of bioregions and integrating cultural and historical heritage into development patterns.
Individual ratings by the experts were anonymized, indicating no name or position of any expert; the ratings were used in an aggregated form and represented by letter codes. In total, 6 experts participated in rating the bioregional scenarios: an expert from the Ministry of Agriculture with an in-depth understanding of agricultural policymaking and setting national strategic priorities was important for rating development possibilities for bioregions in the agricultural and agro-environmental context (Expert 1); the Ministry of Smart Administration and Regional Development provided a view in the fields of regional policymaking and governance, territorial governance models, regional development strategies and integrated approach application (Expert 2); an expert from the Latvian National Centre for Culture provided a view on the dimension of preservation of culture and traditions, which is essential for strengthening the identity of bioregions and integrating cultural and historical heritage into development patterns (Expert 3); an expert from the Cooperation Council of Agricultural Organisations (LOSP) represented the largest Latvian farmer organisation, which unites conventional and organic farms, ensures that a comprehensive vision of the agricultural sector is taken into account in ratings of the bioregional scenarios (Expert 4); an expert from Cesis municipality and the association Greenfest represented both the interests of the municipality (local communities) and the association, which is one of the drivers of the idea of bioregions in Latvia. The expert's practical experience in community development and green initiative management complemented the expert group's perspective with a civil society perspective (Expert 5); an expert representing the Institute of Agricultural Resources and Economics (AREI) provided a fundamentally analytical, data- and research-based view, especially in relation to integrating economic and agri-environmental innovation aspects. The targeted and well-founded selection of the experts guaranteed a cross-sectoral perspective and allowed for a qualitative and reasoned assessment of the scenarios.
To ensure that the experts have a common understanding of how to rate the scenarios, the experts were familiarized with the scenarios, their main features, potential benefits and potential risks or limitations before starting to rate them. The experts were also provided with comprehensive information on the criteria and subcriteria and their roles at each level of analysis. The experts were also provided with methodological guidance on the principle of pairwise comparison in AHP, as well as on how to interpret numerical values in comparisons and how to rate the relevant significance of alternatives.
At the first stage, the experts made pairwise comparisons between three main criteria: economic, ecological and social value added. Each expert, based on their professional experience and understanding, identified which of the criteria was more relevant in a particular context. The results of pairwise comparisons were compiled into a comparative matrix, which was the basis for further calculation of the coefficients of significance. Next, individual pairwise comparison matrices were created for each of the basic criteria, with the experts comparing the subcriteria (e.g., for the economic criterion: local food processing capacity; for the ecological criterion: preservation of natural diversity; for the social criterion: employment, etc.). This approach allowed for a detailed assessment of which aspects in each of the dimensions were most significant within the respective criterion. At the next stage, the experts had to identify the extent to which each of the scenarios could contribute to meeting the respective subcriterion. For rating the scenarios, an individual pairwise comparison matrix was created for each subcriterion to rate the three identified alternatives: 1) broad integration, 2) conservation, 3) culture and tourism (Figure 1).
The Broad Integration Scenario (Scenario 1) envisages that the bioregional concept is implemented on a large scale, covering vast areas of high ecological and scenic value, as well as areas that have not been considered suitable for the introduction of the bioregional concept because of intensive economic activity or other reasons. This scenario envisages the creation of a new territorial governance model, covering various areas of Latvia with different socio-economic and environmental potential. Such an approach allows for the balanced development of sustainable agriculture and processing industries, strengthens local entrepreneurship, improves transport and logistics infrastructure and promotes the spread of innovations over a wider area. At the same time, the sustainable use of natural resources and the preservation of a quality living environment on a large scale are ensured as well. In a social context, this scenario envisages greater participation of local communities in the development of their territories, thus increasing employment opportunities and contributing to the economic security of the population.
The Conservative Scenario (Scenario 2) assumes that the bioregional approach is applied selectively in areas with significant ecological and scenic value, such as specially protected nature areas or areas with significant cultural landscapes. Adapting the bioregional approach in this way reduces the initial impact on wider areas and reduces the likelihood of negative attitudes. By implementing this scenario as a pilot project, it is possible to identify potential challenges and risks, as well as to identify public support and economic efficiency. In ecological terms, this scenario minimises potential risks to biodiversity. However, the economic and social benefits under this scenario are most pronounced in the communities involved in the pilot projects.
Under the Culture and Tourism Scenario (Scenario 3), the bioregional approach is targeted at areas with a strong cultural and historical identity, traditions and tourism opportunities. The activities of the bioregion are aimed at preserving and developing local cultural values, crafts, gastronomy and unique living space through the tourism industry and the export of services. At the same time, the scenario envisages the participation and involvement of local communities in decision-making. From an economic perspective, this scenario creates development incentives for local businesses, various cultural projects and social initiatives. However, the ecological scenario contributes to the quality of historical environmental and cultural landscapes. Socially, this approach can strengthen the identity, cooperation and well-being of communities.
The experts gave individual ratings by filling in a specially designed questionnaire in Excel format, which included several matrices for comparing pairs according to the hierarchical structure of AHP. Each matrix was constructed as a square n×n matrix, where n was the number of elements to be compared at the given level. For example, a matrix of 3×3 was created in the case of the main criteria.
The research used AHP to determine the weights of criteria and sub-criteria that are essential for identifying the suitability of areas for the creation of bioregions there. AHP was applied to perform prioritisation and analyses, which are essential for deciding which areas are most suitable for inclusion in bioregions. It helps to make informed decisions based on a multidimensional analysis that includes biological, agricultural, environmental, social and economic factors.
The scenarios put forward were rated according to the following criteria and subcriteria:
1. The main criterion of economic value added indicates the extent to which a bioregional approach to a given area can contribute to the development of the local economy by generating steady incomes, increasing employment, improving infrastructure and encouraging innovation. To perform a comprehensive assessment of economic value added, it is appropriate to divide the criterion into several detailed subcriteria. Such an approach allows for a more accurate analysis of individual aspects affecting development, as well as to understand their interaction with each other. Each subcriterion gives an in-depth insight into the importance of a particular factor in the context of the development of a bioregion. Next, the authors give characteristics of each subcriterion of economic value added.
1.1. The production potential for local agriculture makes it possible to identify the capacity of the area to develop sustainable agriculture, especially organic or integrated farming.
1.2. The local food processing capacity shows the extent to which opportunities have been or can be created in the area to process local agricultural commodities, adding value to them before reaching the consumer. It includes small-scale processing plants, cooperation, technological support and infrastructure.
1.3. Market access for local products to identify how easily local products can reach consumers inside and outside the region. The rating considers the transport network and its quality, distance to markets, logistics infrastructure and availability of healthy products to consumers.
1.4. The activity of local businesses and the innovation potential indicate how actively local businesses are involved in the creation of new products and services, attracting investments and introducing new technologies and networking.
1.5. Investments in local infrastructure consider the extent to which infrastructure that directly supports the bioregional economy has been developed or is being planned in the area.
2. Ecological value added indicates the extent to which the bioregional approach to territorial development can ensure the protection, sustainable use and quality improvement of natural resources in the area. Since the principles for bioregions are based on the natural values of the area and the potential of ecosystems, high ecological value added means that a given area can become a clean and healthy environment for residents and visitors in the long term. The rating of ecological value added is important for a comprehensive assessment of the potential impact of the bioregional approach on nature protection and human economic activity. Ecological value added is identified by analysing a number of interrelated subcriteria that affect the overall ecological status, which is essential for sustainable development. Each of the subcriteria provides an in-depth understanding of possibilities for preserving and improving resources in the area.
2.1. The conservation of nature and biodiversity indicates the extent to which natural ecosystems, habitats and species are preserved and protected in an area.
2.2. The existence and maintenance of traditional landscapes show the level of preservation and maintenance of cultural and historical landscapes, which is an essential component of the identity of a bioregion.
2.3. The quality and sustainable use of natural resources are characterized by the quality and usability of soil, the quality and availability of water resources, as well as the proportion of woodland and natural grasslands in the total area. This criterion indicates the state of the natural resources in the area, including the quality of soil, the quality and availability of water resources, as well as the proportion of woodland and natural grasslands, and assesses their sustainable usability for the development of the bioregion.
2.4. The presence and integration of protected areas indicate to what extent the protected areas are integrated into the development and planning of the bioregion, the proportion of protected areas, the alignment of policy documents with nature protection regimes, the use of protected areas in the interests of society and the economy (e.g. green tourism).
2.5. Climate change mitigation potential indicates the ability of an area to contribute to climate change mitigation through natural processes and proper management.
3. Social value added indicates the effect of the bio-region approach on a local community, its cohesion, quality of life, cultural identity and opportunities for participation. It shows the extent to which a bioregion helps to build strong, viable communities that support both ecological and economic sustainability. The role of social value added lies in its ability to balance economic, environmental and human interests, giving development a human dimension based on societal needs. An assessment of it helps to understand how the bioregional approach affects employment opportunities, social cohesion, the preservation of culture and traditions, the development of local tourism and services, as well as community engagement and the quality of the living environment. These interlinked aspects contribute to the resilience of local communities and the long-term attractiveness of a region. Assessing the impact of social added value requires complementary subcriteria, which make it possible to reveal more accurately how specific factors shape and affect the development and quality of life of a community.
3.1. Employment and social cohesion. Employment is perceived as the basis of social well-being: less unemployment, more social cohesion and residents staying in the region. Social cohesion means the internal cohesion of society and its ability to cooperate in achieving common goals. It is people's sense of belonging to their community and mutual trust that help to solve problems together and develop their territory.
3.2. The viability of culture and traditions is characterized by how the bioregional approach helps to preserve and develop local traditions, cultural and historical values and inspires future generations. It involves local values and identities, preservation and development of local cultures and traditions, and involvement of new generations and learning opportunities in the bioregional context.
3.3. Local tourism and services are assessed in terms of how the bioregional approach contributes to the growth of tourism and services, thus making socio-economic contributions and strengthening the community's capacity to provide authentic tourism experiences based on the local environment and culture.
3.4. Community involvement and quality of life (participation and quality of the living environment). It involves assessing community involvement and initiatives, as well as improving the quality of life.
The experts gave their ratings of the relative significance of each criterion over another on a nine-point scale, where 1 meant equal significance and 9 meant absolute predominance (see Table 1). Accordingly, the reverse value was assigned to the second element of the comparison. In the main diagonal of each pair comparison matrix, where the elements were compared with themselves, the value was always 1, since the relative significance of any element relative to itself was the same.
Since there was a possibility that the ratings might be contradictory (inconsistent), the pair-comparison matrices were normalized, and their internal coherence was checked by a coherence test yielding a coherence ratio (CR). The elements of each column of the matrix were normalized by dividing each element by the sum of the elements in that column. After the normalization, the arithmetic mean of each row was calculated, which indicated the relative weight of the respective element. The weight vector (w) calculated indicated the relative significance of the compared elements at a given level of the hierarchy and was used in further analysis, both in rating the scenarios and in performing an overall synthesis of the results. According to Saaty (1980) [20], the developer of AHP, the CR must be less than or equal to 0.1 or 10% in order for comparisons to be considered methodologically acceptable, but if this limit is exceeded, a review of the ratings given by experts is required. In exceptional cases, if the matrix of comparisons is larger or the ratings by several independent experts are analysed, the permissible CR threshold may be raised to 0.20 (20%), while maintaining a critical degree of coherence [28,29,30]).
The present research, taking into account the number of pairwise comparison matrices, as well as the fact that the ratings were given by a number of independent experts, applied a more flexible approach to the permissible coherence ratio (CR):
- • if CR≤0.10, comparisons are considered coherent and are used without further verification;
- • if 0.10<CR≤0.20, an expert's rating was re-discussed, paying attention to the contradictions identified. If the expert reasonably justified their vision and the logic of the comparison, the respective rating was considered acceptable and included in the subsequent analysis;
- • if CR>0.20, an expert was asked to redo their pair comparison matrix to find discrepancies and reach greater coherence.
Such an approach allowed the authors to maintain a balance between methodological rigor and practical flexibility, thus ensuring the quality of the data and at the same time considering the specifics of expert involvement.
Since each pairwise comparison matrix was filled in individually by the experts, the ratings were combined to obtain a single group rating for each unit of the hierarchy. According to the methodological principles of AHP [20], the combination involved calculating the geometric mean for each pairwise comparison, which was the most commonly used method to consolidate the opinions of independent experts. This method made it possible to maintain the multiplicative structure of pairwise comparisons, while at the same time equalizing the effects of individual ratings [21].
As a result, a single matrix of group comparisons was created, which served as the basis for calculating criteria weights and evaluating the scenarios. After the combined matrix was created, a CR for a group was calculated to assess the coherence of the overall ratings. Although the calculation of a CR is not mandatory in cases of group decisions, several authors recommend it [21], as it provides an opportunity to identify whether experts have been sufficiently coherent with each other in their ratings and allows for the timely identification of significant contradictions. A similar approach has also been applied by national researchers who had analysed the coherence of group results based on a CR for combined matrices [31,32].
The final ratings of the scenarios were found by employing the weighted sum method [20]. The overall rating for each alternative scenario was calculated by multiplying the relative weight of each subcriterion (derived from subcriteria comparisons) by the rating of the respective scenario in that subcriterion, and the multiplications were then added up, while taking into account the weights of the higher level (main criteria). As a result, a comparable overall priority vector value was found for each scenario, indicating its relative suitability for establishing bioregions in the context of the hierarchy developed by the present research. Given that in the scientific literature, percentages are often used to show the results of an AHP analysis [33] in order to facilitate the perceptibility of the results and to compare the significance of alternatives to a wide audience, the authors also used percentages to interpret the results. Since priority vector values are relative quantities that are often used only for intermediate weight calculations, the presentation of the final results in terms of percentages facilitates their comparison and interpretation, thus making the analysis results also accessible to users without in-depth knowledge of mathematics or multidimensional data analysis.
3. Results
After combining and processing all the expert ratings by applying AHP (Appendix A, Table A1), the priority vectors (weight) of the main criteria were broken down in terms of the kind of value added as follows: economic value added 17.3%, ecological value added 38.7% and social value added 43.9% (see Table 2). The dataset “Analysis of Bioregional Development Scenarios in Latvia” can be accessed via the Dataverse.lv repository.
The analysis results clearly indicate that, in the opinion of the experts, the social and ecological aspects are the most significant driving forces for strategic development. Although economic factors are considered significant, they play a complementary rather than a dominant role in the context of the present research. Such a trend is fully in line with the principles of sustainable development because, in the long term, priority is given to the well-being of society and the preservation of the environment.
At the level of the subcriteria, there are different priorities, thereby revealing which specific indicators determine the significance of each dimension. For example, regrading economic value added, infrastructure investments (28.7%) and entrepreneurial activity (27.5%) were rated as the most significant, together accounting for more than half of the significance of this group. Other indicators: market availability (16.0%), food processing (14.5%) and agricultural potential (13.3%) were less significant. Similar trends could be observed in relation to ecological and social subcriteria, with individual elements dominating and determining the main pathway in which measures could make the largest contribution. Regarding ecological value added, the highest significance was given to biodiversity (22.8%), integration of protected areas (21.2%) and quality of natural resources (21.2%). If combined, they accounted for more than two-thirds of the overall ecological priority, thereby stressing the need to preserve and integrate natural areas and maintain their quality. A slightly smaller but still significant proportion was held by traditional landscapes (18.7%) and climate change mitigation (16.1%), demonstrating the significant role of maintaining landscape identity and climate policy elements in maintaining a sustainable environment.
It is also important to identify the global weight of the criteria, as it reveals the real impact of each factor on the choice of the final scenario and helps to identify which elements in the strategic planning process are prioritised in order to achieve the highest return from the bioregional approach. A high global weight means that a subcriterion has a significant impact on the assessments of scenarios, even if its relative weight is not the highest within its group. The results of the AHP analysis revealed that the main criterion of social value added had the highest weight; therefore, the moderately significant subcriteria (in terms of weight) in this group also had a significant global impact (Table 3).
According to the combined expert ratings, the criteria "Community involvement and quality of life" and "Viability of culture and traditions" (social value added) as well as "Biodiversity" (ecological value added) had the highest global impact. This means that these aspects have been crucial for the experts in their choice of the final scenario that could provide benefits for society, the environment and long-term resilience to economic and social changes. Accordingly, strategic plans at both the local and national levels should be designed taking into account the dominant role of these elements, thereby integrating them as key priorities in regional development programmes, policy documents and investment plans.
The analysis assessed three alternative regional development strategies based on the implementation of the principles of the bioregional approach to ensure a coherent and sustainable use of socio-economic, ecological and cultural resources. The Broad Integration Scenario gained a priority weight of 0.284 or 28.4%, the Conservative Scenario’s weight was 0.234 or 23.4%, while the Culture and Tourism Scenario gained the highest relative significance with a weight of 0.482. The analysis results revealed that it was the cultural and tourism approach that most fully reflected the essence and potential of the bioregional approach in achieving the long-term development goals of a region, combining the social and ecological dimensions with the economic opportunities provided by the development of the cultural and tourism industries.
An analysis of the global weights of individual priority vectors rated by the experts for the scenarios showed that each expert's view of priorities varied slightly; however, the prevailing trend was persistent, with most of the experts giving the highest ratings specifically to the Culture and Tourism Scenario. In some cases, the experts were more inclined to support the Broad Integration Scenario, giving higher global weights to economic criteria, yet the differences were not enough to change the overall result.
It should be noted that the range of expert ratings was relatively wide, especially for the first and third scenarios (Figure 2 and Appendix A, Table A2). This means that the expert opinions were polarized, with some experts rating a scenario very high, whereas others, on the contrary, very low. An average of 0.32 (scenario 1) and 0.48 (scenario 3) indicated a compromise between the opposing views. A relatively high consensus of expert opinions was observed for scenario 2, which was rated in a moderately narrow range.
To identify the reliability of the final results and the coherence of the expert ratings, it is essential to identify the dispersion of individual expert ratings (global weights) and their coherence ratios.
The test of the logical coherence of ratings using the coherence ratio (CR) showed how coherently experts have followed the rating logic when comparing criteria and subcriteria in pairs. At the level of the main criteria, the CR was found at 0.00069, which was well below the internationally accepted permissible threshold of 0.1. There were nuanced differences in the weight distributions of global priority vectors by individual experts, yet they were based on consistent and coherent ratings, as evidenced by the very low CR. Although the experts assigned different meanings to some criteria or scenarios, the approach to comparing them remained uniform and coherent. This ensured that the combined expert result was not contradictory and reflected a common view of priorities.
It should be noted that the highest rating of the Culture and Tourism Scenario by the experts was in line with the recognition expressed in expert interviews that the bioregional approach was most fully revealed in the social dimension, which includes cultural and tourism aspects. Both the interviews and the ratings of the scenarios suggested that through the prism of culture and tourism, social factors could directly contribute to economic value added, e.g., revenues from tourism, and increase sales of locally produced agricultural products, thereby contributing to economic activity in the region. However, economic activities, in particular the development and expansion of infrastructure, could have a positive impact on the quality of the environment and landscapes and, taking into account the interaction of the elements, the quality of life would increase in the long term. This bioregional approach is also fully consistent with the theory of cultural determinism analysed in theoretical research studies [34,35], thereby emphasizing that success in regional development is strongly linked to the values of and social capital a local community and experience in bioregional development in Europe.
4. Discussion
The development of bioregions is based on socio-economic and ecological theories intertwined with various aspects of regional policy. The formation of bioregions is affected by various factors, and it is not a uniform process and depends on the economic, social, cultural and environmental features of the area, as well as the values of the community. According to leading researchers focusing on the concept of bioregions, Salvatore Basile, Cesare Zanasi and Jostein Hertwig [36], the reasons for the creation of a bioregion could be influenced by societal initiatives, territorial resources, economic motivation or environmental motivation. Based on some research studies [7,12,19], three conceptual categories of bioregions can be distinguished, thus reflecting the different prerequisites for the creation of bioregions, the potential of environmental aspects and development pathways, while providing a potential theoretical framework for further development and comparison of the scenarios in Latvia.
Structural transformation bioregions are areas where the concept of bioregions is introduced as a tool for territorial development to promote structural change in a vast area having high ecological and landscape values. Covering vast areas with various governance models, structural transformation bioregions serve a new governance and development model that promotes sustainable development, societal engagement and economic growth. Such bioregions are designed to transform rural areas structurally, with the aim of developing sustainable agricultural and manufacturing industries steadily, strengthening local entrepreneurship, improving infrastructure and encouraging the application of innovation.
AHP has been widely used in the assessment of regional and territorial development scenarios, investments and land uses. AHP provides for a structured analysis of various criteria, rating their significance. This allows policymakers to set priorities and make the most optimal decisions in the territorial development planning process. AHP is an effective tool for comparing strategic plans for urban districts, providing a detailed explanation and an in-depth understanding of how the planning process is influenced by different political and social contexts. The scenarios were designed to identify how different scales and focuses of the bioregional approach can affect the sustainable development of areas, the use of resources and the well-being of communities.
Bioregions for the preservation and development of ecological values cover areas with a high concentration of natural and landscape values, e.g., protected areas where production or agricultural activity is limited. The concept of bioregions is applied to preserve and protect the values by reaching a balance between economic activity and environmental resilience. It should be taken into account that the limited area of a bioregion means that its potential economic and social benefits are manifested in the particular region, but at the same time it also serves as an opportunity to familiarize the wider public with the concept of bioregions and the potential benefits and risks, so that in the future it would be possible to reorient the public towards the structural transformation model and development in wider areas.
Bioregions for cultural and landscape development cover areas where the creation of a bioregion is based on local cultures and identities and tourism resources. Bioregions are mostly created in areas where the initial potential represents strong cultural and historical values in business, high tourism potential and a strong connection of the identity of residents with the area. Organic food, crafts, local food traditions and environmental and landscape values are integrated into a territorial brand that serves as the basis for the sustainable development of the region.
In Latvia, the concept of bioregions is relatively new, and the way to implement it is still being determined in order to adapt it to local conditions and development needs. As noted in the research study by Assiri et al. (2021) [18], which addressed problems related to territorial development planning, sustainable development and bioregions, there is a need for broader and more coordinated cooperation in Latvia for the development of bioregions. Emphasizing the benefits of traditional food production and hospitality can contribute to territorial development through the concept of bioregions. The issue of local community initiative remains essential, as the concept of bioregions can only be implemented through the bottom-up approach. Therefore, municipalities and the state administration must work together to contribute to the benefits, e.g., by promoting Protected Geographical Identification (PGI) or Protected Designation of Origins (PDO) trademarks, thus supporting community initiatives, helping to overcome the difficulties with tourism seasonality, adjusting tax payment, etc. However, identifying the development benefits of an area helps to encourage cooperation between local governments and communities aimed at the development of the area.
5. Conclusions
The article examines the possibilities for bioregional development in Latvia by applying the AHP to assess the social, economic, and ecological contributions of different bioregion development scenarios and to determine which factors and development directions provide the greatest added value when integrating the bioregion concept into territorial planning in Latvia. The study defines three development scenarios: the Broad Integration Scenario, which envisages the creation of bioregions across extensive territories; the Conservative Scenario, which focuses on areas with particularly valuable natural and cultural landscapes; and the Culture and Tourism Scenario, which is grounded in local identity, traditions, and tourism potential. Expert evaluations confirm that social and ecological aspects are the most important in bioregional development, while economic criteria play a complementary role. The AHP results clearly show that the Culture and Tourism Scenario provides the best balance across the social, ecological, and economic dimensions. It highlights local values and cultural heritage while fostering entrepreneurship, tourism, and community well-being. Overall, expert opinions were relatively aligned, indicating a strong shared understanding of which bioregional development pathway may be most successful in Latvia.
Author Contributions
Conceptualization, D.K. and L.P.; methodology, D.K.; software, D.K.; validation, K.N.-L. and S.C.; formal analysis, S.C.; investigation, D.K. and L.P.; resources, D.K. and L.P.; data curation, K.N.-L.; writing—original draft preparation, D.K.; writing—review and editing, K.N.-L. and S.C.; visualization, D.K.; supervision, K.N.-L.; project administration, L.P.; funding acquisition, L.P. All authors have read and agreed to the published version of the manuscript.
Funding
The research was carried out as part of fundamental and applied research project No. lzp-2022/1-0519 “Bio-regions as an Integrated Strategy for the Sustainable Development of Rural Areas in Latvia” (Bio-reģioni kā integrēta stratēģija ilgtspējīgai lauku teritoriju attīstībai Latvijā - in Latvian).
Institutional Review Board Statement
Not applicable.
Informed Consent Statement
Not applicable.
Data Availability Statement
Klavina, Daniela; Proskina, Liga; Naglis-Liepa, Kaspars; Cerina, Sallija, 2025, "Dataset for Analysis of Bioregional Development Scenarios in Latvia", https://doi.org/10.71782/DATA/JFRVUV, DataverseLV, V1, UNF:6:XHsTmjvhvI/HehXxw9I9Jg== [fileUNF] (accessed on 26 November 2025).
Acknowledgments
During the preparation of this manuscript, the authors used ChatGPT (Mar 14 version, OpenAI, 2024) for the purposes of language editing, translation, and improvement of linguistic clarity. The authors have reviewed and edited all output and take full responsibility for the content of this publication. No generative AI tools were used for the creation of scientific content, formulation of research ideas, data analysis, study design, or the development of methodological approaches presented in this paper.
Conflicts of Interest
The authors declare no conflicts of interest. The funders had no role in the design of the study; in the collection, analyses, or interpretation of data; in the writing of the manuscript; or in the decision to publish the results.
Abbreviations
| AHP | Analytic Hierarchy Process |
| AI | Artificial Intelligence |
| AREI | Institute of Agricultural Resources and Economics |
| ChatGPT | Large language model developed by OpenAI |
| CR | Coherence Ratio |
| EVI | Ecoregional Vocation Index |
| LOSP | Cooperation Council of Agricultural Organisations |
| MDPI | Multidisciplinary Digital Publishing Institute |
| OpenAI | Artificial intelligence research organization developing large language models |
| PGI | Protected Geographical Indication |
| PDO | Protected Designation of Origin |
| RoL | Republic of Latvia |
Appendix A
This appendix includes two supplementary tables that present the full results of the Analytical Hierarchy Process (AHP) conducted in this study. These tables contain methodological details and numerical outcomes that complement the main findings reported in the article but would disrupt the flow of the main text due to their size and complexity. Their inclusion is essential for ensuring transparency, reproducibility, and completeness of the evaluation process. All underlying evaluation data (Raw), that is, the experts’ actual individual pairwise comparison judgments, as well as the normalized values derived from these judgments, are deposited in the Dataverse.lv data repository (https://doi.org/10.71782/DATA/JFRVUV), where they are available for download to enable full reproducibility of the analysis.

Table A1.
AHP Summary: Individual Expert Evaluations, Statistical Aggregates, and Combined Group Weights.
Table A1.
AHP Summary: Individual Expert Evaluations, Statistical Aggregates, and Combined Group Weights.
| Criteria | Individual Expert Evaluations | Minimum, Average, and Maximum Values of Individual Expert Evaluations | Combined Expert Group Evaluation | ||||||||
|---|---|---|---|---|---|---|---|---|---|---|---|
| Expert A | Expert B | Expert C | Expert D | Expert E | Expert F | ||||||
| Main criteria | Weight vector | Weight vector | Weight vector | Weight vector | Weight vector | Weight vector | Aver | Min | Max | Weight vector | Global Weight |
| 1. Economic Added Value (AV) | 0.091 | 0.333 | 0.088 | 0.321 | 0.083 | 0.225 | 0.19 | 0.08 | 0.33 | 0.173 | na* |
| 2. Ecological Added Value (AV) | 0.455 | 0.333 | 0.243 | 0.225 | 0.724 | 0.321 | 0.38 | 0.23 | 0.72 | 0.387 | na |
| 3. Social Added Value (AV) | 0.455 | 0.333 | 0.669 | 0.454 | 0.193 | 0.454 | 0.43 | 0.19 | 0.67 | 0.439 | na |
| 1. Economic Sub-criteria | |||||||||||
| 1.1. Agricultural Potential | 0.142 | 0.073 | 0.058 | 0.419 | 0.182 | 0.050 | 0.15 | 0.05 | 0.42 | 0.133 | 0.023 |
| 1.2. Food Processing | 0.166 | 0.162 | 0.058 | 0.226 | 0.137 | 0.075 | 0.14 | 0.06 | 0.23 | 0.146 | 0.025 |
| 1.3. Market Accessibility | 0.214 | 0.377 | 0.170 | 0.048 | 0.069 | 0.134 | 0.17 | 0.05 | 0.38 | 0.160 | 0.028 |
| 1.4. Entrepreneurial Activity | 0.404 | 0.218 | 0.163 | 0.164 | 0.275 | 0.237 | 0.24 | 0.16 | 0.40 | 0.275 | 0.048 |
| 1.5. Infrastructure Investments | 0.074 | 0.171 | 0.550 | 0.143 | 0.336 | 0.504 | 0.30 | 0.07 | 0.55 | 0.287 | 0.050 |
| 2. Ecological Sub-criteria | |||||||||||
| 2.1. Biodiversity | 0.247 | 0.253 | 0.467 | 0.249 | 0.085 | 0.064 | 0.23 | 0.06 | 0.47 | 0.228 | 0.088 |
| 2.2. Traditional Landscapes | 0.159 | 0.069 | 0.236 | 0.367 | 0.183 | 0.076 | 0.18 | 0.07 | 0.37 | 0.187 | 0.072 |
| 2.3. Quality of Natural Resources | 0.247 | 0.226 | 0.091 | 0.266 | 0.342 | 0.071 | 0.21 | 0.07 | 0.34 | 0.212 | 0.082 |
| 2.4. Integration of Protected Areas | 0.159 | 0.226 | 0.154 | 0.078 | 0.262 | 0.283 | 0.19 | 0.08 | 0.28 | 0.212 | 0.082 |
| 2.5. Climate Change Mitigation | 0.189 | 0.226 | 0.052 | 0.040 | 0.129 | 0.506 | 0.19 | 0.04 | 0.51 | 0.161 | 0.062 |
| 3. Social Sub-criteria | |||||||||||
| 3.1. Employment and Social Cohesion | 0.100 | 0.192 | 0.058 | 0.300 | 0.077 | 0.325 | 0.18 | 0.06 | 0.33 | 0.154 | 0.068 |
| 3.2. Cultural and Traditional Vitality | 0.300 | 0.242 | 0.282 | 0.325 | 0.159 | 0.192 | 0.25 | 0.16 | 0.32 | 0.261 | 0.115 |
| 3.3. Local Tourism and Services | 0.300 | 0.242 | 0.145 | 0.051 | 0.263 | 0.242 | 0.21 | 0.05 | 0.30 | 0.196 | 0.086 |
| 3.4. Community Engagement and Quality of Life | 0.300 | 0.325 | 0.515 | 0.325 | 0.501 | 0.242 | 0.37 | 0.24 | 0.52 | 0.389 | 0.171 |
| Scenario Evaluation According to Main Criterion 1 – Economic Added Value (AV) | |||||||||||
| 1.1. Agricultural Potential | |||||||||||
| Scenario 1: Broad Integration | 0.633 | 0.724 | 0.140 | 0.061 | 0.480 | 0.435 | 0.41 | 0.06 | 0.72 | 0.391 | 0.009 |
| Scenario 2: Conservative | 0.260 | 0.193 | 0.286 | 0.216 | 0.115 | 0.078 | 0.19 | 0.08 | 0.29 | 0.221 | 0.005 |
| Scenario 3: Culture and Tourism | 0.106 | 0.083 | 0.574 | 0.723 | 0.405 | 0.487 | 0.40 | 0.08 | 0.72 | 0.387 | 0.009 |
| 1.2.Food Processing | |||||||||||
| Scenario 1: Broad Integration | 0.655 | 0.111 | 0.074 | 0.074 | 0.429 | 0.480 | 0.30 | 0.07 | 0.66 | 0.249 | 0.006 |
| Scenario 2: Conservative | 0.187 | 0.111 | 0.643 | 0.417 | 0.143 | 0.115 | 0.27 | 0.11 | 0.64 | 0.252 | 0.006 |
| Scenario 3: Culture and Tourism | 0.158 | 0.778 | 0.283 | 0.805 | 0.429 | 0.405 | 0.48 | 0.16 | 0.81 | 0.499 | 0.013 |
| 1.3. Market Accessibility | |||||||||||
| Scenario 1: Broad Integration | 0.405 | 0.111 | 0.083 | 0.187 | 0.211 | 0.429 | 0.24 | 0.08 | 0.43 | 0.272 | 0.008 |
| Scenario 2: Conservative | 0.480 | 0.111 | 0.724 | 0.158 | 0.102 | 0.143 | 0.29 | 0.10 | 0.72 | 0.242 | 0.007 |
| Scenario 3: Culture and Tourism | 0.115 | 0.778 | 0.193 | 0.655 | 0.686 | 0.429 | 0.48 | 0.11 | 0.78 | 0.486 | 0.013 |
| 1.4. Entrepreneurial Activity | |||||||||||
| Scenario 1: Broad Integration | 0.260 | 0.111 | 0.083 | 0.179 | 0.260 | 0.429 | 0.22 | 0.08 | 0.43 | 0.241 | 0.011 |
| Scenario 2: Conservative | 0.633 | 0.111 | 0.724 | 0.136 | 0.106 | 0.143 | 0.31 | 0.11 | 0.72 | 0.276 | 0.013 |
| Scenario 3: Culture and Tourism | 0.106 | 0.778 | 0.193 | 0.685 | 0.633 | 0.429 | 0.47 | 0.11 | 0.78 | 0.483 | 0.023 |
| 1.5. Infrastructure Investments | |||||||||||
| Scenario 1: Broad Integration | 0.143 | 0.111 | 0.106 | 0.187 | 0.724 | 0.429 | 0.28 | 0.11 | 0.72 | 0.262 | 0.013 |
| Scenario 2: Conservative | 0.429 | 0.111 | 0.633 | 0.158 | 0.083 | 0.143 | 0.26 | 0.08 | 0.63 | 0.239 | 0.012 |
| Scenario 3: Culture and Tourism | 0.429 | 0.778 | 0.260 | 0.655 | 0.193 | 0.429 | 0.46 | 0.19 | 0.78 | 0.499 | 0.025 |
| Scenario Evaluation According to Main Criterion 2 – Ecological Added Value (AV) | |||||||||||
| 2.1. Biodiversity | |||||||||||
| Scenario 1: Broad Integration | 0.794 | 0.111 | 0.066 | 0.061 | 0.574 | 0.574 | 0.36 | 0.06 | 0.79 | 0.310 | 0.027 |
| Scenario 2: Conservative | 0.139 | 0.111 | 0.623 | 0.216 | 0.140 | 0.140 | 0.23 | 0.11 | 0.62 | 0.255 | 0.023 |
| Scenario 3: Culture and Tourism | 0.067 | 0.778 | 0.311 | 0.723 | 0.286 | 0.286 | 0.41 | 0.07 | 0.78 | 0.435 | 0.038 |
| 2.2. Traditional Landscapes | |||||||||||
| Scenario 1: Broad Integration | 0.777 | 0.111 | 0.066 | 0.057 | 0.200 | 0.429 | 0.27 | 0.06 | 0.78 | 0.234 | 0.017 |
| Scenario 2: Conservative | 0.155 | 0.111 | 0.623 | 0.649 | 0.200 | 0.143 | 0.31 | 0.11 | 0.65 | 0.327 | 0.024 |
| Scenario 3: Culture and Tourism | 0.069 | 0.778 | 0.311 | 0.295 | 0.600 | 0.429 | 0.41 | 0.07 | 0.78 | 0.439 | 0.032 |
| 2.3. Quality of Natural Resources | |||||||||||
| Scenario 1: Broad Integration | 0.794 | 0.111 | 0.069 | 0.061 | 0.633 | 0.633 | 0.38 | 0.06 | 0.79 | 0.347 | 0.028 |
| Scenario 2: Conservative | 0.139 | 0.111 | 0.777 | 0.216 | 0.260 | 0.260 | 0.29 | 0.11 | 0.78 | 0.353 | 0.029 |
| Scenario 3: Culture and Tourism | 0.067 | 0.778 | 0.155 | 0.723 | 0.106 | 0.106 | 0.32 | 0.07 | 0.78 | 0.300 | 0.025 |
| 2.4. Integration of Protected Areas | |||||||||||
| Scenario 1: Broad Integration | 0.794 | 0.200 | 0.083 | 0.061 | 0.746 | 0.286 | 0.36 | 0.06 | 0.79 | 0.326 | 0.027 |
| Scenario 2: Conservative | 0.067 | 0.200 | 0.724 | 0.216 | 0.134 | 0.140 | 0.25 | 0.07 | 0.72 | 0.252 | 0.021 |
| Scenario 3: Culture and Tourism | 0.139 | 0.600 | 0.193 | 0.723 | 0.120 | 0.574 | 0.39 | 0.12 | 0.72 | 0.422 | 0.035 |
| 2.5.Climate Change Mitigation | |||||||||||
| Scenario 1: Broad Integration | 0.818 | 0.143 | 0.061 | 0.333 | 0.429 | 0.574 | 0.39 | 0.06 | 0.82 | 0.375 | 0.023 |
| Scenario 2: Conservative | 0.091 | 0.143 | 0.723 | 0.333 | 0.429 | 0.286 | 0.33 | 0.09 | 0.72 | 0.351 | 0.022 |
| Scenario 3: Culture and Tourism | 0.091 | 0.714 | 0.216 | 0.333 | 0.143 | 0.140 | 0.27 | 0.09 | 0.71 | 0.274 | 0.017 |
| Scenario Evaluation According to Main Criterion 3 – Social Added Value (AV) | |||||||||||
| 3.1. Employment and Social Cohesion | |||||||||||
| Scenario 1: Broad Integration | 0.686 | 0.111 | 0.083 | 0.158 | 0.600 | 0.454 | 0.35 | 0.08 | 0.69 | 0.325 | 0.022 |
| Scenario 2: Conservative | 0.102 | 0.111 | 0.724 | 0.187 | 0.200 | 0.225 | 0.26 | 0.10 | 0.72 | 0.256 | 0.017 |
| Scenario 3: Culture and Tourism | 0.211 | 0.778 | 0.193 | 0.655 | 0.200 | 0.321 | 0.39 | 0.19 | 0.78 | 0.419 | 0.028 |
| 3.2. Cultural and Traditional Vitality | |||||||||||
| Scenario 1: Broad Integration | 0.286 | 0.111 | 0.081 | 0.071 | 0.633 | 0.231 | 0.24 | 0.07 | 0.63 | 0.191 | 0.022 |
| Scenario 2: Conservative | 0.140 | 0.111 | 0.168 | 0.180 | 0.106 | 0.077 | 0.13 | 0.08 | 0.18 | 0.137 | 0.016 |
| Scenario 3: Culture and Tourism | 0.574 | 0.778 | 0.751 | 0.748 | 0.260 | 0.692 | 0.63 | 0.26 | 0.78 | 0.672 | 0.077 |
| 3.3. Local Tourism and Services | |||||||||||
| Scenario 1: Broad Integration | 0.286 | 0.091 | 0.081 | 0.069 | 0.633 | 0.155 | 0.22 | 0.07 | 0.63 | 0.171 | 0.015 |
| Scenario 2: Conservative | 0.140 | 0.091 | 0.168 | 0.155 | 0.106 | 0.069 | 0.12 | 0.07 | 0.17 | 0.127 | 0.011 |
| Scenario 3: Culture and Tourism | 0.574 | 0.818 | 0.751 | 0.777 | 0.260 | 0.777 | 0.66 | 0.26 | 0.82 | 0.702 | 0.060 |
| 3.4. Community Engagement and Quality of Life | |||||||||||
| Scenario 1: Broad Integration | 0.686 | 0.091 | 0.216 | 0.053 | 0.724 | 0.454 | 0.37 | 0.05 | 0.72 | 0.324 | 0.055 |
| Scenario 2: Conservative | 0.102 | 0.091 | 0.061 | 0.474 | 0.083 | 0.225 | 0.17 | 0.06 | 0.47 | 0.167 | 0.029 |
| Scenario 3: Culture and Tourism | 0.211 | 0.818 | 0.723 | 0.474 | 0.193 | 0.321 | 0.46 | 0.19 | 0.82 | 0.509 | 0.087 |
*na – not applicable.
Table A2.
Global Priority Weight of Each Individual Expert.
| Criteria | Expert A | Expert B | Expert C | Expert D | Expert E | Expert F |
|---|---|---|---|---|---|---|
| Main criteria | Global Weight | Global Weight | Global Weight | Global Weight | Global Weight | Global Weight |
| 1. Economic Added Value (AV) | na | na | na | na | na | na |
| 2. Ecological Added Value (AV) | na | na | na | na | na | na |
| 3. Social Added Value (AV) | na | na | na | na | na | na |
| 1. Economic Sub-criteria | ||||||
| 1.1. Agricultural Potential | 0.013 | 0.024 | 0.005 | 0.134 | 0.015 | 0.011 |
| 1.2. Food Processing | 0.015 | 0.054 | 0.005 | 0.072 | 0.011 | 0.017 |
| 1.3. Market Accessibility | 0.019 | 0.126 | 0.015 | 0.015 | 0.006 | 0.030 |
| 1.4. Entrepreneurial Activity | 0.037 | 0.073 | 0.014 | 0.053 | 0.023 | 0.053 |
| 1.5. Infrastructure Investments | 0.007 | 0.057 | 0.049 | 0.046 | 0.028 | 0.114 |
| 2. Ecological Sub-criteria | ||||||
| 2.1. Biodiversity | 0.112 | 0.084 | 0.114 | 0.056 | 0.061 | 0.021 |
| 2.2. Traditional Landscapes | 0.072 | 0.023 | 0.057 | 0.083 | 0.132 | 0.024 |
| 2.3. Quality of Natural Resources | 0.112 | 0.075 | 0.022 | 0.060 | 0.247 | 0.023 |
| 2.4. Integration of Protected Areas | 0.072 | 0.075 | 0.037 | 0.017 | 0.189 | 0.091 |
| 2.5. Climate Change Mitigation | 0.086 | 0.075 | 0.013 | 0.009 | 0.093 | 0.162 |
| 3. Social Sub-criteria | ||||||
| 3.1. Employment and Social Cohesion | 0.045 | 0.064 | 0.039 | 0.136 | 0.015 | 0.148 |
| 3.2. Cultural and Traditional Vitality | 0.136 | 0.081 | 0.188 | 0.147 | 0.031 | 0.087 |
| 3.3. Local Tourism and Services | 0.136 | 0.081 | 0.097 | 0.023 | 0.051 | 0.110 |
| 3.4. Community Engagement and Quality of Life | 0.136 | 0.108 | 0.345 | 0.147 | 0.097 | 0.110 |
| Scenario Evaluation According to Main Criterion 1 – Economic Added Value (AV) | ||||||
| 1.1. Agricultural Potential | ||||||
| Scenario 1: Broad Integration | 0.008 | 0.017 | 0.001 | 0.008 | 0.007 | 0.005 |
| Scenario 2: Conservative | 0.003 | 0.005 | 0.001 | 0.029 | 0.002 | 0.001 |
| Scenario 3: Culture and Tourism | 0.001 | 0.002 | 0.003 | 0.097 | 0.006 | 0.005 |
| 1.2.Food Processing | ||||||
| Scenario 1: Broad Integration | 0.010 | 0.006 | 0.000 | 0.005 | 0.005 | 0.008 |
| Scenario 2: Conservative | 0.003 | 0.006 | 0.003 | 0.030 | 0.002 | 0.002 |
| Scenario 3: Culture and Tourism | 0.002 | 0.042 | 0.001 | 0.058 | 0.005 | 0.007 |
| 1.3. Market Accessibility | ||||||
| Scenario 1: Broad Integration | 0.008 | 0.014 | 0.001 | 0.003 | 0.001 | 0.013 |
| Scenario 2: Conservative | 0.009 | 0.014 | 0.011 | 0.002 | 0.001 | 0.004 |
| Scenario 3: Culture and Tourism | 0.002 | 0.098 | 0.003 | 0.010 | 0.004 | 0.013 |
| 1.4. Entrepreneurial Activity | ||||||
| Scenario 1: Broad Integration | 0.010 | 0.008 | 0.001 | 0.009 | 0.006 | 0.023 |
| Scenario 2: Conservative | 0.023 | 0.008 | 0.010 | 0.007 | 0.002 | 0.008 |
| Scenario 3: Culture and Tourism | 0.004 | 0.056 | 0.003 | 0.036 | 0.015 | 0.023 |
| 1.5. Infrastructure Investments | ||||||
| Scenario 1: Broad Integration | 0.001 | 0.006 | 0.005 | 0.009 | 0.020 | 0.049 |
| Scenario 2: Conservative | 0.003 | 0.006 | 0.031 | 0.007 | 0.002 | 0.016 |
| Scenario 3: Culture and Tourism | 0.003 | 0.044 | 0.013 | 0.030 | 0.005 | 0.049 |
| Scenario Evaluation According to Main Criterion 2 – Ecological Added Value (AV) | ||||||
| 2.1. Biodiversity | ||||||
| Scenario 1: Broad Integration | 0.089 | 0.009 | 0.007 | 0.003 | 0.035 | 0.012 |
| Scenario 2: Conservative | 0.016 | 0.009 | 0.071 | 0.012 | 0.009 | 0.003 |
| Scenario 3: Culture and Tourism | 0.007 | 0.066 | 0.035 | 0.041 | 0.018 | 0.006 |
| 2.2. Traditional Landscapes | ||||||
| Scenario 1: Broad Integration | 0.056 | 0.003 | 0.004 | 0.005 | 0.026 | 0.010 |
| Scenario 2: Conservative | 0.011 | 0.003 | 0.036 | 0.054 | 0.026 | 0.003 |
| Scenario 3: Culture and Tourism | 0.005 | 0.018 | 0.018 | 0.024 | 0.079 | 0.010 |
| 2.3. Quality of Natural Resources | ||||||
| Scenario 1: Broad Integration | 0.089 | 0.008 | 0.002 | 0.004 | 0.157 | 0.014 |
| Scenario 2: Conservative | 0.016 | 0.008 | 0.017 | 0.013 | 0.064 | 0.006 |
| Scenario 3: Culture and Tourism | 0.007 | 0.059 | 0.003 | 0.043 | 0.026 | 0.002 |
| 2.4. Integration of Protected Areas | ||||||
| Scenario 1: Broad Integration | 0.057 | 0.015 | 0.003 | 0.001 | 0.141 | 0.026 |
| Scenario 2: Conservative | 0.005 | 0.015 | 0.027 | 0.004 | 0.025 | 0.013 |
| Scenario 3: Culture and Tourism | 0.010 | 0.045 | 0.007 | 0.013 | 0.023 | 0.052 |
| 2.5.Climate Change Mitigation | ||||||
| Scenario 1: Broad Integration | 0.070 | 0.011 | 0.001 | 0.003 | 0.040 | 0.093 |
| Scenario 2: Conservative | 0.008 | 0.011 | 0.009 | 0.003 | 0.040 | 0.046 |
| Scenario 3: Culture and Tourism | 0.008 | 0.054 | 0.003 | 0.003 | 0.013 | 0.023 |
| Scenario Evaluation According to Main Criterion 3 – Social Added Value (AV) | ||||||
| 3.1. Employment and Social Cohesion | ||||||
| Scenario 1: Broad Integration | 0.031 | 0.007 | 0.003 | 0.021 | 0.009 | 0.067 |
| Scenario 2: Conservative | 0.005 | 0.007 | 0.028 | 0.025 | 0.003 | 0.033 |
| Scenario 3: Culture and Tourism | 0.010 | 0.050 | 0.007 | 0.089 | 0.003 | 0.047 |
| 3.2. Cultural and Traditional Vitality | ||||||
| Scenario 1: Broad Integration | 0.039 | 0.009 | 0.015 | 0.011 | 0.019 | 0.020 |
| Scenario 2: Conservative | 0.019 | 0.009 | 0.032 | 0.027 | 0.003 | 0.007 |
| Scenario 3: Culture and Tourism | 0.078 | 0.063 | 0.141 | 0.110 | 0.008 | 0.060 |
| 3.3. Local Tourism and Services | ||||||
| Scenario 1: Broad Integration | 0.039 | 0.007 | 0.008 | 0.002 | 0.032 | 0.017 |
| Scenario 2: Conservative | 0.019 | 0.007 | 0.016 | 0.004 | 0.005 | 0.008 |
| Scenario 3: Culture and Tourism | 0.078 | 0.066 | 0.073 | 0.018 | 0.013 | 0.085 |
| 3.4. Community Engagement and Quality of Life | ||||||
| Scenario 1: Broad Integration | 0.094 | 0.010 | 0.074 | 0.008 | 0.070 | 0.050 |
| Scenario 2: Conservative | 0.014 | 0.010 | 0.021 | 0.070 | 0.008 | 0.025 |
| Scenario 3: Culture and Tourism | 0.029 | 0.089 | 0.249 | 0.070 | 0.019 | 0.035 |
*na – not applicable.
References
- Cardillo, M.C.; De Felice, P. A potential example of sustainability in the Italian rural landscape: the Valle di Comino biodistrict in southern Lazio. BelGeo. 2022, 4. [Google Scholar] [CrossRef]
- Lamine, C.; Pugliese, P.; Barataud, F.; Berti, G.; Rossi, A. Italian biodistricts and French territorial food projects: how science-policy-experience interplays shape the framings of transitions towards sustainable territorial food systems. Front. Sustain. Food Syst. 2023, 7, 1223270. [Google Scholar] [CrossRef]
- Stefanovic, L.; Agbolosoo-Mensah, O.A. Biodistricts as a tool to revitalize rural territories and communities: insights from the biodistrict Cilento. Front. Sustain. Food Syst. 2023, 7, 1267985. [Google Scholar] [CrossRef]
- Kraljevic, B.; Zanasi, C. Drivers affecting the relation between biodistricts and school meals initiatives: evidence from the Cilento biodistrict. Front. Sustain. Food Syst. 2023, 7, 1235871. [Google Scholar] [CrossRef]
- Passaro, A.; Randelli, F. Spaces of sustainable transformation at territorial level: an analysis of biodistricts and their role for agroecological transitions. Agroecol. Sustain. Food Syst. 2022, 46, 1198–1223. [Google Scholar] [CrossRef]
- Mazzocchi, C.; Orsi, L.; Bergamelli, C.; Sturla, A. Bio-districts and the territory: evidence from a regression approach. Aestimum. 2021, 79, 5–23. [Google Scholar] [CrossRef]
- Pugliese, P.; Antonelli, A.; Basile, S. Full case study report: Bio-Distretto Cliento –Italy. Available online: https://orgprints.org/id/eprint/29252/7/29252.pdf (accessed on 04.07.2025).
- Favilli, E.; Ndah, T.H.; Barabanova, Y. Multi-actor interaction and coordination in the development of a territorial innovation project: some insights from the Cilento Bio‐district in Italy. In Proceedings of the 13th European IFSA Symposium, Chania, Greece (05.07.2018). Available online: https://www.cabidigitallibrary.org/doi/pdf/10.5555/20183360701 (accessed on 08.03.2024).
- Belliggiano, A.; Bindi, L.; Ievoli, C. Walking along the sheeptrack: Rural tourism, ecomuseums, and bio-cultural heritage. Sustainability. 2021, 13, 8264. [Google Scholar] [CrossRef]
- Stotten, R.; Bui, S.; Pugliese, P.; Schermer, M.; Lamine, C. Organic values-based supply chains as a tool for territorial development: a comparative analysis of three European organic regions. IJSAF. 2017, 24, 135–154. [Google Scholar] [CrossRef]
- Cuoco, E.; Salvatore, B.; BIO-DISTRICTS to boost organic production. The best practices of BioDistretto Cilento. Available online: https://orgprints.org/id/eprint/23977/7/23977.pdf (accessed on 09.02.2025).
- Zanasi, C.; Basile, S.; Paoletti, F.; Pugliese, P.; Rota, C. Design of a Monitoring Tool for Eco-Regions. Front. Sustain. Food Syst. 2020, 4, 536392. [Google Scholar] [CrossRef]
- Poponi, S.; Arcese, G.; Mosconi, E.M.; Pacchera, F.; Martucci, O.; Elmo, G.C. Multi-Actor Governance for a Circular Economy in the Agri-Food Sector: Bio-Districts. Sustainability. 2021, 13, 4718. [Google Scholar] [CrossRef]
- Guareschi, M.; Maccari, M.; Sciurano, J.; Arfini, F.; Pronti, A. A methodological approach to upscale toward an agroecology system in EU-LAFSS: the case of the Parma bio-district. Sustainability. 2020, 12, 5398. [Google Scholar] [CrossRef]
- Gargano, G.; Licciardo, F.; Verrascina, M.; Zanetti, B. The agroecological approach as a model for multifunctional agriculture and farming towards the European Green Deal 2030: Some evidence from the Italian experience. Sustainability. 2021, 13, 2215. [Google Scholar] [CrossRef]
- Naglis-Liepa, K.; Proškina, L.; Paula, L.; Kaufmane, D. Modelling the multiplier effect of a local food system. Agron. Res. 2021, 19, 1075–1086. [Google Scholar] [CrossRef]
- Naglis-Liepa, K.; Paula, L.; Janmere, L.; Kauf-mane, D.; Proškina, L. Local food development perspectives in Latvia: A val-ue-oriented view. Sustainability. 2022, 14, 2589. [Google Scholar] [CrossRef]
- Assiri, M.; Barone, V.; Silvestri, F.; Tassinari, M. Planning sustainable development of local productive systems: A methodological approach for the analytical identification of Ecoregions. J. Clean. Prod. 2021, 287, 125006. [Google Scholar] [CrossRef]
- Naglis-Liepa, K.; Megne, I.; Proskina, L.; Paula, L.; Kaufmane, D.; Pelse, M. Analysis of Factors Influencing the Formation of Bioregions. Sustainability. 2025, 17, 8288. [Google Scholar] [CrossRef]
- Saaty, T.L. The analytic hierarchy process. Publisher: McGraw-Hill International Book Co. New York-London, 1980; p. 287.
- Saaty, T.L.; Vargas, L.G. Models, Methods, Concepts & Applications of the Analytic Hierarchy Process Second Edition. Publisher: Springer Science Business Media, New York, USA, 2012; p. 341. [CrossRef]
- Szabo, Z.K.; Szádoczki, Z.; Bozóki, S.; Stănciulescu, G.C.; Szabo, D. An Analytic Hierarchy Process Approach for Prioritisation of Strategic Objectives of Sustainable Development. Sustainability. 2021, 13, 2254. [Google Scholar] [CrossRef]
- Monteiro, R.; Ferreira, J.C.; Antunes, P. Green Infrastructure Planning Principles: Identification of Priorities Using Analytic Hierarchy Process. Sustainability. 2022, 14, 5170. [Google Scholar] [CrossRef]
- Yrlioglu, I.; Kara, C. Sustainable Urban Design Approach for Public Spaces Using an Analytical Hierarchy Process (AHP). Land. 2025, 14, 19. [Google Scholar] [CrossRef]
- Feltynowski, M.; Szajt, M. The Analytic Hierarchy Process (AHP) in Rural Land-use Planning in Poland: A Case Study of Zawidz Commune. PPR, 2020, 36, 108–119. [Google Scholar] [CrossRef]
- Oleniacz, G.; Skrzypczak, I.; Leń, P. Decision-making models using the Analytical Hierarchy Process in the urgency of land consolidation works. J. Water Land Dev. 2019, 43, 144–150. [Google Scholar] [CrossRef]
- Palka, G.; Oliveira, E.; Pagliarin, S.; Hersperger, A.M. Strategic spatial planning and efficacy: an analytic hierarchy process (AHP) approach in Lyon and Copenhagen. Eur. Plan. Stud. 2020, 29, 1174–1192. [Google Scholar] [CrossRef]
- Schmidt, K.; Babac, A.; Pauer, F.; Damm, K.; von der Schulenburg, J.M. Measuring patients' priorities using the Analytic Hierarchy Process in comparison with Best-Worst-Scaling and rating cards: methodological aspects and ranking tasks. Health Econ. Rev. 2016, 6, 50. [Google Scholar] [CrossRef]
- Pauer, F.; Schmidt, K.; Babac, A.; Damm, K.; Frank, K.; Graf von der Schulenburg, M. Comparison of different approaches applied in Analytic Hierarchy Process – an example of information needs of patients with rare diseases. BMC med. inform. decis. Mak. 2016, 16, 117. [Google Scholar] [CrossRef]
- Salomon, V.A.P.; Gomes, L.F.A.M. Consistency Improvement in the Analytic Hierarchy Process. Mathematics. 2024, 12, 828. [Google Scholar] [CrossRef]
- Auzins, A. Evaluation and Management of Land Use. Scientific Monograph. Publisher: RTU Izdevniecība, Rīga, Latvia 2016; p.270. https://wpweb2-prod.rtu.lv/ebooks/wp-content/uploads/sites/32/2020/02/9789934223921_Zemes-izmantosanas-PDF.pdf.
- Jeroscenkova, L.; Rivza, B.; Rivza, P. Decision making on the use of cultural heritage in rural tourism development in Latvia. Res. Rural Dev. 2016, 2, 233–237. [Google Scholar]
- Whitaker, R. Validation examples of the Analytic Hierarchy Process and Analytic Network Process. Math. Comput. Model. 2007, 46, 840–859. [Google Scholar] [CrossRef]
- Tabellini, G. Culture and Institutions: Economic Development in the Regions of Europe. J. Eur. Econ. Assoc. 2010, 8, 77–716. [Google Scholar] [CrossRef]
- Kalvāns, Ē. Socially demographic portrait of a happy and unhappy resident of Latgale. Society Integration Education. Proceedings of the International Scientific Conference. 2018, 7, 84–94. [Google Scholar] [CrossRef]
- Basile, S.; Cuoco, E. Territorial bio-districts to boost organic production. Available online: https://www.ideassonline.org/public/pdf/BrochureBiodistrettiENG.pdf (accessed on 01.08.2025).
Figure 1.
Structure of AHP hierarchies for the bioregion development scenarios.
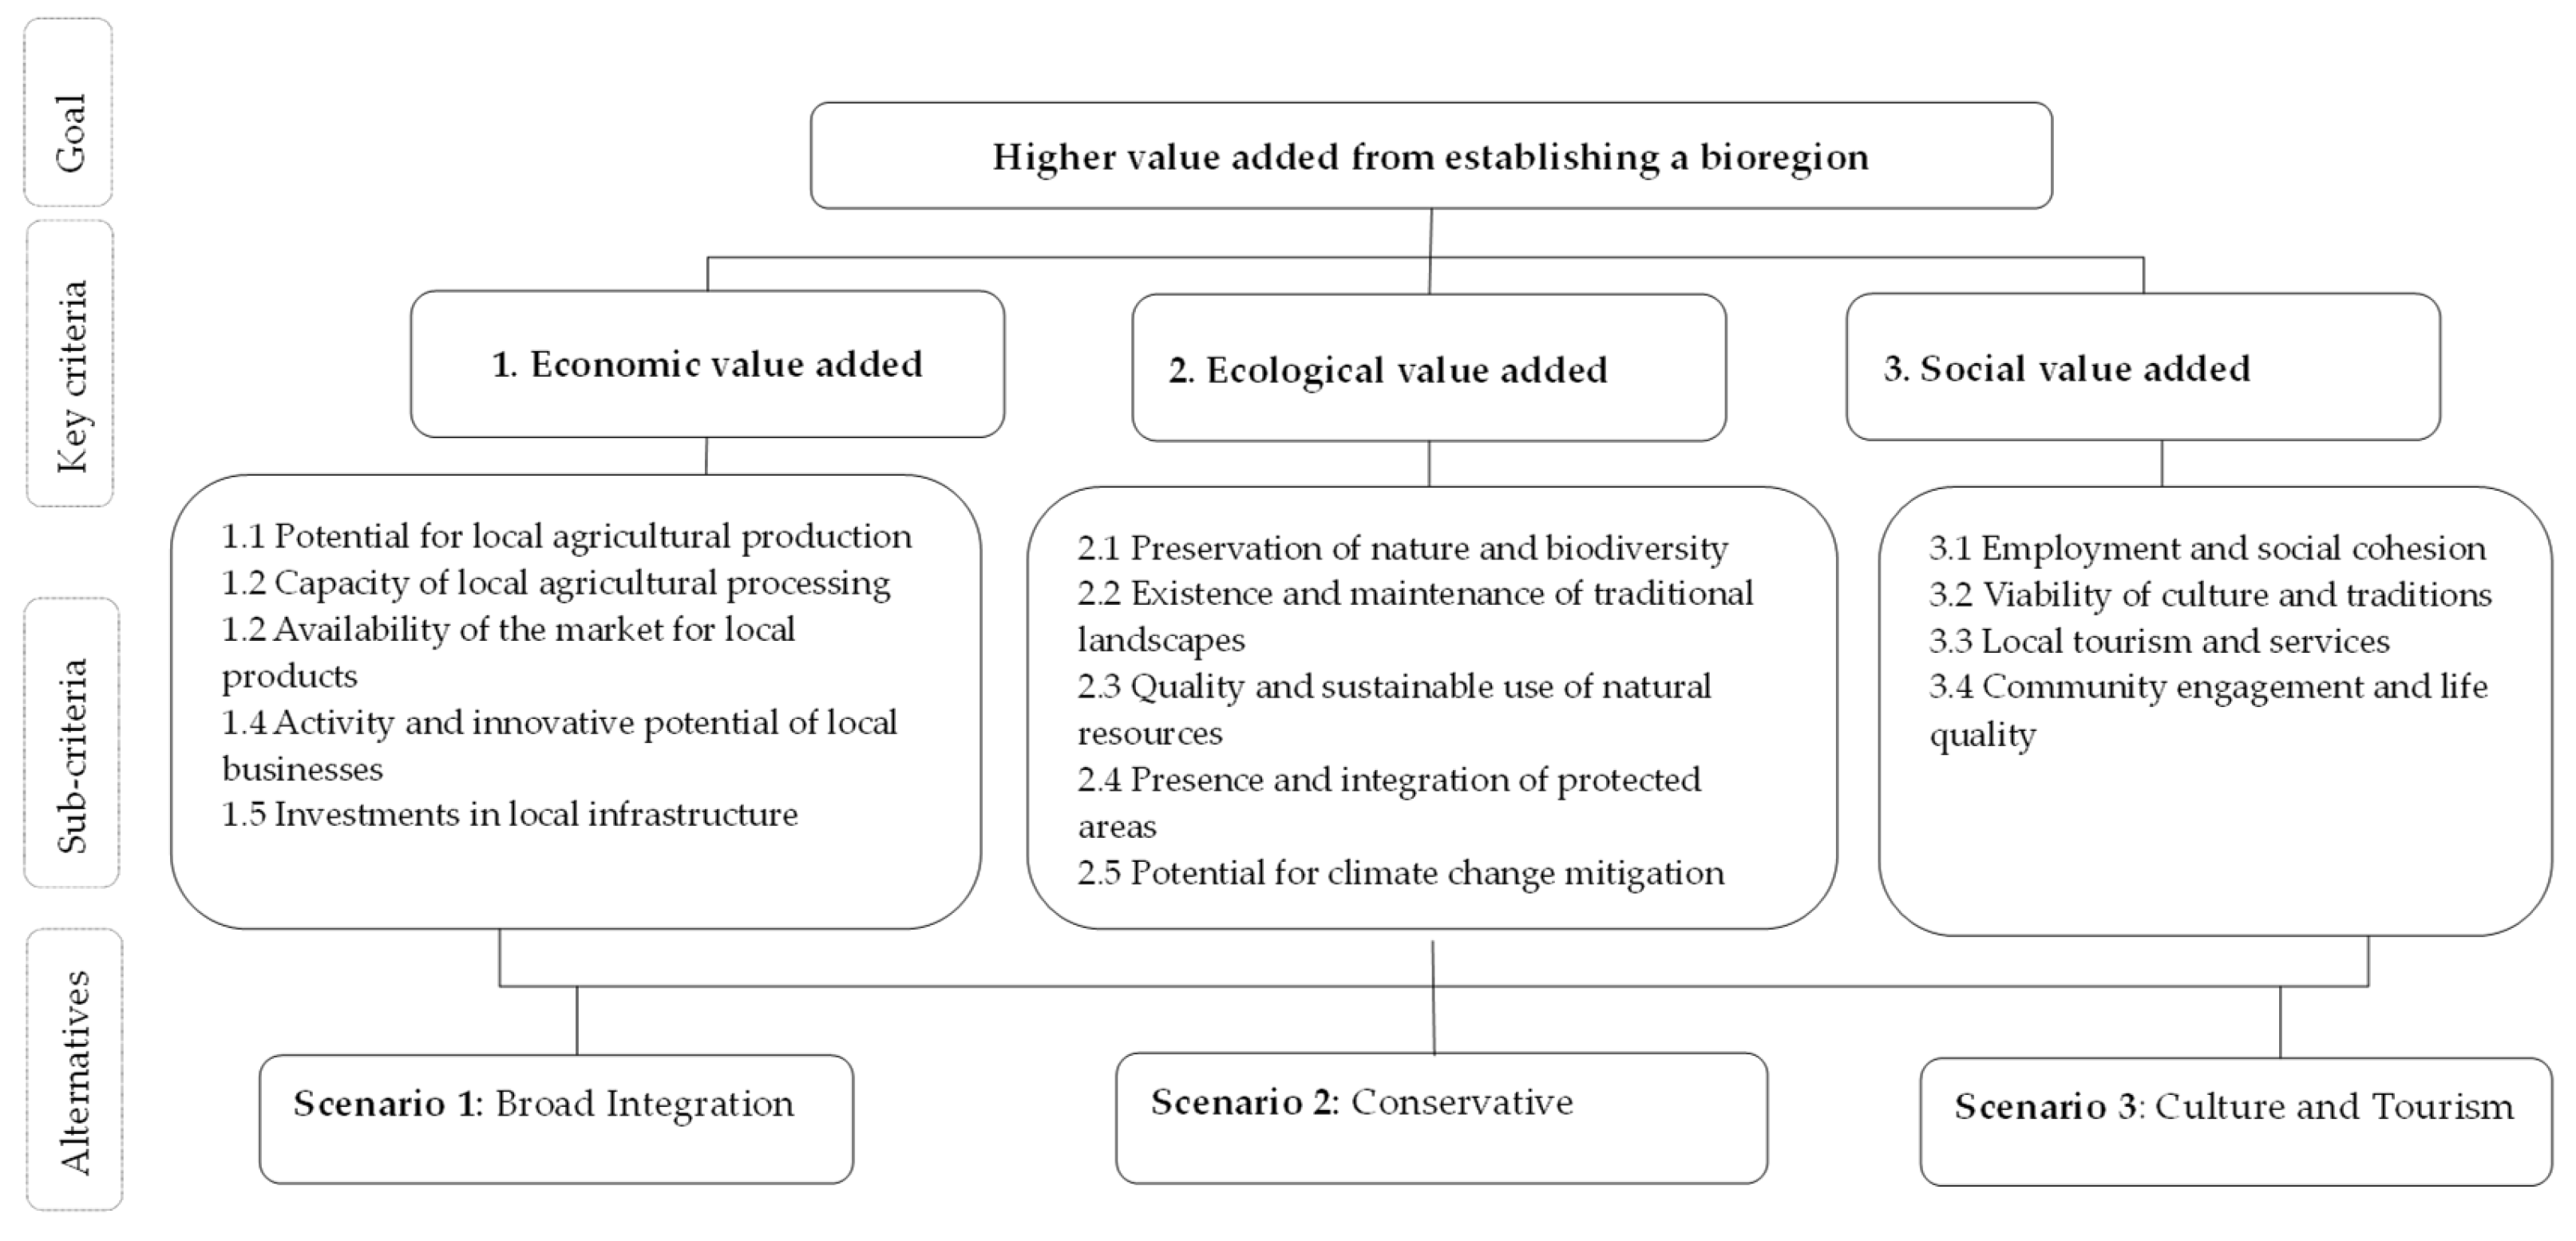
Figure 2.
Global priority vector weights of the impact of the scenarios according to the experts.
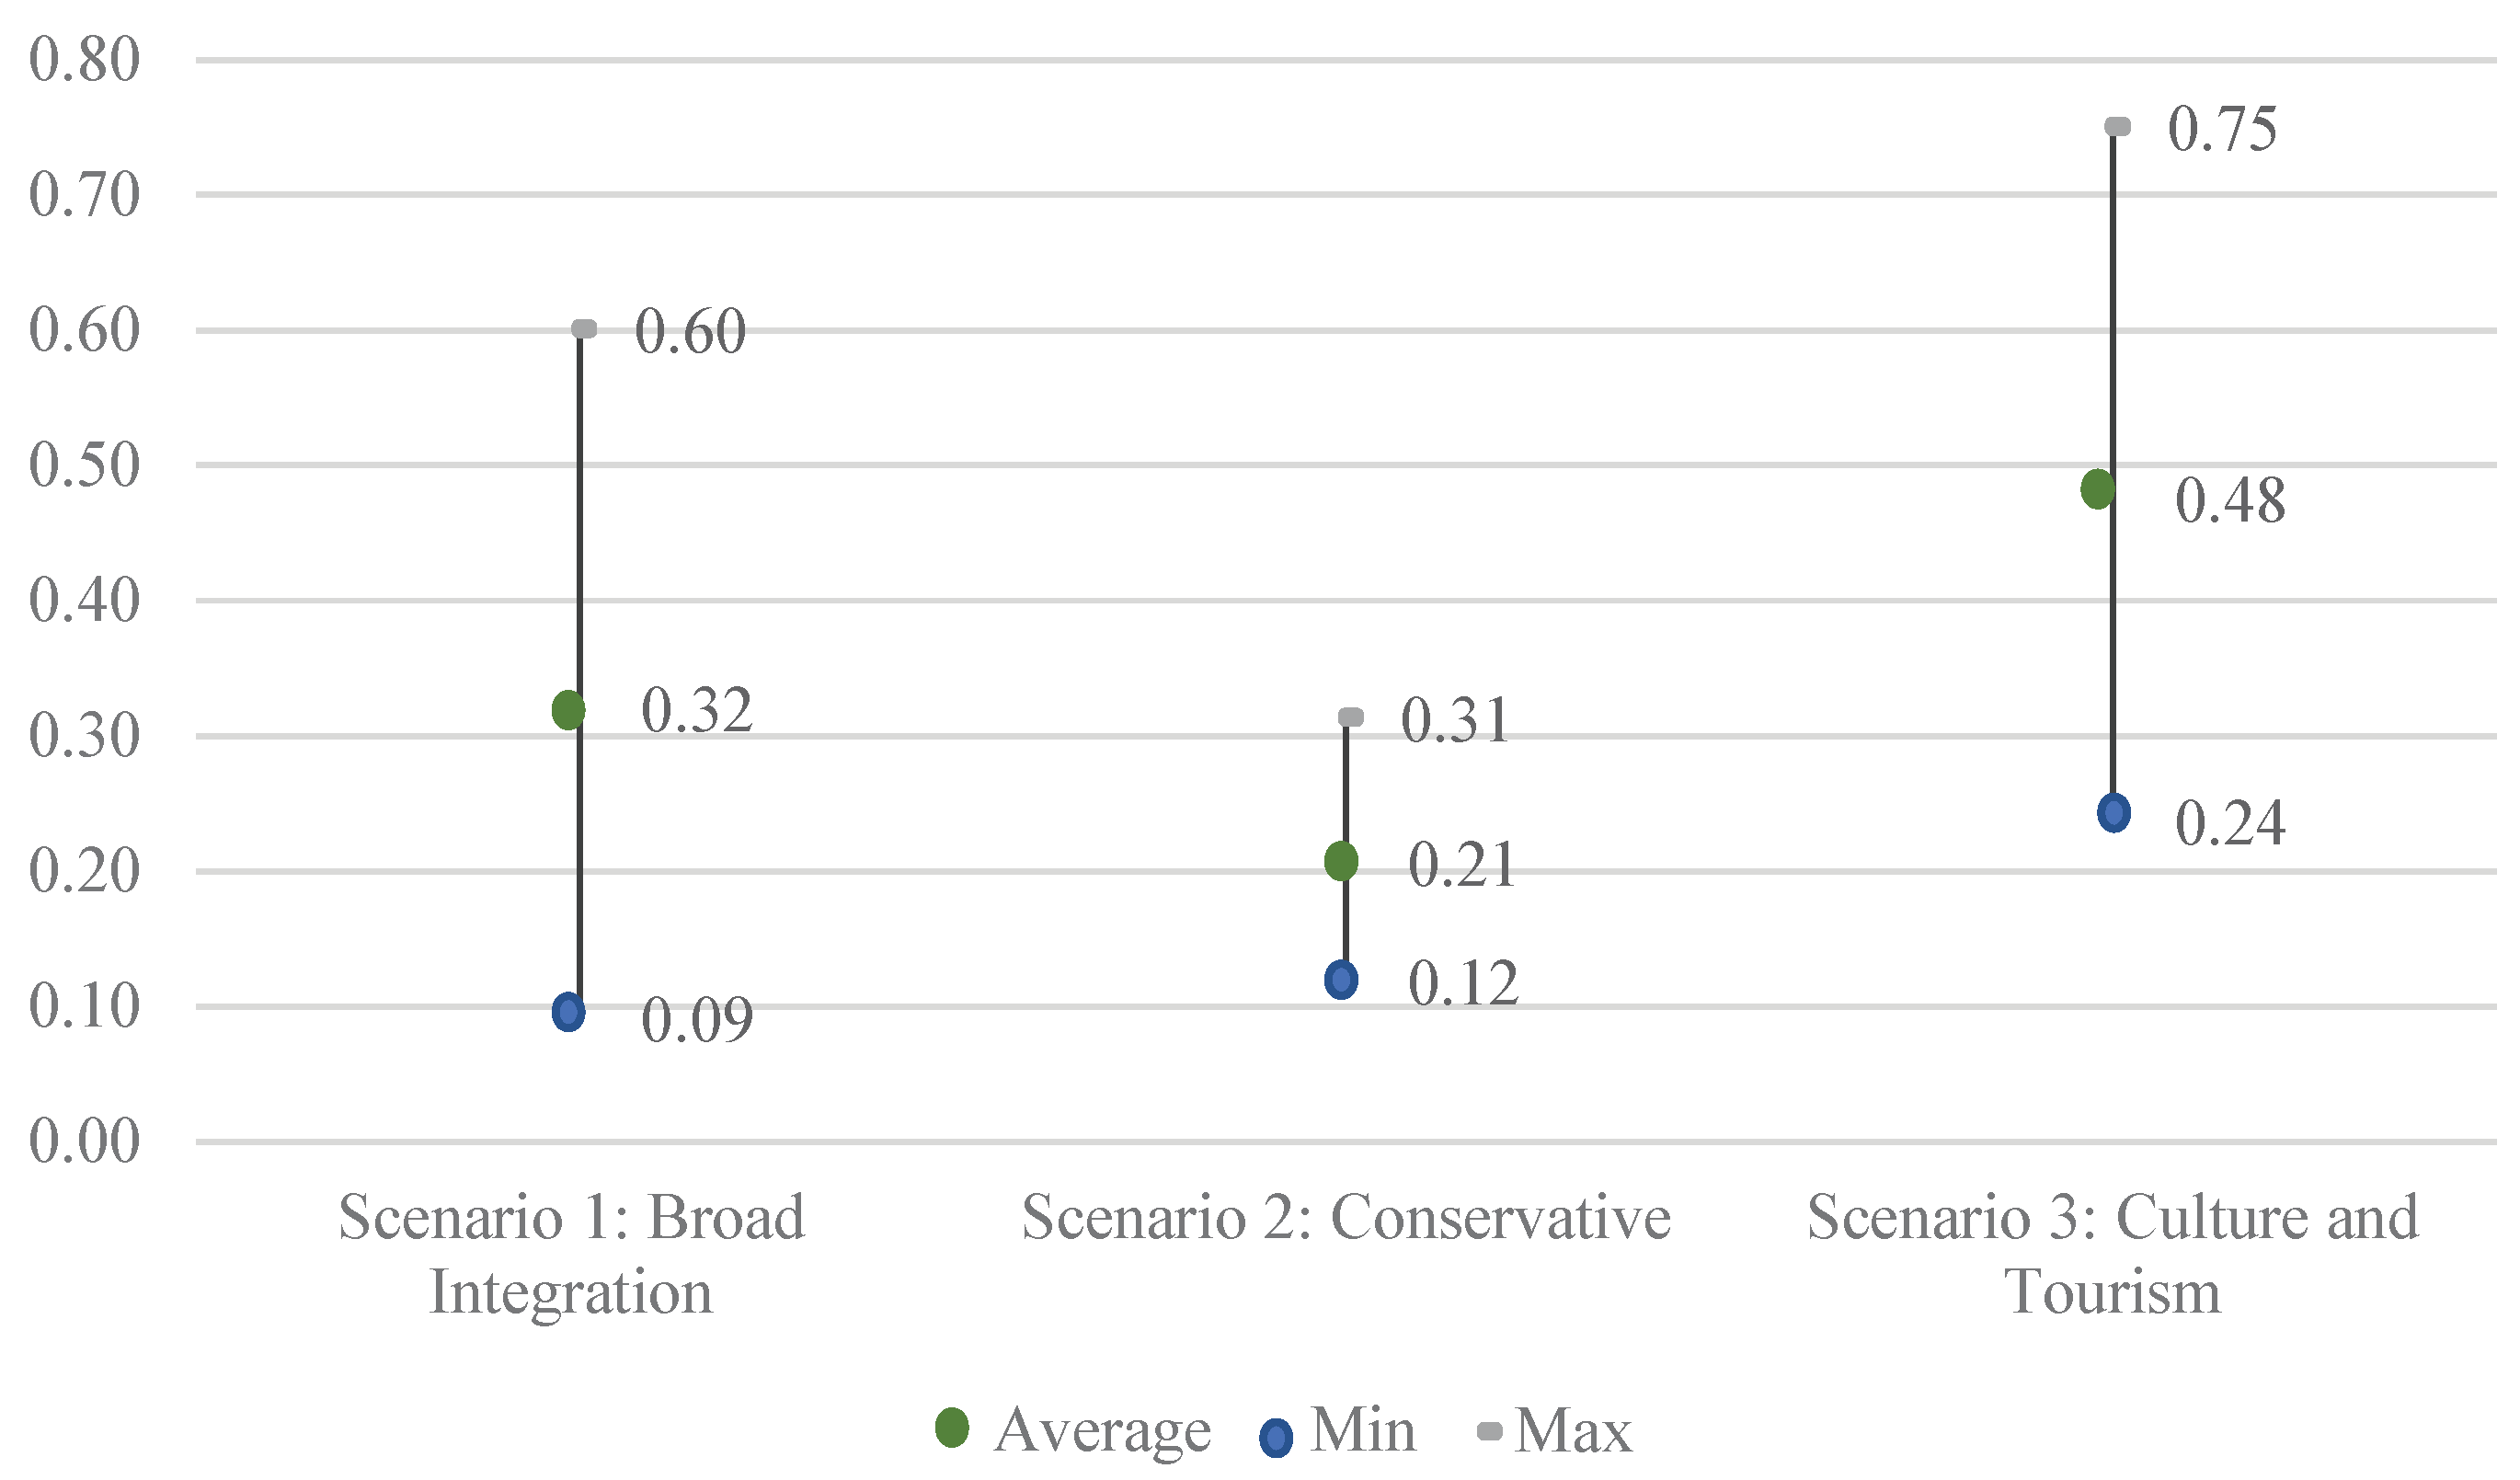
Table 1.
AHP relative significance scale.
| Rating | Relative Significance | Notes |
|---|---|---|
| 1 | Both elements are equally significant | No advantages for either |
| 3 | One of the elements is slightly more significant | Slight advantage |
| 5 | More significant | Clear advantage |
| 7 | Much more significant | Very pronounced advantage |
| 9 | Absolutely more significant | One of the elements clearly prevails |
| 2, 4, 6, 8 | Intermediate values | Used only in the case of an ultimate compromise if the significance is between two degrees |
Table 2.
Ratings of the main criteria by the experts.
| Main Criteria | Individual Expert Ratings of Criteria (Weight) | Combined Weight of Expert Group Criteria | |||||
|---|---|---|---|---|---|---|---|
| A | B | C | D | E | F | ||
| 1.Economic value added | 0.091 | 0.333 | 0.088 | 0.321 | 0.083 | 0.225 | 0.173 |
| 2.Ecological value added | 0.455 | 0.333 | 0.243 | 0.225 | 0.724 | 0.321 | 0.387 |
| 3.Social value added | 0.455 | 0.333 | 0.669 | 0.454 | 0.193 | 0.454 | 0.439 |
Table 3.
Ratings of the subcriteria by the experts.
| Criteria | Individual Expert Ratings of Criteria (Weight) | Criterion Weight | Global Criterion Weight | |||||
|---|---|---|---|---|---|---|---|---|
| A* | B | C | D | E | F | |||
| Economic value added | ||||||||
| 1.1. Agricultural potential | 0.142 | 0.073 | 0.058 | 0.419 | 0.182 | 0.050 | 0.133 | 0.023 |
| 1.2. Food processing | 0.166 | 0.162 | 0.058 | 0.226 | 0.137 | 0.075 | 0.146 | 0.025 |
| 1.3. Market access | 0.214 | 0.377 | 0.170 | 0.048 | 0.069 | 0.134 | 0.160 | 0.028 |
| 1.4. Entrepreneurial activity | 0.404 | 0.218 | 0.163 | 0.164 | 0.275 | 0.237 | 0.275 | 0.048 |
| 1.5. Infrastructure investments | 0.074 | 0.171 | 0.550 | 0.143 | 0.336 | 0.504 | 0.287 | 0.050 |
| Ecological value added | ||||||||
| 2.1. Biodiversity | 0.247 | 0.253 | 0.467 | 0.249 | 0.085 | 0.064 | 0.228 | 0.088 |
| 2.2. Traditional landscapes | 0.159 | 0.069 | 0.236 | 0.367 | 0.183 | 0.076 | 0.187 | 0.072 |
| 2.3. Quality of natural resources | 0.247 | 0.226 | 0.091 | 0.266 | 0.342 | 0.071 | 0.212 | 0.082 |
| 2.4. Integration of protected areas | 0.159 | 0.226 | 0.154 | 0.078 | 0.262 | 0.283 | 0.212 | 0.082 |
| 2.5. Climate change mitigation | 0.189 | 0.226 | 0.052 | 0.040 | 0.129 | 0.506 | 0.161 | 0.062 |
| Social value added | ||||||||
| 3.1. Employment and social cohesion | 0.100 | 0.192 | 0.058 | 0.300 | 0.077 | 0.325 | 0.154 | 0.068 |
| 3.2. Viability of culture and traditions | 0.300 | 0.242 | 0.282 | 0.325 | 0.159 | 0.192 | 0.261 | 0.115 |
| 3.3. Local tourism and services | 0.300 | 0.242 | 0.145 | 0.051 | 0.263 | 0.242 | 0.196 | 0.086 |
| 3.4. Community engagement and quality of life | 0.300 | 0.325 | 0.515 | 0.325 | 0.501 | 0.242 | 0.389 | 0.171 |
Disclaimer/Publisher’s Note: The statements, opinions and data contained in all publications are solely those of the individual author(s) and contributor(s) and not of MDPI and/or the editor(s). MDPI and/or the editor(s) disclaim responsibility for any injury to people or property resulting from any ideas, methods, instructions or products referred to in the content. |
© 2025 by the authors. Licensee MDPI, Basel, Switzerland. This article is an open access article distributed under the terms and conditions of the Creative Commons Attribution (CC BY) license (http://creativecommons.org/licenses/by/4.0/).
Copyright: This open access article is published under a Creative Commons CC BY 4.0 license, which permit the free download, distribution, and reuse, provided that the author and preprint are cited in any reuse.


