
Submitted:
20 November 2025
Posted:
21 November 2025
You are already at the latest version
Abstract
With climate change contributing to soil moisture deficits, effective methods for water re-tention and rational water management are being sought. One solution to provide water for crops during periods of dry weather is the use of superabsorbents (SAP). The aim of this study was to determine the response of selected legume species to various doses of superabsorbent.
The two-year experiments were set up in a randomised block design, with 4 replicates. The test factor was the dose of hydrogel, also known as superabsorbent: 0-control treat-ment (SAP0), 20 kg·ha-1 (SAP20) and 30 kg·ha-1 (SAP30). In the first experiment, the test object was Vicia faba L. cultivar Granit, and in the second experiment, Pisum sativum L. cul-tivar Batuta (narrow-leaved).
The results of our study demonstrated a significant effect of superabsorbent application on the yield of faba beans and peas, with SAP application at a dose of 20 kg ha-1 being the most beneficial. The SAP doses used did not differentiate the factors influencing seed yield in faba bean. However, in peas, an increase in pod number and seed number per plant was observed with the SAP30 dose compared to the SAP20 dose. Application of super-absorbent at a dose of 20 kg ha-1 significantly increased photosynthesis rate in faba bean, the Fv/Fm index in the tested species, and the PI index in peas compared to the control. However, the superabsorbent did not affect transpiration rate or the WUE coefficient in the tested legume species. Significantly higher yields in faba bean and pea and all tested plant structure parameters in pea were recorded in 2018 compared to 2017. The tested parame-ters of gas exchange and chlorophyll fluorescence were higher in pea in 2018 (except for transpiration intensity) and in faba bean in 2017.
Keywords:
SAP
; superabsorbent
; superabsorbent polymer
; legumes
; pea
; faba bean
; photosynthesis
; transpiration
; chlorophyll fluorescence
; leaf greenness index
1. Introduction
Meeting food requirements is fundamental to the hierarchy of human needs and is a key element of global food security. Plant production, as the first level of agricultural activity, provides raw materials not only for direct consumption but also for the production of animal feed. In the face of a growing population, changing climatic conditions and limited natural resources, ensuring stable sources of protein is becoming one of the most important challenges of modern agriculture [1].
Legumes, belonging to the Fabaceae family, play an important role in food and agricultural systems. Their seeds are high in protein, making them a valuable component of both human and animal diets. In addition, these plants have the ability to fix atmospheric nitrogen through symbiosis with nodule bacteria, which improves soil fertility and reduces the need for mineral nitrogen [2,3]. In the context of feed protein deficits in European Union countries, including Poland, legumes are a potential alternative to imported soybean meal, more than 90% of which comes from genetically modified plants [4].
Despite their high utility value, legumes exhibit high yield variability, which results from their sensitivity to agrotechnical, habitat and weather factors [5]. Soil water deficiency causes disturbances in basic physiological processes, changes in metabolism and nutrient distribution, and reduced biomass production [6]. The main mechanism of plant growth is photosynthesis, which is inhibited and disrupted as a result of drought [7,8]. Proper photosynthesis and the transport and distribution of assimilates determine plant growth and agricultural yield, which is the end result of the processes occurring in the plant. Under conditions of water deficit, plant cells do not elongate naturally and terminate their growth prematurely. In the initial period of drought, plants activate defense mechanisms, i.e., they close their stomata and thus limit transpiration, but also the penetration of CO2 into the cells, which in turn inhibits the process of photosynthesis. However, under conditions of prolonged stress, more serious disturbances in cellular metabolism occur, although the response of individual plant species to stress is not uniform. This depends on the degree of protoplast shrinkage during cell dehydration and the ability to efficiently and reversibly rehydrate, which we observe in drought-resistant plants [9].
The inhibition and disruption of photosynthesis causes plant dysfunction, which is of great diagnostic value and can be one of the ways to assess a plant response to stress. Therefore, optimising water use is a key factor in achieving productivity goals within sustainable production systems [1].
During water stress, there is a reduction in the content of proteins and chlorophyll pigments. Chloroplasts release less oxygen, which is associated with damage to photosystems, especially photosystem II (PSII), and cause changes in chlorophyll a fluorescence [9,10]. It is assumed that the amount of fluorescence is inversely proportional to the intensity of photosynthesis. According to Kalaji et al. [11], chlorophyll fluorescence is a measure of the state and condition of the photosynthetic apparatus. On average, there is about three times more chlorophyll a than b in leaves. Chlorophyll a fluorescence is emitted from healthy leaves and comes almost exclusively from chlorophyll a molecules located mainly in photosystem II (PSII), and is therefore an indicator of its function [12]. The measurement of chlorophyll a fluorescence can therefore be a good indicator of the impact of stress factors on the functioning of the photosynthetic apparatus and the health and vitality of the plant [13]. The use of fluorometric methods allows recording very early changes occurring in PSII in response to a stress factor, often even before other symptoms appear [14].
One promising solution for limiting the effects of drought in legume cultivation is the use of superabsorbents (SAP). These are polymers with a high water retention capacity which, when introduced into the soil, improve its water capacity, reduce moisture loss and improve water availability for plants. Studies show, that SAPs can significantly improve photosynthesis parameters, chlorophyll content and water use efficiency in legumes under water stress conditions [15,16]. Their use supports the functioning of PSII, stabilises cellular metabolism and increases plant resistance to drought, which translates into higher yields and better quality raw materials.
The aim of the study was to determine the response of peas and faba bean to various doses of superabsorbent.
2. Materials and Methods
The research was conducted on the basis of two field experiments carried out at the Agricultural Experimental Station belonging to the Institute of Soil Science and Plant Cultivation – State Research Institute in Puławy, located in Grabów nad Wisłą (Masovian voivodeship). The experiments were conducted on loamy soil, formed on light clay – class IIIb, IVa. The soil pHKCl ranged between 5.3-6.0. The content of available forms of macronutrients ranged from (mg·100g-1 soil): P – 12.9-19.3; K – 10.6-13.4; Mg – 4.7-9.8. The organic carbon content was 0.76-0.80%.
The two-year experiments were set up in a randomised block design, with 4 replicates. The test factor was the rate of hydrogel, also known as superabsorbent - 0-control treatment (SAP0), 20 kg·ha-1 (SAP20) and 30 kg·ha-1 (SAP30). In the first experiment, the test object was Vicia faba L. cultivar Granit, and in the second experiment, Pisum sativum L. cultivar Batuta (narrow-leaved). The area of the experimental treatment was 30 m² (26.9 m² for harvesting).
Potassium-based cross-linked acrylic polymer ‘Terra hydrogel Aqua’ was used, which was mixed with the soil using a passive cultivation unit to a depth of 15 cm. Before sowing, the seeds were treated with a fungicide (Funaben T – 200 g·100 kg-1 of seeds). Seeds were sown at a depth of 8-10 cm for faba bean and 5-8 cm for peas, with a spacing of 24 cm, at the optimal time.
Weather conditions varied during the years of the study (Figure 1). Comparing the thermal conditions during the years of the experiment, it was found that the average monthly temperature during the growing season was higher in 2018 than in 2017. The average monthly air temperature during this period in 2017 and 2018 was higher, compared to the long-term averages. The total precipitation during the growing season in 2017 was 380.6 mm, being the closest to the long-term average (376 mm). The year 2018 was deficient in terms of precipitation (320.1 mm).
The characteristics of thermal and precipitation conditions in the two analysed growing seasons were described using Selianinov’s Hydrothermal Coefficient [17], also known as the water security coefficient or conventional moisture balance (Table 1). The index (k) defines the ratio of total precipitation to the sum of average daily air temperatures in a given period.
where:
k = (10∙P)/(∑t)
P - monthly total precipitation (mm),
Ʃt - sum of average daily temperatures in a given month > 0 °C.
After the plants emerged, the plant density (plants per m-1) was calculated for each treatment, which averaged over the years for faba bean: SAP0 - 35.5 ,SAP20 - 45.7 , SAP30 - 46.2 and for peas: SAP0 -63.9 ,SAP20 – 68.8 , SAP30 – 57.7 During the growing season, observations of the developmental stages of individual legume species were carried out according to Bleiholder et al. [18]. In selected developmental stages (BBCH 60, 65, 70, 75, 82 for faba bean and BBCH 51, 67, 75, and 82 for peas), measurements were taken of the intensity of basic gas exchange processes (photosynthesis, transpiration), chlorophyll fluorescence indices (Fv/Fm, PI) and leaf greenness index (SPAD) were measured. The measurements were taken on the second fully developed leaf, in the middle part of the leaf blade.
The photosynthetic efficiency of pea and faba bean leaves was assessed on the basis of measurements of net photosynthesis (PN) [μmol CO2 m-2·s-1] and transpiration intensity (E) [mmol H2O m-2·s-1], performed with a portable CIRAS-2 device (PP-Systems Company, WB, USA). The measurements were performed in four replicates, at constant PAR radiation intensity parameters – 1200 µmol·m-2·s-1, CO2 – 390 ppm (µmol CO2 ·mol-1) of air) and a temperature ranging from 20 to 27ºC. Based on the instantaneous values of photosynthesis and transpiration, the photosynthetic water use efficiency (WUE) was calculated according to the formula WUE = PN / E [19,20].
Direct chlorophyll a fluorescence measurements were performed using a non-invasive (in vivo) method with a PocketPEA fluorometer (Hansatech Instruments – WB). Two indicators were assessed: Fv/Fm (maximum quantum efficiency of photosystem II) and PI (photosystem II performance index). Chlorophyll fluorescence indices were used to determine the efficiency of the photosynthetic apparatus and to assess the physiological state of plants. The measurements were carried out after 20 minutes of leaf adaptation in the dark, in 9 repetitions.
Leaf greenness index (SPAD) measurements were performed using a SPAD – HYDRO N-TesterTM chlorophyll meter. The result is given in digital form, in so-called SPAD (Soil and Plant Analysis Development) units, ranging from 0 to 800. The value of the reading is proportional to the chlorophyll content in the tested leaf area (6 mm²). The measurements were performed in 4 repetitions (one repetition as the average of 30 measurements).
Before harvesting, 10 plants were randomly selected from each treatment to determine the biometric characteristics of the plants, which included: number of pods per plant, number of seeds per plant, seed weight per plant (g), thousand seed weight TSW (g).
Seed yield (t·ha-1) was determined at full maturity, at 14% seed moisture content. Seed moisture content was determined using Seed Moisture Meters – SM 10 (FOSS, DK).
The collected research results were statistically analysed using analysis of variance (ANOVA) in the Statgraphics Centurion XVI programme. A two-factor design was adopted, where the first factor was the SAP dose and the second factor was the year of research. To compare the differences between the means for the factors, a multiple confidence interval test (Tukey’s test) was used at a significance level of α=0.05. For the parameters of gas exchange, chlorophyll fluorescence and SPAD index, the mean of all measurements in the developmental phases in individual years was presented. Correlations between yield and gas exchange indices, chlorophyll fluorescence and SPAD index were sought and presented in the form of simple correlation coefficients (Pearson’s coefficient).
3. Results
3.1. Yield and Photosynthetic Efficiency in Peas
The results of the study showed, that the SAP dose significantly affected the number of pods per plant, the number of seeds per plant and the pea seed yield (Table 2). A significantly higher number of pods and seeds per plant was recorded on the SAP30 treatment compared to SAP20 (by 18% and 26%, respectively). The use of superabsorbent significantly increased the pea yield by approximately 17% at the SAP20 treatment and by 20% at the SAP30 treatment compared to the control. The examined yield and plant structure characteristics varied significantly over the years of the study. All the examined parameters of the yield and structure of peas were significantly higher in 2018. No interaction between the experimental factors and their effect on the examined yield and structure traits was found.
The SAP dose significantly differentiated the rate of photosynthesis and the maximum photosystem II efficiency index (Fv/Fm) in pea (Table 3). The rate of photosynthesis was significantly lower at the SAP20 treatment compared to the other treatments, while the Fv/Fm index was significantly higher at the SAP20 treatment compared to the control and the SAP30 treatment.
The parameters studied varied significantly between the years of the study (except for the SPAD index). Transpiration rate was significantly higher in 2017 than in the following year (by 50%). Photosynthesis rate, WUE, Fv/Fm and PI indices were significantly higher in the second year of the study (by 28, 97, 4 and 52%, respectively), compared to 2017.
Interactions between experimental factors and their impact on photosynthesis rate and chlorophyll fluorescence indices were also demonstrated (Figure 2). The application of hydrogel at the SAP30 treatment in 2018 significantly increased photosynthetic rate compared to the SAP20 treatment. The PSII maximum efficiency index (Fv/Fm) was significantly higher at the SAP20 treatment in 2017 compared to the control treatment and the SAP30 treatment. In contrast, the photosystem II performance index (PI) in 2017 was significantly higher on the SAP20 treatment compared to the SAP0 and SAP30 treatments, and in the following year, a significantly higher value of this parameter was recorded on the control treatment compared to the treatments where superabsorbent was applied.
Highly significant positive correlations were found between yield and photosynthesis rate, WUE coefficient, chlorophyll fluorescence indices (Fv/Fm and PI), and significant correlations between yield and the number of pods per plant and seed weight per plant in peas (Table 4). A negative correlation was found between yield and transpiration rate. Significant correlations were found between yield components and gas exchange and chlorophyll fluorescence indices. The number of pods per plant and seed weight per plant were significantly correlated with the WUE coefficient and the Fv/Fm index, and in the case of seed weight per plant, also with the PI index. A significant negative relationship was demonstrated between transpiration rate and the number of pods and seed weight per plant. Significant relationships were demonstrated between TSW and transpiration rate and the chlorophyll fluorescence indices Fv/Fm and PI.
3.2. Yield and Photosynthetic Efficiency in Faba Bean
The results of the study showed, that the SAP dose and the year of the study did not significantly affect the studied yield structure parameters, i.e., the number of pods per plant, the number of seeds per plant, the weight of seeds and thousand seed weight in faba bean (Table 5). However, a significant increase in the yield of faba bean was observed after the application of the superabsorbent. On the SAP20 and SAP30 treatments, the yield increased by 24% and 30%, respectively, compared to the control treatment. The year of the study also significantly modified the faba bean seed yield. Significantly higher yields (by about 60%) were recorded in 2018. No interaction between the experimental factors and their impact on the studied yield characteristics and structure was found.
The SAP dose significantly affected the parameters of photosynthesis and chlorophyll fluorescence in faba bean (Table 6). When SAP was applied at a dose of 20 kg ha-1, the rate of photosynthesis and the chlorophyll fluorescence indices Fv/Fm and PI were significantly higher compared to the control and SAP30.
The year of research significantly differentiated almost all parameters studied (except for WUE). In 2017, photosynthesis and transpiration rate, as well as Fv/Fm and PI indices, were significantly higher compared to 2018. In contrast, the opposite was found for the SPAD index. Significantly higher SPAD values were recorded in 2018 compared to 2017. No interaction between the experimental factors and their effect on the studied parameters of gas exchange and chlorophyll fluorescence was found.
The analysis of the interdependence between the studied characteristics of faba bean is presented in Table 7. A significant positive correlation was found between yield and the WUE coefficient and the SPAD index, and a negative correlation between yield and transpiration rate and the chlorophyll fluorescence indices Fv/Fm and PI. The correlations between yield components and gas exchange indices (photosynthesis and transpiration rates), chlorophyll fluorescence indices (Fv/Fm and PI), and leaf greenness index (SPAD) were statistically insignificant.
4. Discussion
Legumes are very sensitive to water stress [21]. Water deficit affects morphological characteristics and physiological processes that determine plant yield [22,23]. Legume cultivation is characterised by high yield variability through years, and their productivity depends on the availability of water in the substrate, especially in the early stages of plant development and during the flowering and pod setting phases [24]. Therefore, rainfall distribution is of key importance for crop yields, especially during the above-mentioned stages of development. For this group of plants, this includes the months of April, May and June.
The weather conditions during the 2017-2018 growing seasons were varied and had a significant impact on plant productivity. During the growing seasons in which the research was conducted, rainfall was very irregular. Often, there was heavy rainfall (even up to around 50.0 mm) lasting 2-3 days in a single decade, but the excess water did not seep into the soil profile and instead ran off the fields. As a result, there was a water shortage, which was more related to the uneven distribution of rainfall than to the total rainfall during the growing season. According to the Selianinov index (Table 1), May 2017 was dry and June was very dry, while April 2018 was very dry and June was dry. Thus, during the months when legumes are at their most critical stage in terms of water demand, there was a drought.
Significantly higher yields of faba bean and pea (by 60.1% and 37.7%, respectively) and all tested plant structure parameters in pea were recorded in 2018 compared to 2017. The tested parameters of gas exchange and chlorophyll fluorescence were higher in pea in 2018 (except for transpiration rate) and in faba bean in 2017.
The reduction in seed yield due to soil water deficiency depends on the intensity and duration of stress, as well as the plant species and its growth stage [25]. The use of superabsorbent improves soil moisture conditions by supplying stored water to plants during dry periods, thus reducing the risk of drought stress, which can affect crop yields. However, for the hydrogel to be effective, regular rainfall is required to allow water to be absorbed and then made available to plants. The results of our own research showed a significant impact of the use of superabsorbent on the yield of the tested species. In faba bean and pea, an increase in seed yield was observed after the application of hydrogel, with the most beneficial being the use of SAP at a dose of 20 kg ha-1 (average yield increase of 23.6% and 17.3%, respectively). The hydrogel rates used did not differentiate the elements shaping the seed yield in faba beans. In pea, however, an increase in the number of pods and seeds per plant was observed when using the SAP30 dose compared to the SAP20 dose (by 18.3% and 25.9%, respectively). Significantly lower yields and yield structure parameters in peas in 2017 may have been influenced by rainfall deficits in May and June, which were lower than the long-term average, by 40% and 54%, respectively. Adequate soil moisture during these months is crucial for legumes, and despite higher rainfall during the 2017 growing season, yield levels were determined by the distribution of rainfall during specific stages of development. According to Mandić et al. [26], water deficit during the pod formation and seed production stages causes a greater yield decline than water shortage during the flowering stage. In faba bean and pea, an increase in seed yield was observed after the application of hydrogel, but no effect of SAP on the elements determining seed yield was observed in the case of faba bean (number of pods, number of seeds and seed weight). The increase in yield on the treatments where SAP was applied was probably related to the plant density, which was higher on the SAP20 and SAP30 treatments (by 29% and 30%, respectively) compared to the control. In pea, an increase in the number of pods and seeds per plant was also observed on treatments where SAP was applied, which indicates the impact of this factor on the parameters studied. Various authors report a positive effect of hydrogel on legume seed yield. Shankarappa et al. [27] obtained an increase in lentil (Lens culinaris) seed yield of over 50% compared to the control after applying hydrogel at a rate of 5 kg·ha-1. Pouresmaeil et al. [28] showed, that the application of a superabsorbent in an amount of 7.5% of soil weight increased the yield of red beans (Phaseolus vulgaris L.) by 38.5% compared to the control, where no hydrogel was used. In a pot experiment conducted by Księżak [29], the use of hydrogel resulted in a significant increase in the weight of faba bean seeds (by 14.1% on average) and the weight of thousand seeds compared to the control. In turn, field studies conducted in India on the use of superabsorbent in soybean (Glycine max (L.) Merr.) cultivation showed a significant increase in seed yield after the application of SAP at a dose of 7.5 and 10 kg·ha-1, by 34.3 and 33.6%, respectively, compared to the control [30]. Yazdani et al. [31] obtained 31.7% higher soybean seed yields, but after applying superabsorbent in a very high dose (225 kg·ha-1) compared to the control. However, these results are not confirmed by the studies of Panasiewicz et al. [32]. These authors found that the application of hydrogel at a rate of 30 and 60 kg·ha-1 had no significant effect on the yield of peas. No significant effect of SAP on selected parameters of sowing value and vigor of pea seeds was demonstrated either. In studies by Faligowska and Szukała [33,34], the use of polymer did not increase soybean yields, despite a significant increase in the number of pods per plant compared to the control where SAP was not used. They also found no significant effect of varying rates of SAP on pea seed yields. In contrast, in the studies by Pouresmaeil et al. [28], the use of superabsorbent in an amount of 0.7% of soil mass increased the weight of thousand red bean seeds by 21.2% compared to the control, where no hydrogel was used.
Basic physiological processes such as photosynthesis, transpiration and chlorophyll fluorescence have a decisive influence on crop yields. Proper plant growth and development is possible thanks to the availability of water and carbon dioxide, which are substrates in the process of photosynthesis. Therefore, photosynthesis and transpiration are important processes that have a direct impact on biomass growth and, consequently, on the productivity of crops [35]. The Fv/Fm index determines the maximum quantum efficiency of photosystem II and allows for the detection of PSII damage and possible photoinhibition [36]. According to DeEll et al. [37], the Fv/Fm ratio should be in the range of 0.75-0.85, and a decrease in this ratio may indicate damage and limitations in PSII function. Another important chlorophyll fluorescence index that describes the amount of effective energy converted by photosystem II is the PSII performance index (PI). This index expresses the plant’s ability to defend itself against stress [11].
In our own studies, gas exchange and chlorophyll fluorescence parameters in faba beans were significantly higher in 2017 compared to 2018, while in pea, photosynthesis rate, water use efficiency (WUE) and Fv/Fm and PI indices were significantly higher in 2018, which also correlated with higher seed yield in that year. The application of hydrogel at a dose of 20 kg ha-1 increased the photosynthetic rate in faba bean by 18.5% compared to the control object, while pea reacted in the opposite way and at the same rate the photosynthetic rate was significantly lower compared to the other treatments. However, the superabsorbent did not affect the transpiration rate and WUE coefficient of the legume species studied. The application of superabsorbent at a dose of 20 kg ha-1 significantly increased the Fv/Fm index in the species studied and the PI index in pea compared to the control. Similar results were observed by Pereira et al. [38], who also obtained varied results regarding the use of the polymer in field cultivation of soybeans. In one year of research, the authors noted reductions in photosynthesis and transpiration rate after the application of SAP, and in the following year, a positive effect of the polymer on these parameters. According to the authors, the use of superabsorbent under conditions of severe stress has no effect on the yield and efficiency of the photosynthetic apparatus of soybeans, and its use is only justified under conditions of moderate stress and uniform rainfall. In our own studies, rainfall distribution was irregular, therefore the efficiency of the photosynthetic apparatus and plant productivity were more dependent on climatic and soil conditions than on the superabsorbent used. Taking into account the interactions of the experimental factors and their impact on chlorophyll fluorescence indices and photosynthesis rate, it was shown that chlorophyll fluorescence in peas in 2017 was highest at the SAP20 treatment, which indicates good PSII condition, while photosynthetic intensity at this treatment was the lowest, which may indicate lower photosynthetic efficiency caused by stomatal closure rather than damage to the photosynthetic apparatus, as also reported by Rehman et al. [39].
Plants respond to drought stress by changing the content of photosynthetic pigments [40]. Water deficit inhibits the synthesis of chlorophyll a and b and reduces the content of proteins responsible for its binding [41]. Our own research did not show a significant effect of superabsorbent on the leaf greenness index (SPAD) in faba bean and pea. Significantly higher values of this parameter were recorded in faba beans only in 2018 compared to 2017. These results may have been caused by irregular rainfall distribution and low hydrogel efficiency, as most results confirm that SAP effectively supports the functioning of the photosynthetic apparatus by increasing chlorophyll content under water stress conditions. Youssef et al. [16] showed a significant increase in the greenness index of pea (Pisum sativum L.) leaves on treatments where hydrogel was applied at 0.7% of soil weight compared to treatments without hydrogel, both on treatments with optimal moisture and under water deficit conditions. Also, in studies conducted by Ahmed et al. [42], the application of superabsorbent to sandy soil significantly increased the SPAD index in green bean (Phaseolus vulgaris L.) leaves compared to the control where no hydrogel was applied. The relative chlorophyll content in bean leaves increased with increasing SAP doses (from 0.1 to 0.9% of soil weight). In studies by Alotaibi et al. [43], the application of superabsorbent at a rate of 3 g/plant increased the chlorophyll content in green bean (Phaseolus vulgaris L. cv Bronco) leaves.
5. Conclusions
The study showed that the yield and physiological activity of pea and faba bean varied significantly depending on the superabsorbent dose and weather conditions during the study years. The most beneficial application of SAP at a dose of 20 kg ha-1 significantly increased yield and the maximum quantum efficiency of photosystem II in pea and faba bean, the photosynthetic rate in faba bean, and the PI index in pea. The superabsorbent did not affect transpiration rate, WUE, or SPAD in the studied legume species. Using superabsorbents can be a good solution, especially in drought-prone regions, as they improve soil moisture and positively impact yields and photosynthetic parameters, but their effectiveness also depends on environmental conditions. Further research is needed to assess the long-term impact of superabsorbents on soil structure, microorganisms, and the durability of the effect under various climatic conditions. It is also important to determine the optimal doses and application methods to maximize yield while maintaining profitability and environmental safety.
Author Contributions
Conceptualization, K.C. and M.S.; methodology, K.C. and M.S; investigation, K.C.; resources, K.C. ; data curation, K.C.; writing—original draft preparation, K.C. ; writing—review and editing, K.C. and M.S.; visualization, K.C.; supervision, M.S. All authors have read and agreed to the published version of the manuscript.
Funding
This research received no external funding.
Institutional Review Board Statement
Not applicable.
Data Availability Statement
The research data are located at the Institute of Soil Science and Plant Cultivation in Puławy and are made available by the authors upon request.
Acknowledgments
The authors would like to express their sincere gratitude to Professor Jerzy Księżak for providing access to the experimental site where the research was conducted. This support and the opportunity to use the experimental facilities significantly contributed to the completion of this research.
Conflicts of Interest
The authors declare no conflicts of interest.
Abbreviations
The following abbreviations are used in this manuscript:
| E | transpiration intensity |
| PN | photosynthesis intensity |
| Fv/Fm | maximum quantum efficiency of PSII |
| PI | PSII Performance Index |
| SY | seed yield |
| NP | number of pods per plant |
| NS | number of seeds per plant |
| WS | weight of seeds per plant |
| TSW | thousand seed weight |
References
- Adireddy, R. G.; Manna, S.; Patanjali, N.; Singh, A.; Dass, A.; Mahanta, D.; Singh, V. K. Unveiling Superabsorbent Hydrogels Efficacy Through Modified Agronomic Practices in Soybean–Wheat System Under Semi--Arid Regions of South Asia. J. Agron. Crop Sci. 2024, 210(4), e12730. [CrossRef]
- adeem, M.; Li, J.; Yahya, M.; Sher, A.; Ma, C.; Wang, X.; Qiu, L. Research progress and perspective on drought stress in legumes: A review. Int. J. Mol. Sci. 2019, 20(10), 2541. [CrossRef]
- Tawaha, A. R. M.; Alatrash, H.; Jabbour, Y.; Al-Tawaha, A. R.; Qaisi, A. M.; Jammal, R.; Karnwal, A.; Shatnawi, M.; Saranraj, P.; Rammal, J. Drought stress and sustainable legume production. In Marker-Assisted Breeding in Legumes for Drought Tolerance; Springer, 2025; pp. 23–40. [CrossRef]
- Roman, G. V.; Epure, L. I.; Toader, M.; Lombardi, A. R. Grain legumes-main source of vegetal proteins for European consumption. Agrolife Sci. J. 2016, 5(1).
- Florek J., Czerwińska-Kayzer D., Jerzak M. Current state of production and use of leguminous crops. Fragm. Agron. 2012, 29(4), 45-55. (In Polish).
- Bhattacharya, A. Effect of soil water deficit on growth and development of plants: a review. In Soil water deficit and physiological issues in plants; Springer Singapore, 2021; pp. 393-488. [CrossRef]
- Wang, W.; Wang, C.; Pan, D.; Zhang, Y.; Luo, B.; Ji, J. Effects of drought stress on photosynthesis and chlorophyll fluorescence images of soybean (Glycine max L.) seedlings. Int. J. Agric. & Biol. Eng. 2018, 11, 196–201. [Google Scholar] [CrossRef]
- Staniak, M;, Bojarszczuk, J.; Księżak, J. Changes in yield and gas exchange parameters in Festulolium and alfalfa grown in pure sowing and in mixture under drought stress. Acta Agric. Scand. 2018, 68(3), 255-263. [CrossRef]
- Starck, Z.; Chołuj, D.; Niemyska, B. Physiological responses of plants to unfavorable environmental factors: Publisher SGGW, Warsaw, 1995; pp. 27–47. (In Polish).
- Olszewska, M. Reaction of selected meadow fescue and Timothy cultivars to water stress. Acta Sci. Pol., Agric. 2003, 2(2), 141–148.
- Kalaji, H.M.; Jajoo, A.; Oukarroum, A.; Brestic, M.; Zivcak, M.; Samborska, I.A.; Cetner, M.D.; Łukasik, I.; Goltsev, V.; Ladle, R.J. Chlorophyll a fluorescence as a tool to monitor physiological status of plants under abiotic stress conditions. Acta Physiol. Plant. 2016, 38, 102. [Google Scholar] [CrossRef]
- Park, B.; Wi, S.; Chung, H.; Lee, H. Chlorophyll fluorescence imaging for environmental stress diagnosis in crops. Sensors 2024, 24(5), 1442.
- Šesták, Z.; Šiffel, P. Leaf-age related differences in chlorophyll fluorescence. Photosynthetica 1997, 33, 3/4, 347–369. [Google Scholar]
- Linn, A. I.; Zeller, A. K.; Pfündel, E. E.; Gerhards, R. Features and applications of a field imaging chlorophyll fluorometer to measure stress in agricultural plants. Precision Agric. 2021, 22(3), 947–963. [Google Scholar] [CrossRef]
- Afkari, A. Effect of superabsorbent polymer on photosynthetic traits, chlorophyll content and chlorophyll fluorescence indices of bean (Phaseolus vulgaris L.) under drought stress. J. Plant Environ. Physiol. 2022, 17(66), 57–73. [CrossRef]
- Youssef, S.; Riad, G.; Abu El-Azm, N.A.I.; Ahmed, E. Amending sandy soil with biochar or/and superabsorbent polymer mitigates the adverse effects of drought stress on green pea. Egypt. J. Hort. 2018, 45, 169–183. [Google Scholar] [CrossRef]
- Skowera, B. Changes in hydrothermal conditions in Poland (1971–2010). Fragm. Agron. 2014, 31, 74–87. (In Polish) [Google Scholar]
- Bleiholder, H.; Buhr, L.; Feller, C.; Hack, H.; Hess, M.; Klose, R.; Meier, U.; Stauss, R.; van den Boom, T.; Weber, E.; Lancashire, P.D.; Munger, P. Compendium of growth stage identification keys for mono- and dicotyledonous plants. BASF 2011, 31–74. [Google Scholar]
- Wang, W.; Yu, Z.; Zhang, W.; Shao, Q.; Zhang, Y.; Luo, Y.; Jiao, X.; Xu, J. Responses of rice yield, irrigation water requirement and water use efficiency to climate change in China: historical simulation and future projections. Agric. Water Manag. 2014, 146, 249–261. [Google Scholar] [CrossRef]
- Sikder, S.; Qiao, Y.; Baodi, D.; Shi, C.; Liu, M. Effect of water stress on leaf level gas exchange capacity and water-use efficiency of wheat cultivars. Indian J. Plant Physiol. 2016, 21, 300–305. [Google Scholar] [CrossRef]
- Labidi, N.; Mahmoudi, H.; Dorsaf, M.; Slama, I.; Abdelly, C. Assessment of intervarietal differences in drought tolerance in chickpea using both nodule and plant traits as indicators. J. Plant Breed. Crop Sci. 2009, 1, 80–86. [Google Scholar]
- Rahbarian, R.; Khavari-Nejad, R.; Ganjeali, A.; Bagheri, A.; Najafi, F. Drought stress effects on photosynthesis, chlorophyll fluorescence and water relations in tolerant and susceptible chickpea (Cicer arietinum L.) genotypes. Acta Biol. Cracov. Bot. 2011, 53, 47–56. [Google Scholar] [CrossRef]
- Toker, C.; Çağirgan, M.İ. Assessment of response to drought stress of chickpea (Cicer arietinum L.) lines under rainfed conditions. Turk. J. Agric. For. 1998, 22, 615–622. [Google Scholar]
- Magyar-Tábori, K.; Mendler-Drienyovszki, N.; Dobránszki, J. Models and tools for studying drought stress responses in peas. OMICS 2011, 15, 829–838. [Google Scholar] [CrossRef] [PubMed]
- Parameshwarappa, S.G.; Salimath, P.M. Field screening of chickpea genotypes for drought resistance. Karnataka J. Agric. Sci. 2008, 21, 113–114. [Google Scholar]
- Mandić, V.; Krnjaja, V.; Tomić, Z.; Bijelić, Z.; Simić, A.; Đorđević, S.; Stanojković, A.; Gogić, M. Effect of water stress on soybean production. Proc. 4th Int. Congr. New Perspect. Chall. Sustain. Livest. Prod. Belgrade 2015, pp. 405–414.
- Shankarappa, S.K.; Muniyandi, S.J.; Chandrasheka, A.B.; Singh, A.K.; Nagabhushanaradhya, P.; Shivashankar, B.; El-Ansary, D.O.; Wani, S.H.; Elansary, H.O. Standardizing the hydrogel application rates and foliar nutrition for enhancing yield of lentil (Lens culinaris). Processes 2020, 8, 420. [Google Scholar] [CrossRef]
- Pouresmaeil, P.; Habibi, D.; Boojar, M.M.A. Yield and yield component quality of red bean (Phaseolus vulgaris L.) cultivars in response to water stress and super absorbent polymer application. Ann. Biol. Res. 2012, 3, 5701–5704. [Google Scholar]
- Księżak, J. Evaluation of faba bean productivity depending on hydrogel rate and humidity soil level. Fragm. Agron. 2018, 35, 29–40. [Google Scholar]
- Ryan, Q.; Geetha, K.N.; Hashimi, R.; Atif, R.; Habimana, S. Growth and yield of soybean [Glycine max (L.) Merrill] as influenced by organic manures and superabsorbent polymers. J. Exp. Agric. Int. 2020, 42, 77–85. [Google Scholar] [CrossRef]
- Yazdani, F.; Allahdadi, I.; Akbari, G.A. Impact of superabsorbent polymer on yield and growth analysis of soybean (Glycine max L.) under drought stress condition. Pak. J. Biol. Sci. 2007, 10, 4190–4196. [Google Scholar] [CrossRef]
- Panasiewicz, K.; Faligowska, A.; Szymańska, G.; Szukała, J.; Koziara, W.; Ratajczak, K. The effects of using hydrogel in pea cultivation (Pisum sativum L.). Biul. Inst. Hod. Aklim. Rośl. 2019, 285, 235–236. (In Polish) [Google Scholar]
- Faligowska, A.; Szukała, J. Influence of irrigation, soil tillage systems and polymer on yielding and sowing value of pea. Fragm. Agron. 2011, 28, 15–22. (In Polish) [Google Scholar]
- Faligowska, A.; Szukała, J. Influence of organic polymer on yield components and seed yield of soybean. Nauka Przyr. Technol. 2014, 8, 9. (In Polish) [Google Scholar]
- Arve, L.; Torre, S.; Olsen, J.; Tanino, K. Stomatal responses to drought stress and air humidity. In: Abiotic Stress in Plants – Mechanisms and Adaptations. IntechOpen, Rijeka 2011, pp. 267–280. [CrossRef]
- Ahmed, S. , Nawata E., Hosokawa M., Domae Y., Sakuratani T. Alterations in photosynthesis and some antioxidant enzymatic activities of mungbean subjected to waterlogging. Plant Sci. 2002, 163, 117–123. [Google Scholar] [CrossRef]
- DeEll, J.R.; Van Kooten, O.; Prange, R.K.; Murr, D.P. Applications of chlorophyll fluorescence techniques in postharvest physiology. Hortic. Rev. 1999, 23, 69–107. [Google Scholar]
- Pereira, L.F.; Ribeiro Júnior, W.Q.; Ramos, M.L.G.; Soares, G.F.; de Lima Guimarães, C.A.; da Silva Neto, S.P.; Williams, T.C.R. The impact of polymer on the productivity and photosynthesis of soybean under different water levels. Agronomy 2022, 12, 2657. [Google Scholar] [CrossRef]
- Rehman, A.; Ahmad, R.; Safdar, M. Effect of hydrogel on the performance of aerobic rice sown under different techniques. Plant Soil Environ. 2011, 57, 321–325. [Google Scholar] [CrossRef]
- Farooq, M.; Wahid, A.; Kobayashi, N.; Fujita, D.; Basra, S.M.A. Plant drought stress: effects, mechanisms and management. Agron. Sustain. Dev. 2009, 29, 185–212. [Google Scholar] [CrossRef]
- Sayed, O.H. Chlorophyll fluorescence as a tool in cereal crop research. Photosynthetica 2003, 41, 321–330. [Google Scholar] [CrossRef]
- Ahmed, E.M.; El-Tohamy, W.A.; El-Abagy, H.M.H.; Aggor, F.S.; Nada, S.S. Response of snap bean plants to super absorbent hydrogel treatments under drought stress conditions. Curr. Sci. Int. 2015, 4, 467–472. [Google Scholar]
- Alotaibi, M.M.; Alharbi, B.M.; Alzahrani, Y.M.; Alghamdi, A.G.; Alzahrani, M.M. Influence of super-absorbent polymer on growth and productivity of green bean under drought conditions. Agronomy 2024, 14, 1146. [Google Scholar] [CrossRef]
Figure 1.
Weather conditions during the study years (a) 2017; (b) 2018.
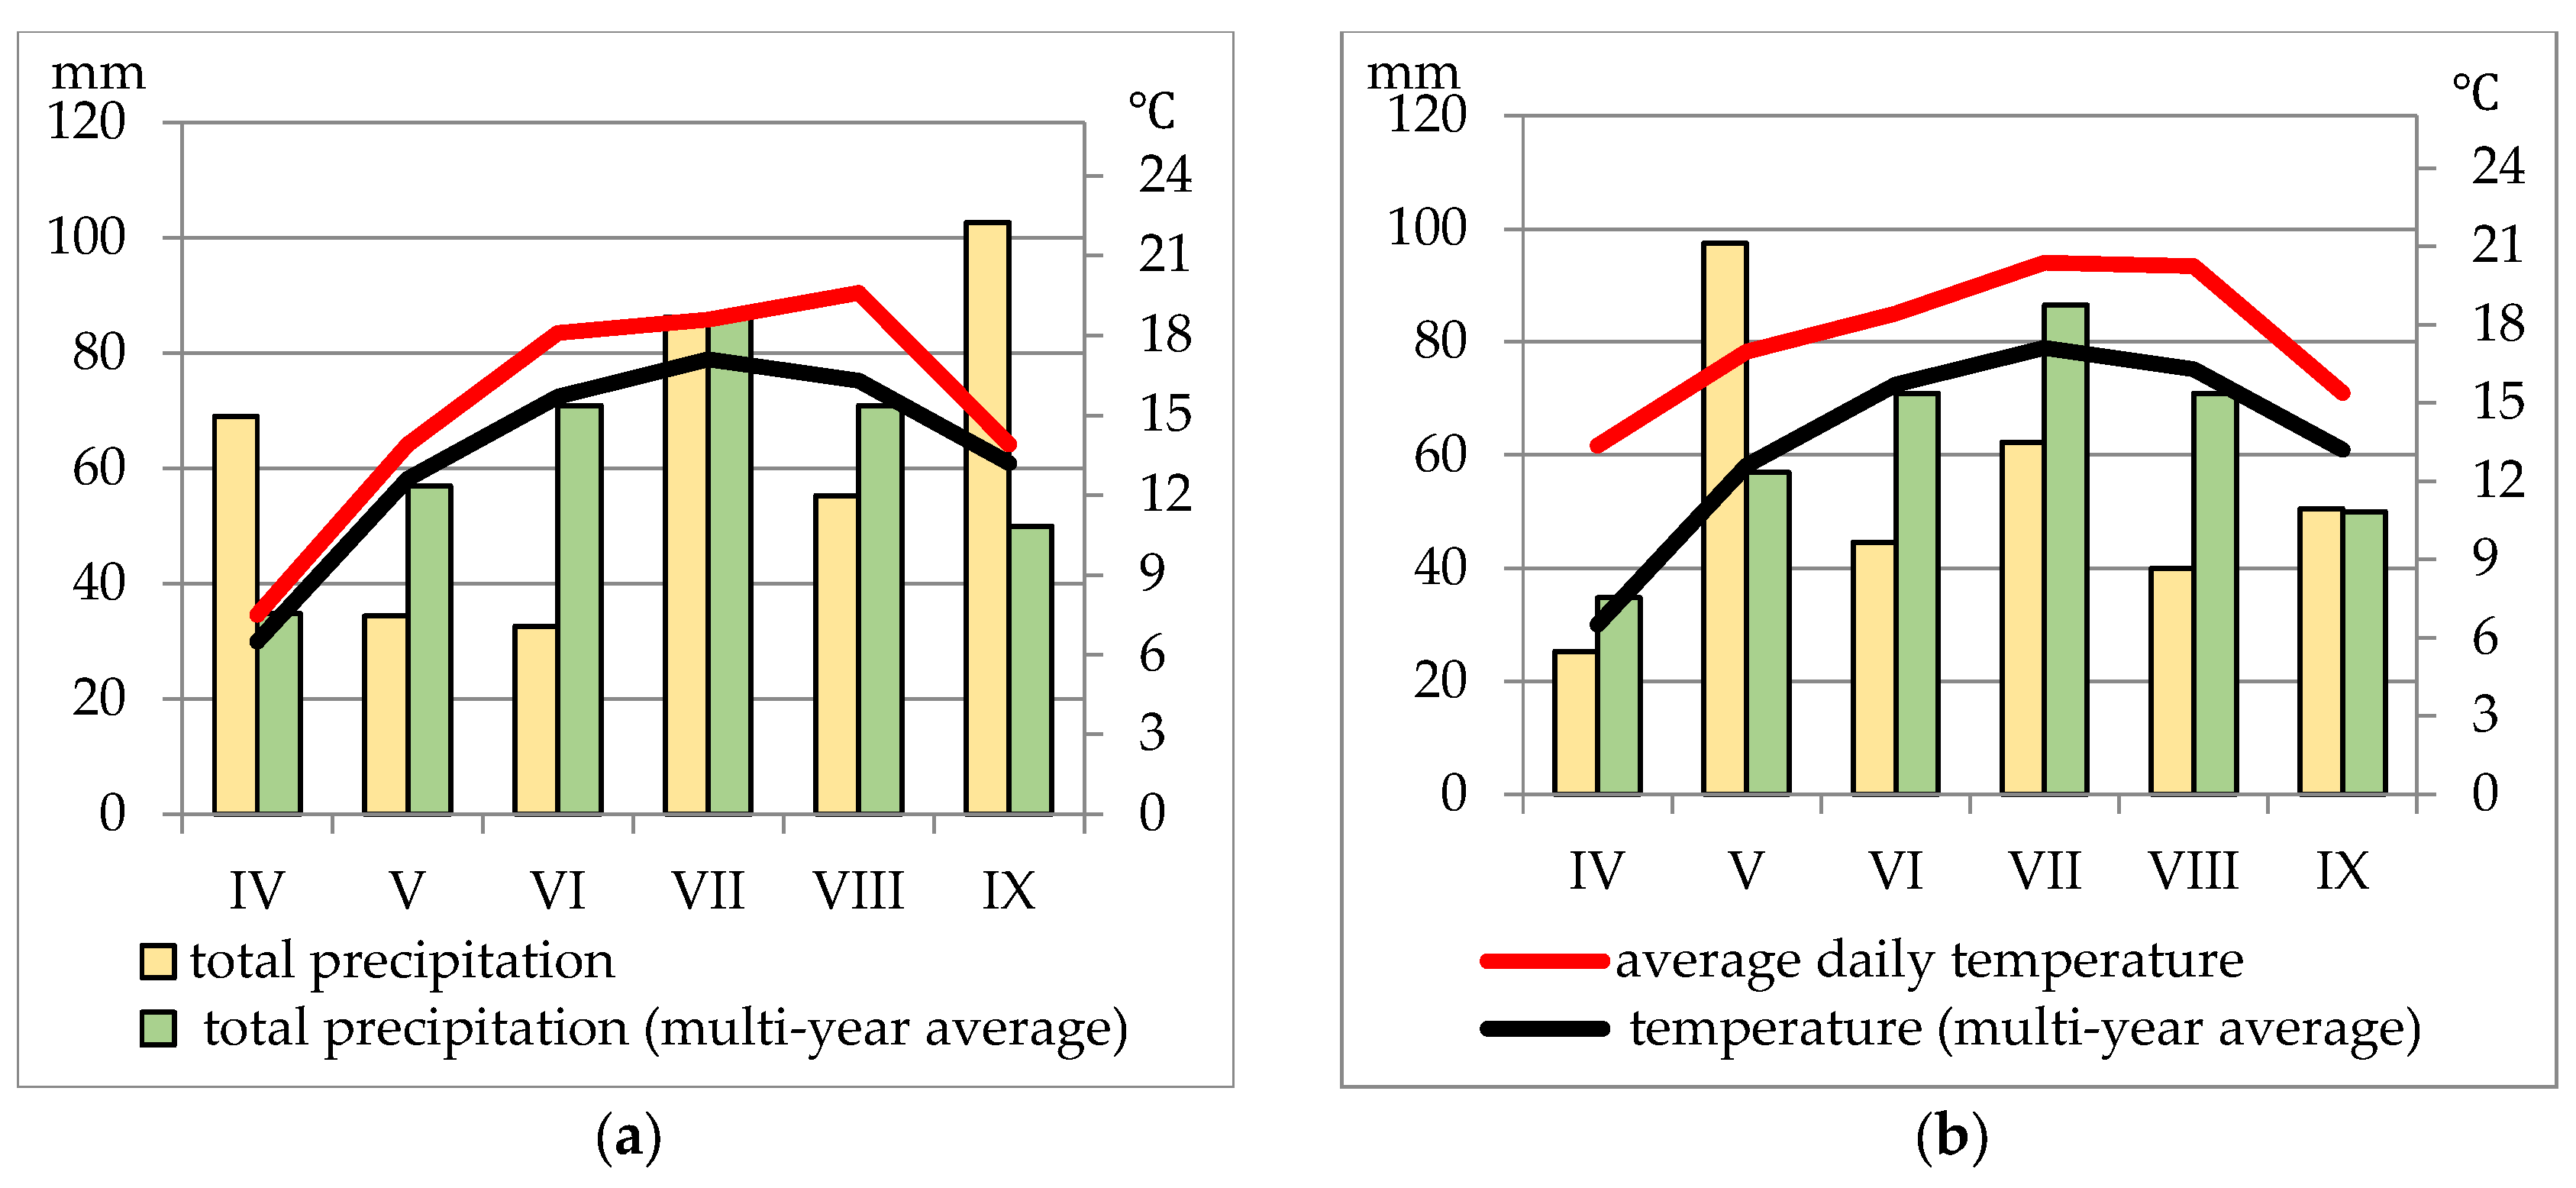
Figure 2.
Interaction of experimental factors and its effect on photosynthesis intensity (a) and chlorophyll fluorescence indices (b, c) in peas.
Figure 2.
Interaction of experimental factors and its effect on photosynthesis intensity (a) and chlorophyll fluorescence indices (b, c) in peas.
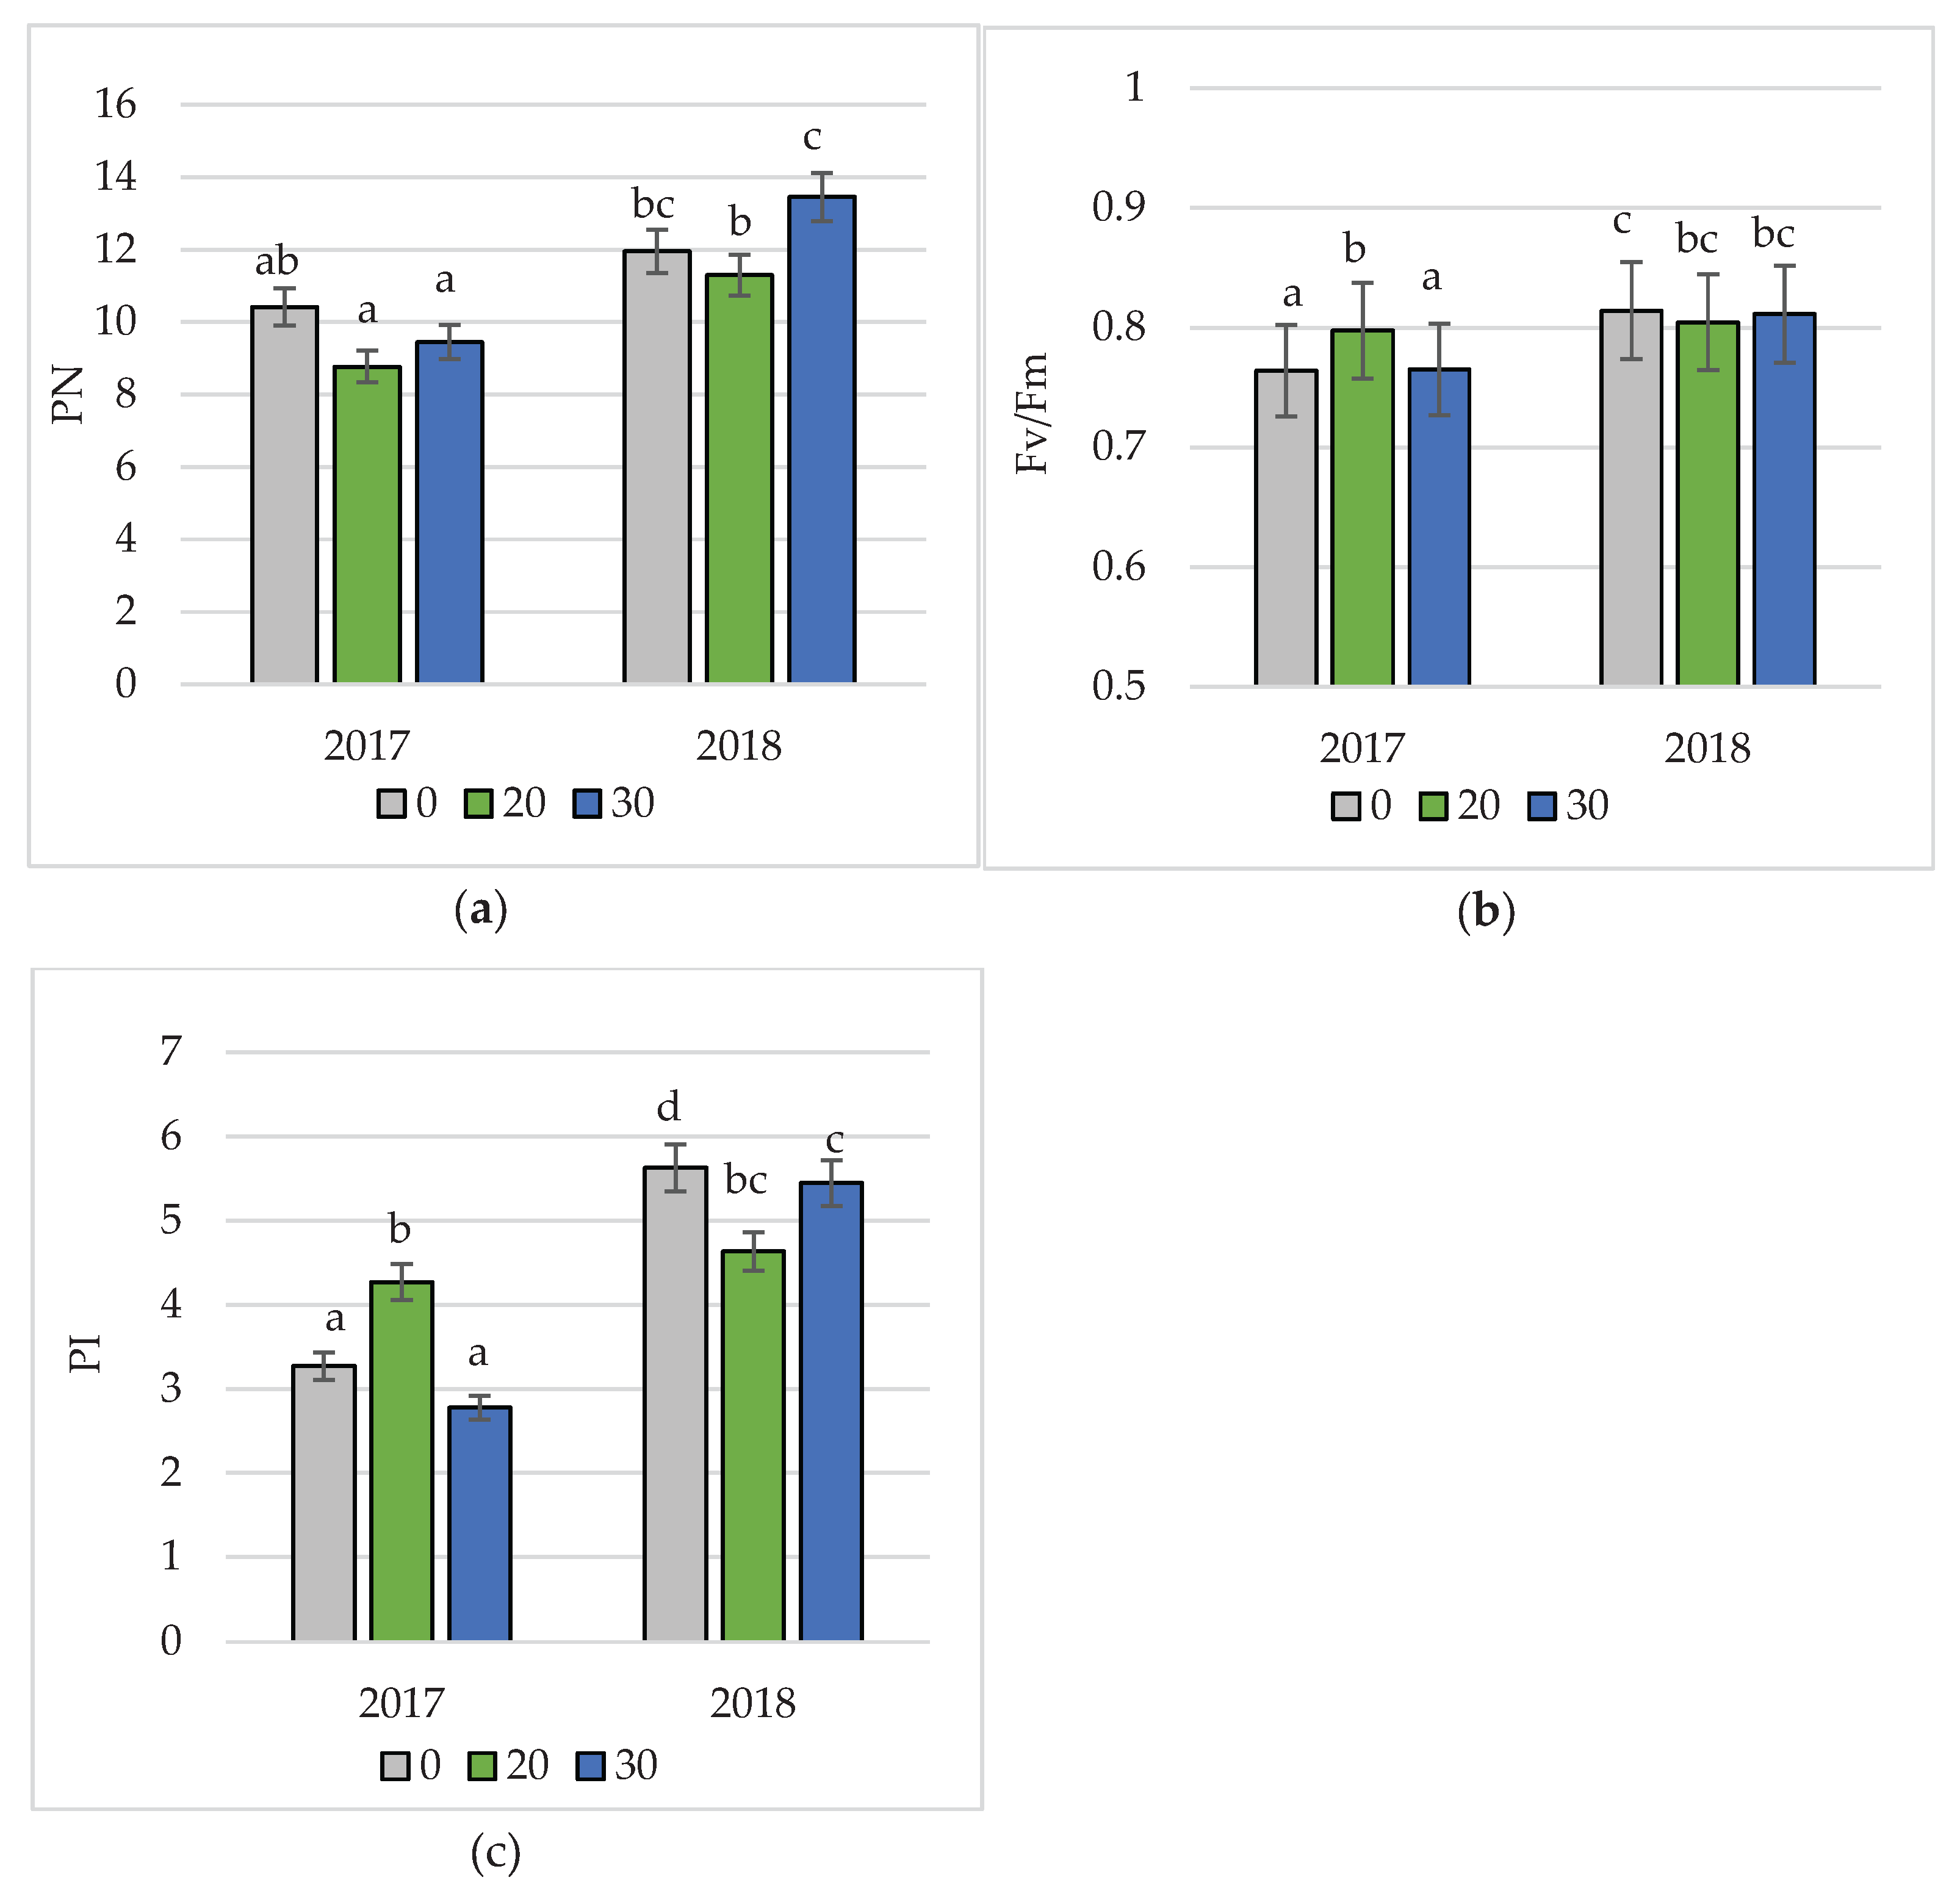

Table 1.
Characteristics of three growing seasons based on Selianinov’s hydrothermal index (k).
| Month | Years of study | |||
|---|---|---|---|---|
| k | 2017 | k | 2018 | |
| April | 3.11 | extremely wet | 0.63 | very dry |
| May | 0.8 | dry | 1.85 | moderately wet |
| June | 0.6 | very dry | 0.81 | dry |
| July | 1.5 | optimal | 0.99 | dry |
| August | 0.91 | dry | 0.64 | very dry |
| September | 2.45 | wet | 1.09 | fairly dry |
k ≤ 0.4 – extremely dry, 0.4 < k ≤ 0.7 – very dry, 0.7 < k ≤ 1.0 – dry, 1.0 < k ≤ 1.3 – fairly dry, 1.3 < k ≤ 1.6 – optimal, 1.6 < k ≤ 2.0 – moderately wet, 2.0 < k ≤ 2.5 – wet, 2.5 < k ≤ 3.0 – very wet, k > 3.0 – extremely wet.
Table 2.
Pea yield and its structure depending on the SAP dose and year of study.
| Factor | Source of variation | Number of pods per plant | Number of seeds per plant | Weight of seeds per plant (g) | Seed yield (t ha-1) | TSW(g) |
|---|---|---|---|---|---|---|
| Dose of SAP (D) | SAP0 | 5.16 ab | 21.6 ab | 4.59 a | 2.02 a | 207.6 a |
| SAP20 | 4.81 a | 18.9 a | 4.10 a | 2.37 b | 208.7 a | |
| SAP30 | 5.69 b | 23.8 b | 5.09 a | 2.42 b | 209.2 a | |
| p-value | * | * | ns | *** | ns | |
| Year (Y) | 2017 | 4.04 a | 17.0 a | 3.09 a | 1.91 a | 181.1 a |
| 2018 | 6.40 b | 25.8 b | 6.09 b | 2.63 b | 235.9 b | |
| p-value | *** | *** | *** | *** | *** | |
| D x Y | p-value | ns | ns | ns | ns | ns |
* Means followed by different letters are significantly different. The level of significance: ***p≤0.001, * p≤0.05, ns – not significant at p≤0.05 (Tukey test); TSW–thousand seed weight.
Table 3.
Gas exchange indices in peas depending on the SAP dose and year of study.
| Factor | Source of variation | E | PN | WUE | Fv/Fm | PI | SPAD |
|---|---|---|---|---|---|---|---|
| Dose of SAP (D) | SAP0 | 1.36 a | 11.19 b | 9.09 a | 0.789 a | 4.45 a | 575.2 a |
| SAP20 | 1.20 a | 10.03 a | 9.08 a | 0.801 b | 4.45 a | 570.1 a | |
| SAP30 | 1.27 a | 11.45 b | 9.61 a | 0.788 a | 4.11 a | 589.7 a | |
| p-value | ns | ** | ns | ** | ns | ns | |
| Year (Y) | 2017 | 1.54 b | 9.54 a | 6.23 a | 0.776 a | 3.44 a | 582.9 a |
| 2018 | 1.01 a | 12.23 b | 12.29 b | 0.810 b | 5.24 b | 573.8 a | |
| p-value | *** | *** | *** | *** | *** | ns | |
| D x Y | p-value | ns | * | ns | *** | *** | * |
* Means followed by different letters are significantly different. The level of significance: ***p≤0.001. ** p≤0.01. * p≤0.05. ns – not significant at p≤0.05 (Tukey test). ); E – transpiration rate, PN-photosynthesis rate, WUE -water use efficiency ratio, Fv/Fm – maximum quantum efficiency of PSII, PI – PSII performance index, SPAD - leaf greenness index.
Table 4.
Pearson correlation coefficients (r) between the physiological characteristics of peas and yield and its structure.
Table 4.
Pearson correlation coefficients (r) between the physiological characteristics of peas and yield and its structure.
| E | WUE | Fv/Fm | PI | SY | NP | NS | WS | TSW | |
|---|---|---|---|---|---|---|---|---|---|
| PN | -0.5904 ** |
0.8389 *** |
0.465 * |
0.5588 ** |
0.5367 ** |
0.135 ns |
-0.052 ns |
0.3042 ns |
0.282 ns |
| E | -0.9125 *** |
-0.7509 *** |
-0.6626 *** |
-0.7833 *** |
-0.5084 * |
0.0435 ns |
-0.434 * |
-0.4552 * |
|
| WUE | 0.6709 *** |
0.649 *** |
0.7116 *** |
0.413 * |
-0.0199 ns |
0.4229 * |
0.3958 ns |
||
| Fv/Fm | 0.8743 *** |
0.7353 *** |
0.4346 * |
-0.0158 ns |
0.4379 * |
0.4956 * |
|||
| PI | 0.5825 ** |
0.3198 ns |
0.0257 ns |
0.4988 * |
0.5044 * |
||||
| SY | 0.4951 * |
0.0436 ns |
0.4505 * |
0.3858 ns |
|||||
| NP | 0.5612 ** |
0.8413 *** |
0.402 ns |
* The level of significance: ***p≤0.001. ** p≤0.01. * p≤0.05. ns – not significant at p≤0.05 (Tukey test); E – transpiration rate, WUE -water use efficiency ratio, PN-photosynthesis rate, Fv/Fm – maximum quantum efficiency of PSII, PI – PSII performance index, SY-seed yield, NP-number of pods per plant, NS- number of seeds per plant, WS- weight of seeds per plant, TSW–thousand seed weight.
Table 5.
Faba bean yield and its structure depending on SAP dose and year of study.
| Factor | Source of variation | Number of pods per plant | Number of seeds per plant | Weight of seeds per plant (g) | Seed yield (t ha-1) | TSW(g) |
|---|---|---|---|---|---|---|
| Dose of SAP (D) | SAP0 | 4.11 a | 11.36 a | 4.83 a | 1.74 a | 420.1 a |
| SAP20 | 3.66 a | 9.26 a | 3.95 a | 2.15 b | 428.5 a | |
| SAP30 | 3.55 a | 9.25 a | 4.09 a | 2.27 b | 440.8 a | |
| p-value | ns | ns | ns | *** | ns | |
| Year (Y) | 2017 | 3.87 a | 10.13 a | 4.38 a | 1.58 a | 432.8 a |
| 2018 | 3.68 a | 9.78 a | 4.20 a | 2.53 b | 426.8 a | |
| p-value | ns | ns | ns | *** | ns | |
| D x Y | p-value | ns | ns | ns | ns | ns |
* Means followed by different letters are significantly different. The level of significance: ***p≤0.001. ns – not significant at p≤0.05 (Tukey test); TSW–thousand seed weight.
Table 6.
Gas exchange indices in faba beans depending on the SAP dose and year of study.
| Factor | Source of variation | E | PN | WUE | Fv/Fm | PI | SPAD |
|---|---|---|---|---|---|---|---|
| Dose of SAP (D) | SAP0 | 1.19 a | 9.97 a | 8.40 a | 0.79 a | 3.63 a | 579.9 a |
| SAP20 | 1.26 a | 11.77 b | 9.48 a | 0.80 b | 4.16 b | 580.4 a | |
| SAP30 | 1.13 a | 9.97 a | 8.90 a | 0.79 a | 3.53 a | 579.1 a | |
| p-value | ns | *** | ns | * | ** | ns | |
| Year (Y) | 2017 | 1.29 b | 10.99 b | 8.61 a | 0.81 b | 4.60 b | 569.7 a |
| 2018 | 1.10 a | 10.15 a | 9.24 a | 0.78 a | 2.94 a | 589.9 b | |
| p-value | ** | ** | ns | *** | *** | ** | |
| D x Y | p-value | ns | ns | ns | ns | ns | ns |
* Means followed by different letters are significantly different. The level of significance: ***p≤0.001. ** p≤0.01. * p≤0.05. ns – not significant at p≤0.05 (Tukey test). ); E – transpiration rate, PN-photosynthesis rate, WUE -water use efficiency ratio, Fv/Fm – maximum quantum efficiency of PSII, PI – PSII performance index, SPAD - leaf greenness index.
Table 7.
Pearson correlation coefficients (r) between the physiological characteristics of faba bean plants and yield and its structure.
Table 7.
Pearson correlation coefficients (r) between the physiological characteristics of faba bean plants and yield and its structure.
| E | WUE | Fv/Fm | PI | SPAD | SY | NS | WS | |
|---|---|---|---|---|---|---|---|---|
| PN | 0.6051 ** |
0.3483 ns |
0.2584 ns |
0.3437 ns |
-0.1972 ns |
-0.247 ns |
-0.1371 ns |
-0.1794 ns |
| E | -0.5285 ** |
0.5423 ** |
0.5745 ** |
-0.6838 *** |
-0.5724 ** |
0.0227 ns |
-0 .0174 ns |
|
| WUE | -0.3567 ns |
-0.311 ns |
0.6014 ** |
0.433 * |
-0.2214 ns |
-0.2129 ns |
||
| Fv/Fm | 0.8371 *** |
-0.6362 *** |
-0.7164 *** |
-0.037 ns |
-0.1171 ns |
|||
| PI | -0.6134 ** |
-0.7451 *** |
0.0824 ns |
0.0918 ns |
||||
| SPAD | 0.5436 ** |
-0.0246 ns |
-0.0917 ns |
|||||
| SY | -0.2752 ns |
-0.1804 ns |
||||||
| NP | 0.9022 *** |
0.7733 *** |
* The level of significance: ***p≤0.001. ** p≤0.01. * p≤0.05. ns – not significant at p≤0.05 (Tukey test). ); E – transpiration rate, WUE -water use efficiency ratio, PN-photosynthesis rate, Fv/Fm – maximum quantum efficiency of PSII, PI – PSII performance index, SY-seed yield, NP-number of pods per plant, NS- number of seeds per plant, WS- weight of seeds per plant, TSW–thousand seed weight.
Disclaimer/Publisher’s Note: The statements, opinions and data contained in all publications are solely those of the individual author(s) and contributor(s) and not of MDPI and/or the editor(s). MDPI and/or the editor(s) disclaim responsibility for any injury to people or property resulting from any ideas, methods, instructions or products referred to in the content. |
© 2025 by the authors. Licensee MDPI, Basel, Switzerland. This article is an open access article distributed under the terms and conditions of the Creative Commons Attribution (CC BY) license (http://creativecommons.org/licenses/by/4.0/).
Copyright: This open access article is published under a Creative Commons CC BY 4.0 license, which permit the free download, distribution, and reuse, provided that the author and preprint are cited in any reuse.


