
Submitted:
30 October 2025
Posted:
04 November 2025
You are already at the latest version
Abstract
This study investigated the composition and temporal dynamics of wood-inhabiting fungal communities in four aging tree species in Lednice Castle Park (Czech Republic), located within the Lednice–Valtice Cultural Landscape, a UNESCO World Heritage Site. Forty wood cores were collected from 20 trees at two time points (2023 and 2024). The hosts included horse chestnut (Aesculus hippocastanum L.), Copper beech (Fagus sylvatica ʻAtropuniceaʼ L.), oak (Quercus robur L.), and poplar (Populus alba L.), each exhibiting visual signs of decline. Fungal assemblages were profiled using ITS2 high-throughput amplicon sequencing. Ascomycota dominated across all hosts (72 – 89 % of reads), while Basidiomycota contributed 8 – 24 %, largely represented by Agaricomycetes in F. sylvatica. Alpha diversity varied significantly among hosts (Shannon: F₃,₃₆ = 10.61, p = 0.001 in 2023; F₃,₃₆ = 10.00, p = 0.001 in 2024). Temporal shifts were host dependent: F. sylvatica exhibited the strongest year-to-year decline in richness (Chao1: - 83 %, p = 0.007) and increased beta dispersion, while A. hippocastanum and P. alba showed significant increases in diversity (+ 65 % and + 42 %, respectively). Community composition was shaped by host species (PERMANOVA Bray–Curtis: p = 0.001) and shifted over time (Jaccard: p = 0.001), with F. sylvatica showing the highest temporal turnover. FUNGuild analysis revealed consistent dominance of saprotrophs (29 – 41 %) and mixed pathotroph–saprotroph guilds (23 – 36 %) across hosts, indicating active degradation processes inside functional xylem. These results demonstrate that the wood mycobiome of aging trees is neither static nor functionally neutral, but host-dependent and temporally dynamic. Short-term environmental variation may accelerate fungal succession inside wood, potentially influencing tree decline trajectories in managed historical park landscapes.
Keywords:
co-occurrence networks
; fungal diversity
; fungal succession
; high-throughput amplicon sequencing
; host specificity
; latent pathogens
; tree mycobiome
; trophic guilds
; wood-inhabiting fungi
1. Introduction
Old trees, particularly those exceeding a century in age, are vital components of park landscapes, contributing significantly to the ecological, aesthetic, and cultural integrity of these environments [1,2]. These veteran trees enhance landscape architectural compositions by providing visual coherence, historical authenticity, and functional benefits, ranging from fine-scale design elements to large-scale garden art features [3]. However, their advanced age renders them increasingly vulnerable to structural weaknesses and pathogen-induced decline, threatening their longevity and ecosystem services [4]. Understanding the intrinsic properties and associated vulnerabilities of these trees is therefore critical for their conservation and sustainable management [5].
Traditional methods for assessing tree health, such as visual inspections, often detect pathological issues only in advanced stages, when external symptoms like canopy dieback or basidiomycete fruiting bodies become evident, indicating significant decay or disease progression [6,7]. These approaches are limited in detecting early-stage or cryptic infections and fail to directly identify fungi within wood, which are often the primary cause of tree diseases [8,9,10]. This delay in diagnosis underscores the need for advanced molecular techniques to enable timely intervention and support effective conservation and management of trees [11,12].
Fungal communities inhabiting trees encompass a broad spectrum of endophytic and pathogenic taxa that influence host health [13,14,15], wood decay [16], and overall ecosystem functioning [17]. Wood-inhabiting fungi can occur as mycelia or spores and have traditionally been detected by isolation and culture-based identification [18]. However, these cultivation-based methods often underestimate fungal diversity because they typically favor fast-growing or spore-forming taxa and may miss unculturable or rare species [19,20,21]. To overcome these limitations, molecular methods, such as metabarcoding, have become essential [22]. By applying high-throughput sequencing of specific DNA regions, metabarcoding enables detection of a broader taxonomic range, including unculturable and previously undescribed taxa [23,24].
Although the importance of tree-associated mycobiota is increasingly recognized [25], detailed knowledge of their composition and temporal dynamics in managed historical park landscapes remains limited. A recent single-tree study of the trunk wood mycobiome of an ancient Tilia × europaea L. in the Czech Republic demonstrated that even individual heritage trees can host diverse and functionally complex fungal assemblages [26]. Environmental stressors [27], disease pressure [28], and anthropogenic impacts [29,30] may alter fungal assemblages, yet few studies have investigated their temporal dynamics at the level of individual trees [31,32,33]. To address this gap, we investigated the wood-associated fungal microbiome of 20 trees with an average age of ~ 100 years, representing four species—horse chestnut (Aesculus hippocastanum L.), Copper beech (Fagus sylvatica ʻAtropuniceaʼ L.), pedunculate oak (Quercus robur L.), and white poplar (Populus alba L.)—in the Lednice Castle Park, part of the Lednice–Valtice Cultural Landscape listed as a UNESCO World Heritage Site.
Using high-throughput amplicon sequencing (HTAS), we addressed three key questions: (i) how species richness and community composition differ among tree hosts, (ii) to what extent fungal communities remain stable over an annual timescale, and (iii) how shifts in fungal assemblages relate to visible symptoms and tree health. Our findings provide new insights into the stability and variability of wood-associated mycobiota in old heritage trees and highlight their potential role as bioindicators for the management of historical park landscapes.
2. Materials and Methods
2.1. Wood Sampling and Processing
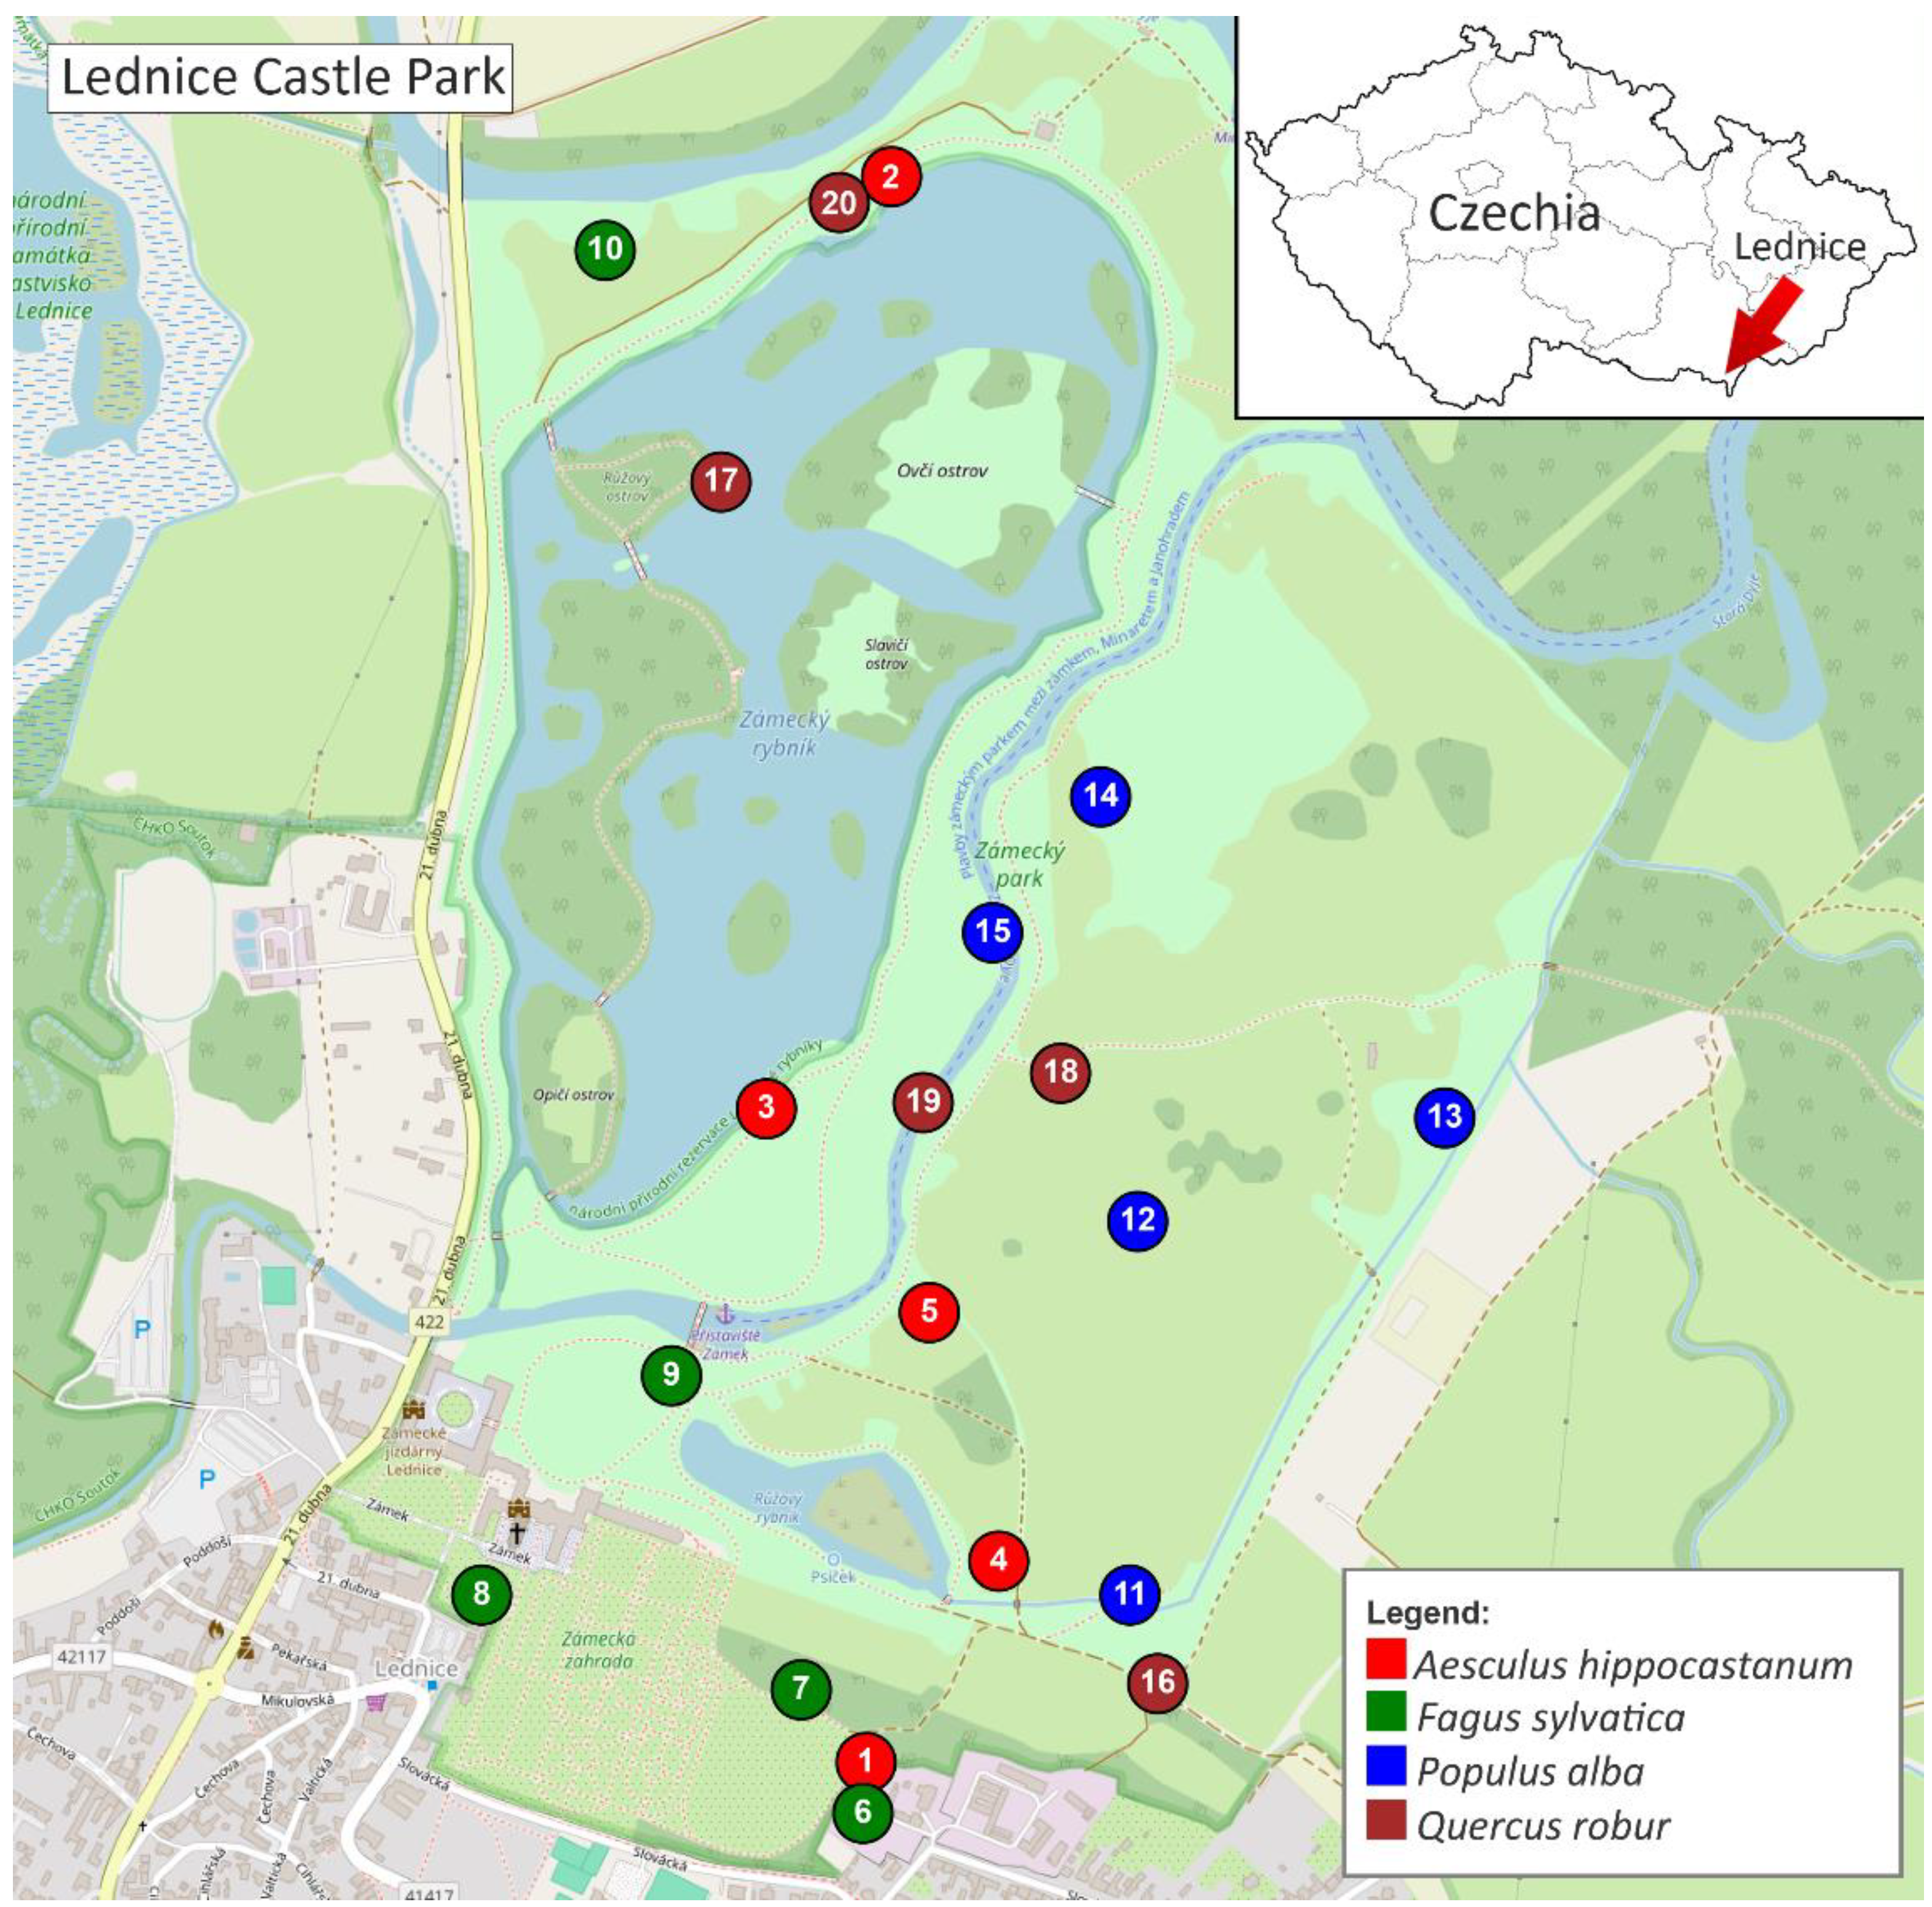
Wood cores were collected from 20 mature trees (File S1; Figure S1; Table 1), in Lednice Castle Park, Czech Republic (Figure 2), representing four host species (Aesculus hippocastanum, Fagus sylvatica ʻAtropuniceaʼ, Quercus robur and Populus alba, n = 5 trees per species). Trees (Figure 1) were selected based on external symptoms of decline (crown dieback, cankers, exudates), ensuring inclusion of individuals potentially affected by internal wood-colonizing fungi while avoiding dead or structurally unstable trees. Sampling was conducted at two time points (October 2023 and October 2024) to assess temporal dynamics, yielding a total of 40 wood samples.
Figure 1.
Field sampling and examples of tree conditions included in this study. (A) Fagus sylvatica ʻAtropuniceaʼ representing a typical sampled tree in the Lednice Castle Park. (B) Fagus sylvatica ʻAtropuniceaʼ exhibiting extensive colonization by parasitic macrofungi at the base of the trunk. (C) Aesculus hippocastanum sampled for wood cores using an increment borer. (D) Example of an increment core extracted from Fagus sylvatica ʻAtropuniceaʼ.
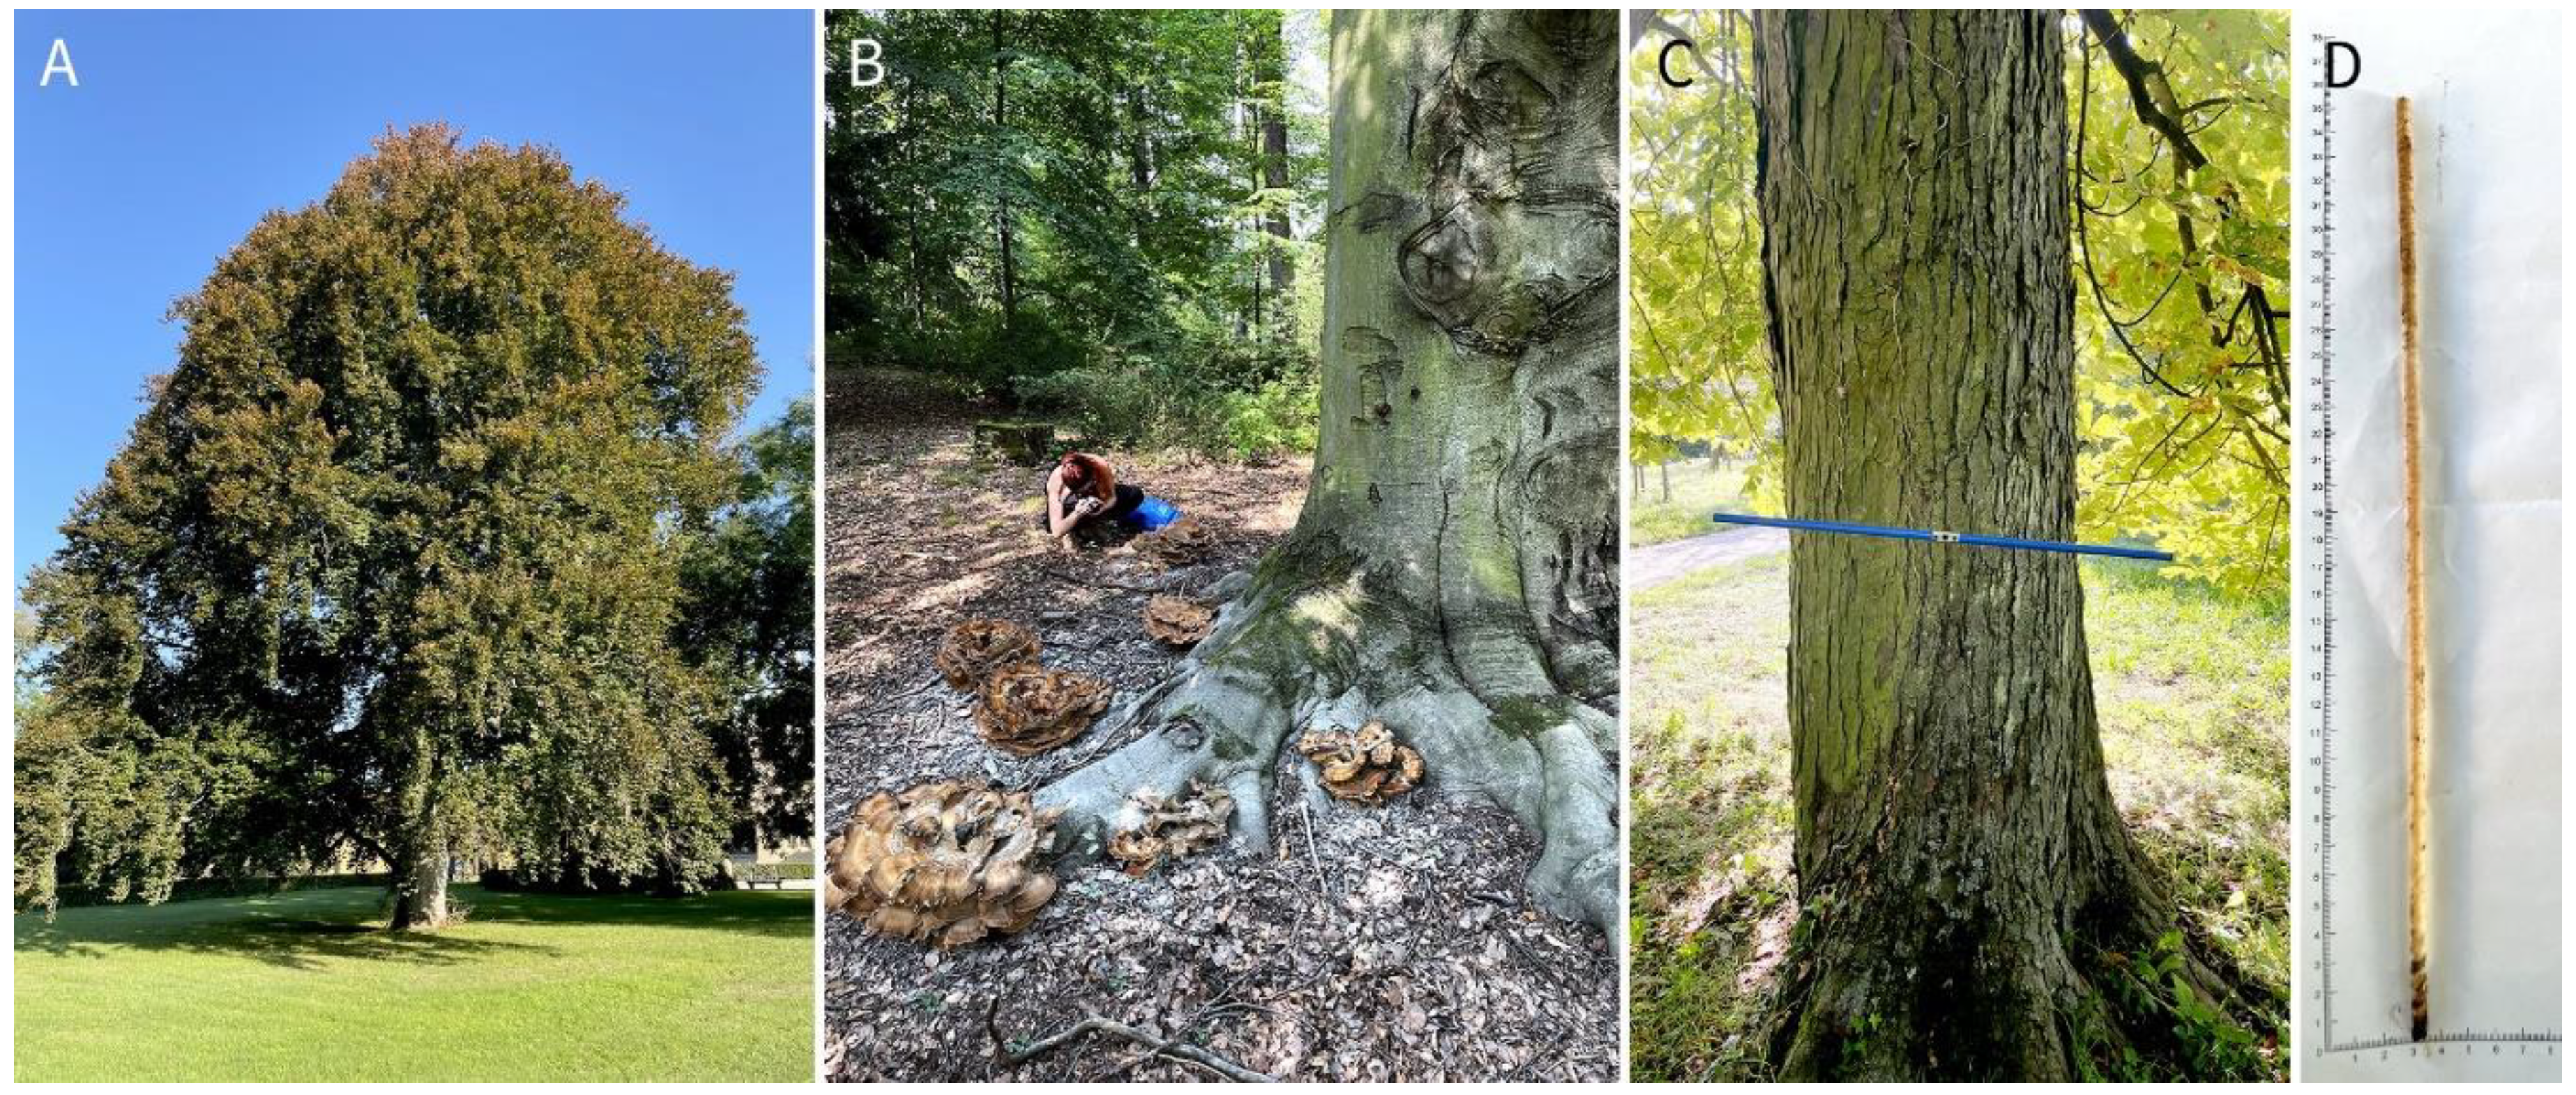
Figure 2.
Map of the Lednice Castle Park showing the locations of sampled trees. Colors indicate tree species: Aesculus hippocastanum (red), Fagus sylvatica ʻAtropuniceaʼ (green), Populus alba (blue), and Quercus robur (brown). Numbers refer to tree IDs listed in Table 1. The map was created based on data © OpenStreetMap contributors. An interactive version of the map is available as Supplementary File S1.
Wood cores were obtained at breast height (1.3 m above ground) using a sterilized increment borer (80 cm, 5 mm diameter), sampling from three opposing trunk positions per tree to reduce spatial bias. Bark was surface-sterilized with 70% ethanol prior to drilling to minimize contamination. After each core, the increment borer was disinfected in 5% sodium hypochlorite for 1 min and rinsed three times in sterile distilled water. Cores were individually wrapped in sterile Parafilm©, transported on ice, and stored at –20 °C until DNA extraction. In the laboratory, the inner sterile portions of wood cores were scraped and pooled per tree, homogenized under liquid nitrogen and processed for fungal DNA isolation. Field and laboratory extraction blanks were included as contamination controls throughout processing.
2.2. Extraction of the DNA and DNA Pooling
Approximately 100 mg of homogenized inner wood tissue was used for DNA extraction. The sample was processed using the NucleoSpin® Tissue Kit (Macherey-Nagel, Düren, Germany) following the manufacturer’s instructions. The total DNA yield was quantified using a fluorimeter and subsequently diluted to 10 ng·μL⁻¹ for downstream molecular analyses.
2.3. Library Preparation and Sequencing
The fungal ITS2 region was amplified using the barcoded primer pair fITS7 and ITS4 [34,35]. PCR reactions were performed in 50 µL volumes containing 25 µL Q5® High-Fidelity 2 × Master Mix (New England Biolabs, Ipswich, USA), 2.5 µL of each primer (10 µM), 2 µL of template DNA (10 ng µL⁻¹) and 18 µL nuclease-free water. The thermocycling protocol consisted of an initial denaturation at 95 °C for 2 min, followed by 35 cycles of 95 °C for 30 s, 55 °C for 30 s and 72 °C for 60 s, and a final extension at 72 °C for 5 min.
Amplicons were visualized on 1.2% agarose gels (Serva, Heidelberg, Germany) and purified using the NucleoSpin® Gel and PCR Clean-up Kit (Macherey-Nagel, Düren, Germany). Indexed paired-end libraries were prepared with the Illumina Nextera XT DNA Library Preparation Kit (Illumina, San Diego, USA) following the manufacturer’s protocol. Library quality and fragment size distribution were verified using a Fast qPCR Library Quantification Kit (MCLAB, San Francisco, USA). Sequencing was carried out on an Illumina MiniSeq platform using 2 × 150 bp paired-end chemistry (MiniSeq Mid Output Kit, 300 cycles).
Negative controls were included during DNA extraction, PCR amplification and sequencing to monitor potential contamination, and a mock fungal community was used as a positive control to validate amplification and sequencing performance. Raw high-throughput amplicon sequencing (HTAS) data have been deposited in the NCBI Sequence Read Archive (SRA) under BioProject accession number: PRJNA1330260.
2.3. Bioinformatic Analysis
Sanger sequencing data from fungal isolates were quality-checked and visualized in Geneious Prime v2024.0.5 (Biomatters Ltd., New Zealand). Taxonomic identification was conducted using the BLASTn (megablast) against the NCBI nucleotide database, with an e-value cutoff of 0.05 and a minimum identity threshold of 98 % [36].
HTAS data quality was assessed using FastQC [37]. Read preprocessing and quality filtering were performed in SEED v2.1.2 [38], with paired-end reads merged using fastq-join [39]. Primer sequences and adapters were removed, and sequences shorter than 70 bp or containing ambiguous bases were discarded. Only reads with an average Phred quality score ≥ Q30 were retained. The ITS2 region was extracted from full-length amplicons using ITSx v1.1.2 [40].
Operational Taxonomic Unit (OTU) clustering was performed with USEARCH v8.1.1861 at a 97 % sequence similarity threshold [41]. Singleton and chimeric sequences were removed using the UPARSE pipeline [42]. Representative OTU sequences were taxonomically assigned using BLASTn against the UNITE fungal database v8.2; [43], with a minimum identity of 98 % and a maximum e-value of 1 × 10⁻⁵⁰. Non-fungal hits and sequences below the thresholds were excluded [44,45].
2.4. Data Analysis
The OTU table was normalized using total sum scaling (TSS) [46]. Community composition was visualized using stacked bar plots and heatmaps generated with matplotlib and seaborn [47]. Alpha diversity was quantified using the Shannon index [48], Chao1 richness, and Simpson’s index [49], calculated with scikit-bio. Group differences were tested with the non-parametric Mann–Whitney U test. Beta diversity was evaluated using Bray–Curtis dissimilarity and Jaccard index, with significance tested by PERMANOVA. Principal Coordinates Analysis (PCoA) was performed in scikit-bio, revealing a clear year-based separation of samples. This pattern was independently confirmed by Principal Component Analysis (PCA) of centered log-ratio (CLR) transformed data [46].
Homogeneity of group dispersions was tested using PERMDISP [50], applied to Bray–Curtis and Jaccard distance matrices, to assess differences in within-group variability among species and years. Functional guilds were assigned to fungal OTUs using FUNGuild [51] and grouped into pathotroph, saprotroph, symbiotroph, and mixed categories.
Microbial co-occurrence networks were constructed in Cytoscape v3.10.0 [52]. Relative abundance data were CLR-transformed prior to network inference to account for compositional constraints of sequencing data [46]. Pairwise Spearman correlations were computed, and significant associations (|ρ| > 0.6, p < 0.05) were highlighted. Networks were visualized with edge width proportional to correlation strength and node color scaled according to taxonomic or functional category.
All analyses were conducted in Python 3.9 using pandas, numpy, scipy, scikit-bio, seaborn, and matplotlib.
2.5. Meteorological Data
Meteorological data were obtained from the Czech Hydrometeorological Institute (CHMI), Brno Regional Office, recorded at the Lednice meteorological station located near the study site. The station continuously monitors standard climatic parameters, including air temperature, relative humidity, precipitation, sunshine duration, and soil temperature at depths of 5, 10, 20, 50, and 100 cm.
For this study, daily measurements from October 2022 to October 2024 were aggregated into monthly averages (for air temperature, humidity, soil temperature, and sunshine duration) and monthly totals (for precipitation). These summarized values were used to characterize local microclimatic conditions throughout the sampling period. All measurements followed the standard CHMI calibration and quality-control protocols to ensure data accuracy and comparability.
Monthly trends in all measured variables are shown in (Figure S2).
3. Results
3.1. Sequencing
High-throughput sequencing yielded 20,854,304 reads (read length 40–284 bp). After quality filtering at Q30, 0.01 % of reads (2,085) were discarded. Reads shorter than 70 bp were removed (additional 4,306,843 reads), leaving 16,545,376 length- and quality-filtered reads. Taxonomic assignment retained 5,819,178 fungal reads for downstream analyses. Clustering at 98 % similarity produced 1,410 fungal OTUs, of which 319 singletons were excluded, leaving 1,091 non-singleton OTUs for analysis. Among these OTUs, 5,076,406 reads (87.2 %) could be assigned to the genus level, while 742,396 reads (12.8 %) were classified only at the kingdom level. Fungal communities were dominated by Ascomycota with 3,468,779 reads (59.6 %), followed by Basidiomycota with 1,607,348 reads (27.6 %), Mucoromycota with 268 reads (0.005 %), and Glomeromycota with 7 reads (< 0.001 %).
3.2. Relative Abundance
3.2.1. Phylum Level
Across all samples, Ascomycota dominated the wood-inhabiting fungal communities, consistently representing the majority of sequence reads in each host species. Relative abundance ranged from 55 – 70 % in Fagus sylvatica ʻAtropuniceaʼ, 70 – 85 % in Aesculus hippocastanum, 80 – 90 % in Quercus robur, and 80 – 95 % in Populus alba. Basidiomycota showed strong host dependence, contributing 25 – 40 % of reads in Fagus but only 5 – 15 % in Quercus and < 10 % in Populus and Aesculus. Minor proportions of Mucoromycota, Chytridiomycota and unclassified taxa (< 5 % combined) were also detected across hosts. Interannual changes were most pronounced in Basidiomycota, which increased in Fagus and Quercus in 2024 compared to 2023, suggesting moisture-driven shifts in the proportion of wood-decaying taxa.
3.2.2. Class Level
At the class level, fungal communities were dominated by Sordariomycetes, Eurotiomycetes, Dothideomycetes, Leotiomycetes, and Agaricomycetes, with additional contributions from Tremellomycetes and other minor taxa. Relative abundance patterns were host-specific: in Quercus robur, Sordariomycetes accounted for 30 – 45 %, Dothideomycetes for 15 – 25 %, Leotiomycetes for 10 – 20 %, and Eurotiomycetes for 5 – 15 %; in Populus alba, Eurotiomycetes comprised 35 – 50 %, Sordariomycetes 20 – 30 %, Leotiomycetes 5 – 15 %, and Dothideomycetes 5 – 10 %; in Aesculus hippocastanum, Sordariomycetes represented 20 – 40 %, Eurotiomycetes 15 – 30 %, Dothideomycetes 10 – 20 %, and Leotiomycetes 5 – 15 %; and in Fagus sylvatica ʻAtropuniceaʼ, Agaricomycetes reached 20 – 40 %, Tremellomycetes 10 – 20 %, Leotiomycetes 10 – 15 %, Sordariomycetes 5 – 15 %, and Eurotiomycetes 5 – 10 %. Interannual variation was detected primarily in Eurotiomycetes, which increased in Quercus in 2024, and in Leotiomycetes, which increased in Populus in 2024 relative to 2023.
3.2.3. Order Level
Dominant orders included Pleosporales, Helotiales, Hypocreales, and Eurotiales, with additional contributions from Capnodiales, Chaetothyriales, and Agaricales. In Fagus, Agaricales and Polyporales were proportionally higher compared to other hosts, while Populus samples frequently contained large fractions of Eurotiales and Helotiales. Interannual variation was reflected in shifts between Pleosporales and Eurotiales dominance in Quercus samples.
3.2.4. Family Level
A large proportion of sequences remained unclassified at the family level. Among identified families, Pachysolenaceae, Herpotrichiellaceae, Leucosporidiaceae, and Aspergillaceae were prominent. Nectriaceae, Didymellaceae, and Helotiaceae varied among host species, with Nectriaceae frequently detected in Quercus and Populus. Some families showed interannual differences, e.g. Didymellaceae were more abundant in Quercus in 2023, whereas Helotiaceae increased in 2024.
3.2.5. Genus Level
Among the identified taxa, Nakazawaea and Leucosporidium were frequent in Populus, Phialophora and Pseudocercospora were recurrent in Quercus, and Ganoderma and Pholiota occurred more prominently in Fagus. Potentially pathogenic or endophytic genera such as Phaeoacremonium, Cadophora, and Puccinia appeared sporadically. Year-to-year variation was reflected in a stronger representation of Leucosporidium and Helotiales-associated genera in 2024 compared to 2023.
3.3. Alfa Diversity
3.3.1. Shannon Diversity Index
Shannon diversity (Figure 3) differed significantly among host species in both years (2023: F = 10.61, p = 0.001; 2024: F = 10.00, p = 0.001). In 2023, Fagus exhibited the highest diversity (median ~2.9), followed by Aesculus (~1.7), Quercus (~1.5), and Populus (~1.4). In 2024, Aesculus (~2.8) and Populus (~2.6) displayed higher values, while Quercus (~1.6) and Fagus (~1.3) showed lower diversity. Year-to-year comparisons confirmed these shifts: Shannon diversity significantly increased in Aesculus (F = 57.37, p < 0.001) and Populus (F = 12.19, p = 0.008), decreased in Fagus (F = 23.84, p = 0.003), and remained unchanged in Quercus (F = 0.04, p = 0.856).
3.3.2. Simpson Diversity Index
Simpson diversity (Figure 4) showed significant species-level differences in 2023 (F = 4.32, p = 0.024), but not in 2024 (F = 2.91, p = 0.074). In 2023, Fagus and Quercus reached the highest values (~0.9 and ~0.75), while Aesculus and Populus showed lower indices (~0.6). In 2024, differences among species were less pronounced, although Aesculus and Populus tended to exhibit higher values than Fagus. Interannual comparisons revealed significant increases in Aesculus (F = 21.42, p = 0.002) and a decline in Fagus (F = 7.95, p = 0.030). Populus showed a non-significant increasing trend (F = 4.79, p = 0.060), while Quercus remained stable.
3.3.3. Chao1 Richness
Chao1 richness (Figure 5) varied significantly among host species in 2024 (F = 9.32, p = 0.001), but not in 2023 (F = 2.43, p = 0.108). In 2023, richness was highest in Fagus (~360) and Aesculus (~330), intermediate in Populus (~260), and lowest in Quercus (~150). In 2024, Aesculus showed the highest values (~310), followed by Populus (~260) and Quercus (~180), while Fagus dropped markedly (~60). Paired year comparisons confirmed a significant decrease in Fagus (F = 16.63, p = 0.007), while Quercus (F = 0.07, p = 0.801), Populus (F = 0.17, p = 0.689), and Aesculus (F = 0.83, p = 0.392) showed no significant changes.
3.4. Beta Diversity
Community composition differed significantly among host species and between years, as confirmed by PERMANOVA (Bray–Curtis: p = 0.001; Jaccard: p = 0.001).
Heatmap analyses (Figure 6) showed consistently high dissimilarities (Bray–Curtis 0.66 – 0.96; Jaccard 0.56 – 0.86). In both metrics, interannual dissimilarities within the same species (e.g., Fagus_2023 vs. Fagus_2024: Bray–Curtis 0.93; Jaccard 0.85) were comparable to or higher than cross-species dissimilarities within a year. The lowest dissimilarity was observed between Fagus_2023 and Quercus_2024 (Bray–Curtis 0.66).
PCoA based on Bray–Curtis distances (PC1 = 12.1 %, PC2 = 10.5 %) showed partial clustering of samples by host species, with overlaps across groups. Interannual separation was evident for Fagus and Aesculus. PCoA (Figure 7) using Jaccard distances (PC1 = 9.6 %, PC2 = 8.2 %) also indicated species-level clustering with distinct year-based shifts. Centroid-based ordination confirmed separation of species × year combinations in multivariate space.
PERMDISP analyses revealed significant differences in dispersion between years for Fagus (F = 48.19, p = 0.0004), Populus (F = 7.21, p = 0.0277), and Aesculus (F = 9.07, p = 0.0196), but not for Quercus (F = 0.06, p = 0.8108). In Fagus and Populus, dispersion was higher in 2024 than in 2023, whereas in Aesculus it decreased in 2024.
Species-specific PCoA analyses further supported these findings. For Fagus, PERMANOVA detected significant year to year differences with Bray–Curtis (p = 0.034), but not with Jaccard (p = 1.000). Populus also showed significant separation between years with Bray–Curtis (p = 0.011), but not with Jaccard (p = 0.923). Aesculus communities differed significantly between 2023 and 2024 based on Bray–Curtis (p = 0.035), but not Jaccard (p = 1.000). In contrast, Quercus did not display significant year-to-year differences in either metric (Bray–Curtis: p = 0.328; Jaccard: p = 1.000).
3.5. FUNGuild Trofic Groups
FUNGuild assignment indicated that fungal communities were dominated by saprotrophic and mixed trophic modes across all host species (Figure 8). When aggregated across species, the largest fractions were saprotrophs (31 %), pathotroph–saprotroph (23.8 %), and pathotroph–saprotroph–symbiotroph (19.3 %), followed by pathotrophs (12.7 %). Symbiotrophs accounted for 3 % of the community, while unassigned taxa represented 2.4 %.
Species-level patterns showed distinct differences. In Quercus, pathotroph–saprotroph (35.5 %) and saprotrophs (32.5 %) dominated, while mixed guilds (11.3 %) and pathotrophs (4.7 %) contributed smaller shares. Aesculus exhibited a broader distribution, with saprotroph–pathotroph–symbiotroph (28.8 %), saprotrophs (26.5 %), pathotrophs (15.6 %), and pathotroph–saprotroph (15.5 %) as major groups. In Fagus, the most abundant guilds were pathotroph–saprotroph (29 %), saprotrophs (26.2 %), and pathotrophs (25.9 %), together with a notable fraction of pathotroph–saprotroph–symbiotroph (12.4 %). Populus was characterized by a dominance of saprotrophs (39.4 %), followed by pathotroph–saprotroph–symbiotroph (26.9 %) and pathotroph–saprotroph (15.6 %).
Comparing interannual changes between 2023 and 2024, Aesculus exhibited relatively stable functional group proportions between years. In Fagus, pronounced changes were observed, with a higher share of pathotrophic and mixed guilds in 2024 and a decrease in purely saprotrophic taxa. Populus showed only minor changes, with saprotrophs remaining dominant. In Quercus, the 2024 samples contained more pathotrophs and symbiotrophs and fewer saprotrophs, indicating greater ecological variability between years.
At the tree level, interannual comparisons showed variability in functional groupproportions, but saprotrophs and mixed pathotroph–saprotroph modes remained consistently dominant in both years across all host species.
3.6. Cytoscape
Co-occurrence networks (Figure 9) constructed at the class level revealed distinct interaction patterns across all samples and within individual host tree species. In the overall network combining all samples and years, the most abundant classes formed a highly connected core, with both positive (grey edges) and negative (red edges) correlations. Ascomycota classes dominated the hub structure, particularly with several classes showing multiple strong connections, whereas Basidiomycota and Mucoromycota were represented by fewer, more peripheral nodes. All identified hubs were supported by correlations with p-values < 0.01.
In Aesculus, the network exhibited a relatively fragmented structure, characterized by fewer highly connected hubs compared to the global network. Most associations were positive, although several negative correlations occurred among dominant Ascomycota classes.
The Fagus network was markedly denser, forming a cohesive interaction cluster primarily dominated by Ascomycota. Negative associations were prevalent among the core taxa, whereas Basidiomycota occupied peripheral positions and were connected through only a limited number of edges.
Within Populus, the network was partitioned into multiple smaller clusters, with Ascomycota and Basidiomycota representing the majority of nodes. Both positive and negative interactions were detected, yet the overall network cohesion was lower than that observed in Fagus.
The Quercus network was structured around several abundant Ascomycota classes functioning as hubs, linked by both positive and negative associations. Mucoromycota was present as a minor component, primarily integrated through positive connections.
4. Discussion
Wood-inhabiting fungal communities in old-growth trees of Lednice Castle Park showed clear host specificity combined with pronounced temporal dynamics. Fungal richness and beta diversity differed among hosts, yet intra-host turnover between years was equally strong, indicating that the wood mycobiome is not static even within mature trees. This temporal instability was most evident in Fagus sylvatica ʻAtropuniceaʼ, which exhibited a marked decline in richness and increased beta dispersion in 2024, while Aesculus hippocastanum maintained comparatively stable diversity. Quercus robur and Populus alba showed only moderate interannual change, suggesting that the strength of temporal turnover is host dependent.
Short-term environmental fluctuations likely contributed to these shifts. Extreme moisture events may destabilize fungal communities in aging trees, as seen in Fagus sylvatica ʻAtropuniceaʼ, where exceptionally high precipitation occurring one month before sampling coincided with a shift toward opportunistic taxa (see Figure S2 for meteorological data). This disturbance effect was also reflected at the taxonomic level, with interannual shifts in major fungal lineages—for example, Eurotiomycetes increased in Quercus robur in 2024, while Leotiomycetes expanded in Populus alba—indicating that climatic stressors not only affect functional guild structure but also drive taxonomic turnover. Similar moisture-driven restructuring of wood mycobiomes has already been reported in Fagus sylvatica and other temperate hardwoods [53,54].
Interannual variation was mainly linked to changing proportions of Basidiomycota and to shifts among dominant Ascomycota classes and orders: for instance, Eurotiomycetes increased in Quercus in 2024, while Leotiomycetes expanded in Populus. Taxonomic composition confirmed strong host filtering. Across all samples, Ascomycota dominated, but Fagus harboured a relatively higher proportion of Basidiomycota—especially Agaricomycetes and Polyporales—consistent with its role as a substrate for white-rot fungi and latent wood decayers [53,55]. In contrast, Quercus hosted fungal communities strongly dominated by Ascomycota, particularly Dothideomycetes, Sordariomycetes and Leotiomycetes, which are typical for hardwood-associated endophyte assemblages [23,28]. This pattern is consistent with study of Menkis et al. (2022), who reported similar Ascomycota dominance in veteranisation wounds of ~ 100-year-old living Quercus robur trees [56]. Populus likewise showed strong enrichment in Ascomycota, a trend widely reported in host-associated mycobiome studies where Sordariomycetes and Dothideomycetes dominate across Populus tissues [57,58]. At the genus level, potentially pathogenic or opportunistic taxa such as Phaeoacremonium and Cadophora were detected sporadically; both are well-documented causal agents of trunk diseases in grapevine, plum, apricot, peach, and various other hardwood hosts [59,60,61,62].
Beta diversity analyses confirmed strong temporal instability. Abundance-based (Bray–Curtis) and presence–absence (Jaccard) dissimilarities between years within a host (0.77 – 0.82; up to 0.85 in Fagus) were similar to or greater than interspecific distances. PCoA ordinations showed clear host clustering but strong year-to-year separation in Fagus and horse chestnut, while Quercus remained relatively stable. Similar rapid restructuring of wood mycobiomes has been reported in living trees under fluctuating moisture and temperature, including seasonal and multi-year shifts in two Populus species [63] and high temporal turnover across spatial–temporal gradients in contiguous habitats of seven Fagaceae species [64].
Functional guild analysis revealed a consistent dominance of saprotrophic fungi across hosts, with additional contributions of mixed pathotroph saprotroph taxa. This pattern matches global findings from wood mycobiome studies [65,66,67]. In Fagus sylvatica ʻAtropuniceaʼ, 2024 samples showed a marked increase in pathotrophic and mixed guilds, while saprotrophs declined, indicating stress-driven succession. The high proportion of saprotrophs in living wood most likely reflects latent endophytes that can switch to saprotrophic or pathogenic lifestyles once host defences weaken [16,68,69]. Such lifestyle plasticity, increasingly recognized in endophytes [15,70,71], explains the guild restructuring observed in Fagus and highlights the ecological risk of latent fungi transitioning to opportunistic pathogens under host decline [72].
Co-occurrence network analysis underscored differences in community assembly processes among hosts. The global network was highly connected and Ascomycota-dominated, with both positive and negative associations, while Basidiomycota and Mucoromycota remained peripheral. Fagus supported the most cohesive and competitively structured network, characterized by numerous negative correlations that suggest strong intertaxa competition and niche differentiation. Negative associations in fungal networks are commonly interpreted as indicators of competitive exclusion and resource partitioning among co-occurring taxa [73,74]. The balance between positive and negative associations can also serve as a proxy for community stability, where increased negative connectivity often accompanies ecological stress or reorganization [75,76]. In contrast, fungal co-occurrence networks in Aesculus and Populus were more fragmented and predominantly positive, indicating looser and potentially transient interactions. Quercus exhibited well-connected Ascomycota hubs but lacked the dense core observed in Fagus, consistent with its more compositionally stable yet functionally flexible mycobiome. A similar dominance of Ascomycota hubs and host-dependent modularity patterns has also been observed across forest types [77].
Our results closely align with those of Nordén et al. (2025) [78], who investigated wood-inhabiting fungi in Quercus, Fagus, Acer, and Tilia across Norwegian forests. In both studies, saprotrophic fungi dominated the functional structure, while pathotrophic and mixed pathotroph–saprotroph guilds formed a substantial secondary component, suggesting that these functional strategies are conserved across biogeographic regions. Similarly, Ascomycota prevailed over Basidiomycota in both datasets, reflecting the dominance of opportunistic microfungi that frequently colonize early or transitional wood stages. Despite these similarities, our findings also diverge from Nordén et al. (2025) [78] in several key aspects. First, while their study focused exclusively on deadwood, we demonstrate that living and partially decayed wood also hosts taxonomically rich fungal assemblages, including latent pathotrophs typically absent from deadwood surveys. Second, temporal turnover was a major factor structuring communities in our study, whereas Nordén et al. (2025) [78] reported only spatial variation among host trees and bioclimatic zones. Third, we observed strong year-to-year functional shifts, including an increase in pathotrophic guilds under presumed host stress in Fagus sylvatica ʻAtropuniceaʼ — a pattern not detectable in static deadwood datasets. These differences indicate that fungal succession inside living trees is driven not only by substrate properties but also by host physiological status and environmental fluctuations.
Overall, our results demonstrate that the wood mycobiome of mature trees is a dynamic and host-dependent system that reflects both internal tree condition and external environmental variability.
5. Conclusions
This study demonstrates that the internal wood mycobiome of mature trees is a host-structured but temporally variable system rather than a stable microbial assemblage. Fungal communities were consistently dominated by Ascomycota, yet their taxonomic composition, diversity, and functional guild structure differed among hosts, indicating strong host filtering and species-specific fungal assembly processes. Short-term temporal turnover was pronounced, particularly in Fagus sylvatica ʻAtropuniceaʼ, suggesting that fungal community restructuring can occur even within one year.
These findings show that latent shifts in wood-associated fungal communities may precede visible decline, emphasizing the ecological relevance of subcortical fungal dynamics in long-lived trees. They also demonstrate that single-time sampling underestimates fungal variability, reinforcing the need for multi-year monitoring in both ecological studies and tree health diagnostics. Integrating high-throughput amplicon sequencing, beta diversity metrics, and network analysis provides a sensitive framework for detecting early warning signals of internal wood decay and latent pathogen activity, with direct implications for tree health assessment and the conservation management of heritage park trees.
Supplementary Materials
File S1. Interactive HTML map displaying the geographic locations of the sampled trees. Each sampling point is annotated with metadata specifying tree ID, species, and GPS coordinates. The file can be opened directly in any standard web browser. Figure S1. Photoplate showing the twenty sampled trees included in this study. The numbering corresponds to individual tree IDs listed in Table 1 and indicated on the map (File S1; Figure 2). Trees 1 – 5 represent Aesculus hippocastanum (horse chestnut), 6 – 10 Fagus sylvatica ‘Atropunicea’ (Copper beech), 11 – 15 Quercus robur (pedunculate oak), and 16 – 20 Populus alba (white poplar). Figure S2. Monthly meteorological data for Lednice Castle Park (October 2022 – October 2024). (A) Total precipitation (mm). (B) mean air temperature (°C). (C) mean relative humidity (%). (D) sunshine duration (hours). (E) mean soil temperature at 5 cm depth (°C). (F) mean soil temperature at 10 cm depth (°C). (G) mean soil temperature at 20 cm depth (°C). (H) mean soil temperature at 50 cm depth (°C). (I) mean soil temperature at 100 cm depth (°C).
Author Contributions
Project administration: J.C.; Mentoring: P.S.; Conceptualization and study design: A.E., L.S.; Field sampling: M.S., L.F., P.B., L.M.; Tree selection and visual assessment: P.B., L.M.; Laboratory sample processing: M.S.; Molecular analyses: L.F., M.S.; Data analysis and interpretation: L.F., M.S.; Manuscript drafting: M.S., L.F.; All authors critically revised the manuscript and approved the final version.
Funding
This outcome was supported by the Ministry of Culture of the Czech Republic, from the NAKI III programme (ID: DH23P03OVV053) and by the Internal Grant Schemes of Mendel University in Brno, registration No.: IGA-FFWT-23-IP-028.
Data Availability Statement
All data generated or analysed during this study are included in this published article and supplementary material.
Acknowledgments
We gratefully acknowledge Martin Hadlik and Jakub Pecenka for their dedicated assistance during field sampling.
Conflicts of Interest
The authors declare no competing interest.
Abbreviations
DBH – Diameter at Breast Height.
HTAS – High-Throughput Amplicon Sequencing
NCBI – National Center for Biotechnology Information
OTU – Operational Taxonomic Unit
PCoA – Principal Coordinates Analysis
PERMANOVA – Permutational Multivariate Analysis of Variance
PERMDISP – Permutational Analysis of Multivariate Dispersion
CLR – Centered Log-Ratio Transformation
TSS – Total Sum Scaling
GLMM – Generalized Linear Mixed Model
SRA – Sequence Read Archive
FUNGuild – Fungal Guild Assignment Tool
References
- Blicharska, M.; Mikusinski, G. Incorporating Social and Cultural Significance of Large Old Trees in Conservation Policy. Conservation Biology 2014, 28, 1558–1567. [Google Scholar] [CrossRef]
- Konijnendijk, C. The Forest and the City - the cultural landscape of urban woodland; 2008.
- Stagoll, K.; Lindenmayer, D.B.; Knight, E.; Fischer, J.; Manning, A.D. Large trees are keystone structures in urban parks. Conservation Letters 2012, 5, 115–122. [Google Scholar] [CrossRef]
- Lindenmayer, D.B.; Laurance, W.F.; Franklin, J.F. Global Decline in Large Old Trees. Science 2012, 338, 1305–1306. [Google Scholar] [CrossRef] [PubMed]
- Fay, N. Environmental arboriculture, tree ecology and veteran tree management. Arboricultural Journal 2002, 26, 213–238. [Google Scholar] [CrossRef]
- Schwarze, F.W.M.R.; Engels, J.; Mattheck, C. Fungal Strategies of Wood Decay in Trees; Springer: 2000.
- Lonsdale, D. Principles of Tree Hazard Assessment and Management; Stationery Office: 1999.
- Parfitt, D.; Hunt, J.; Dockrell, D.; Rogers, H.J.; Boddy, L. Do all trees carry the seeds of their own destruction? PCR reveals numerous wood decay fungi latently present in sapwood of a wide range of angiosperm trees. Fungal Ecology 2010, 3, 338–346. [Google Scholar] [CrossRef]
- Boddy, L.; Heilmann-Clausen, J. Chapter 12 Basidiomycete community development in temperate angiosperm wood. In British Mycological Society Symposia Series, Boddy, L., Frankland, J.C., van West, P., Eds.; Academic Press: 2008; Volume 28, pp. 211–237.
- Gilmartin, E.C.; Jusino, M.A.; Pyne, E.J.; Banik, M.T.; Lindner, D.L.; Boddy, L. Fungal endophytes and origins of decay in beech (Fagus sylvatica) sapwood. Fungal Ecology 2022, 59, 101161. [Google Scholar] [CrossRef]
- Martin, R.; Gazis, R.; Skaltsas, D.; Chaverri, P.; Hibbett, D. Unexpected diversity of basidiomycetous endophytes in sapwood and leaves of Hevea. Mycologia 2015, 107, 284–297. [Google Scholar] [CrossRef] [PubMed]
- Fukasawa, Y. Ecological impacts of fungal wood decay types: A review of current knowledge and future research directions. Ecological Research 2021, 36, 910–931. [Google Scholar] [CrossRef]
- Sun, X.; Guo, L.-D. Endophytic fungal diversity: review of traditional and molecular techniques. Mycology 2012, 3, 65–76. [Google Scholar] [CrossRef]
- Hardoim Pablo, R.; van Overbeek Leonard, S.; Berg, G.; Pirttilä Anna, M.; Compant, S.; Campisano, A.; Döring, M.; Sessitsch, A. The Hidden World within Plants: Ecological and Evolutionary Considerations for Defining Functioning of Microbial Endophytes. Microbiology and Molecular Biology Reviews 2015, 79, 293–320. [Google Scholar] [CrossRef]
- Liao, C.; Doilom, M.; Jeewon, R.; Hyde, K.D.; Manawasinghe, I.S.; Chethana, K.W.T.; Balasuriya, A.; Thakshila, S.A.D.; Luo, M.; Mapook, A.; et al. Challenges and update on fungal endophytes: classification, definition, diversity, ecology, evolution and functions. Fungal Diversity 2025, 131, 301–367. [Google Scholar] [CrossRef]
- Song, Z.; Kennedy, P.G.; Liew, F.J.; Schilling, J.S. Fungal endophytes as priority colonizers initiating wood decomposition. Functional Ecology 2017, 31, 407–418. [Google Scholar] [CrossRef]
- Baldrian, P. Forest microbiome: diversity, complexity and dynamics. FEMS Microbiology Reviews 2017, 41, 109–130. [Google Scholar] [CrossRef]
- Heilmann-Clausen, J.; Barron, E.S.; Boddy, L.; Dahlberg, A.; Griffith, G.W.; Nordén, J.; Ovaskainen, O.; Perini, C.; Senn-Irlet, B.; Halme, P. A fungal perspective on conservation biology. Conservation Biology 2015, 29, 61–68. [Google Scholar] [CrossRef]
- Hawksworth David, L.; Lücking, R. Fungal Diversity Revisited: 2.2 to 3.8 Million Species. Microbiology Spectrum 2017, 5. [Google Scholar] [CrossRef]
- Lindahl, B.D.; Nilsson, R.H.; Tedersoo, L.; Abarenkov, K.; Carlsen, T.; Kjøller, R.; Kõljalg, U.; Pennanen, T.; Rosendahl, S.; Stenlid, J.; et al. Fungal community analysis by high-throughput sequencing of amplified markers – a user's guide. New Phytologist 2013, 199, 288–299. [Google Scholar] [CrossRef]
- Blackwell, M. The Fungi: 1, 2, 3 … 5.1 million species? American Journal of Botany 2011, 98, 426–438. [Google Scholar] [CrossRef]
- Toju, H.; Tanabe, A.S.; Yamamoto, S.; Sato, H. High-Coverage ITS Primers for the DNA-Based Identification of Ascomycetes and Basidiomycetes in Environmental Samples. PLOS ONE 2012, 7. [Google Scholar] [CrossRef] [PubMed]
- Nilsson, R.H.; Anslan, S.; Bahram, M.; Wurzbacher, C.; Baldrian, P.; Tedersoo, L. Mycobiome diversity: high-throughput sequencing and identification of fungi. Nature Reviews Microbiology 2019, 17, 95–109. [Google Scholar] [CrossRef]
- Tordoni, E.; Ametrano, C.G.; Banchi, E.; Ongaro, S.; Pallavicini, A.; Bacaro, G.; Muggia, L. Integrated eDNA metabarcoding and morphological analyses assess spatio-temporal patterns of airborne fungal spores. Ecological Indicators 2021, 121. [Google Scholar] [CrossRef]
- Desprez-Loustau, M.-L.; Aguayo, J.; Dutech, C.; Hayden, K.J.; Husson, C.; Jakushkin, B.; Marçais, B.; Piou, D.; Robin, C.; Vacher, C. An evolutionary ecology perspective to address forest pathology challenges of today and tomorrow. Annals of Forest Science 2016, 73, 45–67. [Google Scholar] [CrossRef]
- Eichmeier, A.; Spetik, M.; Frejlichova, L.; Pecenka, J.; Cechova, J.; Stefl, L.; Simek, P. Survey of the Trunk Wood Mycobiome of an Ancient Tilia × europaea L. Preprints 2025. [Google Scholar] [CrossRef]
- Sieber, T.N. Endophytic fungi in forest trees: are they mutualists? Fungal Biology Reviews 2007, 21, 75–89. [Google Scholar] [CrossRef]
- Terhonen, E.; Blumenstein, K.; Kovalchuk, A.; Asiegbu, F.O. Forest Tree Microbiomes and Associated Fungal Endophytes: Functional Roles and Impact on Forest Health. Forests 2019, 10. [Google Scholar] [CrossRef]
- Dawson, S.K.; Berglund, H.; Ovaskainen, O.; Jonsson, B.G.; Snäll, T.; Ottosson, E.; Jönsson, M. Fungal trait-environment relationships in wood-inhabiting communities of boreal forest patches. Functional Ecology 2024, 38, 1944–1958. [Google Scholar] [CrossRef]
- Jönsson, M.T.; Edman, M.; Jonsson, B.G. Colonization and extinction patterns of wood-decaying fungi in a boreal old-growth Picea abies forest. Journal of Ecology 2008, 96, 1065–1075. [Google Scholar] [CrossRef]
- Liao, H.-L.; Bonito, G.; Rojas, J.A.; Hameed, K.; Wu, S.; Schadt, C.W.; Labbé, J.; Tuskan, G.A.; Martin, F.; Grigoriev, I.V.; et al. Fungal Endophytes of Populus trichocarpa Alter Host Phenotype, Gene Expression, and Rhizobiome Composition. Molecular Plant-Microbe Interactions® 2019, 32, 853–864. [Google Scholar] [CrossRef]
- Helander, M.; Ahlholm, J.; Sieber, T.N.; Hinneri, S.; Saikkonen, K. Fragmented environment affects birch leaf endophytes. New Phytologist 2007, 175, 547–553. [Google Scholar] [CrossRef]
- Scholtysik, A.; Unterseher, M.; Otto, P.; Wirth, C. Spatio-temporal dynamics of endophyte diversity in the canopy of European ash (Fraxinus excelsior). Mycological Progress 2013, 12, 291–304. [Google Scholar] [CrossRef]
- Ihrmark, K.; Bödeker, I.T.M.; Cruz-Martinez, K.; Friberg, H.; Kubartova, A.; Schenck, J.; Strid, Y.; Stenlid, J.; Brandström-Durling, M.; Clemmensen, K.E.; et al. New primers to amplify the fungal ITS2 region – evaluation by 454-sequencing of artificial and natural communities. FEMS Microbiology Ecology 2012, 82, 666–677. [Google Scholar] [CrossRef]
- White, T.J.; Bruns, T.; Lee, S.; Taylor, J. Amplification and Direct Sequencing of Fungal Ribosomal RNA Genes for Phylogenetics. In PCR Protocols, Innis, M.A., Gelfand, D.H., Sninsky, J.J., White, T.J., Eds.; Academic Press: San Diego, 1990; pp. 315–322. [Google Scholar]
- Stover, N.A.; Cavalcanti, A.R.O. Using NCBI BLAST. Current Protocols Essential Laboratory Techniques 2017, 14, 11.11–11. [Google Scholar] [CrossRef]
- Babraham, B. FastQC: A quality control tool for high throughput sequence data.
- Větrovský, T.; Baldrian, P.; Morais, D. SEED 2: a user-friendly platform for amplicon high-throughput sequencing data analyses. Bioinformatics 2018, 34, 2292–2294. [Google Scholar] [CrossRef]
- Aronesty, E. "Comparison of Sequencing Utility Programs". The Open Bioinformatics Journal 2013, 7, 1–8. [Google Scholar] [CrossRef]
- Bengtsson-Palme, J.; Ryberg, M.; Hartmann, M.; Branco, S.; Wang, Z.; Godhe, A.; De Wit, P.; Sánchez-García, M.; Ebersberger, I.; de Sousa, F.; et al. Improved software detection and extraction of ITS1 and ITS2 from ribosomal ITS sequences of fungi and other eukaryotes for analysis of environmental sequencing data. Methods in Ecology and Evolution 2013, 4, 914–919. [Google Scholar] [CrossRef]
- Blaxter, M.; Mann, J.; Chapman, T.; Thomas, F.; Whitton, C.; Floyd, R.; Abebe, E. Defining operational taxonomic units using DNA barcode data. Philosophical Transactions of the Royal Society B: Biological Sciences 2005, 360, 1935–1943. [Google Scholar] [CrossRef] [PubMed]
- Edgar, R.C. UPARSE: highly accurate OTU sequences from microbial amplicon reads. Nature Methods 2013, 10, 996–998. [Google Scholar] [CrossRef]
- Nilsson, R.H.; Larsson, K.-H.; Taylor, A. F S.; Bengtsson-Palme, J.; Jeppesen, T.S.; Schigel, D.; Kennedy, P.; Picard, K.; Glöckner, F.O.; Tedersoo, L.; et al. The UNITE database for molecular identification of fungi: handling dark taxa and parallel taxonomic classifications. Nucleic Acids Research 2019, 47, 259–264. [Google Scholar] [CrossRef] [PubMed]
- Baldrian, P.; Větrovský, T.; Lepinay, C.; Kohout, P. High-throughput sequencing view on the magnitude of global fungal diversity. Fungal Diversity 2022, 114, 539–547. [Google Scholar] [CrossRef]
- Tedersoo, L.; Bahram, M.; Põlme, S.; Kõljalg, U.; Yorou, N.S.; Wijesundera, R.; Ruiz, L.V.; Vasco-Palacios, A.M.; Thu, P.Q.; Suija, A.; et al. Global diversity and geography of soil fungi. Science 2014, 346. [Google Scholar] [CrossRef]
- Gloor, G.B.; Macklaim, J.M.; Pawlowsky-Glahn, V.; Egozcue, J.J. Microbiome Datasets Are Compositional: And This Is Not Optional. Frontiers in Microbiology 2017, 8. [Google Scholar] [CrossRef] [PubMed]
- Greenacre, M.; Martínez-Álvaro, M.; Blasco, A. Compositional Data Analysis of Microbiome and Any-Omics Datasets: A Validation of the Additive Logratio Transformation. Frontiers in Microbiology 2021, 12. [Google Scholar] [CrossRef]
- Hill, M.O. Diversity and Evenness: A Unifying Notation and Its Consequences. Ecology 1973, 54, 427–432. [Google Scholar] [CrossRef]
- Willis, A.D. Rarefaction, Alpha Diversity, and Statistics. Frontiers in Microbiology, 2019. [Google Scholar]
- Anderson, M.J. Distance-Based Tests for Homogeneity of Multivariate Dispersions. Biometrics 2006, 62, 245–253. [Google Scholar] [CrossRef]
- Nguyen, N.H.; Song, Z.; Bates, S.T.; Branco, S.; Tedersoo, L.; Menke, J.; Schilling, J.S.; Kennedy, P.G. FUNGuild: An open annotation tool for parsing fungal community datasets by ecological guild. Fungal Ecology 2016, 20, 241–248. [Google Scholar] [CrossRef]
- Kohl, M.; Wiese, S.; Warscheid, B. Networks. In Data Mining in Proteomics: From Standards to Applications, Hamacher, M., Eisenacher, M., Stephan, C., Eds.; Humana Press: Totowa, NJ, 2011; pp. 291–303. [Google Scholar]
- Krah, F.-S.; Bässler, C.; Heibl, C.; Soghigian, J.; Schaefer, H.; Hibbett, D.S. Evolutionary dynamics of host specialization in wood-decay fungi. BMC Evolutionary Biology 2018, 18, 119. [Google Scholar] [CrossRef]
- Venugopal, P.; Junninen, K.; Edman, M.; Kouki, J. Assemblage composition of fungal wood-decay species has a major influence on how climate and wood quality modify decomposition. FEMS Microbiology Ecology 2017, 93. [Google Scholar] [CrossRef] [PubMed]
- Yang, S.; Poorter, L.; Kuramae, E.E.; Sass-Klaassen, U.; Leite, M.F.A.; Costa, O.Y.A.; Kowalchuk, G.A.; Cornelissen, J.H.C.; van Hal, J.; Goudzwaard, L.; et al. Stem traits, compartments and tree species affect fungal communities on decaying wood. Environmental Microbiology 2022, 24, 3625–3639. [Google Scholar] [CrossRef] [PubMed]
- Menkis, A.; Redr, D.; Bengtsson, V.; Hedin, J.; Niklasson, M.; Nordén, B.; Dahlberg, A. Endophytes dominate fungal communities in six-year-old veteranisation wounds in living oak trunks. Fungal Ecology 2022, 59, 101020. [Google Scholar] [CrossRef]
- Cregger, M.A.; Veach, A.M.; Yang, Z.K.; Crouch, M.J.; Vilgalys, R.; Tuskan, G.A.; Schadt, C.W. The Populus holobiont: dissecting the effects of plant niches and genotype on the microbiome. Microbiome 2018, 6, 31. [Google Scholar] [CrossRef] [PubMed]
- Wang, Y.; Zhang, W.; Ding, C.; Zhang, B.; Huang, Q.; Huang, R.; Su, X. Endophytic Communities of Transgenic Poplar Were Determined by the Environment and Niche Rather Than by Transgenic Events. Frontiers in Microbiology 2019, 10. [Google Scholar] [CrossRef]
- Spies, C.F.J.; Moyo, P.; Halleen, F.; Mostert, L. Phaeoacremonium species diversity on woody hosts in the Western Cape Province of South Africa. Persoonia - Molecular Phylogeny and Evolution of Fungi 2018, 40, 26–62. [Google Scholar] [CrossRef]
- Travadon, R.; Lawrence, D.P.; Rooney-Latham, S.; Gubler, W.D.; Wilcox, W.F.; Rolshausen, P.E.; Baumgartner, K. Cadophora species associated with wood-decay of grapevine in North America. Fungal Biology 2015, 119, 53–66. [Google Scholar] [CrossRef]
- Spetik, M.; Pecenka, J.; Stuskova, K.; Stepanova, B.; Eichmeier, A.; Kiss, T. Fungal Trunk Diseases Causing Decline of Apricot and Plum Trees in the Czech Republic. Plant Disease 2023, 108, 1425–1436. [Google Scholar] [CrossRef]
- Damm, U.; Mostert, L.; Crous, P.W.; Fourie, P.H. Novel Phaeoacremonium species associated with necrotic wood of Prunus trees. Persoonia - Molecular Phylogeny and Evolution of Fungi 2008, 20, 87–102. [Google Scholar] [CrossRef] [PubMed]
- Argiroff William, A.; Carrell Alyssa, A.; Klingeman Dawn, M.; Dove Nicholas, C.; Muchero, W.; Veach Allison, M.; Wahl, T.; Lebreux Steven, J.; Webb Amber, B.; Peyton, K.; et al. Seasonality and longer-term development generate temporal dynamics in the Populus microbiome. mSystems 2024, 9, e00886–00823. [Google Scholar] [CrossRef] [PubMed]
- Lin, C.-P.; Lin, Y.-F.; Liu, Y.-C.; Lu, M.-Y.J.; Ke, H.-M.; Tsai, I.J. Spatiotemporal dynamics reveal high turnover and contrasting assembly processes in fungal communities across contiguous habitats of tropical forests. Environmental Microbiome 2025, 20, 23. [Google Scholar] [CrossRef]
- Purahong, W.; Wubet, T.; Lentendu, G.; Hoppe, B.; Jariyavidyanont, K.; Arnstadt, T.; Baber, K.; Otto, P.; Kellner, H.; Hofrichter, M.; et al. Determinants of Deadwood-Inhabiting Fungal Communities in Temperate Forests: Molecular Evidence From a Large Scale Deadwood Decomposition Experiment. Frontiers in Microbiology 2018, 9. [Google Scholar] [CrossRef] [PubMed]
- Hoppe, B.; Purahong, W.; Wubet, T.; Kahl, T.; Bauhus, J.; Arnstadt, T.; Hofrichter, M.; Buscot, F.; Krüger, D. Linking molecular deadwood-inhabiting fungal diversity and community dynamics to ecosystem functions and processes in Central European forests. Fungal Diversity 2016, 77, 367–379. [Google Scholar] [CrossRef]
- Hiscox, J.; Savoury, M.; Müller, C.T.; Lindahl, B.D.; Rogers, H.J.; Boddy, L. Priority effects during fungal community establishment in beech wood. The ISME Journal 2015, 9, 2246–2260. [Google Scholar] [CrossRef]
- Davis, E.L.; Weatherhead, E.; Koide, R.T. The potential saprotrophic capacity of foliar endophytic fungi from Quercus gambelii. Fungal Ecology 2023, 62, 101221. [Google Scholar] [CrossRef]
- Cline, L.C.; Schilling, J.S.; Menke, J.; Groenhof, E.; Kennedy, P.G. Ecological and functional effects of fungal endophytes on wood decomposition. Functional Ecology 2018, 32, 181–191. [Google Scholar] [CrossRef]
- Tanney, J.B.; Kemler, M.; Vivas, M.; Wingfield, M.J.; Slippers, B. Silent invaders: the hidden threat of asymptomatic phytobiomes to forest biosecurity. New Phytologist 2025, 247, 533–545. [Google Scholar] [CrossRef]
- Cosner, J.; Pandharikar, G.; Tremble, K.; Nash, J.; Rush, T.A.; Vilgalys, R.; Veneault-Fourrey, C. Fungal endophytes. Current Biology 2025, 35, R904–R910. [Google Scholar] [CrossRef]
- Runnel, K.; Tedersoo, L.; Krah, F.-S.; Piepenbring, M.; Scheepens, J.F.; Hollert, H.; Johann, S.; Meyer, N.; Bässler, C. Toward harnessing biodiversity–ecosystem function relationships in fungi. Trends in Ecology & Evolution 2025, 40, 180–190. [Google Scholar] [CrossRef]
- Peay, K.G.; Kennedy, P.G.; Talbot, J.M. Dimensions of biodiversity in the Earth mycobiome. Nature Reviews Microbiology 2016, 14, 434–447. [Google Scholar] [CrossRef]
- Ma, B.; Wang, H.; Dsouza, M.; Lou, J.; He, Y.; Dai, Z.; Brookes, P.C.; Xu, J.; Gilbert, J.A. Geographic patterns of co-occurrence network topological features for soil microbiota at continental scale in eastern China. The ISME Journal 2016, 10, 1891–1901. [Google Scholar] [CrossRef]
- Toju, H.; Peay, K.G.; Yamamichi, M.; Narisawa, K.; Hiruma, K.; Naito, K.; Fukuda, S.; Ushio, M.; Nakaoka, S.; Onoda, Y.; et al. Core microbiomes for sustainable agroecosystems. Nature Plants 2018, 4, 247–257. [Google Scholar] [CrossRef]
- Gao, C.; Xu, L.; Montoya, L.; Madera, M.; Hollingsworth, J.; Chen, L.; Purdom, E.; Singan, V.; Vogel, J.; Hutmacher, R.B.; et al. Co-occurrence networks reveal more complexity than community composition in resistance and resilience of microbial communities. Nature Communications 2022, 13, 3867. [Google Scholar] [CrossRef] [PubMed]
- Kitagami, Y.; Matsuda, Y. Forest types matter for the community and co-occurrence network patterns of soil bacteria, fungi, and nematodes. Pedobiologia 2024, 107, 151004. [Google Scholar] [CrossRef]
- Nordén, B.; Andreasen, M.; Gran, O.; Menkis, A. Fungal diversity in wood of living trees is higher in oak than in beech, maple or linden, and is affected by tree size and climate. Biodiversity and Conservation 2025, 34, 3609–3632. [Google Scholar] [CrossRef]
Figure 3.
Shannon diversity index of wood-inhabiting fungal communities across four host tree species (Quercus robur, Populus alba, Aesculus hippocastanum and Fagus sylvatica ʻAtropuniceaʼ) in 2023 (green) and 2024 (orange). Boxes show median and interquartile range; whiskers indicate data range; circles represent outliers.
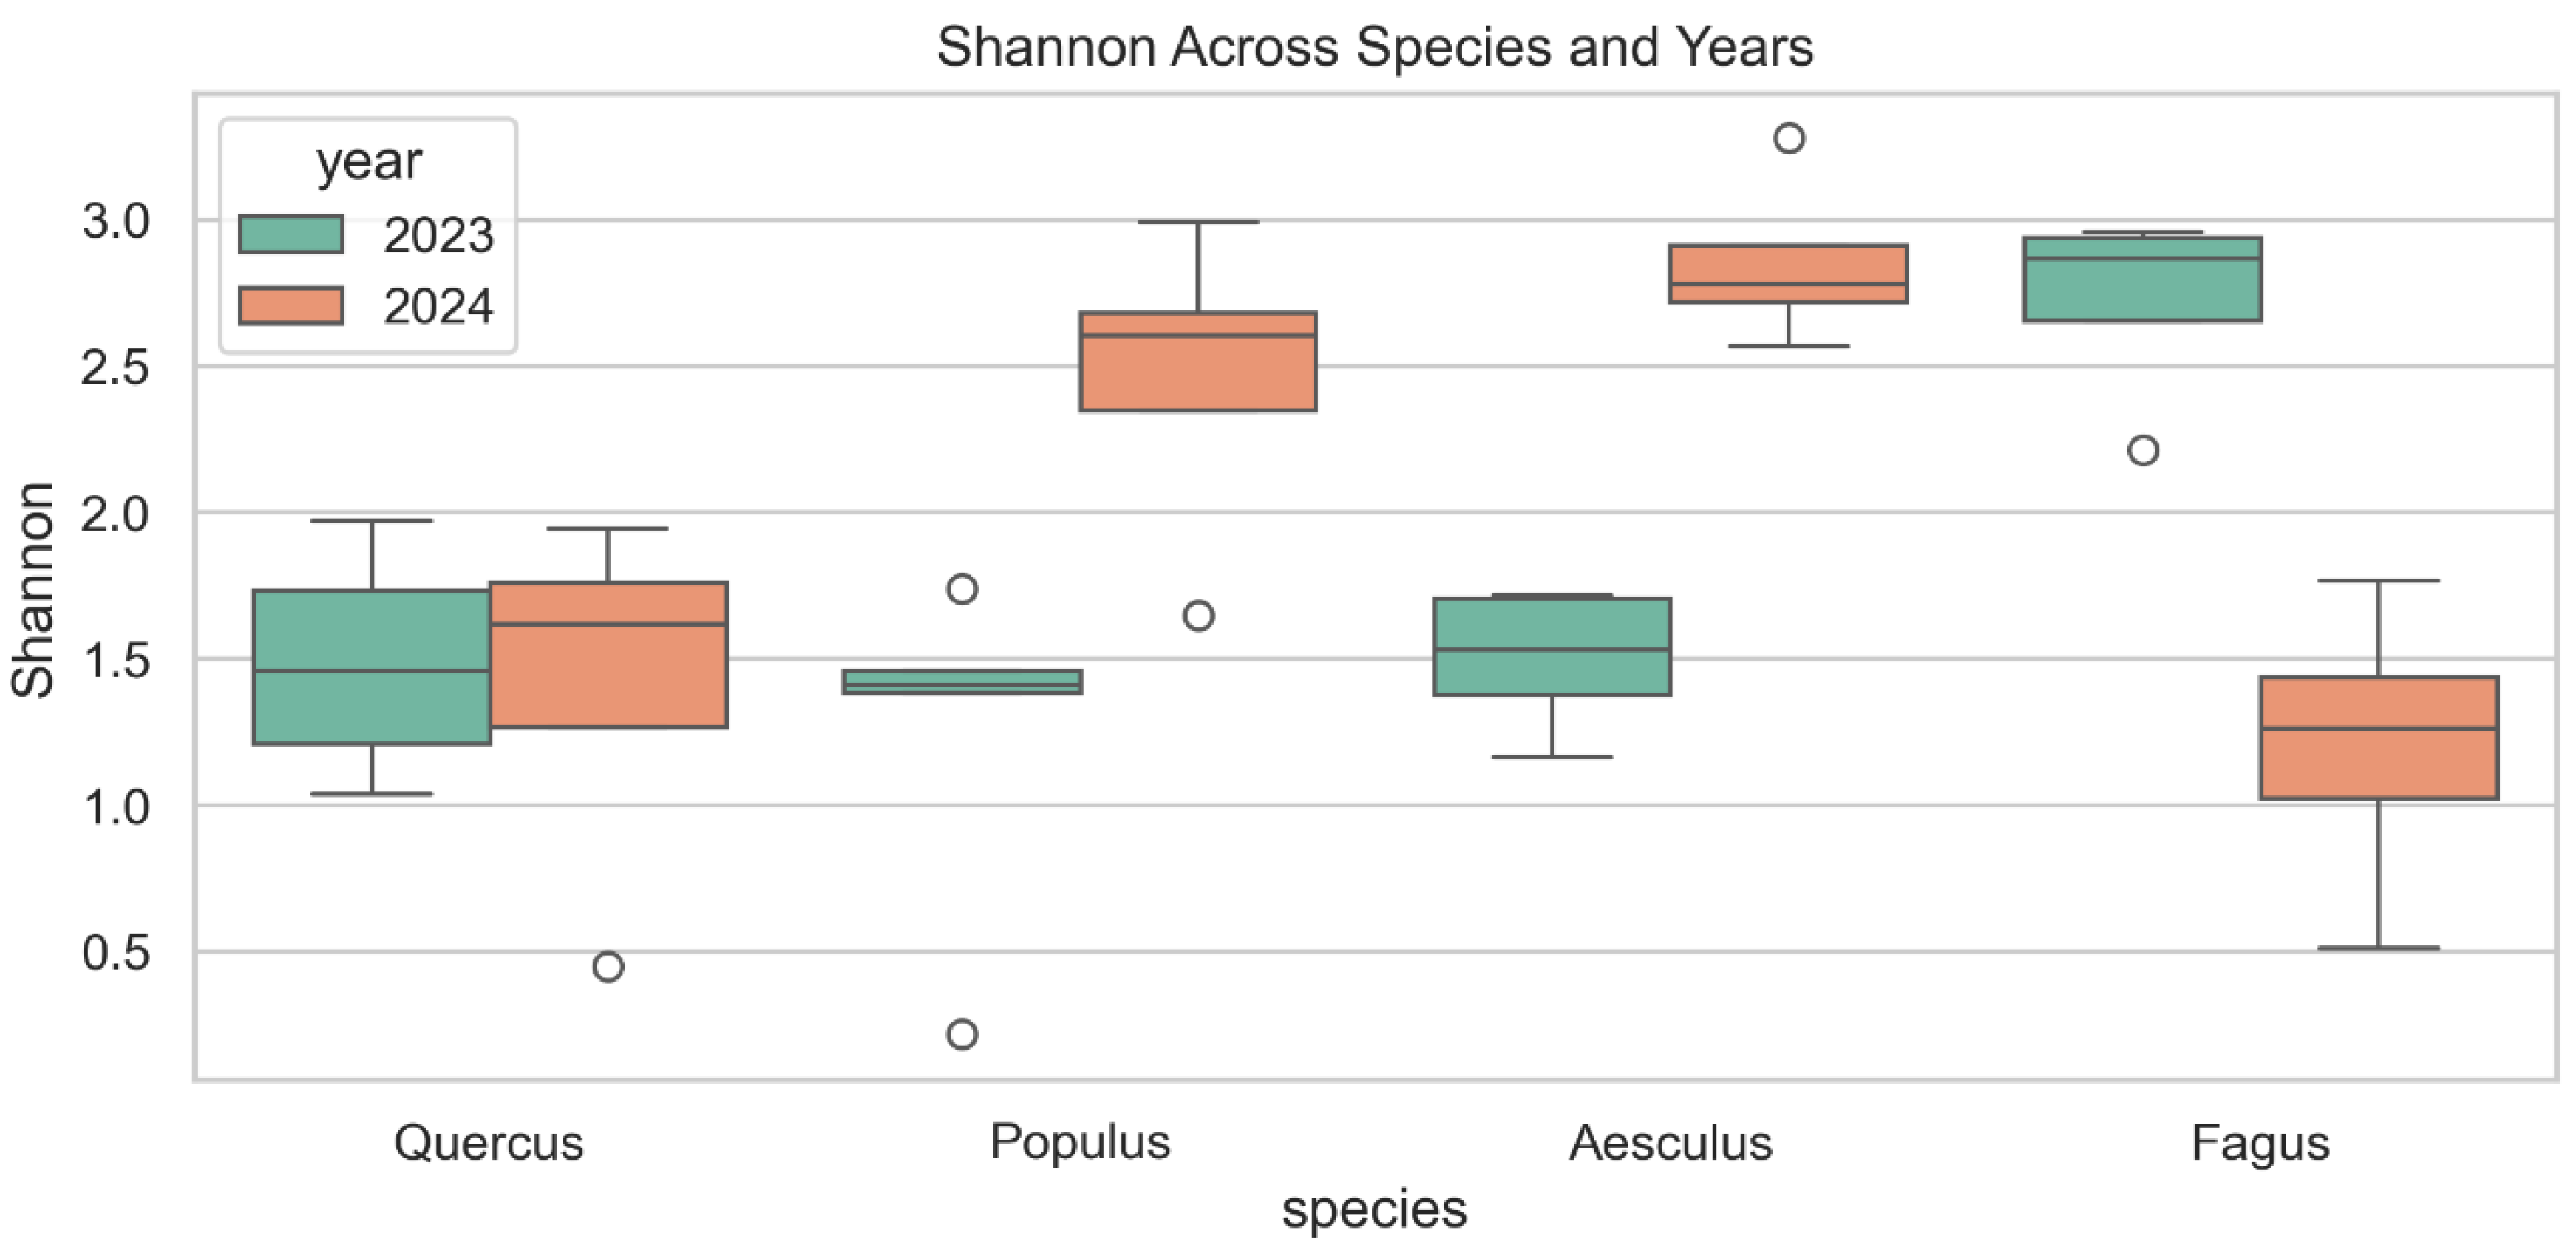
Figure 4.
Simpson diversity index of wood-inhabiting fungal communities across four host tree species (Quercus robur, Populus alba, Aesculus hippocastanum and Fagus sylvatica ʻAtropuniceaʼ) in 2023 (red) and 2024 (blue). Boxes show median and interquartile range; whiskers indicate data range; circles represent outliers.
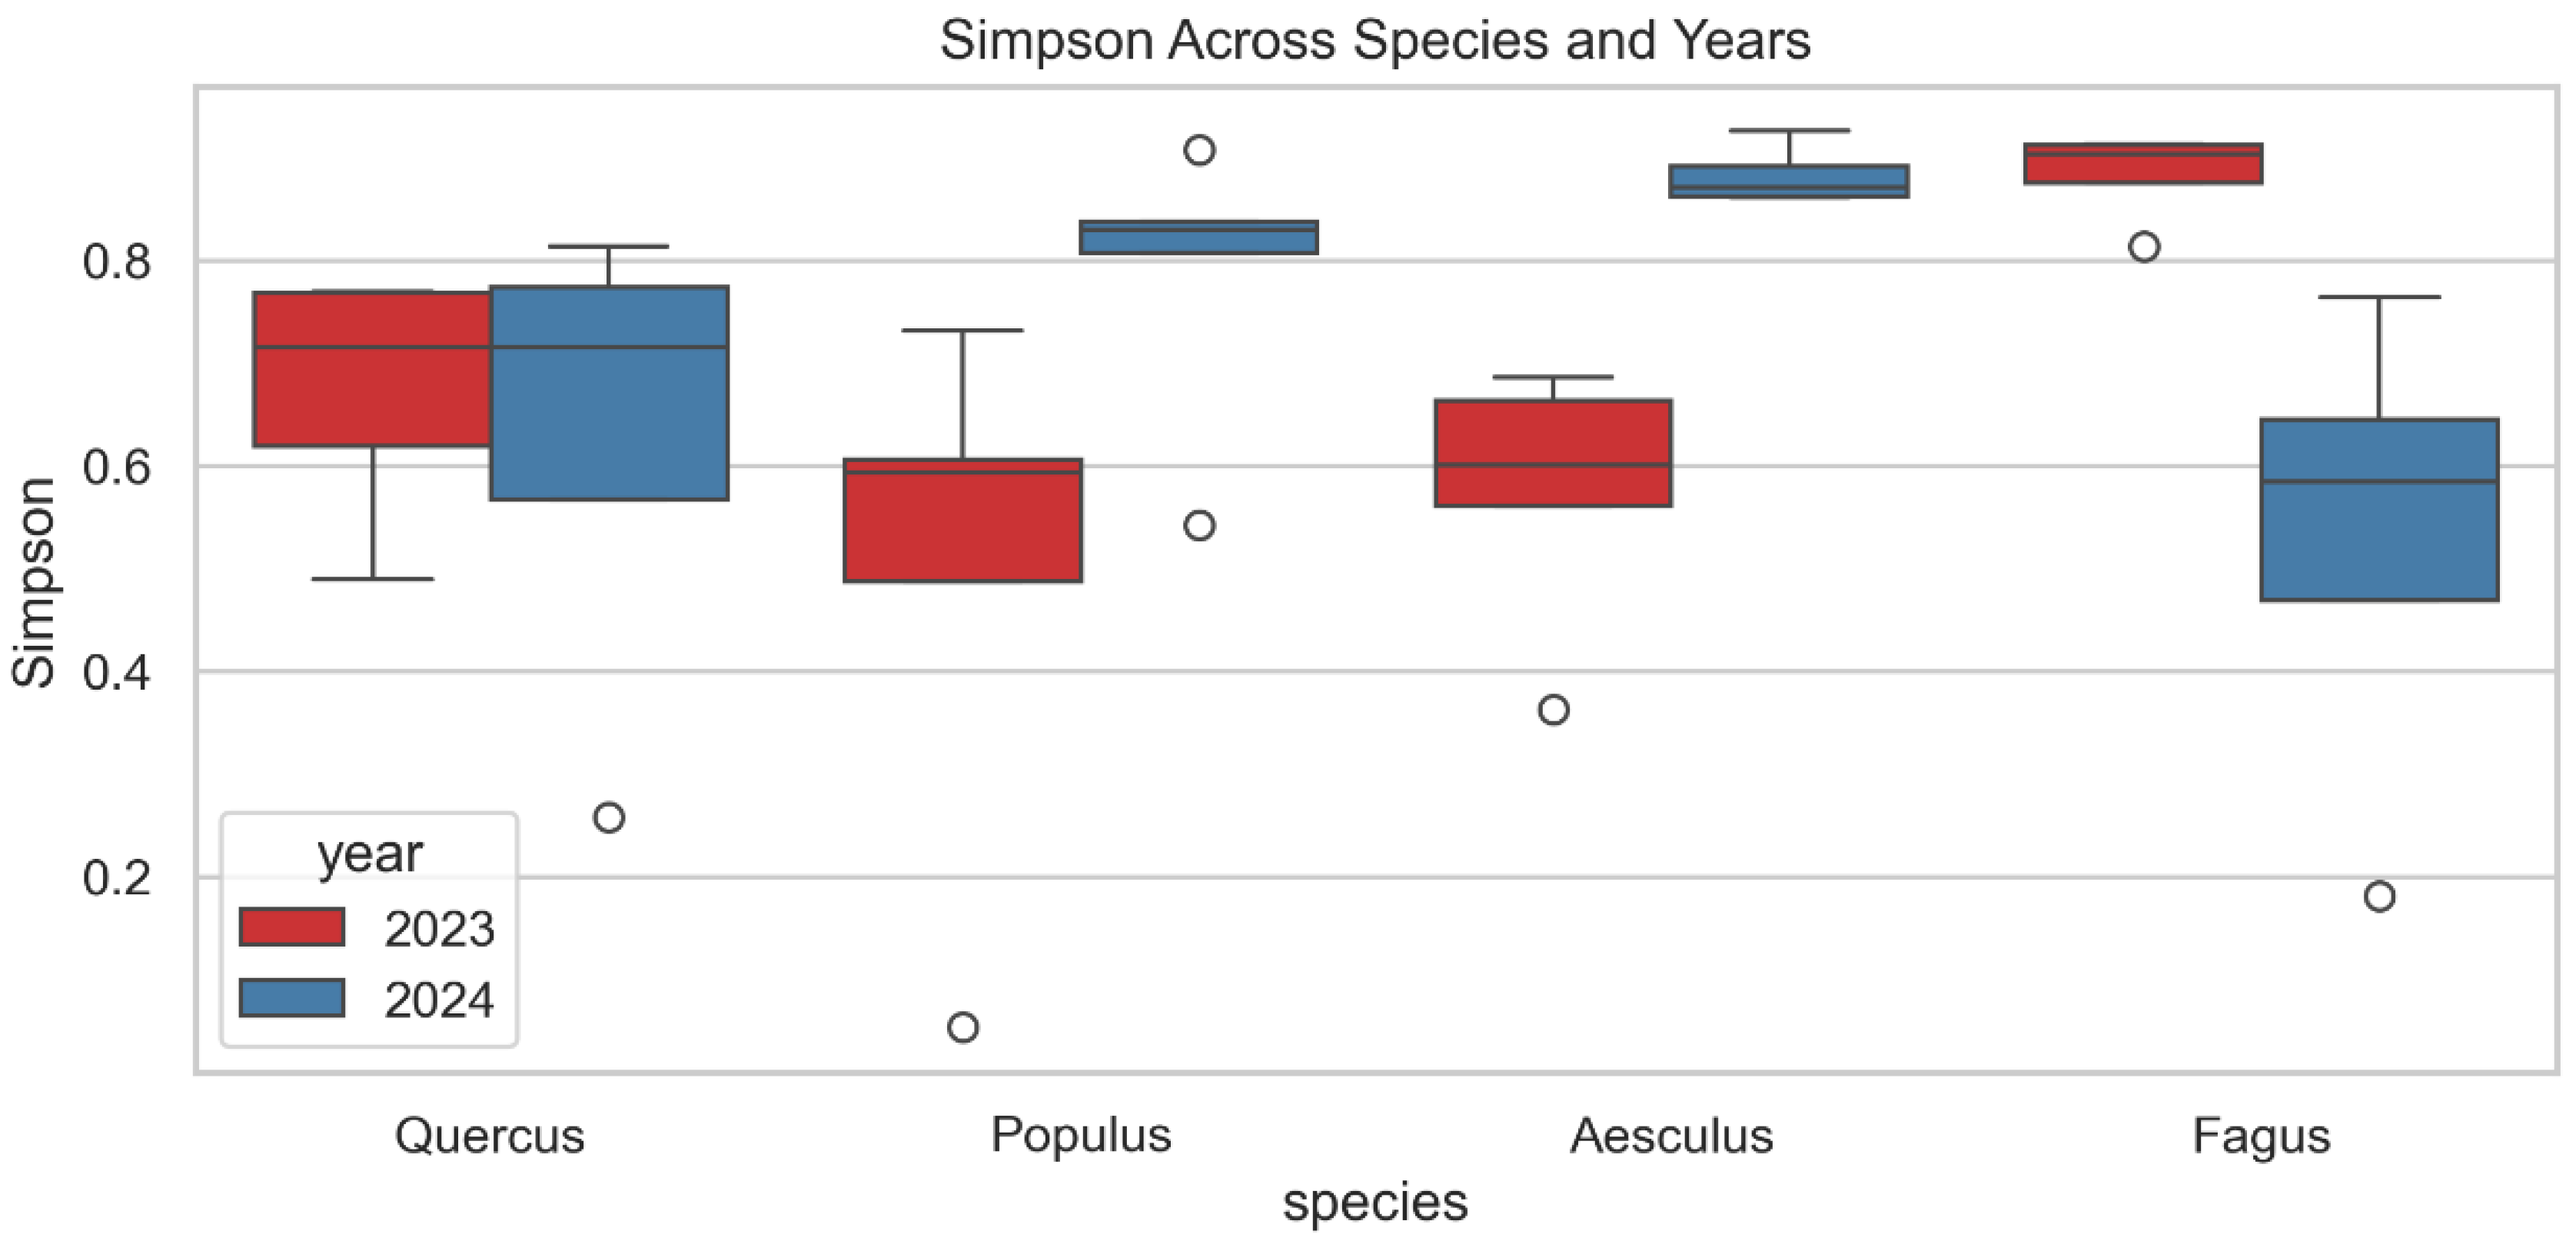
Figure 5.
Chao1 estimated richness of wood-inhabiting fungal communities across four host tree species (Quercus robur, Populus alba, Aesculus hippocastanum and Fagus sylvatica ʻAtropuniceaʼ) in 2023 (green) and 2024 (yellow). Boxes show median and interquartile range; whiskers indicate data range; circles represent outliers.
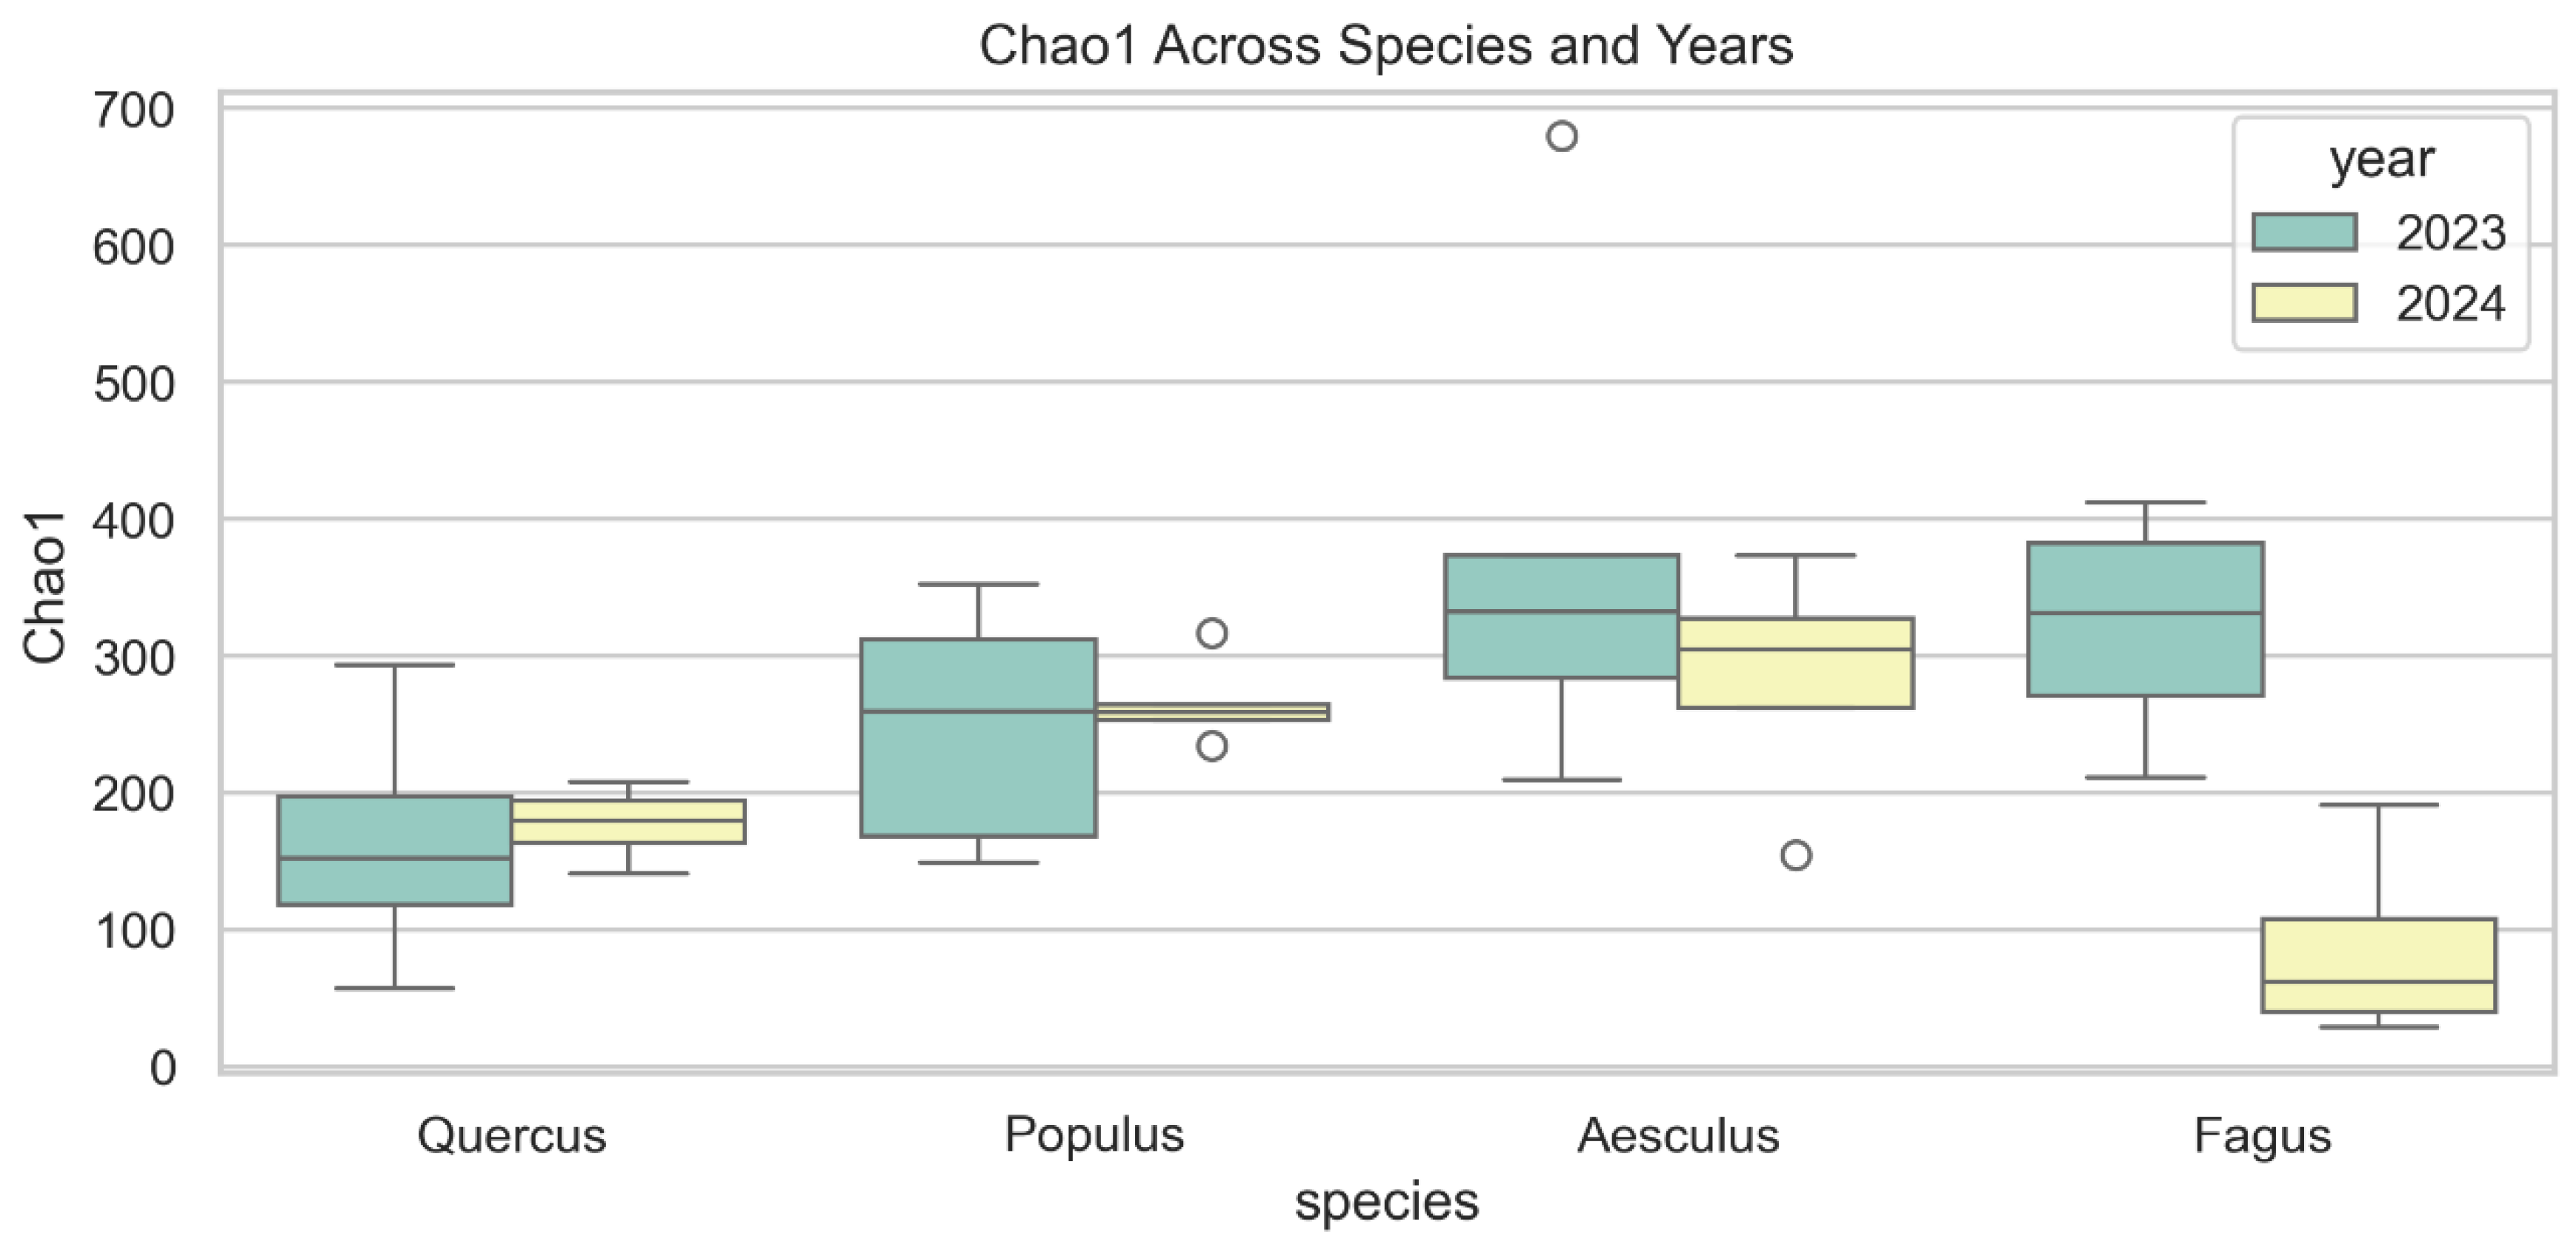
Figure 6.
Heatmap of Bray-Curtis dissimilarity aggregated by species and year (group). The heatmap illustrates the Bray-Curtis dissimilarity index values (ranging from 0.0 to 0.96) comparing fungal community compositions across four tree species (Quercus robur, Populus alba, Aesculus hippocastanum and Fagus sylvatica ʻAtropuniceaʼ) between 2023 and 2024. Dissimilarity values are represented by a color gradient, where dark purple indicates high similarity (0.0) and yellow indicates higher dissimilarity (up to 0.96).
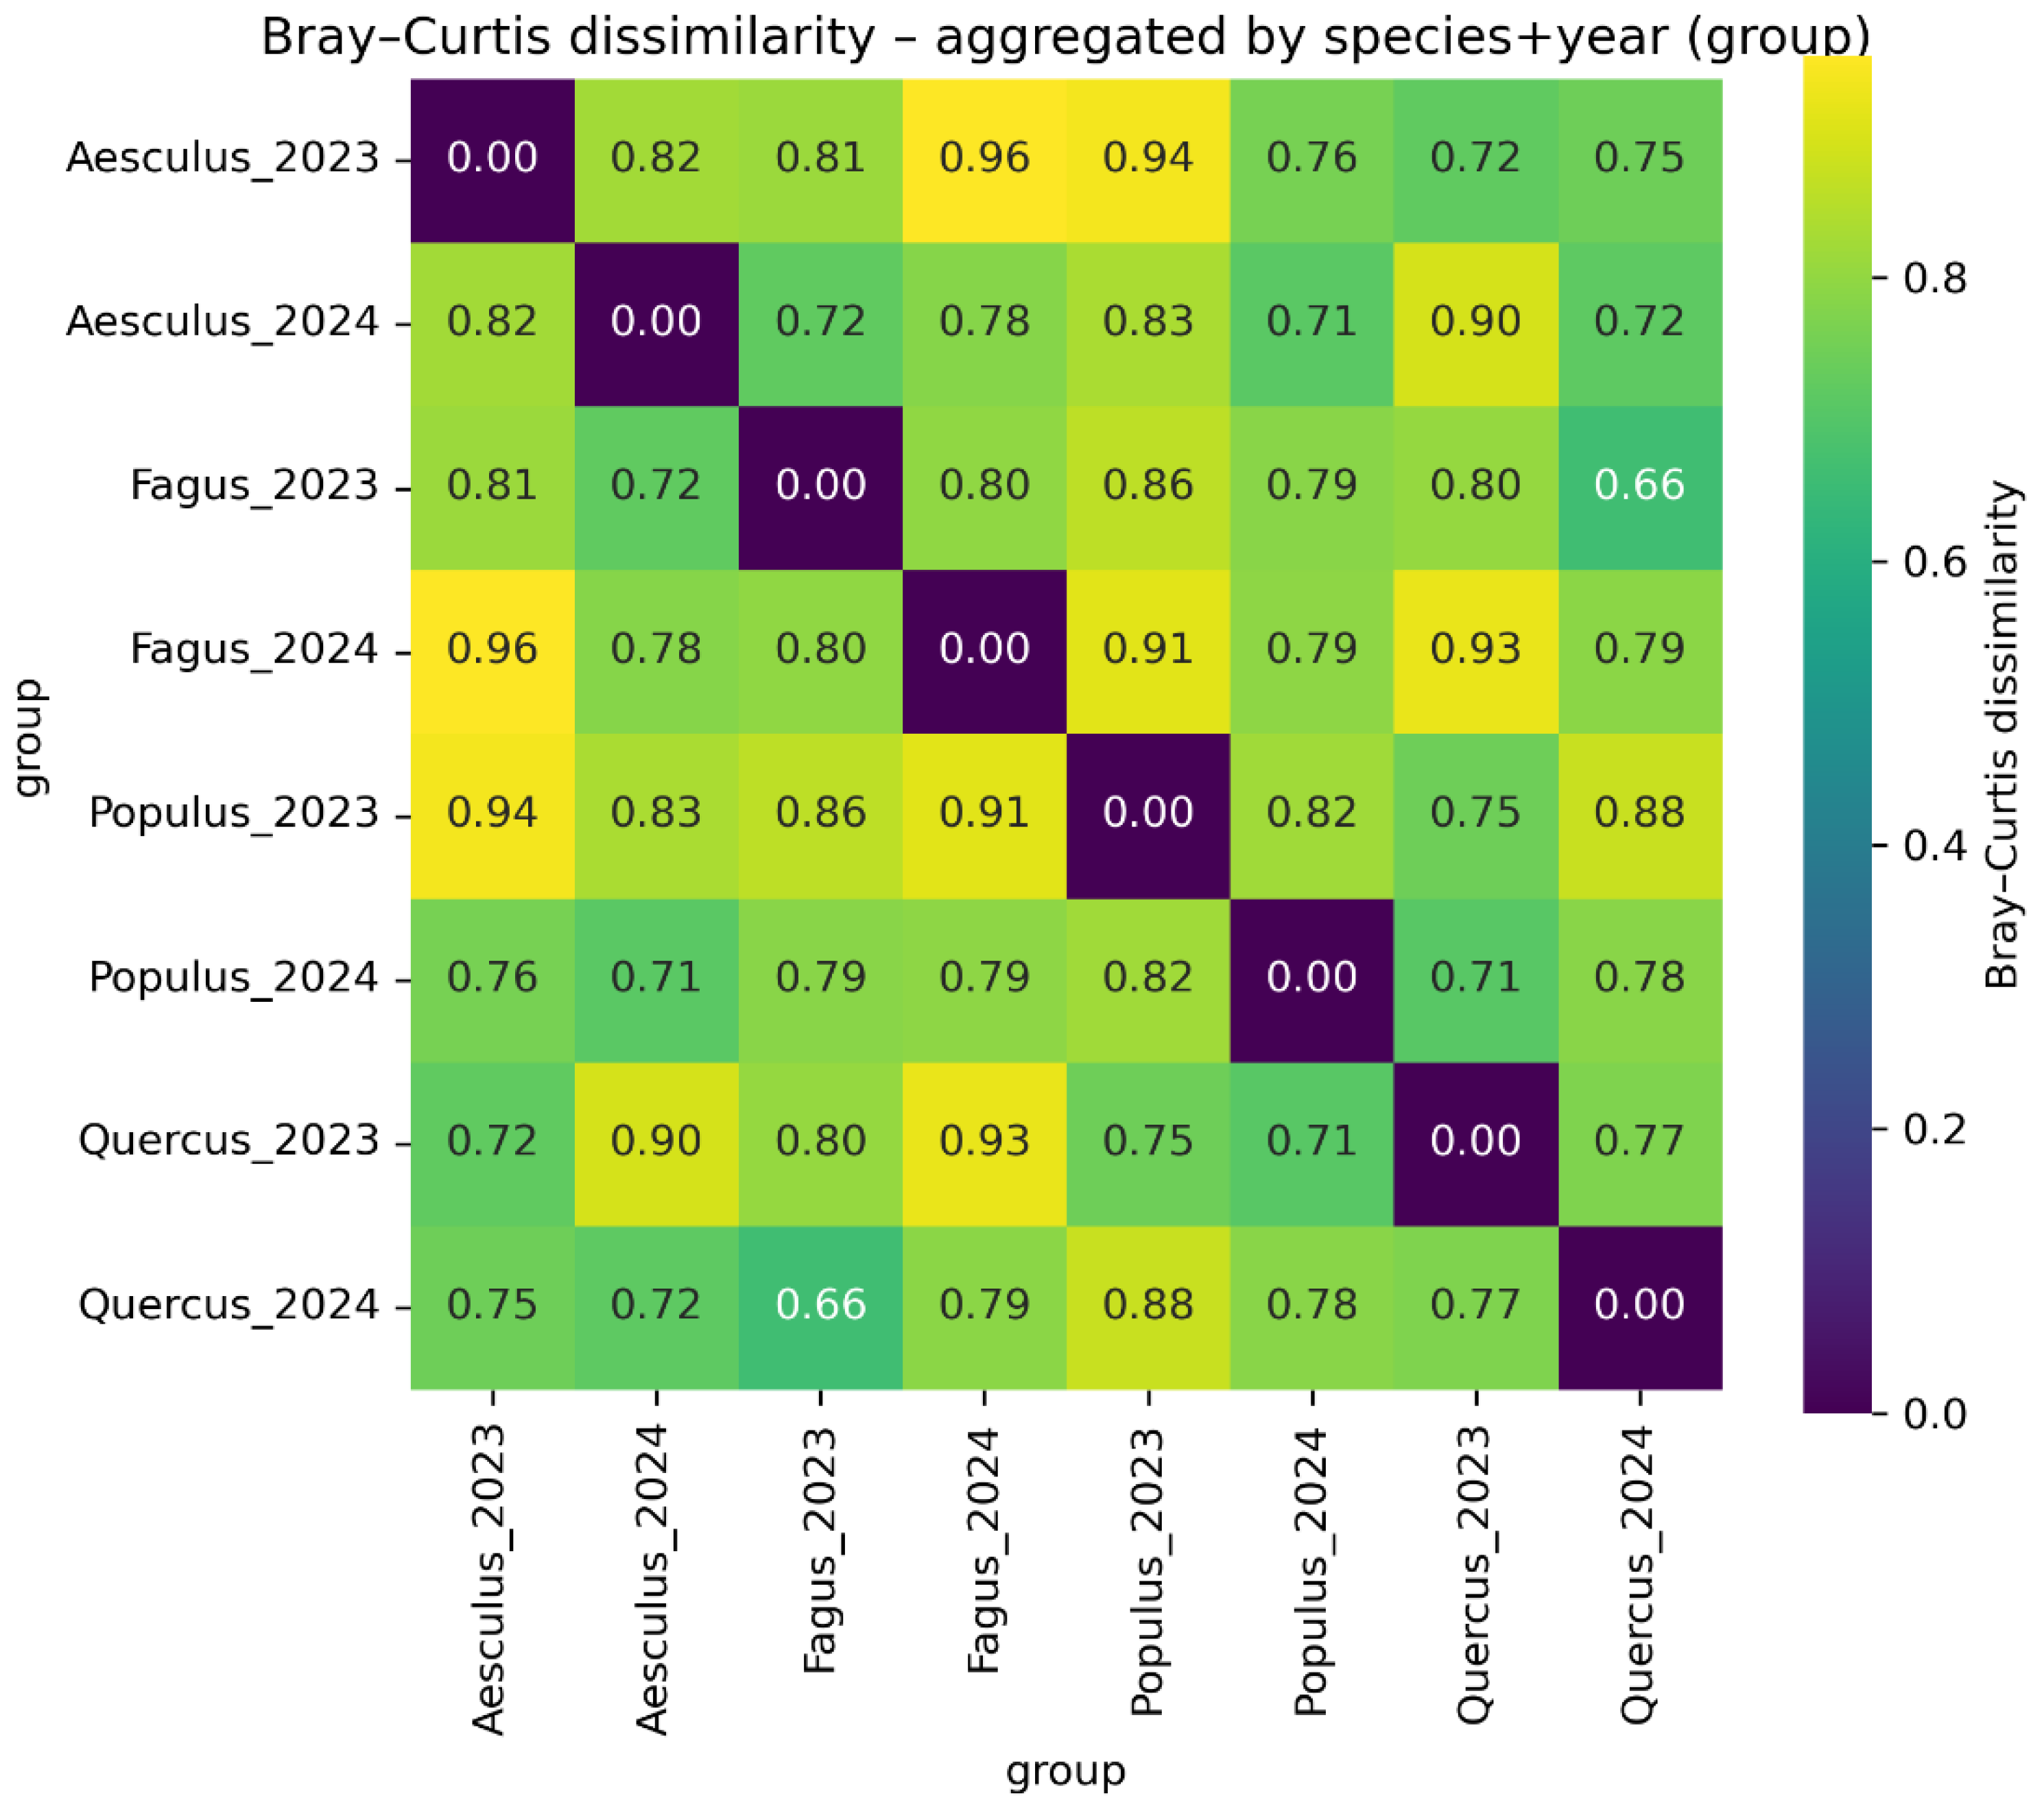
Figure 7.
PCoA (Jaccard) of fungal communities associated with four tree species (Quercus robur, Populus alba, Aesculus hippocastanum and Fagus sylvatica ʻAtropuniceaʼ) in 2023 (circles) and 2024 (crosses). Ellipses indicate 95% confidence intervals for each species. PC1 and PC2 explain 9.6% and 8.2% of variation, respectively. PERMANOVA shows significant differences among species (p = 0.001).
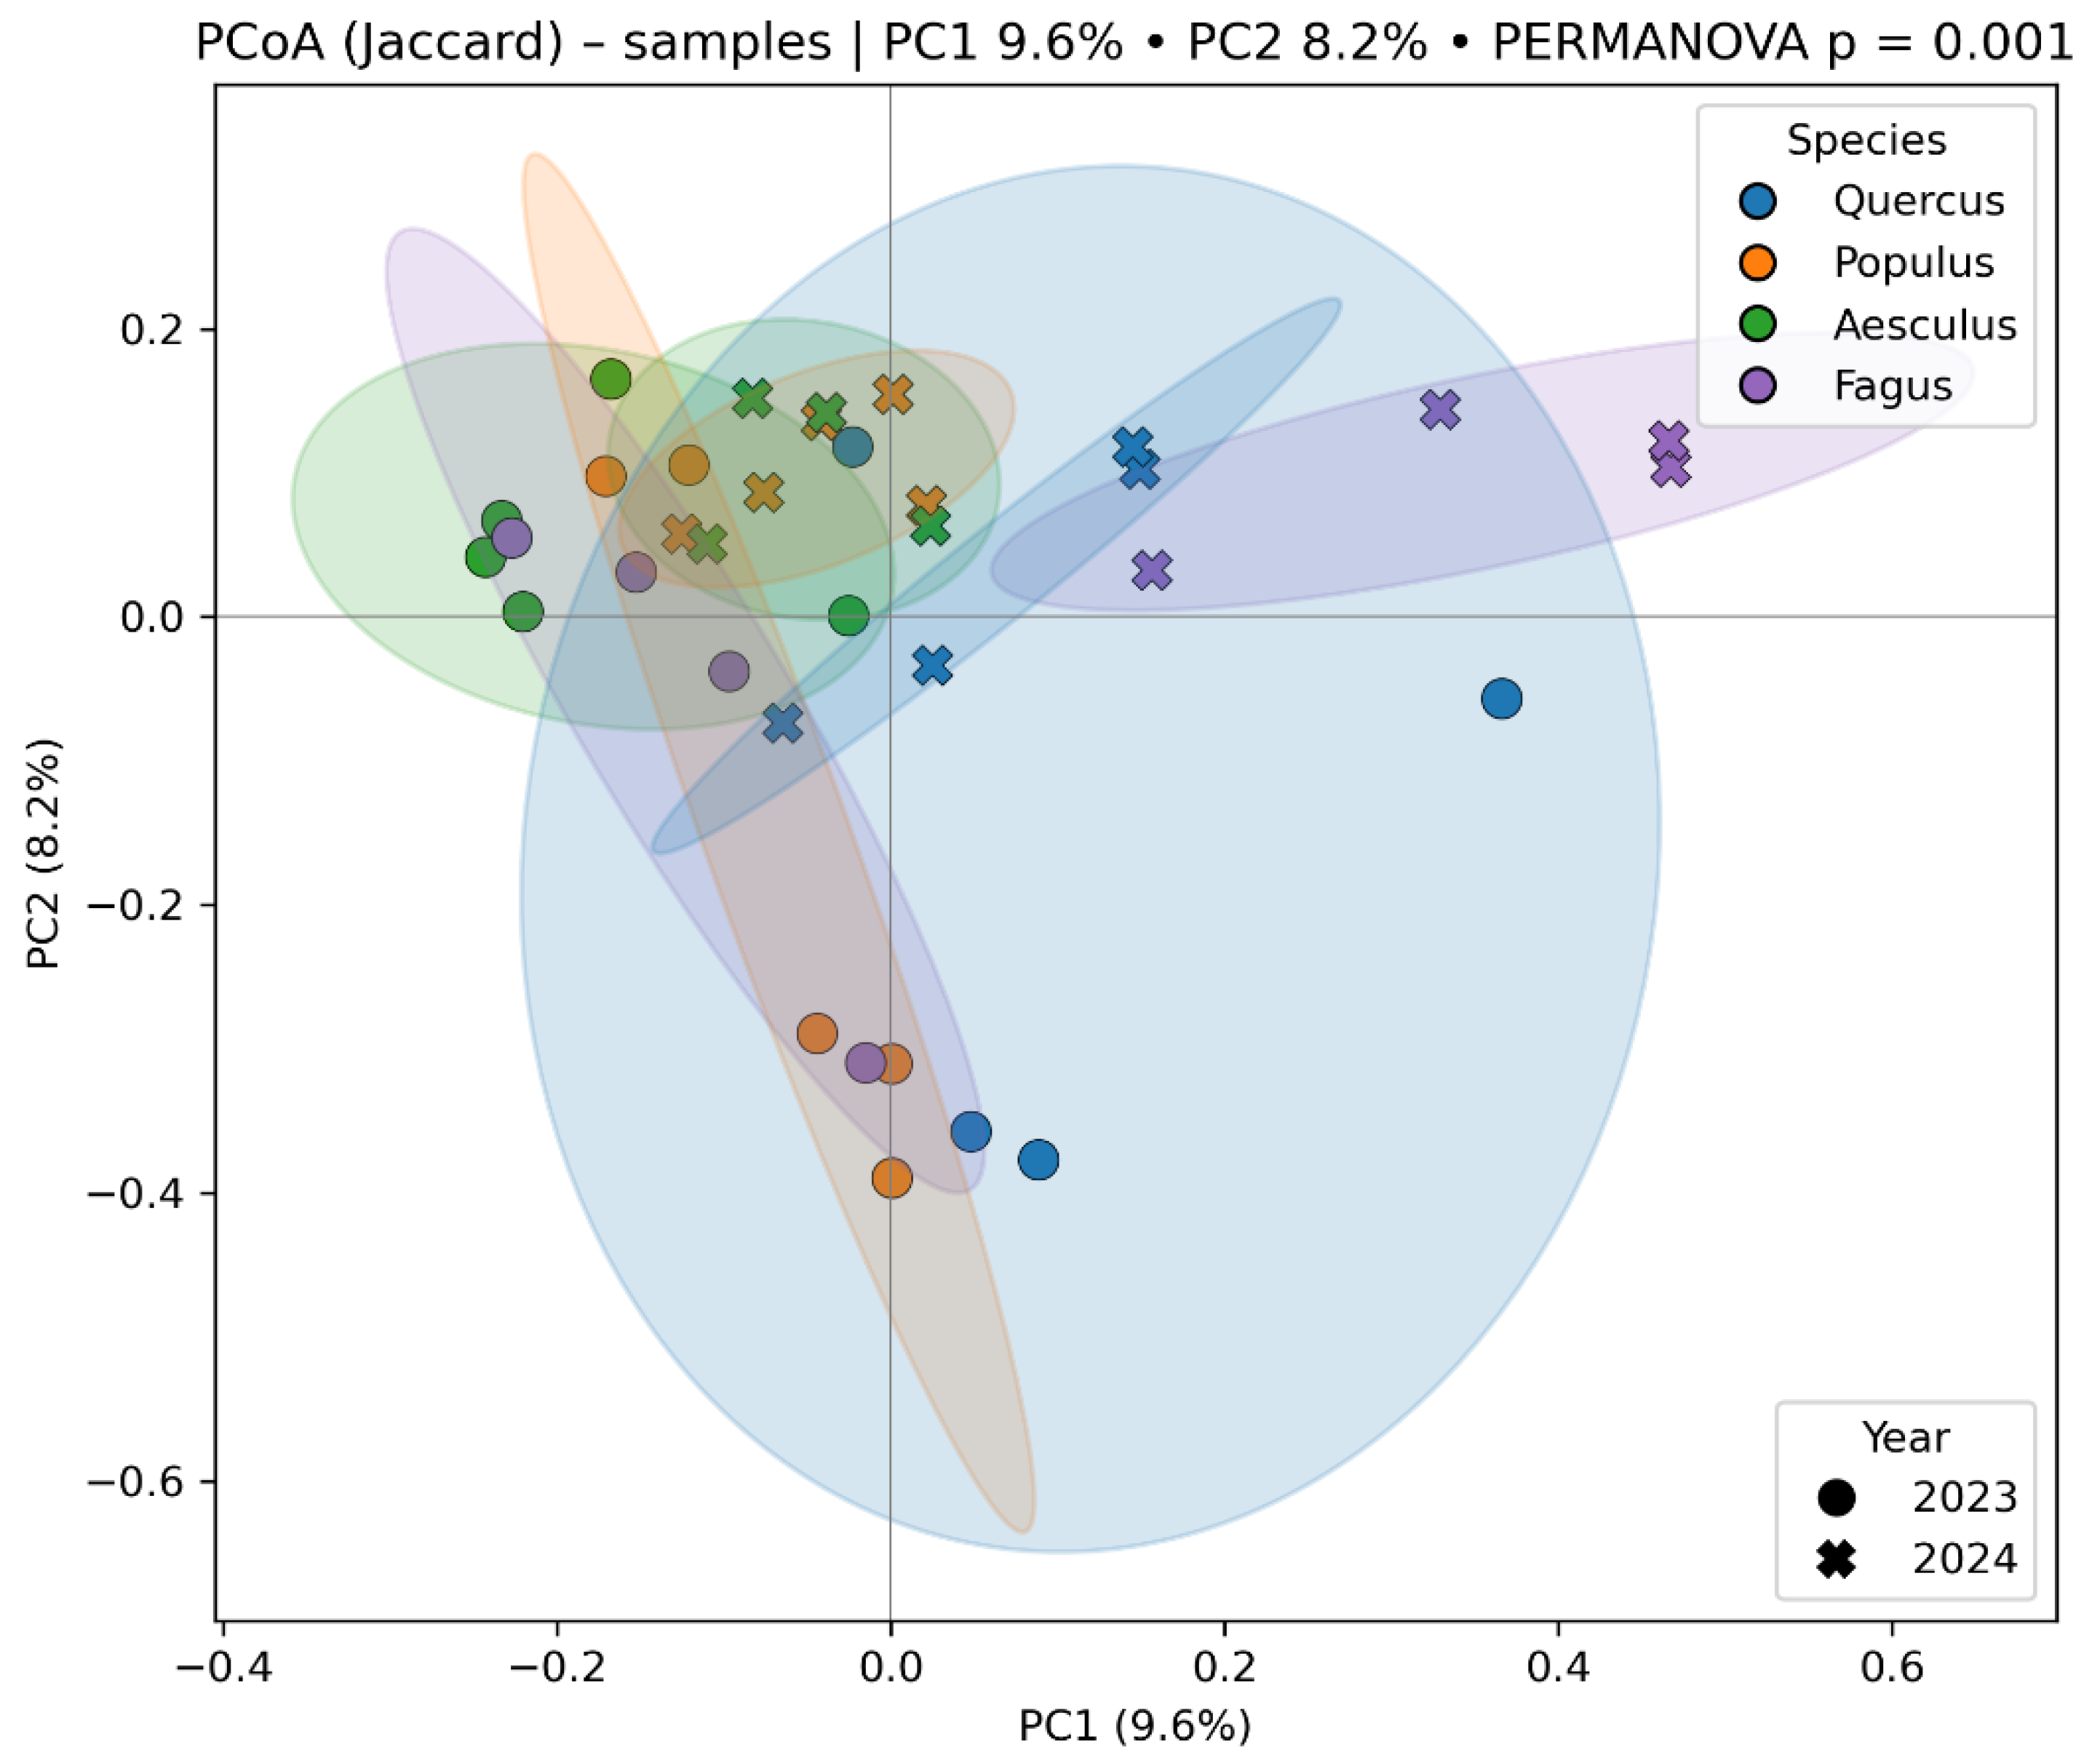
Figure 8.
Relative abundance of trophic modes in four tree species (Quercus robur, Populus alba, Aesculus hippocastanum and Fagus sylvatica ʻAtropuniceaʼ) in 2023 (left bar) and 2024 (right bar). Colors indicate global percentage of each trophic mode. The plot highlights interannual shifts and host-specific fungal composition.
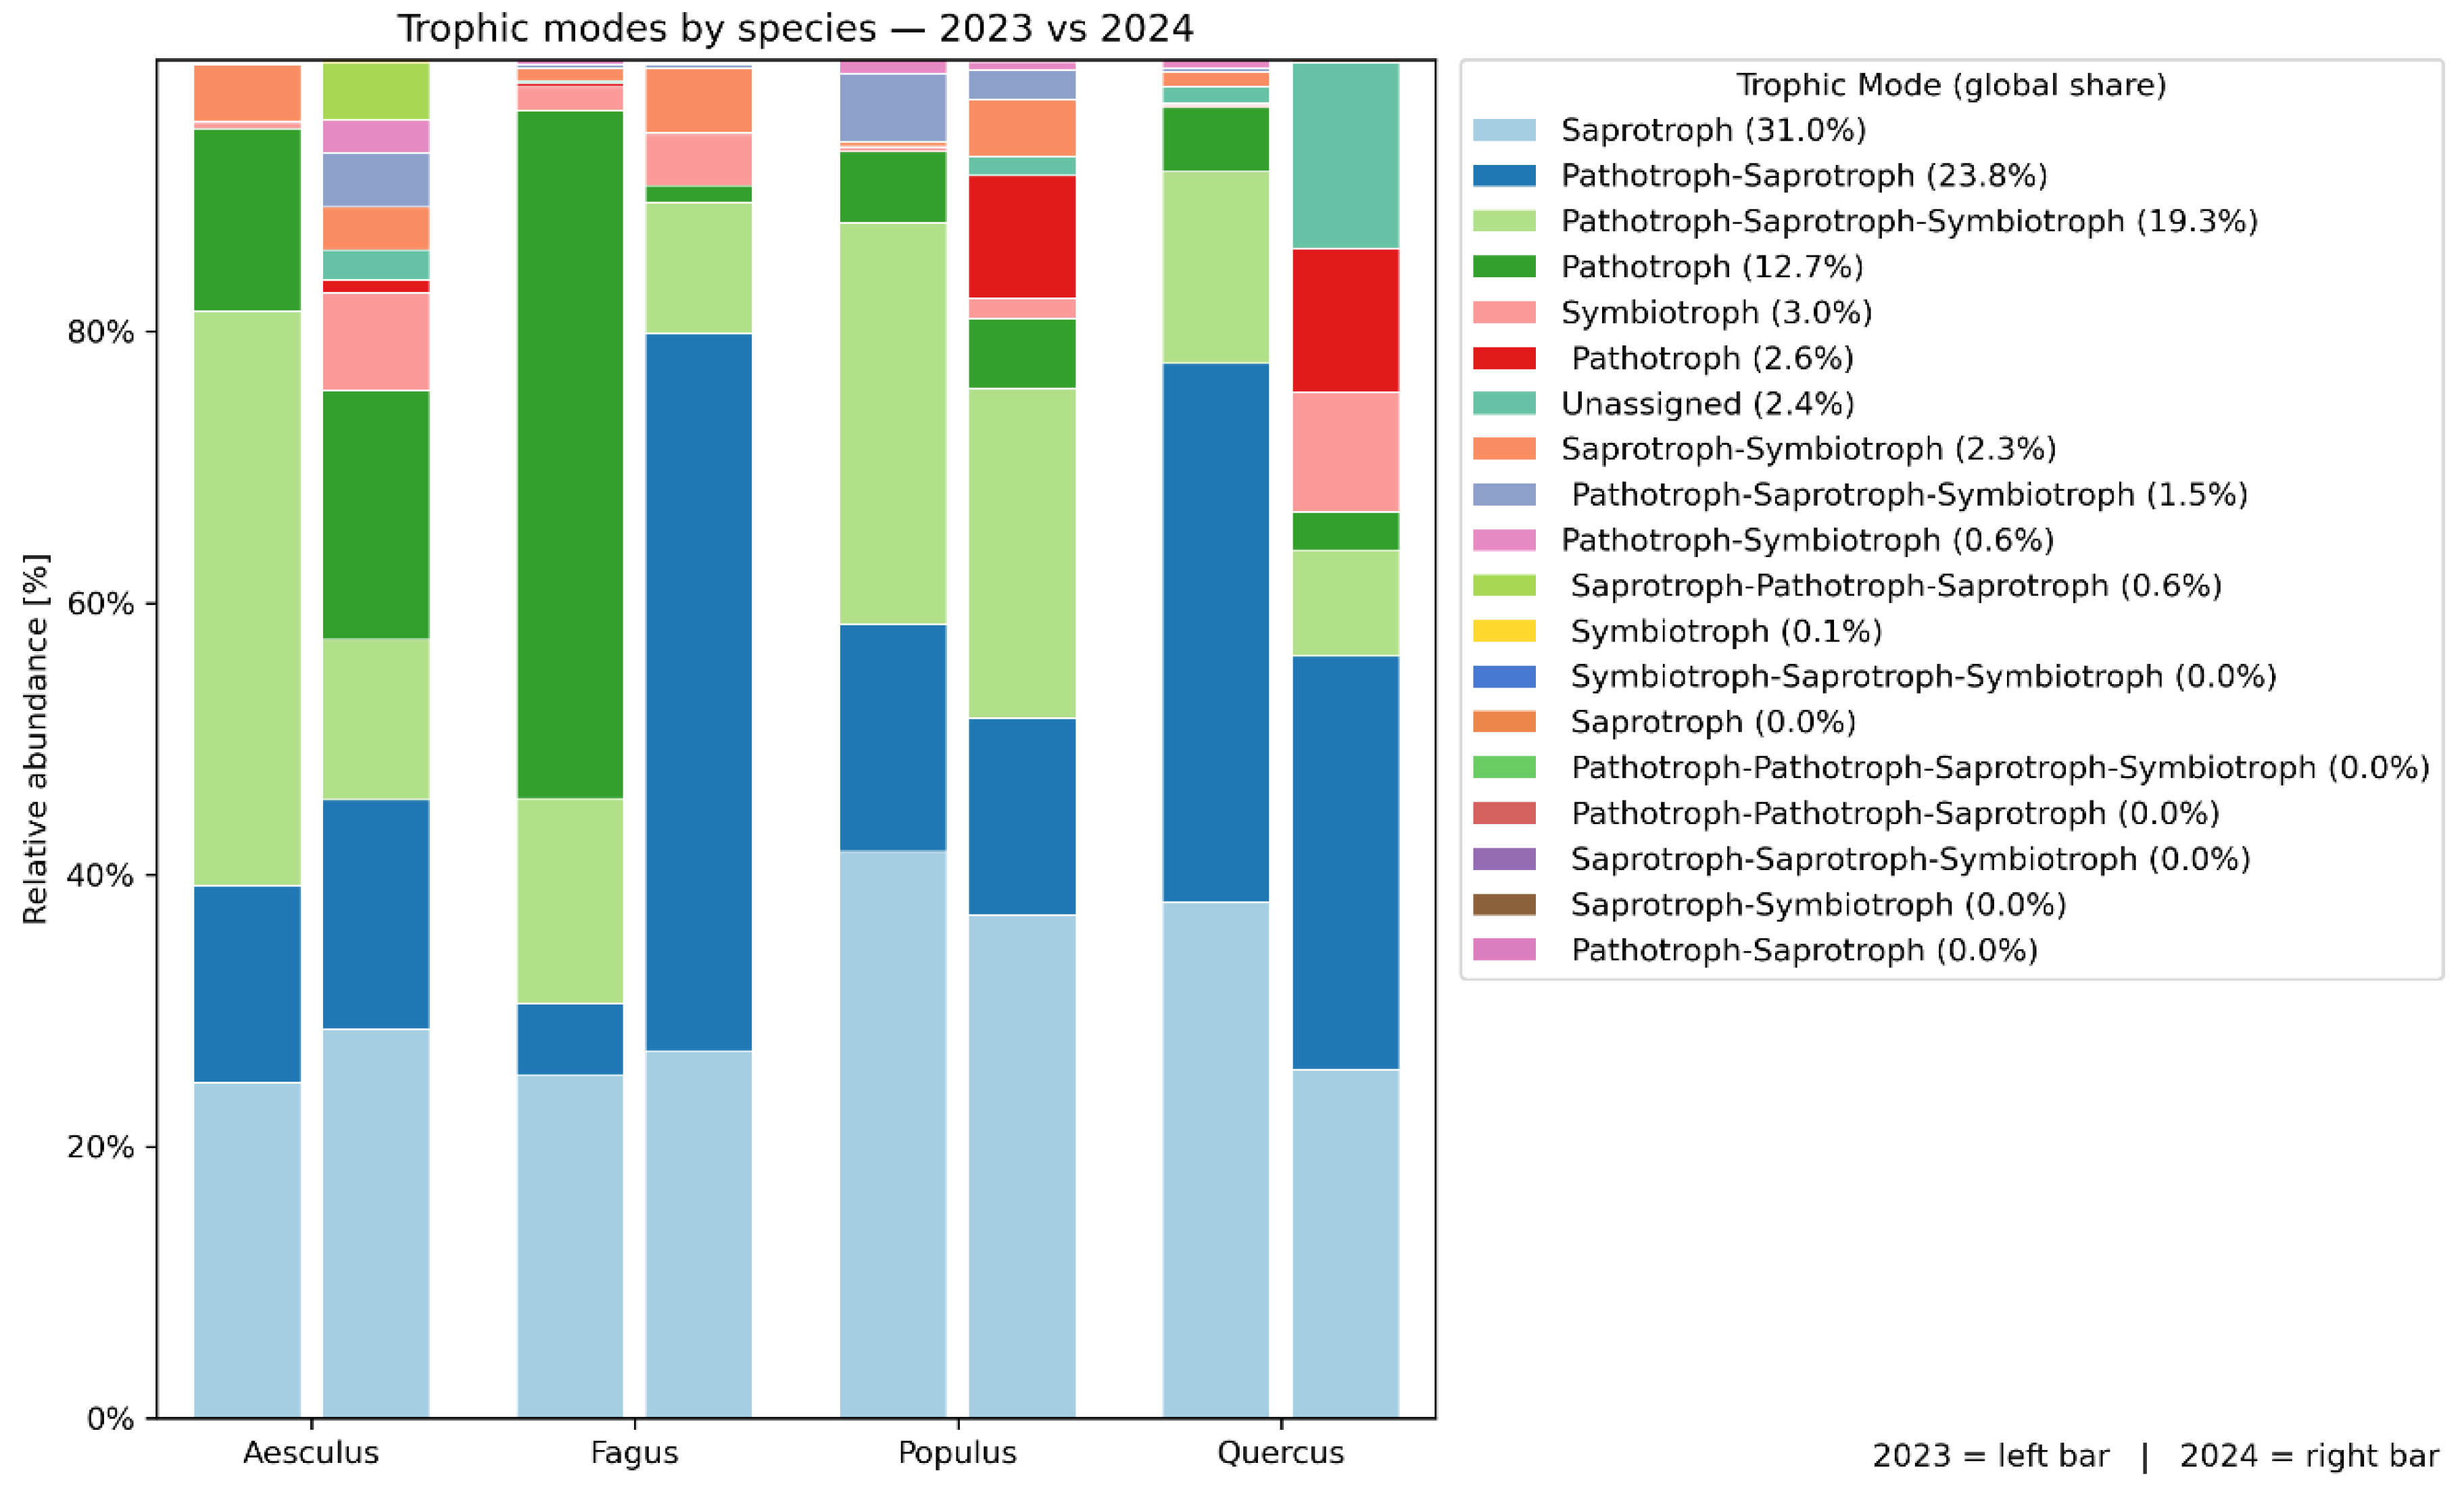
Figure 9.
Co-occurrence networks showing associations among fungal classes detected in wood across host tree species. (A) Global network including all samples from all hosts. (B–E) Host-specific subnetworks constructed separately for (B) Aesculus hippocastanum, (C) Fagus sylvatica ʻAtropuniceaʼ, (D) Populus alba and (E) Quercus robur.
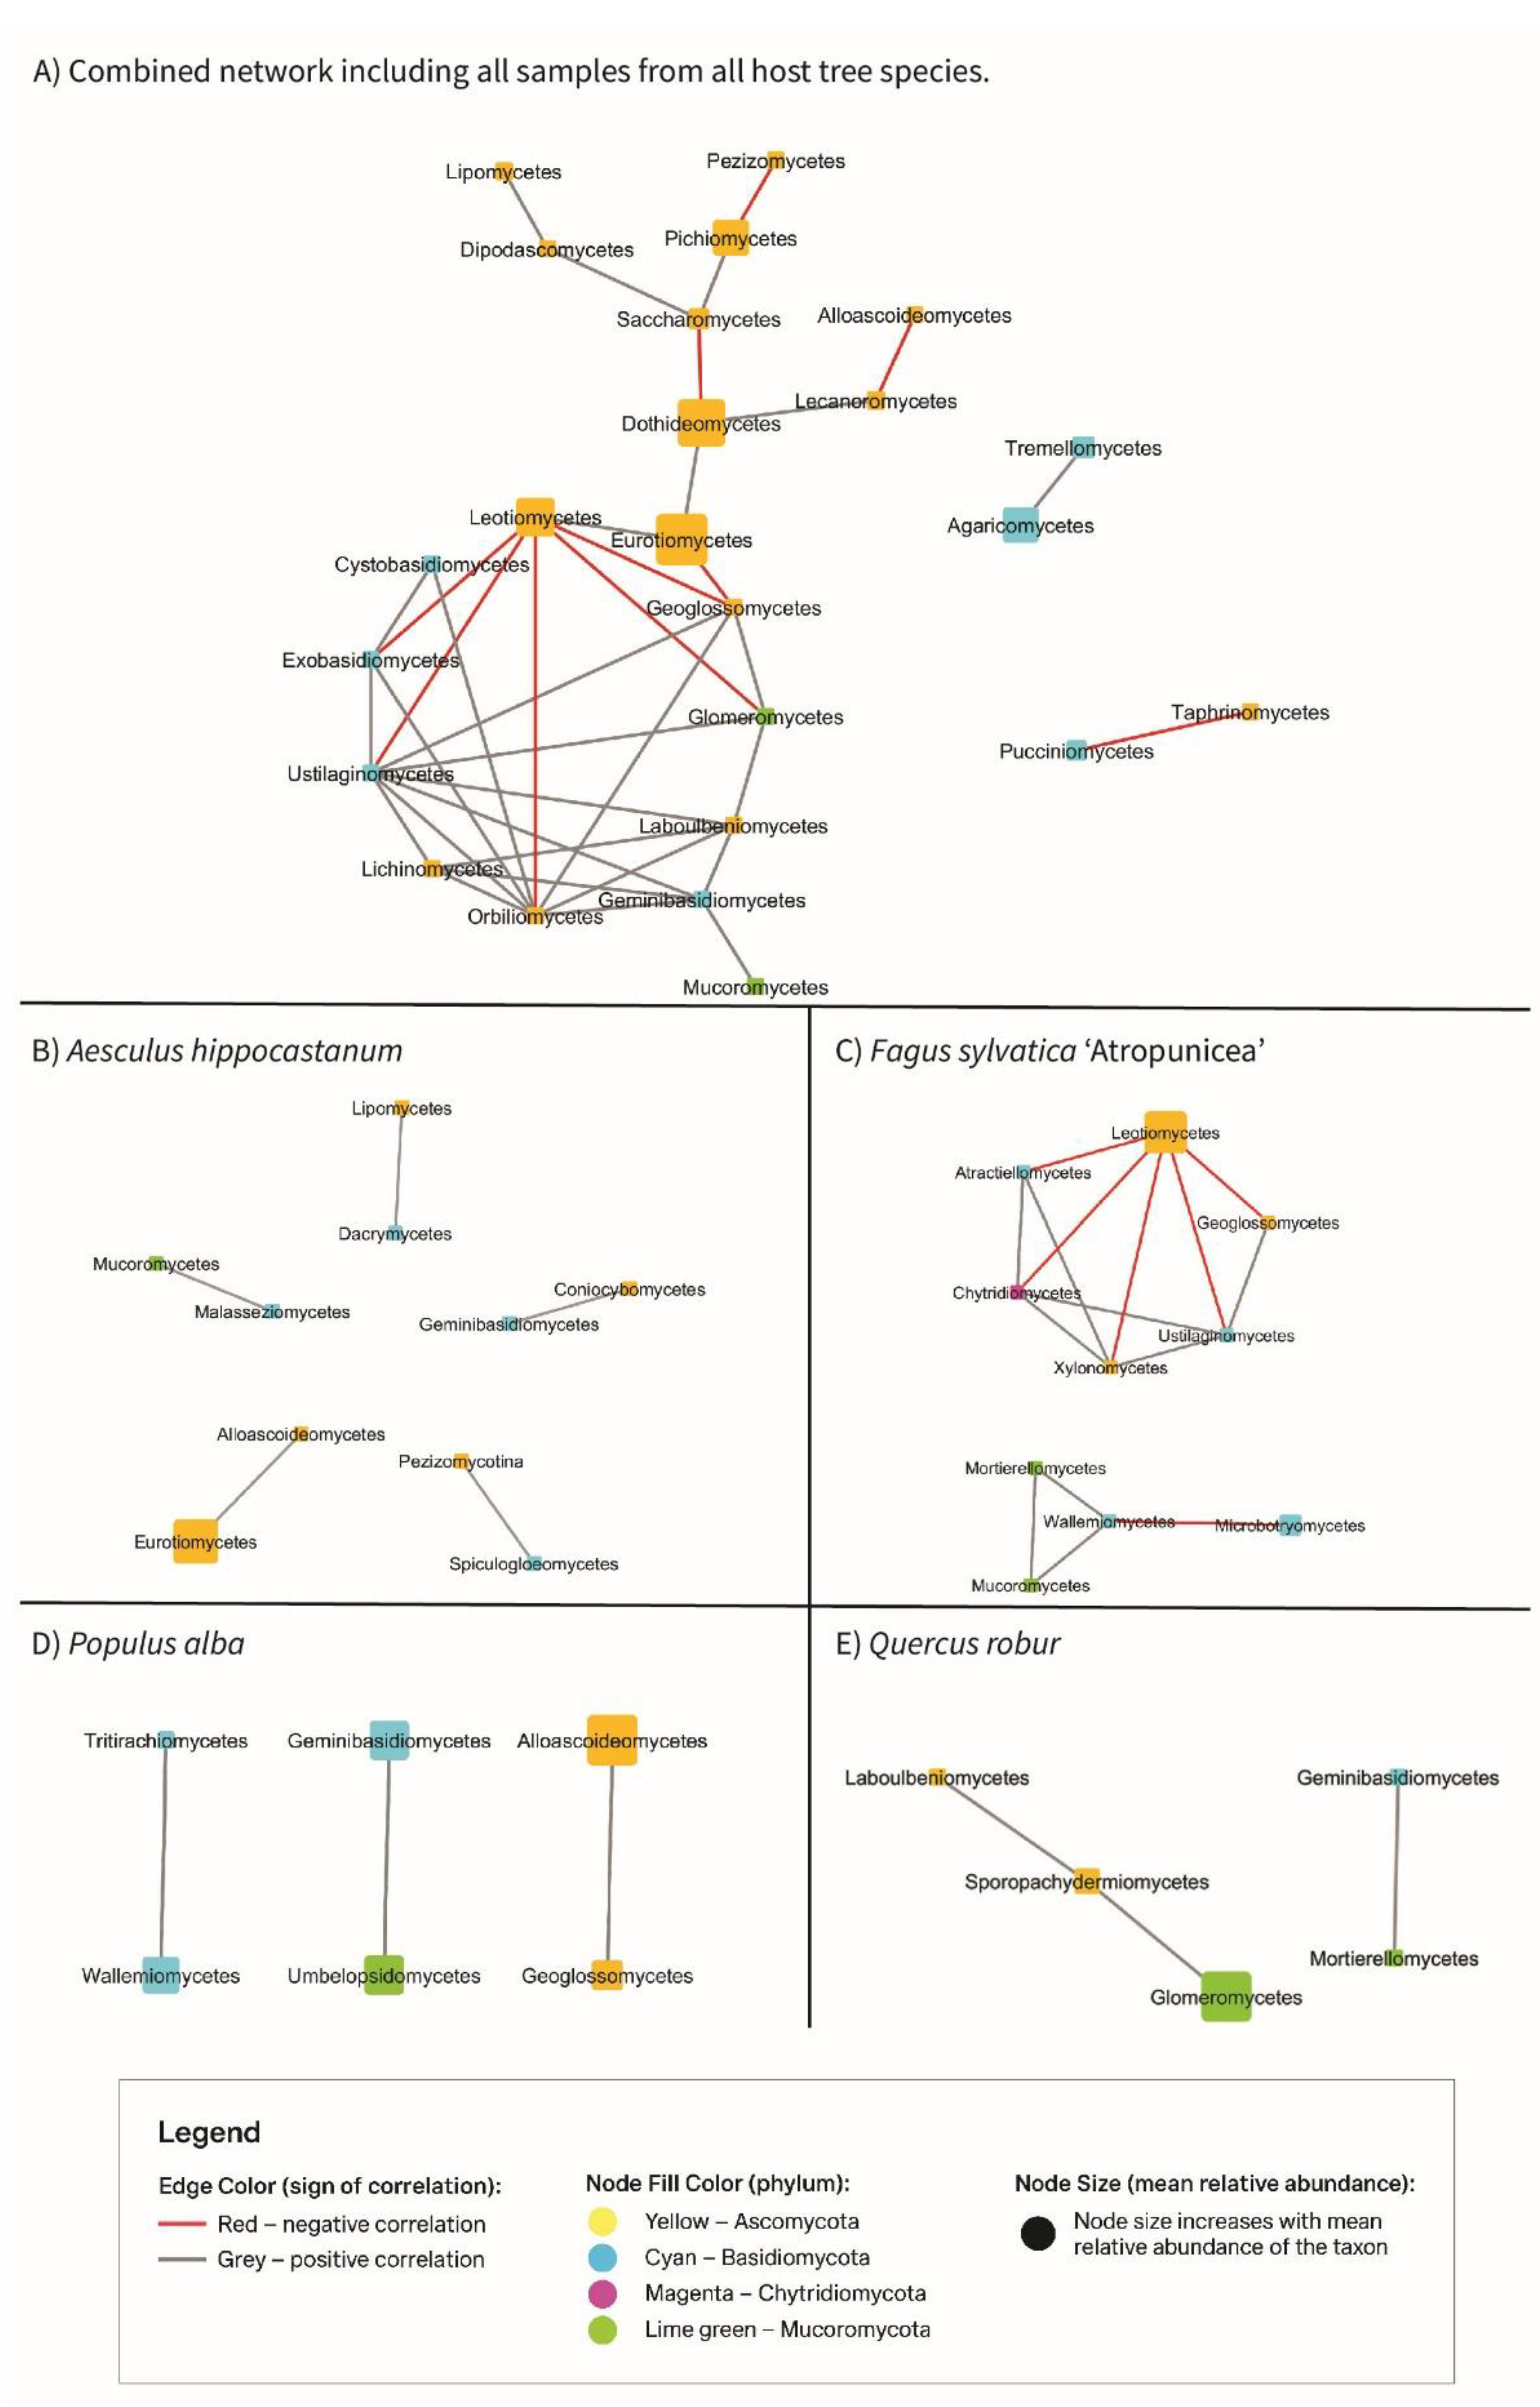

Table 1.
Overview of sampled trees in the Lednice Castle Park. The table includes tree ID, species, GPS coordinates, estimated age, stem diameter, and stem circumference of each individual.
Table 1.
Overview of sampled trees in the Lednice Castle Park. The table includes tree ID, species, GPS coordinates, estimated age, stem diameter, and stem circumference of each individual.
| No. | Species | GPS coordinates | Tree age estimate* [years] | Stem diam.** [cm] | Stem circumference** [cm] |
| 1 | Aesculus hippocastanum | 48°47'58.1"N 16°48'35.6"E | 80 - 100 | 79 | 248 |
| 2 | Aesculus hippocastanum | 48°48'49.7"N 16°48'38.0"E | 80 - 100 | 75 | 236 |
| 3 | Aesculus hippocastanum | 48°48′19.1″N 16°48′32.1″E | 60 - 80 | 78 | 245 |
| 4 | Aesculus hippocastanum | 48°48'04.7"N 16°48'42.3"E | 100 - 120 | 111 | 349 |
| 5 | Aesculus hippocastanum | 48°48'12.9"N 16°48'38.8"E | 100 - 120 | 89 | 280 |
| 6 | Fagus sylvatica ʻAtropuniceaʼ | 48°47'56.4"N 16°48'35.5"E | ≈ 150 | 114 | 358 |
| 7 | Fagus sylvatica ʻAtropuniceaʼ | 48°48'00.5"N 16°48'32.4"E | 150 - 200 | 136 | 426 |
| 8 | Fagus sylvatica ʻAtropuniceaʼ | 48°48'03.6"N 16°48'16.4"E | ≈ 150 | 125 | 393 |
| 9 | Fagus sylvatica ʻAtropuniceaʼ | 48°48'10.7"N 16°48'25.9"E | ≈ 150 | 109 | 343 |
| 10 | Fagus sylvatica ʻAtropuniceaʼ | 48°48'47.9"N 16°48'22.6"E | 150 - 200 | 121 | 381 |
| 11 | Populus alba | 48°48'03.4"N 16°48'48.8"E | 80 - 100 | 117 | 367 |
| 12 | Populus alba | 48°48'15.9"N 16°48'49.2"E | 60 - 80 | 87 | 273 |
| 13 | Populus alba | 48°48'19.3"N 16°49'04.6"E | 60 - 80 | 80 | 251 |
| 14 | Populus alba | 48°48'29.9"N 16°48'47.4"E | ≈ 100 | 120 | 377 |
| 15 | Populus alba | 48°48'25.4"N 16°48'42.0"E | 100 - 120 | 133 | 418 |
| 16 | Quercus robur | 48°48'00.7"N 16°48'50.2"E | 150 - 200 | 157 | 493 |
| 17 | Quercus robur | 48°48'40.3"N 16°48'28.4"E | 150 - 200 | 129 | 405 |
| 18 | Quercus robur | 48°48'20.8"N 16°48'45.4"E | 150 - 200 | 153 | 480 |
| 19 | Quercus robur | 48°48'19.8"N 16°48'38.5"E | 150 - 200 | 163 | 512 |
| 20 | Quercus robur | 48°48'48.9"N 16°48'37.1"E | 150 - 200 | 148 | 465 |
Note: *Tree age was estimated using a combination of trunk diameter at breast height (DBH) measurements and increment coring. ** measured at DBH.
Disclaimer/Publisher’s Note: The statements, opinions and data contained in all publications are solely those of the individual author(s) and contributor(s) and not of MDPI and/or the editor(s). MDPI and/or the editor(s) disclaim responsibility for any injury to people or property resulting from any ideas, methods, instructions or products referred to in the content. |
© 2025 by the authors. Licensee MDPI, Basel, Switzerland. This article is an open access article distributed under the terms and conditions of the Creative Commons Attribution (CC BY) license (http://creativecommons.org/licenses/by/4.0/).
Copyright: This open access article is published under a Creative Commons CC BY 4.0 license, which permit the free download, distribution, and reuse, provided that the author and preprint are cited in any reuse.


