Submitted:
27 October 2025
Posted:
29 October 2025
You are already at the latest version
Abstract
The transition to electric aircraft for zero-emission transport requires integrating thermal management systems for high-performance batteries without incurring significant weight, balance, or aerodynamic penalties. This study focuses on the aerodynamic penalties associated with air-cooling systems that can compound the presently unavoidable reduction in endurance imposed by current battery energy density limitations. Building on previous research into battery installation layouts and internal cooling flows, this study is the first to investigate the lift-to-drag (L/D) optimisation for the multiple wing-mounted inlets and outlets necessary for air-cooling batteries in the wing of an electrified aircraft. Wing-leading-edge inlets and NACA (National Advisory Committee for Aeronautics) ducts were analysed by systematically varying their layout, number, and dimensions. The analysis evaluated their effects on the wing’s lift, drag, and moment to maximise the L/D. Multiple highly efficient experimental test designs were developed to screen for the main factors to identify the best inlet and outlet configuration, resulting in 66 different Computational Fluid Dynamics (CFD) simulations in ANSYS Fluent. Following this, three CFD verifications cases of the best configuration were conducted to verify the cooling effect by combining both internal and external flow simulations with heat generation. Compared to the baseline wing of the carbon combustion aircraft, the best configuration caused a 1.75% reduction in L/D, range, and endurance. While the aerodynamic penalty is now minimised, the internal battery pack layout requires further optimisation to re-establish uniform cooling across the battery pack. Designers may still be able to separate the CFD analysis of the internal and external flow regimes with idealised inlets and outlets; however, more whole-field CFD iterations are needed to guide such subdivision to a viable and safe design for wing-mounted batteries. Further, the margins are such that wing-mounted electrification warrants careful instrumented validation in an aircraft. These findings provide crucial design guidance for sustainable aviation, particularly to enable after-market electrification projects.
Keywords:
battery thermal management
; air cooling system
; electric aircraft
; computational fluid dynamics (CFD)
; after-market electrification
1. Introduction
The aviation industry is facing increasing pressure to reduce greenhouse gas emissions. It accounts for 2.5% of global greenhouse gas emissions annually [1], expected to increase by 11% by 2040 [2] due to a 5% annual growth rate of the industry [3]. The European Union Advisory Council for Aviation Research and Innovation [4] has established ambitious targets to address climate change. They are targeting reductions of 75% in CO2 emissions, 90% in NOx emissions, and 65% in noise emissions by 2050. Advancements in battery and electric motor technologies, combined with improvements in aerodynamic aircraft design and lightweight composite materials, have led to electric aircraft that are environmentally friendly and capable of longer endurance, enabling a sustainable aviation solution for flight training and urban air mobility.
In 2022, over 100 electric aircraft were in development [5] globally. The Pipistrel Velis Electro was the first all-electric aircraft to receive a type rating certification from the European Union Aviation Agency [6,7]. However, multiple limitations exist when considering aircraft electrification. First, current technological limits in battery capacity restrict most electric aircraft to sustain only 60 minutes of flight, rendering them potentially suitable for flight training schools [6] rather than short-haul commercial flights. Second, designing new electric aircraft entails significant costs and limits many start-ups from joining the industry.
Infinitus Aero, an Australian company, is developing the E22 Spark, an after-market electric aircraft based on the AeroJones CTLS Light Sport Aircraft, primarily to be used as a short-range training aircraft. The initial design sought to replace the conventional fuel cells in the wing with high-performance lithium-ion batteries to produce a sustainable and cost-effective aftermarket electrified aircraft. In particular, replacing fuel weight with battery weight, similarly distributed as much as possible, is intended to maintain the extant overall structural design, including wing-bending relief, but the approach also introduces obvious challenges, not only in cooling, but in maintenance and recharging access.
Lithium-ion batteries are the preferred energy storage for electric vehicles [8] due to their high energy density and efficiency. However, lithium-ion batteries generate heat during discharge and require a thermal management system for safe and optimal operation. The thermal management system needs to reduce the maximum battery temperature [9] and minimise temperature variation across the battery pack [10]. Consequently, all multi-cell battery packs require a Thermal Management System [11] to regulate the heat distribution.
Thermal management systems can utilise methods such as forced air cooling, phase-changing materials, or liquid cooling to dissipate heat [12] from high-temperature components. Forced air cooling is advantageous in the aviation sector due to its simplicity and minimal weight penalty compared to other cooling methods. It aims to regulate battery temperatures below the thermal runaway temperature of lithium-ion batteries, utilising the high speed and cool freestream air during flight. Koumakis et al. (2024) [12] conducted a Computational Fluid Dynamics (CFD) analysis of a forced air cooling system based on the E22 Spark’s likely battery pack. His analysis of the internal wing flow across battery packs used idealised wing inlets and outlets, confirming that the battery pack could likely be cooled effectively using four inlets and five outlets evenly distributed along each wing. Koumakis necessarily neglected the aerodynamic effect of extracting, heating, and reintroducing air into the wing’s boundary layer. Furthermore, he assumed there are no inlet losses and an optimal chordwise placement of the inlets and outlets.
This follow-on research assesses the aerodynamic impact of the forced air cooling systems by examining the lift-to-drag ratio (L/D) of the electrified aircraft’s wing across a range of angles of attack, speeds, and combinations of inlet and outlet configurations. The research uses a series of screening test designs to determine an optimum arrangement of inlets and outlets for the aircraft aerodynamics. The optimal design identified is further analysed in a verification CFD simulation to again model battery heat generation, coupled with both internal and external airflows combined.
2. Literature Review
The problem associated with cooling aircraft components has been a concern since the early years of flight. Early studies found that internally mounted radiators could sufficiently cool the engine with only a 1.5% loss of engine power compared to externally mounted radiators that produce losses of between 14% and 20% at high speeds [13]. Biermann & McLellan (1940) identified that the inlets, outlets, and ducting need the following properties [14]: (1) low external drag, (2) adverse effect on the stall characteristics of the wing, (3) maximum pressure available throughout the take-off, climb, and high-speed flight, and (4) critical Mach number. The stall characteristics of the wing are outside of the scope of this research; however, the aerodynamic moments on the wing will be investigated to ensure there is minimal likely impact on the longitudinal stability of the aircraft. The pressure loss of ducts is well represented in the literature and is therefore not analysed directly. However, a high pressure loss will be identified through a decrease in L/D. Point four is not required for the E22 Spark, as it operates well below the speed at which compressibility effects become apparent.
Aerodynamic drag is the largest source of energy loss in a ducted radiator system [13]. This aerodynamic drag can be split into two components- internal and external. Internal losses are due to duct expansion, obstructions, friction along the wall, and losses through the radiator [13]. The external losses result from disturbances caused by the inlets and outlets along the wing. Furthermore, the additional weight of the radiator system, internal ducting, and further structural support in the wing increase the system’s energy loss. Losses resulting from the extra weight are considered negligible in this study, as the E22 Spark aims to avoid a radiator system and, from the earlier research, hopes not to require a duct network to move the flow through the wing.
2.1. Wing Leading Edge Inlets
The National Advisory Committee for Aeronautics (NACA), now known as the National Aeronautics and Space Administration (NASA), conducted multiple studies between 1938 and 1946 investigating the feasibility of cooling radial engines with an internal radiator [13,14,15,16]. The NACA wind tunnels were used to experimentally investigate the aerodynamic impact of channelling air through the wing leading edge inlet to the radiators inside the wing. These experiments proved successful and were implemented on both military and civilian aircraft, such as the Avro Vulcan (Figure 1) and de Havilland Comet.
Wing-leading edge inlets are effective for an angle of attack (AoA) between -4° and 11° in a wind tunnel [14]. In most cases, it was found that they disrupt the laminar airflow and reduce the circulation around the wing, resulting in a reduction in L/D [13]. All four papers [13,14,15,16] are based on the two-dimensional effects of the ducts. No heat was added to the exhaust flow, and inlets and outlets were aligned chordwise, while only Harris and Recant (1938) [13] allowed flow to pass through the wing. This research needs to be extended to a three-dimensional wing to accurately account for the impact caused by the ducts on the spanwise flow and wing tip vortices.
Placing the wing leading edge inlets near the wing root has been shown to improve the stall characteristics of the wing. It ensures that the region of the wing downstream of the inlet stalls before the outer part of the wing, maintaining roll authority during stall [18] . It also leverages the high-speed propeller wash from a nose-mounted propeller to enhance cooling effectiveness [14]. Like all inlets, wing leading-edge inlets slow the flow in their local region, creating a region of higher pressure drag. This loss can be minimised by placing the inlet at the wing’s stagnation point, the leading edge [13,16]. However, the stagnation point varies with the angle of attack. Therefore, the placement, shape, and size of the inlets need to be aerodynamically optimised for cruise [16], without a significant compromise in cooling effectiveness and aerodynamics across all stages of flight. The placement of the duct on the leading edge removes almost all boundary layer ingestion - improving the duct’s efficiency [18].
Another key design consideration is the design of the entrance lips [13,14,15,16]. The coefficient of lift (CL) can be improved by rounding the upper lip to have a radius of 0.5% of the chord length. This rounding increases the curvature of the wing and also allows more air to be ingested at a higher angle of attack [13]. Further, it was concluded that projecting the lips forward of the wing’s leading edge reduces drag, while keeping the lips equidistant from the camber line resulted in a minimal impact on the lift [14].
There is no agreement across the literature for the optimal spanwise opening size of the inlets. The transition between the inlet and wing leading edge in Biermann and McLellan’s (1940) [14] research produced a significant amount of drag. They concluded that wider entrances are better as they reduce the drag effective area. However, this can be overcome through a better transition between the sides of the inlet and the leading edge of the wing. On the other hand, both [13,16] concluded that the spanwise opening should be as small as possible to reduce the amount of wing affected by the ducts. However, to achieve a sufficient intake area, the inlet height needs to be increased, which is limited by the upper and lower surfaces. A taller duct results in increased local drag and a decrease in lift due to early separation [14].
Only Harris and Recant (1938) allowed air to pass through the inlet and exit the outlet, with the outlet position ranging from 25% to 70% of the chord from the leading edge [13]. The radiator was replicated by a screen which caused the same pressure drop as a radiator. They found that the flow could be throttled by varying the inlet and outlet area ratio [13], and it was most effective to vary the width of inlets and outlets rather than the height. The CLmax could be increased by controlling the boundary layer, through having a larger inlet area compared to the outlet area [13].
2.2. NACA Ducts
NACA ducts are also known as submerged inlets, as they are designed to ingest or exhaust the air near the surface whilst minimising the aerodynamic impact. They are used across a wide range of industries, from racing cars to aviation, primarily to cool internal systems. Their aerodynamic effect on a flat plate is well documented in the literature. Multiple journals have concluded that the optimum ramp angle is between 5° and 7°, and the optimum width-to-depth ratio is between 3 and 5 with diverging sidewalls [19]. The diverging side walls help create counter-rotating vortices, which draw in faster-moving air from the free stream and re-energise the boundary layer [20]. This increases the pressure recovery, making the inlet more efficient.
There is currently no published data on the aerodynamic impact of multiple NACA ducts on an aircraft wing or their effectiveness in arrangements. However, aircraft such as the Diamond DA40NG (Figure 2) utilise these inlets on the bottom surface of the wing, and the Airbus A380 uses them on the wing root, suggesting that they have minimal relative effect on the aircraft’s aerodynamics. It is believed that NACA ducts are better than wing leading edge inlets as they require minimal internal ducting, produce less external drag, and have satisfactory total pressure recovery when positioned in areas with a thin boundary layer [21]; that is, near the wing leading edge.
2.3. Wing Outlets
There is a vast amount of literature that investigates wing tip and spanwise blowing to manipulate the wing tip vortex and spanwise flow, respectively. However, there is currently minimal variation in outlet shape or size, with most researchers adopting long, thin rectangular slots that are placed near the wingtip or that stretch across the majority of the wingspan. Wing tip blowing has been shown to increase L/D by 0.45% [23], as it moves the wing-tip vortex upwards and outboard, whilst decreasing its vorticity magnitude by 25%. The air jet, however, does diminish the effect of the blowing as it creates more drag than the baseline [23]. Steady spanwise blowing can improve the lift of a wing when the air jet is sufficiently large [24]. Wong and Kontis (2006) [24] identified that the optimal exhaust position is at 0.25c, which corresponds to the wing outlets used by Koumakis et al. (2024) [12]. There is currently no research that investigates distributed blowing using air from an internal battery; instead, all the research relies on compressed air to create the blowing, something that is not possible with after-market electrification.
2.4. Newman, Tiedmann, Gu and Kim Battery Model
The Newman, Tiedemann, Gu, and Kim (NTGK) battery model is a standard method for modelling heat generation within battery cells, utilising the multi-scale, multi-domain battery model in Ansys Fluent. The NTGK model, proposed by Kwon et al. (2006) [25] and Kim et al. (2008, 2011) [26,27], is an empirical-based model in which heat generation is dependent on the current potential [12]. The model calculates the battery heat generation rate () by Equation 1. The U and Y functions, Equations 2 and 3, are fifth-order polynomial functions that are influenced by depth of discharge (DoD) and temperature. The constants , are constants based on the experimental and simulation temperatures. and are polynomial coefficients derived by Ansys Fluent through curve fitting the experimental data. The U function is the intercept of the tangent line on the polarisation curve related to cell voltage. At the same time, the Y function is the reciprocal of the slope of the current potential polarisation curve [28]. is the electrochemical parameter that corrects the experimental battery cell size to the simulation cell size and is dependent on both U and Y functions.
Multiple studies [29,30,31] have been conducted to compare the NTGK battery model to experimental data. In all studies, the experimental battery temperature was slightly less than the NTGK battery model. This means that the NTGK model is conservative, and any thermal management system capable of cooling an NTGK battery inherently incorporates a safety factor.
2.5. Novelty and Importance
The research focused on minimising the external drag and reducing local adverse aerodynamic effects of the inlets and outlets on the wing [14]. The L/D will serve as the primary metric to evaluate whether the specifications of the inlets and outlets are optimal in terms of external drag and their impact on lift. The CM will help to determine whether the inlets and outlets are causing a negative stall or handling characteristics. It will also ensure that the inlets and outlets do not create a significant adverse pitching moment. If the change in CM is significant, modifications to the horizontal stabiliser and wing structure may be necessary to maintain stability and also to strengthen the wings.
L/D is a critical aspect of an aircraft’s design, influencing both efficiency and safety. It is vital for training aircraft, as a higher L/D increases the usable training time and enables the aircraft to operate from more challenging airstrips. Training aircraft conduct multiple flights daily, requiring transit between the airport and the training area. Electric aircraft will utilise a higher percentage of their available energy for these transits compared to petrol-powered aircraft. This lower efficiency reduces the amount of available training time per flight, which can be mitigated by achieving a high L/D, as indicated by Equation 6, from Gudmundsson (2022) [32]. A 10% increase in L/D can lead to a 10% increase in endurance and range (Equation 6), allowing for more time spent in the training area. For example, the E22 Spark has an estimated flight time of 96 minutes, meaning a 10% increase in the L/D could result in one more circuit per training flight, based on a six-minute circuit.
3. Methodology
3.1. Design of Experiment
Multiple highly efficient experimental designs were conducted to screen for the most experimentally significant factors. The software package QuantumXL® [33] was utilised to create the test plans. QuantumXL® utilises combinatorial approaches to identify an optimal test plan that maximises factor orthogonality by minimising the Variable Inflation Factor (VIF) of a multi-factor regression. The VIF is a measure of near-orthogonality, where 1 is a perfect orthogonal test plan. Industry standards accept a test plan with a VIF of less than 1.4 to be statistically robust enough to be utilised. A mixed-level full factorial was initially created for each test case. After which, the D-Optimal test design feature of QuantumXL® was utilised to develop a sparse but sufficient test case, with a maximum VIF of less than 1.4 for the desired main factors, quadratics of main factors, and the two-way interactions.
A D-Optimal design case identifies by row replacements in the logistics regression solution matrix a subset of experimental combinations that maximise the determinant of the data matrix to reduce the generalised variance of the estimated regression [34]. Although less comprehensive than a full factorial design, the D-optimal approach provides a sufficiently accurate design case in which the most significant factors can be identified and quantified [35]. It is assumed that the factors are independent, meaning that the result of one factor does not impact the other factors, and they are identically distributed; the probability of one level occurring is the same as the likelihood of another level occurring.
Two highly efficient screening tests were conducted to identify the most significant factors contributing to the L/D ratio, including the multiple inlet and outlet configurations. QuantumXL® [33] was used to generate a D-Optimal test plan, reducing the number of test cases from 6,669 (required for three-level full-factorial test plans) to a sparse 66 test cases when aggregated across the screening and modelling. All multi-factor test designs, namely screening, sparse modelling and focused modelling, exhibited a VIF of less than 1.4. The low VIF in all three test cases underscores the reliability of the results.
3.2. Computational Fluid Dynamics Simulation Parameters
ANSYS Fluent is a commercial CFD software package that was used for all simulations within this paper. These simulations were conducted on the University of New South Wales `Katana’ High Performance Cluster (HPC) [36]. For the CFD, a steady-state Reynolds-Averaged Navier-Stokes (RANS) solver was used. This simplification resulted in the flow field displaying the steady-state, perturbation-free flow quantities as seen in unsteady simulations. A consequence of this approach is that it prevents the proper formation of any wake trailing wake vortices. This will reduce the accuracy of the simulation. However, the flow field is still generally representative and appropriate enough to allow the significant factors to be screened and their impact identified.
More specifically, to the CFD, for the RANS turbulence closure, the K- SST turbulence model was selected for its ability to capture the fluid-structure interaction within the boundary layer [37], as well as its general utility in analysing wall-bound and free-shearing problems. This model combines both the K- and K- turbulent models. ANSYS Fluent utilises the K- model in the far-field region to reduce computational resources as the impact of turbulence is minimal, whilst the K- model is used in regions near surfaces [38].
The wing inlets and outlets were modelled as pressure outlets and velocity inlets, respectively, to simplify the CFD test cases to an external flow problem. Both the wing inlets and outlets were assigned a gauge pressure of 0 kPa. The velocity and temperature of the airflow exiting the wing outlets, representing the battery pack’s exhaust, were derived from the Koumakis et al. (2024) [12] research. The exhaust temperature was set at 311.1 5 K, and the free-stream temperature was set as 303.15 K, 16.8 K hotter than the ISA (International Standard Atmosphere) free-stream air temperature at 1000 ft altitude. This replicates the aircraft operating in high-ambient-temperature environments, such as tropical and warm climate regions. The exhaust velocity was oriented perpendicular to the chord line and ranged from s to as the free stream velocity increased.
3.2.1. Mesh Generation
The native mesher in ANSYS Fluent is relatively limited when used for complex meshes. This limitation makes it difficult and time-consuming to do traditional mesh independence studies to verify accuracy. Instead, three adaptive mesh refinements (AMR) were used for each simulation, rather than creating three different meshes in which the cell size is decreased by a factor of each time. An Aerodynamic Combined Hessian was used for each AMR [39]. This Hessian matrix approach adds more cells in regions with high flow gradients and reduces the number of cells in areas of low flow gradients [37]. The AMR results in a more accurate simulation without drastically increasing the number of cells compared to traditional mesh refinement [37]. To ensure accuracy, the flow was initially solved using first-order upwind schemes, followed by second-order upwind schemes. The AMR was conducted once the residuals converged below 0.001. The AMR resulted in less than one per cent change to L/D and tripled the number of cells (up to 15 million additional cells) compared to the baseline mesh. Most of the refinement primarily occurred on the wing inlets and outlets, trailing edge, wing-tip vortex, and wake regions, areas associated with complex flows.
The wing was simulated as a no-slip wall, with boundary layers generated around the wing’s surface designed to maintain a Y+ value below one, thereby solving the viscous sub-layer of the boundary layer [40]. This objective was achieved across the vast majority of the wing, with only the wing tip (1.5) and specific regions near the inlets and outlets being different. This approach was deemed sufficient, as only a small percentage of the entire wing exceeded a Y+ of one, attributed mainly to the difference in length scale and airspeed in these regions (i.e. different Reynolds numbers).
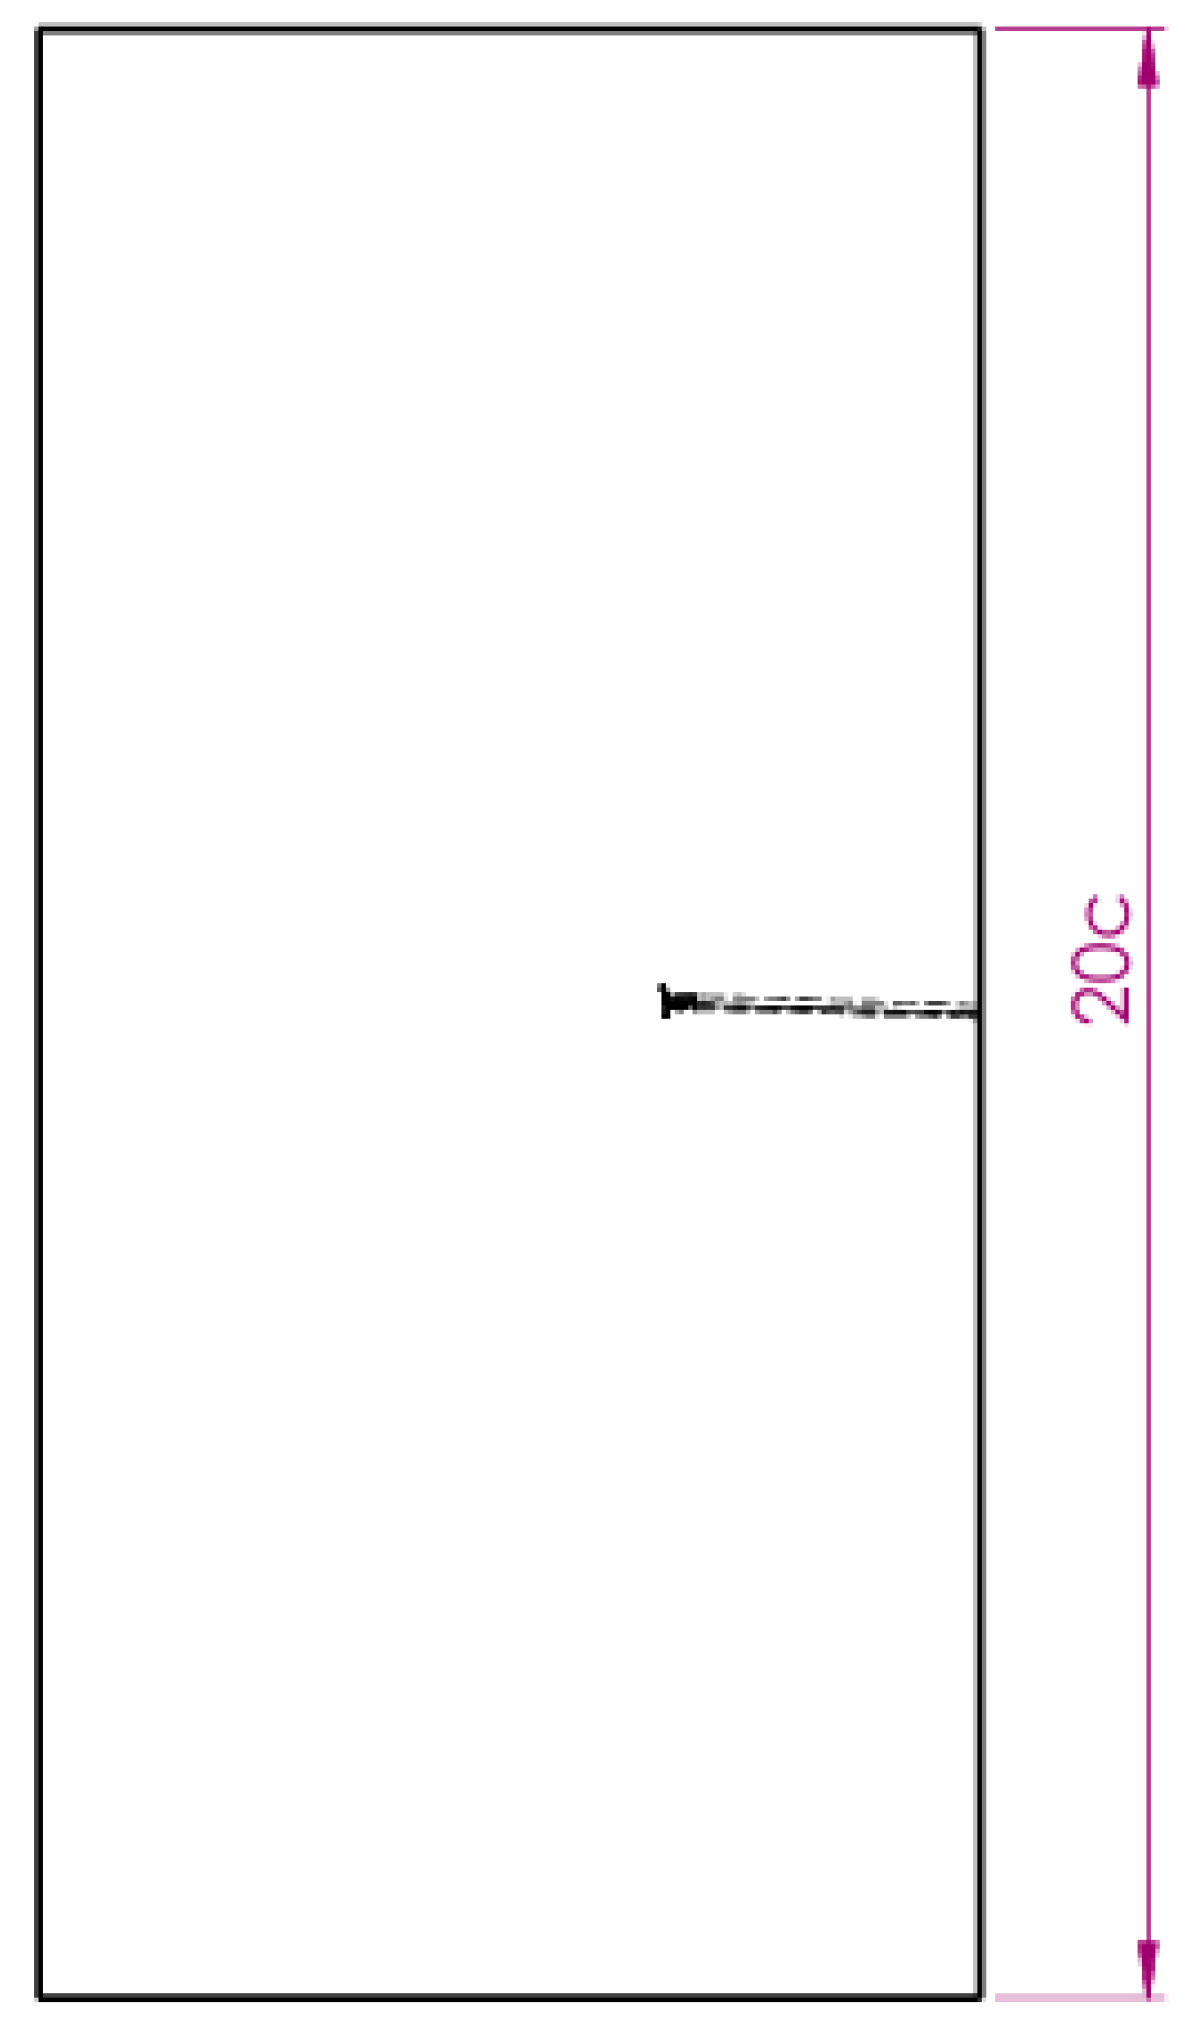
The domain was sized to be sufficiently large to avoid impacting the simulation results. The domain’s dimensions are per the schematics in Appendix A. A tetrahedral mesh was used for all cases except the validation case due to its ability to generate quickly and because it is less computationally demanding [41,42]. The validation case utilised a polyhedral mesh to enhance simulation accuracy and reduce the combined internal and external flow cell count. The extra memory requirement associated with a polyhedral mesh [41,42] was not a concern, as only three such validating simulations were conducted.
4. Results and Discussion
4.1. Model Validation
Intellectual property rights held by AeroJones protect the E22 Spark’s aerofoil design. However, the shape of the GA(W)-2 is very similar to that of the E22 Spark and was therefore used as the basis for the wing. A baseline ’petrol wing’ was designed with a GA(W)-2 aerofoil profile and the E22 Spark’s wing tip. This baseline serves to validate the model, establish baseline results, and provide the basis for the E22 Spark’s wing.
The baseline wing was tested at a free stream velocity of 28.25 m/s at an angle of attack of -2°, 4°, and 10° to identify the CL, CD, and CM. Curve fits were applied to the CFD results in MATLAB to produce Figure 3 and Figure 4. All the curve fits had an value equal to 1, indicating a perfect fit. The curve fit equations being: , and for the CFD simulation with a Reynolds number of . These curve fits were compared against experimental aerofoil data [43], as corrected to finite-wing performance using Equation 7 [32]. These calculations are based on assumptions of winglet effectiveness and the Oswald Efficiency Factor (0.828). The maximum difference in L/D within the tested angle of attack range occurred at -2° angle of attack, at which the CFD wing overestimates the L/D by . Between approximately -1° and 7° angle of attack, the CFD wing underestimates the L/D to a very minor extent. This error can be attributed to the assumptions made in simplifying the CFD simulation and to the assumptions made in the correction calculation previously mentioned.
4.2. Baseline Wing
The baseline `petrol wing’ was tested at the same three angles of attack as the validation case and at three different free stream velocities: 36, 44 and 48 m/s. These nine test cases encompass the standard operating flight envelope of the E22 Spark. Enabling a consistent evaluation of how the inlets and outlets will influence the L/D of the modified wings by comparing their performance to the baselines. As illustrated in Figure 5 and Figure 6 the aerodynamic properties of all baseline simulations were consistent and exhibited the expected trends. The three curve fits had an value equal to 1, which indicates a perfect fit. The curve fit equations are: , and for the CFD simulation with a Reynolds number of .
4.3. Screening
The first experimental test design screened eight potential factors for their effect on L/D. The inlet type was a nested factor, where the inlet type of NACA or leading edge had subordinate factors unique to each type. As such, the inlet factor combinations were coded with the design options, encompassing 11 levels, the most of any factor. A D-optimal test plan reduced the number of simulations from the full factorial 6,480 to 28, as detailed in Table 1. The number of inlets and outlets, along with the inlet width, were centred on the optimal values identified by Koumakis et al. (2024) [12] for cooling purposes. To minimise the experimental matrix, the size and shape of the wing outlets were kept constant, emphasising variation in inlet configurations. The inlet type was informed by the research previously discussed in the literature review. Specifically, NACA ducts were parameterised by their width-to-depth ratio, ramp angle, and chordwise placement as seen in Figure 7. Whereas, wing leading edge inlets were varied by their height expressed as a percentage of the wing’s chord as seen in Figure 8. The streamwise position of the ducts was constrained to the region forward of the main spar, owing to the emphasis on aftermarket integration of high-performance battery packs. Having the ducts aft of the main spar would compromise the structural integrity and necessitate additional apertures to route airflow from the battery pack to the outlets. The angle of attack and Reynolds number were selected to span the primary flight profile. To further reduce the number of test cases, only the main factors and two-way interactions between angle of attack and Reynolds number were selected. These two-way interactions were chosen because it was assumed that the angle of attack and Reynolds number factors would have the most significant impact on the L/D and thus warranted more precise modelling.
4.3.1. Screening Results
A multiple regression analysis was used to test whether the eight screening factors significantly predicted the wing’s L/D. The results of the regression indicated that the number of inlets (), inlet aerofoil surface (upper cf. lower, p = 0.086), the Reynolds number interaction with angle of attack () and the square of the angle of attack () were statistically significant or likely significant as applicable, explaining 54.16% of the variance (). Notwithstanding, the screening test indicated that the NACA inlets yield a superior L/D compared to wing-leading edge inlets, consistent with the literature [21]. Inlet width was found to have a minimal impact on the wing’s L/D ratio, with narrower inlets performing better. This effect is likely due to less of the wing being impacted by the adverse effects of the inlets. An increase in the inlet width of 10 cm reduced the L/D by . The aerodynamically optimal number of inlets and outlets serendipitously coincided with the cooling-optimised configuration reported by Koumakis et al. (2024) [12].
However, this identified aerodynamic optimum may not represent the global optimum, as the screening test did not evaluate the discrete impact of each inlet and outlet count within the tested range, as seen in Figure 9. Thus, potentially overlooking adjacent values. Figure 9 shows that the optimal number of inlets is 3.5; however, this is not feasible, as this factor has to be a discrete integer. While this is true, and further analysis should be conducted, it would not be beneficial, as Koumakis’ et al. (2024) [12] findings suggest that fewer inlets and outlets would likely result in the battery pack overheating. Conversely, increasing the number of inlets and outlets would have a similar adverse aerodynamic effect as increasing the width of the inlets, but to a greater extent, as the percentage of the wing impacted is not only affected by an increase in inlets, but also by outlets.
The curve fits in Figure 9 both have an value of 1. The curve fit for the number of inlets is and the number of outlets being .
Positioning both inlets and outlets on the lower wing surface yielded a superior L/D performance prediction of 16.7 compared to around 14.6 when placed on the upper surface, holding other factors constant at four inlets, NACA duct of R5-WD3-CW15 (see Table 1), five outlets, inlet width 10 cm, angle of attack 4 degrees, and Reynolds number . This difference is primarily attributed to the upper surface of the wing requiring laminar, high-velocity air flow to create a pressure differential compared to the lower surface. However, inlets and outlets on the upper surface disrupt this laminar flow through boundary layer disturbances and the formation of unwanted vortex pairs. This likely effect would increase the local pressure coefficient compared to the baseline wing, resulting in a lower L/D. Exhausting the hot air to the lower surface of the wing has multiple benefits. First, it decelerates the velocity of the air downstream of the outlet, therefore increasing the local coefficient of pressure. The second is that the outlets act as air jets, generating a small upward force, enhancing lift. Such an outlet effect would be an adverse effect when the outlet is on the upper surface. Third, the elevated temperature of the exhaust air increases the local pressure coefficient, consistent with the ideal gas law as per Equation 8; this phenomenon would also yield adverse outcomes on the upper surface. Collectively, these three effects result in a more positive lifting force when inlets and outlets are on the lower surface, increasing the wing’s L/D.
As described earlier, the streamwise position of the ducts was constrained to the region forward of the main spar. This constraint limits the potential benefits of having the outlets further downstream to re-energise the upper-surface boundary layer, which could further improve the L/D. Consequently, for future analysis, the ducts were positioned as close to the main spar as possible to replicate Koumakis’ et al. (2024) [12] position, as this had been shown in CFD modelling to cool the battery pack effectively. The inlets and outlets were distributed uniformly along the wing span. The angle of attack and Reynolds number had their expected significant influence on L/D, with their effects being consistent with the baseline test results.
The set-up of the D-optimal test plan prevents a comprehensive analysis of individual variables (width-to-depth ratio, ramp angle and streamwise position) of the NACA ducts. However, the D-optimal test plan clearly indicates that the best NACA duct combination has a ramp angle of 7°, a width-to-depth ratio of 3, and a streamwise placement of 15% of the chord, which corresponds to literature published [19]. The least favourable inlet configuration was a wing leading-edge inlet with a vertical opening of 40% of the chord, corroborating Biermann et al. 1940 [14] in demonstrating that a large opening is detrimental to L/D due to early flow separation. Comparatively, the wing leading edge inlet with a vertical opening of 20% of the chord was only 3.29% worse than the ideal inlet analysed, which has an estimated L/D of 21.694, with a standard deviation of 3.145. The substantial standard deviation arises from the breadth of the exploration space and the omission of many of the interactions between factors. Therefore, further tests were required to develop a more precise L/D model based on the more ideal configuration found in this screening test.
4.4. Modelling
A sparse modelling design was then conducted, focusing on five key factors: ramp angle, width-to-depth ratio, chordwise placement, and angle of attack at three levels and Reynolds number at two levels. Sparse modelling again used a D-Optimal test plan, reducing the number of tests from the full factorial 162 to 23 near orthogonal tests while maintaining a maximum VIF below 1.4 for main factors, two-way interactions and quadratics. The central test point for all inlet parameters was based on the optimal inlet parameters from the previous screening plan, bracketed to help refine the optimal point. The angle of attack and Reynolds number ranges remained those of the aircraft’s normal operation, but the Reynolds number was modelled with just two levels, maximum and minimum. This reduction in the number of levels for Reynolds number was made because the optimal free stream velocity is not as crucial as the optimal values of other parameters, saving computational costs. The inlet area, outlet shape, size, and streamwise position were held constant, consistent with the optimal cooling design found by Koumakis et al. (2024) [12].
A multiple regression analysis of the sparse modelling results, performed using QuantumXL® [33] found that an angle of attack, the quadratic of angle of attack, Reynolds number, and the interactions of Reynolds number and angle of attack (all ) statistically significant. Collectively these four influences explained 99.9% of the variance (). Unfortunately, the angle of attack quadratic dominated, masking the impact of the other important cooling design factors. Consequently, a revised screening test was created in which angle of attack and Reynolds number were held constant at the Aero Jones CTLS’ most economic cruise speed of 82 KIAS [44] and an angle of attack 4.38°, thereby better representing the most likely cruise condition.
A focused modelling design used just three factors, ramp angle, width-to-depth ratio, and streamwise position of the inlet, each at three levels to identify the optimal inlet configuration based on their impact on L/D, as detailed in Table 2. The test design also used a D-Optimal test plan, reducing the number of tests from the full factorial 27 to 15 while maintaining a maximum VIF below 1.4 for all main factors, the quadratics, two-way interactions, and the three-way interaction. The results of the screening tests informed the setup of the modelling test plan. The inlet parameters of the ideal case from the screening tests served as the central test point, which was then bracketed to refine the optimal point. Furthermore, the outlet shape, size and streamwise position were kept constant and in line with Koumakis et al. (2024) [12] optimal design case. Also, whilst the inlet depth and width were varied, the total inlet area was kept constant .
4.4.1. Focused Modelling Results
A multiple regression analysis of the sparse modelling results, performed using QuantumXL® [33], found only the interaction between the width-to-depth ratio and the ramp angle statistically significant (p = 0.039), explaining 39.21% of the variance (). The significant interaction is at Figure 10, indicating the optimal width-to-depth ratio and ramp angle are at the edge of the test envelope values of 4° and 6°, respectively. As such, a better optimum may lie beyond the focused area. Using sparse screening designs risks focusing early and correcting, in this instance, the interaction between ramp angle and width to depth was masked during limited screening by other highly dominant factors like angle of attack. Recall from the literature review earlier that previous research conducted on flat plates [19] found the optimal width-to-depth ratios of 3 to 5 and ramp angles of between 5° and 7°. As such, the optimum found so far is entirely consistent with that research at its midpoint.
The interaction plotted in Figure 10 is caused by several competing effects. First, the boundary layer flow accelerates over the start of the ramp to maintain contact with the ramp surface. This acceleration reduces the local pressure coefficient as per Bernoulli’s Equation 9, adversely affecting the wing’s lift. This effect can be seen in Figure 11, Figure 12, Figure 13 and Figure 14. A larger ramp angle extends the duct length, resulting in a marginal increase in parasitic drag. Additionally, while not tested in the modelling simulations, a longer ramp generates a larger boundary layer, which occupies a larger portion of the inlet area, restricting high-speed flow from entering the inlet and causing pressure losses.
The chordwise placement of the inlets between 10 and 20% was not significant, meaning the inlets can be placed anywhere in this range to suit the internal battery flow, most likely around the 10% to avoid as much turning of the flow as possible. According to the flat plate theory, the transition point from a laminar to turbulent boundary layer occurs at 14.6% of the chord. Therefore, the inlet starts downstream of the transition point and can be assumed to ingest a small boundary layer as the flow is still laminar or has just transitioned to turbulence and has had little distance to grow rapidly. While not tested for in the modelling test plan, having the inlet ingest a small boundary layer would result in a more efficient duct, compared to a large boundary ingestion [21].
Furthermore, the shape of the NACA duct ingests the boundary layer, while the lip of the duct creates a new boundary layer, effectively resetting the boundary layer. Using flat plate theory, the height of the boundary layer downstream of the inlet reduces by 16.97%, and the transition point moves to 0.343c compared to the boundary layer produced by the wing not influenced by the ducts. This localised effect likely reduces the induced drag [32] and [45]. Therefore, having the inlet further rearwards allows the boundary layer to transition to turbulent, thus increasing the drag and reducing the effectiveness of the inlet.
The screened optimal was test case 3, seen in Figure 15 and has an L/D of 20.339, which is only 0.59% less than a petrol wing at the same angle of attack and Reynolds number.
4.5. Verification Case- Combining Heat Generation with Internal and External Flows
Multiple assumptions were made in both this research and Koumakis et al. (2024) [12] that allowed the internal cooling and external aerodynamic impact to be conducted independently. Both investigations assumed that the wing inlets and outlets were ideal. This later research has also assumed that the position of the inlets and outlets has no impact on the cooling of the battery pack, and a simplified, exclusively external aerodynamic simulation is representative of a real-world case. Therefore, a verification case combining internal, external, and heat generation simulations was conducted to verify the underpinning assumptions that enabled the prior independent analysis.
The verification case utilises the focused modelling design’s optimal configuration, with a cavity inside the wing forward of the main spar. Inside the cavity are 663 batteries spaced equally in 11 rows by 61 columns, with the eight batteries removed from the bottom row to allow space for the NACA inlets. The final cell count of the previous test design was approximately 22 million cells per simulation. Using the same meshing parameters for the verification case resulted in a starting cell count of approximately 60 million, surpassing 100 million cells after the AMRs. This drastic increase in the number of cells is the result of the complex and small meshing required for the 663 batteries inside the wing’s cavity. This number of cells would be too computationally demanding for the Katana HPC. Therefore, it was decided to use a polyhedral mesh. Polyhedral meshes can mesh complex geometries with fewer cells [46], especially in boundary layers [47], where the verification case has many. Using a polyhedral mesh reduced the initial number of cells to 16 million, which increased to 35 million after the three AMRs. Koumakis et al. (2024) [12] also used a polyhedral mesh, which produced 13 million cells for a quarter of the wing’s internal geometry. In contrast, this research used the same number of cells to initially mesh the internal wing geometry. This difference is attributed to Koumakis et al. (2024) [12] meshing the batteries as solids, rather than as walls, to simulate the batteries using the NTGK battery model.
The generation of heat flux by the battery packs varies based on multiple factors, which can be simulated using ANSYS Fluent with the multi-scale multi-domain battery model and the NTGK modelling method. ANSYS Fluent requires three data inputs to accurately model battery cells: cell voltage as a function of time, cell capacity, and discharge rate. This data was obtained from a comparative battery, the SA10, a 4Ah, 3.6V battery that is similar in performance to the expected E22 Spark’s batteries. The experimental data provided are for discharge rates of 0.2C, 0.5C, 1C, 2C, and 3C, compared to the used E22 Spark’s predicted discharge rates of 0.023C, 0.23C, 0.94C, and 2.34C. A discharge rate of 1C means that a battery will discharge in 1 hour, and a discharge of 2C will result in the battery discharging in 30 minutes. This difference in C-rate is negligible, as ANSYS Fluent uses curve fits to match the experimental data to simulation requirements. One limitation of the experimental data is that they were all tested at a constant atmospheric temperature of 298.15 K. This constraint prevents ANSYS Fluent from modelling how the atmospheric temperature impacts the battery’s performance.
As a worst-case scenario to Equations 1, 4 and 5, the research extracted the curve fits of U and Y from ANSYS Fluent and applied the correct C-rate for all stages of flight except cruise, which has a safety factor of two, creating Figure 16. This figure illustrates how the heat generation per volume changes over the duration of the flight, with the highest heat generation occurring at the top of climb and the minimum during pre- and post-flight periods when only the aircraft’s avionics require power. The variations during cruise (1,375- 4,080 seconds), even though the discharge rate is constant, are due to fluctuations in Y. The three time periods in which the rate of change of with respect to time is at a minimum are Peak 1 at 1,832 seconds, Trough 1 at 3,603 seconds, and Peak 2 at 3,615 seconds. These points were selected for the verification cases because they have minimal changes in , allowing these time periods to be simplified to a steady-state simulation, which shows the equilibrium condition for each time step.
The initial cruise condition was chosen because it is the midpoint between maximum heat generation following takeoff and climb, and less heat generation during later cruise and descent. The ideal battery cooling layout identified by Koumakis et al. (2024) [12] provided no noticeable cooling difficulties during takeoff and cruise. Similarly, if the ideal layout from the focused modelling test can cool the batteries in cruise, then it can be assumed that it will also cool the batteries during descent and likely to be adequate for all stages of flight. Each battery was then set to produce a consistent heat flux based on the NTGK modelling.
The ideal external aerodynamic configuration of ducts will be considered to effectively cool the batteries if the average battery temperature is less than or equal to the respective temperature reported by Koumakis et al. (2024) [12]. Shahid and Agelin-Chaab (2018) [30] compared steady state simulation of a battery pack’s Thermal Management System to experimental results, showing an average 1.1 K difference between the two tests, which is an acceptable error margin for the amount of computational resources that will be saved by doing a steady state simulation compared to a transient simulation. To further effectively use computational resources, the verification case was simulated with a low value of until all residuals converged below 0.001. Once converged, the mesh underwent an AMR. This process was repeated a total of three times over 317 iterations, taking 4 hours and 42 minutes. The value of was then adjusted to match that of the three different verification cases, and the solution was iterated until the residuals converged below 0.001, requiring approximately 100 iterations and 90 minutes per simulation.
4.5.1. Verification Results
The three different verification simulations resulted in very similar L/D as seen in the Table 3. The verification cases’ L/D was 1.75%, less than the greenhouse-emitting petrol wing, even though the inlets and outlets encompass 25% of the wing span. This represents a 1.75% reduction in both the range and endurance of the E22 Spark to 71.72 nmi and a 1 hour 34 minute flight time with 30 minutes of reserves. Even with this reduction, the E22 Spark still has a similar range and better endurance than aircraft designed to be electrically powered, such as the Pipistrel Alpha Electro [48]. The reduction in L/D associated with the forced air cooling is trivial compared to the almost 90% reduction in range and endurance when it was converted from petrol to electric power. While any decrease in L/D is limiting, a 1.75% reduction is considered acceptable compared to the likely weight of cooling without using forced air.
The verification cases’ L/D were within 3.45% of the simplified screening and modelling cases. Therefore, the assumption that the internal aerodynamics can be simplified to ideal outlets and inlets to reduce computational costs was valid. The simplified cases exhibited a reduction in lift, attributed to the efficiency of the outlet. Figure 17 and Figure 18 show that the pressure coefficient on the underside of the wing is almost identical. The only differences are the locally higher pressure region forward of the inlets and a smaller low-pressure region downstream of the outlets. This effect is likely the result of the idealised inlets having no pressure increase upstream of them, and the entire idealised outlet exhausting hot gas. The entire idealised outlet produces uniform flow, whereas the flow out of the verification case only begins approximately halfway from the forward edge of the outlet. This flow blockage increases the pressure downstream of the outlets compared to the ideal modelling case, therefore providing a slight increase in lift. However, the reduction of the higher temperature region and circulation around the wing creates an adverse lift effect. The simplified external model slightly underestimates the total drag compared to the verification case. This can be attributed to the increased pressure upstream of the inlets. The change in the moment coefficient is negligible between the modelling and verification cases, further verifying the assumption.
As expected, the baseline petrol wing produces more lift (1.61%), less drag (0.37%), and a smaller moment (2.99%) compared to the verification cases. However, the differences between the parameters are marginal and well within the error of the CFD not being converged to a smaller residual. The difference in L/D between the three verification cases is minimal and can be attributed to errors in the CFD. The L/D difference does not correlate with the temperature differences between the three different cases.
The battery manufacturer of the E22 Spark’s batteries recommends that the batteries stay below 308 K and within the ideal operating range of 288 K to 308 K [49], with thermal runaway occurring between 363 K and 393 K [49]. Figure 19 depicts the maximum, minimum, and average temperature on each battery with respect to their position as viewed from the front of the left wing. The four black boxes distributed along the bottom of each graph represent the batteries that have been removed from the battery pack to create space for the NACA ducts. Therefore, these black boxes can be thought of as the inlets. The five outlets at 0.25c are not marked on the graph but are spaced equidistant between the inlets at 0.1c.
Figure 19 indicates that the idealised inlet, outlet configuration can prevent the majority of the batteries from reaching the critical thermal runaway temperature. However, the configuration cannot keep all the batteries at their optimal performance temperature. Furthermore, there is a significant temperature difference (113.92 K) between batteries within the pack, which is detrimental to their lifespan and efficiency. It is essential to note that the cruise C-rate has been doubled to provide a safety factor that may be necessary if the E22 Spark encounters a headwind or the avionics require more power than a standard cruise. Furthermore, the aircraft is operating in a high ambient temperature (303.15 K, 30 °C), which is typically found in tropical and warm climate regions.
The simulated variation in temperature across the battery pack can be attributed to the lack of uniform airflow through the pack caused by the repositioning of the inlets and outlets. Figure 20 shows how the flow and temperature vary through the pack. The cool air is ingested by the inlet and is redirected by the back wall to move spanwise and upwards. The flow is then redirected by the upper wall of the void and moves over the top row of batteries before circulating in the large void forward of the batteries, then flowing past the lower batteries and out through the outlets. These flows are why the upper and lower rows of batteries are consistently cooler than the remainder of the batteries Figure 19 and Figure 21; this is consistent with Koumakis et al. (2024) [12] findings. Furthermore, the batteries in the vicinity of the inlets remain cooler because the ingested air has not had time to increase in temperature. The outlet provides a marginal cooling benefit to the batteries within its region, but not as much as the inlets’ area of influence.
The batteries within rows two to seven are consistently hotter due to the airflow bypassing them as it moves from the bottom to the top of the void, as seen in Figure 21. This effect means that the batteries within these rows cannot rely on the circulation about the wings’ lateral axis and instead have to rely on the spanwise flow inside the pack. Figure 22 shows that the spanwise flow around the battery pack is minimal and insufficient to transfer heat away from the batteries effectively. Koumakis et al. (2024) [12] did not encounter this problem in their ideal case, as their inlet was placed upstream of the battery pack. This placement allowed the ingested air to diffuse inside the large void before moving through the battery pack, resulting in a more even airflow across the pack. Additionally, having their inlet as far upstream as possible and their outlets as far downstream as possible meant that the airflow did not lose as much energy and velocity turning around obstructions on the way from the inlet to the outlet. This earlier research compares to verification cases in which the flow turns multiple times, thus losing energy and speed that could be used to extract heat from the batteries and exhaust outboard.
5. Future Work
Many aspects of this research could benefit from further research. The first being enhancing the internal geometry to suit the external aerodynamic optimal configuration of inlets and outlets. This refinement could be achieved by modifying the layout of the batteries to utilise the unused space forward of the current battery pack. Such an approach would result in larger gaps between the batteries, which would increase the airflow velocity between batteries as less of the gap is taken up by the boundary layers, thus reducing the battery temperature [50,51]. Another aspect that could be investigated is the addition of internal ducting or baffles to divert the air towards regions of stagnant air. Such mitigation would add more weight to the system; however, if designed correctly, they could be very effective and would result in a marginal increase in weight if they were made from composite materials. A full factorial test could analyse the cooling benefit and aerodynamic penalty of having slightly larger NACA ducts or more ducts.
The research to date has demonstrated that forced air cooling is feasible, and the optimal inlet shape and size for aerodynamic purposes have been identified. However, no research has been conducted on the impact of the outlet and how it could be optimised. A modelling test case, similar to the one in this research, should be undertaken to characterise the impact of the outlet shape, size, and position on L/D and to find the optimal configuration. If a pathway around the main spar can be identified, then the hot exhaust gas could exit near the wing tip to potentially push the wing tip vortex away from the wing and reduce its vorticity, with possible improvement to the wing’s L/D. Such research would require a complex and transient CFD screening test design. The hot air could also be exhausted at an angle to reduce the streamwise airflow along the wing, therefore also potentially improving lift.
As battery technology continues to improve, larger aircraft will likely transition to hybrid or fully electric models. As such, the scalability of this system should be investigated.
6. Conclusion
This CFD-based research presents the first aerodynamic optimisation of forced air cooling of a high-performance battery pack within an aircraft wing. Such a design is a likely inevitability of sustainable aviation, especially for after-market electrification. Using a series of highly efficient experimental designs, key inlet and outlet parameters were screened and modelled against their impact on L/D, reducing the number of simulations from several thousand to a manageable 66, while maintaining sufficient orthogonality. The results proved that four NACA ducts spaced evenly along the wing span, with a ramp angle of 6°, a width-to-depth ratio of 4 and a chordwise placement at 0.1c, resulted in the best aerodynamic performance, achieving an L/D of 20.07, only 1.69% less than that of the baseline `petrol wing’. This configuration aligns with the battery cooling-optimised design used by Koumakis et al. (2024) [12], balancing aerodynamic and thermal performance requirements.
Three verification cases, incorporating internal and external flow as well as heat generation, validated the assumption of simplified external aerodynamic simulations. However, non-uniform airflow across the battery pack, caused by repositioning of the inlet and outlet, resulted in significant temperature variation, with the middle rows of batteries exceeding the thermal runaway temperatures during certain phases of flight. Another iteration of internal flow design is needed to avoid such inefficient operation and the risks of catastrophic battery failure. Furthermore, the margins and risks are such that an intermediary instrumented flight test verification of the installation is needed, at least for the first after-market electrification, while design strategies and certification mature. Unfortunately, many of the commercial operators of light sport aircraft, where electrification is first viable, are unlikely to have the financial viability and engineering to undertake such tests. Therefore, Government support may be needed to progress the viability testing and meet the sustainability objectives they are setting for the aviation sector.
Acknowledgments
M. Hargreaves thanks Dr K. Joiner, CSC, CPEng, CPPD, for their input and guidance as Project Supervisor throughout the project. M. Hargreaves also thanks Dr D. Dooner for their continued guidance and support with CFD throughout the project. This research includes computations using the computational cluster Katana supported by Research Technology Services at UNSW Sydney (https://doi.org/10.26190/669x-a286).
Conflicts of Interest
The authors declare no conflicts of interest. The funders had no role in the design of the study; in the collection, analyses, or interpretation of data; in the writing of the manuscript; or in the decision to publish the results.
Nomenclature
| NTGK polynomial constant | |
| Angle of attack (deg) | |
| NTGK polynomial constant | |
| c | Chord |
| C | C-rate |
| Temperature correction constant () | |
| Temperature correction constant (K) | |
| 3-dimensional drag coefficient | |
| 3-dimensional minimum drag coefficient | |
| 3-dimensional lift coefficient | |
| 3-dimensional lift curve slope () | |
| 2-dimensional lift curve slope () | |
| 3-dimensional maximum lift coefficient | |
| 3-dimensional lift coefficient at minimum drag | |
| 3-dimensional moment | |
| Boundary layer thickness (m) | |
| DoD | Depth of discharge (%) |
| Electrochemical current potential () | |
| Battery heat generation ( | |
| E | Endurance time (min) |
| e | Oswald efficiency factor |
| Energy density () | |
| Mass-specific energy | |
| Total drivetrain efficiency (%) | |
| g | Gravitational acceleration () |
| h | Reference height (m) |
| j | Current density () |
| L/D | Lift-to-drag ratio |
| m | Aircraft mass (kg) |
| Battery mass (kg) | |
| n | Number of moles (mol) |
| P | Pressure (kPa) |
| Battery total electric capacity (Ah) | |
| Battery capacity of the experimental battery (Ah) | |
| R | Range (nmi) |
| R | Ideal gas constant () |
| Re | Reynolds number |
| Local Reynolds number | |
| Air density () | |
| T | Temperature of the battery in the simulation (K) |
| t | Time (K) |
| Reference temperature- experimental condition (K) | |
| , | Battery terminal voltages (v) |
| U | NTGK fitting parameter (v) |
| V | Velocity (m/s) |
| Battery cell voltage (v) | |
| Freestream velocity (m/s) | |
| Vol | Volume of a single battery () |
| W | Aircraft weight (kg) |
| x | Distance from the leading edge (m) |
| Y | NTGK fitting parameter () |
Appendix A
Figure A1.
CFD Domain
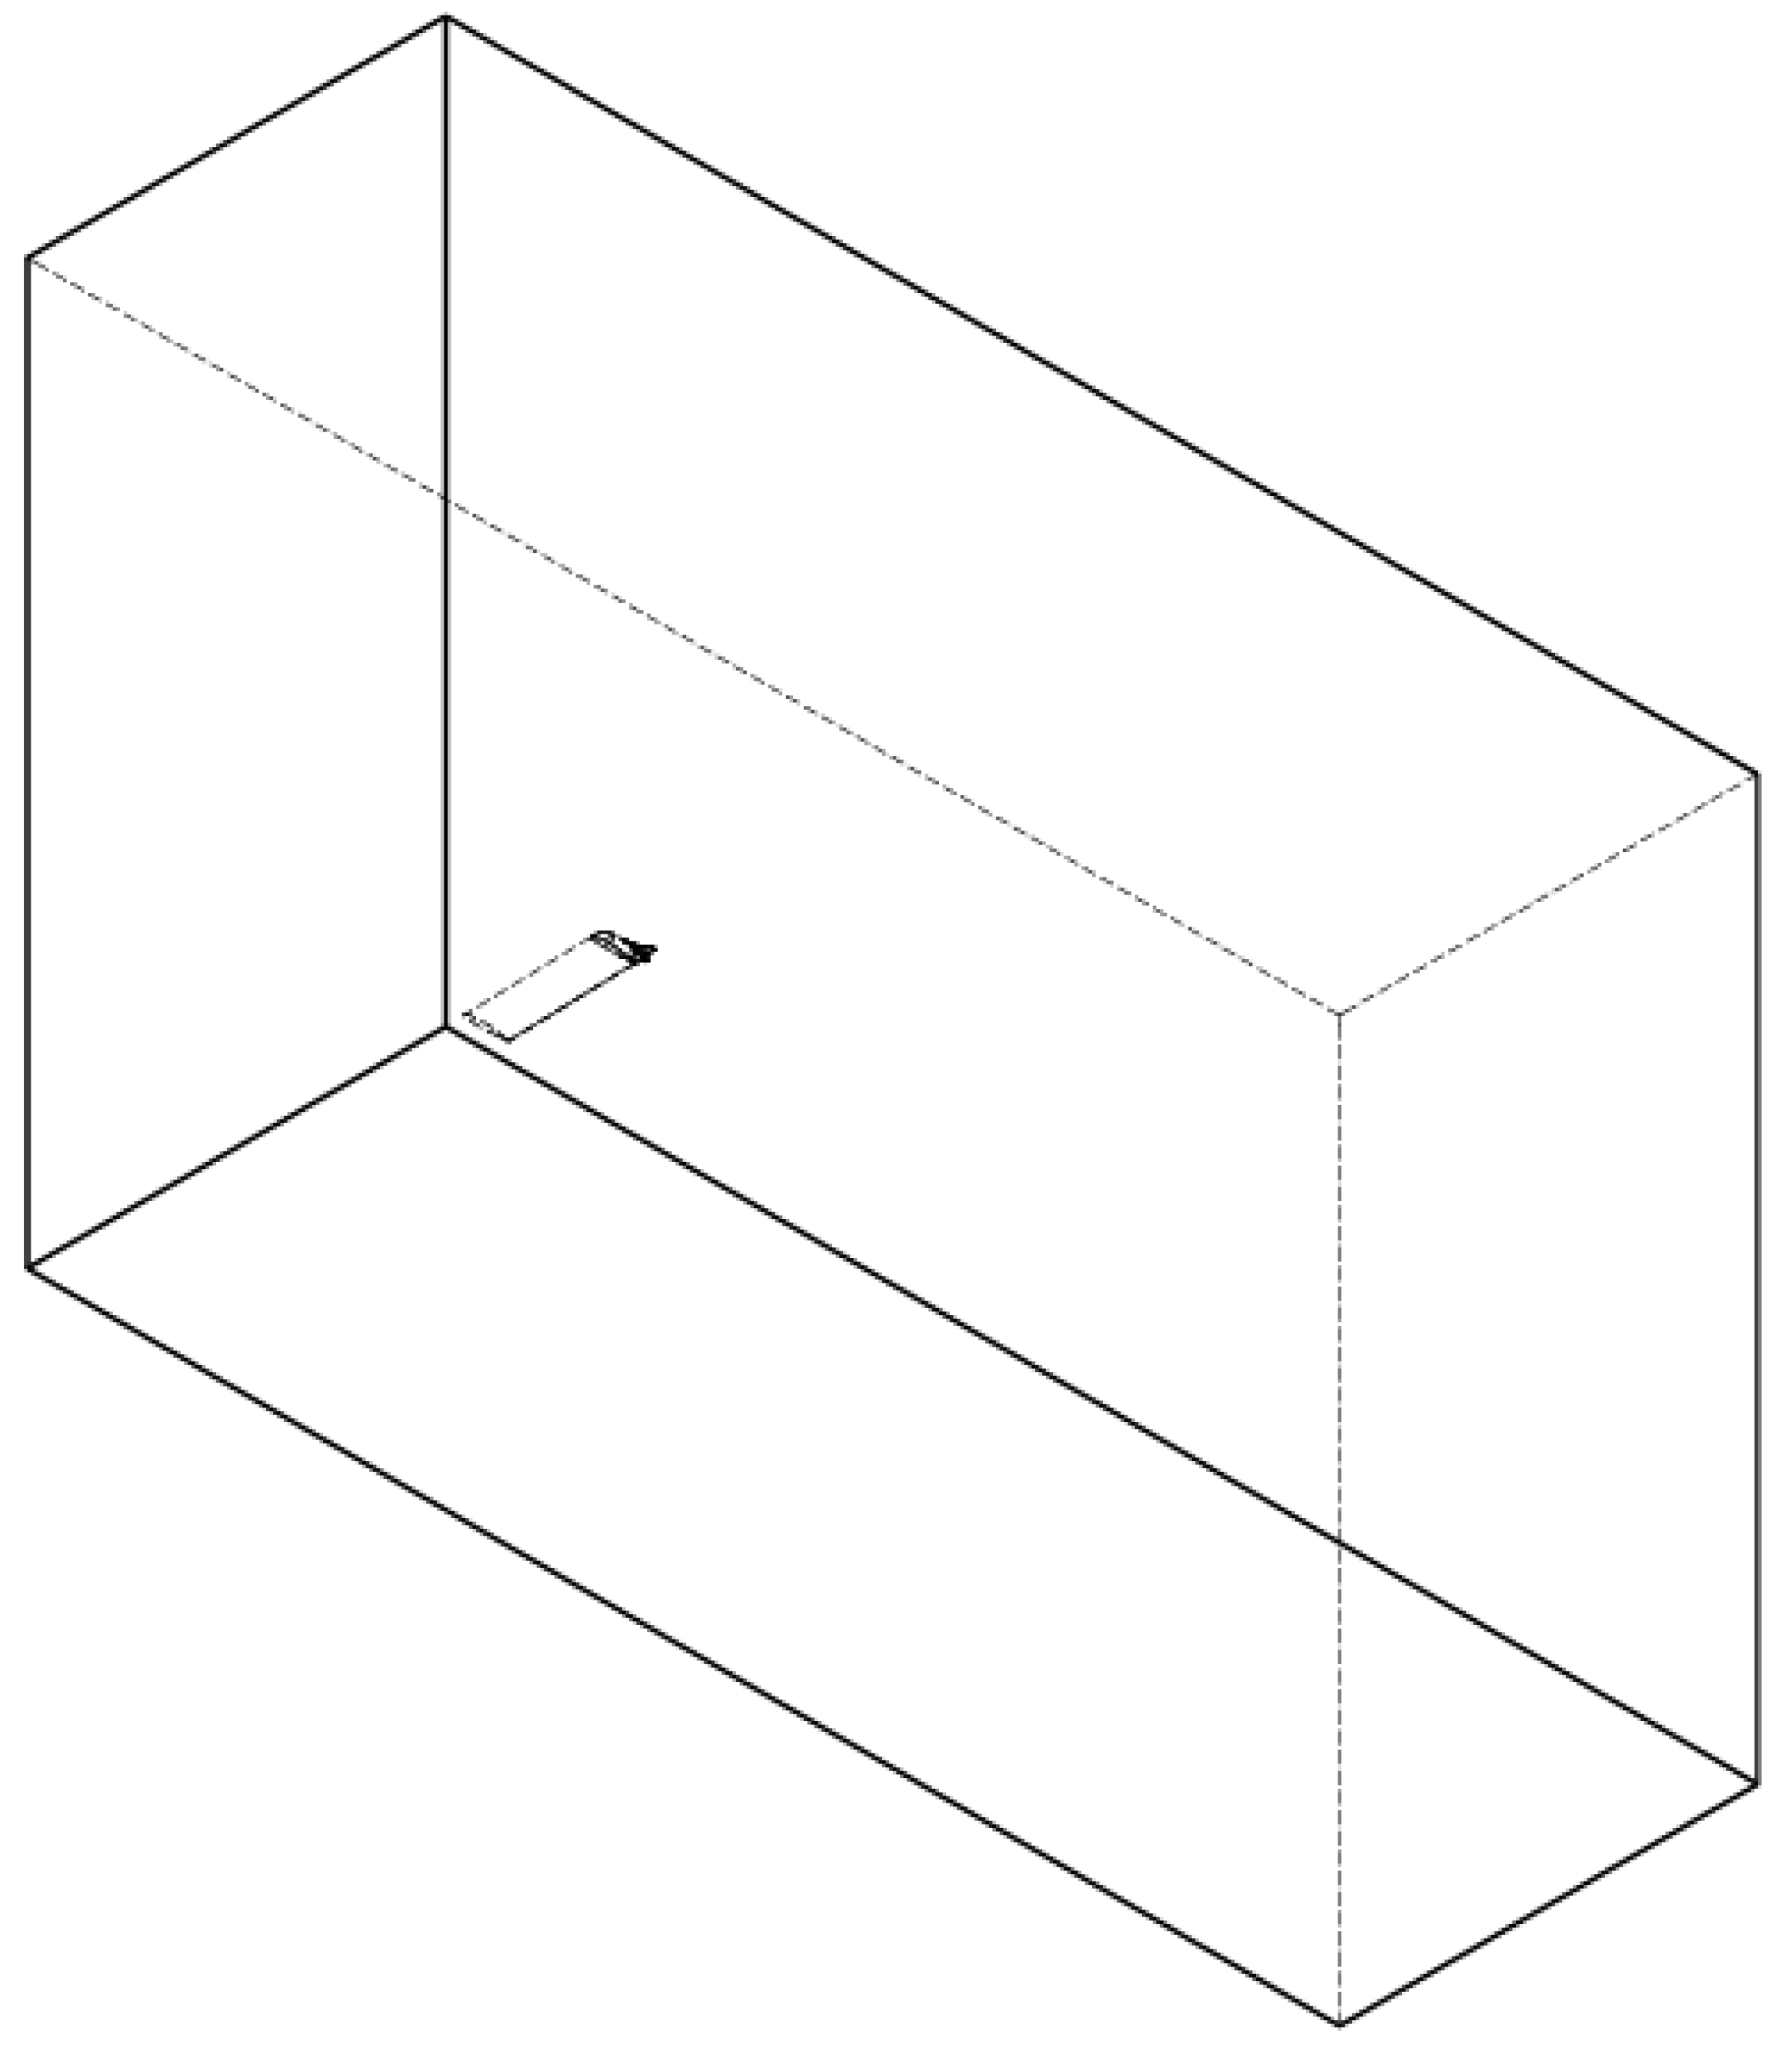
Figure A2.
CFD Domain- Side view
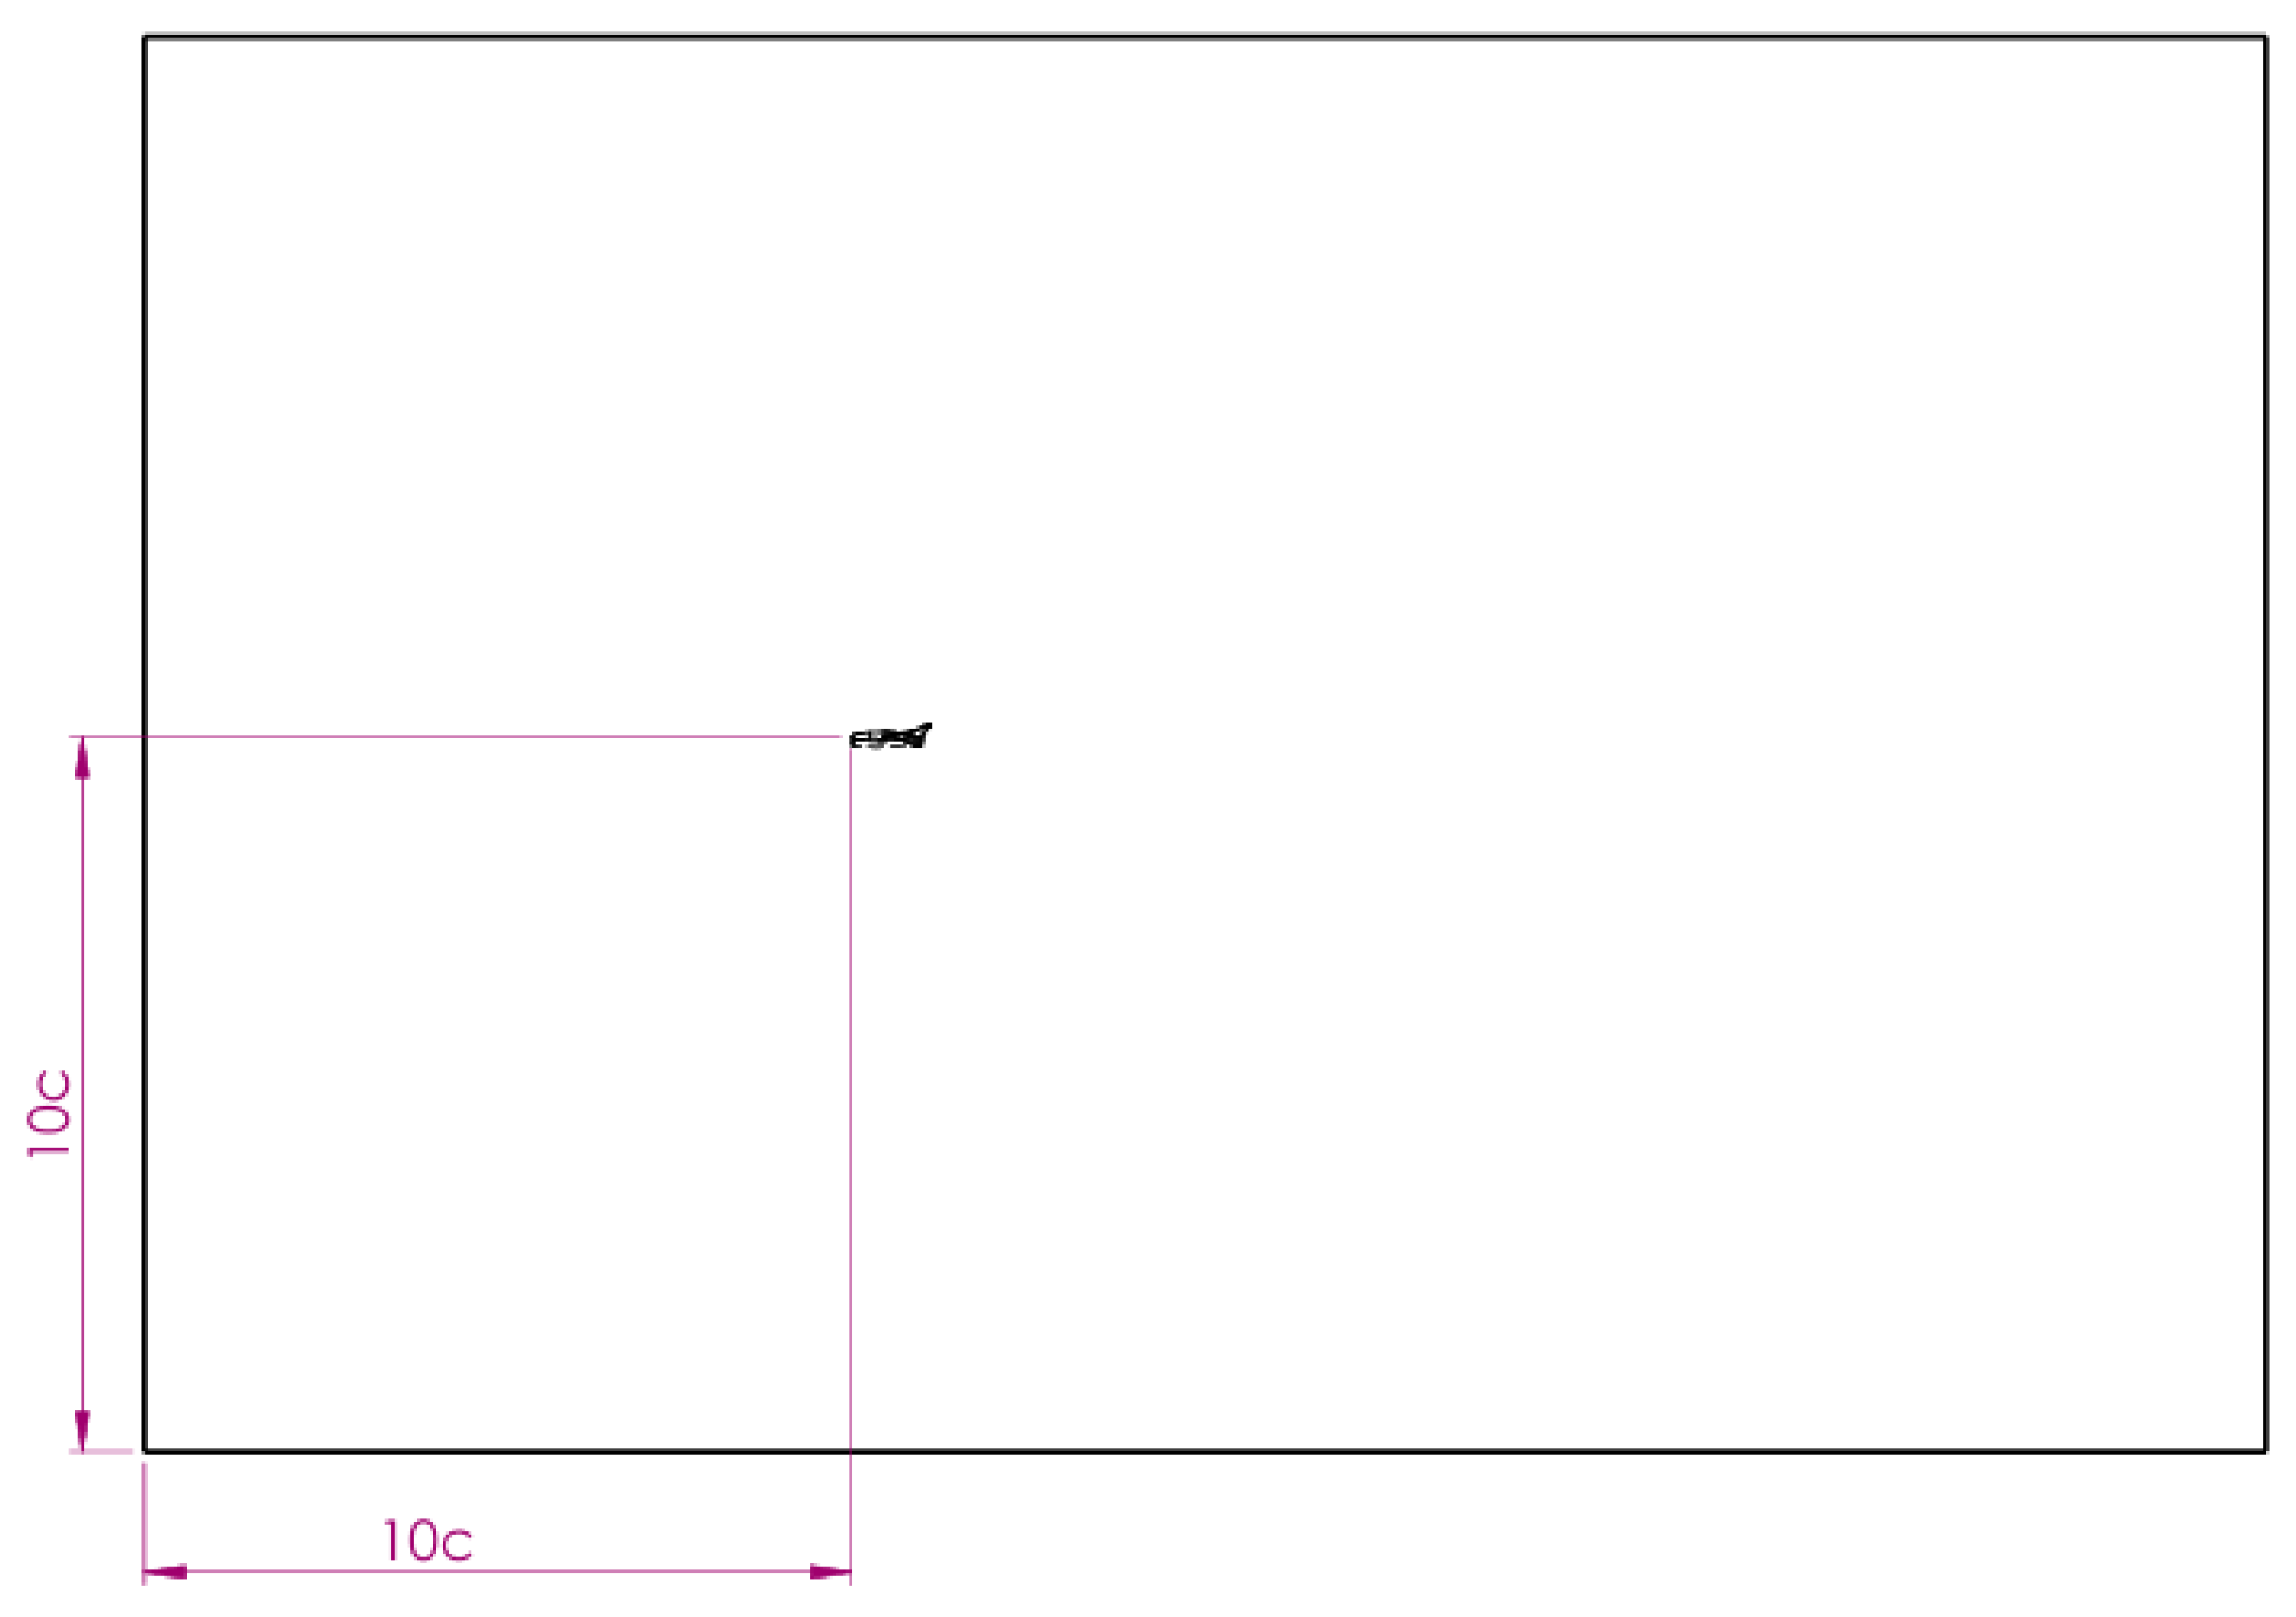
Figure A3.
CFD Domain- Top View
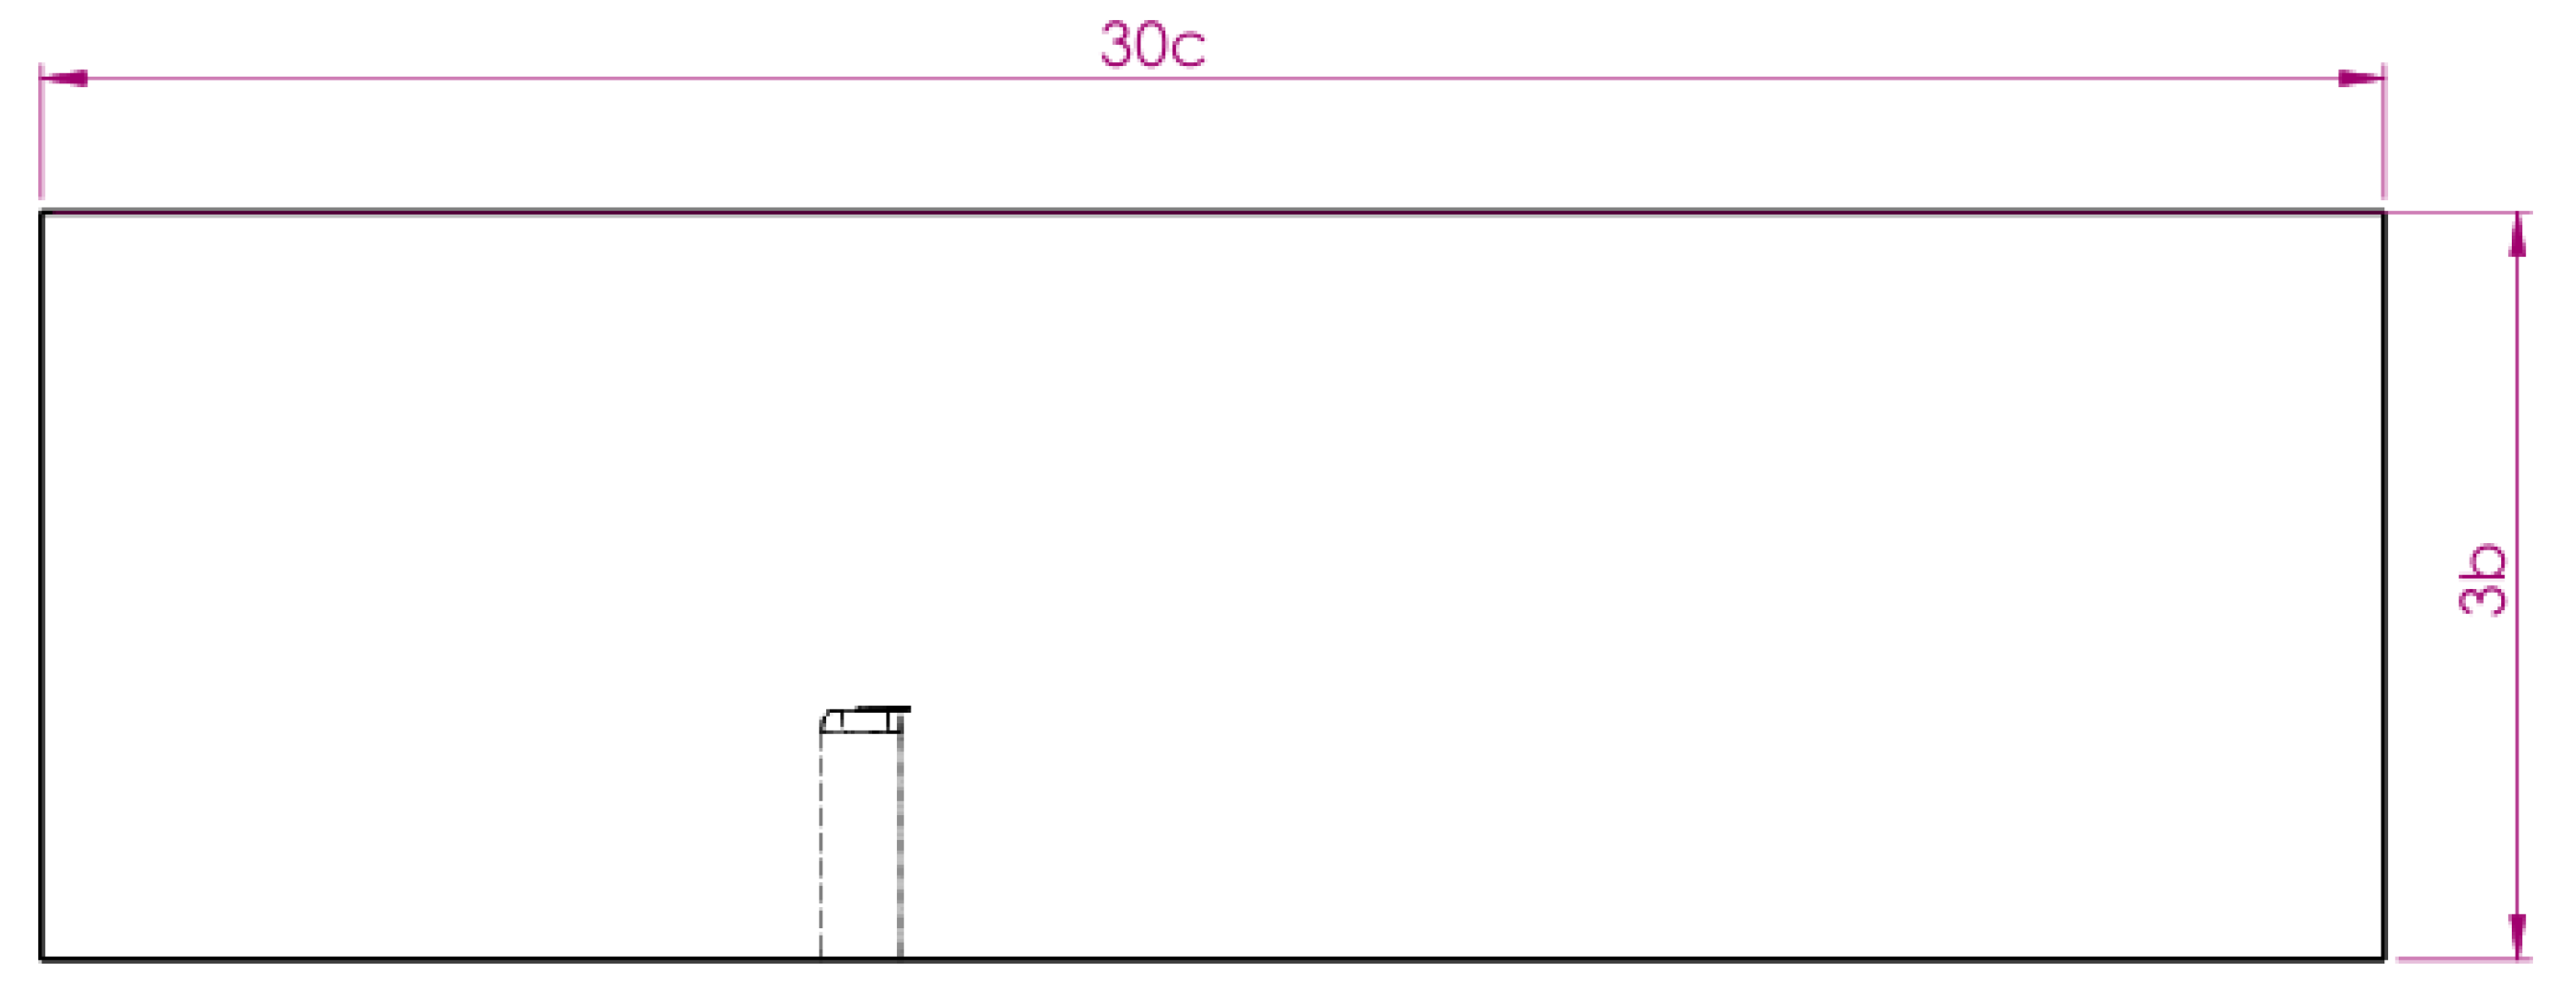
Figure A4.
CFD Domain- Back view
References
- Benzaquen, J.; He, J.; Mirafzal, B. Toward more electric powertrains in aircraft: Technical challenges and advancements. CES Transactions on Electrical Machines and Systems 2021, 5, 177–193. (accessed on 2 Apr 2025). [CrossRef]
- Bravo, G.M.; Praliyev, N.; Veress, A. Performance analysis of hybrid electric and distributed propulsion system applied on a light aircraft. Energy 2021, 214, 118823. [CrossRef]
- Adu-Gyamfi, B.A.; Good, C. Electric aviation: A review of concepts and enabling technologies. Transportation Engineering 2022, 9, 100134. (accessed on 8 May 2025), . [CrossRef]
- European Commission. Directorate General for Research and Innovation..; European Commission. Directorate General for Mobility and Transport.. Flightpath 2050 – Europe’s vision for aviation – Maintaining global leadership and serving society’s needs; Publications Office, 2011. (accessed on 8 May 2025), . [CrossRef]
- Board, T.R.; National Academies of Sciences, E.; Medicine. Preparing Your Airport for Electric Aircraft and Hydrogen Technologies; The National Academies Press, 2022. [CrossRef]
- Parker, P.; Edwards, C.A. Why fly electric? Stakeholder perceptions of e-plane knowledge, motivations and barriers. International Journal of Sustainable Aviation, 8, 299–311. (accessed on 8 May 2025), . [CrossRef]
- EASA.A.573 - Virus SW 121 | EASA. Available online: https://www.easa.europa.eu/en/document-library/type-certificates/aircraft-cs-25-cs-22-cs-23-cs-vla-cs-lsa/easaa573-virus-sw-121. (accessed on 8 May 2025).
- Lin, J.; Liu, X.; Li, S.; Zhang, C.; Yang, S. A review on recent progress, challenges and perspective of battery thermal management system. International Journal of Heat and Mass Transfer 2021, 167, 120834. (accessed on 8 May 2025), . [CrossRef]
- Zhang, X.; Chen, S.; Zhu, J.; Gao, Y. A Critical Review of Thermal Runaway Prediction and Early-Warning Methods for Lithium-Ion Batteries. Energy Material Advances 2023, 4, 0008. (accessed on 10 Jun 2025), . [CrossRef]
- Liu, H.; Wei, Z.; He, W.; Zhao, J. Thermal issues about Li-ion batteries and recent progress in battery thermal management systems: A review. Energy Conversion and Management 2017, 150, 304–330. (accessed on 8 May 2025), . [CrossRef]
- Arora, S. Selection of thermal management system for modular battery packs of electric vehicles: A review of existing and emerging technologies. Journal of Power Sources 2018, 400, 621–640. (accessed on 8 May 2025), . [CrossRef]
- Koumakis, D.; Zhao, J.; Khraibut, A.; Hill, D.; Joiner, K. Cfd-Based Viability for Safely Cooling Wing-Mounted High-Performance Batteries in an After-Market Aircraft Electrification. Available online: https://papers.ssrn.com/abstract=5030338, 2024. (accessed on 30 Sep 2025), . [CrossRef]
- Harris, T.A.; Recant, I.G. Investigation in the 7-By-10 Foot Wind Tunnel of Ducts for Cooling Radiators Within an Airplane Wing, Special Report. Available online: https://ntrs.nasa.gov/citations/20090014718, 1938. (accessed on 2 Apr 2025).
- Biermann, D.; McLellan, C.H. Wind-Tunnel Investigation of Rectangular Air-Duct Entrances in the Leading Edge of an NACA 23018 Wing, Special Report. Available online: https://ntrs.nasa.gov/citations/20090014885, 1940. (accessed on 2 Apr 2025).
- Racisz, S.F. Development of Wing Inlets. Available online: https://ntrs.nasa.gov/citations/19930092761, 1946. (accessed on 2 Apr 2025).
- Doenhoff, A.E.v.; Horton, E.A. Preliminary Investigation in the NACA Low-Turbulence Tunnel of Low-drag Airfoil Sections Suitable for Admitting Air at the Leading Edge. Available online: https://ntrs.nasa.gov/citations/19930092757, 1942. (accessed on 2 Apr 2025).
- Richard Mallory Allnutt. Avro Vulcan XH558 Makes Her Final Flight. Available online: https://vintageaviationnews.com/warbirds-news/avro-vulcan-xh558-final-flight.html, 2015. (accessed on 12 Oct 2025).
- Martin, P. Inlet-airfoil design method for heat exchangers of a high altitude RPA. In 36th AIAA Aerospace Sciences Meeting and Exhibit; Aerospace Sciences Meetings, American Institute of Aeronautics and Astronautics, 1998. (accessed on 2 Apr 2025), . [CrossRef]
- Mossman, E.A.; Randall, L.M. An experimental investigation of the design variables for NACA submerged duct entrances. Available online: https://ntrs.nasa.gov/citations/19930093809, 1948. NTRS Author Affiliations: NTRS Report/Patent Number: NACA-RM-A7I30 NTRS Document ID: 19930093809 NTRS Research Center: Legacy CDMS (CDMS).
- Sacks, A.H.; Spreiter, J.R. Theoretical Investigation of Submerged Inlets at Low Speeds. Available online: https://ntrs.nasa.gov/citations/19890067876, 1951. (accessed on 19 Oct 2025).
- Taskinoglu, E.; Knight, D. Numerical Analysis of Submerged Inlets. In 20th AIAA Applied Aerodynamics Conference; p. 3147. _eprint: https://arc.aiaa.org/doi/pdf/10.2514/6.2002-3147, . [CrossRef]
- Peter Schmidleitner. Handout DA40 NG Systems. Available online: https://hasslo.org/wp-content/uploads/2021/06/SE-MIO-Diamond-DA40-NG_-Handout_V5_2-6.pdf.
- Duraisamy, K.; Baeder, J.D. Numerical Simulation of the Effects of Spanwise Blowing on Wing-Tip Vortex Formation and Evolution. In 23rd AIAA Applied Aerodynamics Conference; American Institute of Aeronautics and Astronautics; Vol. 43. (accessed on 2 Apr 2025).
- Wong, C.; Kontis, K. Flow control by spanwise blowing on a NACA 0012. In Proceedings of the Journal of Aircraft, Vol. 44. [CrossRef]
- Kwon, K.H.; Shin, C.B.; Kang, T.H.; Kim, C.S. A two-dimensional modeling of a lithium-polymer battery. Journal of Power Sources 2006, 163, 151–157. (accessed on 11 Oct 2025), . [CrossRef]
- Kim, U.S.; Shin, C.B.; Kim, C.S. Effect of electrode configuration on the thermal behavior of a lithium-polymer battery. Journal of Power Sources 2008, 180, 909–916. (accessed on 11 Oct 2025), . [CrossRef]
- Seong Kim, U.; Yi, J.; Shin, C.B.; Han, T.; Park, S. Modeling the Dependence of the Discharge Behavior of a Lithium-Ion Battery on the Environmental Temperature. Journal of The Electrochemical Society 2011, 158, A611. (accessed on 11 Oct 2025), . [CrossRef]
- Hong, S.; Zhang, X.; Chen, K.; Wang, S. Design of flow configuration for parallel air-cooled battery thermal management system with secondary vent. International Journal of Heat and Mass Transfer 2018, 116, 1204–1212. (accessed on 11 Oct 2025), . [CrossRef]
- Behi, H.; Karimi, D.; Behi, M.; Ghanbarpour, M.; Jaguemont, J.; Sokkeh, M.A.; Gandoman, F.H.; Berecibar, M.; Mierlo, J.V. A new concept of thermal management system in Li-ion battery using air cooling and heat pipe for electric vehicles. Applied Thermal Engineering 2020, 174, 115280. [CrossRef]
- Shahid, S.; Agelin-Chaab, M. Development and analysis of a technique to improve air-cooling and temperature uniformity in a battery pack for cylindrical batteries. Thermal Science and Engineering Progress 2018, 5, 351–363. (accessed on 11 Oct 2025), . [CrossRef]
- Li, K.; Sun, C.; Zhang, M.; Wang, S.; Wei, B.; Cheng, Y.; Ju, X.; Xu, C. A Study of the Thermal Management and Discharge Strategies of Lithium-Ion Batteries in a Wide Temperature Range. Energies 2024, 17. [CrossRef]
- Snorri Gudmundsson. General Aviation Aircraft Design Applied Methods and Procedures, 2 ed.; Butterworth-Heinemann, 2022.
- SigmaZone. Quantum XL v17. Available online: SigmaZone.com, 2025.
- D-Optimal Designs. Available online: https://www.ncss.com/wp-content/themes/ncss/pdf/Procedures/NCSS/D-Optimal_Designs.pdf.
- Full Factorial Design: Comprehensive Guide for Optimal Experimentation. Available online: https://www.6sigma.us/six-sigma-in-focus/full-factorial-design/.
- PVC (Research Infrastructure).; UNSW Sydney. Katana. 2010. Available online: . [CrossRef]
- 39.2. Refining and Coarsening. Available online: https://ansyshelp.ansys.com/public////Views/Secured/corp/v252/en/flu_ug/flu_ug_adapt_refine-coarsen.html?q=Combined%20Hessian. (accessed on 13 Oct 2025).
- Ansys Product Help. Available online: https://ansyshelp.ansys.com/public/account/secured?returnurl=/Views/Secured/prod_page.html?pn=Fluent. (accessed on 10 Jun 2025).
- Pekurovsky, D.; Drayna, T.W.; Knutson, A.; Candler, G.V. Effect of Mesh Refinement Methods on Hypersonic Flow Quantities. In AIAA SCITECH 2025 Forum; p. 0147. _eprint: https://arc.aiaa.org/doi/pdf/10.2514/6.2025-0147, . [CrossRef]
- 4.18.3. y+-Insensitive Near-Wall Treatment for w-based Turbulence Models. Available online: https://ansyshelp.ansys.com/public////Views/Secured/corp/v252/en/flu_th/section_kbf_dl4_vvb.html. (accessed on 21 Oct 2025).
- Wang, W.; Cao, Y.; Okaze, T. Comparison of hexahedral, tetrahedral and polyhedral cells for reproducing the wind field around an isolated building by LES. Building and Environment 2021, 195, 107717. (accessed on 25 May 2025), . [CrossRef]
- Li, Y.; Wang, W.; Okaze, T. Evaluation of polyhedral mesh performance for large-eddy simulations of flow around an isolated building within an unstable boundary layer. Building and Environment 2023, 235, 110207. (accessed on 14 Oct 2025), . [CrossRef]
- S.K. Chakrabartty.; K. Dhanalakshmi.; V. Ramesh. Navier-Stokes analysis of GA (W)-2 aerofoil with deflected flap and redesign of HANSA flap for better performance. Computational Flmd Dynaimcs .Journal, 12, 89–97. (accessed on 24 Jul 2025).
- Pilot’s Operating Handbook. Available online: https://www.aerojones.com/download.php?lang=en&tb=2&cid=239.
- John Anderson. Fundamentals of Aerodynamics, 6 ed.; McGraw-Hill Education, 2017. (accessed on 9 Oct 2025).
- Emre Sozer.; Christoph Brehm.; Cetin C. Kiris. Gradient Calculation Methods on Arbitrary Polyhedral Unstructured Meshes for Cell-Centered CFD Solvers. In Proceedings of the 52nd Aerospace Sciences Meeting, 2014, p. 1440. (accessed on 11 Oct 2025), . [CrossRef]
- Aaron Katz.; Venkateswaran Sankaran. Mesh Quality Effects on the Accuracy of CFD Solutions on Unstructured Meshes. In 49th AIAA Aerospace Sciences Meeting including the New Horizons Forum and Aerospace Exposition; Vol. 230, pp. 7670–7686. (accessed on 11 Oct 2025).
- Alpha Electro. Available online: https://flyone.com.au/electricaircraft/alphaelectro. (accessed on 11 Oct 2025).
- Yue, Q.L.; He, C.X.; Wu, M.C.; Zhao, T.S. Advances in thermal management systems for next-generation power batteries. International Journal of Heat and Mass Transfer 2021, 181, 121853. (accessed on 11 Oct 2025), . [CrossRef]
- Hasan, H.A.; Togun, H.; Abed, A.M.; Mohammed, H.I.; Biswas, N. A novel air-cooled Li-ion battery (LIB) array thermal management system – a numerical analysis. International Journal of Thermal Sciences, 190, 108327. [CrossRef]
- Chen, K.; Chen, Y.; She, Y.; Song, M.; Wang, S.; Chen, L. Construction of effective symmetrical air-cooled system for battery thermal management. Applied Thermal Engineering 2020, 166, 114679. [CrossRef]
Figure 1.
Avro Vulcan [Photo by Steven Comber [17].
Figure 1.
Avro Vulcan [Photo by Steven Comber [17].
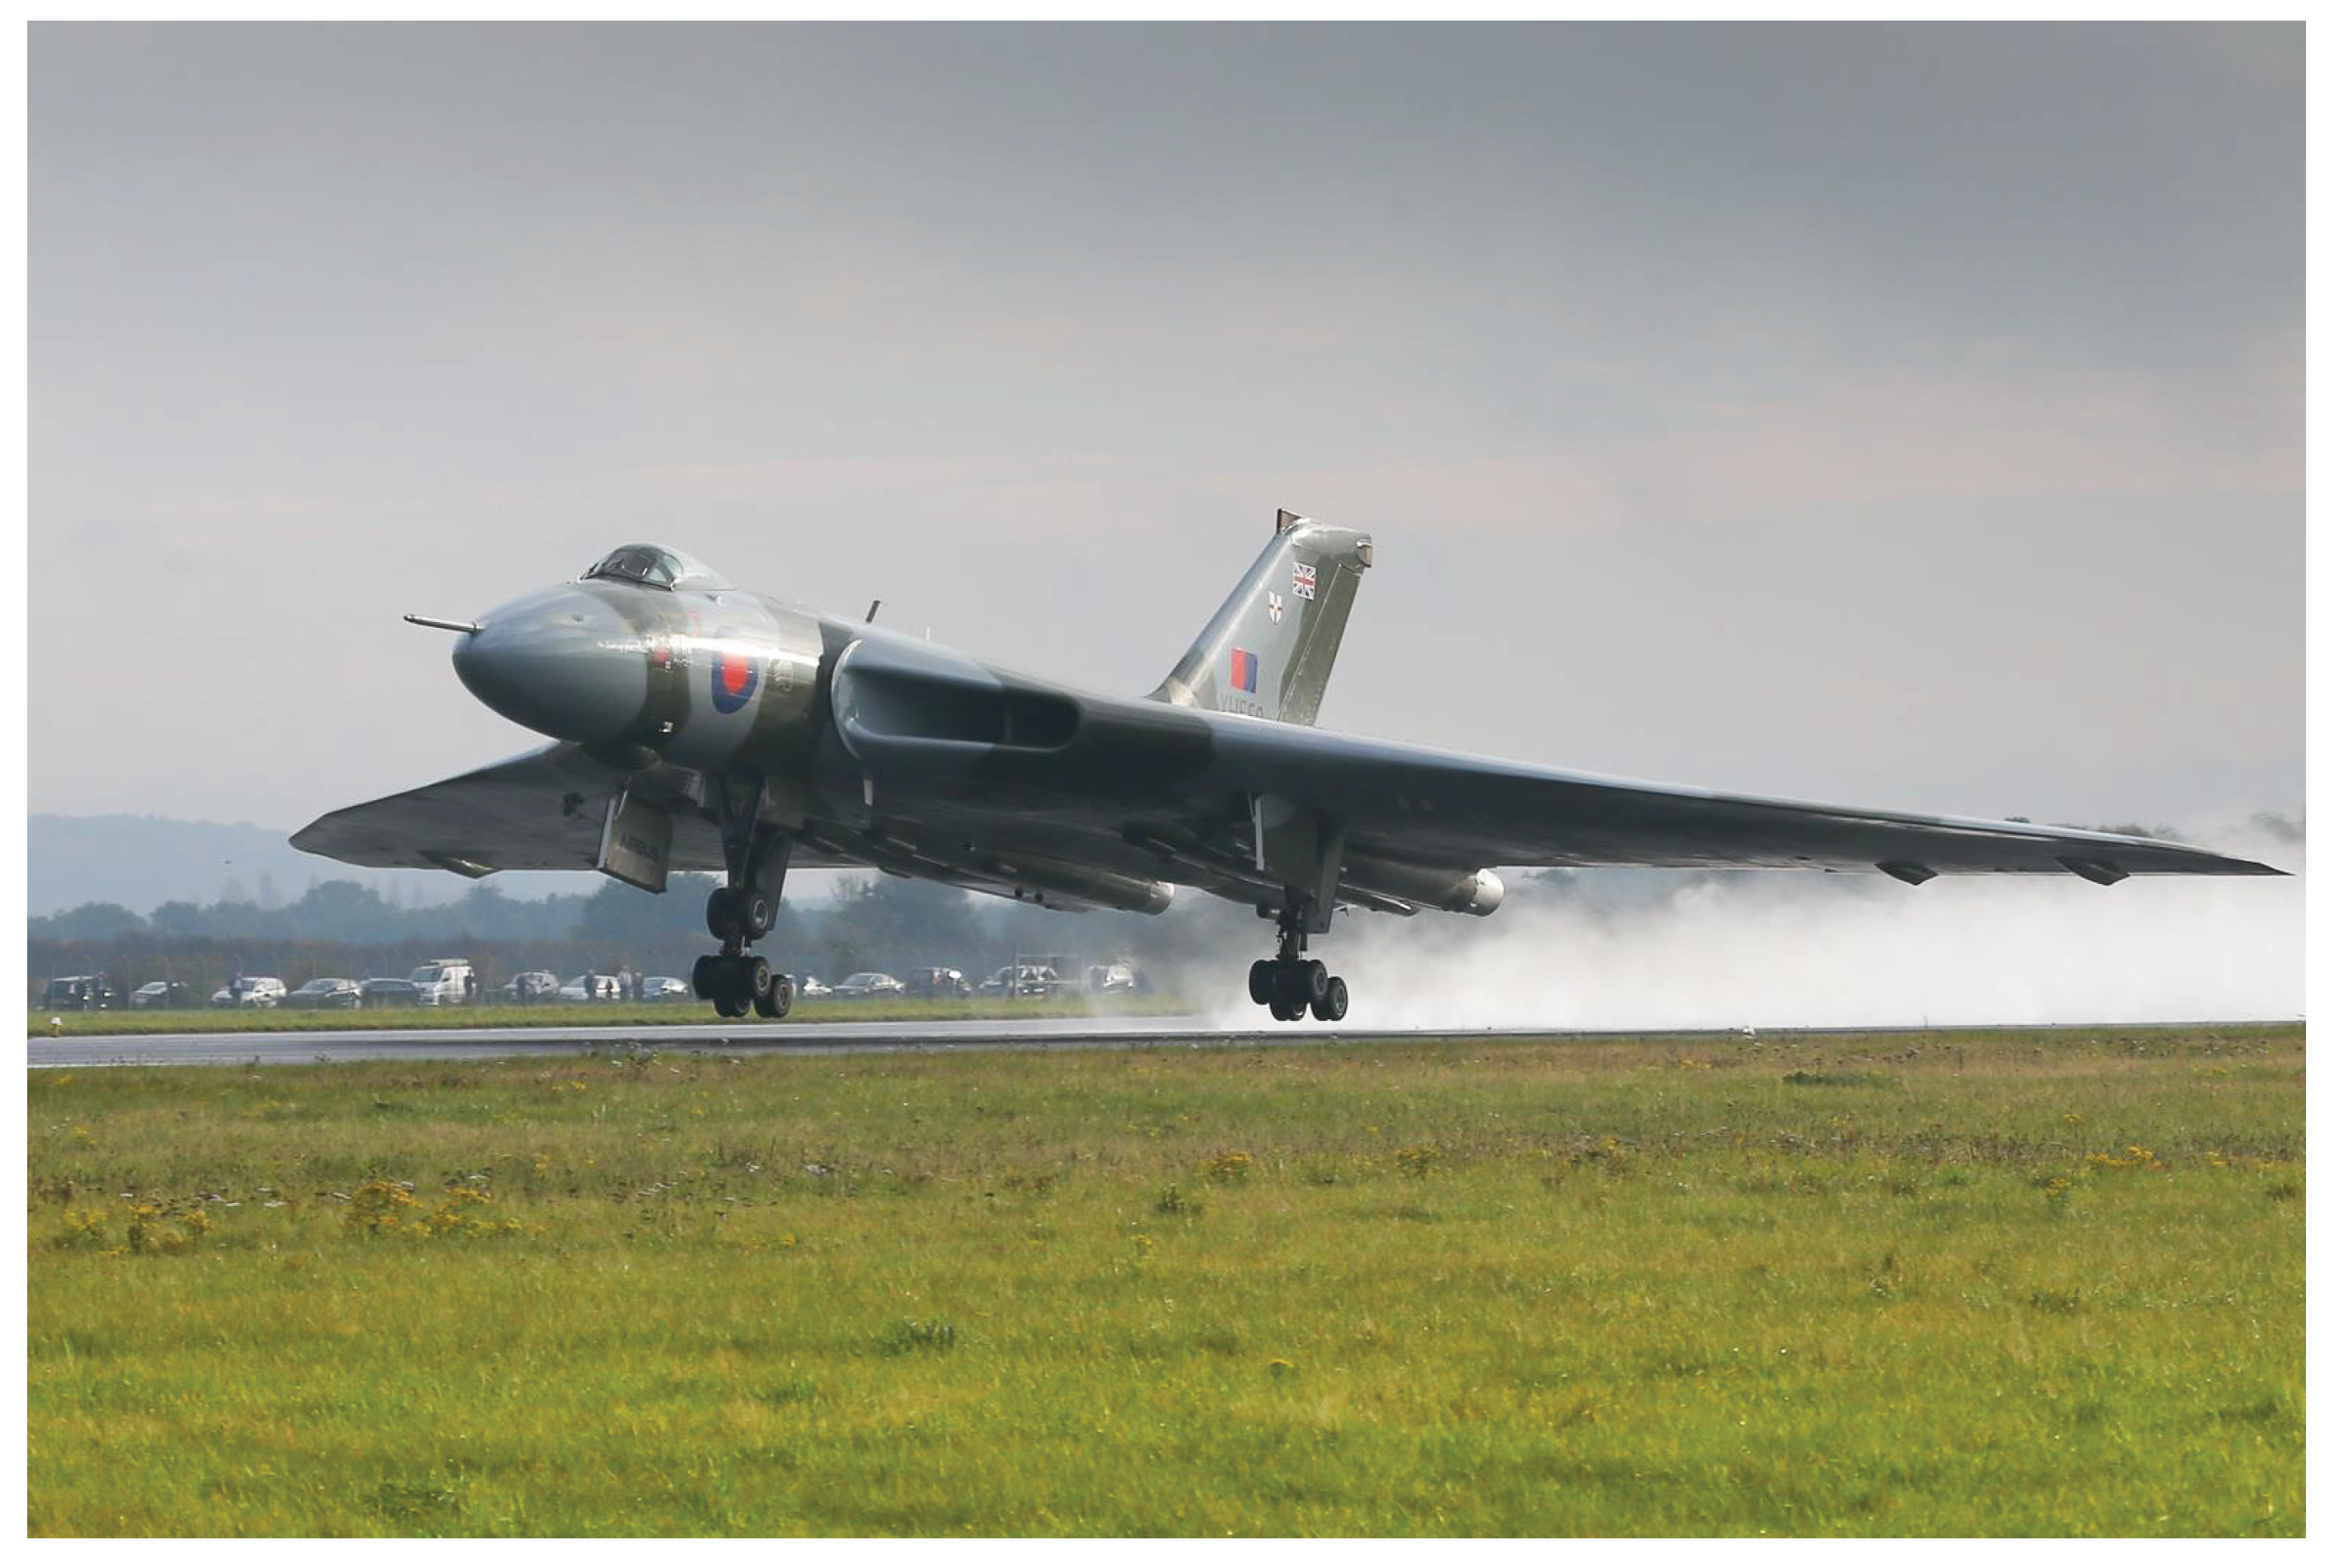
Figure 2.
NACA ventilation duct on a DA40NG wing [22].
Figure 2.
NACA ventilation duct on a DA40NG wing [22].
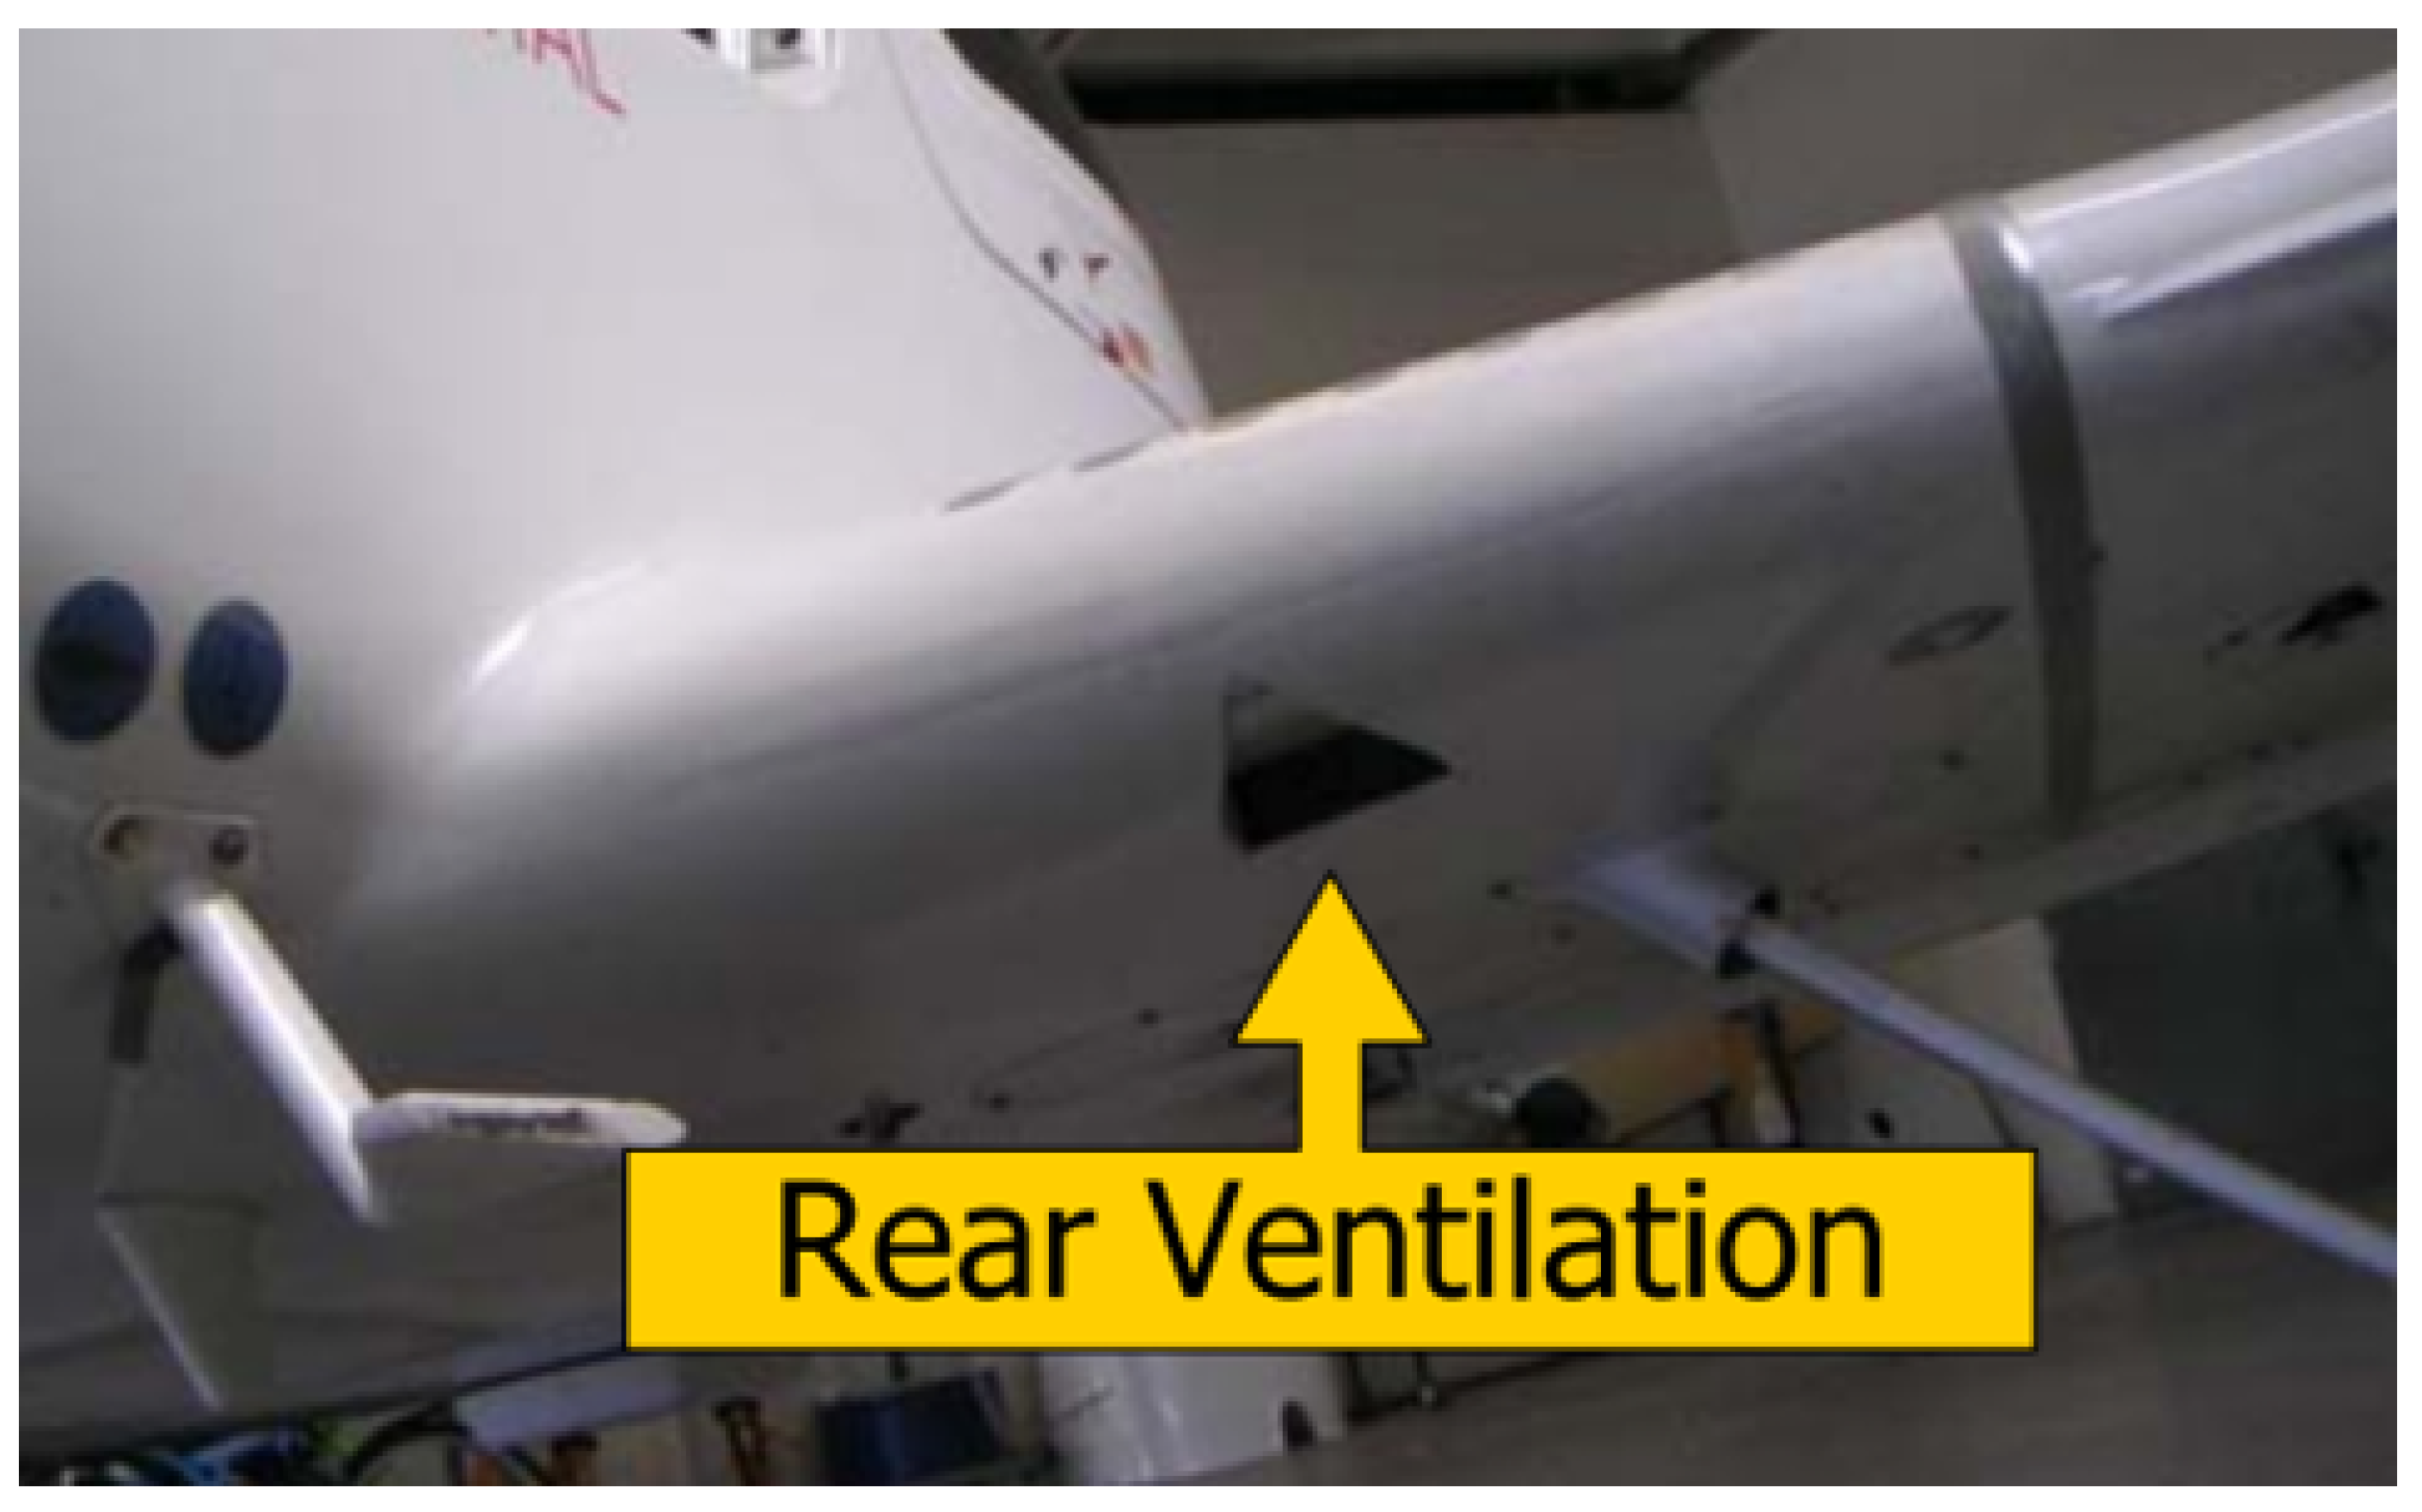
Figure 3.
Validation of CD and L/D against experimental GA(W)-2 aerofoil (Re ).
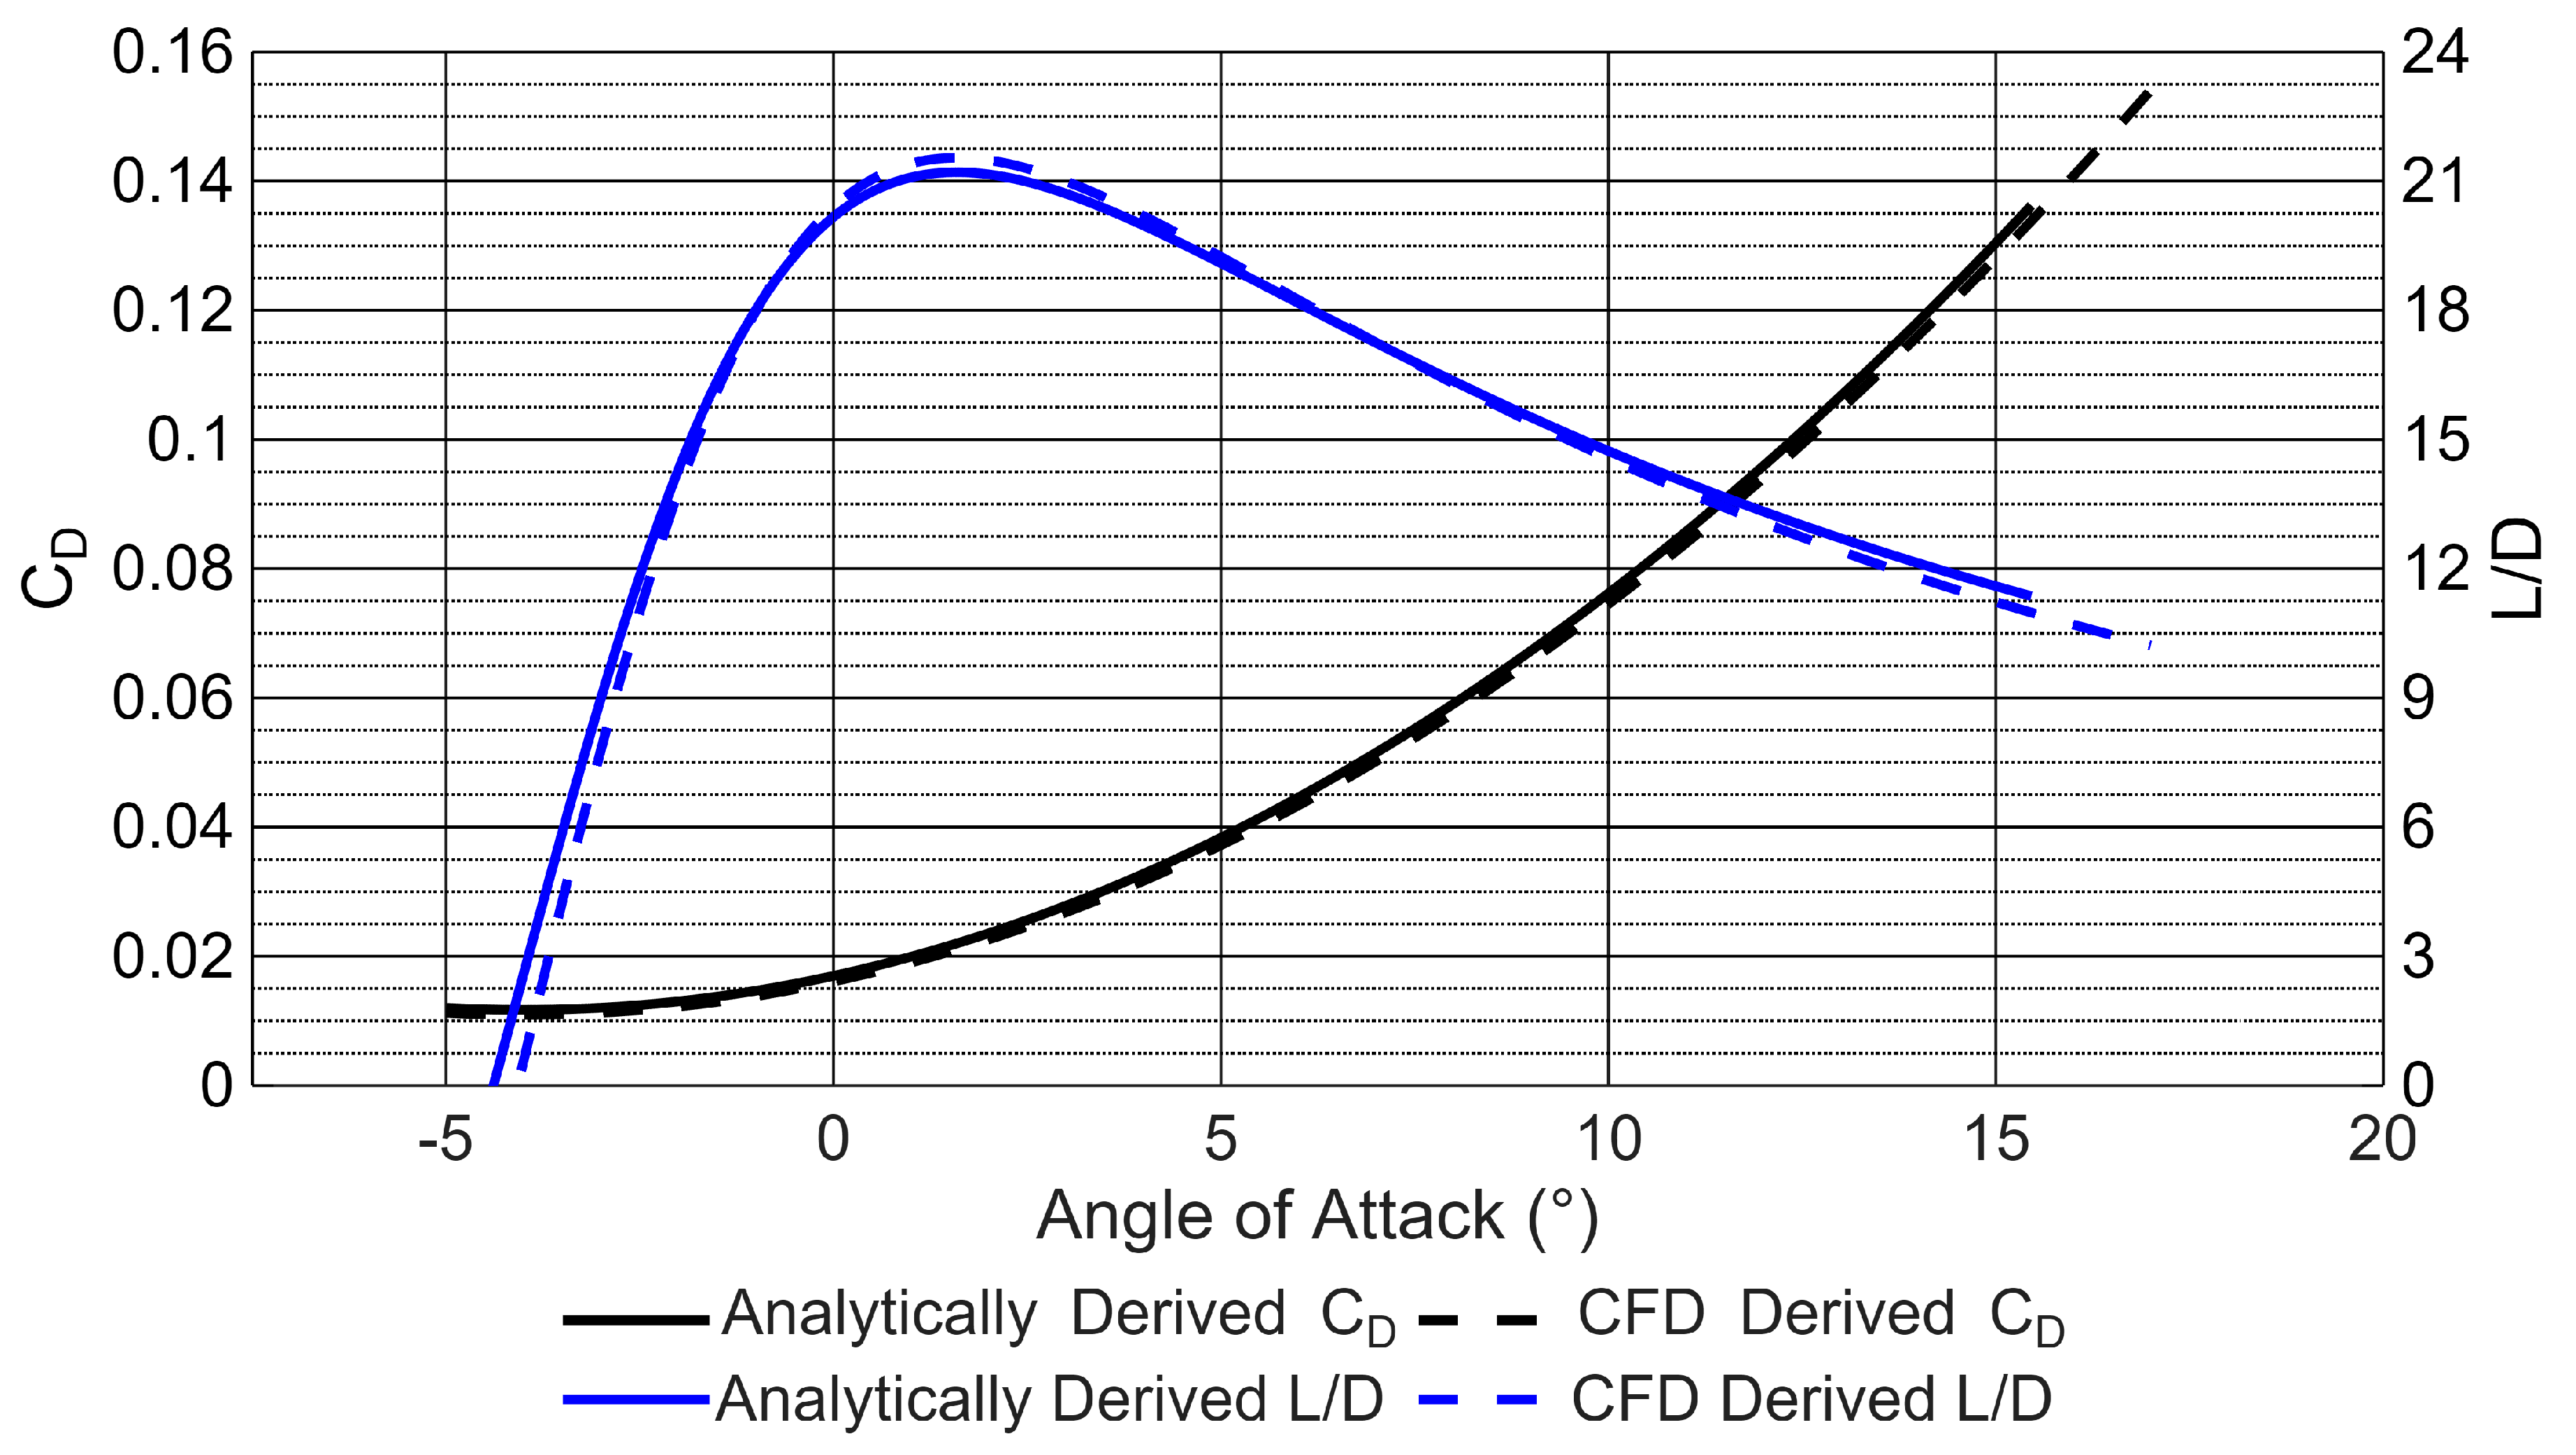
Figure 4.
Validation of CL and CM against experimental GA(W)-2 aerofoil (Re ).
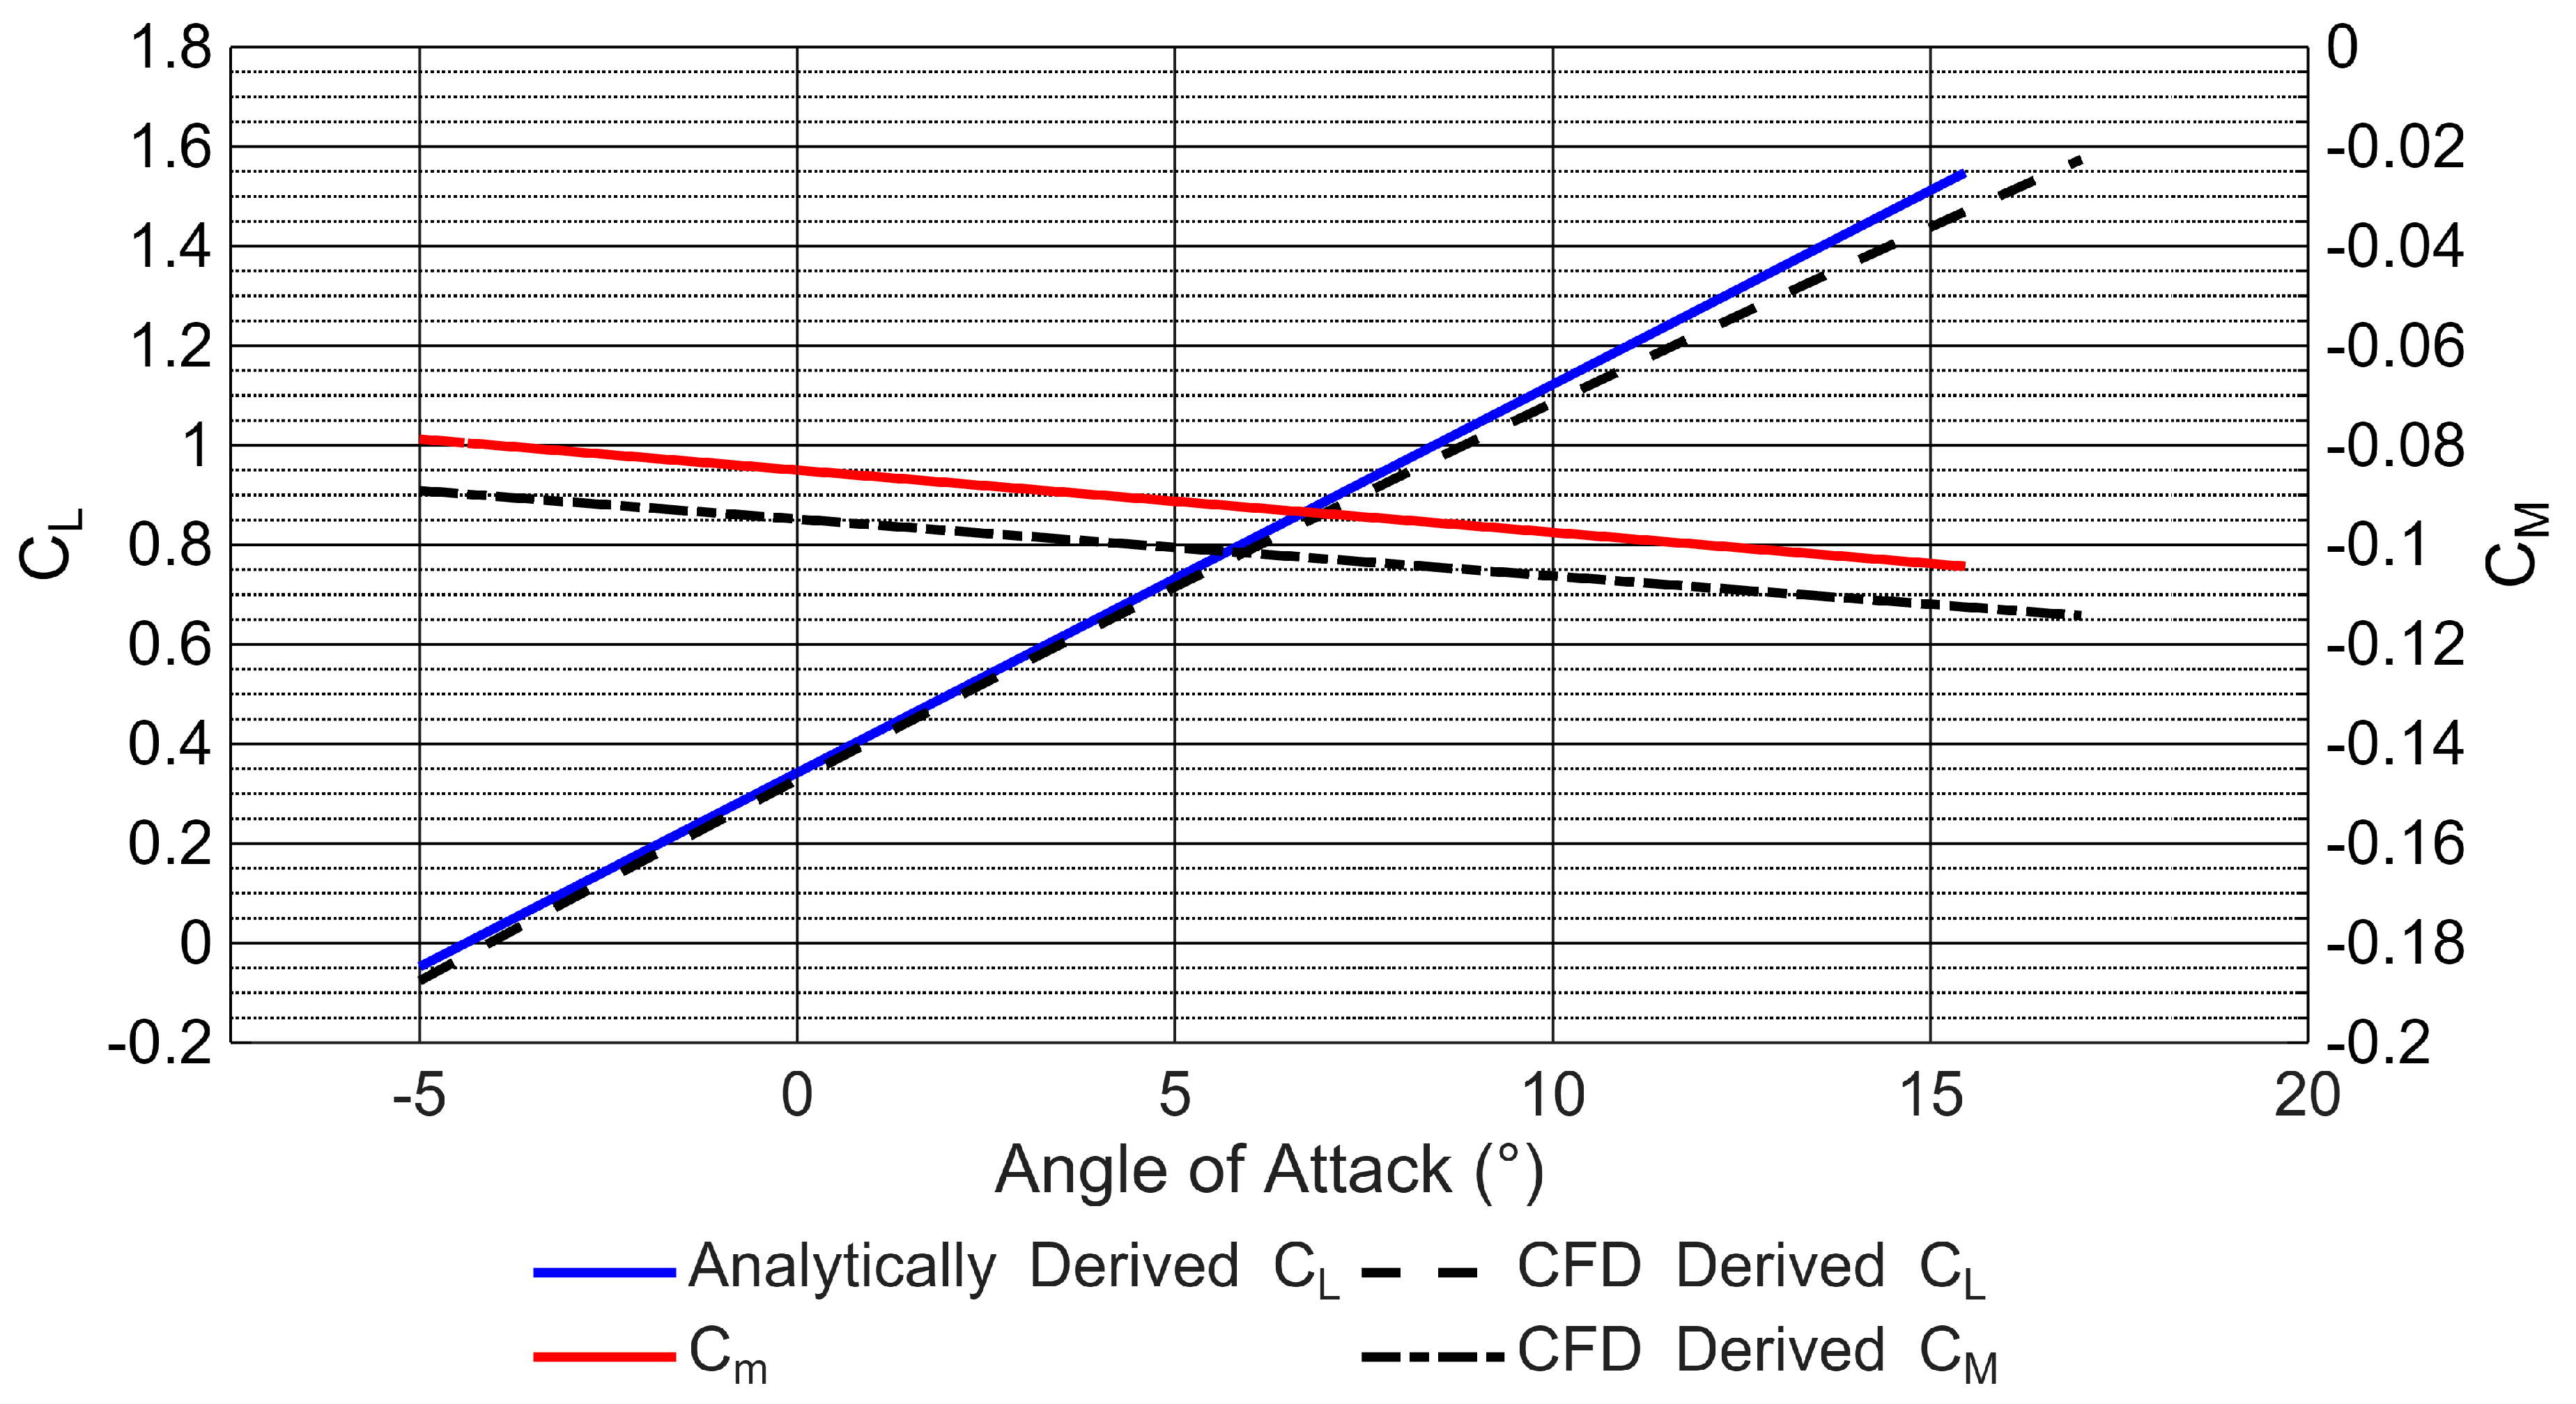
Figure 5.
CFD derived CL and CM for the baseline wing.
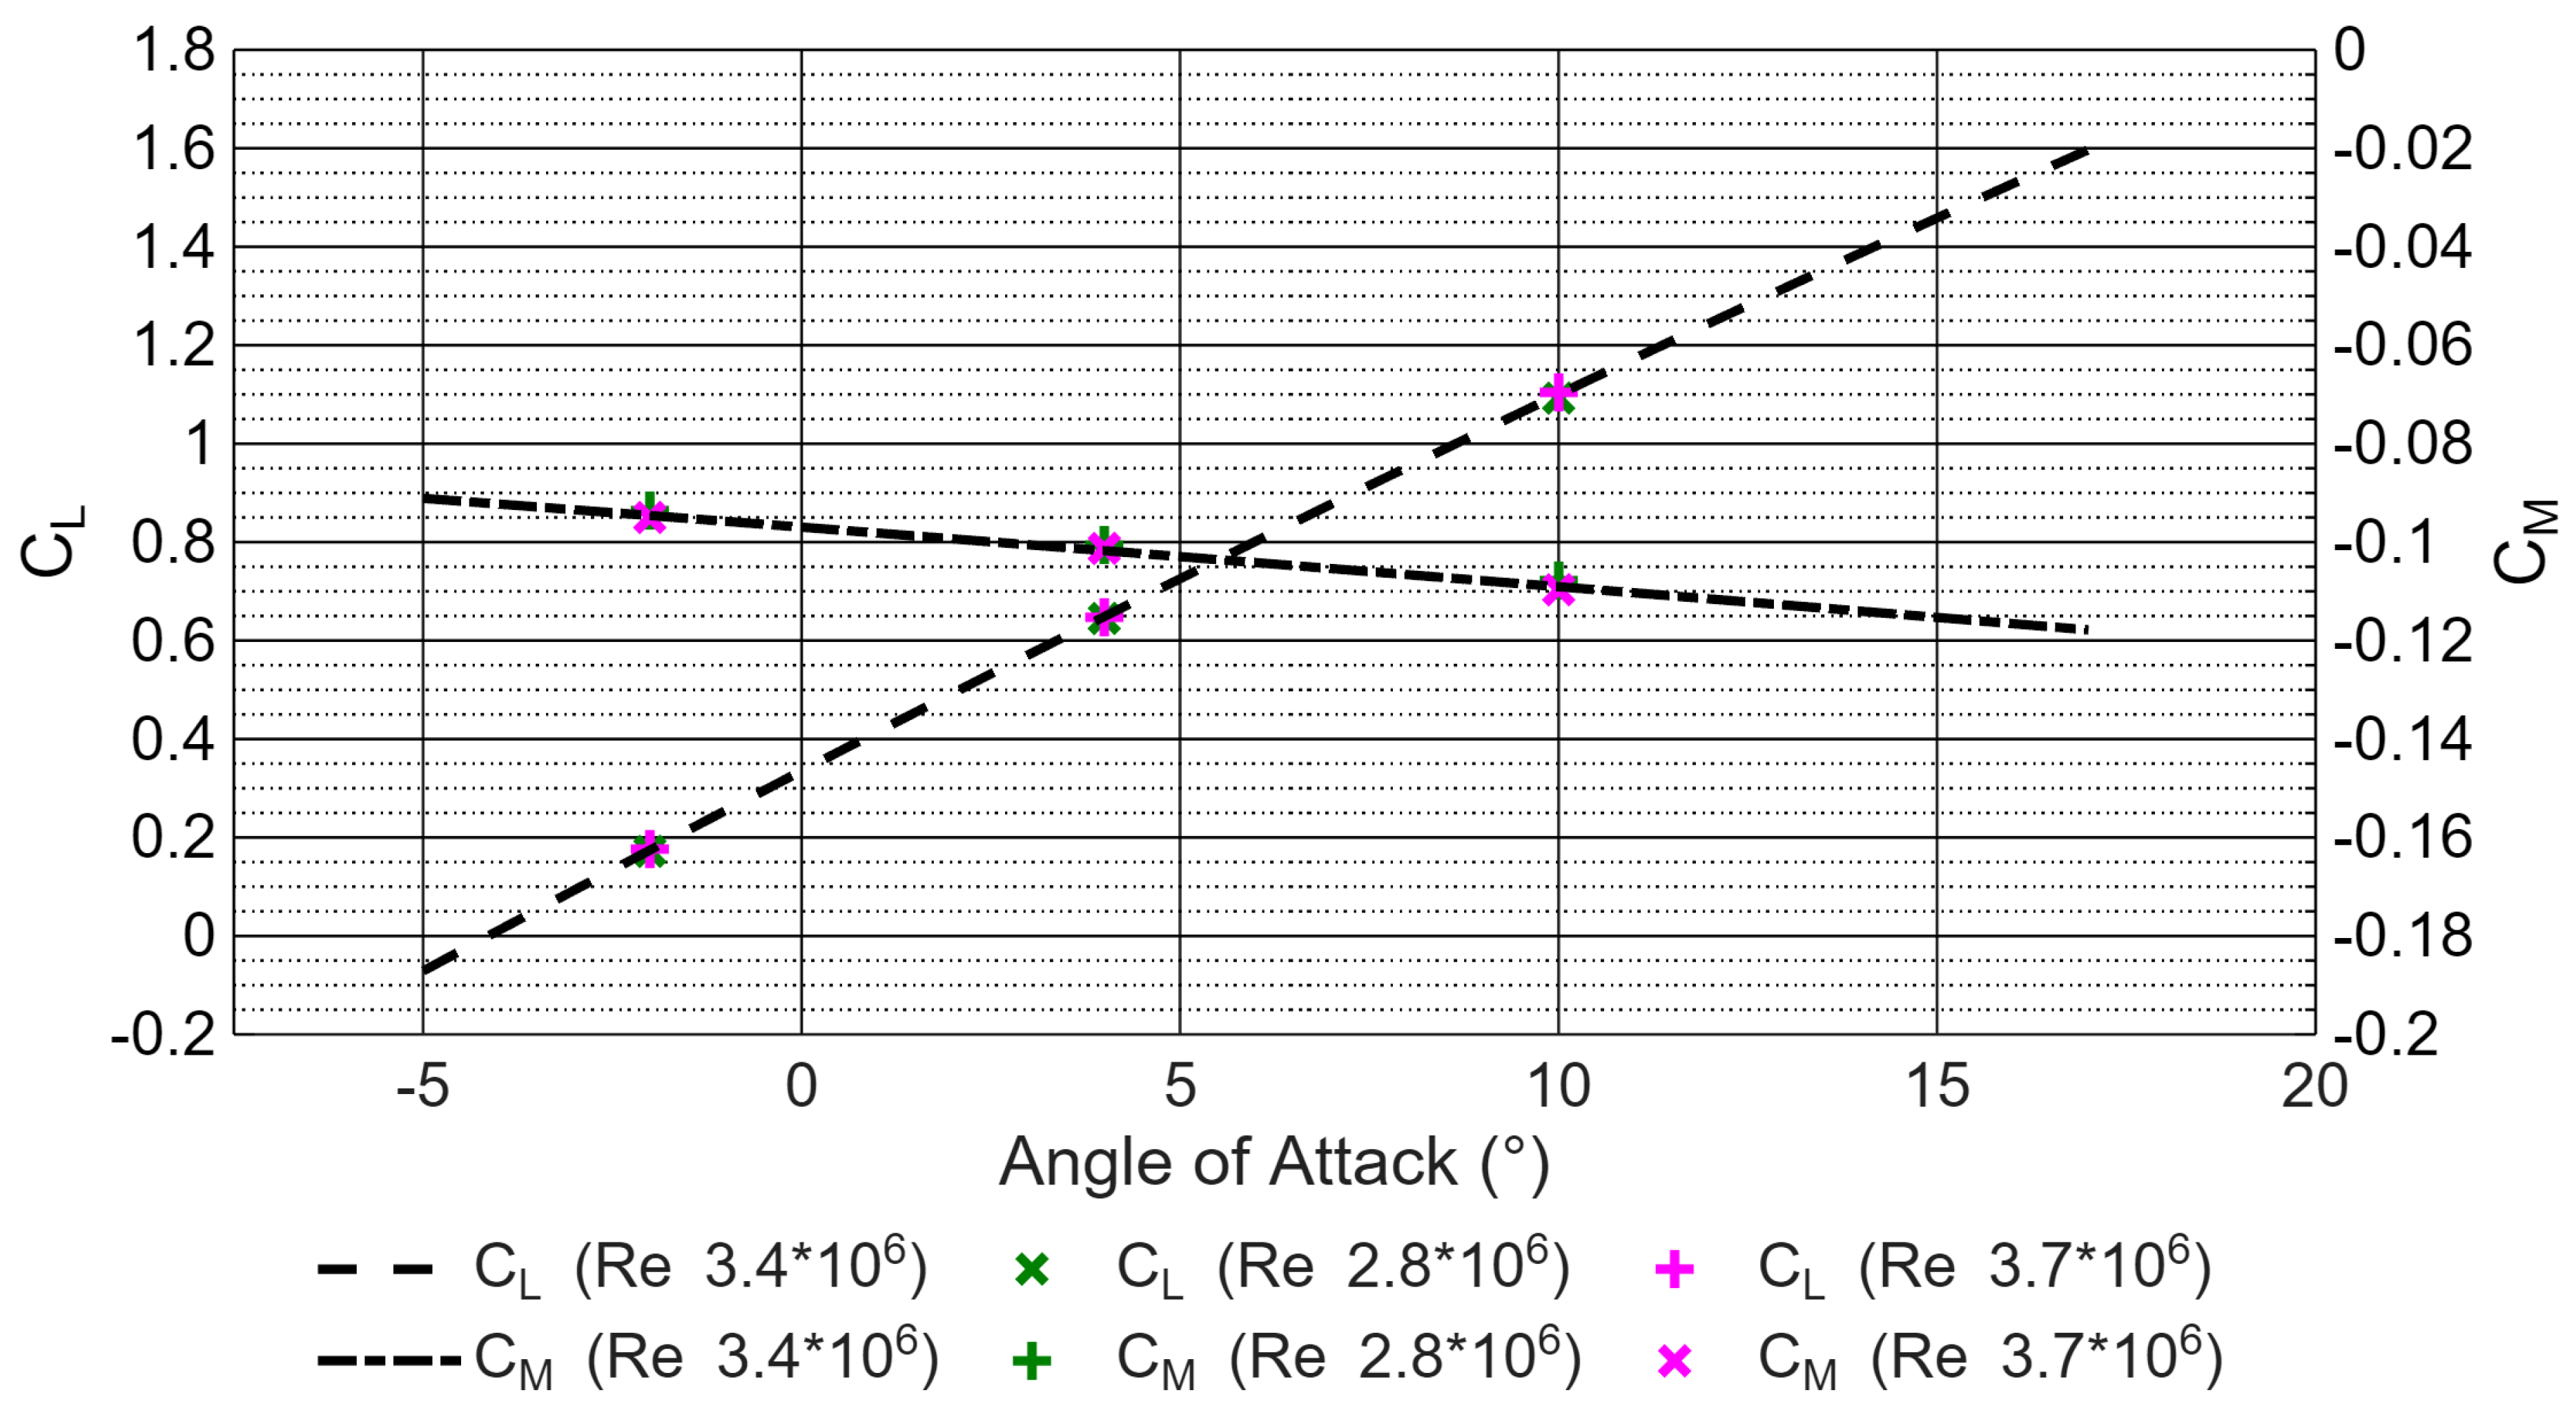
Figure 6.
CFD derived CD and L/D for the baseline wing.
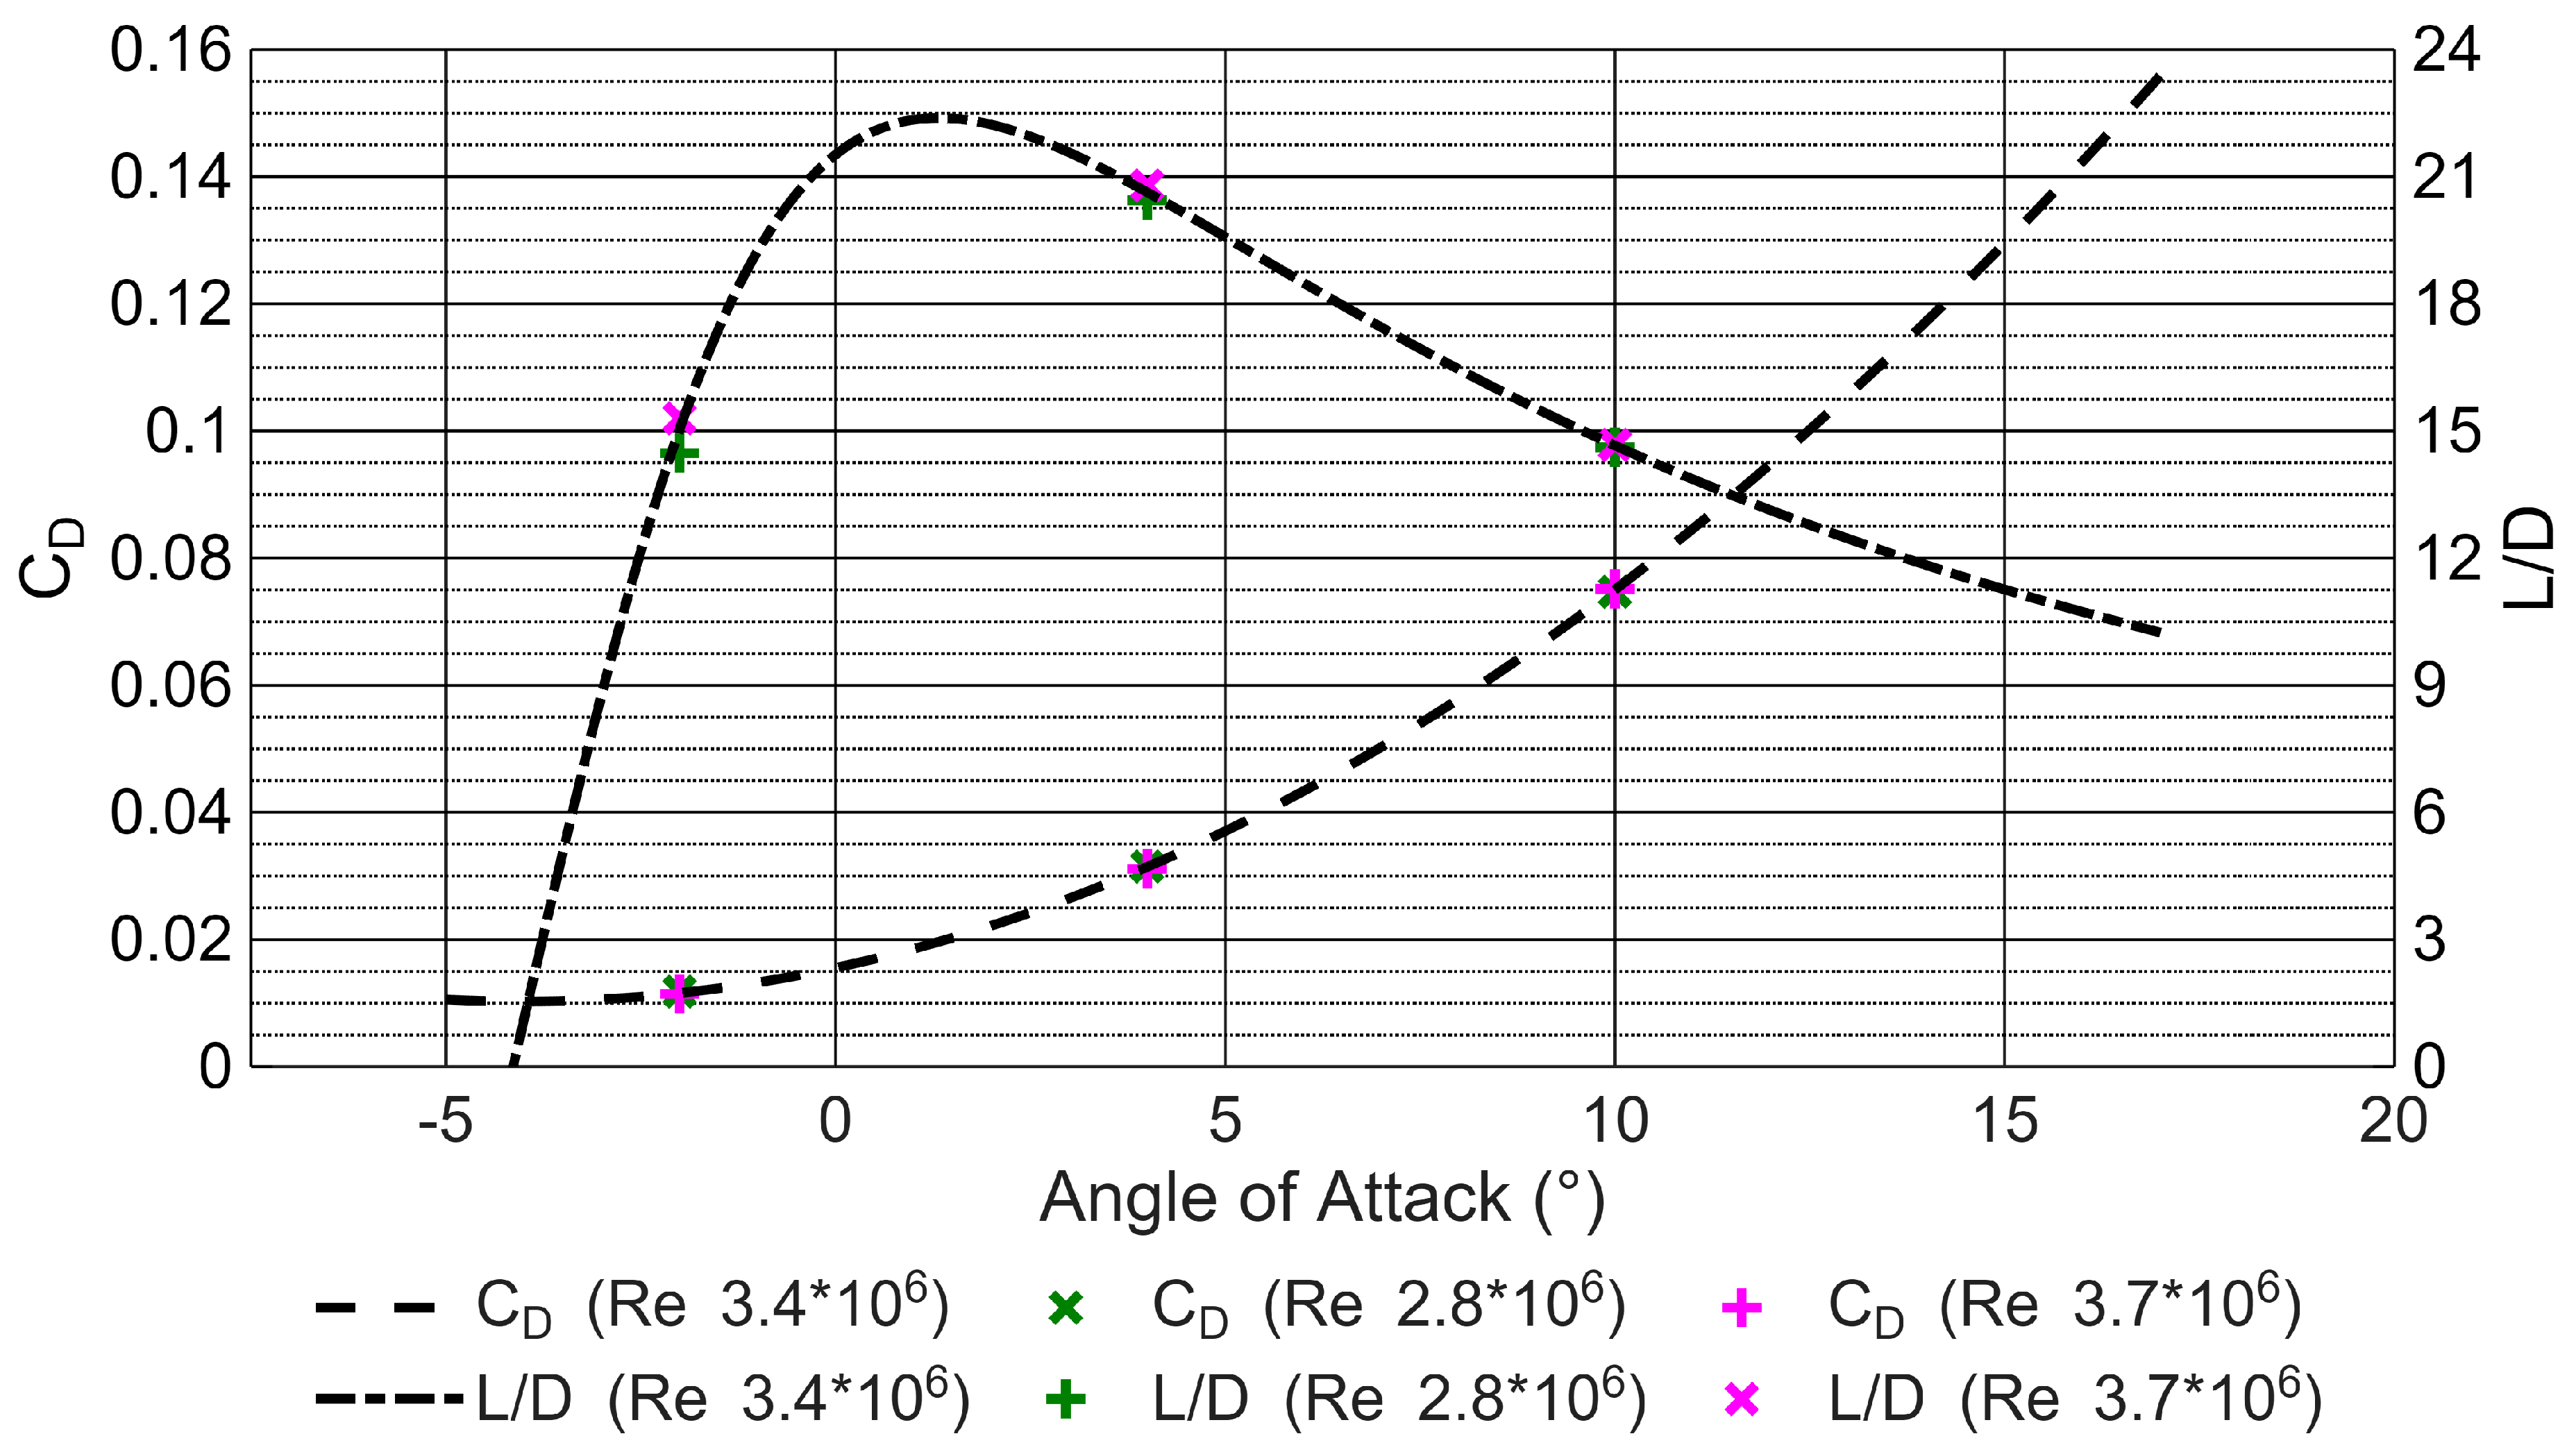
Figure 7.
NACA ducts on the upper surface of the wing- Case number 9.
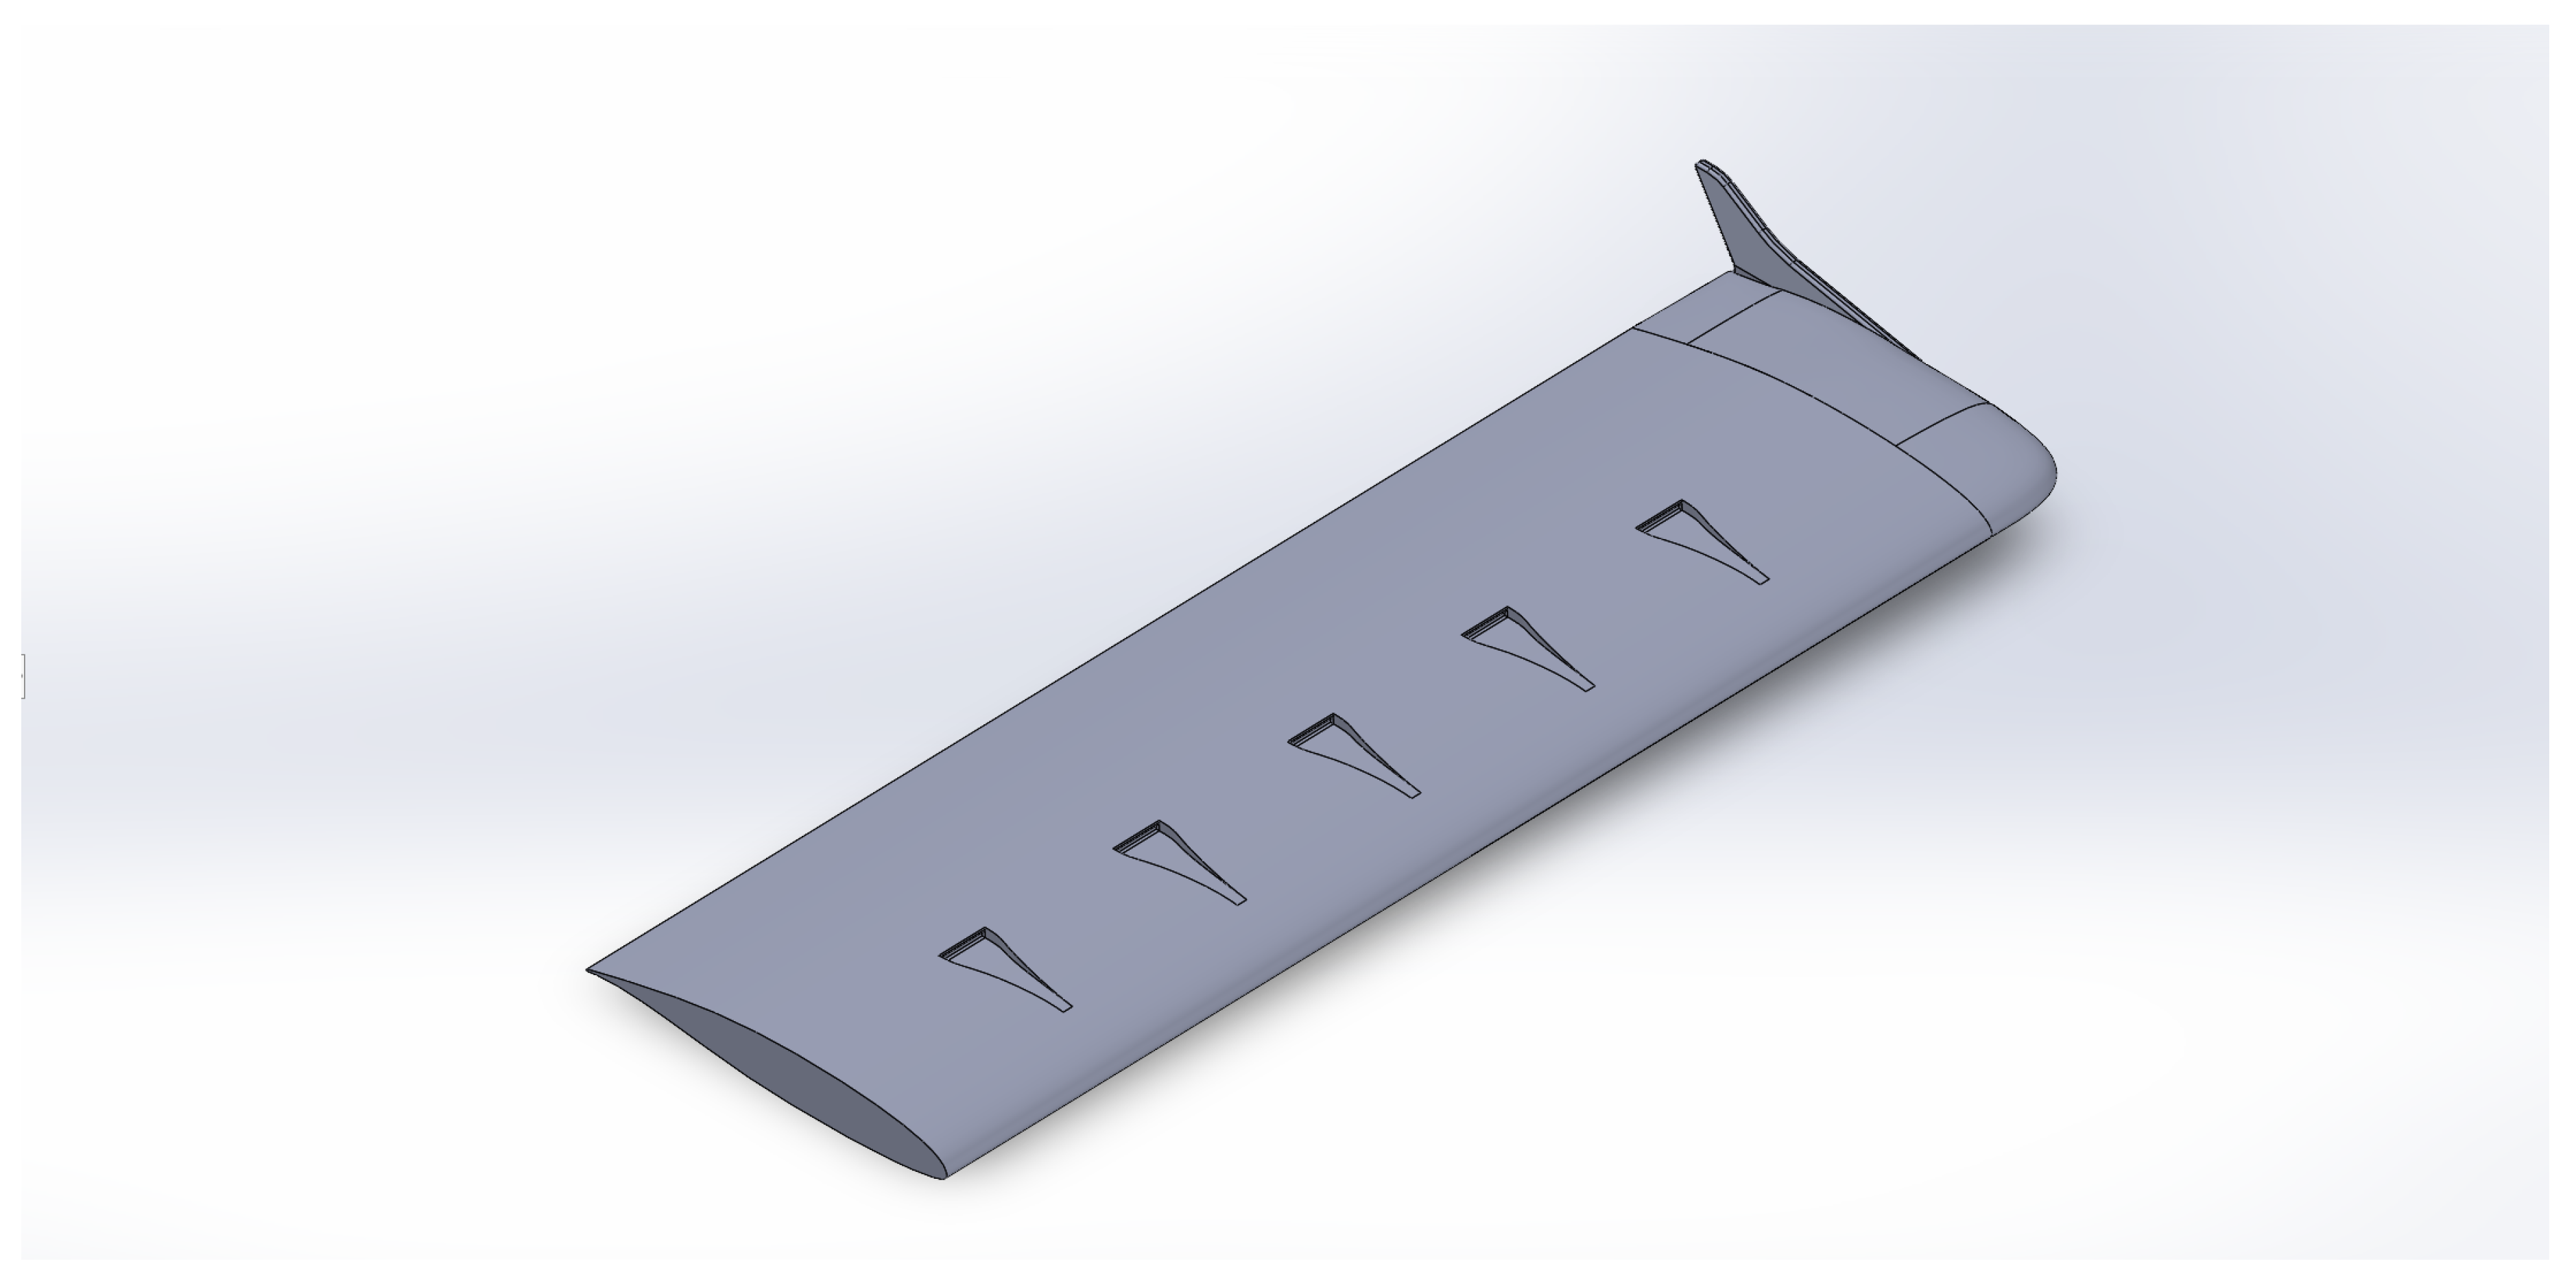
Figure 8.
Wing leading edge inlets- Case number 10.
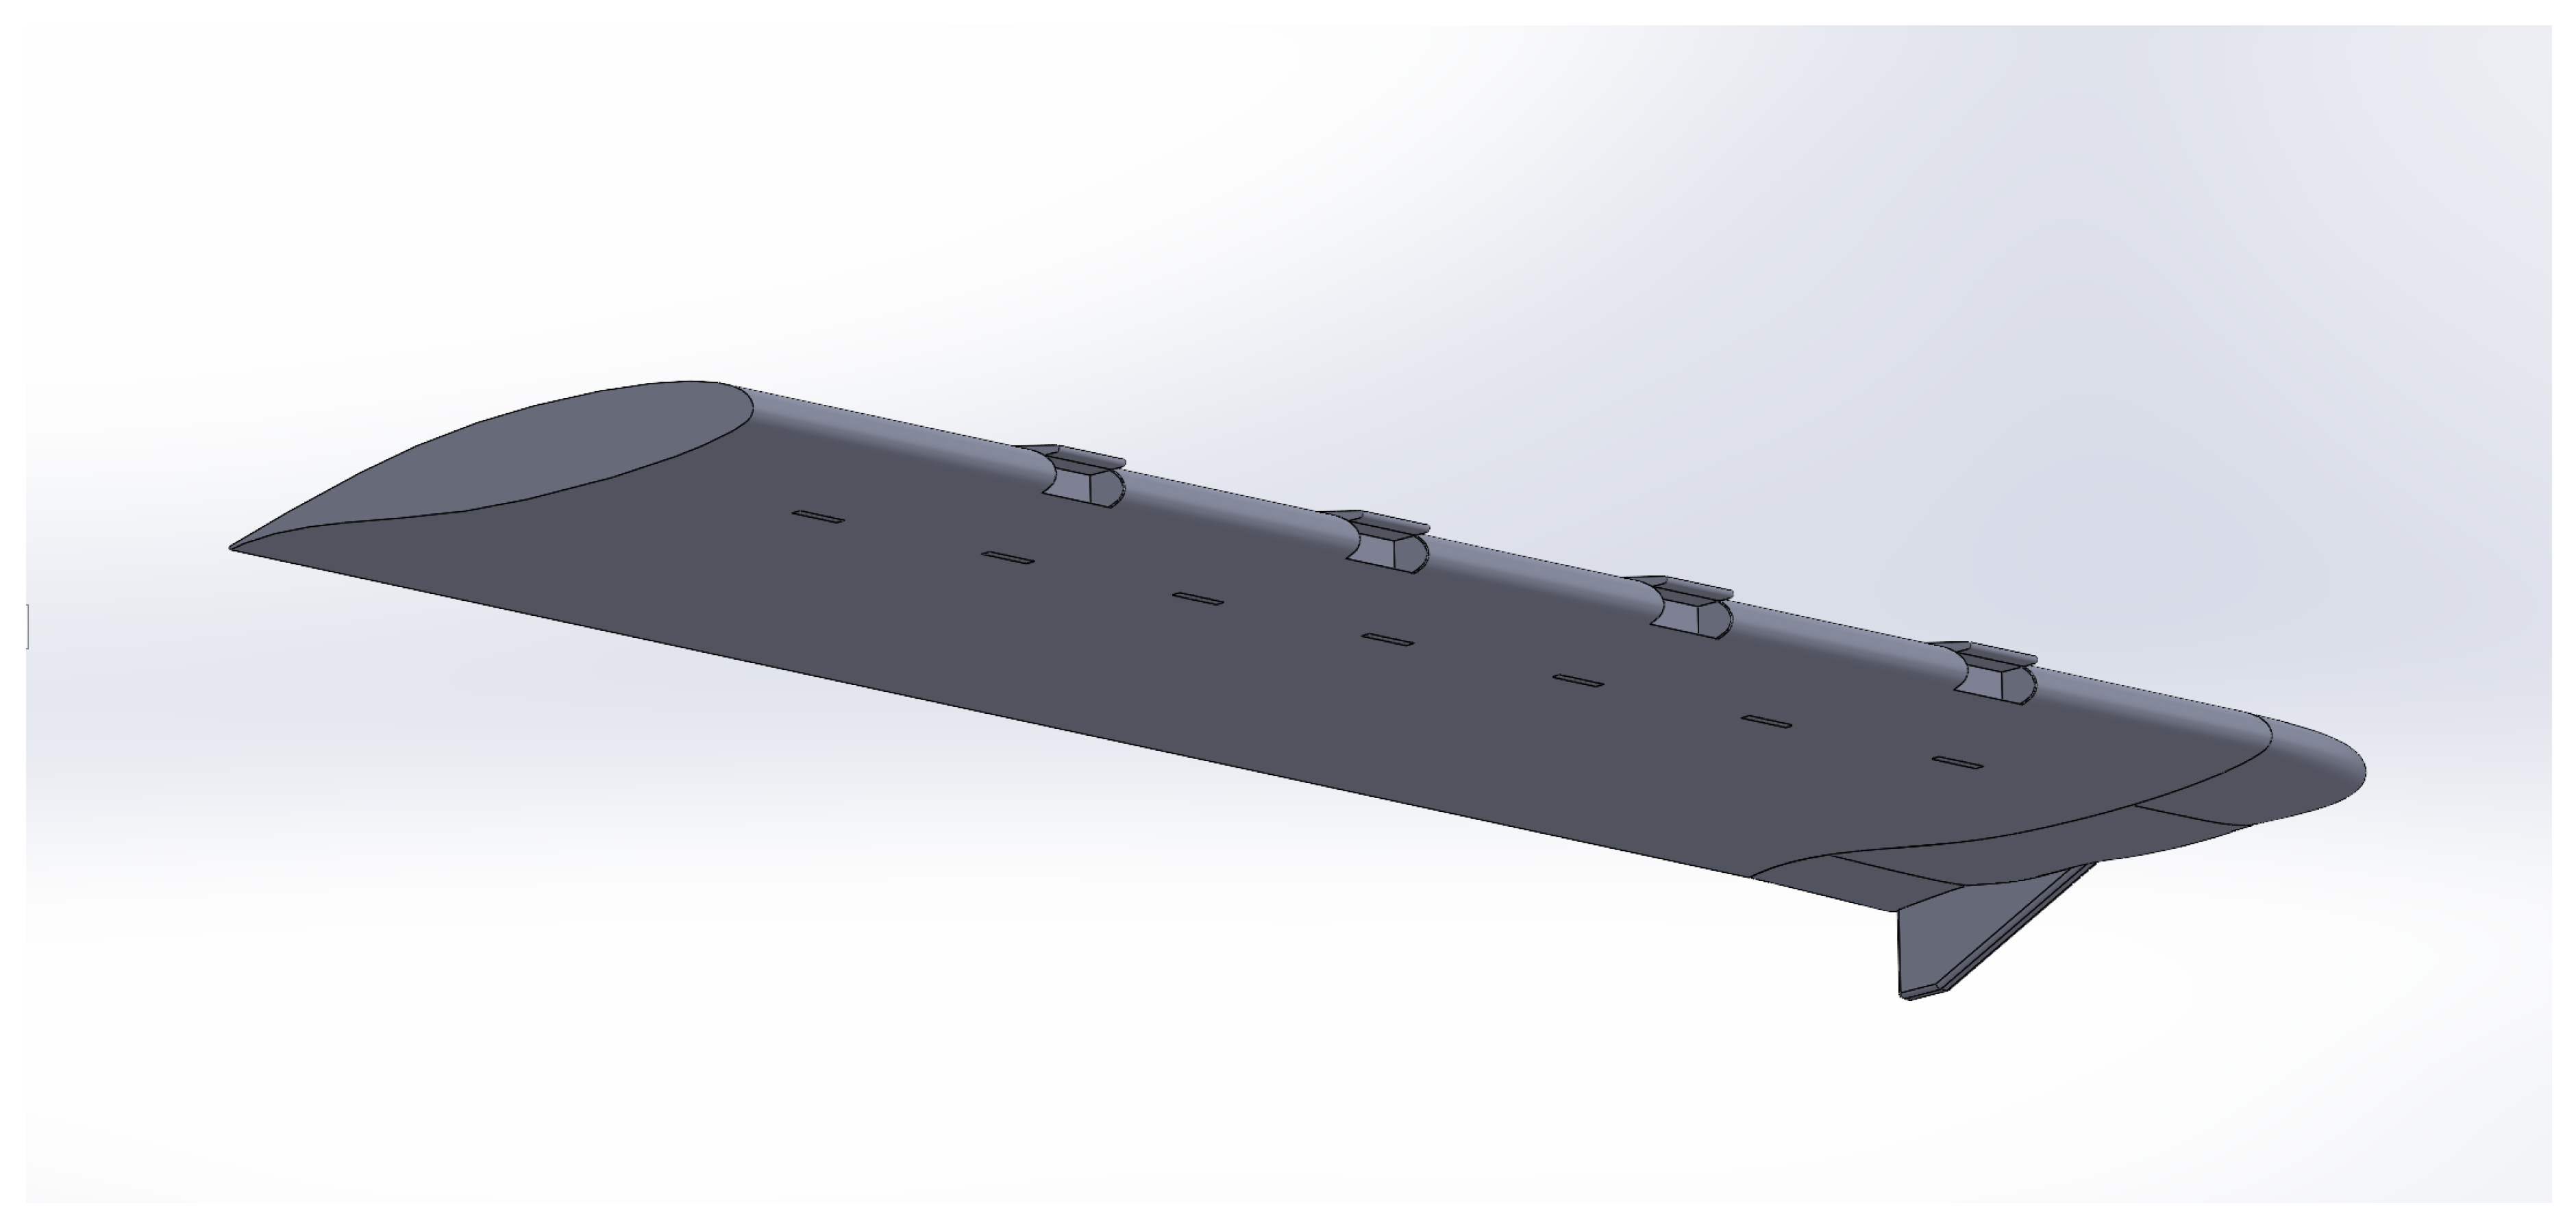
Figure 9.
Impact of the number of inlets and outlets on L/D. Note: Based on a wing with four NACA inlet ducts of R5-WD5-CW15, with a width of 10 cm, on the lower wing surface and four outlets also on the lower surface flying at an angle of attack of 4.38° and Reynolds number of 3.284 × 10⁶.
Figure 9.
Impact of the number of inlets and outlets on L/D. Note: Based on a wing with four NACA inlet ducts of R5-WD5-CW15, with a width of 10 cm, on the lower wing surface and four outlets also on the lower surface flying at an angle of attack of 4.38° and Reynolds number of 3.284 × 10⁶.
Figure 10.
Surface plot of the width-to-depth ratio and ramp angle.
Figure 11.
Streamwise velocity (m/s) of case 3’s inboard inlet.
Figure 12.
Streamwise velocity (m/s) of case 5’s inboard inlet.
Figure 13.
Pressure coefficient of case 3’s inboard inlet.
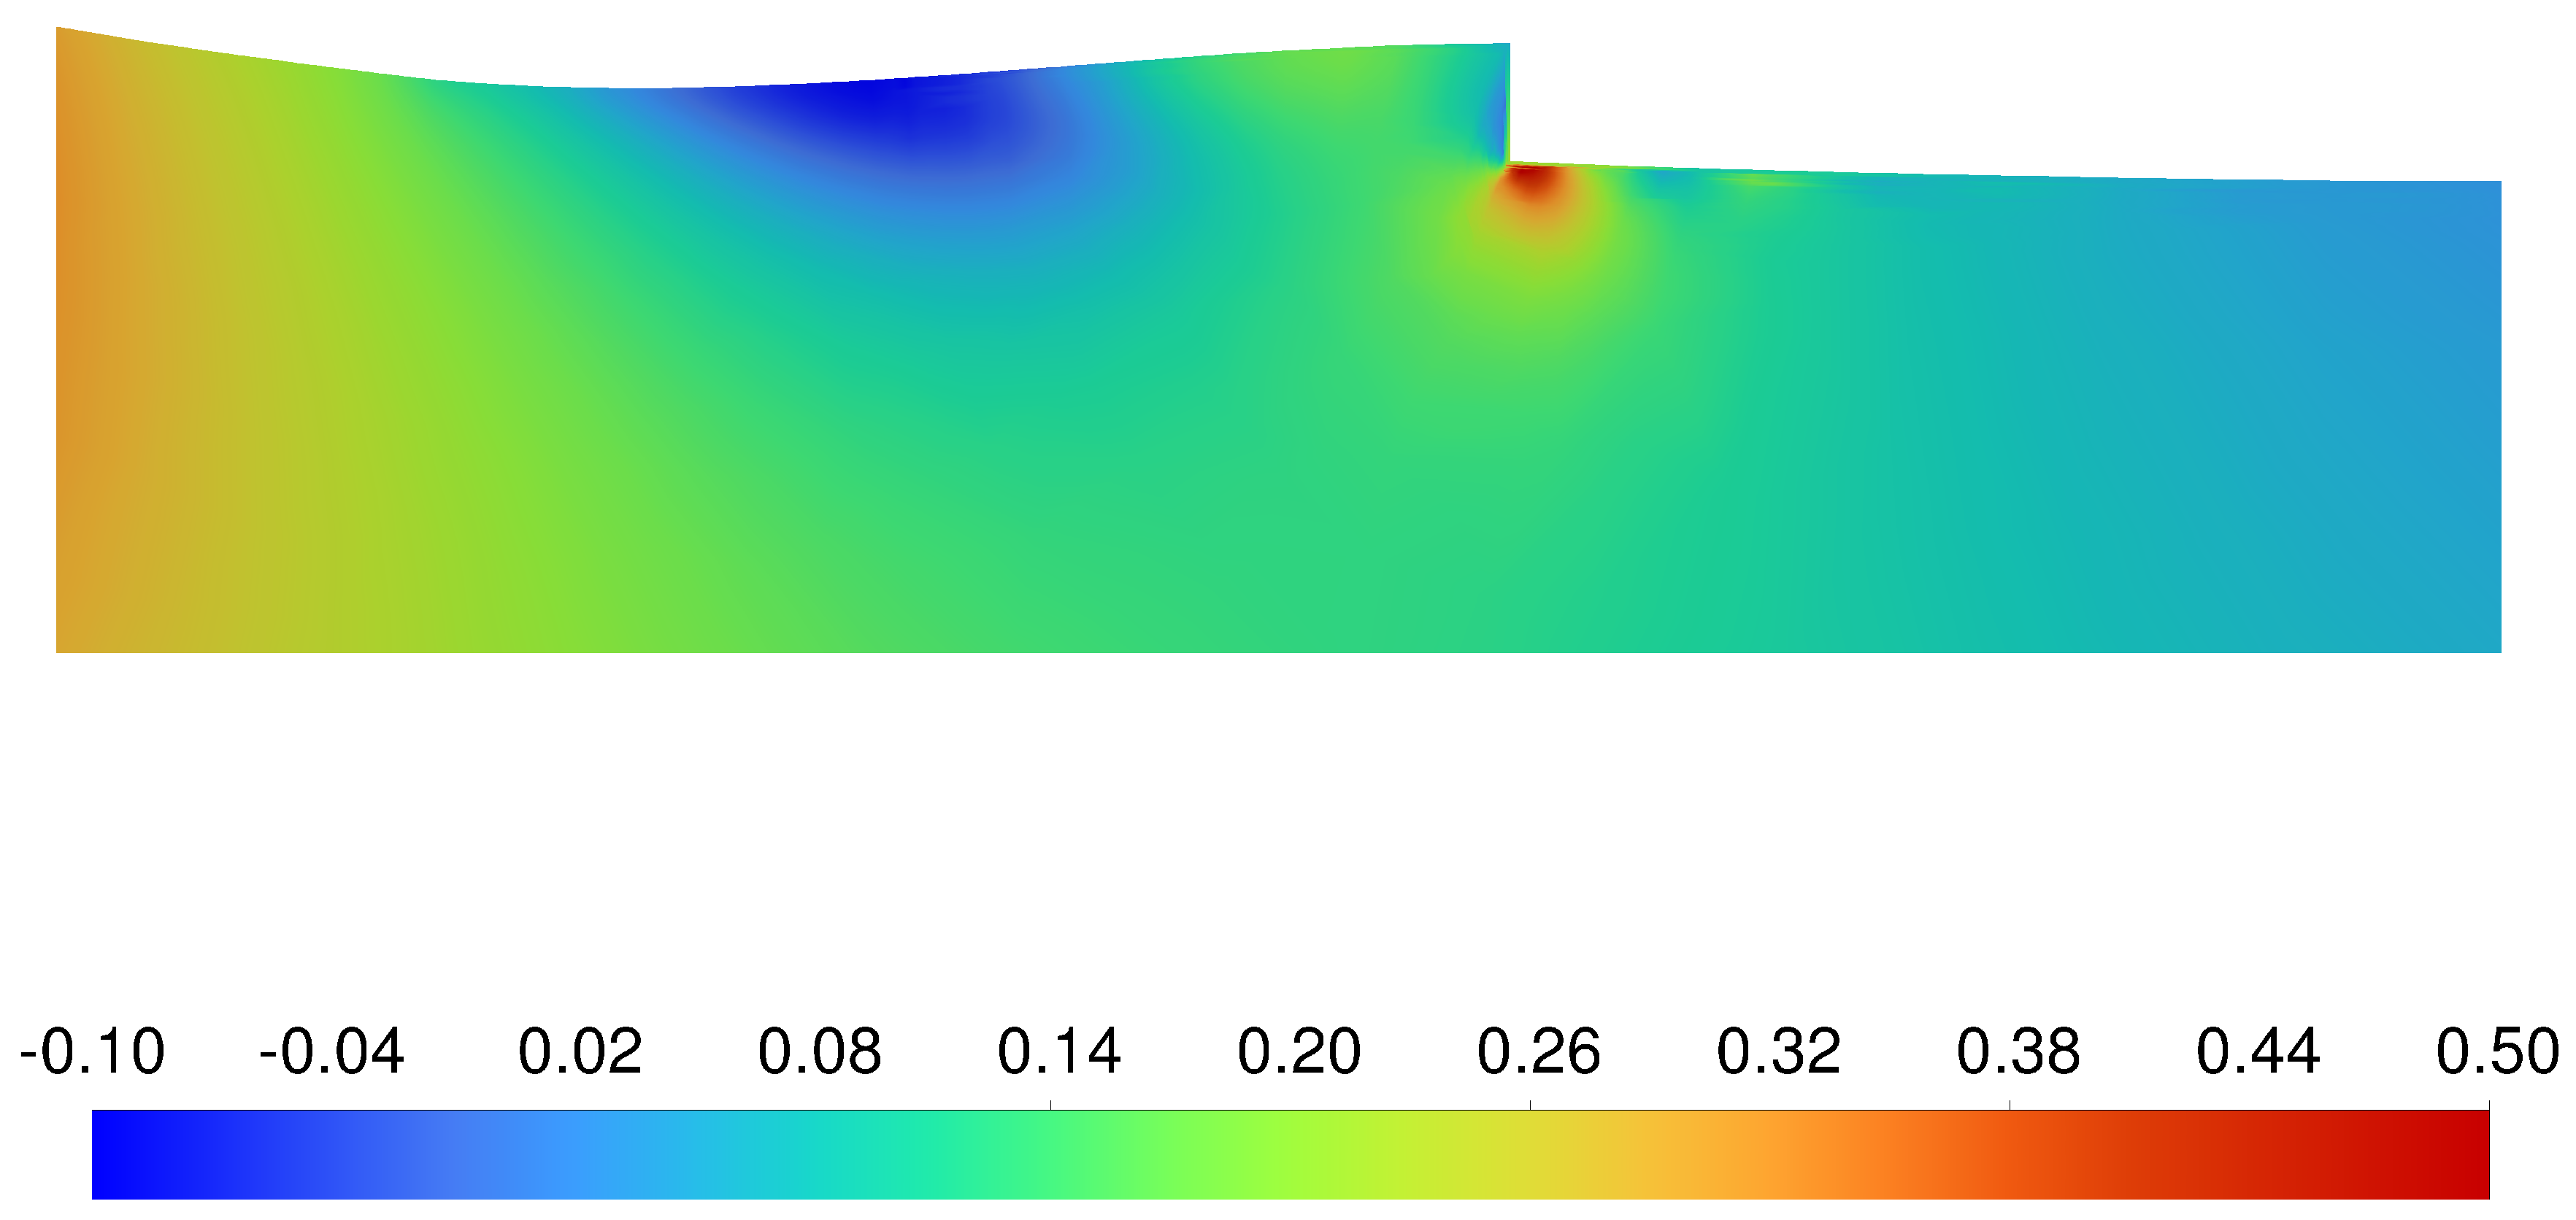
Figure 14.
Pressure coefficient of case 5’s inboard inlet.
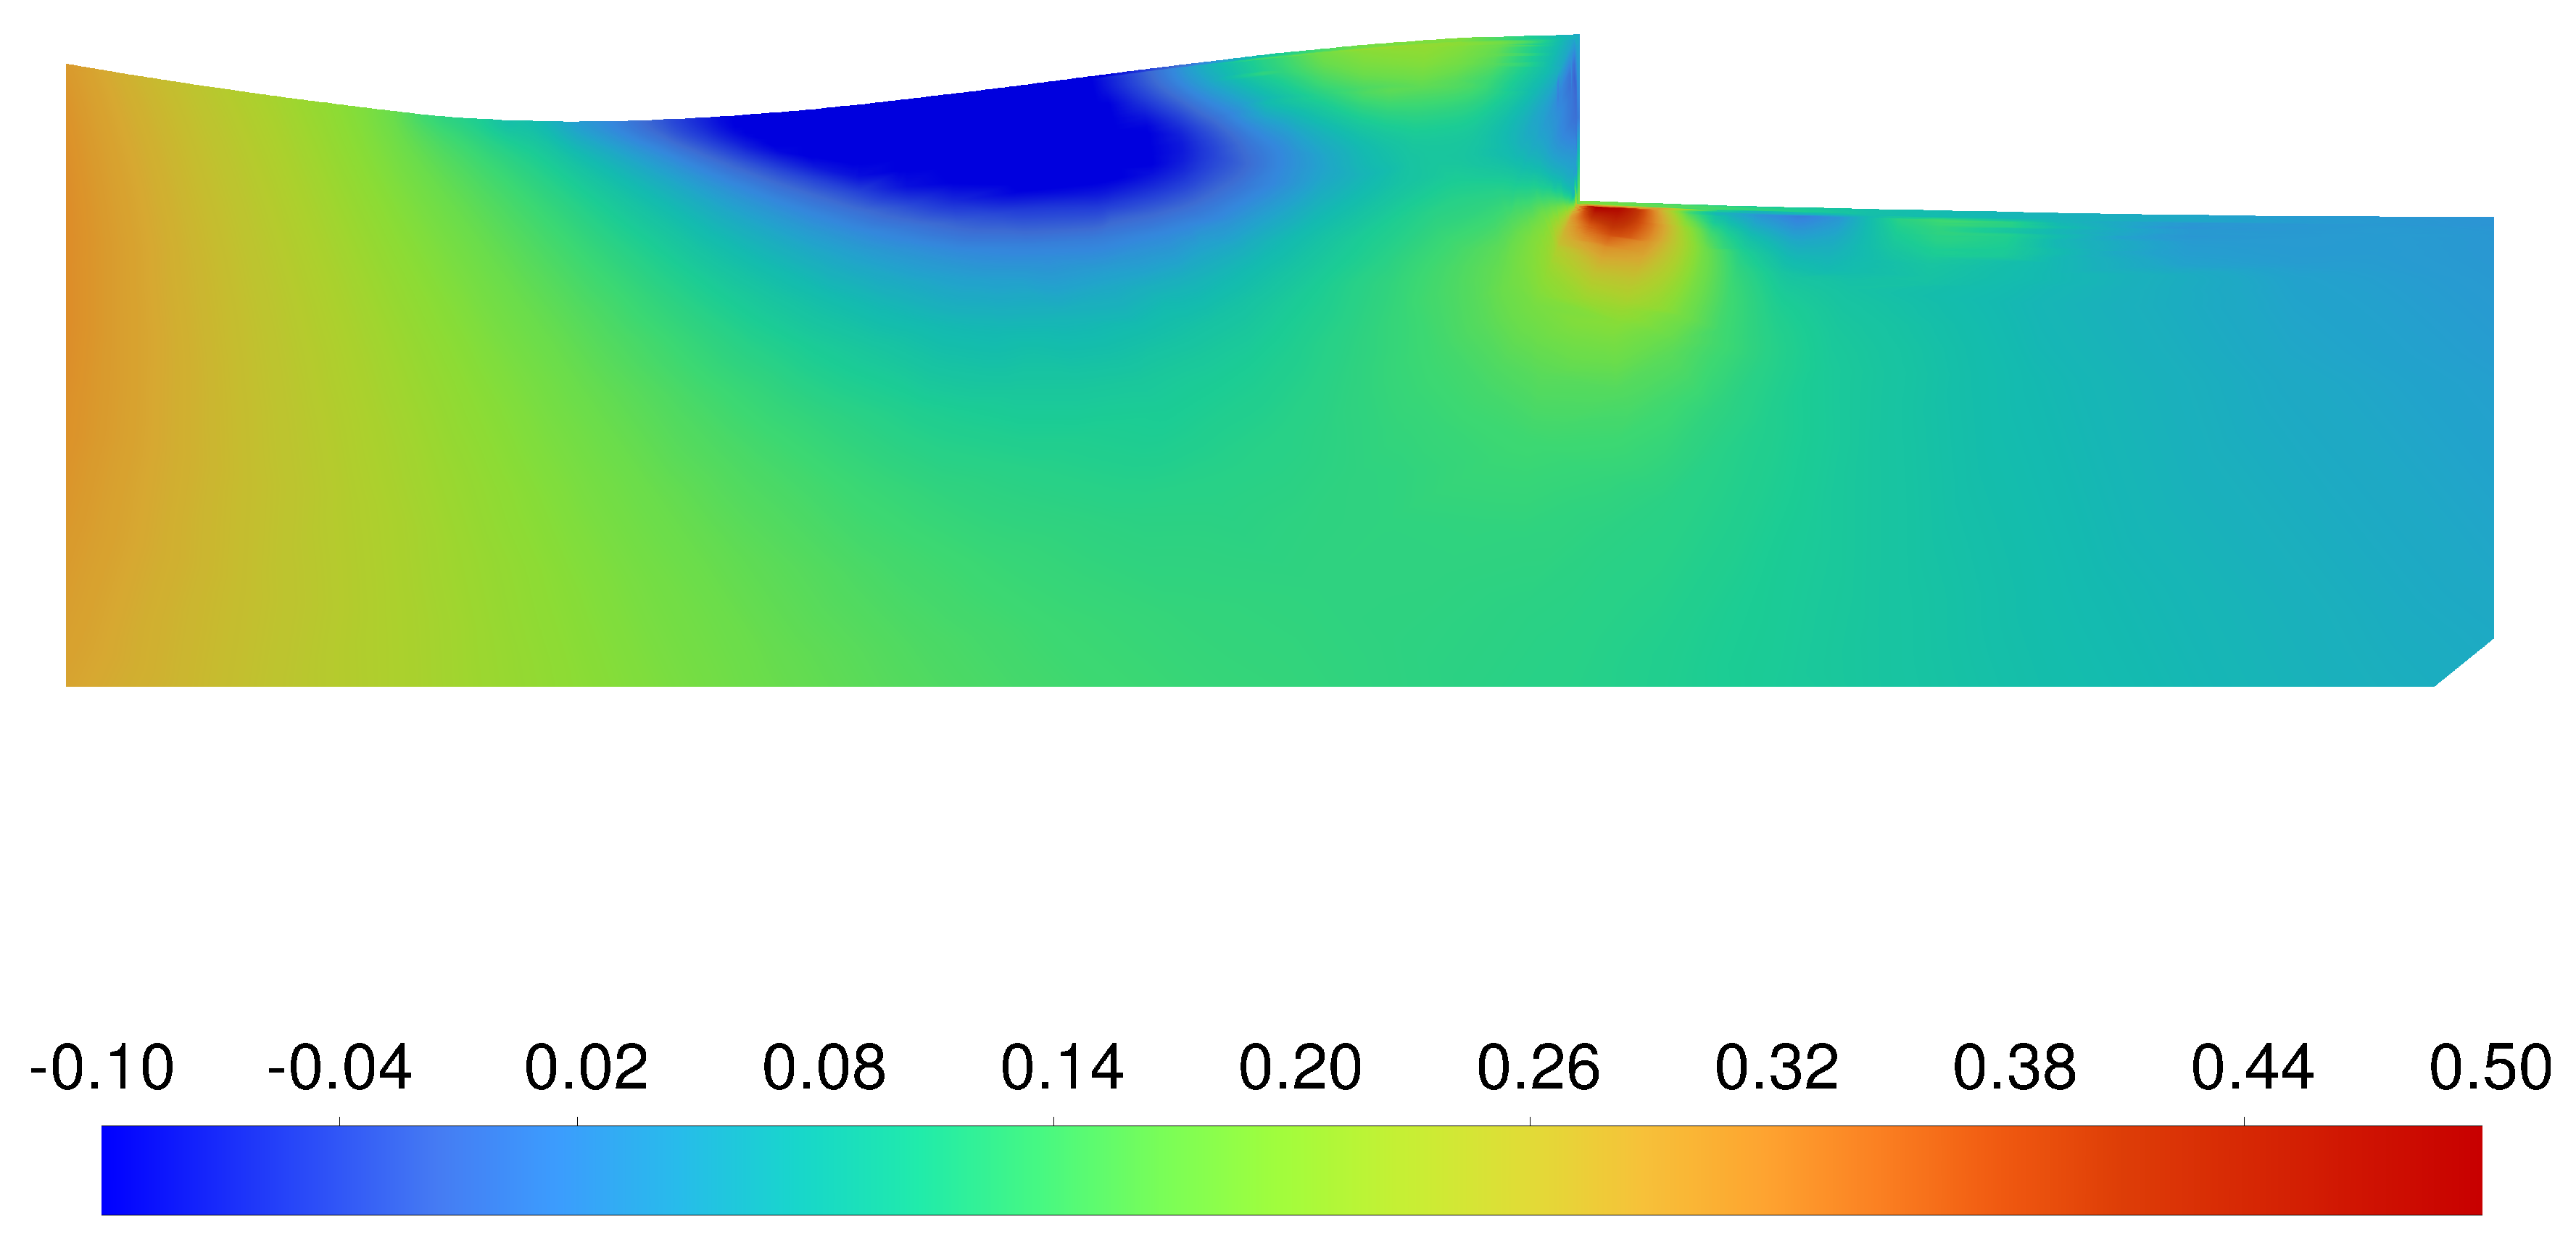
Figure 15.
Ideal modelling case 3.
Figure 16.
Variation in with respect to flight time
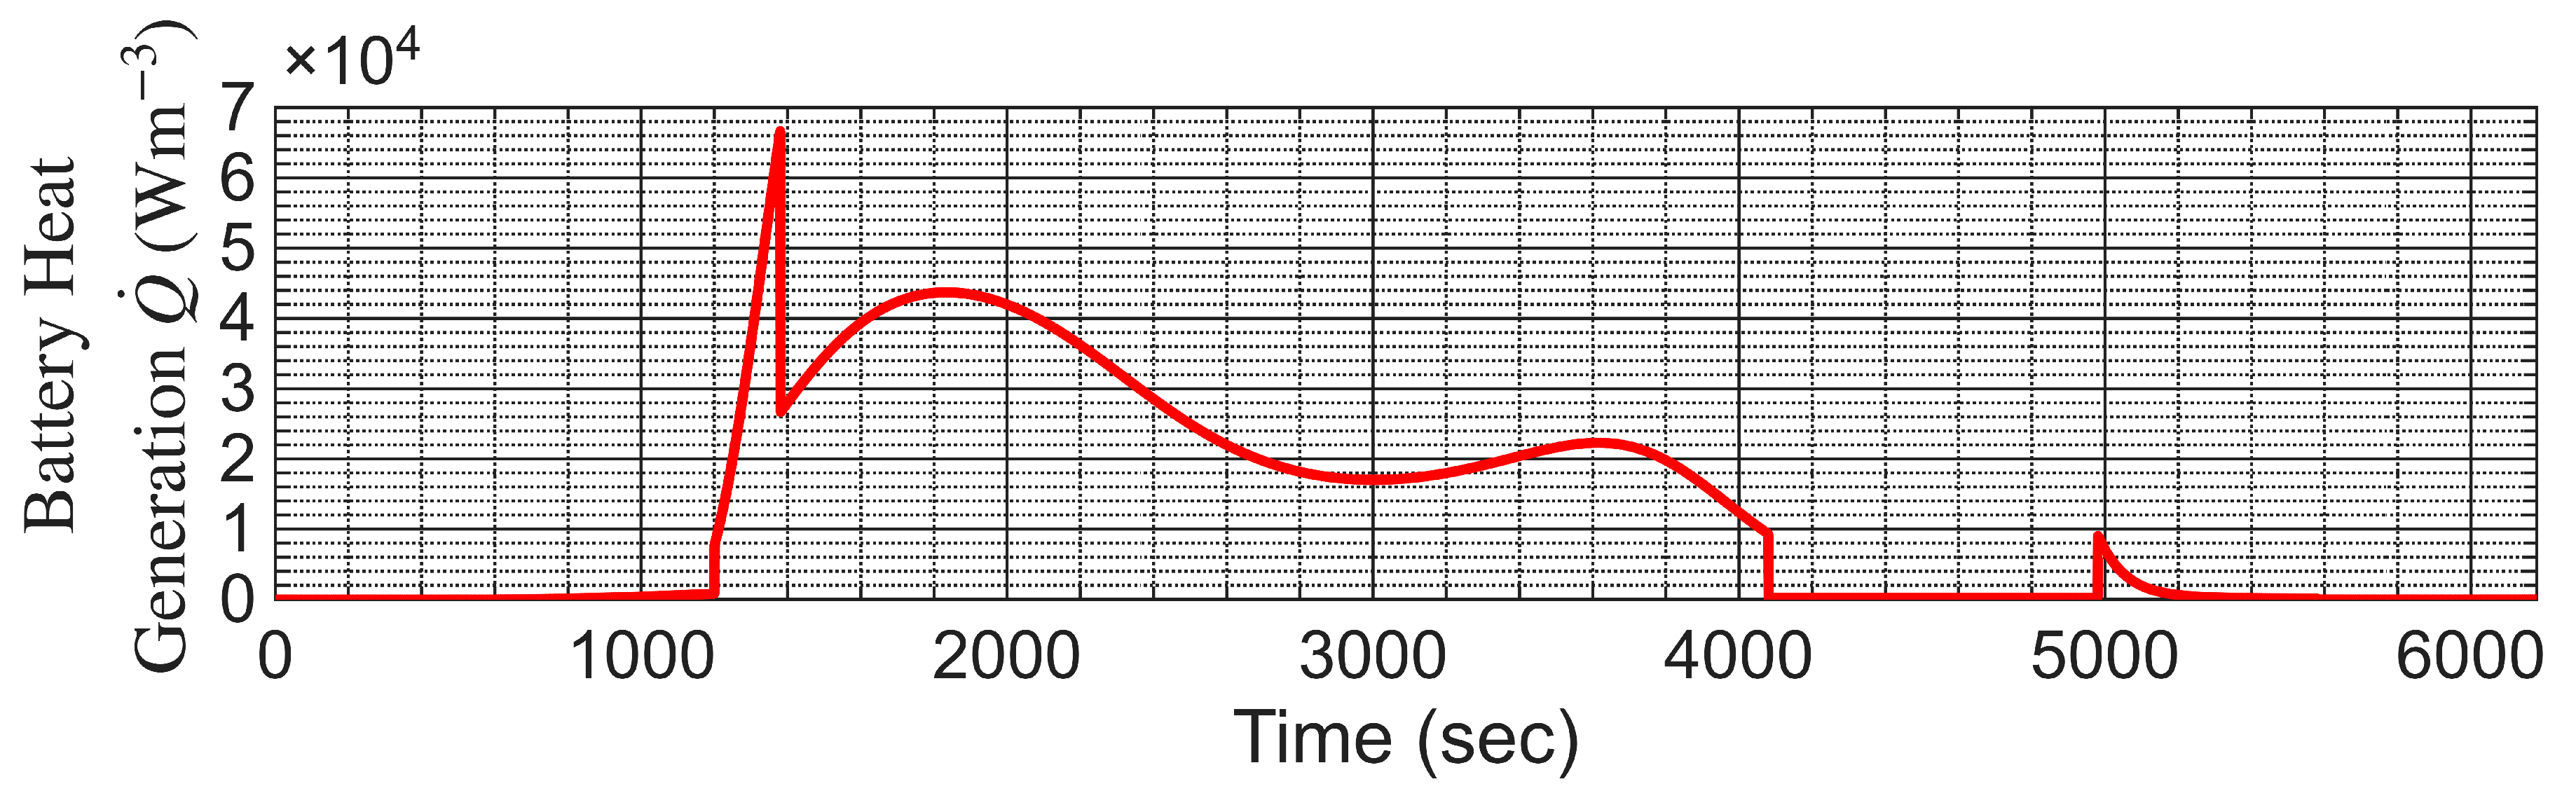
Figure 17.
Pressure coefficient on the bottom wing surface of Peak 2.
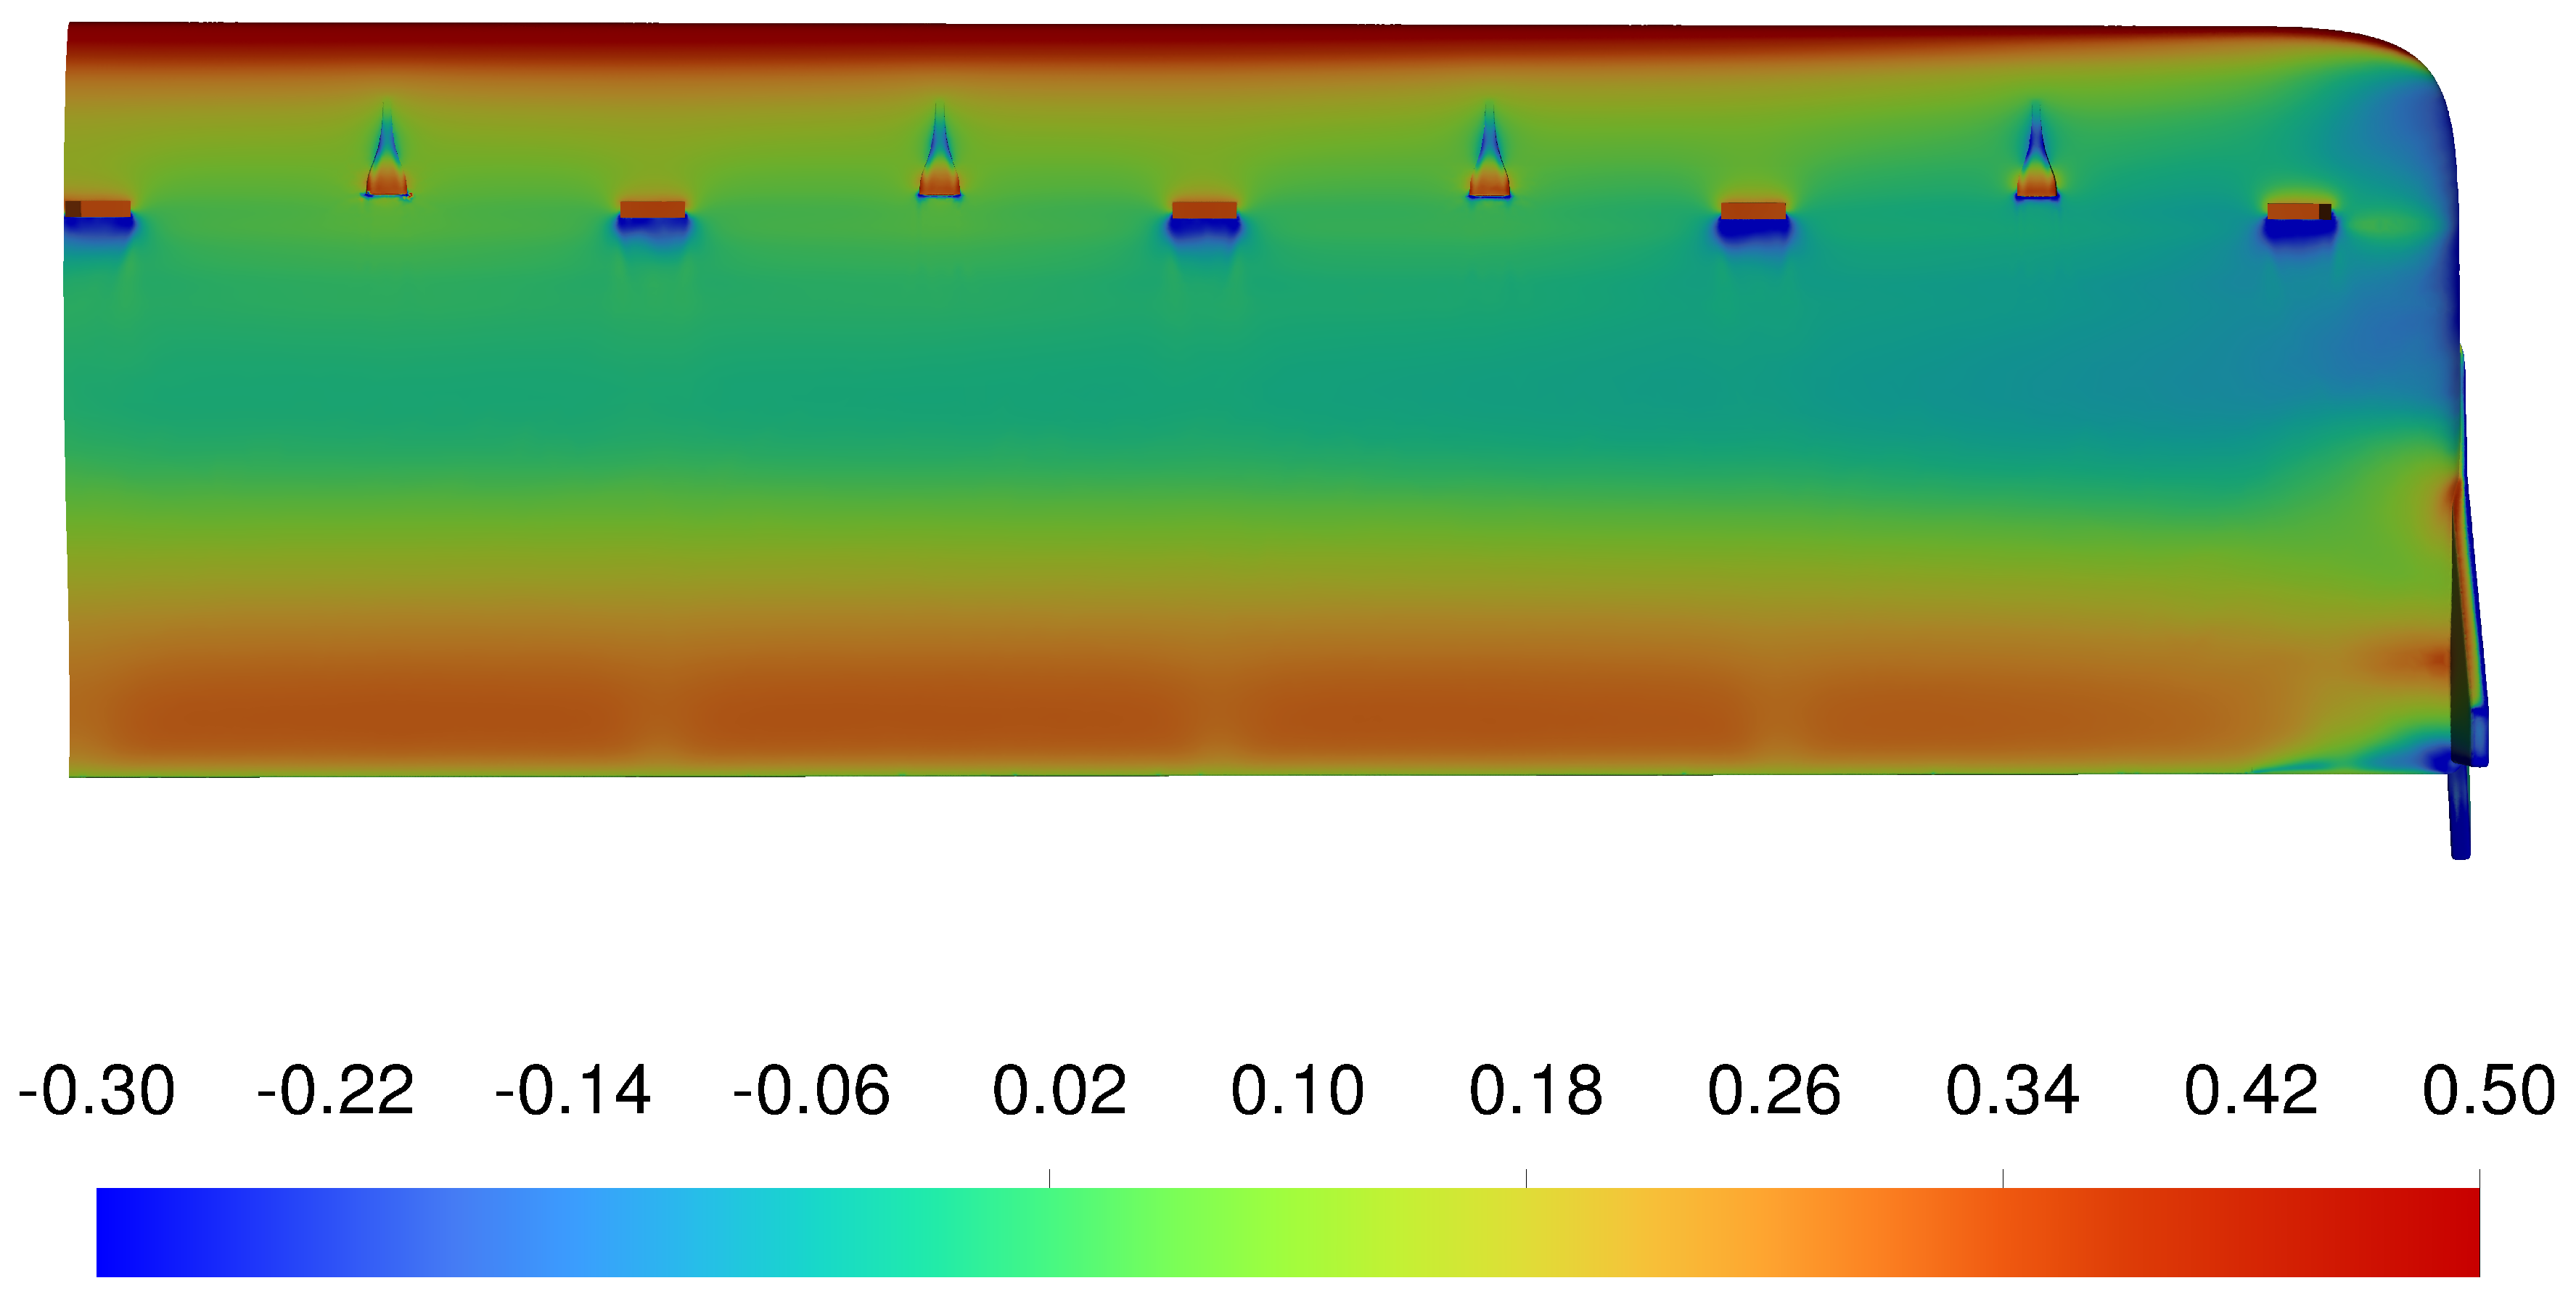
Figure 18.
Pressure coefficient on the bottom wing surface of the ideal modelling case.
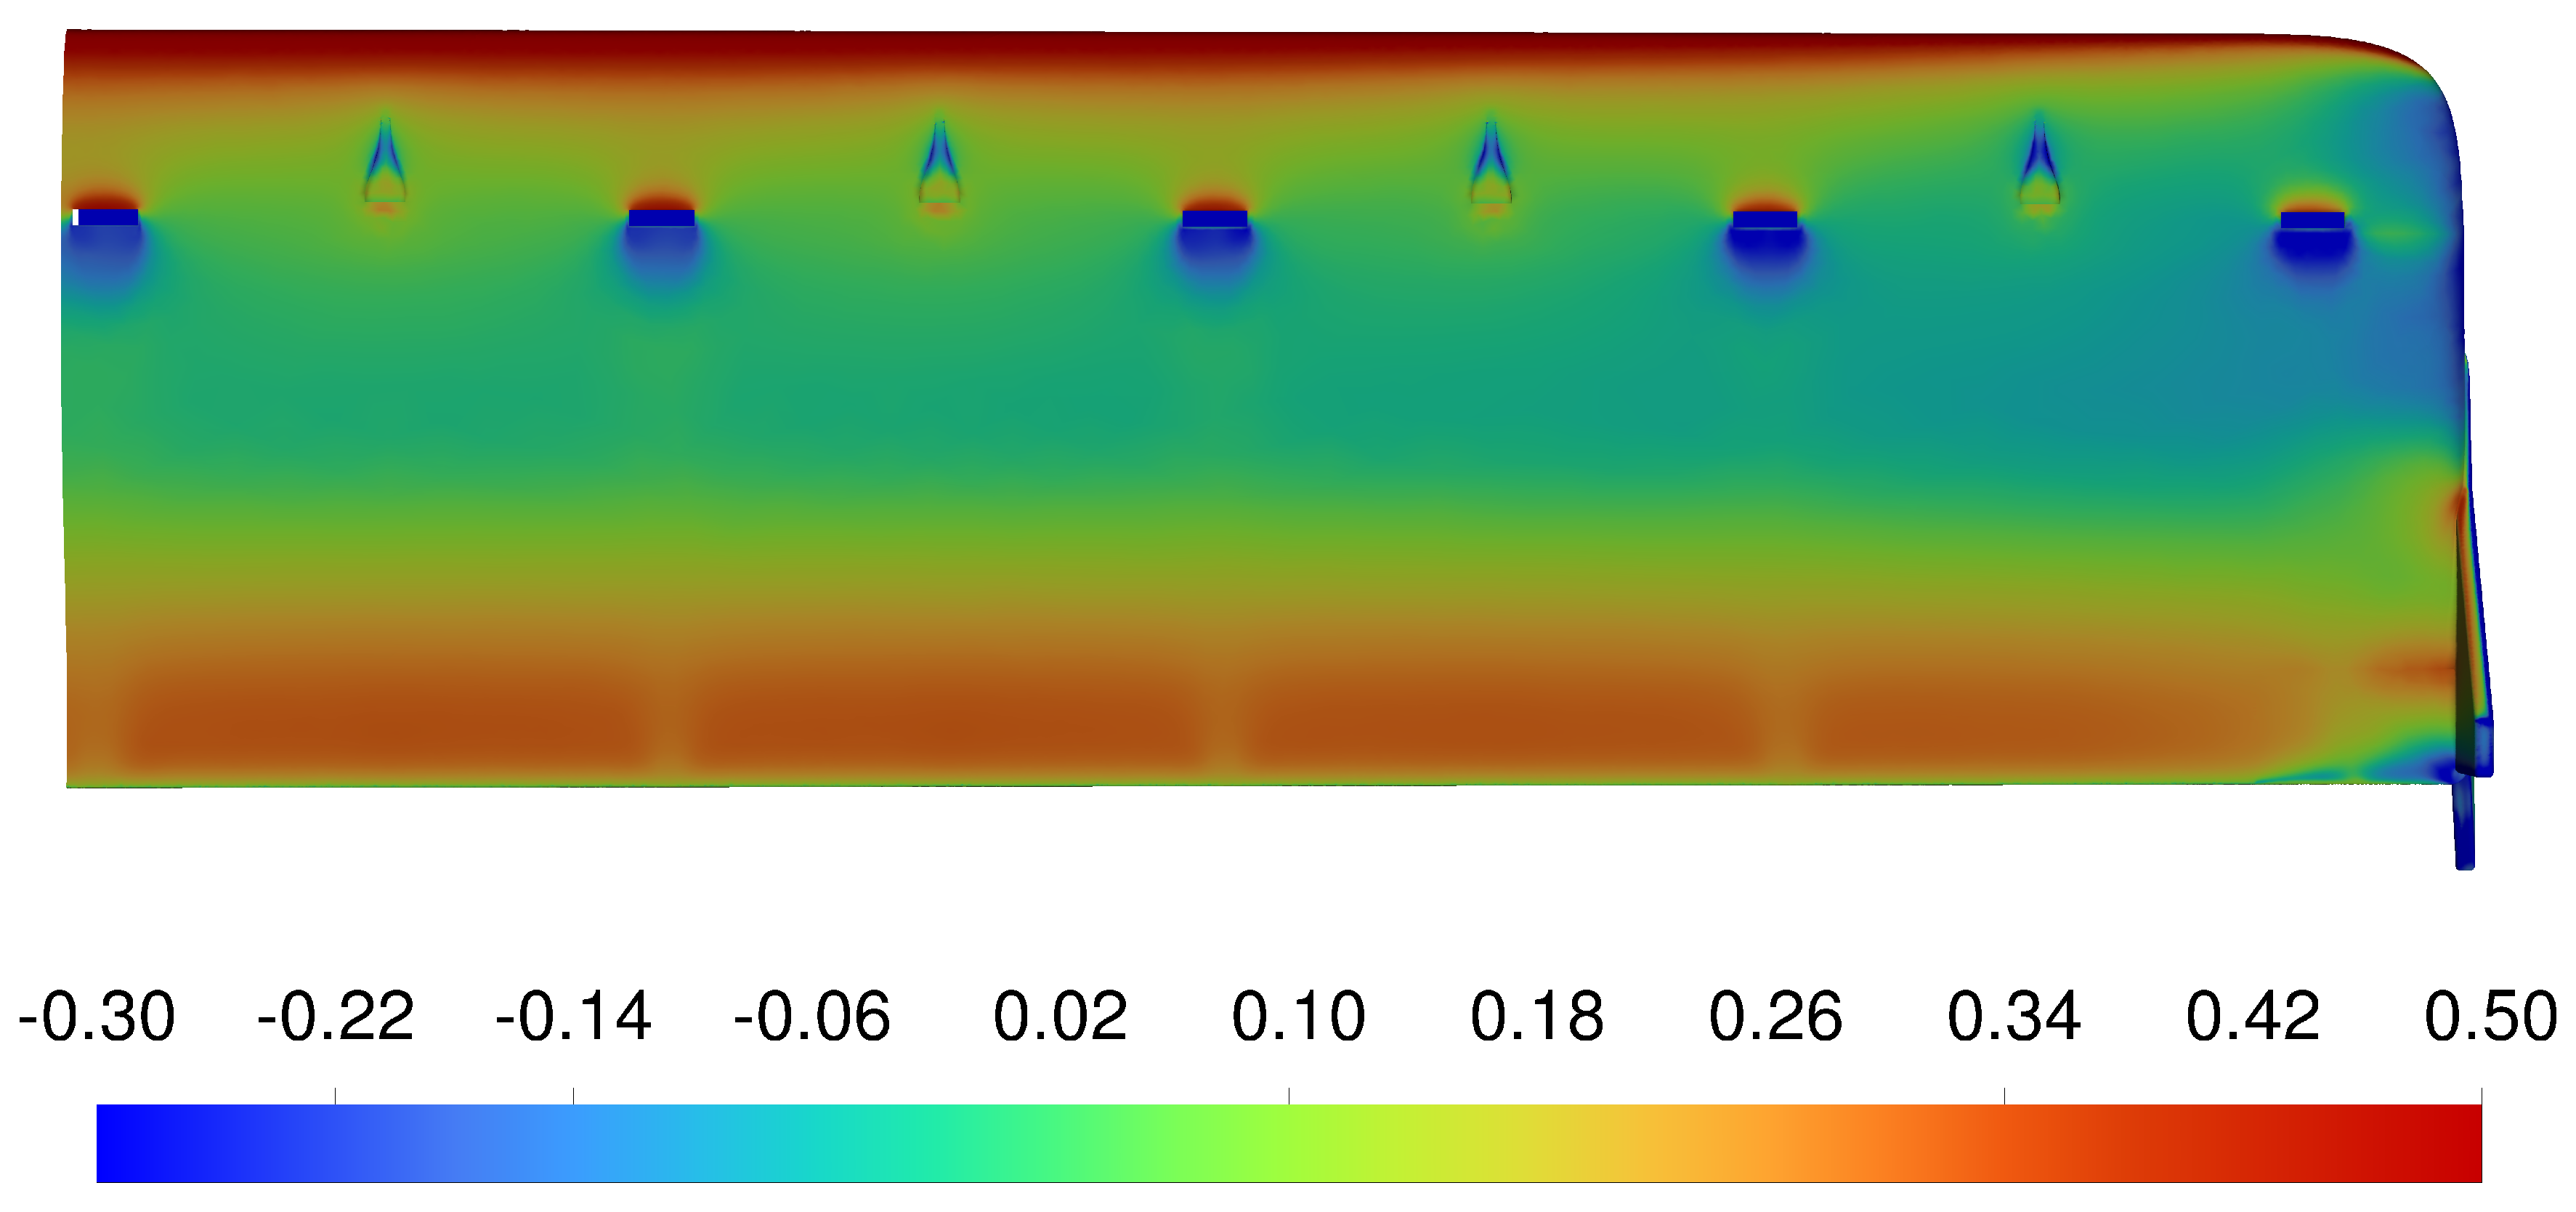
Figure 19.
Temperature on the surface of each battery.
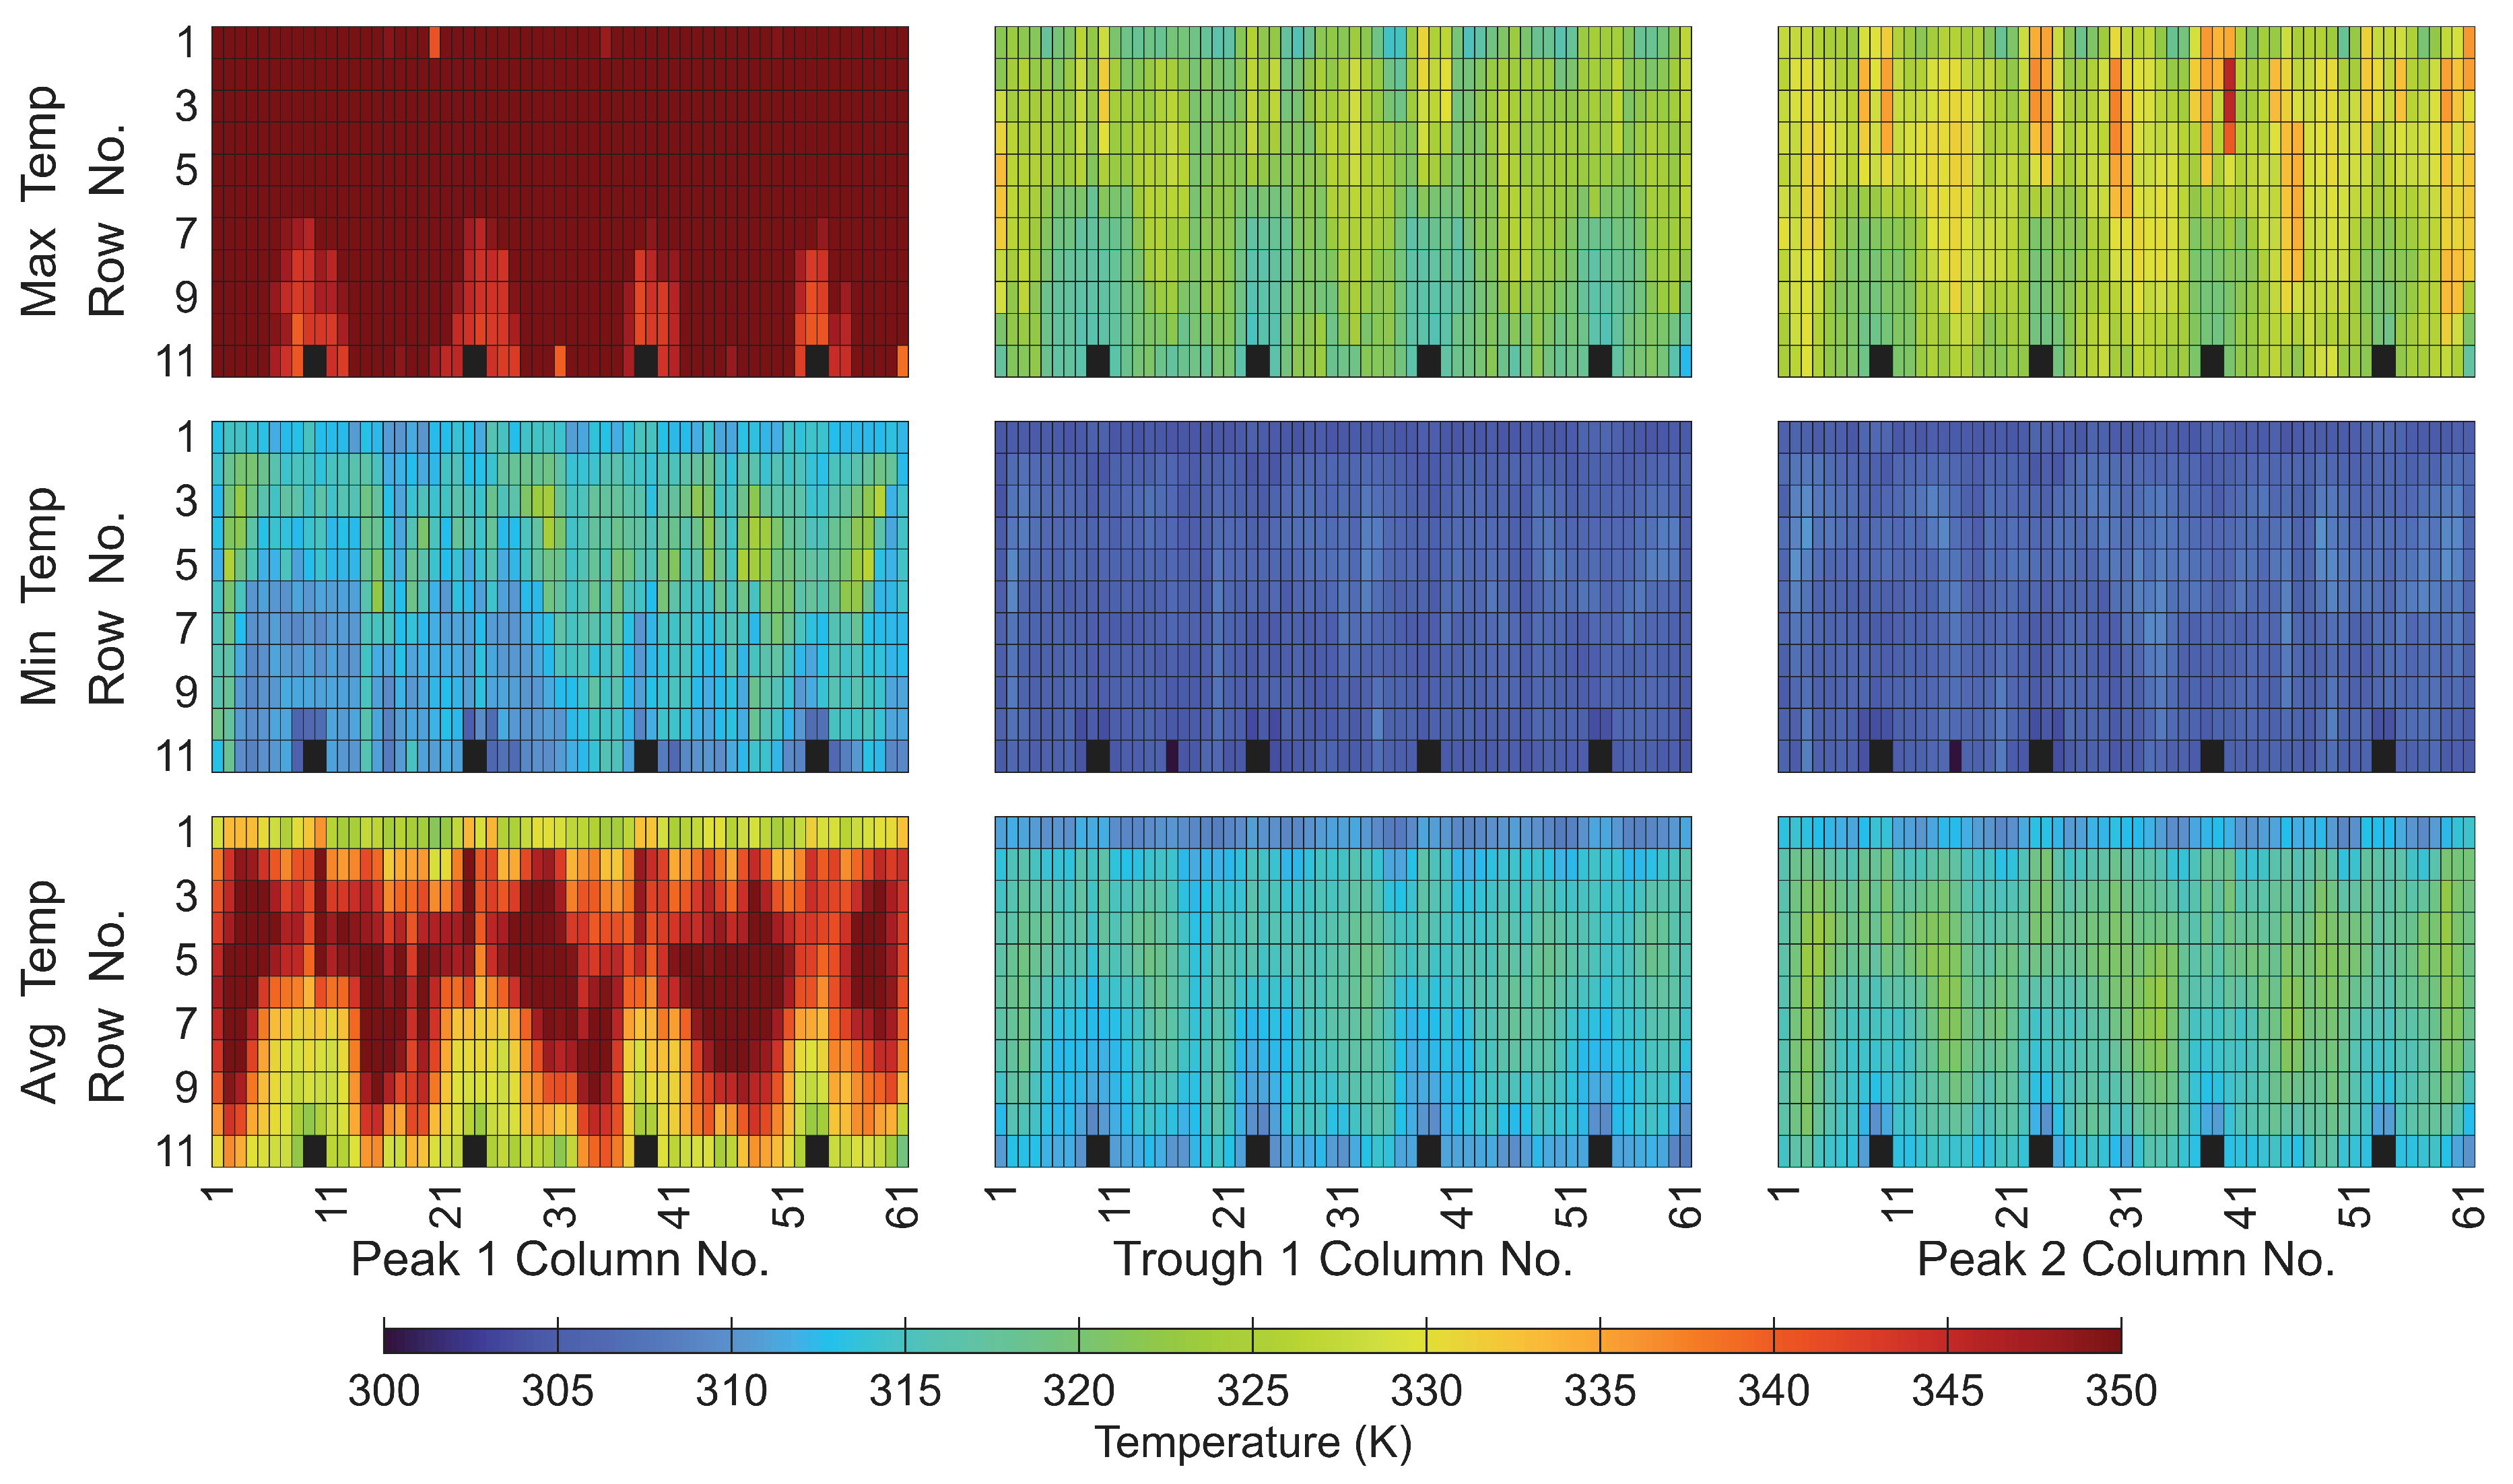
Figure 20.
Velocity flow (m/s) around the battery (Peak 2).
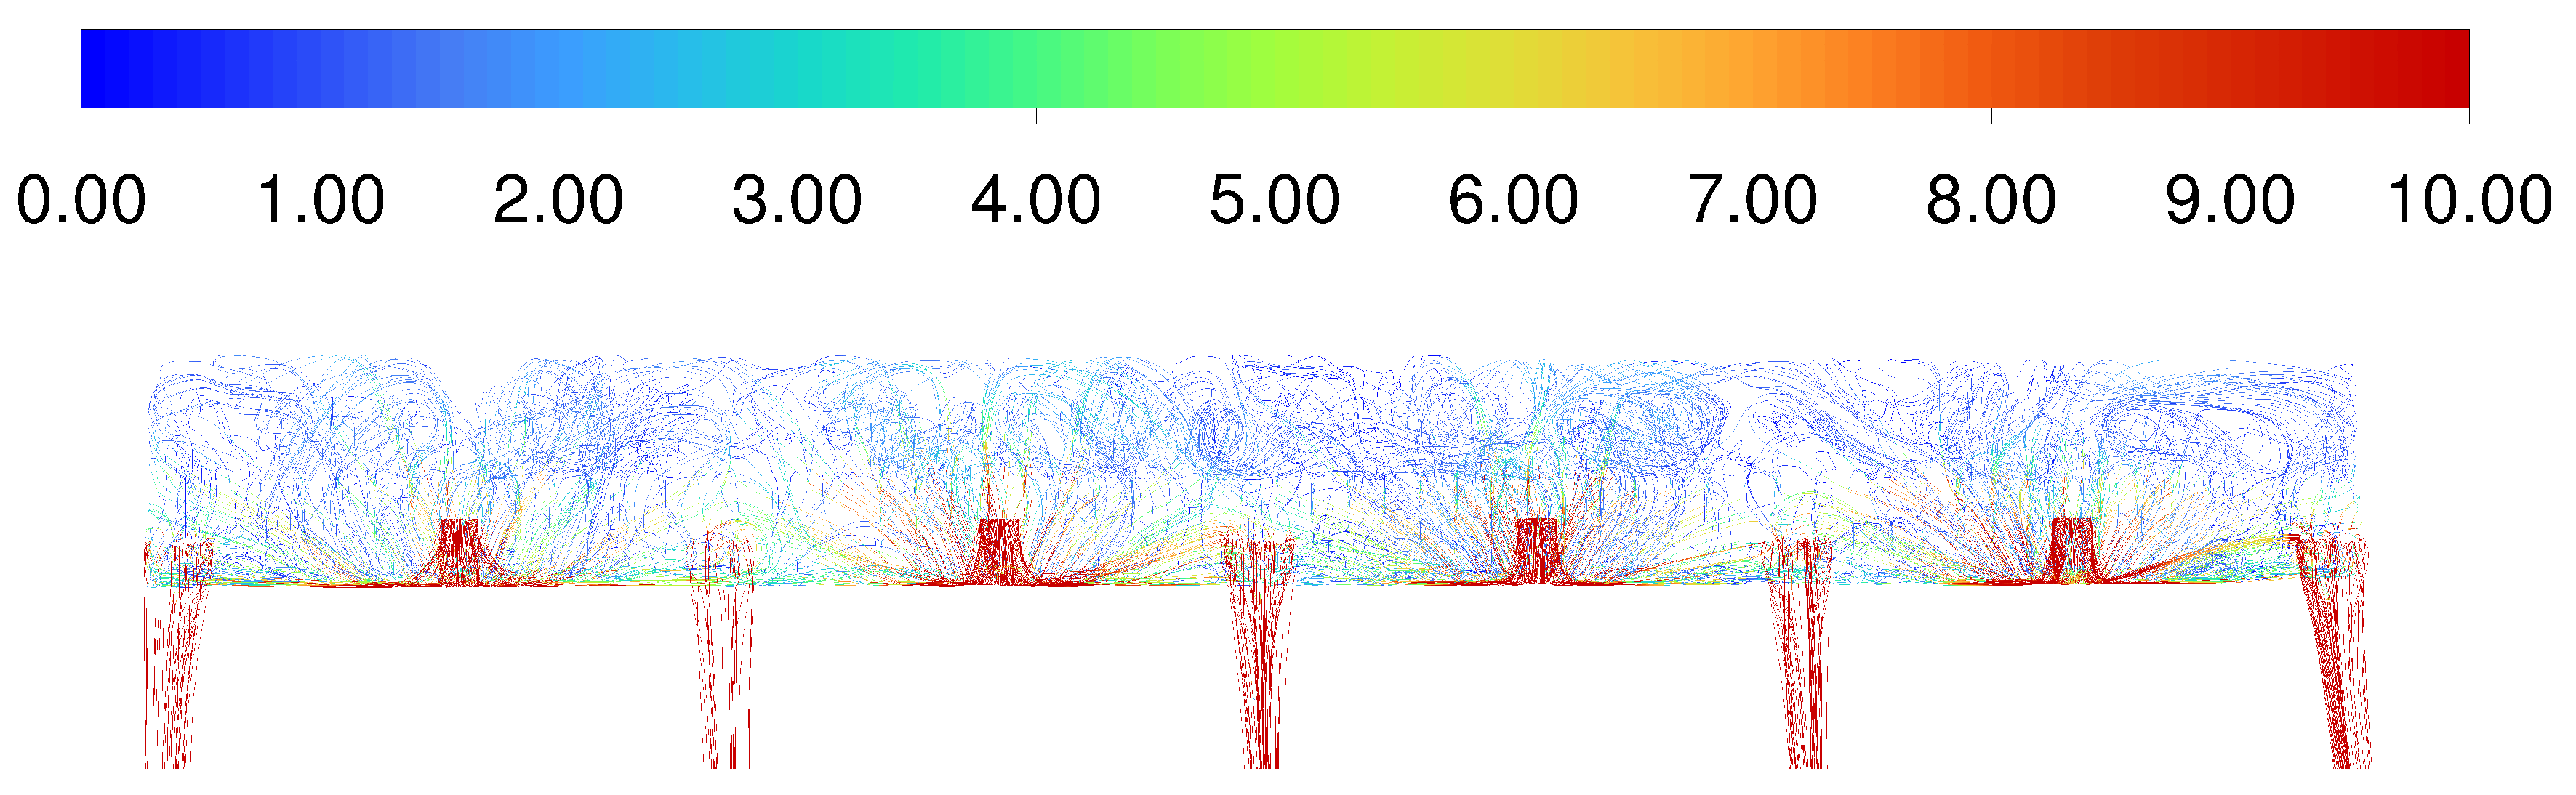
Figure 21.
Average temperatures in each row of batteries.
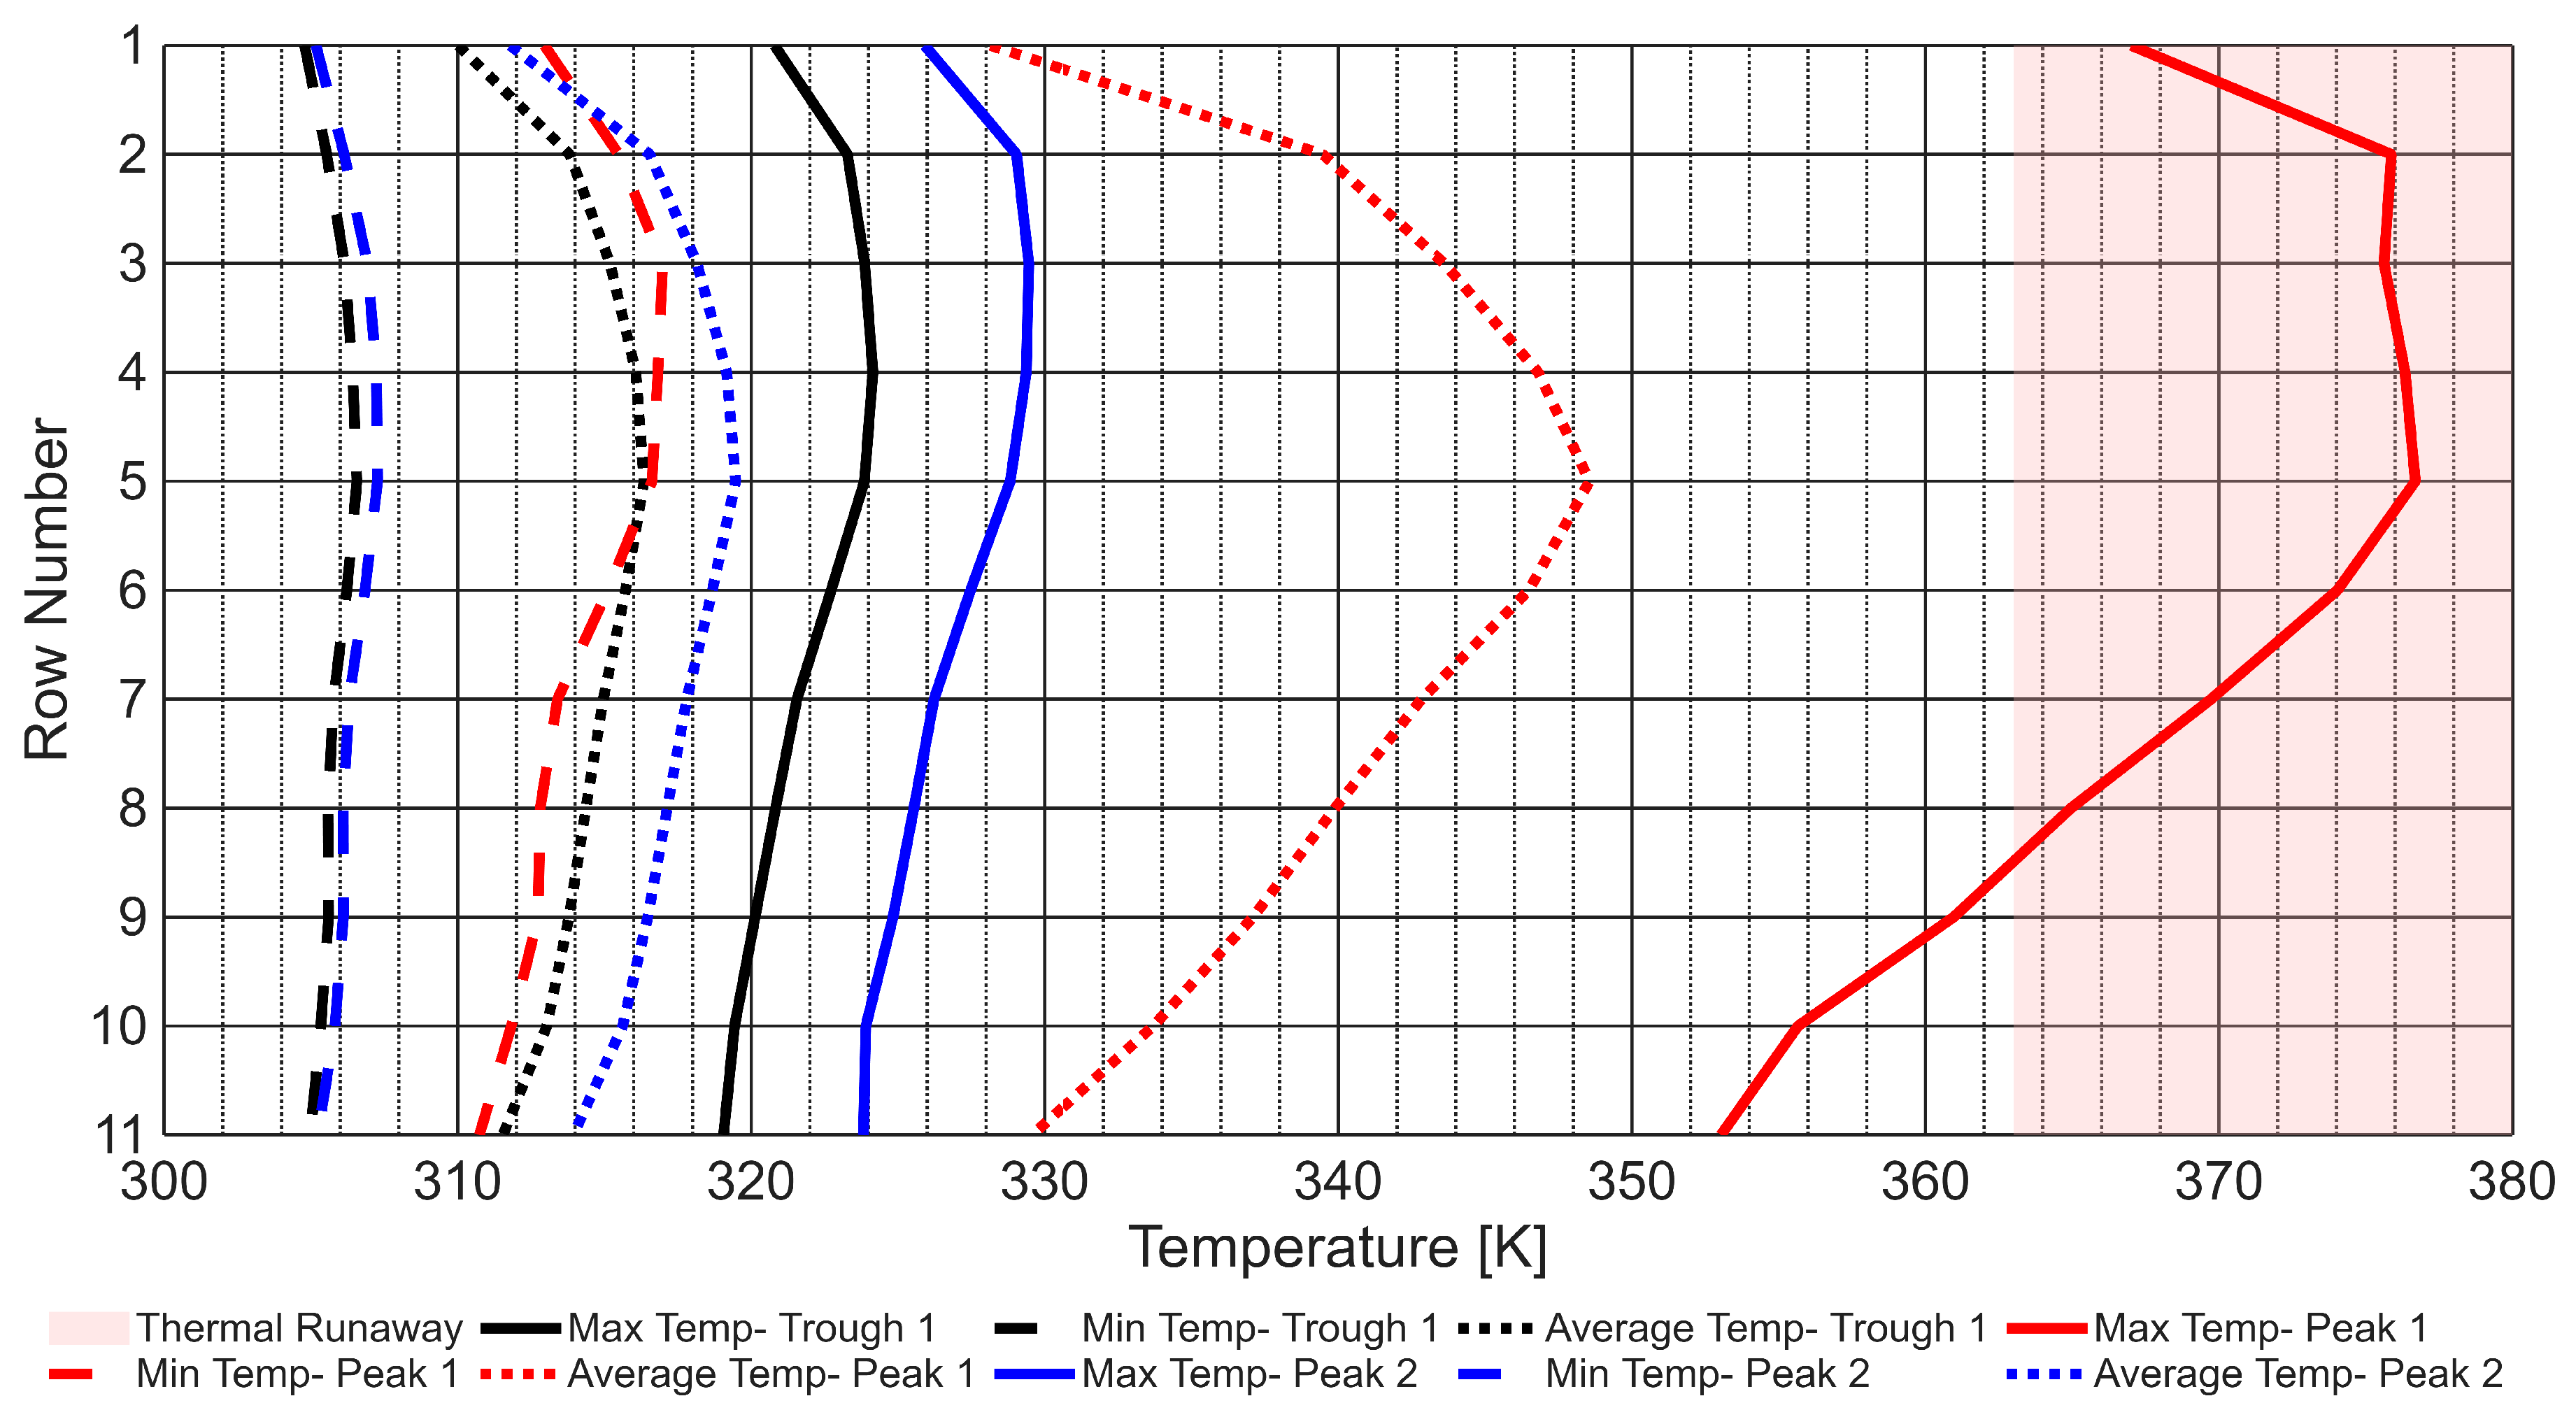
Figure 22.
Temperature (K) of the flow around the battery pack (Peak 2).
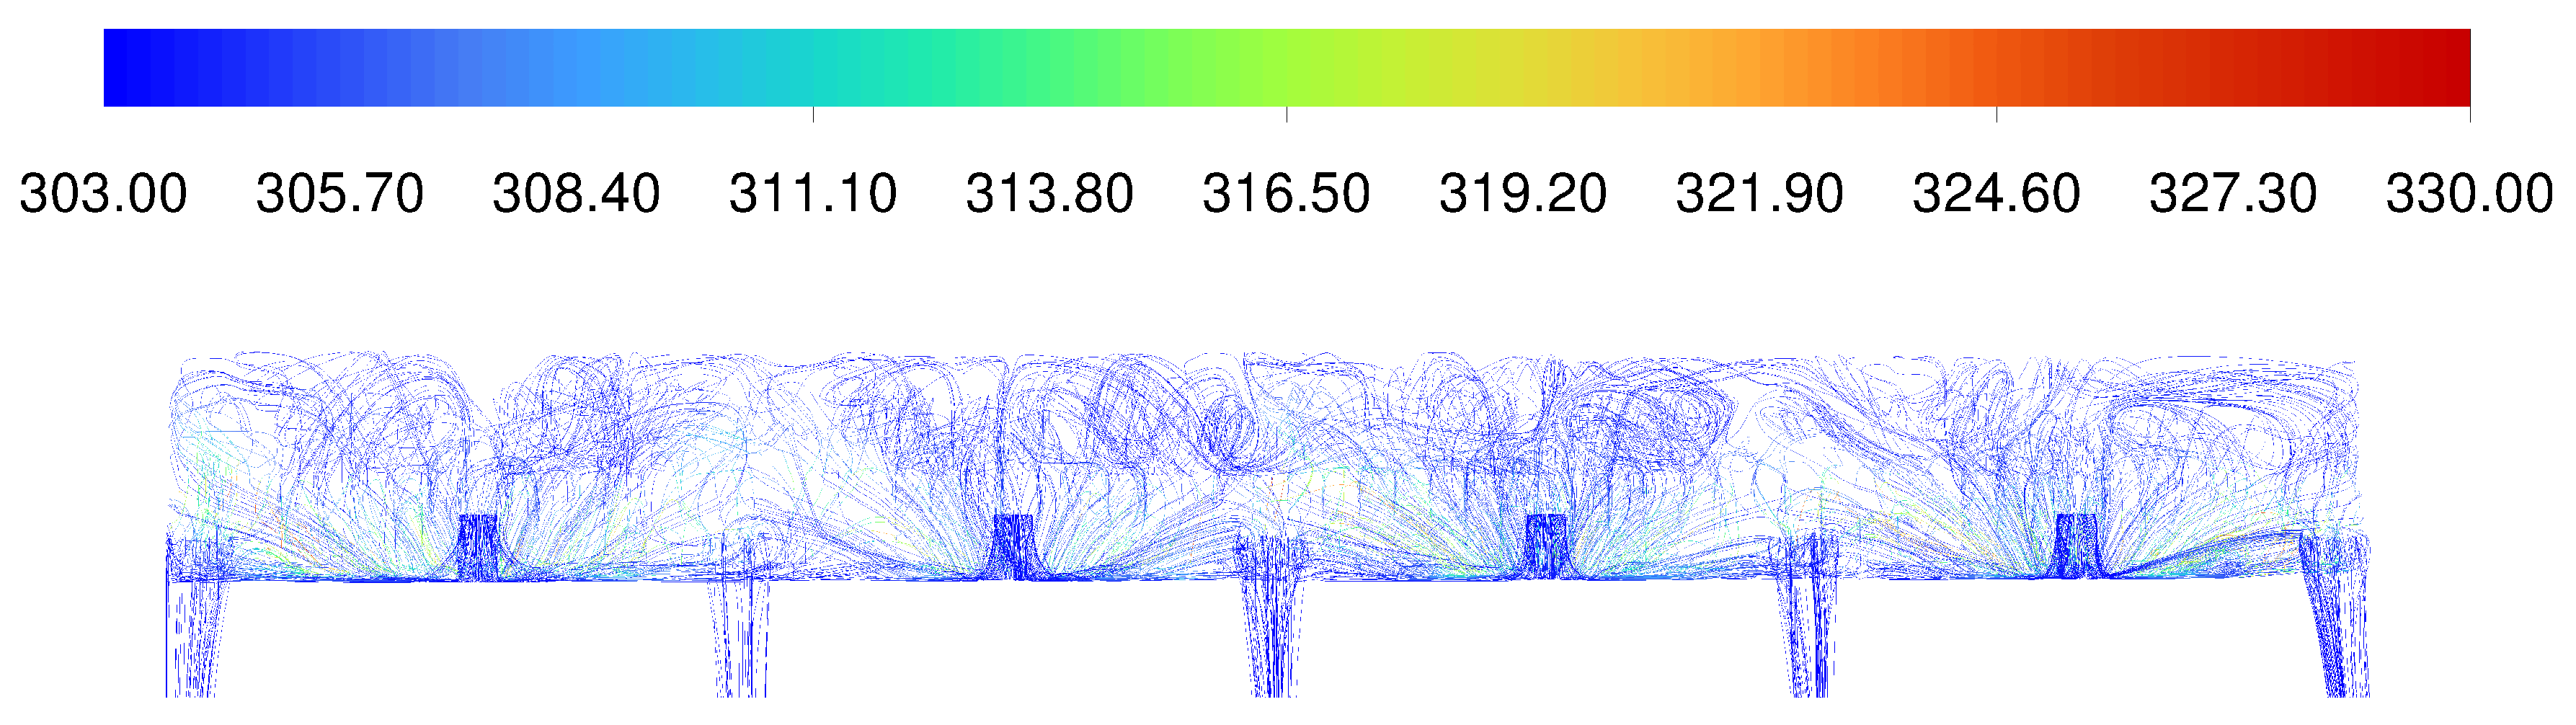

Table 1.
Screening D-Optimal Design Test Plan.
| Case No. | No. of Inlets | Inlet Surface | Inlet Type a | No. of Outlets | Outlet Surface | Inlet Width (cm) | AoA (deg) | Re () |
|---|---|---|---|---|---|---|---|---|
| 1 | 4 | Lower | NACA R5-WD5-CW5 | 5 | Lower | 15 | -2 | 3.7 |
| 2 | 2 | Upper | NACA R7-WD3-CW15 | 7 | Upper | 15 | 4 | 3.7 |
| 3 | 4 | Upper | LE Inlets 20% height | 7 | Lower | 5 | 10 | 3.7 |
| 4 | 4 | Upper | NACA R7-WD3-CW15 | 3 | Lower | 5 | -2 | 2.8 |
| 5 | 2 | Lower | NACA R7-WD5-CW5 | 3 | Upper | 5 | 10 | 2.8 |
| 6 | 2 | Lower | NACA R5-WD3-CW5 | 3 | Lower | 15 | 4 | 3.4 |
| 7 | 6 | Lower | NACA R5-WD5-CW5 | 3 | Lower | 5 | 4 | 2.8 |
| 8 | 4 | Lower | NACA R5-WD3-CW15 | 3 | Upper | 15 | 10 | 3.7 |
| 9 | 2 | Upper | NACA R5-WD5-CW15 | 5 | Lower | 15 | 10 | 3.7 |
| 10 | 4 | Lower | LE Inlets 40% height | 7 | Lower | 15 | 10 | 2.8 |
| 11 | 4 | Upper | NACA R7-WD5-CW15 | 7 | Upper | 15 | -2 | 3.4 |
| 12 | 2 | Upper | NACA R5-WD5-CW5 | 7 | Upper | 5 | 10 | 3.4 |
| 13 | 6 | Upper | LE Inlets 20% height | 3 | Upper | 15 | -2 | 3.7 |
| 14 | 6 | Upper | LE Inlets 40% height | 3 | Lower | 5 | 4 | 3.7 |
| 15 | 2 | Lower | LE Inlets 20% height | 5 | Upper | 5 | 4 | 3.4 |
| 16 | 2 | Upper | NACA R7-WD5-CW15 | 3 | Lower | 15 | 10 | 2.8 |
| 17 | 6 | Lower | NACA R7-WD5-CW15 | 5 | Upper | 5 | 10 | 3.7 |
| 18 | 4 | Upper | NACA R7-WD3-CW5 | 5 | Upper | 15 | 4 | 2.8 |
| 19 | 2 | Lower | NACA R7-WD3-CW5 | 7 | Lower | 5 | -2 | 3.7 |
| 20 | 6 | Upper | NACA R5-WD3-CW5 | 5 | Upper | 5 | 10 | 2.8 |
| 21 | 6 | Upper | NACA R7-WD3-CW5 | 3 | Upper | 15 | 10 | 3.4 |
| 22 | 4 | Lower | NACA R5-WD5-CW15 | 3 | Upper | 5 | -2 | 3.4 |
| 23 | 6 | Upper | NACA R5-WD3-CW15 | 5 | Lower | 5 | -2 | 3.4 |
| 24 | 6 | Lower | NACA R7-WD5-CW5 | 7 | Lower | 15 | -2 | 2.8 |
| 25 | 6 | Lower | NACA R5-WD5-CW15 | 7 | Upper | 15 | 4 | 2.8 |
| 26 | 2 | Upper | LE Inlets 40% height | 5 | Upper | 15 | -2 | 2.8 |
| 27 | 4 | Upper | NACA R7-WD5-CW5 | 5 | Lower | 5 | 4 | 3.4 |
| 28 | 6 | Lower | NACA R7-WD3-CW15 | 5 | Lower | 15 | 10 | 3.4 |
a NACA ducts are parameterised by the following: Ramp angle (R), width-to-depth ratio (WD), chord-wise position (CW). The wing-leading-edge inlets are varied by the inlet height as a percentage of the wing chord.
Table 2.
Focused Modelling Test Plan.
| Case No. | Width-to-Depth Ratio | Ramp Angle (deg) | Chordwise Position (%) |
|---|---|---|---|
| 1 | 2 | 8 | 20 |
| 2 | 4 | 7 | 20 |
| 3 | 4 | 6 | 10 |
| 4 | 4 | 8 | 15 |
| 5 | 2 | 8 | 10 |
| 6 | 2 | 6 | 20 |
| 7 | 3 | 8 | 20 |
| 8 | 4 | 8 | 20 |
| 9 | 2 | 6 | 10 |
| 10 | 4 | 6 | 20 |
| 11 | 3 | 7 | 10 |
| 12 | 4 | 8 | 10 |
| 13 | 3 | 6 | 15 |
| 14 | 2 | 6 | 10 |
| 15 | 2 | 7 | 15 |
Table 3.
L/D Comparison Between Simulations.
| Configuration | Peak 1 | Trough 1 | Peak 2 | Focussed Config. | Baseline Petrol Wing |
|---|---|---|---|---|---|
| L/D | 20.07 | 20.09 | 20.06 | 20.78 | 20.46 |
Note: All simulations used a polyhedral mesh.
Disclaimer/Publisher’s Note: The statements, opinions and data contained in all publications are solely those of the individual author(s) and contributor(s) and not of MDPI and/or the editor(s). MDPI and/or the editor(s) disclaim responsibility for any injury to people or property resulting from any ideas, methods, instructions or products referred to in the content. |
© 2025 by the authors. Licensee MDPI, Basel, Switzerland. This article is an open access article distributed under the terms and conditions of the Creative Commons Attribution (CC BY) license (http://creativecommons.org/licenses/by/4.0/).
Copyright: This open access article is published under a Creative Commons CC BY 4.0 license, which permit the free download, distribution, and reuse, provided that the author and preprint are cited in any reuse.


