
Submitted:
26 August 2025
Posted:
28 August 2025
You are already at the latest version
Abstract
In the high-performance environment of Formula Student Car racing, effective battery thermal management is crucial for safety, reliability, and performance. This work presents the design and validation of a lightweight, air-based Battery Cooling System (BCS) developed for a Formula Student vehicle. The system addresses the significant thermal loads generated by 528 Molicel P45B lithium-ion cells, arranged in a constrained U-shaped module layout. Using Computational Fluid Dynamics (CFD), the airflow geometry was optimized to deliver uniform cooling across all modules while minimizing aerodynamic drag. Simulations evaluated the system's performance under various ambient temperatures (25 °C and 30 °C) and airflow velocities (from 16 m/s to 18 m/s), identifying the impact of duct geometry, internal air guides, and airflow distribution on thermal regulation. Results showed that the system maintained most cell temperatures below the critical 60°C threshold under nominal conditions, with localized overheating only occurring under elevated ambient temperatures. Streamline and contour analyses confirmed the effectiveness of the airflow design and highlighted the need for future improvements in battery module geometry. Hence, this work demonstrates the feasibility of air cooling in high-performance applications and provides a validated framework for further refinement of electric vehicle battery thermal management systems.
Keywords:
battery
; cooling
; cfd simulation
; formula student
; electric car
1. Introduction
In high-performance electric racing, such as the Formula Student (FS) competition, efficient battery thermal management is essential for optimizing vehicle performance, ensuring safety, and meeting the rigorous demands of competition. FS, a global engineering competition, challenges teams to design, build, and race formula-style electric cars. The intense acceleration, rapid deceleration, and extended race durations inherent in this context impose substantial thermal loads on the vehicle's energy storage systems. Without effective cooling strategies, batteries can overheat, reducing efficiency, compromising safety, and accelerating wear [1,2].
Lithium-ion batteries, the preferred energy storage medium for FS cars, are highly sensitive to temperature variations. Studies show that optimal battery performance is maintained within a narrow temperature range, typically between 25 to 40°C, with temperatures exceeding 60 °C causing significant efficiency losses and accelerating chemical degradation [1,2]. Moreover, uneven temperature distribution within a battery pack can exacerbate these issues, leading to imbalances, decreased capacity utilization, and increased risk of thermal runaway [1,3,4]. In the most extreme cases, uncontrolled heat generation can lead to catastrophic failure, making thermal management critical not only for performance but also for safety [5].
The challenges associated with battery cooling are compounded by the increasing energy demands of electric racing vehicles. To enhance mileage and power delivery, battery packs are becoming more densely packed and feature higher energy density cells. This trend increases internal heat generation, particularly during the high charge and discharge cycles characteristic of racing [6]. Heat generation in lithium-ion cells arises from electrochemical reactions, ohmic resistance, and entropy changes, all of which intensify under the high currents required for race performance [6]. Without an effective cooling system, this heat accumulation can cause localized hotspots, accelerate thermal degradation, and, in extreme cases, lead to thermal runaway [7].
Various cooling strategies have been developed to mitigate these thermal challenges. Liquid cooling and phase change material systems are effective due to their high thermal conductivity and capacity to handle extreme heat loads. However, these systems are often unsuitable for FS applications because they add significant weight, increase system complexity, and require additional maintenance [8]. Air cooling, by contrast, offers a lightweight and cost-effective solution that aligns with the competition's principles of efficiency and simplicity. Although air has a lower heat capacity and thermal conductivity compared to liquids, advancements in duct design and airflow management have demonstrated its potential to effectively regulate battery temperatures in high-performance environments [8,9].
Recent studies have emphasized the importance of duct geometry, placement, and airflow optimization in achieving uniform cooling across battery packs. CFD tools have proven instrumental in this regard, enabling precise simulations of airflow patterns and temperature distributions. By iteratively refining duct designs based on simulation results, engineers can ensure that cooling systems deliver sufficient airflow to critical areas while minimizing aerodynamic drag [10].
The scope of this work was focused on the design, simulation, and validation of an air duct system to ensure effective heat dissipation. Using CFD simulations, the cooling system was optimized to provide uniform airflow across the battery modules, minimize temperature gradients, and maintain compatibility with the overall vehicle architecture. The air-cooling system was developed to align with FS principles of lightweight construction, aerodynamic efficiency, and adherence to safety standards.
In this paper, the following contributions can be identified: (i) the development of an air-cooled battery system tailored for a Formula Student (FS) electric car; (ii) a design incorporating custom air duct intakes strategically positioned to channel airflow over the battery cells while minimizing aerodynamic drag; (iii) validation of the system through CFD simulations under various operating conditions, ensuring compliance with FS regulations that require battery cell temperatures to remain below 60 °C. This approach aligns with the competition’s emphasis on innovation, efficiency, and adherence to stringent safety standards.
The results of this work contribute to the ongoing advancement of battery thermal management systems for electric racing applications. By detailing the design methodology and presenting simulation-based validation, this study provides a framework for future developments in lightweight and efficient cooling solutions for high-performance electric vehicles.
2. Battery Cooling System
The thermal management of lithium-ion batteries is a critical aspect of high-performance electric vehicles, especially in the FS competition. These vehicles are subjected to intense operational conditions, including rapid accelerations, sustained power outputs, and frequent thermal cycling, which result in significant heat generation within the battery pack. To ensure safe and reliable operation, FS regulations mandate that at least 30% of the battery cells must be monitored, and all monitored cells must remain below a maximum temperature of 60 °C [11]. This temperature threshold is critical to prevent chemical degradation, maintain efficiency, and reduce the risk of thermal runaway.
The primary objective of this study was to design an air-cooling system capable of maintaining battery cell temperatures within these limits under all anticipated operating conditions. The system was developed to integrate seamlessly with a pre-defined battery layout, which consisted of 528 Molicel P45B cells arranged in six U-shaped modules. This configuration, while outside the scope of the design work presented here, posed specific thermal challenges that influenced the cooling strategy.
The FS vehicle’s battery pack comprises 528 Molicel P45B cells, divided into six U-shaped modules. Each module consists of four parallels of 22 cells arranged in two layers, as shown in Figure 1. This layout optimizes space within the vehicle chassis while providing robust electrical connectivity. Although the configuration was pre-defined, its impact on thermal management posed unique challenges that guided the development of the air-cooling system.
To establish the thermal demands of the battery pack, simulations were conducted by a teammate using OpenLap software. These simulations emulated the car's performance during the endurance race, which represents the most challenging thermal conditions in FS. The analysis was based on five different track layouts, each designed to simulate typical endurance scenarios.
The OpenLap simulation relied on a comprehensive set of vehicle parameters, including aerodynamic coefficients, weight distribution, gear ratios, and powertrain characteristics, to closely replicate the car's real-world performance. These simulations provided critical insights into the vehicle’s energy usage and motor demands under race conditions. While the motor was limited to a peak power of 60 kW, the endurance race demonstrated an average power of 34 kW.
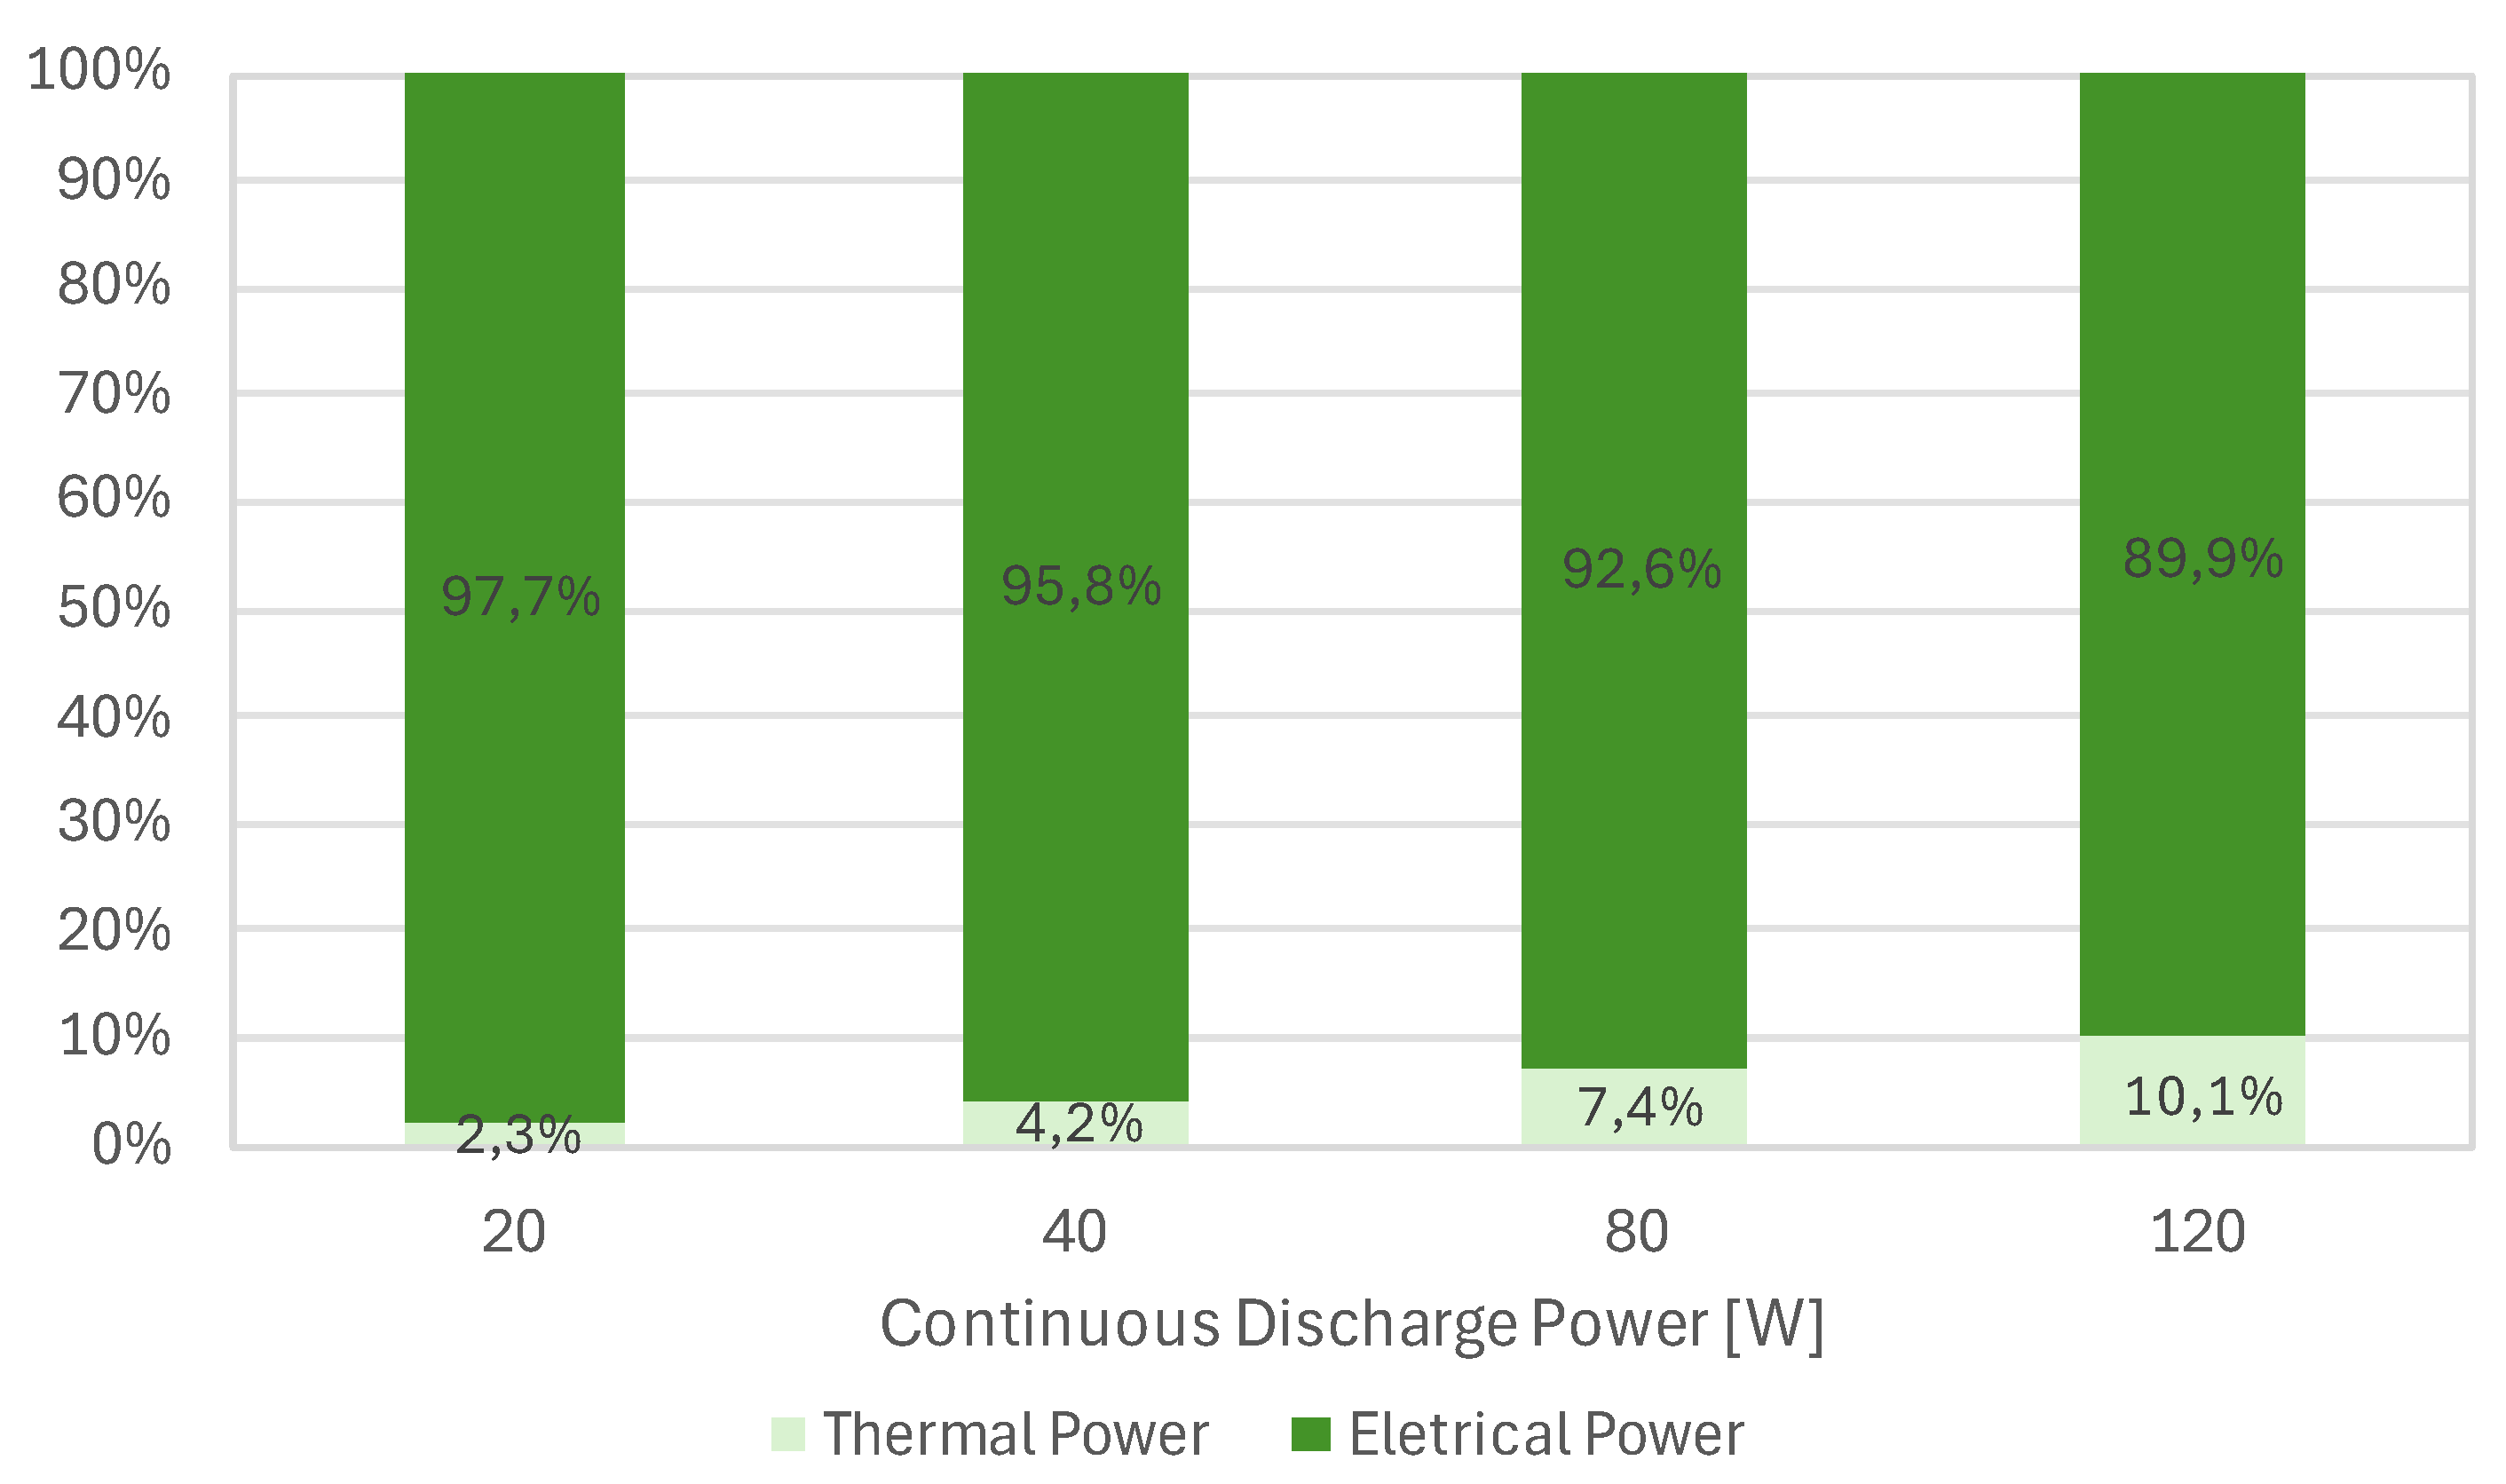
Research on the Molicel P45B cells revealed that, during discharge, approximately 6% of the energy is dissipated as heat [12]. This value was obtained considering an average output on continuous discharge testing as shown in Figure 2.
Using the discharge efficiency of 94% for Molicel P45B cells, the heat dissipation rate for the battery was calculated. The total thermal power generation was determined as:
substituting the values, returns a heat power of 2.04 kW produced in the battery pack. This value represents the heat that needs to be dissipated across all 528 cells during operation. Dividing the total thermal load by the number of cells provides the heat generated per individual, which is equal to 3.86 W.
These values formed the baseline for designing the air-cooling system, which was developed to ensure uniform temperature distribution and compliance with the FS regulation.
Figure 1.
FSUMinho's battery pack layout (602 x 577 x 312 mm).
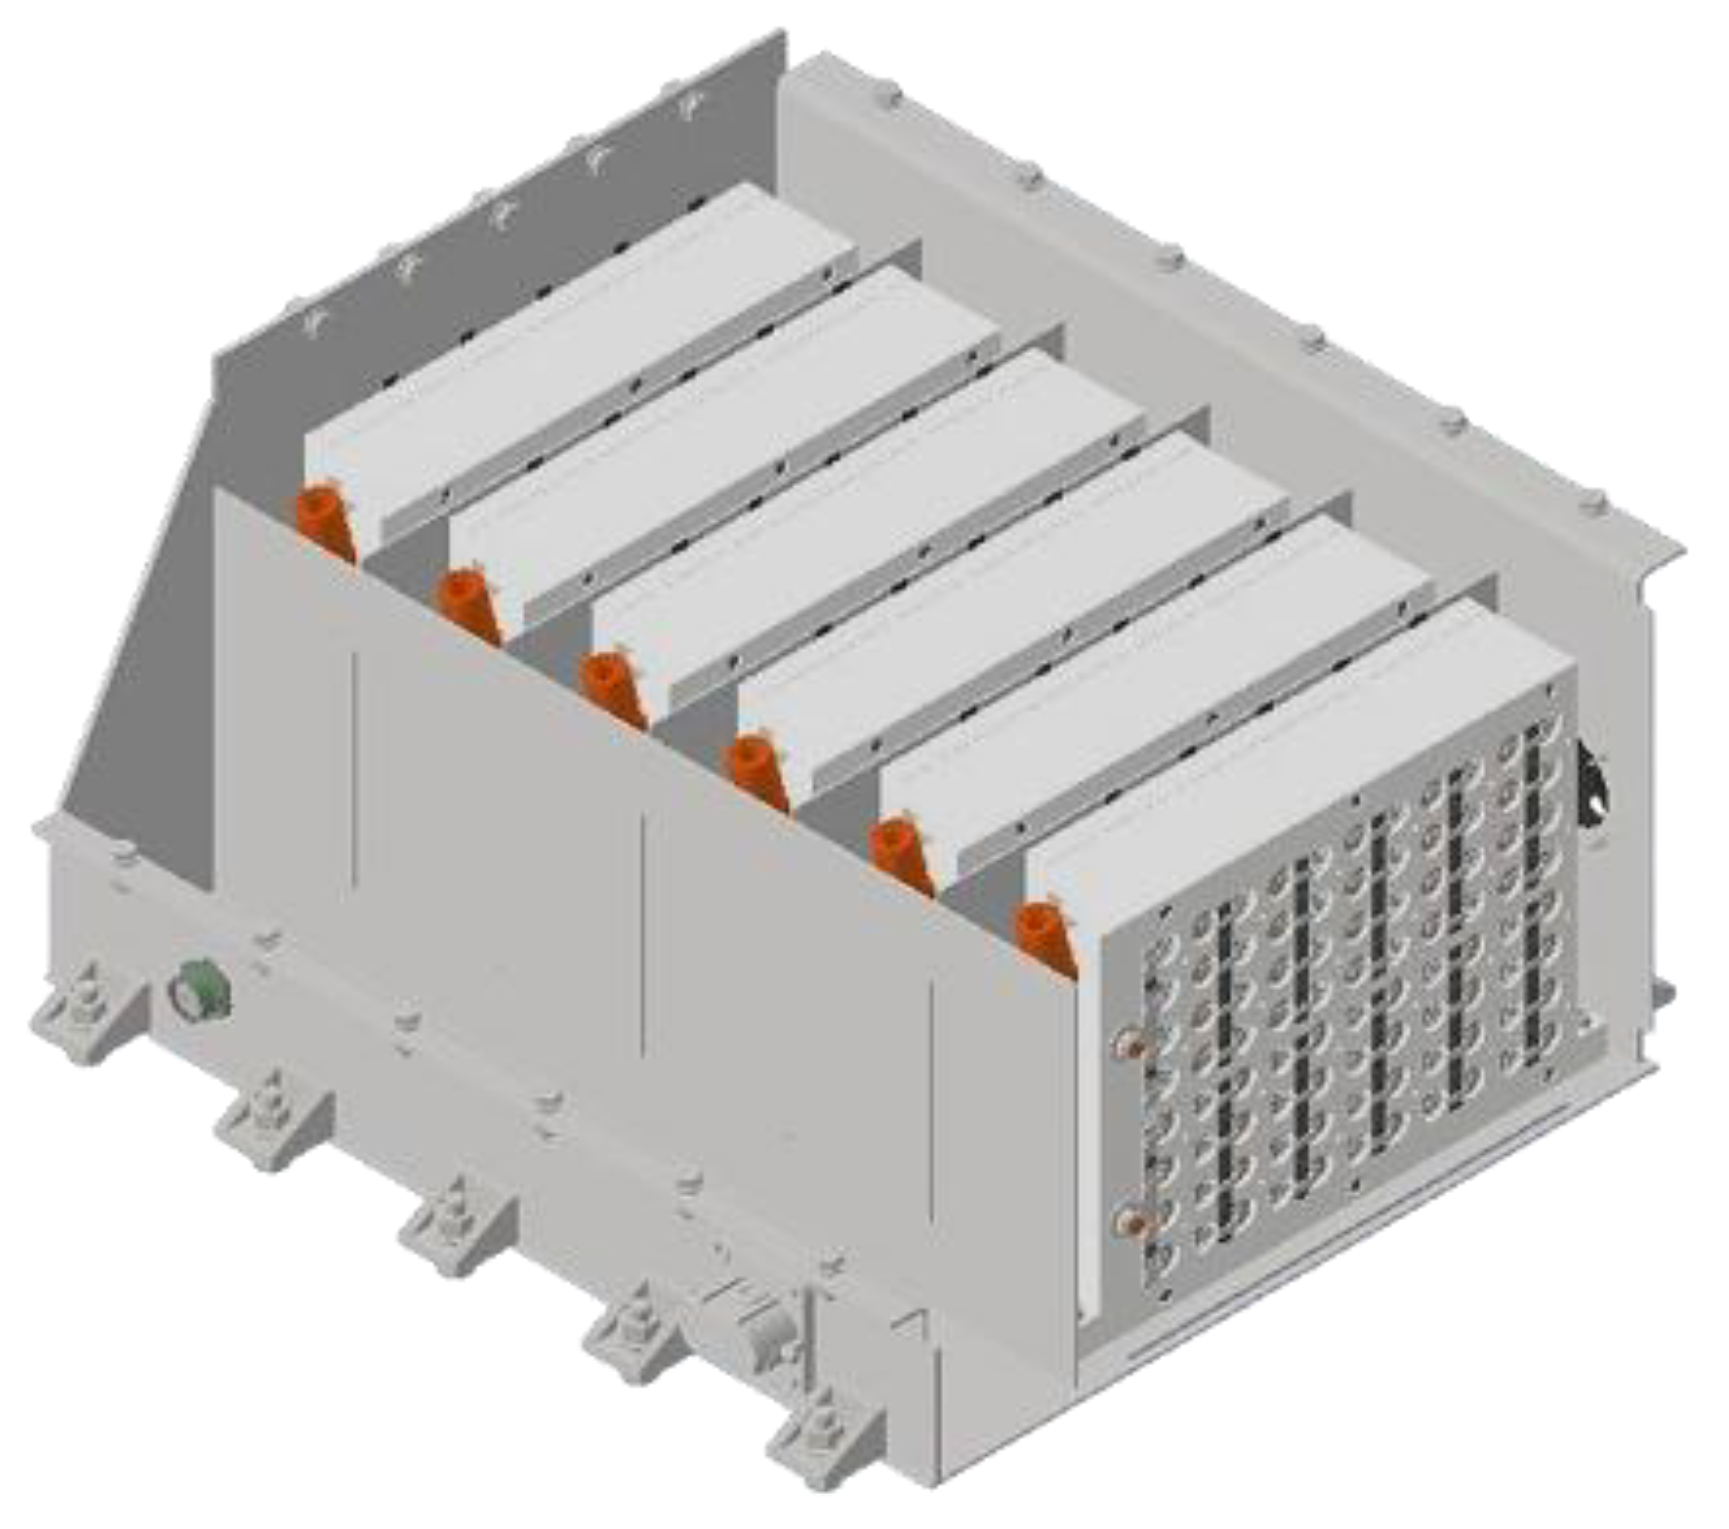
Figure 2.
Thermal power and electrical power produced by Molicel P45b in different discharging power [12].
Figure 2.
Thermal power and electrical power produced by Molicel P45b in different discharging power [12].
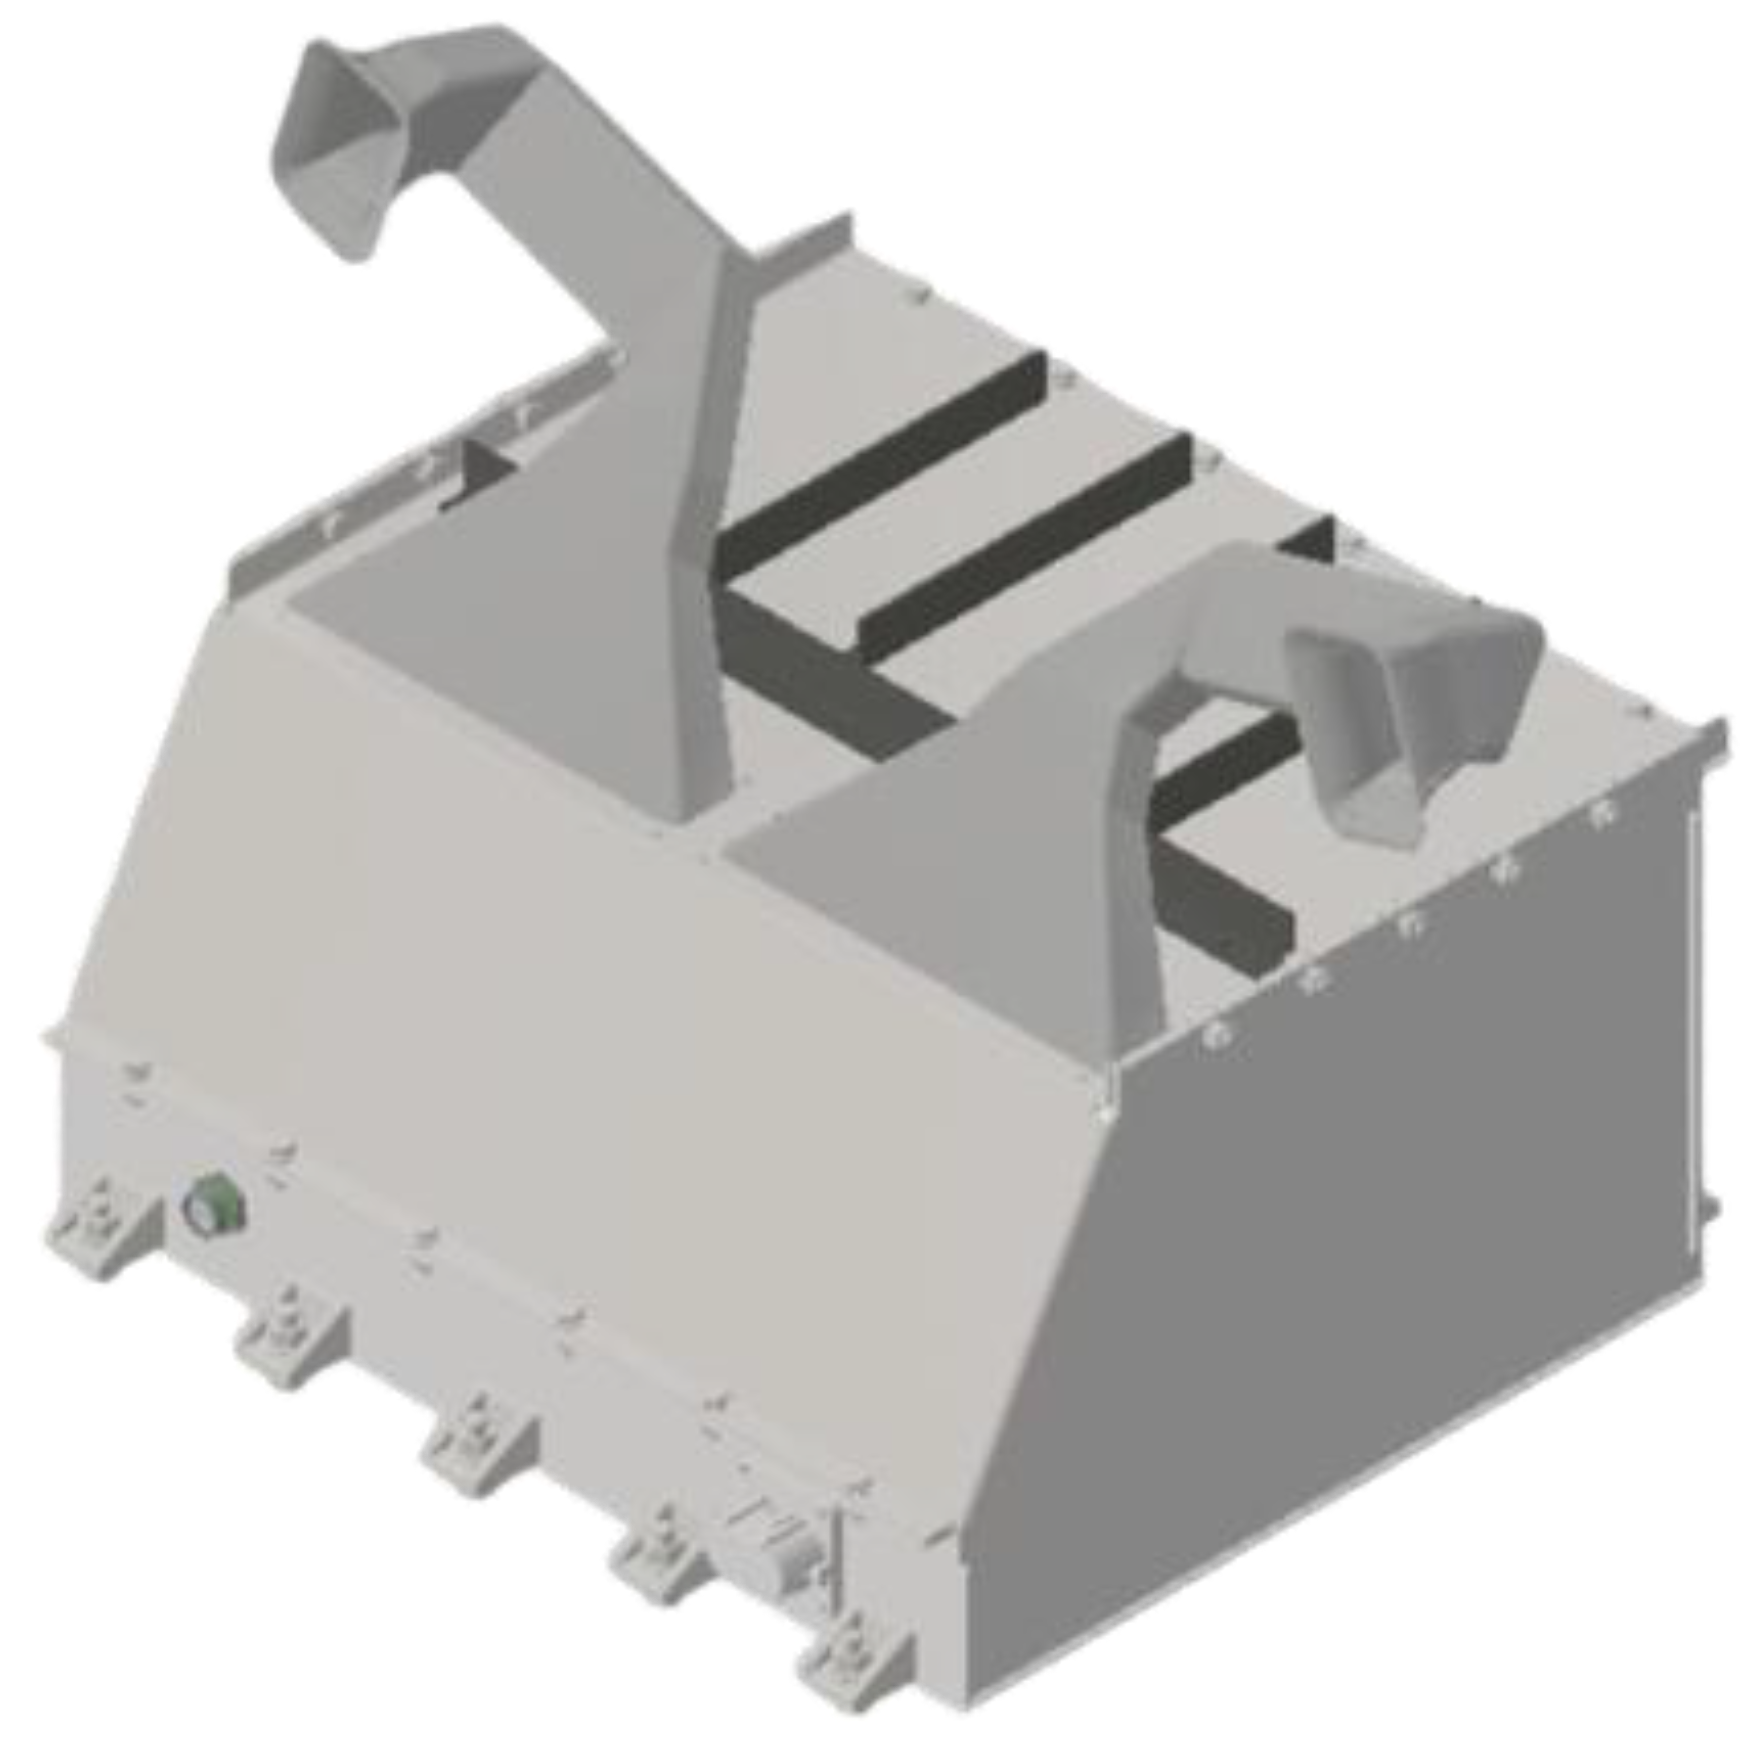
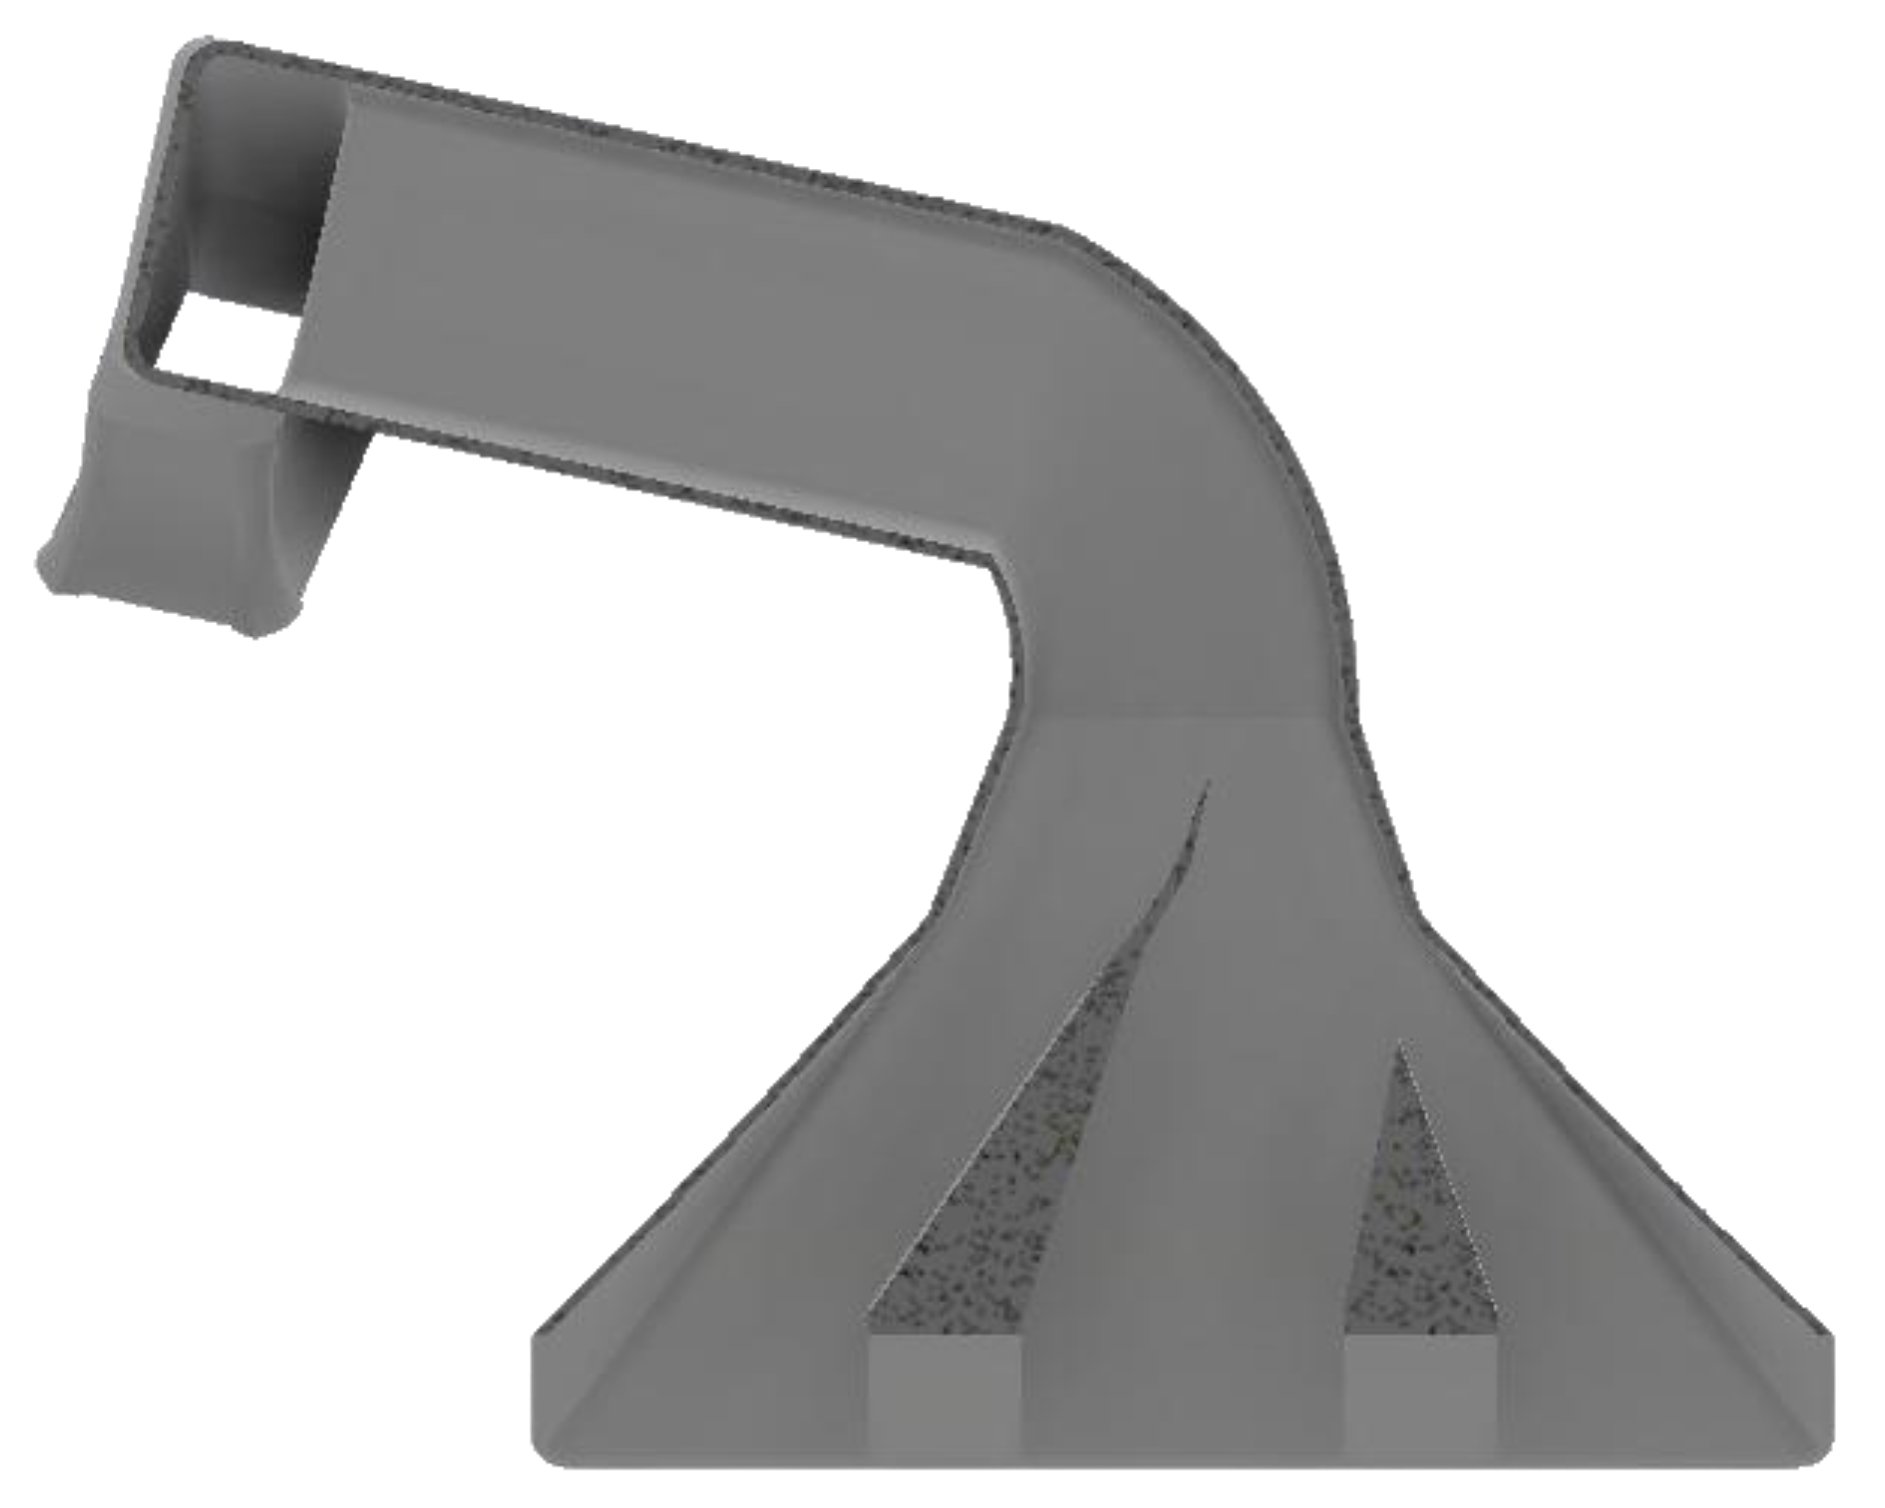
The air duct system was designed to channel airflow from the lateral side of the main hoop of the chassis directly to the battery modules, with each inlet serving three modules as shown in Figure 3. The entrance to the battery measured 263 mm in length and 46 mm in width, while the overall air intake had a height of 81 mm. The primary objective was to ensure uniform airflow across the modules, maintaining effective cooling while adhering to the pre-defined external constraints of the vehicle design.
Figure 3.
Initial geometry of the air duct.
Initial simulations revealed a significant challenge caused by centrifugal forces acting on the airflow as it moved through the curved ducts. These forces pushed most of the airflow toward the outer wall of the ducts, resulting in an uneven distribution of cooling air. This effect led to a disproportionate concentration of airflow toward the middle modules, leaving the outer modules insufficiently cooled.
To address this imbalance, the internal structure of the ducts was redesigned to split the airflow closer to the outer wall, as shown in Figure 4. Internal channels and guides were introduced to redistribute the air more evenly across all three modules. These adjustments ensured that the airflow was redirected effectively to each module, reducing the dominance of airflow toward the middle and improving cooling uniformity.
Figure 4.
Air duct with air splitters inside.
Another challenge identified during the design process was the presence of free spaces around the modules, which allowed air to bypass the cells rather than flow directly through them. To address this, the free spaces were reduced, creating additional airflow resistance. This adjustment forced the air through the modules and over the battery cells, significantly improving convective heat transfer and reducing temperature gradients across the modules. Additionally, small air directors were added near the modules to channel airflow directly against the cells, Figure 5, further enhancing heat dissipation.
Figure 5.
Final geometry of half of the battery cooling system, represented in Space Claim.
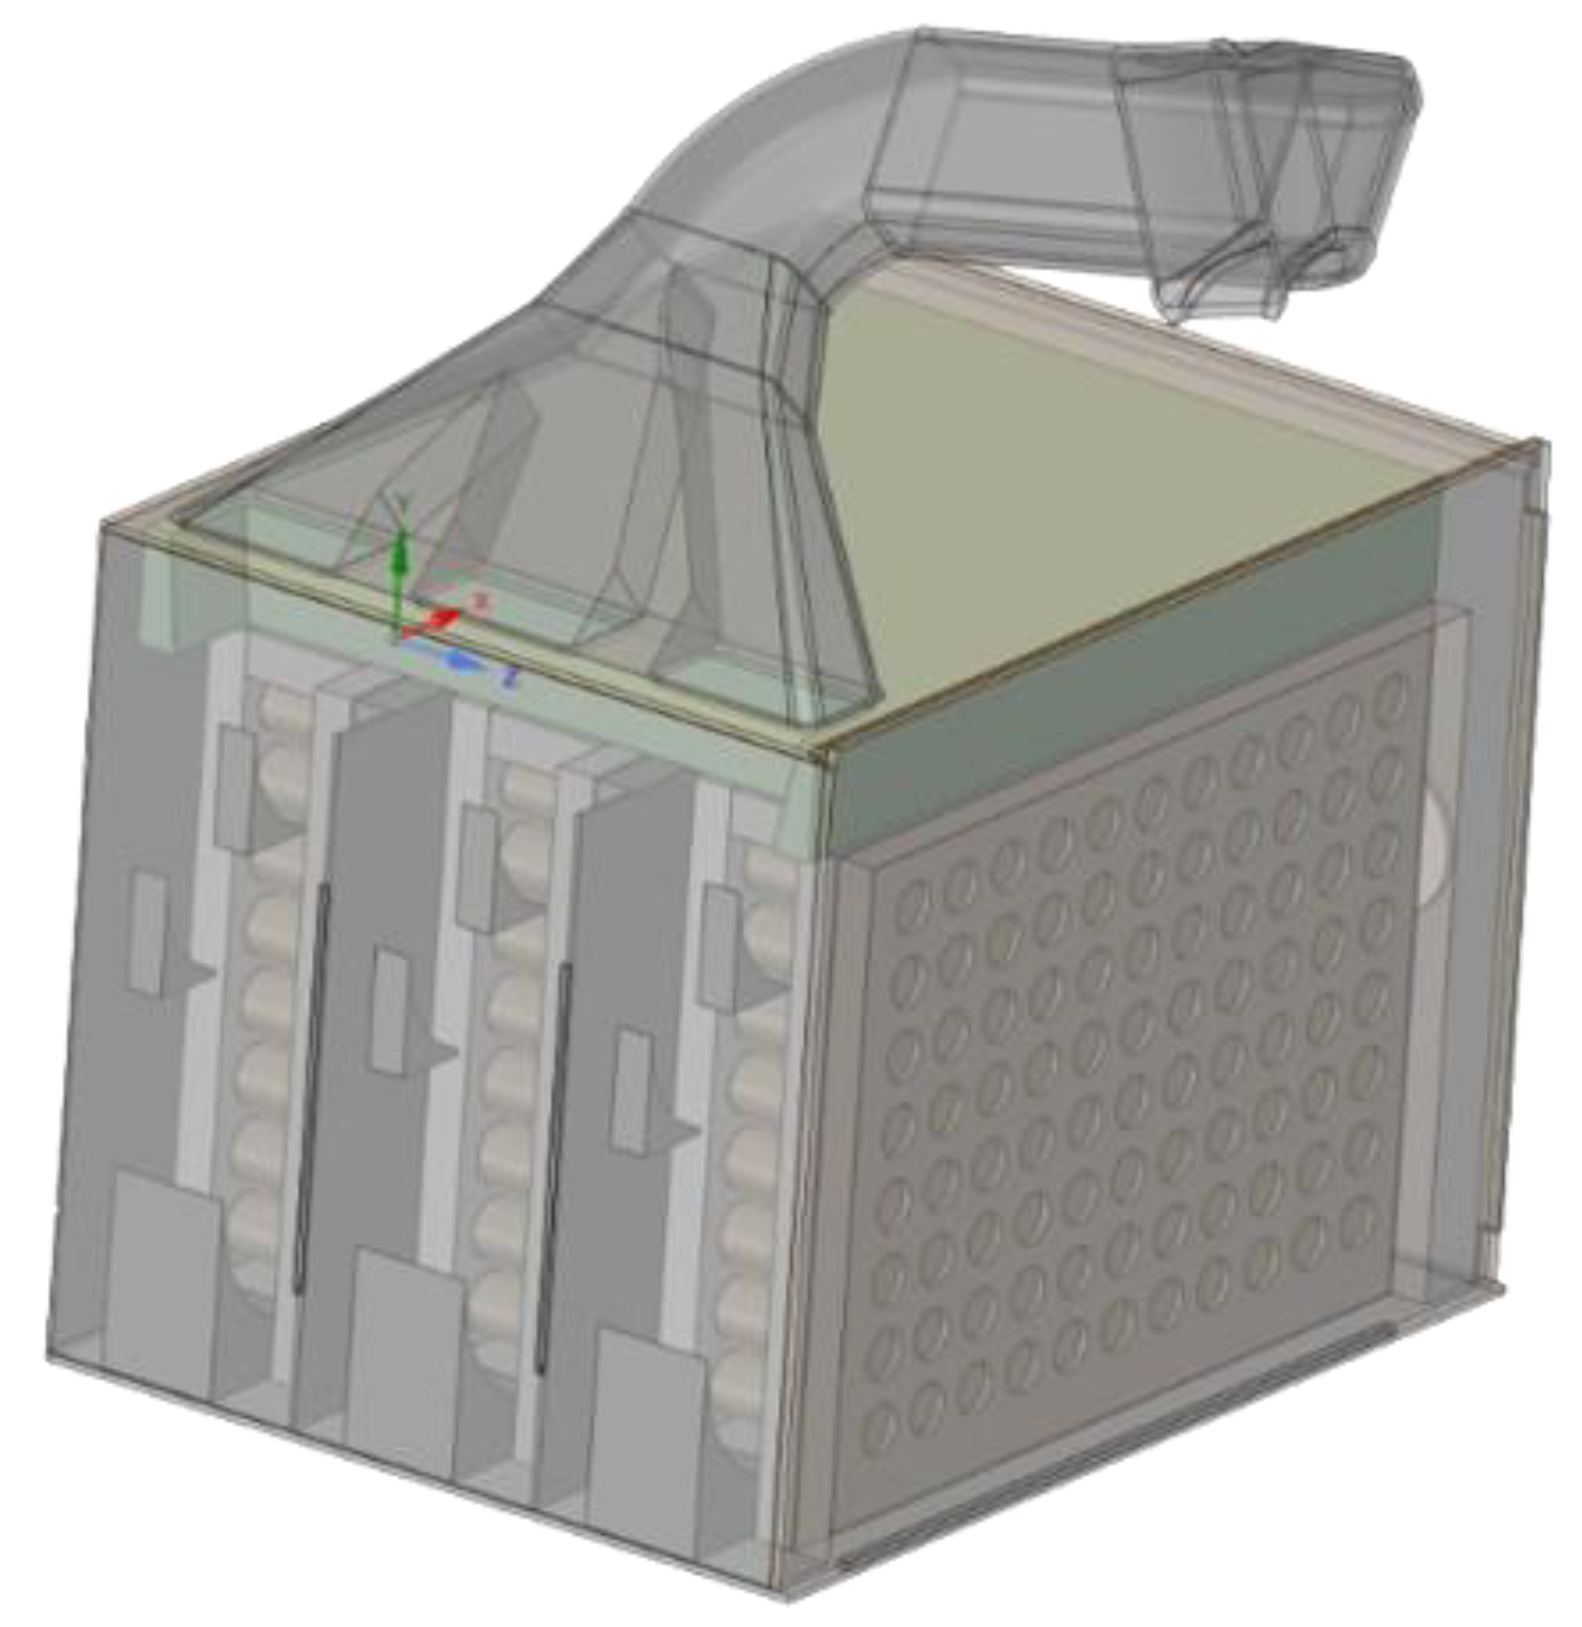
The final design successfully combined these refinements, resulting in a BCS capable of delivering uniform airflow across all modules.
3. Numerical Model
3.1. Computational Domain
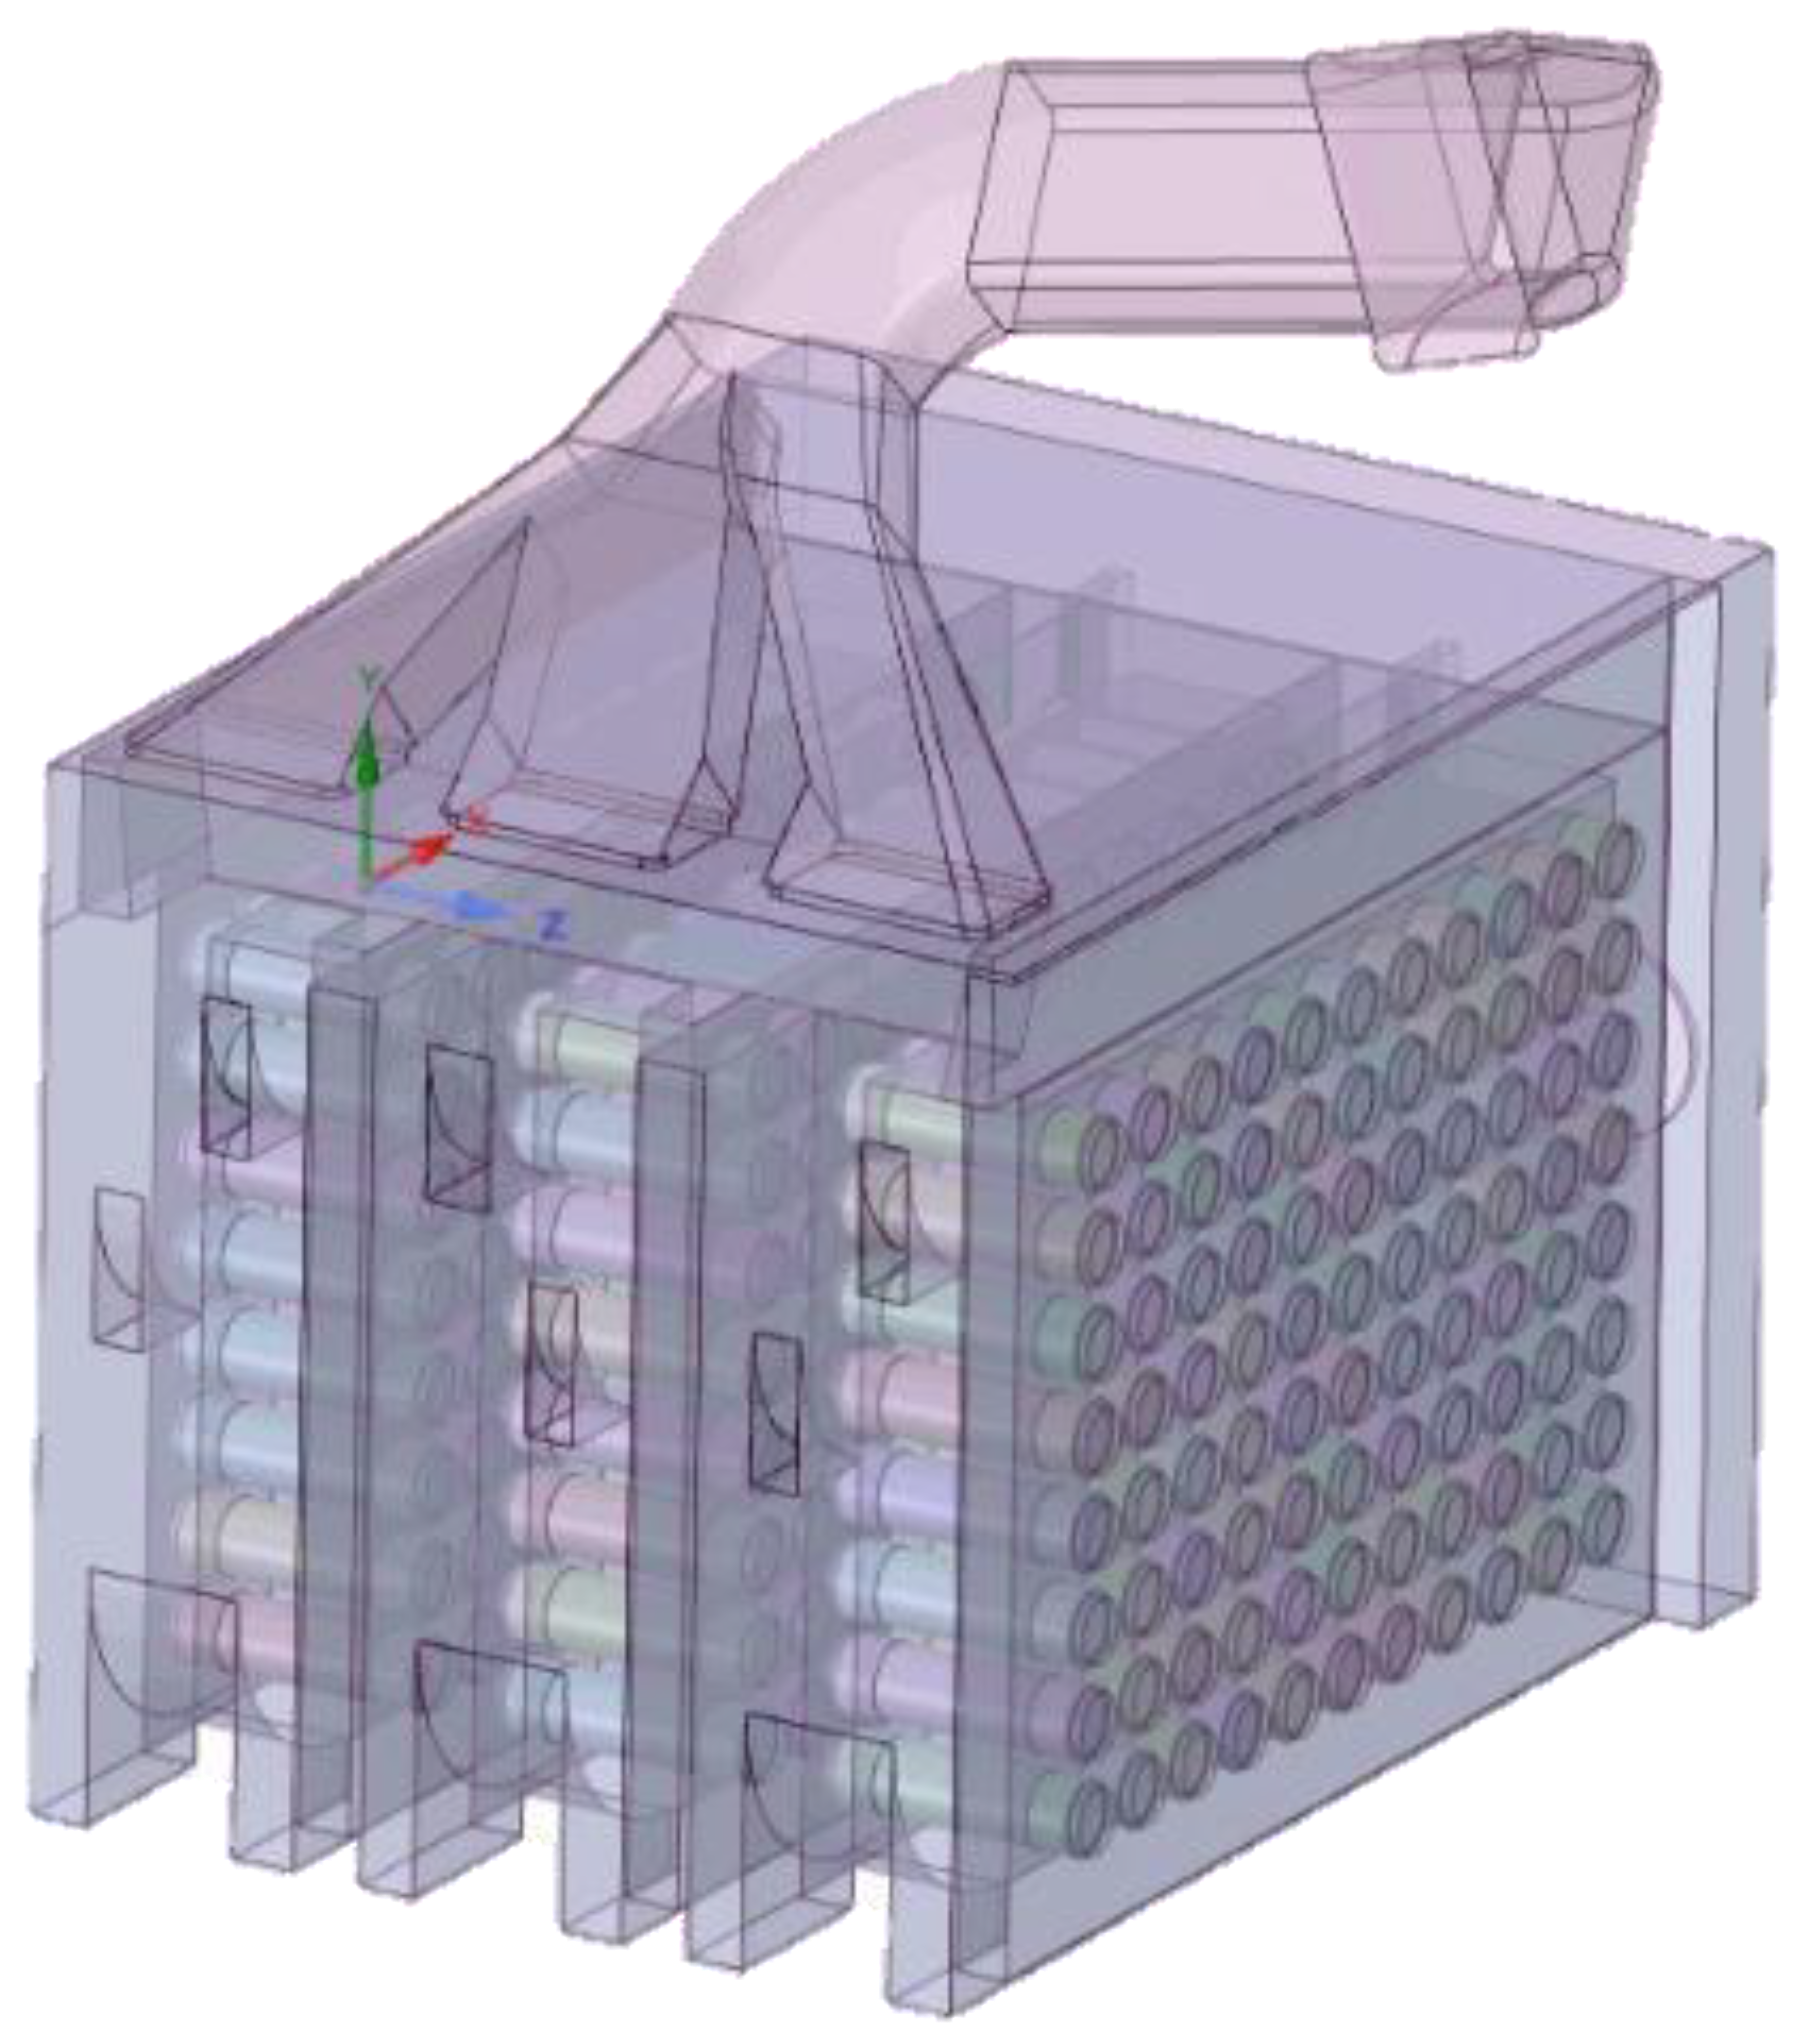
The preparation of the battery geometry was a critical step to ensure the accuracy of the thermal and airflow simulations. This process involved isolating the regions of interest and defining the flow volume where air would move around the battery cells. These steps were essential for effective meshing and boundary condition application, providing a reliable foundation for the simulations.
The preparation process began with a thorough feature repair of the battery model. Ensuring that all geometrical features were clean, properly connected, and free of inconsistencies was critical to avoid potential errors during meshing and simulation. Furthermore, to optimize computational efficiency, the simulation leveraged the symmetrical nature of the battery pack. Only half of the geometry was modeled, with a symmetry plane applied to represent the mirrored half as shown in Figure 6. This approach significantly reduced computation time and resource requirements while maintaining the accuracy of airflow and thermal interaction simulations across the entire battery geometry.
Figure 6.
Final geometry of half of the battery cooling system, represented in Space Claim.
3.2. Meshing Strategy
The meshing process for the BCS was conducted using Fluent Meshing to ensure high-quality representation of the geometry and effective simulation of thermal and fluid dynamics. Each step of the meshing process was carefully tailored to the system’s unique requirements, balancing computational efficiency with simulation accuracy.
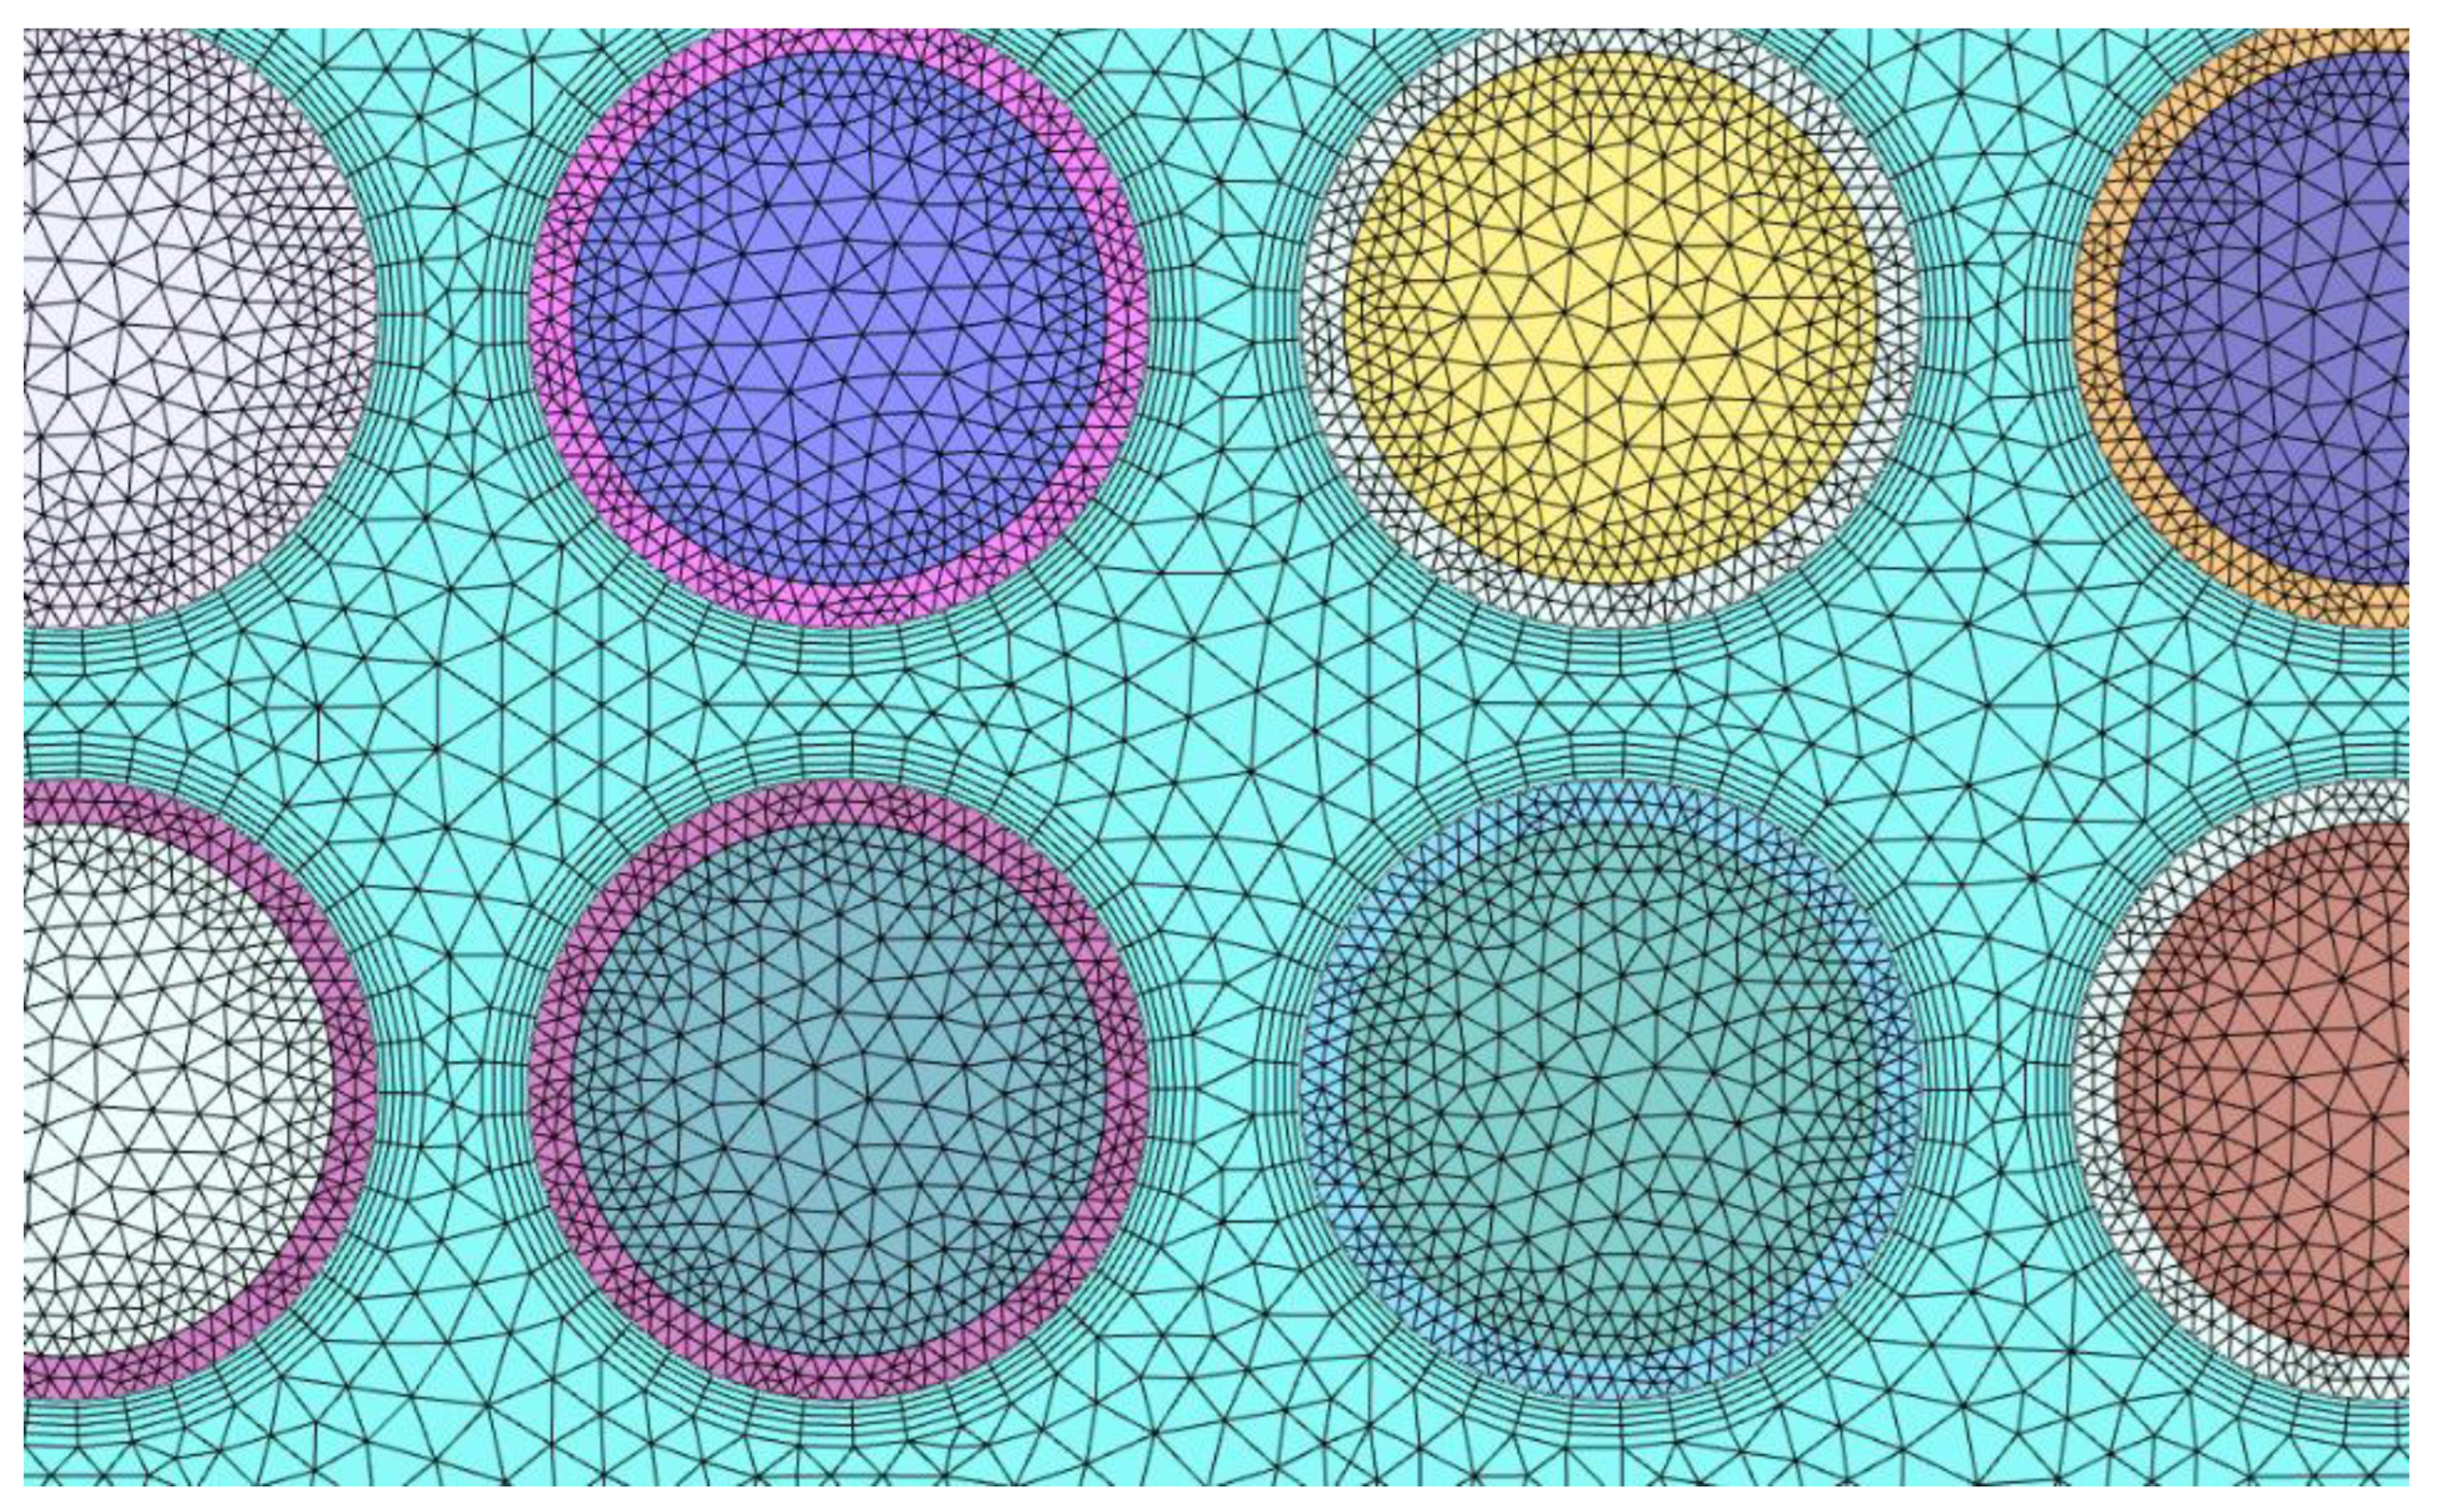
The initial meshing step involved defining the base mesh for the computational domain, ensuring that all key features of the geometry were captured. A fine surface mesh was applied to critical areas such as the air duct walls, battery module surfaces, and the battery cells themselves using curvature sizing. This approach allowed the mesh to conform closely to complex geometrical features, ensuring that regions with high curvature received finer resolution for improved accuracy.
Inflation layers were then applied around the battery cells, as shown in Figure 7, to improve the resolution of convection heat transfer. These layers captured the steep velocity and temperature gradients near the solid-fluid interfaces, providing a more precise representation of the thermal interactions between the airflow and the heat-generating cells. This refinement was crucial for evaluating the cooling system’s effectiveness in maintaining uniform temperatures.
The bulk of the flow domain was meshed using a hex-core strategy. This approach was selected to provide an optimal balance between computational efficiency and accuracy in larger, less geometrically complex regions. The hex-core mesh allowed for sufficient resolution of the airflow patterns, while minimizing the computational cost associated with finer meshes.
Figure 7.
Mesh detail around the battery cells with inflation layers.
To further optimize the computational effort, a symmetry plane was employed in the meshing process. This approach leveraged the symmetrical design of the battery pack, allowing only half of the geometry to be modeled. By mirroring the results across the symmetry plane, the computational domain was effectively halved without compromising the accuracy of the simulations.
Finally, rigorous mesh quality checks were performed, focusing on key metrics such as skewness, orthogonal quality, and aspect ratio. Areas with high gradients or complex geometry were carefully refined to avoid numerical instabilities. A mesh independence study was conducted to confirm that the simulation results were consistent across different mesh densities, ensuring reliability and robustness.
By following these steps, the meshing process prepared the model with elements, faces and nodes.
3.3. Simulation Setup
The setup for the BCS simulations was meticulously configured to evaluate the system’s thermal and airflow performance under operational conditions. This process involved defining materials, boundary conditions, turbulence models, and solver parameters to ensure an accurate representation of real-world behavior. Special attention was given to capturing the interaction between airflow and heat dissipation within the battery pack, as these factors are critical to maintaining cell temperatures below the operational threshold of 60 °C. By simulating different ambient temperatures, of 25 °C and 30 °C, and airflow conditions, the setup provided valuable insights into the cooling system's efficiency and effectiveness.
3.3.1. Materials Assignment
The accurate assignment of material properties was a critical step in the simulation setup to ensure precise representation of the battery cooling system's behavior. Each material within the system, from the battery casing to the airflow region, was carefully defined based on its physical and thermal characteristics.
The battery casing, constructed from S275JR steel, was assigned to its specific thermal and structural properties. These properties were crucial for modeling the casing's role in conducting and dissipating heat generated within the battery pack. Similarly, the module housing, made by Simona PVC CAW, was assigned its thermal attributes to capture the interaction between the modules and surrounding airflow accurately.
For the battery cells, bibliographic research on lithium-ion cells, specifically Molicel P45B, provided the necessary thermal data [13,14]. These parameters allowed for the simulation of heat generation during operation, reflecting the cells' real-world discharge conditions.
The airflow, modeled as a fluid region, was assigned properties corresponding to air at ambient temperatures of 25 °C and 30 °C [15]. These conditions were chosen to evaluate the cooling system under varying environmental scenarios, simulating realistic race conditions. The thermal conductivity (k), specific heat capacity (Cp), density () and dynamic viscosity () of the air were integral to capture its role as a cooling medium, ensuring accurate predictions of convective heat transfer.
The material properties of each component, summarized in Table 1, underline the fidelity of the simulation. By defining these properties, the model effectively captured the thermal interactions and airflow dynamics within the battery system, enabling robust evaluation and optimization of the cooling design.

Table 1.
Air and material properties assigned in Fluent.
| Parameter | Air (25/30 °C) | Molicel P45B | S275JR steel | Simona PVC |
|---|---|---|---|---|
| ρ (kg/m3) | 1.184 / 1.164 | 2887.16 | 7800 | 1440 |
| Cp (J/kg.K) | 1007 / 1007 | 888 | 470 | 1076 |
| k (W/m.K) | 0.02551 / 0.02588 | 0.83/11.55 (radial/axial) | 42.5 | 0.143 |
| (kg/m.s) | 1.849 / 1.872 | - | - | - |
3.3.2. Boundary and Thermal Conditions
The boundary conditions for the battery cooling simulation were carefully designed to ensure accurate airflow and thermal analysis. At the air intake, a velocity inlet boundary condition was defined based on previously conducted wind tunnel testing performed during the broader scope of this project. These tests determined an average velocity range between 17.87 m/s and 18.14 m/s. To account for potential variations, three inlet velocities of 18 m/s, 17 m/s, and 16 m/s were tested. The temperature of the air at the inlet was set at two values: 25 °C for initial tests and 30 °C for subsequent evaluations.
At the outlet, a pressure outlet condition was applied with a gauge pressure of 0 Pa, representing ambient atmospheric conditions. Additionally, a target mass flow rate was imposed at the outlet to ensure that the mass flow rate matched the air entering the system, reflecting the effects of fans used to maintain airflow consistency. The volumetric flow rate () was calculated using:
where V is the velocity at the inlet, and A is the cross-sectional area of the inlet. Substituting an inlet velocity of 18 m/s and an inlet area of 0.004 , the volumetric flow rate was computed as . The mass flow rate () was then figured out by:
The resulting mass flow rate was . For inlet velocities of 17 m/s and 16 m/s, the mass flow rates were and , respectively. These values were used as targets at the outlet to simulate the fan-driven airflow through the battery pack.
The accurate modeling of the battery cooling system required detailed calculations for the thermal coefficients and heat generation rates to replicate the real-world operational behavior of the system. Each battery cell was treated as a volumetric heat source, and the heat transfer between the air and cell surfaces was modeled using empirical correlations for convective heat transfer. These parameters were critical for simulating thermal interactions and airflow dynamics within the cooling system.
The heat generation of the Molicel P45B cells was determined based on the average thermal energy dissipated during discharge. Each cell produced 3.86 W. Using the cell’s physical dimensions, with a diameter (d) of 21 mm and a height (he) of 70 mm, the volume of a single cell, , was calculated using:
substituting the values the volume of a cell is equal to .
Thus, the source term applied to each cell, representing thermal power generation in , was calculated then computed according to:
which returned a thermal power generation per cubic meter of . The thermal source term, representing heat generation within each cell, was applied uniformly across all 264 cells in the model. This setup ensured that the simulation accurately reflected the consistent heat flux produced by each cell during operation.
These boundary conditions were critical for replicating realistic operating conditions and ensuring the accuracy and reliability of the simulation results.
3.3.3. Turbulence Model and Solver Settings
The k-ω SST (Shear Stress Transport) turbulence model was chosen for its ability to accurately predict both laminar and turbulent flows, which are essential for the complex dynamics within the BCS. This model is particularly effective under adverse pressure gradients and boundary layer separation, conditions commonly encountered in the airflow through the cooling ducts and around the battery cells. Its blending of the k-ε model for the core flow with the k-ω model near the walls enabled precise boundary layer predictions, essential for capturing heat transfer and airflow behaviour.
The simulations were conducted under steady-state conditions, using a solver configuration that emphasized numerical stability and convergence. A pseudo-transient initialization method was employed to stabilize the solution process during the initial iterations. This approach involved iterative adjustments to under-relaxation factors, allowing controlled updates to critical variables such as velocity, pressure, and temperature. Hence, an incompressible pressure-based solver, ensuring the mass conservation of the velocity field by solving the pressure equation, was used for the CFD simulations. Essentially, while imposing mass conservation, the pressure equation was obtained by derivation of the continuity and momentum equations by the pressure. Since the governing equations of the CFD model are non-linear and are interlinked, the solution can only be obtained through an iterative process. To solve these equations simultaneously, the Coupled algorithm was considered. This algorithm was preferred over the Semi-Implicit Method for Pressure-Linked Equations (SIMPLE) and Pressure-Implicit with Splitting of Operators (PISO) algorithms to solve the pressure-velocity coupling since it is more efficient, requires a reduced number of iterations to converge, and is useful for steady flow simulations, and presents better results for meshes with a reduced quality.
For spatial discretization, the convection terms of the different transport equations are solved using second-order upwind methods. For the gradient terms, to evaluate diffusive fluxes and velocity, the least-squares cell-based method was selected. Both methods for spatial discretization were selected due to their easier convergence and a less computationally intensive simulation. In addition to the previous interpolation schemes, for pressure second-order was selected due to their suitability for highly swirling flows involving steep pressure gradients.
Furthermore, the convergence criterion for the iterative calculation was defined as 1x10⁻³ for continuity, momentum, and turbulence equations and 1x10⁻⁵ for energy equation. The contribution of gravitational acceleration was implemented in a downwards direction along the y-axis, with a magnitude of 9.81 m/s2. The simulations were computed in a 16 (logical) processor with 128 GB of memory RAM.
4. Results and Discussion
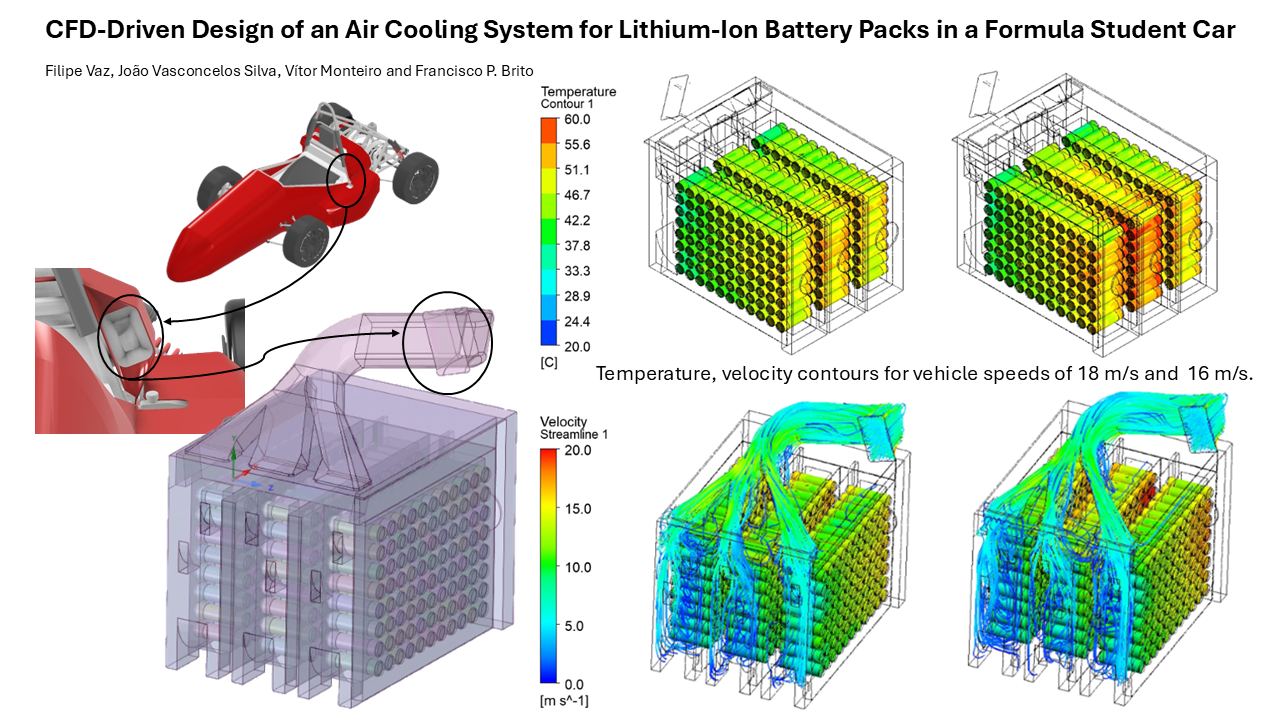
The performance of the BCS was evaluated through detailed CFD simulations under varying operational conditions. The results presented in this chapter focus on the system's ability to regulate battery cell temperatures and ensure compliance with safety requirements, particularly maintaining temperatures below the critical threshold of 60 °C. The analysis includes the thermal response of the cells, airflow behavior, and the system's overall heat transfer efficiency at different inlet velocities and ambient temperatures.
To provide a comprehensive evaluation, the results are divided into two main sections. The first examines the system's performance at nominal ambient conditions (25 °C), while the second addresses elevated ambient temperatures (30 °C) to assess the cooling system's robustness under more challenging thermal loads. For each condition, numerical data is supplemented with contour plots to visualize temperature distribution and airflow patterns, offering critical insights into the system’s behavior and potential areas for optimization.
By systematically analyzing these scenarios, the results aim to establish a clear understanding of the cooling system's capabilities and limitations, highlighting the importance of airflow velocity in ensuring uniform cooling and maintaining thermal safety across all battery cells.
4.1. Thermal Performance
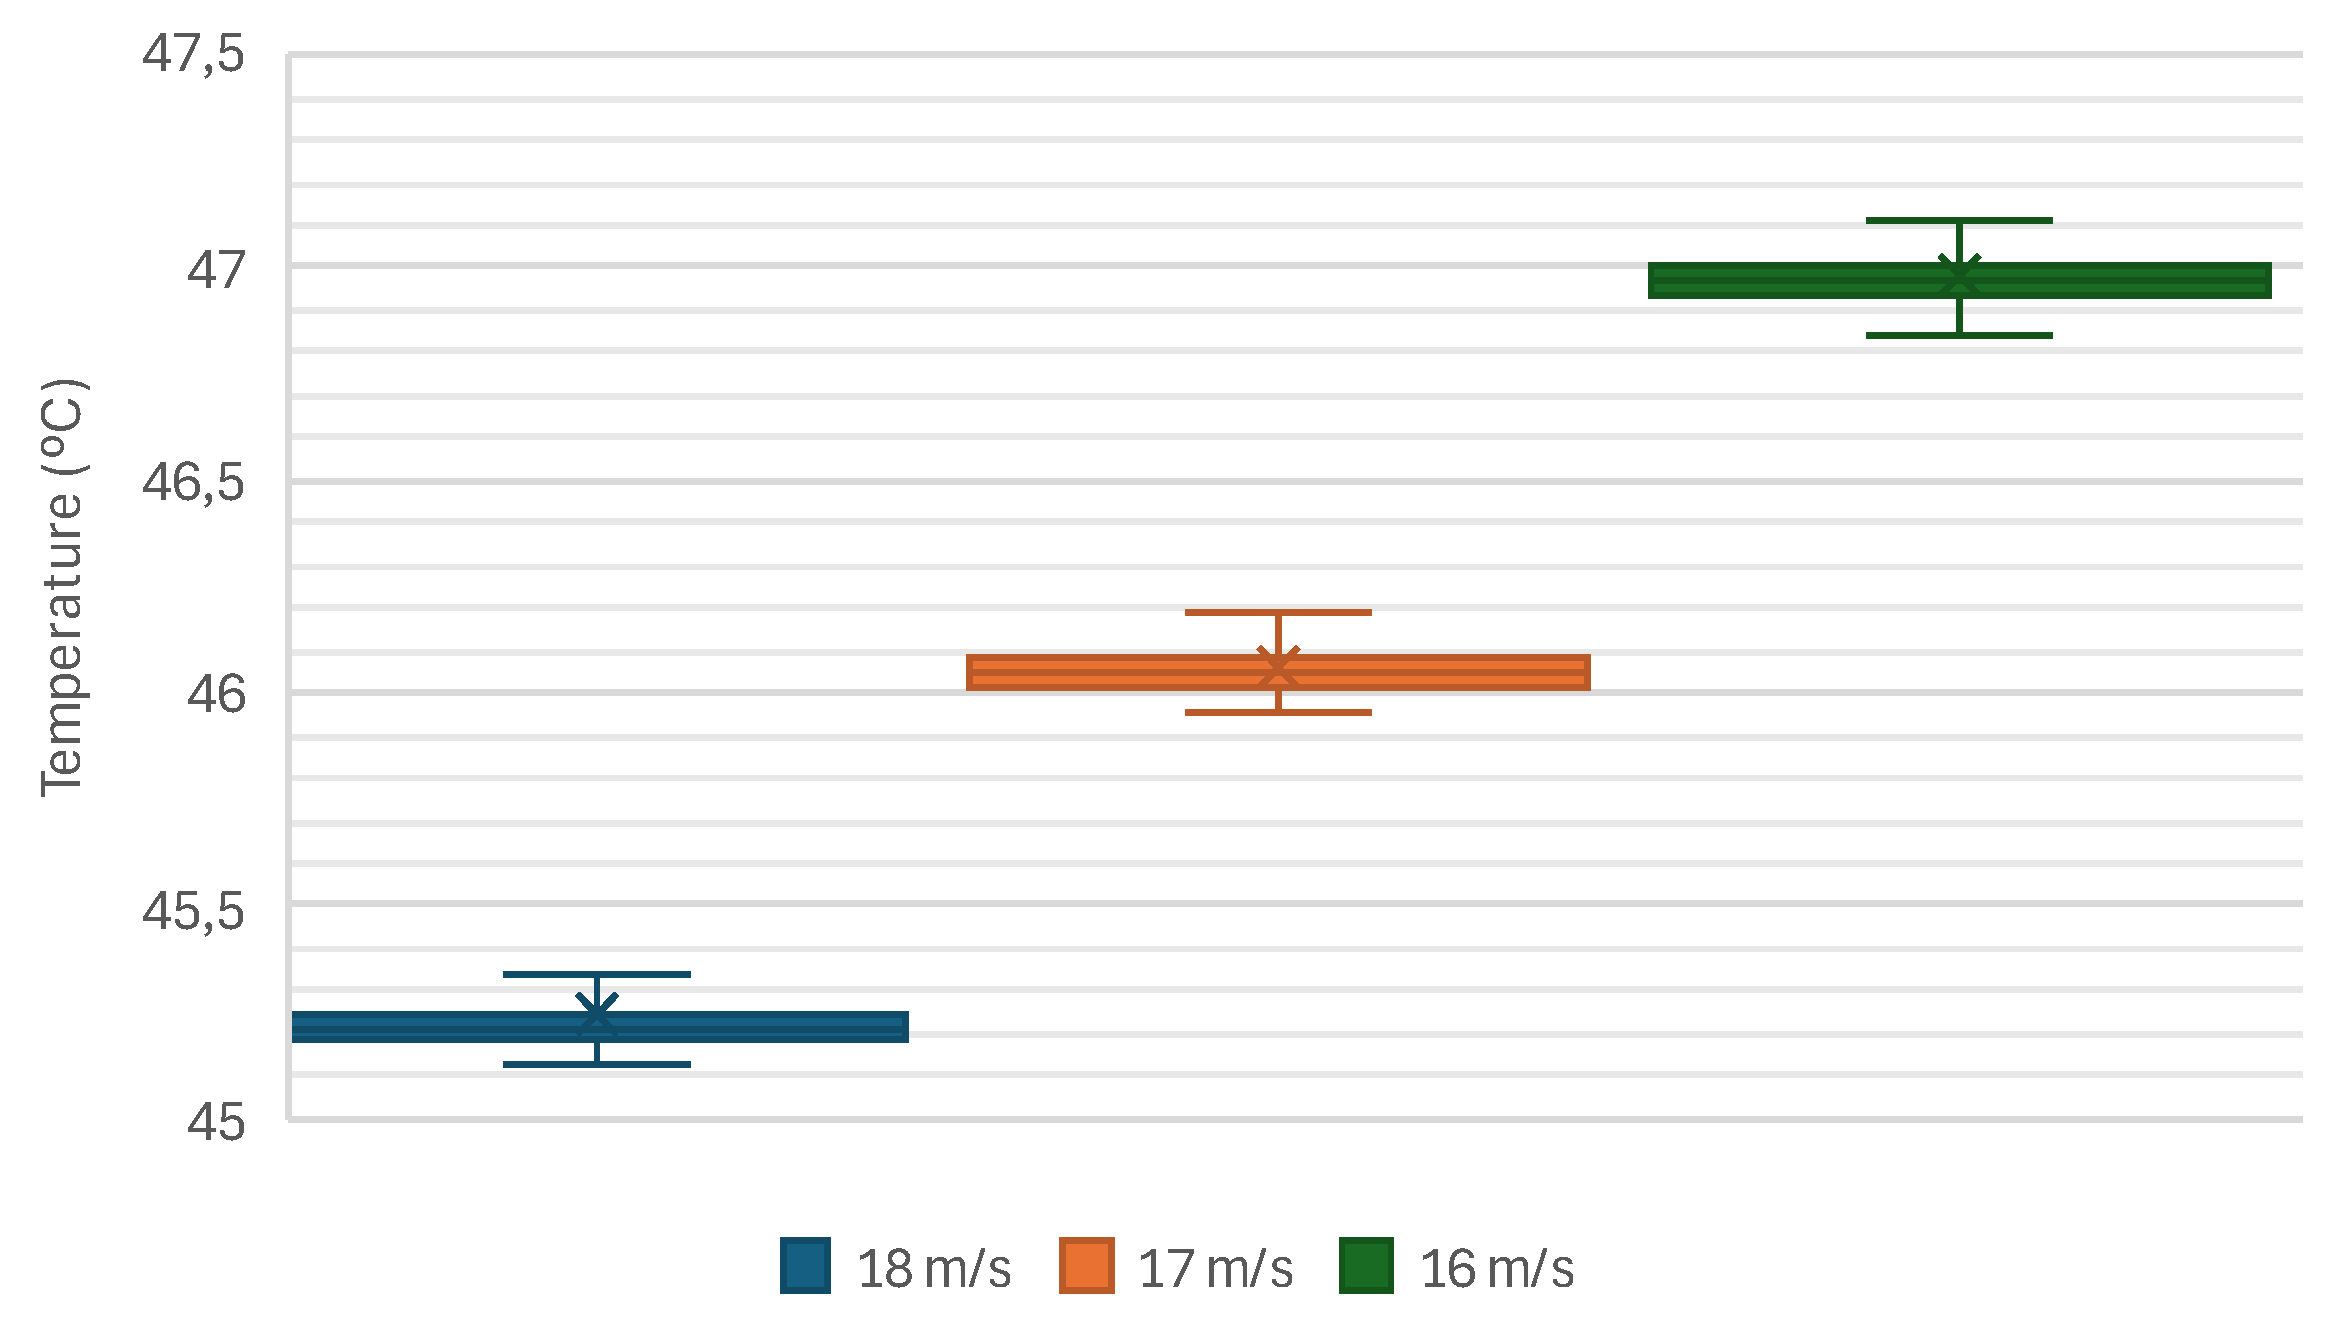
The BCS's performance was evaluated under an ambient temperature of 25 °C for inlet velocities of 16 m/s, 17 m/s, and 18 m/s. Figure 8 presents the average temperature of the battery cells as a function of iteration number. For an inlet velocity of 18 m/s, the average cell temperature stabilized at 45.21 ± 0.04 °C, while at 17 m/s and 16 m/s, the average temperatures were slightly higher at 46.04 ± 0.04 °C and 46.95 ± 0.04 °C, respectively.
Figure 8.
Average temperatures of the cells for the different inlet speeds at 25 °C of ambient temperature.
Figure 8.
Average temperatures of the cells for the different inlet speeds at 25 °C of ambient temperature.
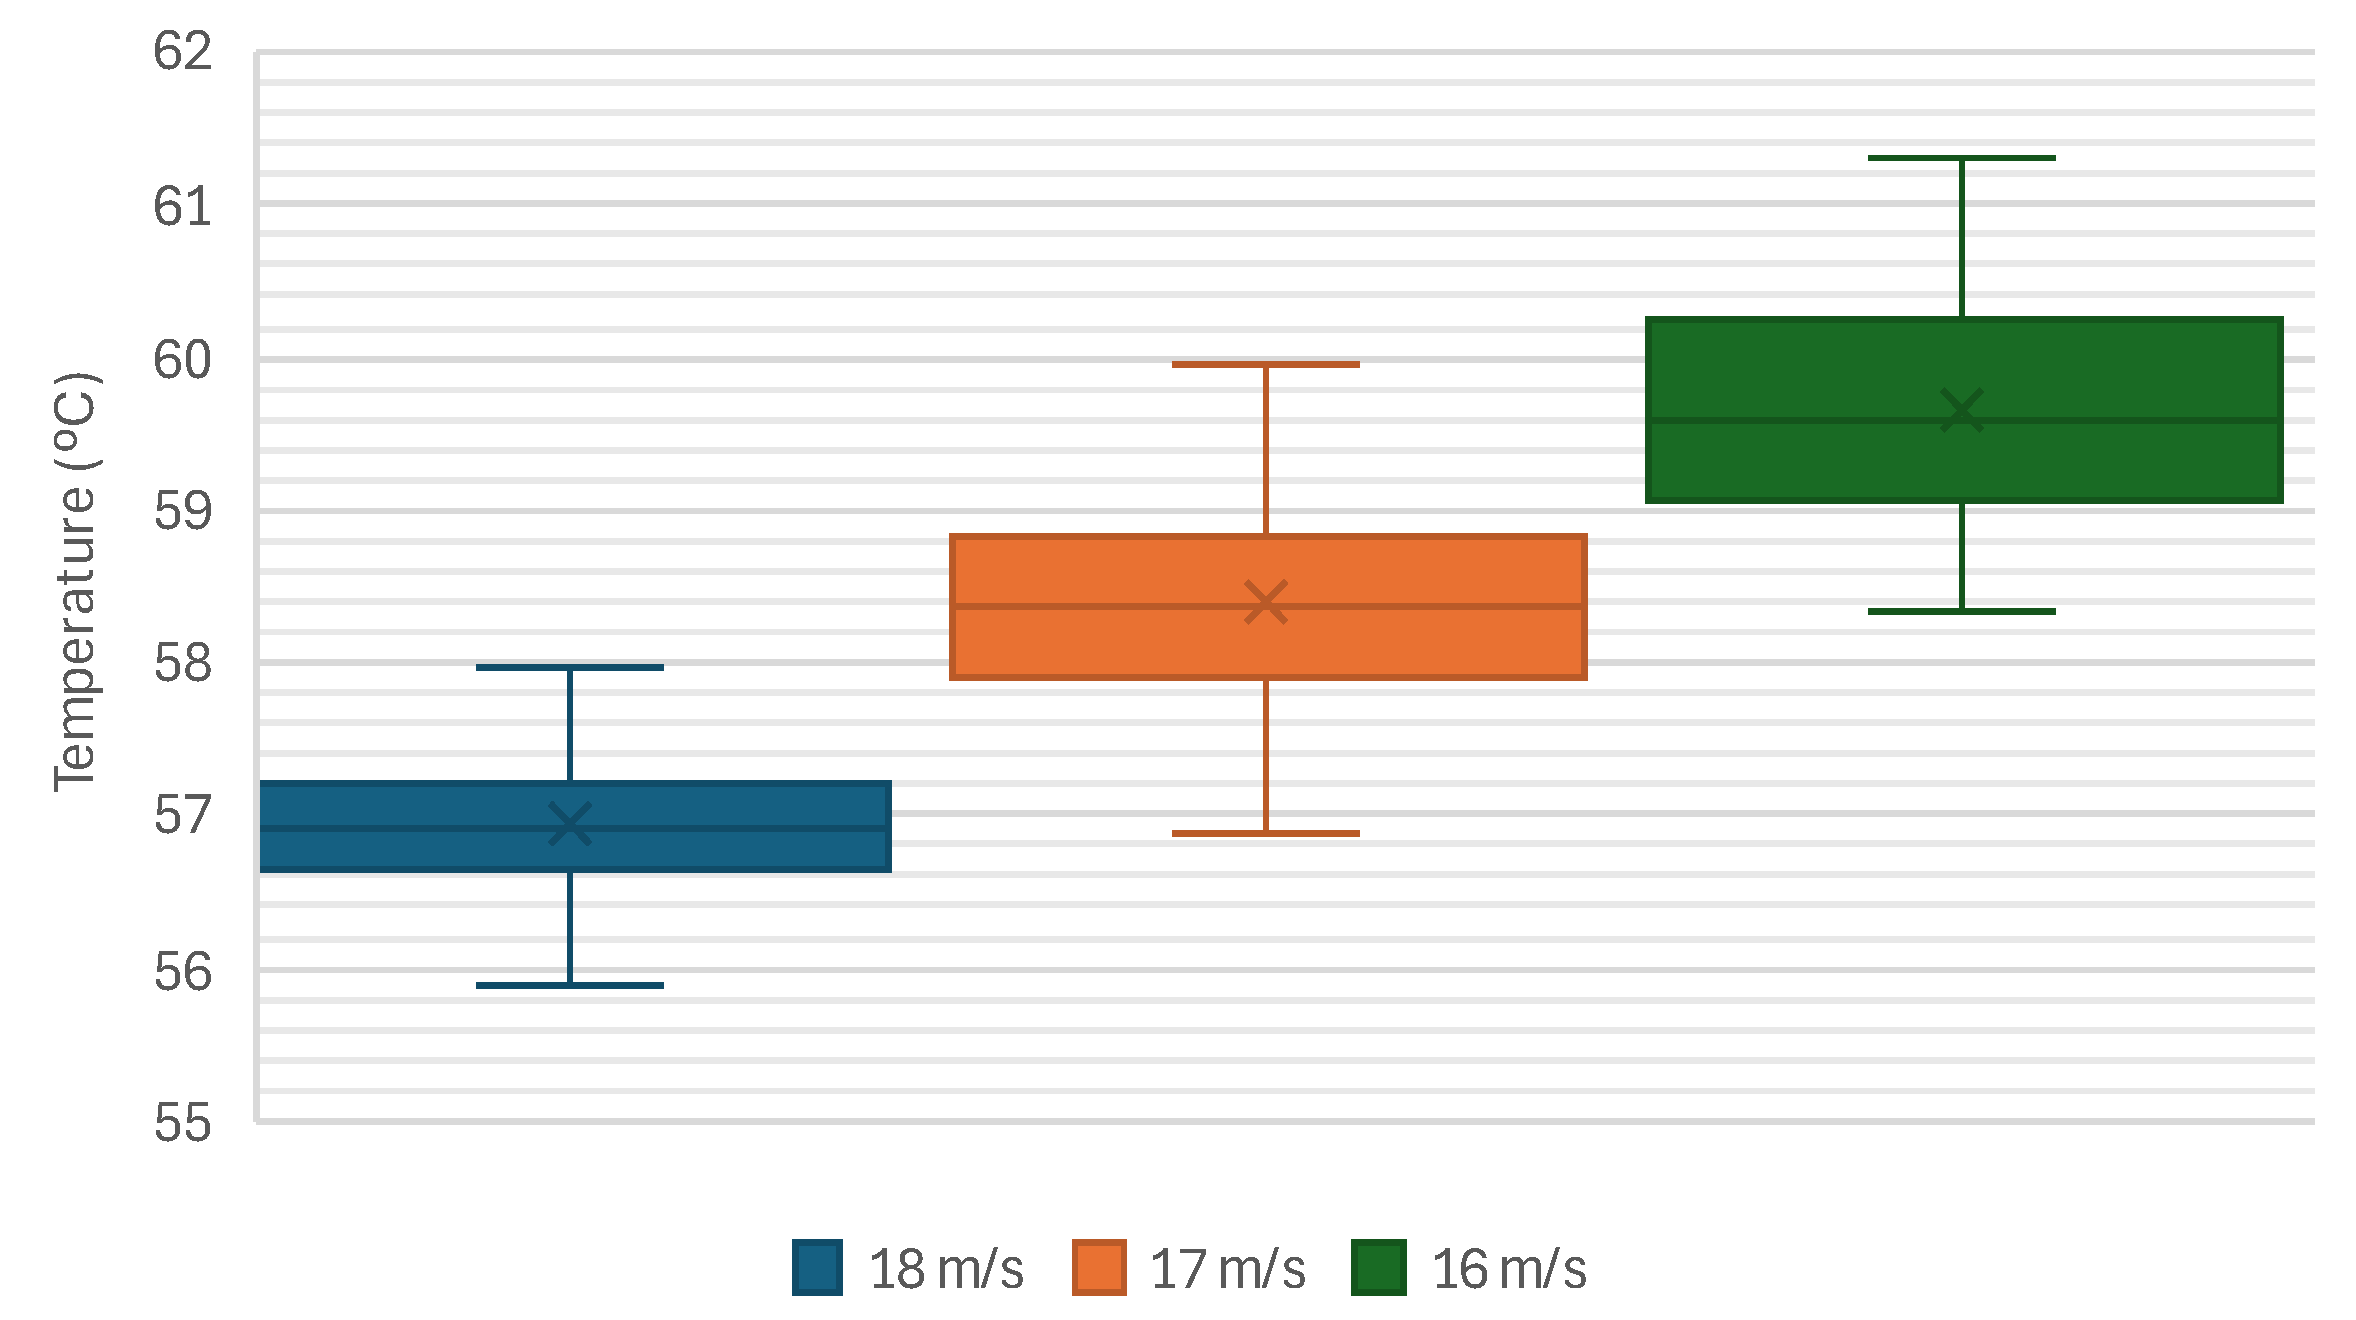
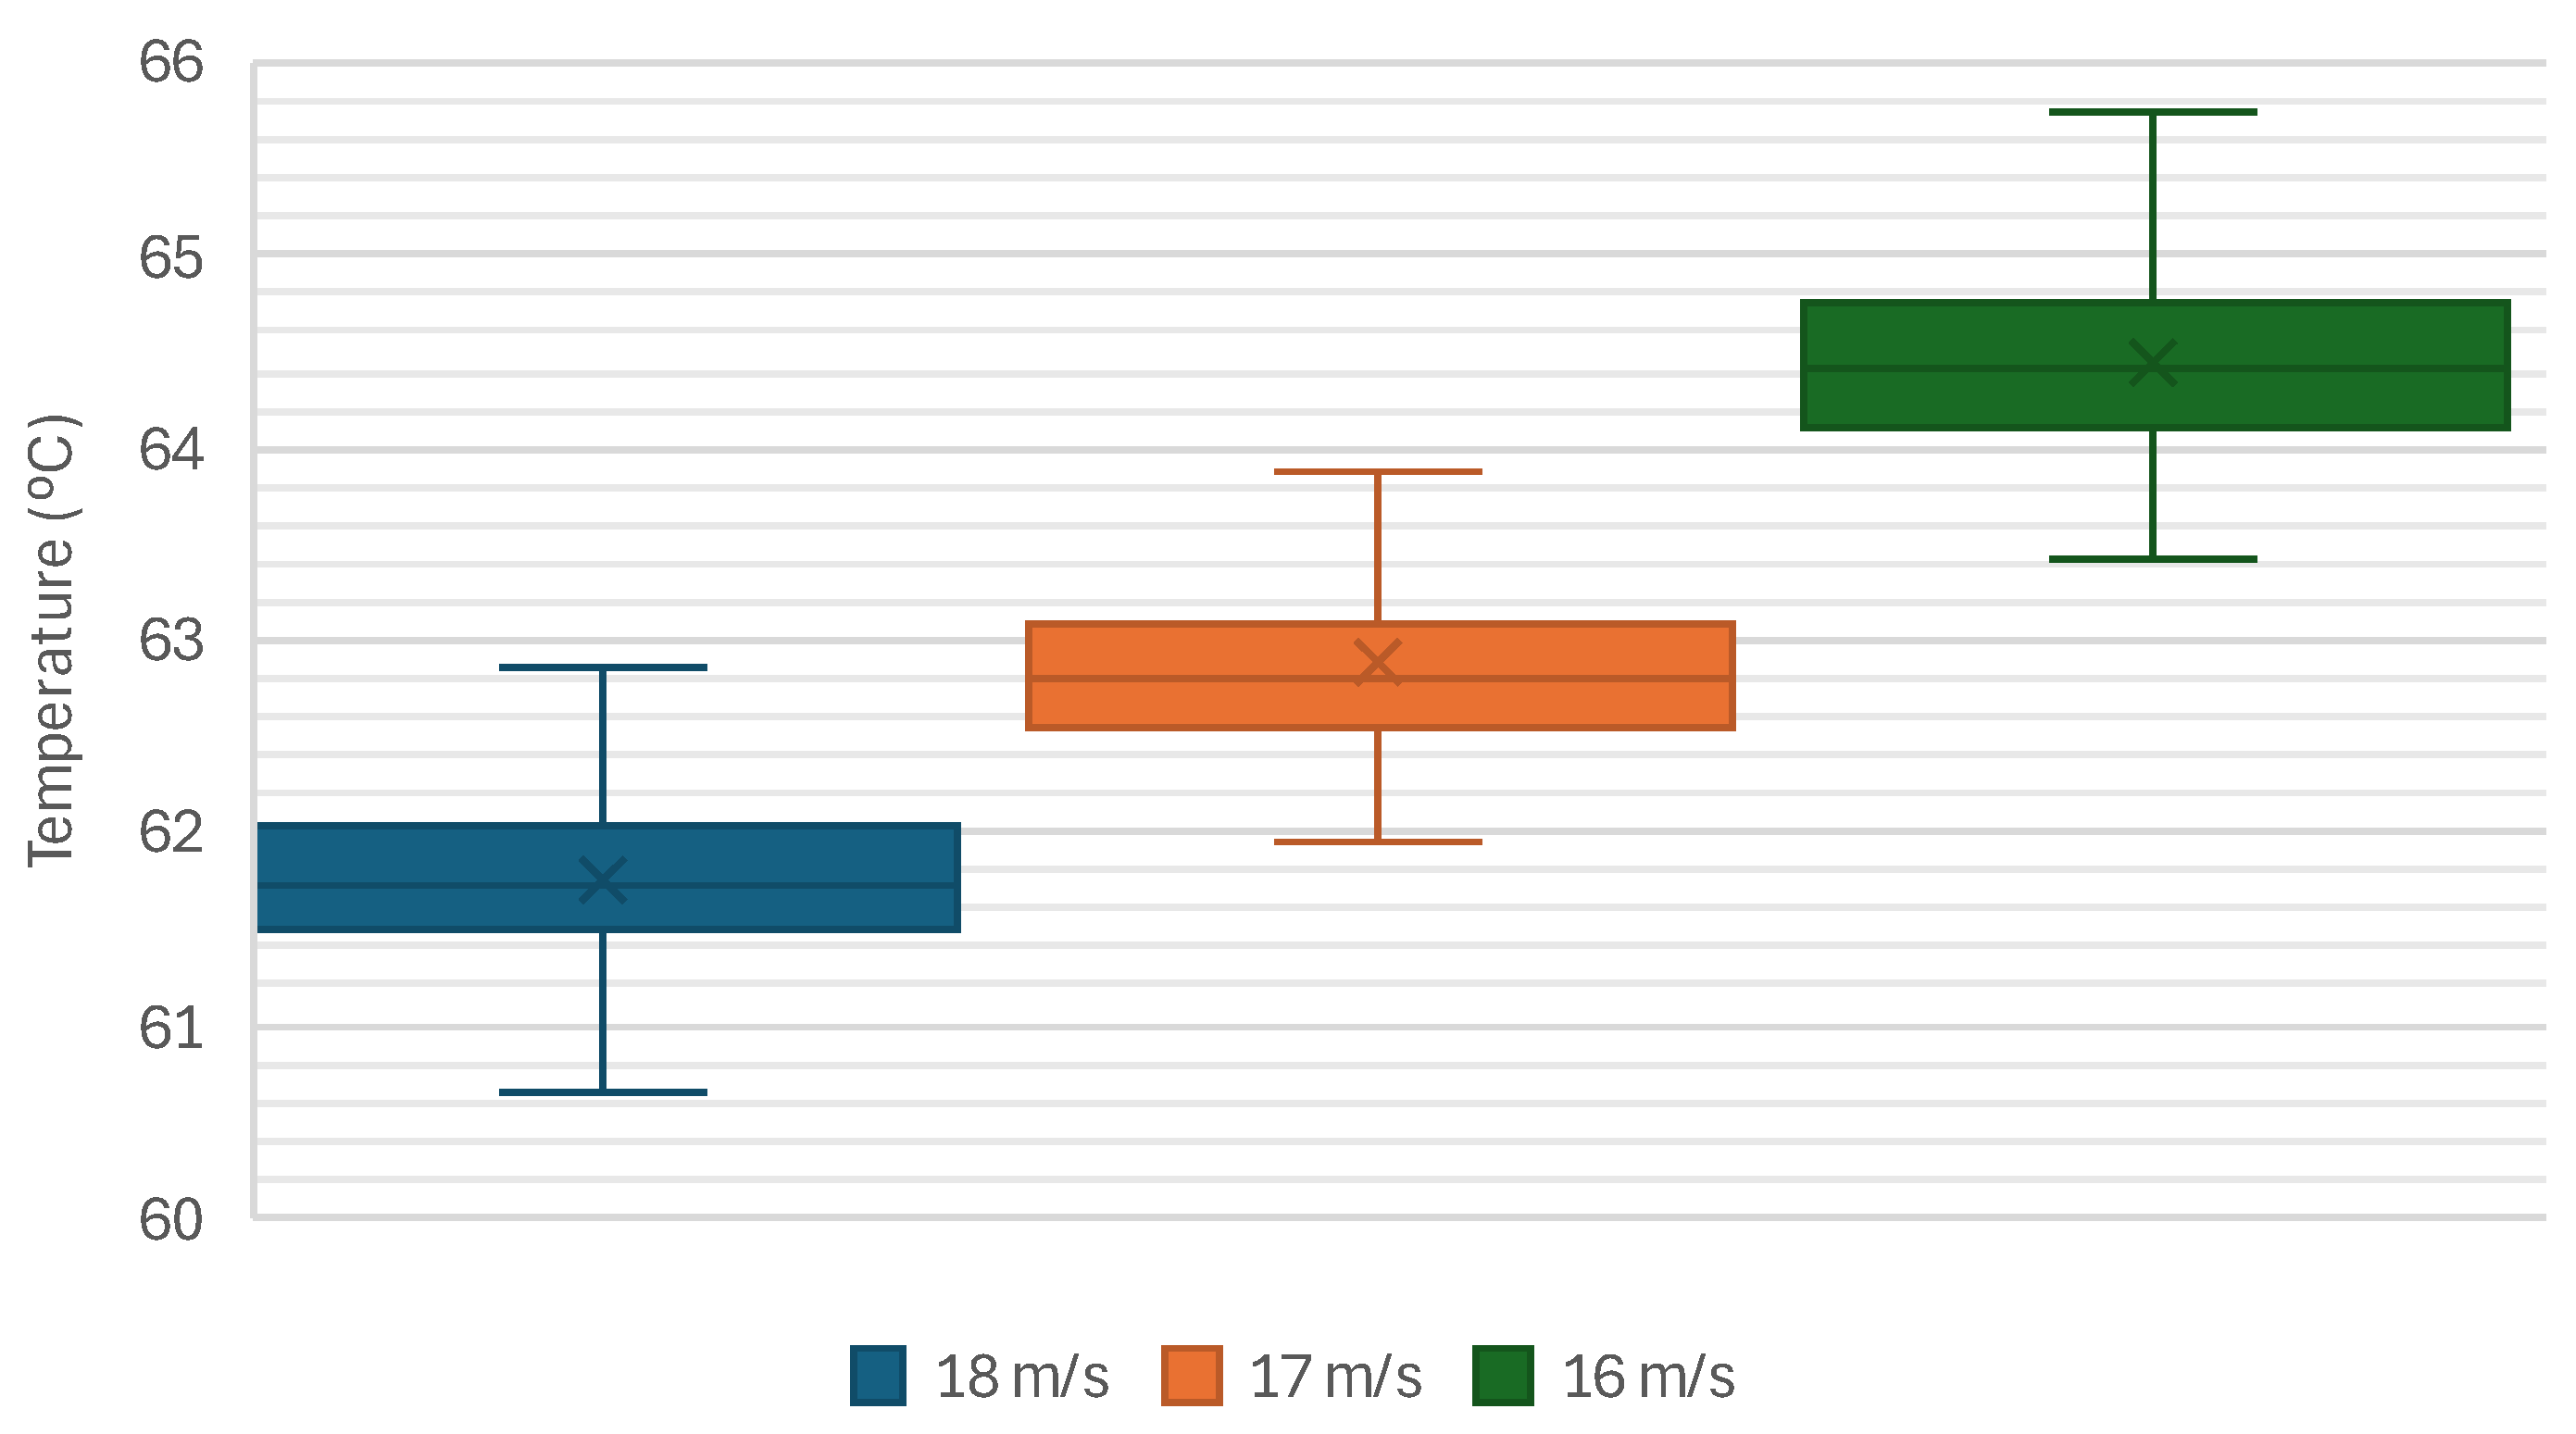
The maximum cell temperatures under these conditions are shown in Figure 9. At 18 m/s, the maximum temperature reached 56.91 ± 0.51 °C, maintaining a safe margin below the critical threshold of 60 °C. For 17 m/s and 16 m/s, the maximum temperatures were 58.43 ± 0.53 °C and 59.67 ± 0.65 °C, respectively, indicating that the system remained within operational limits at nominal ambient temperatures.
Figure 9.
Maximum temperature of the cells for the different inlet speeds at 25 °C of ambient temperature.
Figure 9.
Maximum temperature of the cells for the different inlet speeds at 25 °C of ambient temperature.
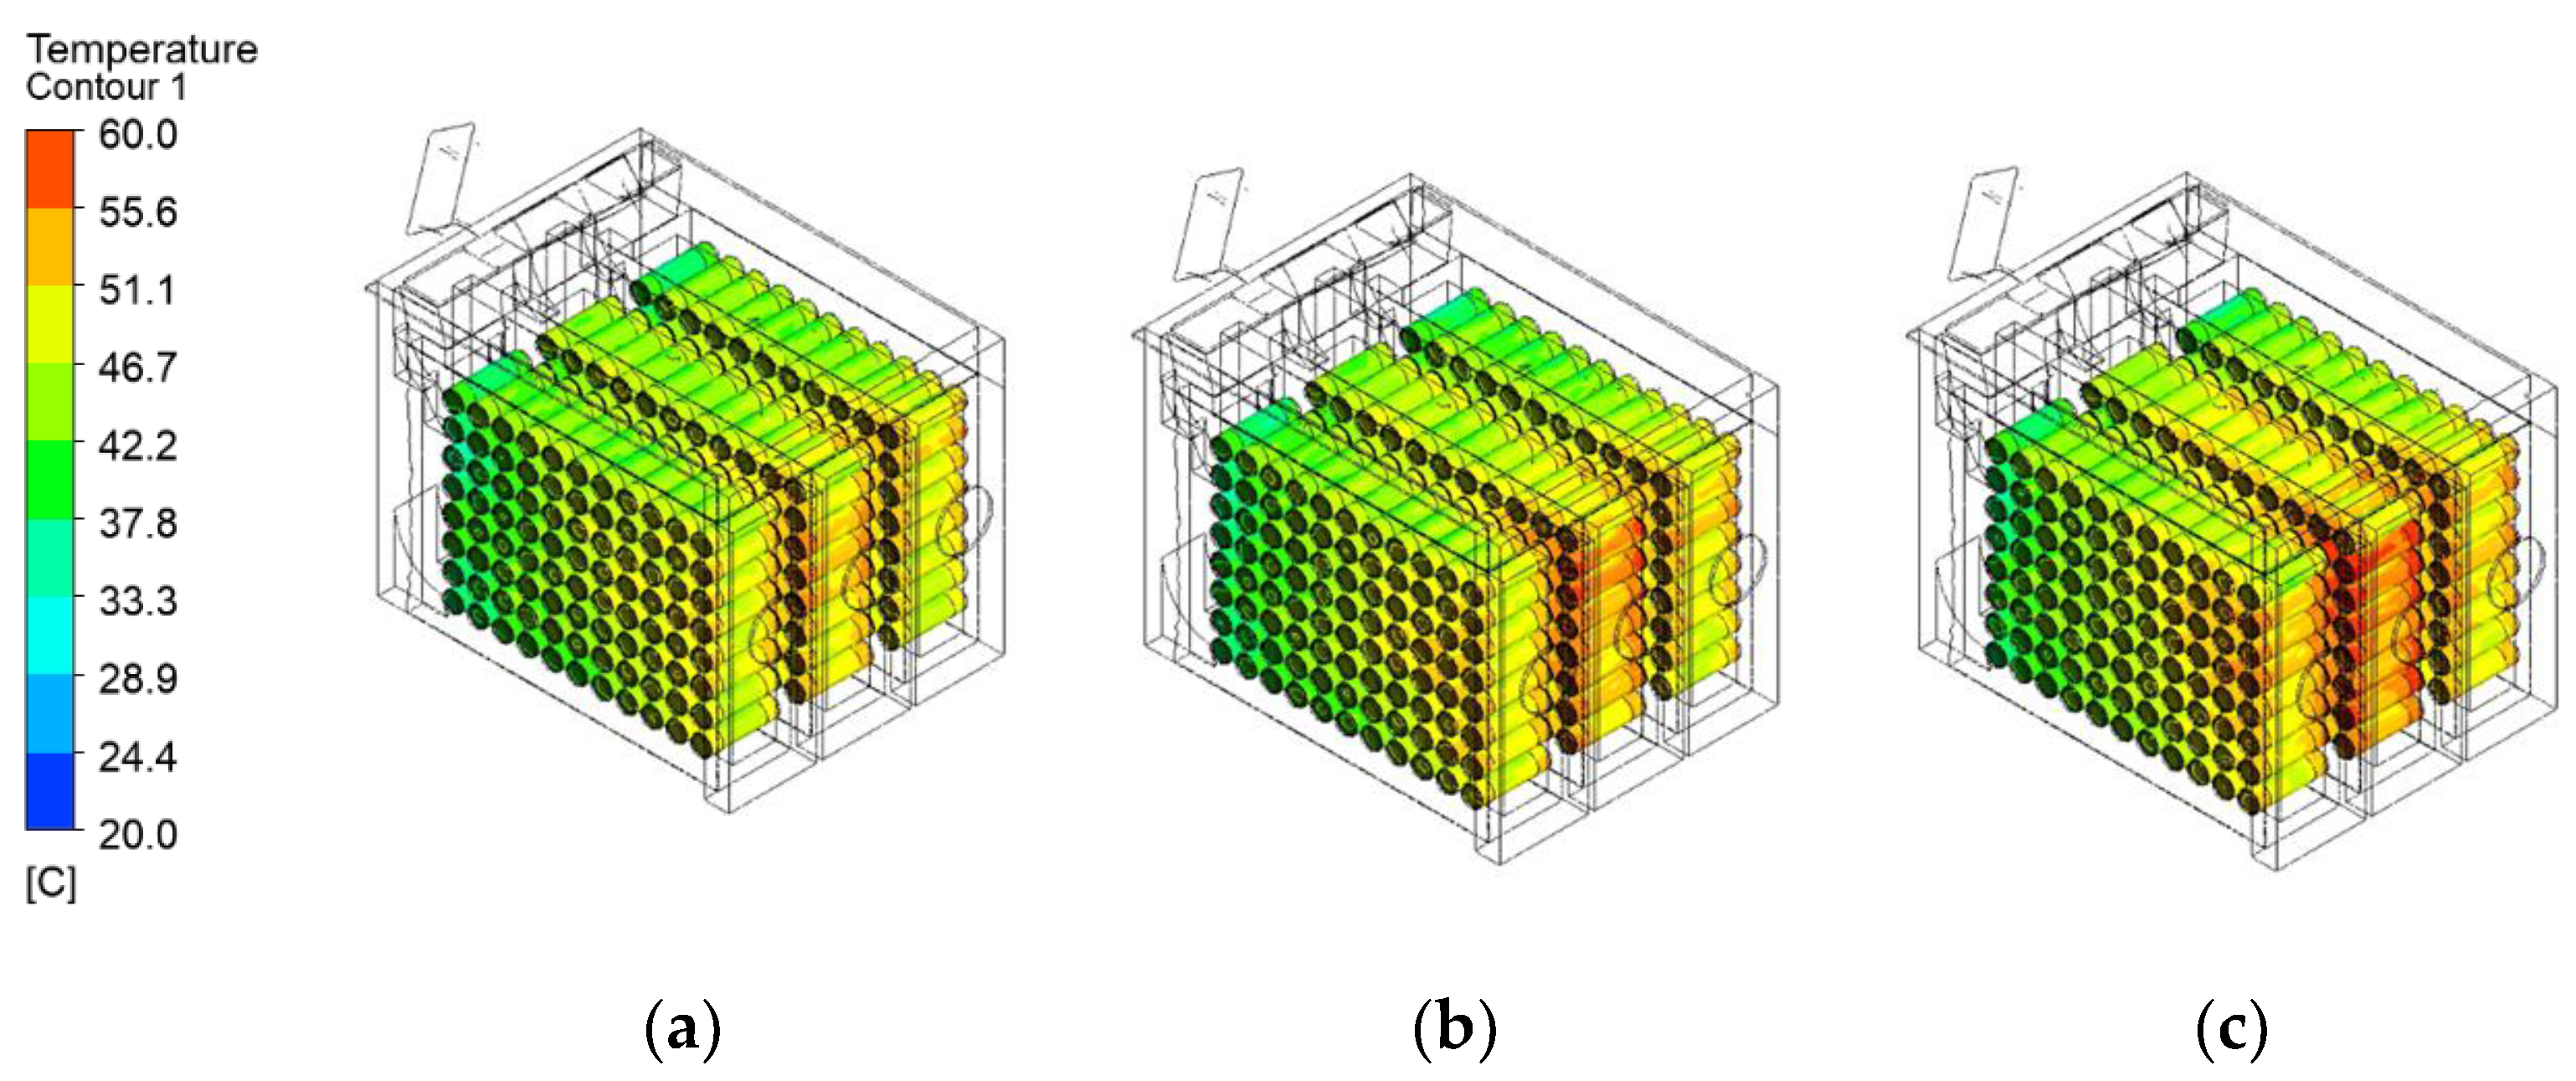
To complement these numerical results, Figure 10 provides a contour visualization of the temperature distribution across the battery cells at 25 °C. This figure illustrates the spatial distribution of cooling effectiveness and highlights areas of localized heating. At 18 m/s (a), the temperature is more uniformly distributed, while at 16 m/s (c), localized hotspots appear near regions with reduced airflow. These contours confirm the importance of maintaining sufficient airflow for effective thermal regulation.
Figure 10.
Temperature contours (25 °C of ambient temperature) for inlet speed of: (a) 18 m/s, (b) 17 m/s and (c) 16 m/s.
Figure 10.
Temperature contours (25 °C of ambient temperature) for inlet speed of: (a) 18 m/s, (b) 17 m/s and (c) 16 m/s.
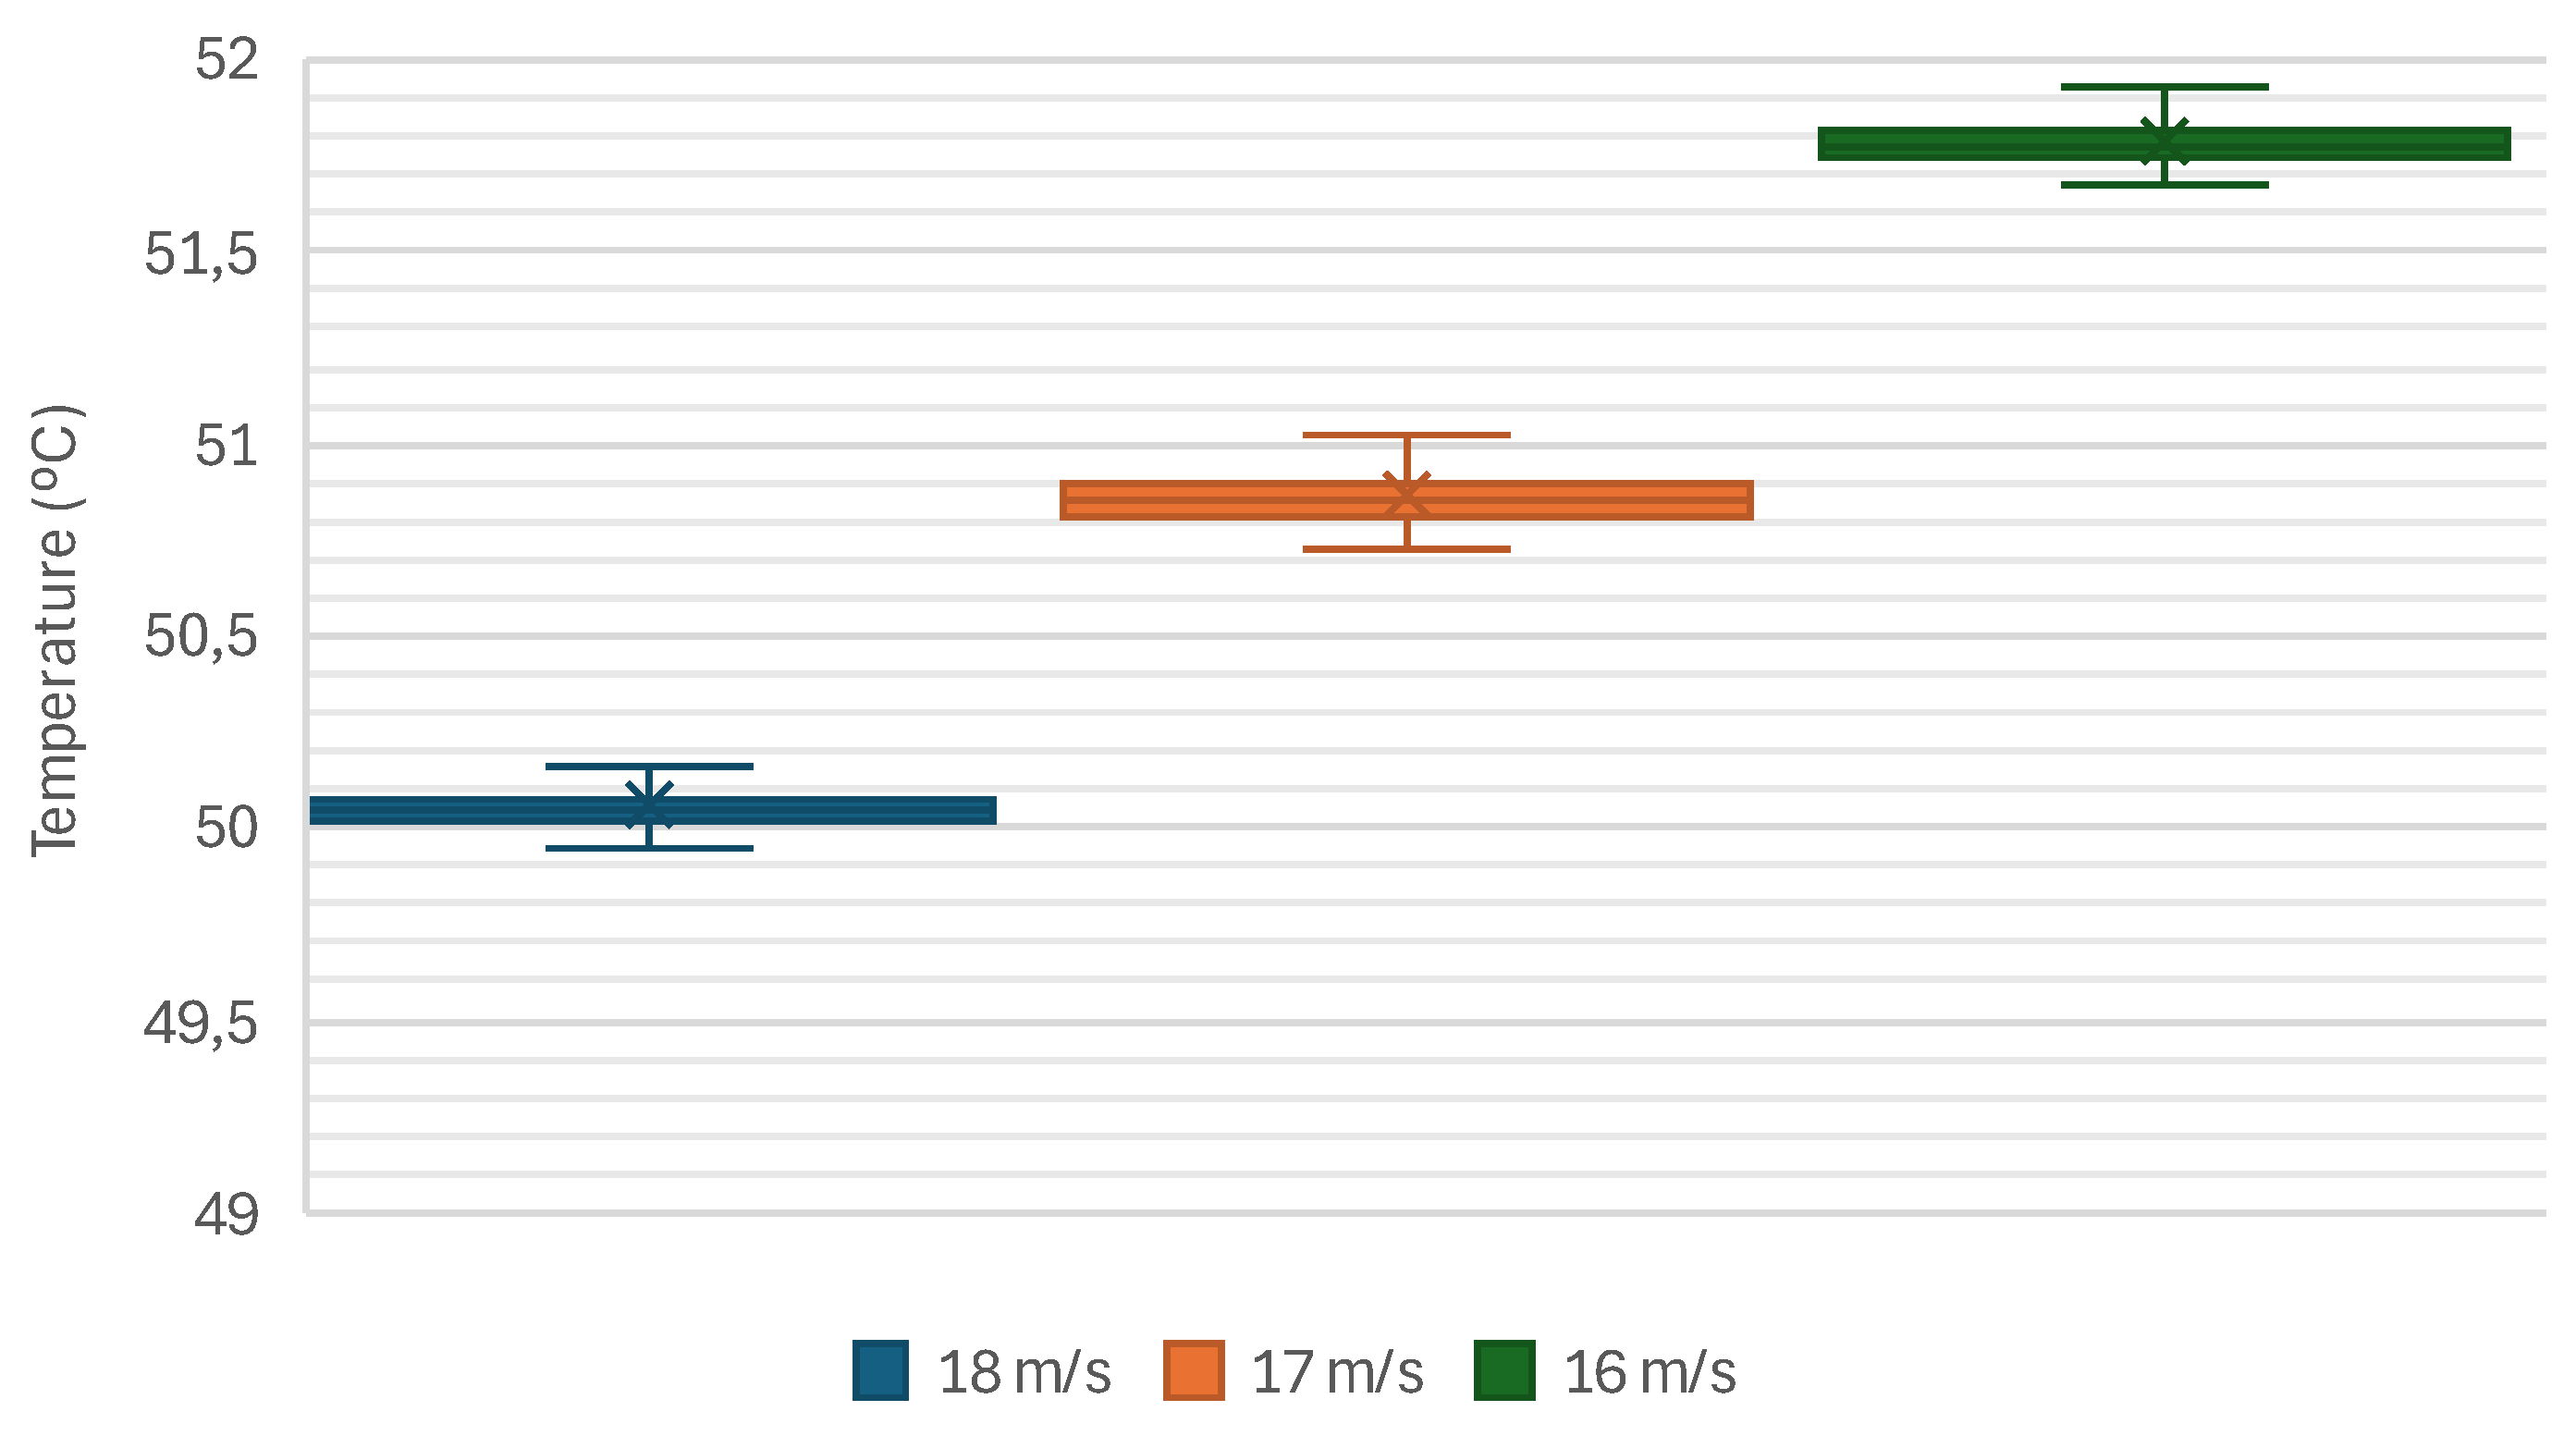
The BCS’s performance was evaluated under an ambient temperature of 30 °C for inlet velocities of 16 m/s, 17 m/s, and 18 m/s. Figure 11 presents the average temperature of the battery cells as a function of iteration number. For an inlet velocity of 18 m/s, the average cell temperature stabilized at 50.04 ± 0.04 °C, while at 17 m/s and 16 m/s, the average temperatures were slightly higher at 50.84 ± 0.05 °C and 51.78 ± 0.05 °C, respectively.
Figure 11.
Average temperatures of the cells for the different inlet speeds at 30 °C of ambient temperature.
Figure 11.
Average temperatures of the cells for the different inlet speeds at 30 °C of ambient temperature.
The maximum cell temperatures under these conditions are shown in Figure 12. At 18 m/s, the maximum temperature reached 61.73 ± 0.51 °C, maintaining few cells above the critical threshold of 60 °C. For 17 m/s and 16 m/s, the maximum temperatures were 62.88 ± 0.57 °C and 64.48 ± 0.47 °C, respectively, indicating that the system remained within operational limits at elevated ambient temperatures. Even though a few cells exceed the critical threshold, the ability of the cells to withstand temperatures up to 80 °C provides the necessary confidence in the system’s reliability and operational safety.
Figure 12.
Maximum temperatures of the cells for the different inlet speeds at 30 °C of ambient temperature.
Figure 12.
Maximum temperatures of the cells for the different inlet speeds at 30 °C of ambient temperature.
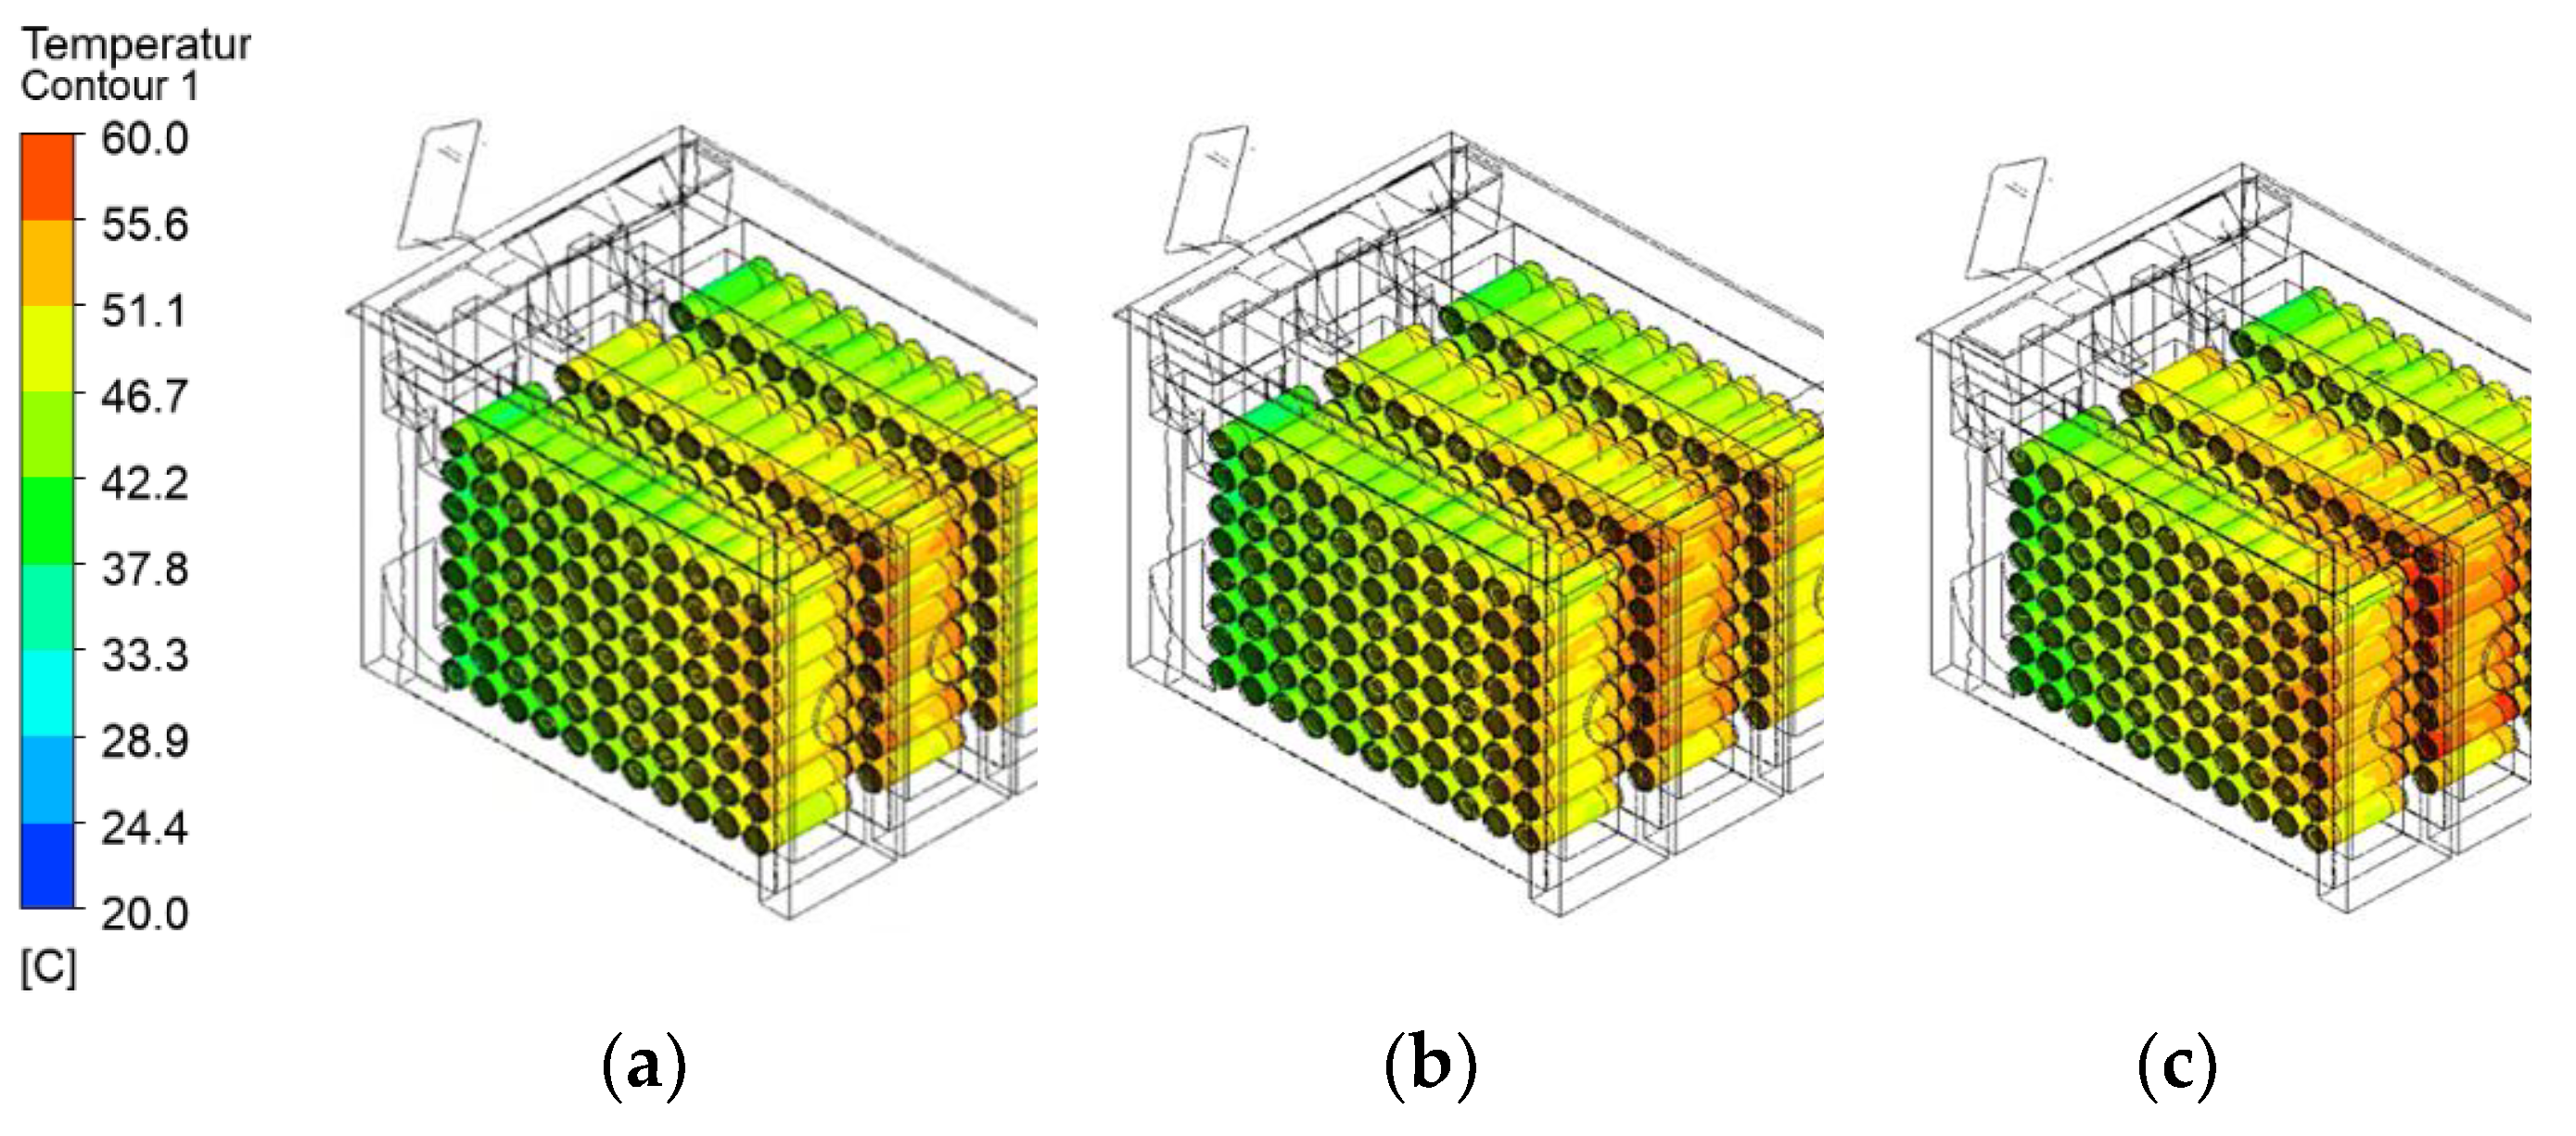
To complement these numerical results, Figure 13 provides a contour visualization of the temperature distribution across the battery cells at 30 °C. This figure illustrates the spatial distribution of cooling effectiveness and highlights areas of localized heating with temperature up to 65 °C. At 18 m/s (a), the temperature is more uniformly distributed, while at 16 m/s (c), noticeable hot spots appear in regions with reduced airflow. These contours confirm the importance of maintaining adequate airflow to ensure effective thermal management.
Figure 13.
Temperature contours (30 °C of ambient temperature) for inlet speed of: (a) 18 m/s, (b) 17 m/s and (c) 16 m/s.
Figure 13.
Temperature contours (30 °C of ambient temperature) for inlet speed of: (a) 18 m/s, (b) 17 m/s and (c) 16 m/s.
4.2. Streamline Analysis
The streamline analysis provides insight into airflow behavior across the battery module at different inlet velocities. By examining the streamlines, it is possible to assess how air distribution affects cooling efficiency and potential stagnation zones.
Figure 14 presents an isometric view of the airflow streamlines for the three inlet speeds: (a) 18 m/s, (b) 17 m/s, and (c) 16 m/s. At 18 m/s, the airflow is more uniform, ensuring better heat dissipation across the battery module. As the velocity decreases, flow separation and recirculation zones become more prominent, particularly at 16 m/s, where regions of reduced airflow may contribute to localized heating.
Figure 14.
Isometric view of airflow streamlines for different inlet speeds: (a) 18 m/s, (b) 17 m/s, and (c) 16 m/s.
Figure 14.
Isometric view of airflow streamlines for different inlet speeds: (a) 18 m/s, (b) 17 m/s, and (c) 16 m/s.
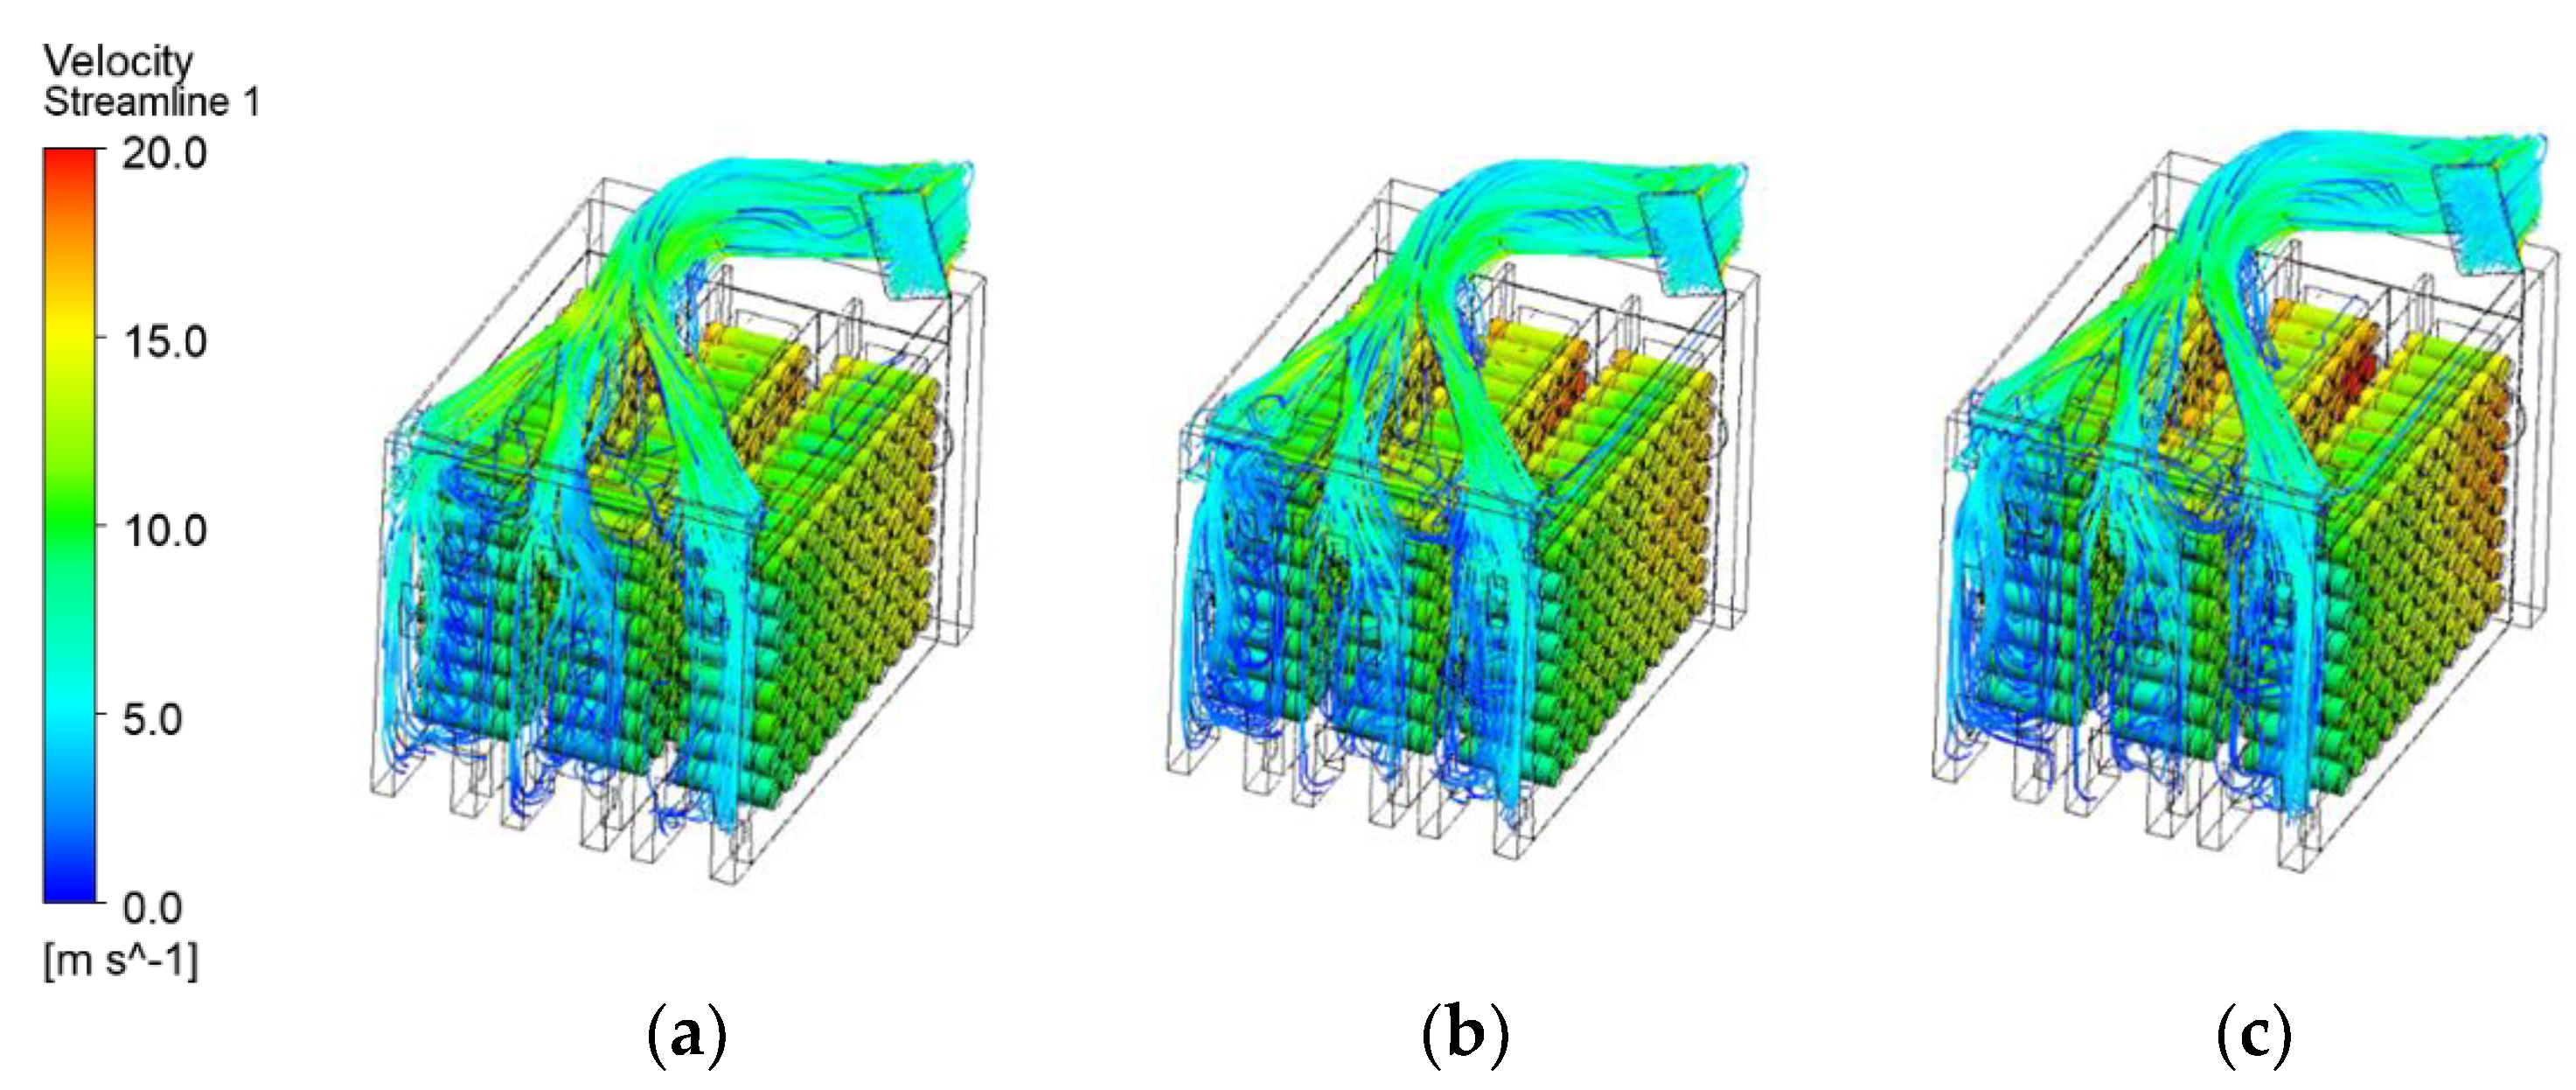
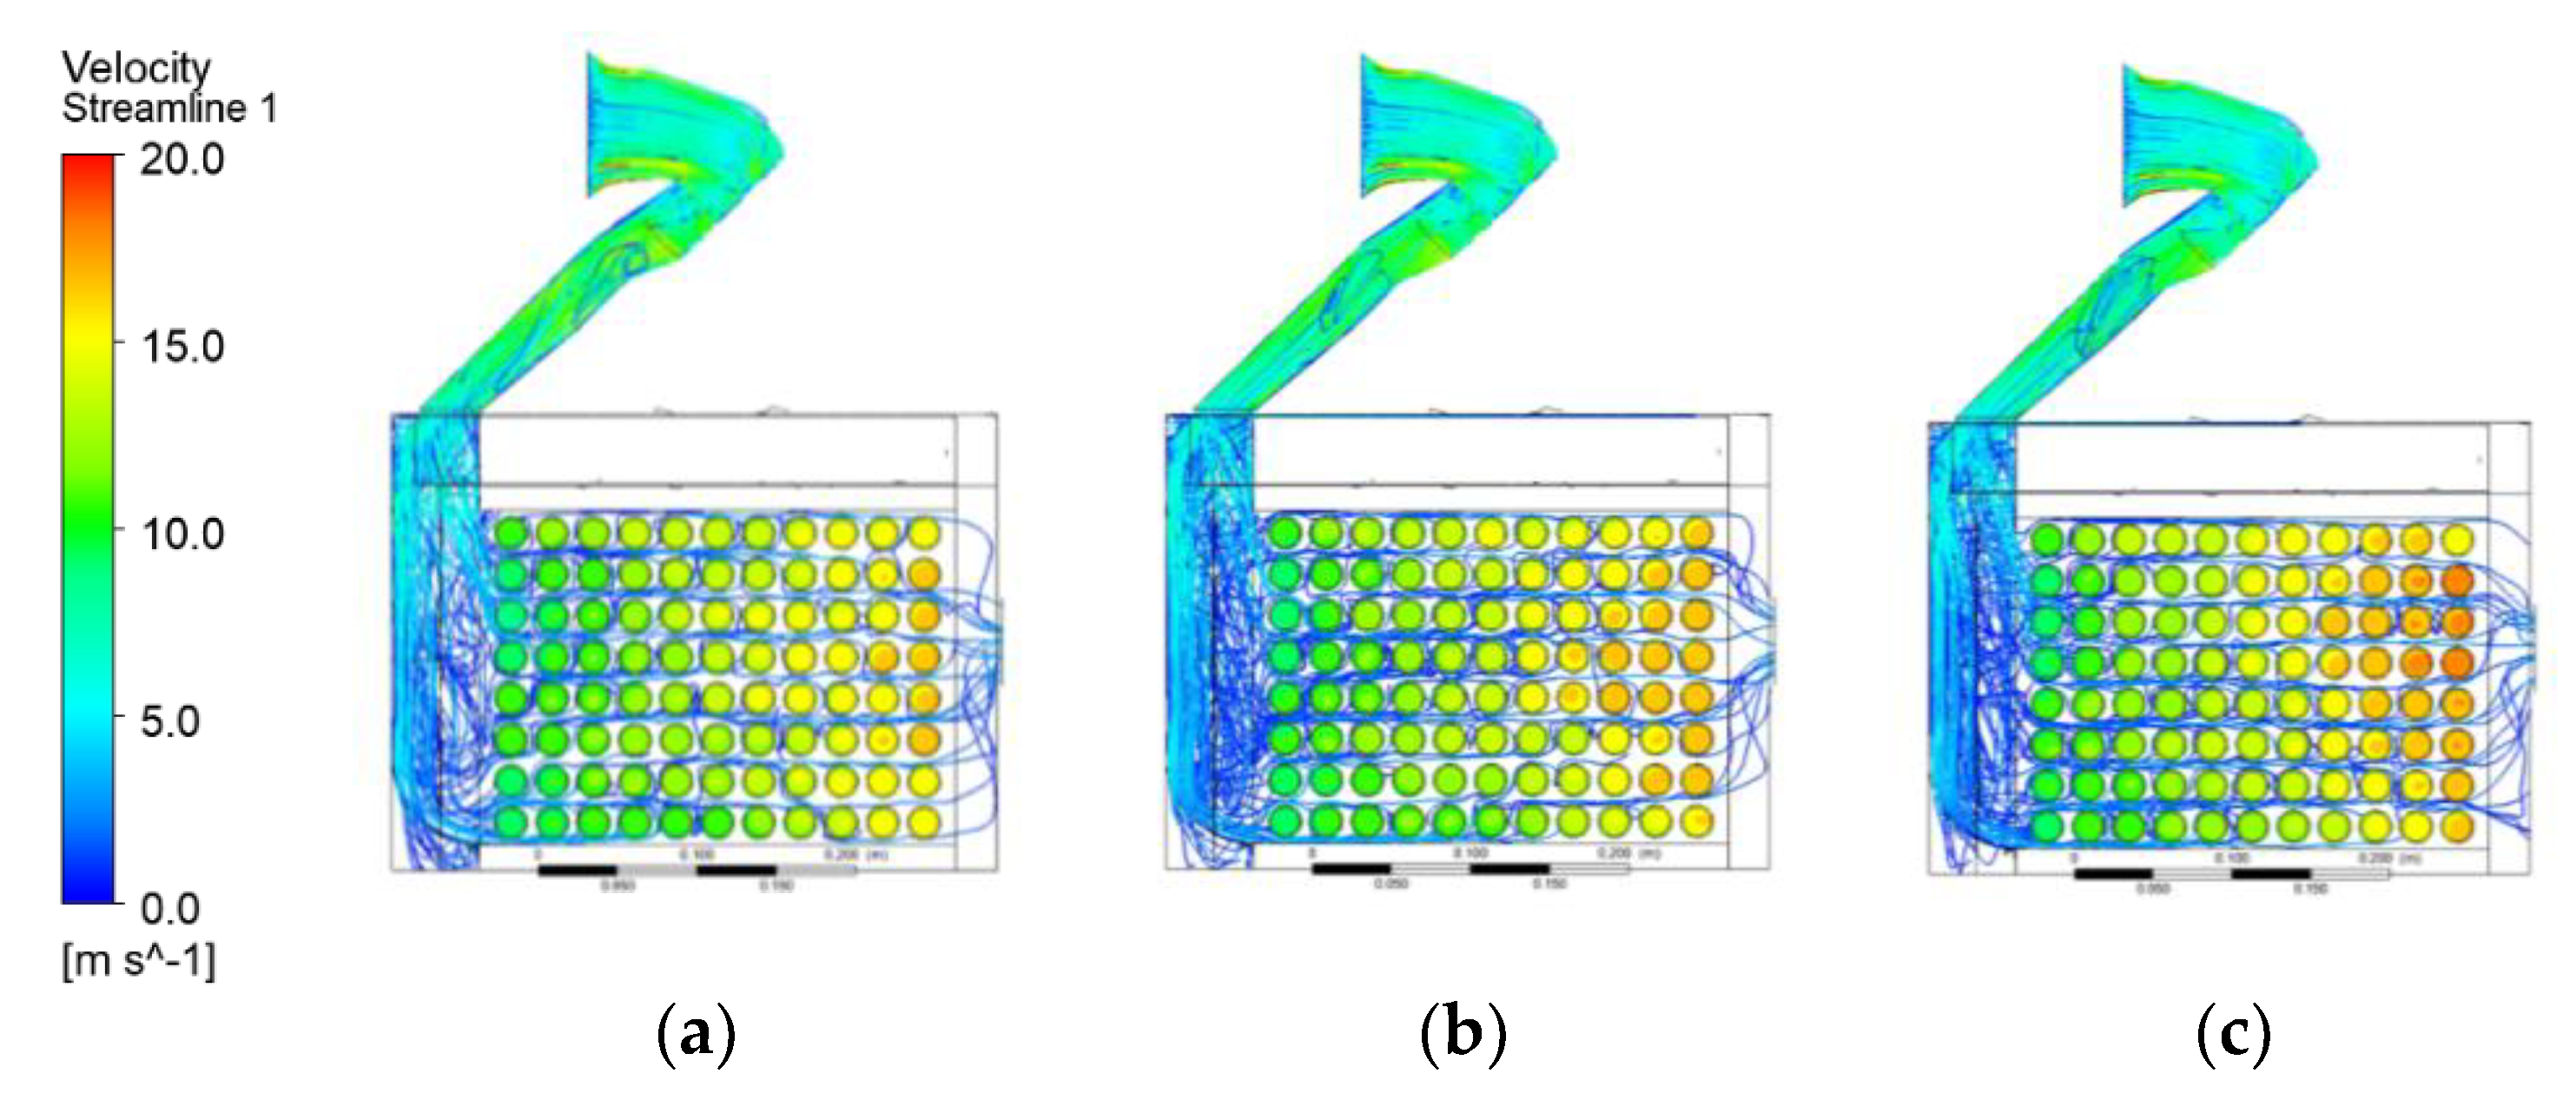
Figure 15 provides a lateral view of the same streamlines, offering a clearer visualization of how the airflow interacts with internal components. The higher inlet speeds (18 m/s and 17 m/s) maintain a steadier, more directed flow, whereas at 16 m/s, recirculation effects and lower flow velocities become evident, potentially leading to thermal inefficiencies.
Figure 15.
Lateral view of airflow streamlines for different inlet speeds: (a) 18 m/s, (b) 17 m/s, and (c) 16 m/s.
Figure 15.
Lateral view of airflow streamlines for different inlet speeds: (a) 18 m/s, (b) 17 m/s, and (c) 16 m/s.
These results emphasize the importance of maintaining adequate airflow velocity to ensure effective cooling performance and minimize the risk of overheating due to airflow stagnation. The BCS results reveal its ability to maintain the system within safe operating temperatures, with most of the cells remaining below 60 °C at various inlet speeds (16, 17, and 18 m/s) and ambient temperatures up to 25 °C. At 30 °C, the system remains effective for most cells but approaches its thermal limits, necessitating adjustments, such as motor power reduction, to ensure long-term reliability.
Additionally, constraints imposed by the vehicle’s design and the limited space available for air inlets affected the overall airflow distribution. These restrictions inevitably influenced the cooling uniformity, further reinforcing the importance of a well-designed battery enclosure to maximize airflow exposure.
The analysis underscores the need for consistent airflow and uniform cooling across the battery modules to prevent thermal imbalances and maintain operational efficiency. Future design improvements should focus on refining the battery pack layout, optimizing module spacing, and adjusting cooling duct positioning to enhance airflow dynamics and thermal performance. While the current system performs within safe limits, these refinements will be necessary to achieve a more effective and reliable cooling strategy.
5. Conclusions
The study successfully developed and evaluated a BCS for a FS car, demonstrating its capability to maintain cell temperatures within safe operational limits. The results indicate that the system effectively controls heat dissipation at various inlet speeds (16, 17, and 18 m/s), with most cells remaining below the critical threshold of 60 °C. However, at 30 °C ambient temperature, certain areas exhibited higher thermal stress, emphasizing the need for further optimization. The findings also highlight the significant role of the battery layout and case geometry in ensuring efficient thermal management, as initial designs revealed limitations in airflow distribution and cooling effectiveness. Addressing these issues is crucial for improving the system's overall performance.
Despite the effectiveness of the proposed cooling system, certain challenges were identified. The battery layout and case geometry imposed constraints on airflow distribution, leading to non-uniform cooling and localized hotspots. Additionally, the reliance on air cooling, while effective under moderate conditions, may struggle under extreme environmental or operational scenarios. These factors highlight the need for further refinement in both system design and cooling strategy selection.
The immediate next step in the development of the BCS involves conducting on-track validation to assess its real-world performance and ensure its reliability under actual racing conditions. This validation will provide critical data on temperature distribution and highlight any unforeseen operational issues.
For future vehicle iterations, improvements in the battery module layout and cooling design will be a priority. The findings from this study indicate that the current battery case design imposes significant airflow restrictions, leading to localized thermal inefficiencies. To address this, the next design phase should focus on optimizing airflow paths, reducing pressure losses, and implementing structural modifications to enhance heat dissipation. Advanced CFD simulations should be utilized to test these design changes before physical prototyping.
Additionally, incorporating alternative cooling strategies, such as hybrid air-liquid cooling solutions, could provide enhanced thermal regulation under extreme conditions. Material selection for the battery casing should also be reconsidered to improve heat dissipation without adding excessive weight to the vehicle. Finally, experimental studies on different cooling configurations should be conducted to determine the most efficient design, ensuring a balance between performance, weight, and aerodynamic impact.
Author Contributions
Conceptualization, F.V., V.M., F.B.; Methodology, F.V., V.M., J.V.S., F.B.; Software: F.V., J.V.S.; Validation, F.V., J.V.S., F.B.; Formal analysis, F.V., J.V.S., F.B; Investigation, F.V., J.V.S., F.B.; Resources, F.B; Data curation, J.V.S., F.B.; Writing—Original Draft Preparation, F.V.; Writing—Review and Editing, F.V., V.M., J.V.S, F.B.; Visualization, F.V.; Supervision, V.M., J.V.S, F.B.; Project Administration, F.B.; All authors have read and agreed to the published version of the manuscript.
Funding
“This research was supported by FCT national funds, under the national support to R&D units grant, through the reference project UID/4077: Mechanical Engineering and Resource Sustainability Center (MEtRICs)" and the European Union through the Recovery and Resilience Facility (NextGenerationEU) under the Portuguese Recovery and Resilience Plan (PRR) ATE - Aliança para a Transição Energética, C644914747-00000023.
Data Availability Statement
Data is contained within the article.
Acknowledgments
The authors would like to thank the Department of Mechanical Engineering at the University of Minho for providing excellent academic and research conditions. Special thanks are extended to the FSUMinho team for their collaboration and motivation, as well as to Professor José Carlos Teixeira for his valuable support. The authors also acknowledge Donelab for their collaboration in the development of the air inlets.
Conflicts of Interest
The authors declare no conflicts of interest.
References
- Chung, Y.; Kim, M.S. Thermal analysis and pack level design of battery thermal management system with liquid cooling for electric vehicles. Energy Convers. Manag. 2019, 196, 105–116. [Google Scholar]
- Liu, H.; Wei, Z.; He, W.; Zhao, J. Thermal issues about Li-ion batteries and recent progress in battery thermal management systems: A review. Energy Convers. Manag. 2017, 150, 8–29. [Google Scholar] [CrossRef]
- Cuñado, M.V. Design and Optimization of the Cooling System for an Electrical Formula Student Car’s Battery Pack Memory and Annexes. Bachelor’s Thesis, Universitat Politècnica de Catalunya – BarcelonaTech, Escola d’Enginyeria de Barcelona Est, Barcelona, Spain, June 2021. [Google Scholar]
- Lyu, Y.; Siddique, A.R.M.; Majid, S.H.; Biglarbegian, M.; Gadsden, S.A.; Mahmud, S. Electric vehicle battery thermal management system with thermoelectric cooling. Energy Rep. 2019, 5, 822–827. [Google Scholar] [CrossRef]
- Martellucci, L.; Krishna, K.K. Analysis of Air-Cooling Battery Thermal Management System for Formula Student Car. J. Transp. Technol. 2021, 11, 436–454. [Google Scholar] [CrossRef]
- Kim, J.; Oh, J.; Lee, H. Review on battery thermal management system for electric vehicles. Appl. Therm. Eng. 2019, 149, 192–212. [Google Scholar] [CrossRef]
- Freire Montero, Director A.; Jacobi Madrid, A. Design of a Battery Cooling System for the Illini Formula Electric Vehicle. Bachelor’s Thesis, Escuela Técnica Superior de Ingeniería (ICAI), Madrid, Spain, 2017.
- Magnusson, A.E. Modelling of battery cooling for Formula Student application: 3D Simulation of air cooled lithium-ion battery with COMSOL Multiphysics®, applied on 2016 years KTH Formula Student car “EV12e.”. Bachelor’s Thesis, KTH Royal Institute of Technology, Stockholm, Sweden, 2016; p. 27. [Google Scholar]
- Khurshid, H.; Naz, E.; Design and Analysis of a Cooling System for High Voltage Battery Pack of a Formula Student Electric Vehicle. Int. Res. J. Eng. Technol. 2022. Available online: www.irjet.net (accessed on 19 February 2025).
- Zhao, L.; Wang, J.; Li, Y.; Liu, Q.; Li, W. Experimental Investigation of a Lithium Battery Cooling System. Sustainability 2019, 11, 5020. Available online: https://www.mdpi.com/2071-1050/11/18/5020 (accessed on 12 February 2025). [CrossRef]
- Formula Student Germany. FS-Rules_2025_v1.0, 2024. Available online: https://www.formulastudent.de (accessed on 13 October 2024).
- Tripathy, Y. Exploring Molicel’s new power cell. Available online: https://www.aboutenergy.io/post/exploring-molicel-s-new-power-cell (accessed on 16 October 2024).
- Nigel. Thermal Conduction in a Cell – Battery Design. Available online: https://www.batterydesign.net/thermal-conduction-in-a-cell/ (accessed on 16 October 2024).
- Lin, C.; Wen, H.; Liu, L.; Liu, S.; Ma, T.; Fan, B.; et al. Heat generation quantification of high-specific-energy 21700 battery cell using average and variable specific heat capacities. Appl. Therm. Eng. 2021, 184, 116215. [Google Scholar] [CrossRef]
- Çengel, Y.A.; Ghajar, A.J. Heat and Mass Transfer: Fundamentals & Applications; 5th ed.; McGraw-Hill Education: New York, NY, USA, 2015. [Google Scholar]
Disclaimer/Publisher’s Note: The statements, opinions and data contained in all publications are solely those of the individual author(s) and contributor(s) and not of MDPI and/or the editor(s). MDPI and/or the editor(s) disclaim responsibility for any injury to people or property resulting from any ideas, methods, instructions or products referred to in the content. |
© 2025 by the authors. Licensee MDPI, Basel, Switzerland. This article is an open access article distributed under the terms and conditions of the Creative Commons Attribution (CC BY) license (https://creativecommons.org/licenses/by/4.0/).
Copyright: This open access article is published under a Creative Commons CC BY 4.0 license, which permit the free download, distribution, and reuse, provided that the author and preprint are cited in any reuse.


