
Submitted:
20 October 2025
Posted:
22 October 2025
You are already at the latest version
Abstract
This study produces high-purity nano-silica from corn straw ash (biomass power plants) using an alkaline fusion derived sodium silicate solution. CO₂ replaces traditional acids in the carbonation reaction, enabling high extraction yield (93.11%). The process addresses the gap in directly utilizing combustion ash for such high-purity silica. Key optimal conditions identified were: 5 M HCl concentration, NaOH fusion reagent, 1:1.2 mixing ratio, 3 M NaOH solvent, and 12 h ripening. The resulting nano-silica achieved 92.73% purity, 10-50 nm particle size, 270 × 10⁻⁵ m³/kg DBP absorption, 55.9916 m²/g specific surface area, 6.38% LOD, and 6.69% LOI. These properties meet national standards for premium, loosely structured nano-silica. This method provides an economical and effective silicon source, reducing costs and offering economic-environmental benefits.
Keywords:
nano-silica
; corn straw ash
; carbonation reaction
; silica activity
; biomass power plant
; extraction yield
1. Introduction
With the increasing depletion of fossil fuels, biomass power plants are experiencing rapid development under the guidance of resource recycling and green energy initiatives. It is estimated that by 2050, approximately 33%-50% of the world’s primary energy consumption will be derived from biomass sources [1]. As a solid waste produced after the combustion process in biomass power plants, biomass power plant ash, has garnered significant attention from researchers due to its disposal challenges and potential for comprehensive utilization, particularly in the context of circular and ecological agriculture [2]. Thus, exploring efficient disposal and utilization methods for power plant straw ash is of significant importance for promoting the sustainable development of biomass power plants.
The composition of biomass power plant ash are including SiO2, Al2O3, Fe2O3, CaO, MgO, K2O, P2O5, and SO3. It also contains trace amounts of MnO, TiO2, Na2O, as well as unburned carbon and small quantities of organic matter [3]. Currently, the utilization of biomass ash primarily focuses on its incorporation into building materials and soil improvement. Studies have demonstrated that the addition of 10%-30% biomass ash can significantly enhance the compressive strength, anti-permeability, and sulfate resistance of concrete [4,5], as well as its load-bearing capacity, crack resistance, and freeze-thaw durability [6,7,8]. However, biomass ash requires pretreatment prior to incorporation, and when the mixing ratio exceeds 30%, it can negatively affect the strength of the concrete. In terms of soil improvement, the alkaline nature of straw ash can significantly enhance microbial activity in acidic soils, thereby promoting plant growth [9]. Incorporating 2%-4% biomass ash into the soil can significantly enhance the growth rate and yield of crops, improve the soil’s moisture retention and nutrient-holding capacity, and strengthen the drought resistance of the crops [10]. Additionally, the alkaline components in biomass ash can react with heavy metal ions in the soil, forming insoluble compounds that reduce the bioavailability of these heavy metals [11]. In addition to this, the high silica content in ash, such as the SiO2 content in corn stalk ash, which can reach up to 79.24% [12], and in rice husk ash, which can attain 97% [13], has led some researchers to focus on utilizing the silicon-rich phase in biomass ash for the production of high-value-added chemicals. Chen et al. [14] successfully produced silica with a purity of 97.68% from biomass ash through acid treatment and high-temperature calcination processes. Yalçin et al. [15] demonstrated that adjusting the calcination temperature and acid treatment conditions significantly enhances the specific surface area and purity of silica. Fadhl et al. [16] utilized a multi-stage washing and calcination method to reduce organic matter and metal impurities in biomass ash, thereby improving the performance of silica. These research efforts have made certain contributions to the utilization of biomass ash; however, the extraction efficiency of silica from biomass ash is currently low, and the process is complex. Additionally, the inherent limitations of silica functionality have led more researchers to focus on using biomass ash to synthesize higher value-added nano-silica. This nano-silica can be applied in various fields, including agriculture, optics, and biomedicine.
However, the current processes for synthesizing nano-silica face several challenges, including complex procedures, high extraction costs, low yield, and lengthy extraction times. Carmona et al. [17] treated rice husks in acidic solution under high temperature and pressure, followed by washing four times with distilled water at high temperature and pressure, drying for 18 hours, and finally calcining at 650 °C for 1 hour to obtain nano-silica. Singh et al. [18] discussed common chemical methods for synthesizing nano-silica, including sol-gel process, microemulsion processing, and plasma synthesis. However, the solvents, catalysts, and silica sources used in these methods are often costly, leading to increased production costs for nano-silica. Chen et al. [14] achieved an extraction yield of 68.01% in the production of conventional silica from corn stalk ash. Liang et al. [19] prepared nano-silica from a mixed ash of straw and rice husks, resulting in an extraction yield of 20.45%. Piela et al. [20] employed a bioconversion method to extract nano-silica of specific sizes and shapes from corn cobs, achieving an extraction yield of 47%; however, the entire extraction process required a lengthy reaction period of at least 16 days. Estevez et al. [21] increased the extraction yield of nano-silica from rice husks to 88% through a bio digestion method, although the extraction period extended to five months. Moreover, current research predominantly utilizes laboratory-prepared, single-source biomass ash as a silica source, rather than directly employing the ash generated from biomass power plants. Therefore, to promote the resource utilization of biomass power plant ash, it is essential to recognize the low-cost and high-yield advantages of using direct combustion ash from biomass power plants as a silica source, along with the significant market demand and broad application potential for nano-silica. By leveraging the silicon-rich phase in direct combustion ash from biomass power plants, developing more environmentally friendly and efficient extraction technologies for nano-silica could help address the existing challenges in biomass ash management and improve the economic viability of nano-silica production.
This study addresses the issues of low utilization rates of biomass power plant ash and the difficulties associated with the preparation of high-purity nano-silica. By employing an acid washing and alkaline fused method, we aim to modulate the activity of silica in direct combustion corn stalk ash. Furthermore, we replace traditional precipitation methods that utilize strong acids with CO2 for carbonation reaction. This approach enables the extraction of high-value, high-purity nano-silica from biomass power plant combustion ash with a high extraction yield. The elemental composition, crystal morphology, particle size, and structural characteristics of the prepared nano-silica were characterized using various experimental equipment, including X-ray diffraction, X-ray fluorescence spectroscopy, nitrogen adsorption-desorption analysis, scanning electron microscopy, and transmission electron microscopy. The study examined the influence of various factors on the activity of silica in corn stalk ash, as well as their impact on the purity and extraction yield of nano-silica. Furthermore, the process parameters for extracting nano-silica from corn stalk ash were optimized, leading to the identification of the optimal procedure for producing nano-silica using ash. This research not only broadens the utilization pathways for direct combustion corn stalk ash in biomass power plants but also offers new possibilities and directions for the preparation of nano-silica in practical engineering applications.
2. Materials and Methods
2.1. Experimental Materials
Biomass ash was sourced from the Nong’an biomass power plant (BPP), where corn stalks were combusted using a high-temperature, high-pressure biomass water-cooled vibrating grate boiler, resulting in corn stalk ash (CSA). This study selected the bottom slag as the research subject, which was dried at 105 °C and passed through a 200-mesh sieve to obtain the processed bottom slag (BS) samples. The fundamental characteristic data of the BS were measured, as presented in Table 1 and Table 2.
2.2. Extraction Process of Nano-Silica
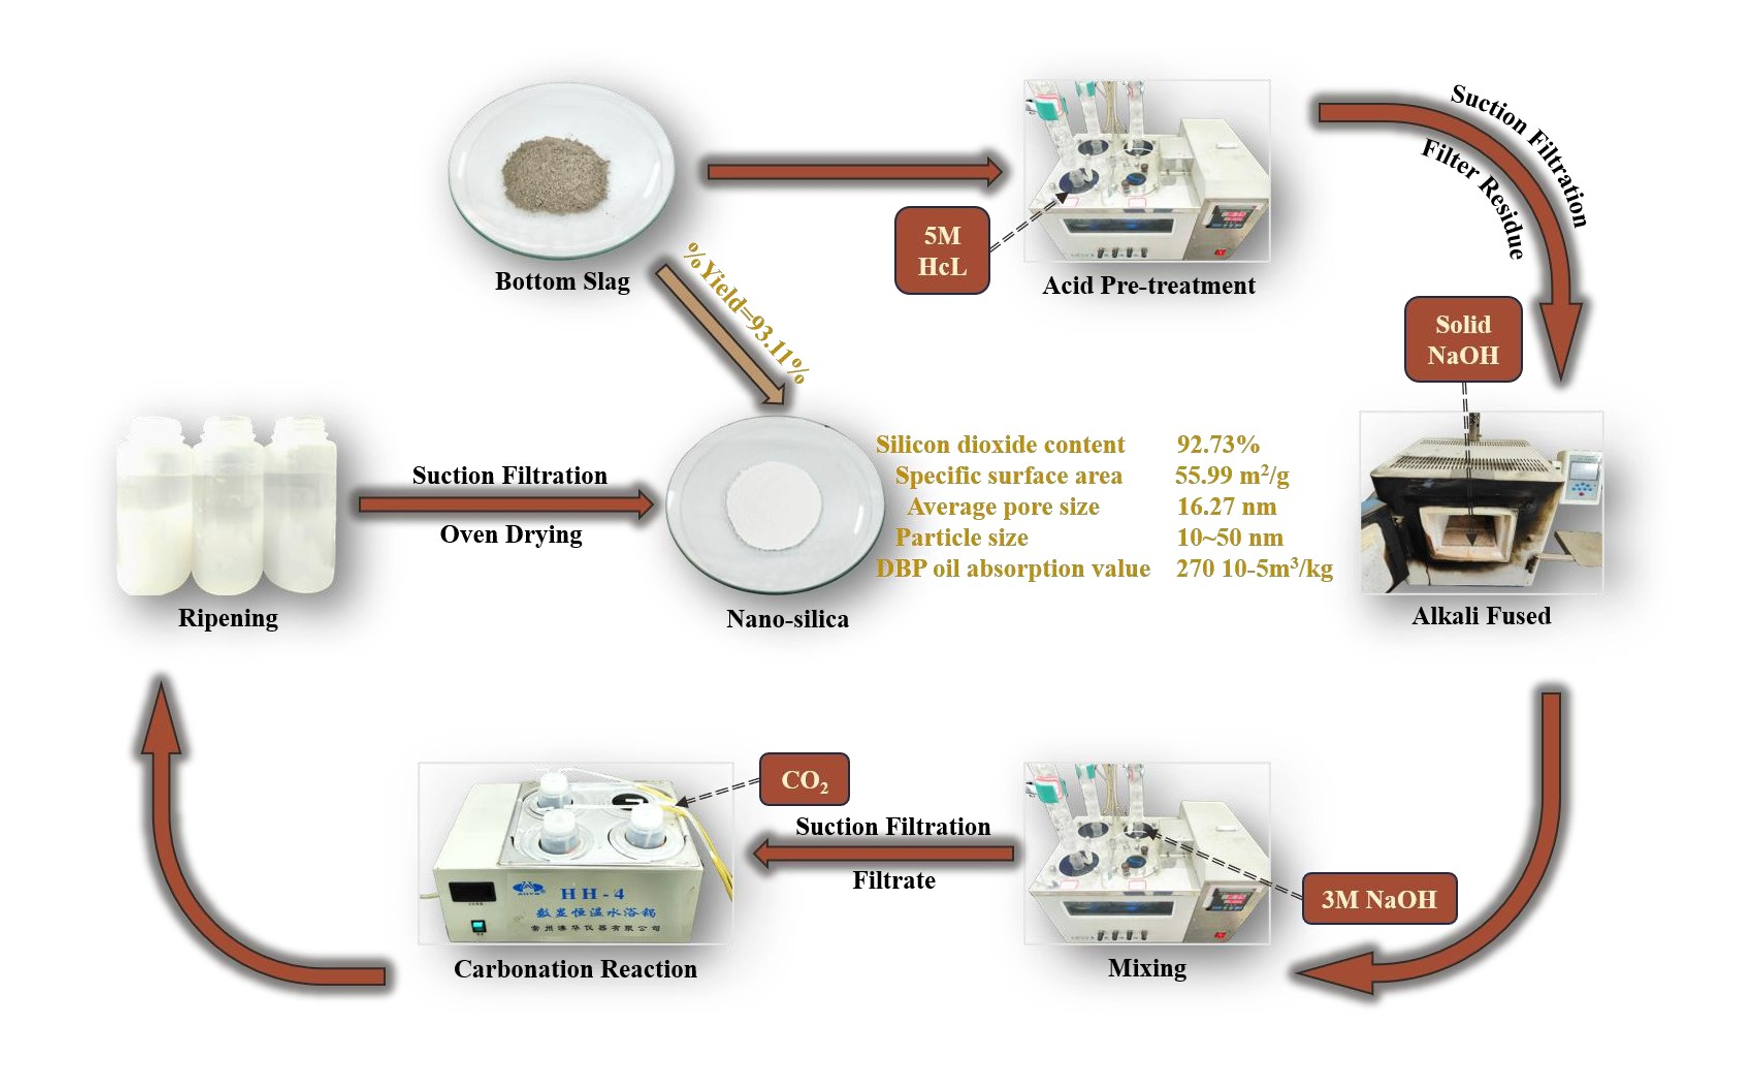
This study used water glass prepared from biomass ash as a precursor and synthesized nano silica through carbon separation method. The specific process was shown in Figure 1. In this study, all experimental data are obtained as the average values from three trials.
The first, the bottom slag is added to a hydrochloric acid at a specific solid-to-liquid ratio. The mixture is heated to 90 °C for 2 hours under magnetic stirring in a constant-temperature water bath, cooled to room temperature, filtered, washed with ultrapure water until neutral, and then the bottom slag is dried at 105 °C for 12 hours. To achieve the optimal acid treatment concentration, a single variable was controlled during the acid treatment process, varying the hydrochloric acid concentrations (1 mol/L, 3 mol/L, 5 mol/L, 7 mol/L, 9 mol/L, and 11 mol/L). Comparative analysis revealed the optimal physicochemical properties of the bottom slag after treatment with different concentrations of hydrochloric acid, facilitating subsequent extraction steps. Additionally, the impact of acid treatment concentration on the quality of the final product, nano-silica, was assessed to determine the optimal acid pretreatment concentration.
The second, the acid-treated bottom slag is mixed with alkaline solids at a specific blending ratio and heated at 550 °C for 1 hour in a muffle furnace. During the alkaline fused process, the effects of alkaline materials (NaOH, Ca(OH)2, KOH) on the crystal morphology of silica in the bottom slag as well as the extraction yield and purity of the final product, nano-silica, are investigated. A single variable, the blending ratio (1:0.6, 1:0.8, 1:1, 1:1.2, 1:1.4), is then controlled. Through comparative analysis of the changes in the crystal morphology of silica in the bottom slag after alkaline fused at different blending ratios, along with the content of amorphous silica, the optimal blending ratio is determined based on its effect on the extraction yield and purity of the final product, nano-silica.
The third, the alkaline fused sample is added to different mixed solvents at a specific solid-to-liquid ratio and heated to 90 °C for 2.5 hours under magnetic stirring in a constant-temperature water bath to produce water glass. The solution is then filtered hot and washed with ultrapure water until neutral, and the filtrate is stored in a PTFE gas washing bottle. During the mixing process, a single variable, the type of mixed solvent (ultrapure water, 1 mol/L NaOH, 3 mol/L NaOH), is controlled. A comparative analysis is conducted to evaluate the effects of different mixed solvents on the extraction yield and purity of the final product, nano-silica, along with changes in the Na2O content to determine the optimal mixed solvent.
The fourth, the gas washing bottle containing the water glass is placed in a constant-temperature water bath at 90 °C, and CO2 is introduced at a specific airflow rate for 1.5 hours, replacing traditional acids and resulting in the carbonate decomposition that generates silica flocs.
The fifth, the silica flocs are allowed to stand at room temperature for a period of time until the flocs mature. They are then filtered and washed to neutrality and dried at 105 °C for 12 hours to obtain nano-silica. During the ripening process, a single variable, the ripening time (0 h, 3 h, 12 h, 72 h), is controlled to determine the optimal ripening duration for complete maturation of the flocs. The optimal ripening time is determined by comparing the effects of different ripening durations on the extraction yield and oil absorption value of the nano-silica.
2.3. Experimental Tests
To elucidate the physicochemical properties of the extracted nano-silica, the following experimental instruments and characterizations were employed for its analytical characterization. The specific surface area and pore size distribution of the biomass ash and nano-silica were analyzed using a nitrogen adsorption-desorption isotherm analyzer (BET, TriStar II 3020, America). The microstructure and morphology of silica were examined using a scanning electron microscope (SEM, JEOL, Japan). The elemental content and the oxide composition of ash were analyzed using X-ray fluorescence spectroscopy (XRF, S8 TIGER, Germany). The particle size of the nano-silica was examined using a transmission electron microscope (TEM, JEM-2100F, Japan) following GB/T 42208-2022, and the crystal structure of the samples was analyzed using X-ray diffraction (XRD, XD-6, Japan).
The absorption value of white carbon black using dibutyl phthalate (DBP) was determined using the manual method as stated in HG/T 3072-2019. The determinations of loss on drying (LOD) and loss on Ignition (LOI) were conducted according to national industry standards HG/T 3065-2008 and HG/T 3066-2008, respectively. The content of amorphous silica was determined based on detection methods for silicon-containing fertilizers published by the Food and Agricultural Materials Inspection Center (FAMIC) in Japan. The extraction yield of silica was calculated using Equation1.
Where M1 is the dried weight of the obtained white silica.
M0 is the dried weight of the bottom slag.
is the SiO2 content in the obtained solids.
is the SiO2 content in the bottom slag.
3. Results and Discussion
3.1. Effects of Acid Pretreatment
The effects of different acid concentrations on the final product were illustrated in Figure 2. It could be observed from Figure 2 that as the concentration of hydrochloric acid increased, both the extraction yield and purity of nano-silica initially increased, then decreased, and subsequently increased again, with the first peak occurring at a concentration of 5 M. This trend aligned with the findings of Teymouri et al. [22]. At a hydrochloric acid concentration of 1 M, the extraction yield was relatively low, and the purity was only 53.2%. As the concentration of hydrochloric acid increased, when it reached 5 M, the extraction yield significantly increased to 61.1%, and the purity also substantially improved to 86.92%. This was because, in the initial stages of concentration increase, hydrochloric acid significantly dissolved other oxides in the bottom slag, effectively removing the other oxides that encapsulated the silica and thereby significantly increasing the reactive surface area of the silica. However, when the hydrochloric acid concentration increased further to 7 M, both the extraction yield and purity decreased to 52.66% and 70.32%, respectively. This was attributed to the high concentration hydrochloric acid beginning to react directly with silica, leading to its dissolution in the solution, which was then removed in the subsequent filtration step, thus lowering the extraction yield. Furthermore, excessive reaction of hydrochloric acid may have triggered a series of side reactions, such as the reaction between the acid and metal oxides like calcium, magnesium, and aluminum present in the residue, resulting in the formation of insoluble by-products. This reduced the proportion of silica in the final product, thereby decreasing its purity. As the concentration was further increased to 9 M, the purity reached its maximum value of 94.38%, while at 11 M, the extraction yield reached its peak of 66.71%. Due to the acid concentration reaching a higher level, it provided enhanced dissolving and complexing abilities, consistent with the findings of Steven et al. [23]. Extremely concentrated hydrochloric acid could dissolve silicates that were previously difficult to process or disrupt the formation of silica gel, thereby increasing the purity and extraction yield of SiO2.
The BET test results of nano-silica extracted after treatment with different acid concentrations were shown in Figure 3. Figure 3(a) showed the nitrogen adsorption isotherms of nano-silica extracted after treatment with different acid concentrations. All curves displayed clear Type II nitrogen adsorption-desorption isotherms, with an H3-type mesoporous hysteresis loop appearing at P/P0 = 0.8-1.0. This was attributed to capillary condensation of nitrogen in the interstitial pores of mesoporous silica particles [24]. This result indicated the presence of a distinct adsorption saturation plateau on the isotherms, reflecting a uniform pore size distribution in the nano-silica samples, which was consistent with the pore size distribution shown in Figure 3(b) for different concentrations of hydrochloric acid treatment. Typically, in the absence of surfactants, the pore size distribution of nano-silica ranged from 2 to 100 nm [19]. In this study, the pore size distribution obtained from 3 M to 11 M acid treatment was within the range of 2 to 100 nm. As the concentration of hydrochloric acid increased, the pore size distribution remained relatively unchanged, while the pore volume showed an increasing trend.
The changes in specific surface area, average pore size, and oil absorption values of nano-silica extracted after treatment with different acid concentrations were shown in Figure 4. Figures 4(a) and (b) indicated that as the concentration of hydrochloric acid pretreatment increased, the trends in oil absorption value, specific surface area, and average pore size corresponded to the changes in extraction yield, purity, and pore volume. These values increased up to 5 M, then decreased before increasing again. This was because the obtained silica consisted of fine and uniform nano-silica particles with small diameters, which had a large specific surface area. Hydrochloric acid effectively removed other impurities from the residual ash, leading to higher-purity silica with a looser structure, further increasing its specific surface area and average pore size. Additionally, the oil absorption value was positively correlated with the average pore size. This was because larger pore sizes and pore volumes could accommodate more oil, leading to higher oil absorption values. Therefore, the trend in the oil absorption curve aligned with the trend in the average pore size curve, which was consistent with previous studies [25]. In conclusion, acid treatment could improve the purity and extraction efficiency of nano-silica and enhance its specific surface area, average pore size, oil absorption value, and other physicochemical properties.
To determine the optimal acid concentration for the pretreatment step, this study further investigated the effects of different acid concentrations on the physicochemical properties of the ash. To characterize the changes in the crystalline form and degree of crystallization of silica in the residual ash after pretreatment with varying concentrations of hydrochloric acid, XRD diffraction experiments were conducted on the BS treated with different concentrations of hydrochloric acid. The experimental results were shown in Figure 5. Multiple distinct peaks appeared between diffraction angles of 20° and 70°, representing primarily silica, silicon sulfide, and aluminum phosphate. The main peak was located at a diffraction angle of 27°, and the high, narrow peak indicated a high degree of crystallinity in the silica at this location. It was noteworthy that although different concentrations of hydrochloric acid treatment did not significantly affect the types of substances present, the peak height of the main peak representing silica at a diffraction angle of 27° showed a clear decreasing trend with increasing acid concentration. This directly reflected a significant reduction in crystallinity, as the crystal structure of minerals was disrupted during hydrochloric acid treatment, leading to a disordering of the originally ordered crystal structures, which in turn reduced the crystallinity of the silica. This phenomenon was most pronounced in the XRD diffraction pattern of the BS treated with 5 M hydrochloric acid. The decrease in crystallinity suggested that the silica in the BS became easier to extract during subsequent processing, indicating that the activity of the silica in the BS was significantly enhanced after acid pretreatment, facilitating an increase in extraction efficiency.
To characterize the changes in the main ash components and heavy metal content in the ash after treatment with different acid concentrations, X-ray fluorescence (XRF) spectroscopy was performed on the ash before and after acid treatment. The experimental results were shown in Figure 6. The content of major oxides such as Al2O3, Fe2O3, CaO, K2O, and Na2O decreased significantly after acid washing, with the decrease becoming more pronounced as acid concentration increased. The concentrations of major heavy metals such as Cr, Mg, Mn, Ni, Cu, and Zn also decreased significantly after acid washing. This was because these oxides reacted with hydrochloric acid to form chlorides and water, allowing them to be removed with the filtrate from the solid ash. However, the SiO2 content in the ash increased from 53.96% to 60.16% after treatment with 5 M hydrochloric acid. This was because silica did not react with hydrochloric acid, and as the content of other oxides decreased, the proportion of silica increased. This indicated that the acid washing process could significantly increase the proportion of silica, reduce the impact of other oxides on silica purity, and thus enhance the final purity and extraction efficiency of nano-silica.
To determine the trend in the proportion of easily extractable amorphous silica in the BS after acid treatment, the content of amorphous silica in the BS treated with different acid concentrations and in the untreated BS was measured based on the method for detecting silicon-containing fertilizers published by Japan’s Food and Agricultural Materials Inspection Center (FAMIC) (4.4.1-c). As shown in Figure 7, the content of amorphous silica gradually increased with increasing hydrochloric acid concentration, reaching a peak at 9 M. However, even at the peak, the content of amorphous silica remained lower than that in the untreated BS sample. The acid treatment step dissolved part of the silica, which was removed with the filtrate during filtration. This dissolved portion was actually the easily extractable amorphous silica present in the raw BS. As the acid concentration increased, the higher concentration of hydrochloric acid reacted with silica, directly converting some other forms of silicon into amorphous silica. Although this conversion increased the total amount of amorphous silica, part of the initially easily extractable amorphous silica was dissolved and removed during the initial acid treatment, resulting in a final measured content of amorphous silica that remained lower than that of the untreated BS sample after reaching a certain peak.
In summary, while acid pretreatment resulted in some loss of the original amorphous silica in the BS, the amount lost was relatively small in the overall silica content. As discussed earlier, the acid washing step helped improve purity, extraction efficiency, and the physicochemical properties of silica. By adjusting the acid concentration, the activity of silica in the BS could be regulated, making it easier to extract. From the perspective of economic production, an increase in hydrochloric acid concentration led to higher costs and greater experimental risks. Therefore, the most suitable concentration of hydrochloric acid for pretreatment was ultimately determined to be 5 M.
3.2. Effects of Alkali Fused Materials
In this study, we initially followed the method proposed by An et al. [26], using conventional alkali leaching followed by a carbonation reaction to extract silica. However, the purity and extraction yield of the obtained silica were only 20%. Based on the property that high-temperature calcination after mixing ash with alkali could alter the crystal form and enhance the activity of silica [27], this study conducted X-ray diffraction experiments on the BS before and after high-temperature alkali fused. The experimental results, as shown in Figure 8, indicated that the SiO2 crystal form in the as-received BS before high-temperature alkali fused mainly consisted of stable forms such as High-quartz, Kyanite, and Beryl. In the alkali-fused BS activated by high-temperature fused, numerous peaks of sodium silicate appeared between diffraction angles of 10° and 70°. The presence of these sodium silicates indicated the transformation of the stable crystal form of SiO2 into more reactive and easily extractable soluble silicates.
To determine the effects of different alkaline materials used in alkali fused on the purity and extraction yield of the products, a controlled variable method was employed. The variable alkaline materials included three solid alkalis: NaOH, Ca(OH)2, and KOH. The experimental results showed that when NaOH solid was used as the mixing material, the extraction yield of silica significantly increased to 65.09%, with a purity of 86.92%. However, when Ca(OH)2 solid was used as the mixing material, the quantity of solid obtained was relatively low. This was because Ca(OH)2 is a weak base that reacts with silicates to form insoluble calcium silicate, which became mixed with the remaining solids in the ash, making effective separation difficult. Therefore, this study first excluded Ca(OH)2 as a mixing material. NaOH and KOH are strong bases, which, after alkali fused, generated corresponding soluble silicates when added to the liquid, and silica solids were subsequently obtained through a carbonation reaction. In the experiments, the purity of the white solids obtained from both KOH and NaOH was similar; however, the extraction yield using NaOH as the mixing agent was higher.
Consequently, this study adopted a method of co-firing with alkali mixing to achieve the goal of altering the silica crystal form in the BS and enhancing the activity of SiO2. Based on the aforementioned experimental results and an analysis of economic factors, while considering safety, the use of NaOH solid for co-firing proved to be the most effective in enhancing the activity of SiO2 in the BS. Therefore, the alkaline fused material selected for this study was NaOH.
3.3. Effects of the Mixing Ratio
The mixing ratio referred to the different mass ratio of the BS, dried after acid treatment, to solid NaOH during the alkaline fusion process. This study aimed to determine the optimal mixing ratio and its effects on the content of amorphous silica in the BS after alkaline fusion, as well as the purity and extraction yield of the product. Using the method of controlling variables, the mixing ratios were set at 1:0.6, 1:0.8, 1:1, 1:1.2, and 1:1.4. The experimental results, shown in Figure 9, indicated that as the mixing ratio increased, the extraction yield, purity, and content of amorphous silica initially increased and then decreased. This phenomenon occurred because SiO2 in the BS existed in stable crystalline forms such as high quartz and sanidine. In a high-temperature environment, these stable crystals reacted with NaOH, transforming into extractable Na2SiO3. This conversion process facilitated the extraction of silica, thereby enhancing the overall extraction efficiency. The maximum purity and extraction yield of 92.43% and 61.8% were achieved at mixing ratios of 1:1 and 1:1.2, respectively. However, further increasing the mixing ratio led to an excess of alkali, which existed as Na2O in the final product and reduced the purity of nano-silica. The detection method for silicon-containing fertilizers published by FAMIC was modified to measure the content of amorphous silica in the BS after alkaline fusion. The variation in the content of amorphous silica indicated changes in the extent to which silica could be extracted. The content of amorphous silica reached its maximum at a mixing ratio of 1:1.2, indicating that the amount of NaOH mixed at this ratio effectively converted the SiO2 form in the BS into an extractable amorphous state.
Based on the above experimental results, appropriately increasing the mixing ratio could enhance the extraction yield and purity of silica, as well as increase the content of amorphous silica, thereby improving the reactivity of silica in the BS. In this study, a mixing ratio of 1:1.2 was employed for mixed combustion to best enhance the reactivity of SiO2 in the BS, thereby facilitating silica extraction. Therefore, the mixing ratio used in this study was 1:1.2.
3.4. Effects of Mixed Solvents
In this study, the alkali-fused BS were ground and then added to deionized water along with different concentrations of NaOH solution. As shown in Table 3, with the increasing concentration of NaOH in the mixed solvents, both the extraction yield and the purity of the product demonstrated an upward trend. However, this enhancement was not without its costs, as the Na2O content in the product also increased significantly. The Na2O content rose from the original 2.03% present in the residue to 5.62% in the extracted silica when using a 3M NaOH solution as the mixed solvent. This result indicated that there was an excess of alkali during the extraction process. Therefore, further increasing the concentration of the mixed solvent did not enhance the purity or extraction yield of the product but instead led to an increased proportion of Na in the product. This not only may have affected the final performance of the product but also appeared to be economically unreasonable.
Through theoretical analysis and experimental verification, the mixed solvent chosen in this study ultimately was 3M NaOH.
3.5. Effects of Ripening Time
The ripening step referred to allowing the solution, after carbonization decomposition, to stand at room temperature. To determine the optimal ripening time for the extraction yield and oil absorption value of the product, this study conducted a single-factor experiment. Following the controlled variable method, the variable ripening times were set at 0h, 3h, 12h, and 72h. The experimental results, as shown in Figure 10, indicated that the extraction yield of silica and the oil absorption value in the BS first increased and then decreased over time. According to the Ostwald ripening theory, when solid particles were dispersed in a supersaturated solution, the solute concentration around smaller particles was higher than that around larger particles due to the capillary effect. This concentration gradient drove the diffusion of solute toward larger particles, enabling the larger particles to absorb solute from the supersaturated solution and continue to grow. During the ripening process of the silica system, smaller silica particles gradually dissolved while larger silica particles grew further until the solubility of silica particles of different sizes in the system approached equilibrium. Therefore, the ripening process was essentially one of gradually homogenizing the sizes of the silica floccules. Thus, ripening during the initial formation of nuclei was beneficial for the uniform growth of the particles in the later stages. The trend shown in the figure revealed a significant influence of ripening time on the maturity of silica particles. Specifically, when the ripening time reached 12 hours, the state of the silica particles achieved optimal maturity. However, if the ripening time was too long, smaller silica particles gradually dissolved while larger particles might continue to grow, ultimately leading to an overall increase in particle size and a narrower particle size distribution. This change in particle size distribution not only affected the extraction yield of silica but also negatively impacted its oil absorption value.
In this study, to achieve a higher extraction yield and oil absorption value while conserving time, the final selected ripening time was 12 hours.
3.6. Product Quality and Characterization
The final prepared nano-silica was characterized according to the industry standards HG/T 3062-3072, and the product parameters are detailed in Table 4. A comparison of the parameters with the industry standard HG/T 3061-2020 confirmed that all parameters fell within the prescribed standard ranges. As shown in Figure 11(a), the X-ray diffraction (XRD) pattern of the prepared nano-silica displayed a typical diffuse scattering diffraction pattern. At 2θ = 21°, the curve presented a broad and shallow peak, which corresponded to the position of soluble silicates in the XRD spectrum of the BS treated with hydrochloric acid. No sharp characteristic peaks of crystalline SiO2 were observed in the figure, indicating clearly that the obtained nano-silica powder was in an amorphous form, with no significant impurities detected. Therefore, it can be concluded that the nano-silica powder was primarily composed of an amorphous material, showcasing the high purity characteristics of the product.
Figure 11(b) presented the nitrogen adsorption-desorption isotherm and the corresponding desorption pore volume curve for the nano-silica obtained through the optimal process. Using a BET physical adsorption apparatus, the specific surface area of the obtained nano-silica was measured to be 55.9916 m2/g, with an average pore diameter of 16.2717 nm. The presented adsorption-desorption curve in the figure corresponded to Type II isotherms defined by the International Union of Pure and Applied Chemistry (IUPAC) and prominently exhibited characteristics of an H3-type hysteresis loop. This result indicated the presence of a distinct plateau in the adsorption isotherm, reflecting a uniform pore size distribution in the nano-silica samples, as well as a large specific surface area and moderate pore volume. This characteristic not only enhanced the ability to adsorb macromolecules but also effectively facilitated the mass transfer process.
To confirm that the extracted silica from the optimal process consisted of nanoparticles and to observe the microscopic structure and morphological characteristics of the nano-silica, this study employed scanning electron microscopy (SEM) and transmission electron microscopy (TEM) for examination, as illustrated in Figure 12(d). Under the scanning electron microscope, the silica appeared as aggregates of smooth, spherical particles. The transmission electron microscopy images clearly revealed the high-resolution microstructure of silica derived from CSA. At a magnification of 300,000 times in Figure 12(a), we observed that the nano-silica particles exhibited a quasi-spherical morphology, along with a certain degree of aggregation. Further examination of Figure 12(b) revealed that these silica particles were composed of interconnected quasi-spherical particles with a wide size range, distributed between 10 and 50 nanometers, consistent with the definition of “nano-silica.” In the high-resolution image shown in Figure 12(c), all samples exhibited a disordered state, with no discernible crystal structure. This observation indicated that the prepared nano-silica was entirely amorphous, further confirming its non-crystalline nature.
To clarify the superiority of the silica prepared in this study, various properties of the silica obtained from this research were compared with those derived from different silicon sources, as shown in Table 5. In terms of silica content among the prepared samples, the silica synthesized in this study achieved a purity of 92.73%, surpassing that of most other silica derived from different sources listed in the table. Furthermore, under the condition of high purity, this study reported a silica extraction yield of 92.73%, which was the actual yield obtained during the experimental process. Due to certain losses in the experimental procedure, the theoretical extraction yield should exceed 92.73%. Nevertheless, the extraction yield of nano-silica synthesized in this study was significantly higher than that of other methods; for instance, the extraction yield reported by Piela et al. was 47%, Chen et al. achieved 68.01%, and Liang et al. reported a yield of 20.45%. Although Estevez et al. also reported an extraction yield of 88%, the purity of their product was unknown, and their synthesis process took as long as five months. Consequently, the extraction yield reported in this study was far superior to those previously documented in the literature for synthesizing nano-silica, and this high extraction yield further reduced the production costs of nano-silica. In comparison to silica produced from BPP straw ash with particle sizes greater than 100 nm, this study produced nano-silica with smaller particle sizes (10 nm–50 nm), which has higher added value and broader application potential. Additionally, when compared to nano-silica prepared from biomass that had been calcined in a laboratory, the properties of the nano-silica synthesized in this study using direct combustion ash from BPP as the silicon source were similar, providing strong evidence for the feasibility of using direct combustion ash to produce nano-silica in practical production settings. Therefore, the superiority of this study lay in the utilization of direct combustion ash from BPP as a silicon source, which significantly enhanced the extraction yield of nano-silica to over 90% while ensuring high purity and other important characteristics.
4. Conclusion
In this study, nano-silica was successfully extracted from the direct combustion corn straw ash of a BPP, opening a new efficient, environmentally friendly, and feasible path for the recycling of solid waste from power plants. This approach effectively explores the potential value of power plant waste, reducing the environmental pollution caused by waste disposal. At the same time, it provides a direction for the high-value utilization of corn straw ash, transforming what was once considered waste into high-value-added nano-silica, thereby realizing resource recovery of solid waste.
In the preparation of nano-silica, this study utilized corn straw ash from BPP as the silicon source, which is cost-effective yet highly effective. By optimizing the process, this research successfully produced amorphous nano-silica with a small particle size (10nm-50nm), high DBP oil absorption value (270*10-5m3/kg), large specific surface area (55.9916 m2/g), high purity (92.73%), and high extraction yield (93.11%), with copper, iron, and manganese contents (30mg/kg,165mg/kg,39mg/kg), LOD (6.38%), LOI (6.69%) all meeting industry standards.
In the extraction of nano-silica, the acid concentration was 5 M, the choice of alkaline fused was NaOH, and the mixing ratio was 1:1.2; these factors are key to optimizing and enhancing the activity of silica. Other influencing factors, such as the mixing solvent (3mol/L NaOH) and ripening time (12 h), allow for the production of high-value nano-silica with an extraction yield exceeding 90% while ensuring purity and other parameters after filtration, washing, and drying.
Acknowledgements
This work was supported by Huaneng Jilin Power Generation CO.,LTD., Changchun130012, Jilin, China (HNKJ23-HF54).
References
- Z. Lei, S. Pavia, X. Wang, Biomass ash waste from agricultural residues: Characterisation, reactivity and potential to develop one-part geopolymer cement, Constr Build Mater 431 (2024). [CrossRef]
- Y.M. Peralta, R. Molina, S. Moreno, Chemical and structural properties of silica obtained from rice husk and its potential as a catalytic support, J Environ Chem Eng 12 (2024). [CrossRef]
- Y. Shi, C. Xue, Y.P. Qiu, Analysis and prospect of resource utilization of ash and slag from agroforestry biomass-fired power plants in China, Journal of Agricultural Resources and Environment 36 (2019). [CrossRef]
- N. Chusilp, C. Jaturapitakkul, K. Kiattikomol, Utilization of bagasse ash as a pozzolanic material in concrete, Constr Build Mater 23 (2009). [CrossRef]
- V. Sata, C. Jaturapitakkul, K. Kiattikomol, Utilization of Palm Oil Fuel Ash in High-Strength Concrete, Journal of Materials in Civil Engineering 16 (2004). [CrossRef]
- C. Lung, H. Andsatish Chandra, THE USE OF RICE HUSK ASH IN CONCRETE, n.d.
- E.A. Basha, R. Hashim, H.B. Mahmud, A.S. Muntohar, Stabilization of residual soil with rice husk ash and cement, Constr Build Mater 19 (2005). [CrossRef]
- M.H. Zhang, V. Mohan, MalhotraHigh Performance Concrete Incorporating Rice Husk Ash as a Supplementary, ACI materials journal 93 (1996).
- Cementing MaterialA.M. Rashad, A comprehensive overview about the influence of different additives on the properties of alkali-activated slag - A guide for Civil Engineer, Constr Build Mater 47 (2013). [CrossRef]
- A. Mishra, K. Taing, M.W. Hall, Y. Shinogi, Effects of Rice Husk and Rice Husk Charcoal on Soil Physicochemical Properties, Rice Growth and Yield, Agricultural Sciences 08 (2017). [CrossRef]
- L. Romdhane, L.B. Ebinezer, A. Panozzo, G. Barion, C. Dal Cortivo, L. Radhouane, T. Vamerali, Effects of Soil Amendment With Wood Ash on Transpiration, Growth, and Metal Uptake in Two Contrasting Maize (Zea mays L.) Hybrids to Drought Tolerance, Front Plant Sci 12 (2021). [CrossRef]
- L. Sulaiman, R.M.E. Ramadhan, R.C. Islami, Compressive Strength of Corn Stalk Ash as Supplementary Cementitious Material in Mortar, E3S Web of Conferences 589 (2024). [CrossRef]
- M. Yadav, V. Dwibedi, S. Sharma, N. George, Biogenic silica nanoparticles from agro-waste: Properties, mechanism of extraction and applications in environmental sustainability, J Environ Chem Eng 10 (2022). [CrossRef]
- X. Chen, M. Xie, H. Wang, Y. Xue, Z. Li, Preparation of Silica by Alkaline-Heating and Precipitation Method from Corn Straw Ash, Bio Resources 9 (2014).
- N. Yalcë, V. Sevincë, Studies on silica obtained from rice husk, Ceramics international 27 (2001) 219-224.
- S.K.S. Hossain, L. Mathur, P.K. Roy, Rice husk/rice husk ash as an alternative source of silica in ceramics: A review, Journal of Asian Ceramic Societies 6 (2018). [CrossRef]
- V.B. Carmona, R.M. Oliveira, W.T.L. Silva, L.H.C. Mattoso, J.M. Marconcini, Nanosilica from rice husk: Extraction and characterization, Ind Crops Prod 43 (2013). [CrossRef]
- P. Singh, S. Srivastava, S.K. Singh, Nanosilica: Recent Progress in Synthesis, Functionalization, Biocompatibility, and Biomedical Applications, ACS Biomater Sci Eng 5 (2019). [CrossRef]
- G. Liang, Y. Li, C. Yang, C. Zi, Y. Zhang, X. Hu, W. Zhao, Production of biosilica nanoparticles from biomass power plant fly ash, Waste Management 105 (2020). [CrossRef]
- A. Pieła, E. Żymańczyk-Duda, M. Brzezińska-Rodak, M. Duda, J. Grzesiak, A. Saeid, M. Mironiuk, M. Klimek-Ochab, Biogenic synthesis of silica nanoparticles from corn cobs husks. Dependence of the productivity on the method of raw material processing, Bioorg Chem 99 (2020). [CrossRef]
- M. Estevez, S. Vargas, V.M. Castaño, R. Rodriguez, Silica nano-particles produced by worms through a bio-digestion process of rice husk, J Non Cryst Solids 355 (2009). [CrossRef]
- M. Teymouri, M. Shakouri, Optimum pretreatment of corn stover ash as an alternative supplementary cementitious material, CEMENT 12 (2023). [CrossRef]
- S. Steven, E. Restiawaty, P. Pasymi, Y. Bindar, An appropriate acid leaching sequence in rice husk ash extraction to enhance the produced green silica quality for sustainable industrial silica gel purpose, J Taiwan Inst Chem Eng 122 (2021). [CrossRef]
- Q. Yue, M. Wang, J. Wei, Y. Deng, T. Liu, R. Che, B. Tu, D. Zhao, A template carbonization strategy to synthesize ordered mesoporous silica microspheres with trapped sulfonated carbon nanoparticles for efficient catalysis, Angewandte Chemie - International Edition 51 (2012). [CrossRef]
- W.J. Tian, L. Han, Z.L. Shi, Performance study of precipitated nano-silica from acid leaching residue of coal ash by carbonation method, Chemical Industry and Engineering Progress 37 (2018) 984.
- D. An, Y. Guo, Y. Zhu, Z. Wang, A green route to preparation of silica powders with rice husk ash and waste gas, Chemical Engineering Journal 162 (2010). [CrossRef]
- T. Qi, H. Wang, G. Feng, Y. Zhang, J. Bai, Y. Han, Effect of calcination temperature on the pozzolanic activity of maize straw stem ash treated with portlandite solution, International Journal of Minerals, Metallurgy and Materials 29 (2022). [CrossRef]
- R.H. Alves, T.V.D.S. Reis, S. Rovani, D.A. Fungaro, Green Synthesis and Characterization of Biosilica Produced from Sugarcane Waste Ash, J Chem 2017 (2017). [CrossRef]
- L. Han, P.W. Zhu, H. Dai, Z.L. Shi, Q.H. Wang, M.X. Fang, Preparation of Precipitated Nano-silica from Acid Leaching Residue of Coal Ash by Carbonation Method, Materials Reports 29 (2015).
Figure 1.
Extraction flowchart of Nano-silica.
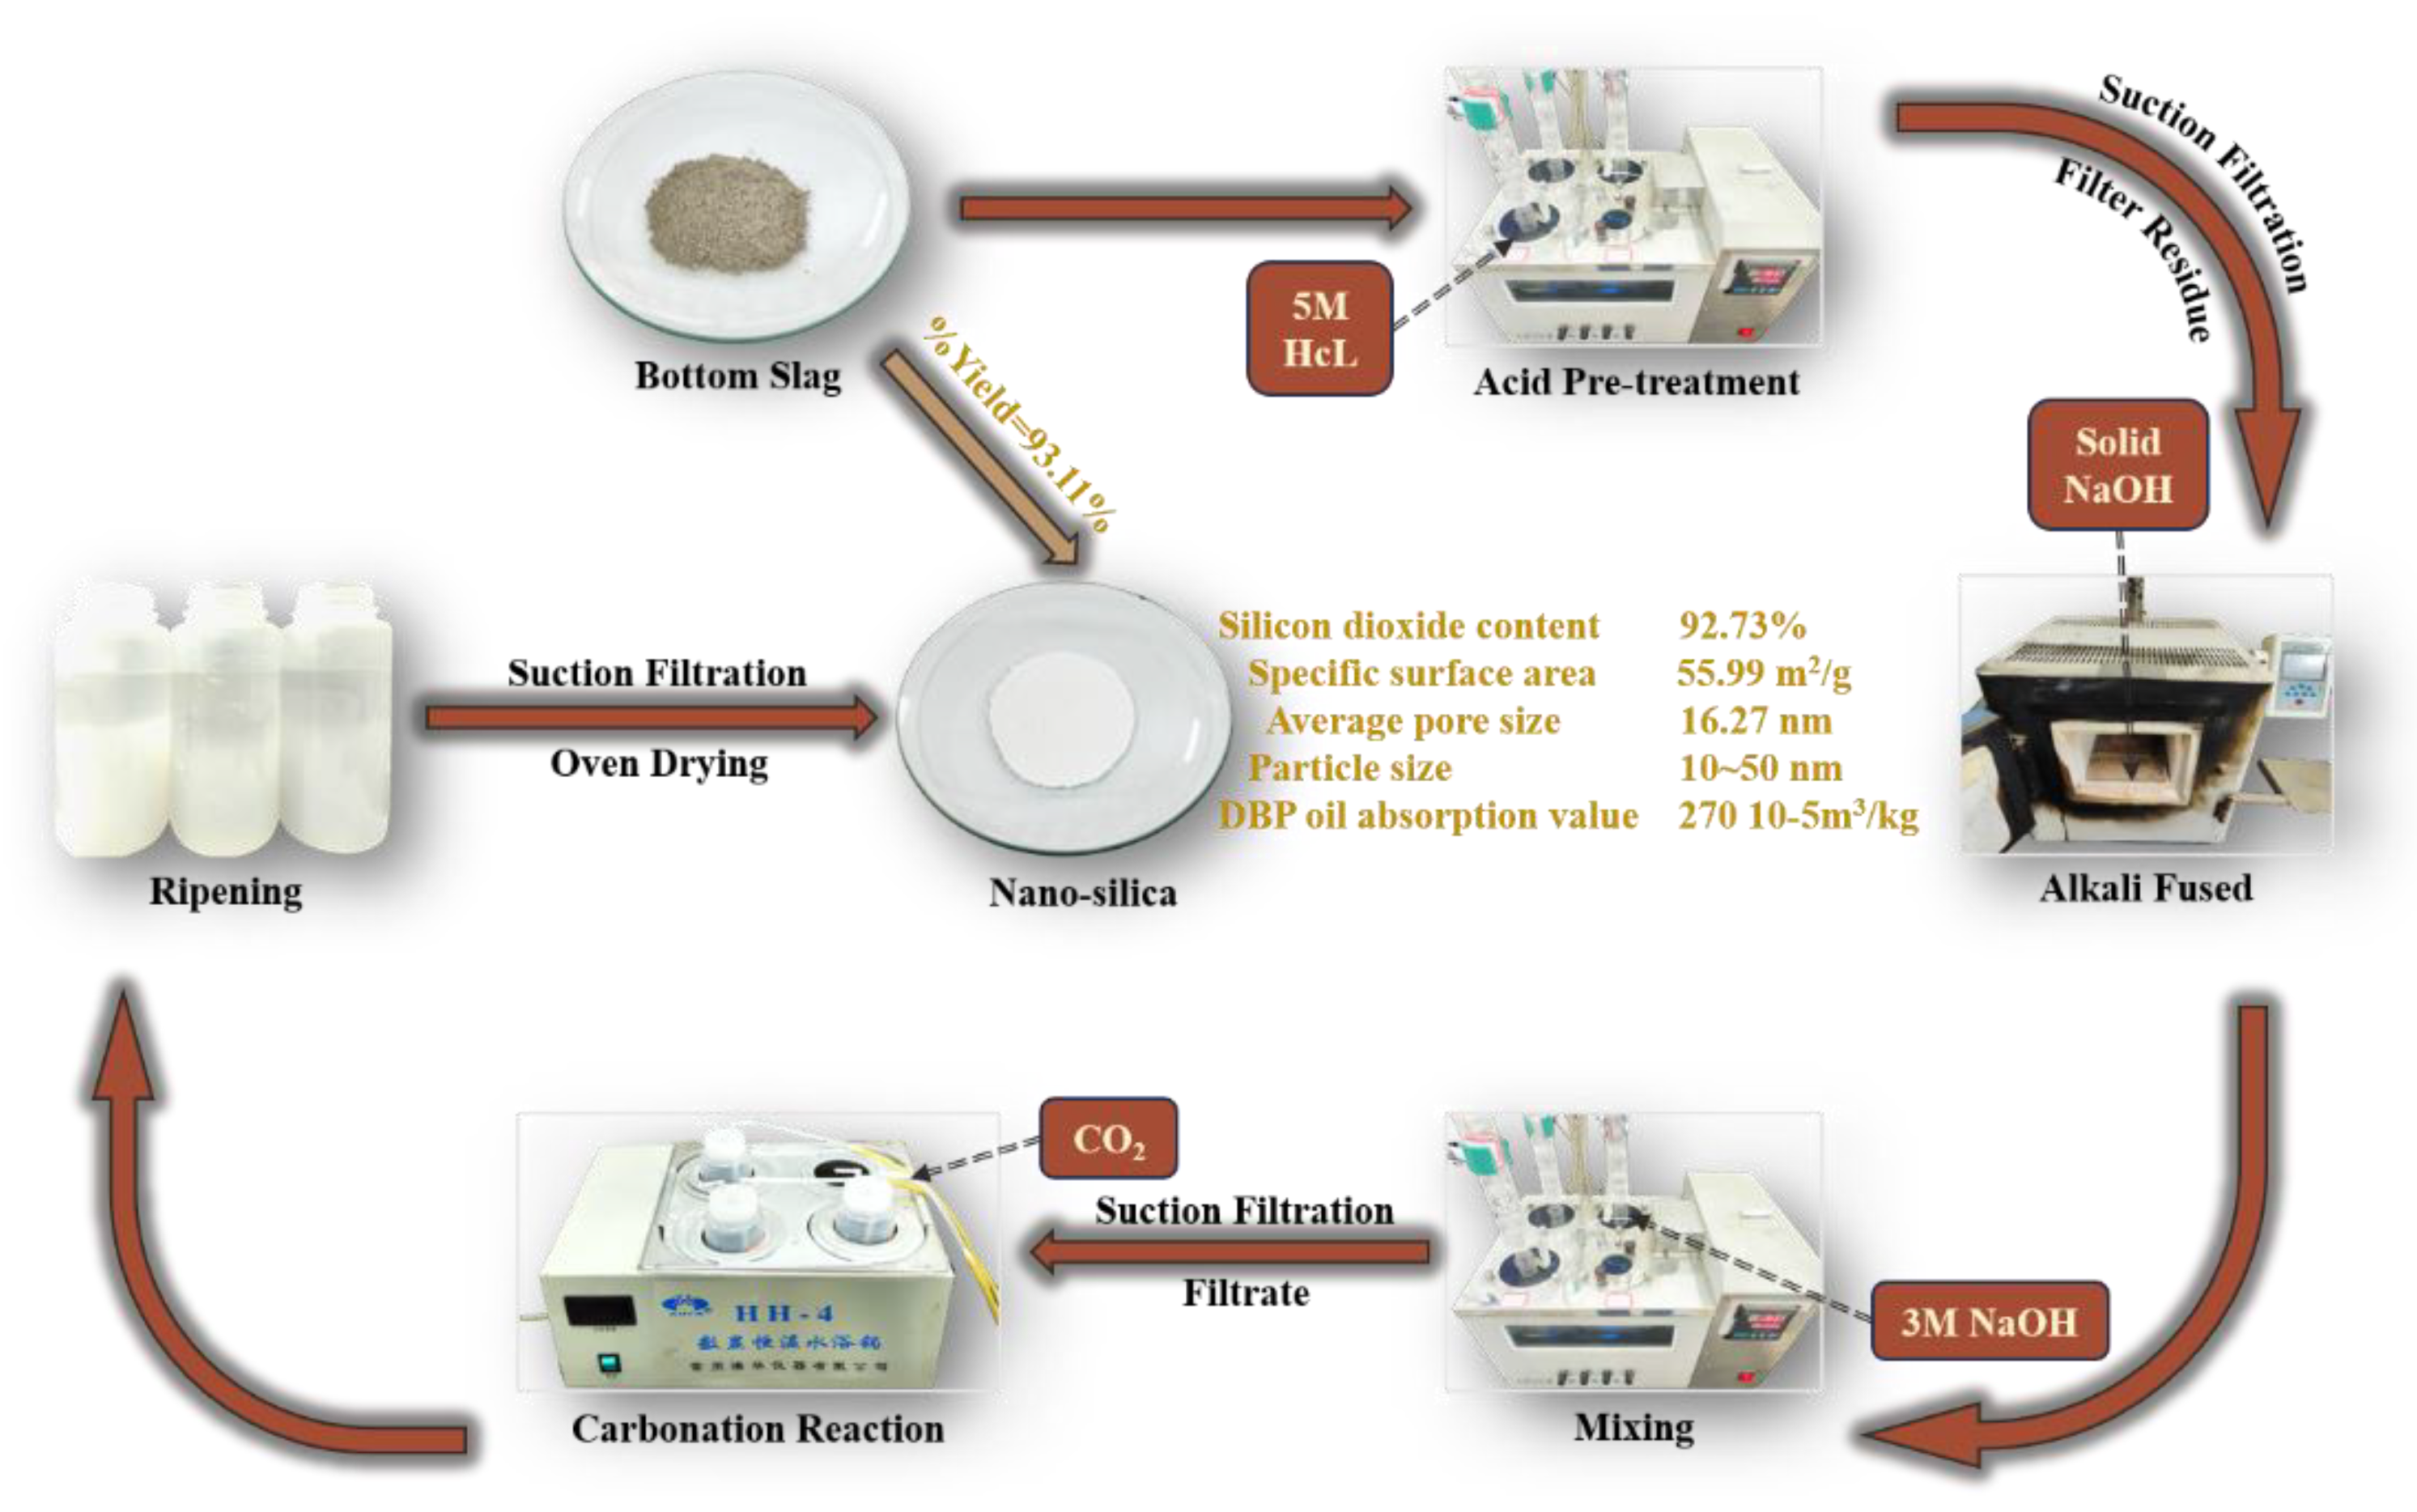
Figure 2.
Effect of pretreatment hydrochloric acid concentration on extraction rate and purity.
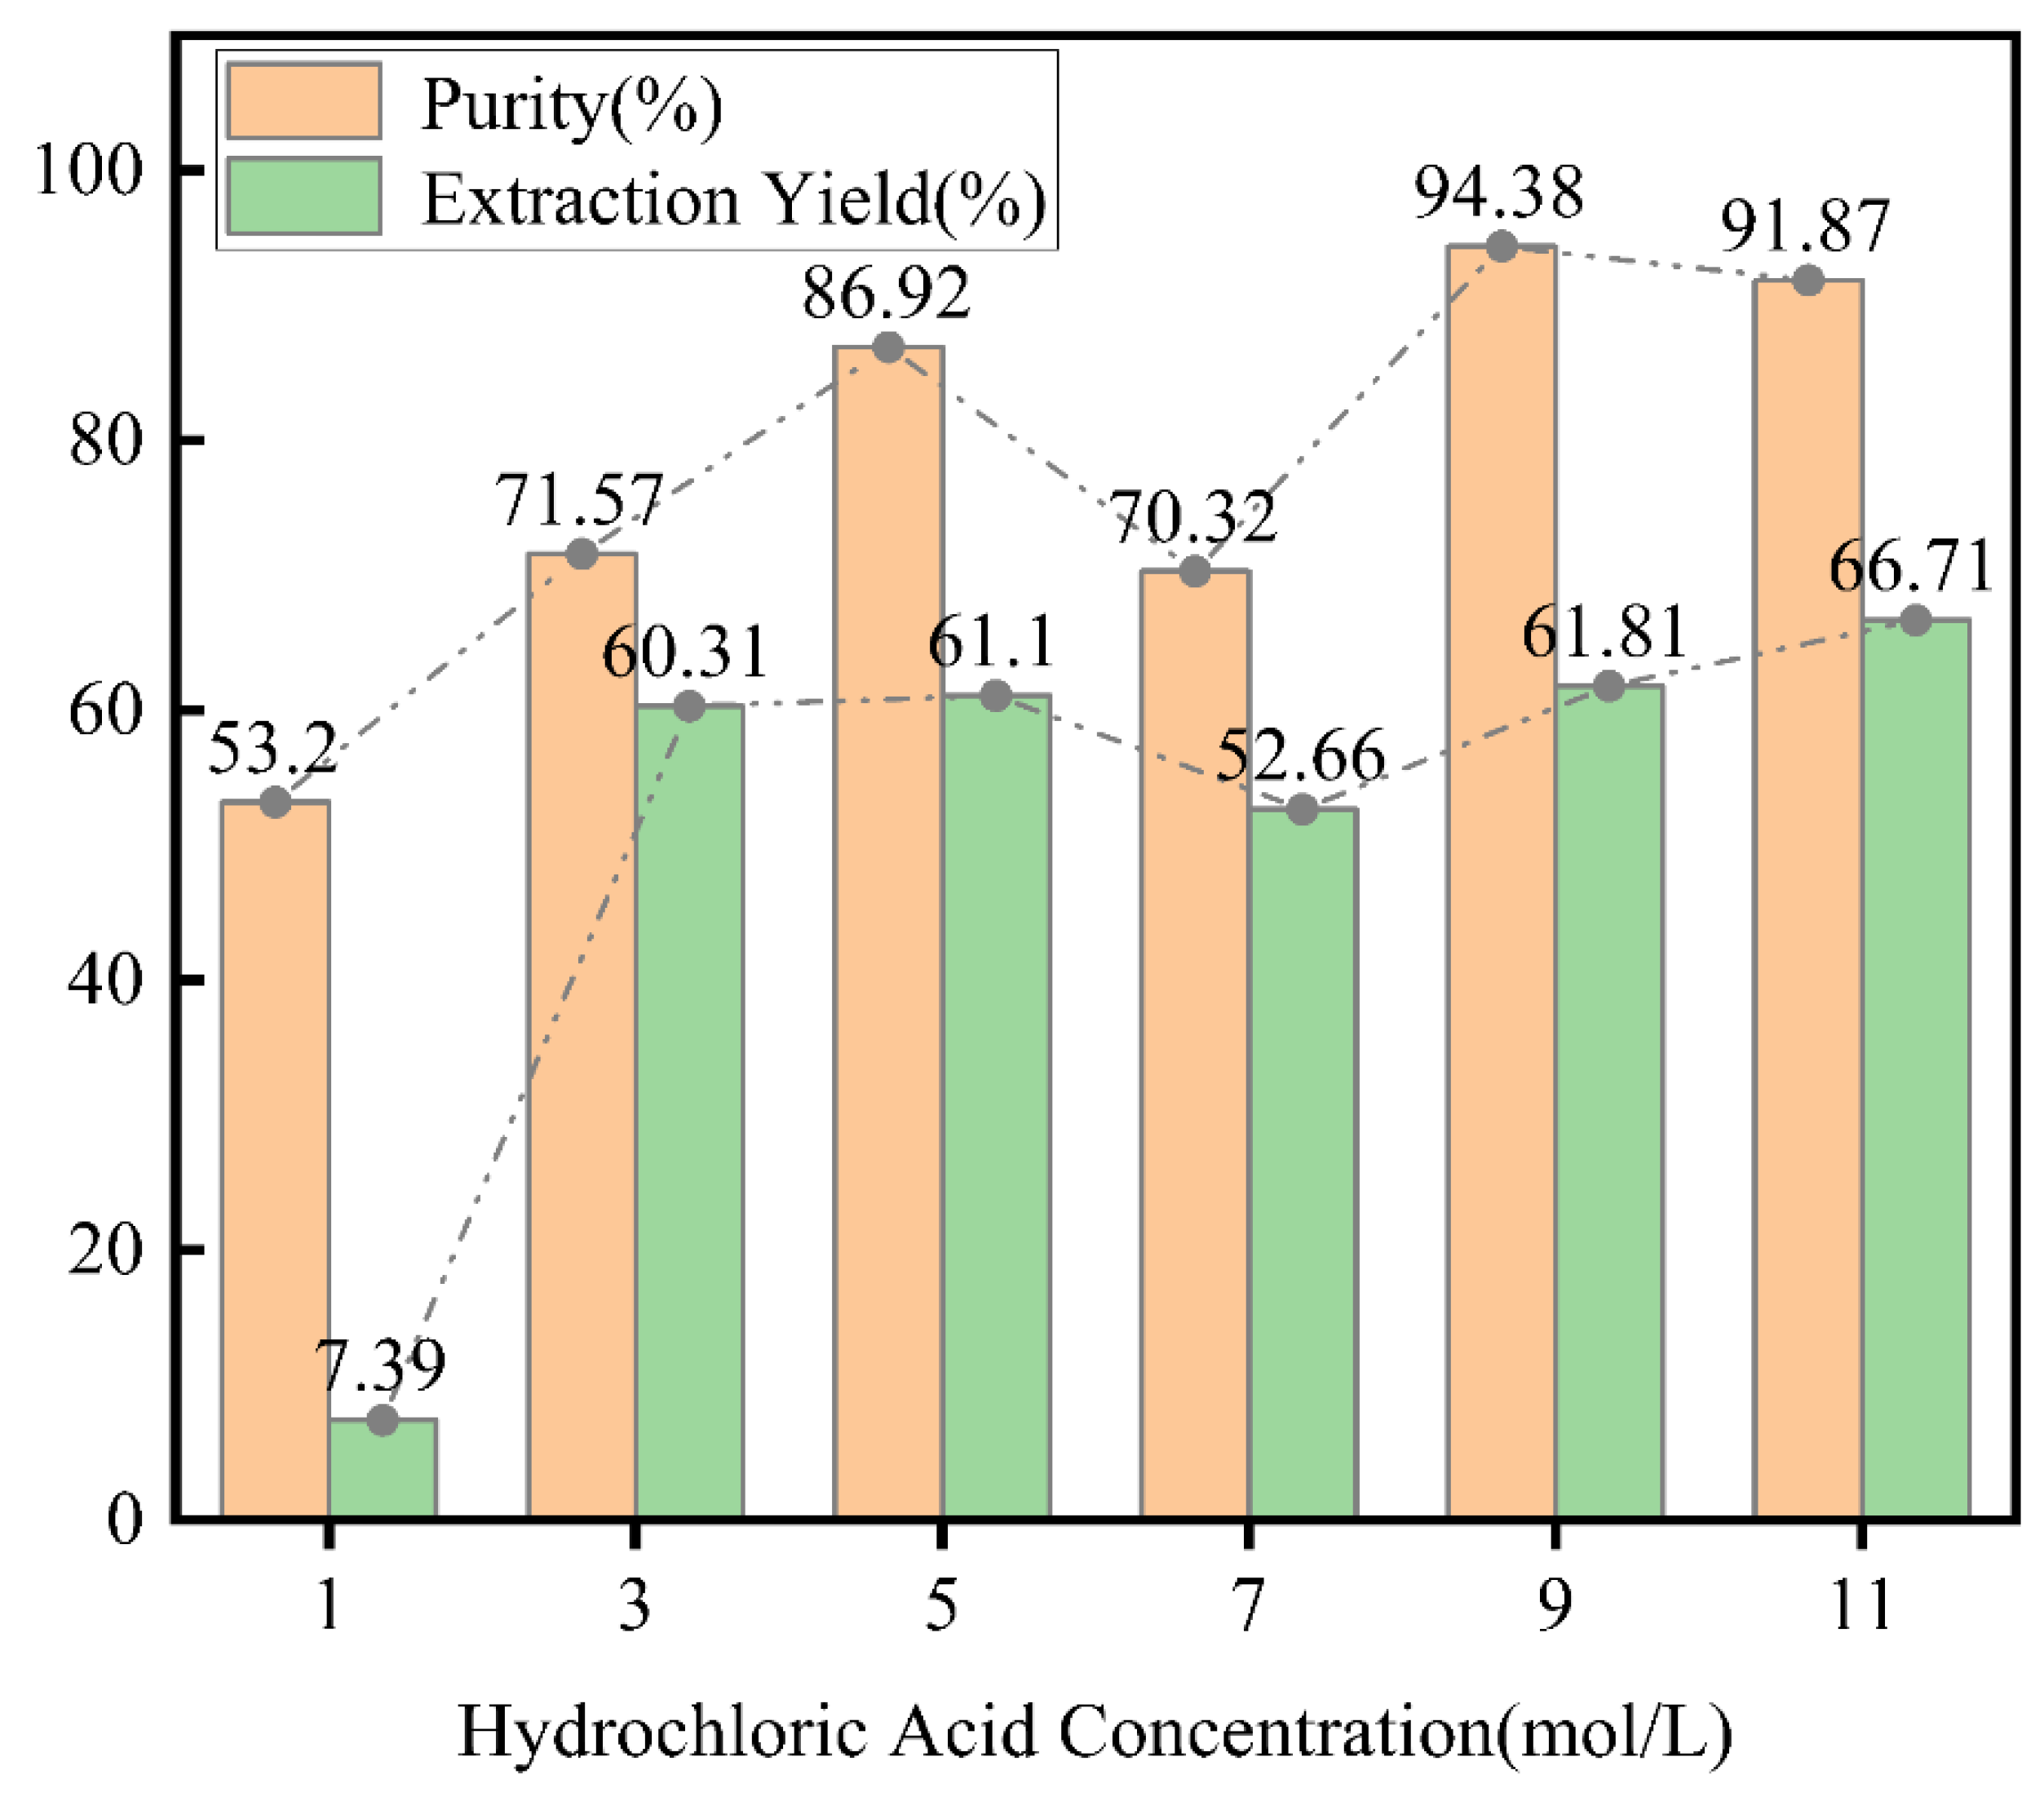
Figure 3.
N2 adsorption isotherms and pore size distribution of nano-silica extracted after treatment with different concentrations of acids.
Figure 3.
N2 adsorption isotherms and pore size distribution of nano-silica extracted after treatment with different concentrations of acids.
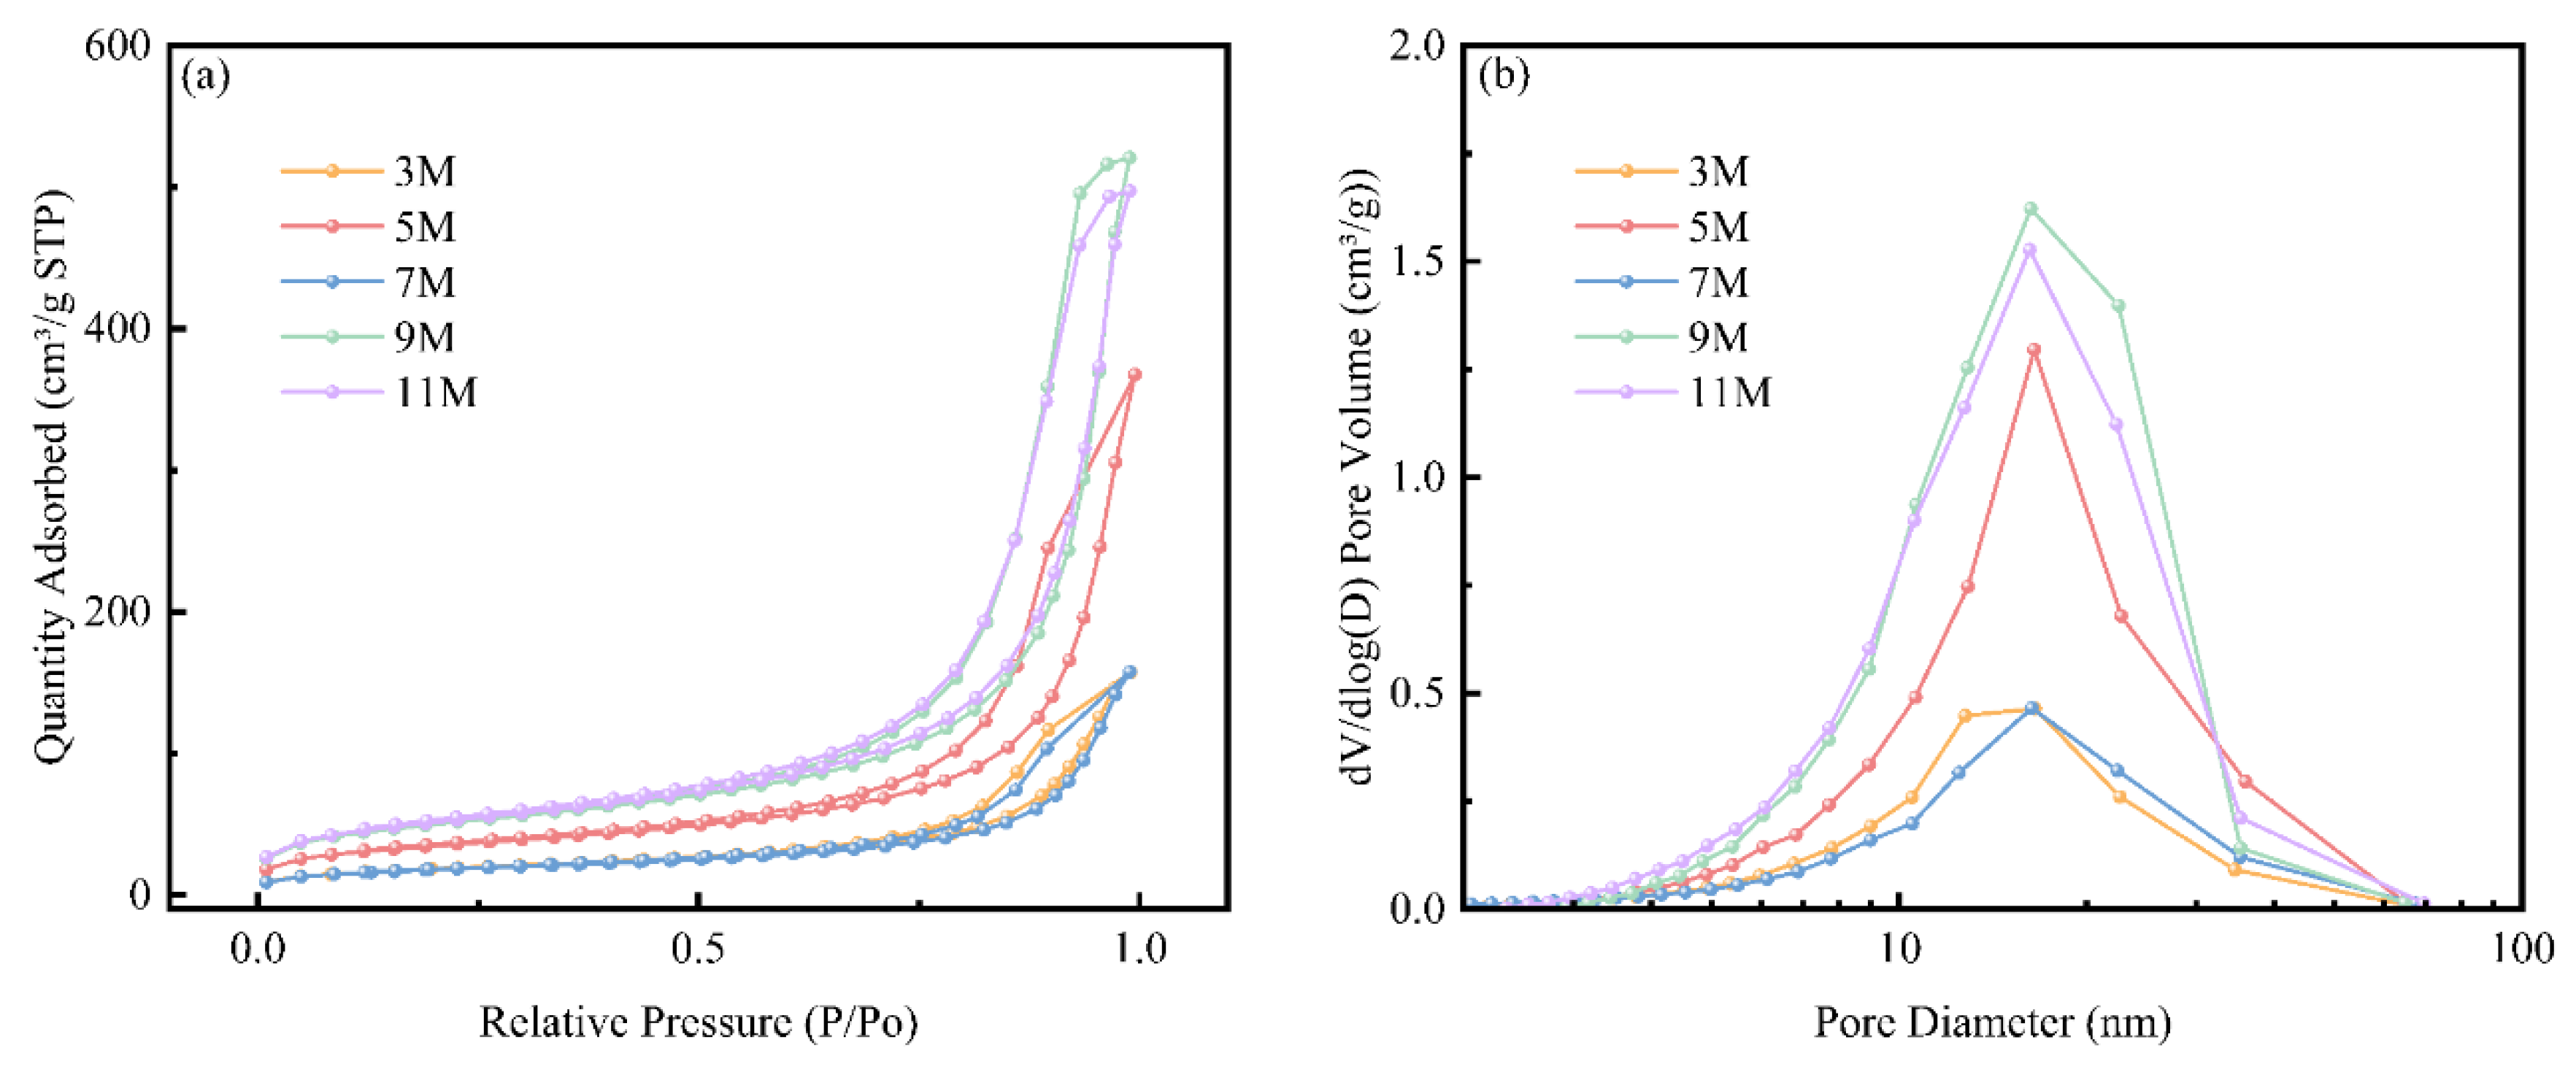
Figure 4.
Effects of acid treatment at different concentrations on the specific surface area, average pore diameter, and oil absorption value of nano-silica.
Figure 4.
Effects of acid treatment at different concentrations on the specific surface area, average pore diameter, and oil absorption value of nano-silica.
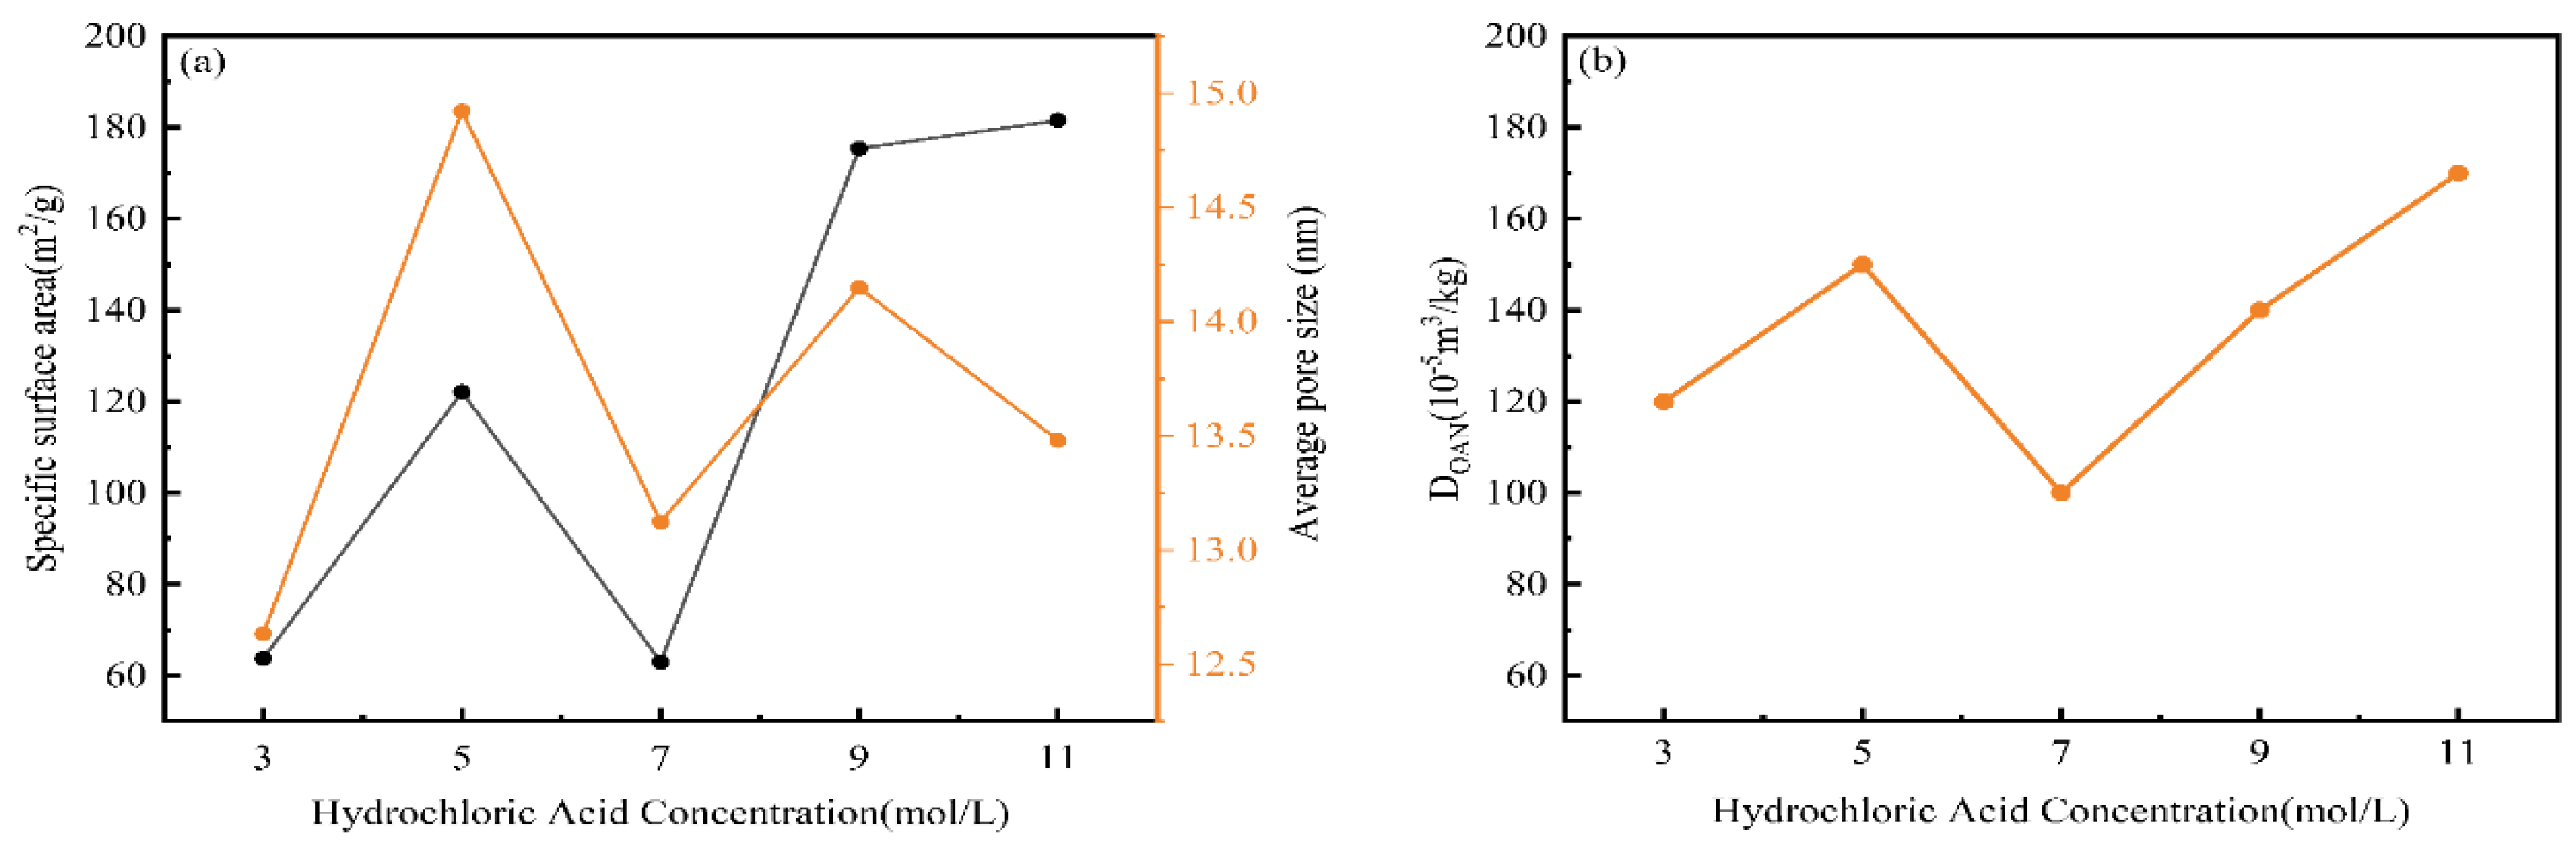
Figure 5.
XRD diffraction patterns of bottom slag after treatment with different concentrations of acid.
Figure 5.
XRD diffraction patterns of bottom slag after treatment with different concentrations of acid.
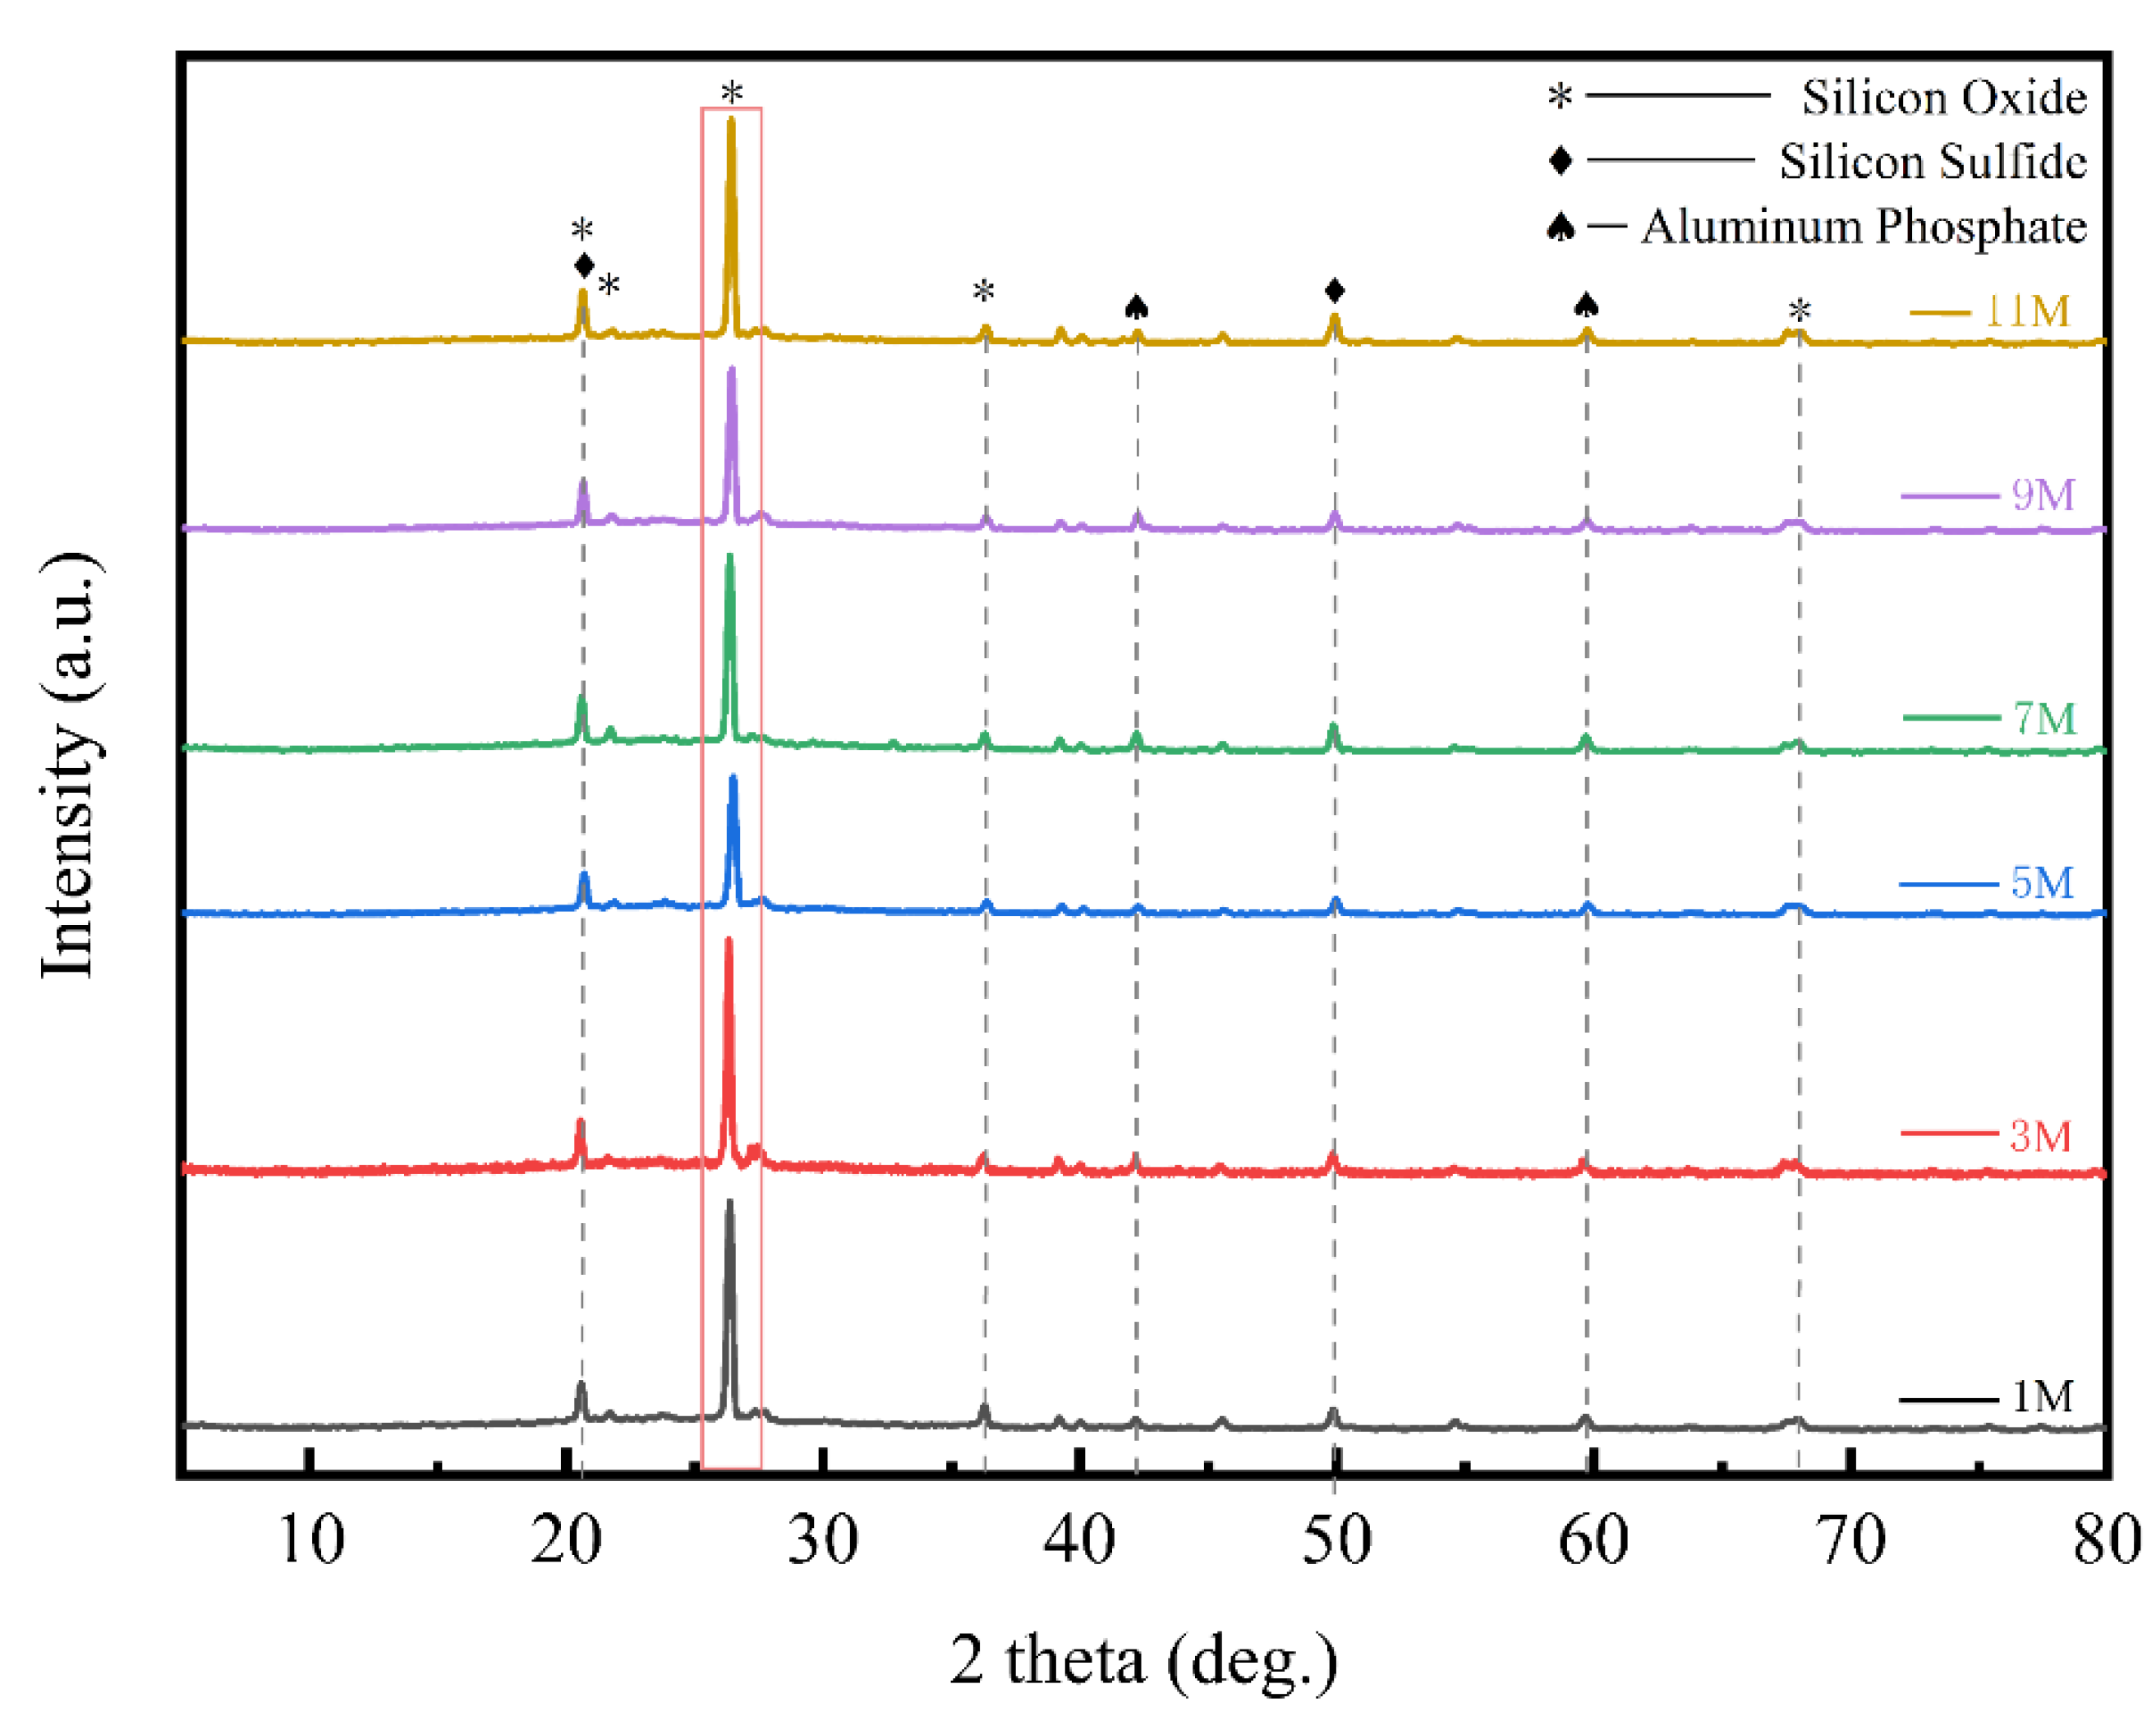
Figure 6.
X-ray fluorescence spectra of bottom slag after treatment with different concentrations of acid.
Figure 6.
X-ray fluorescence spectra of bottom slag after treatment with different concentrations of acid.
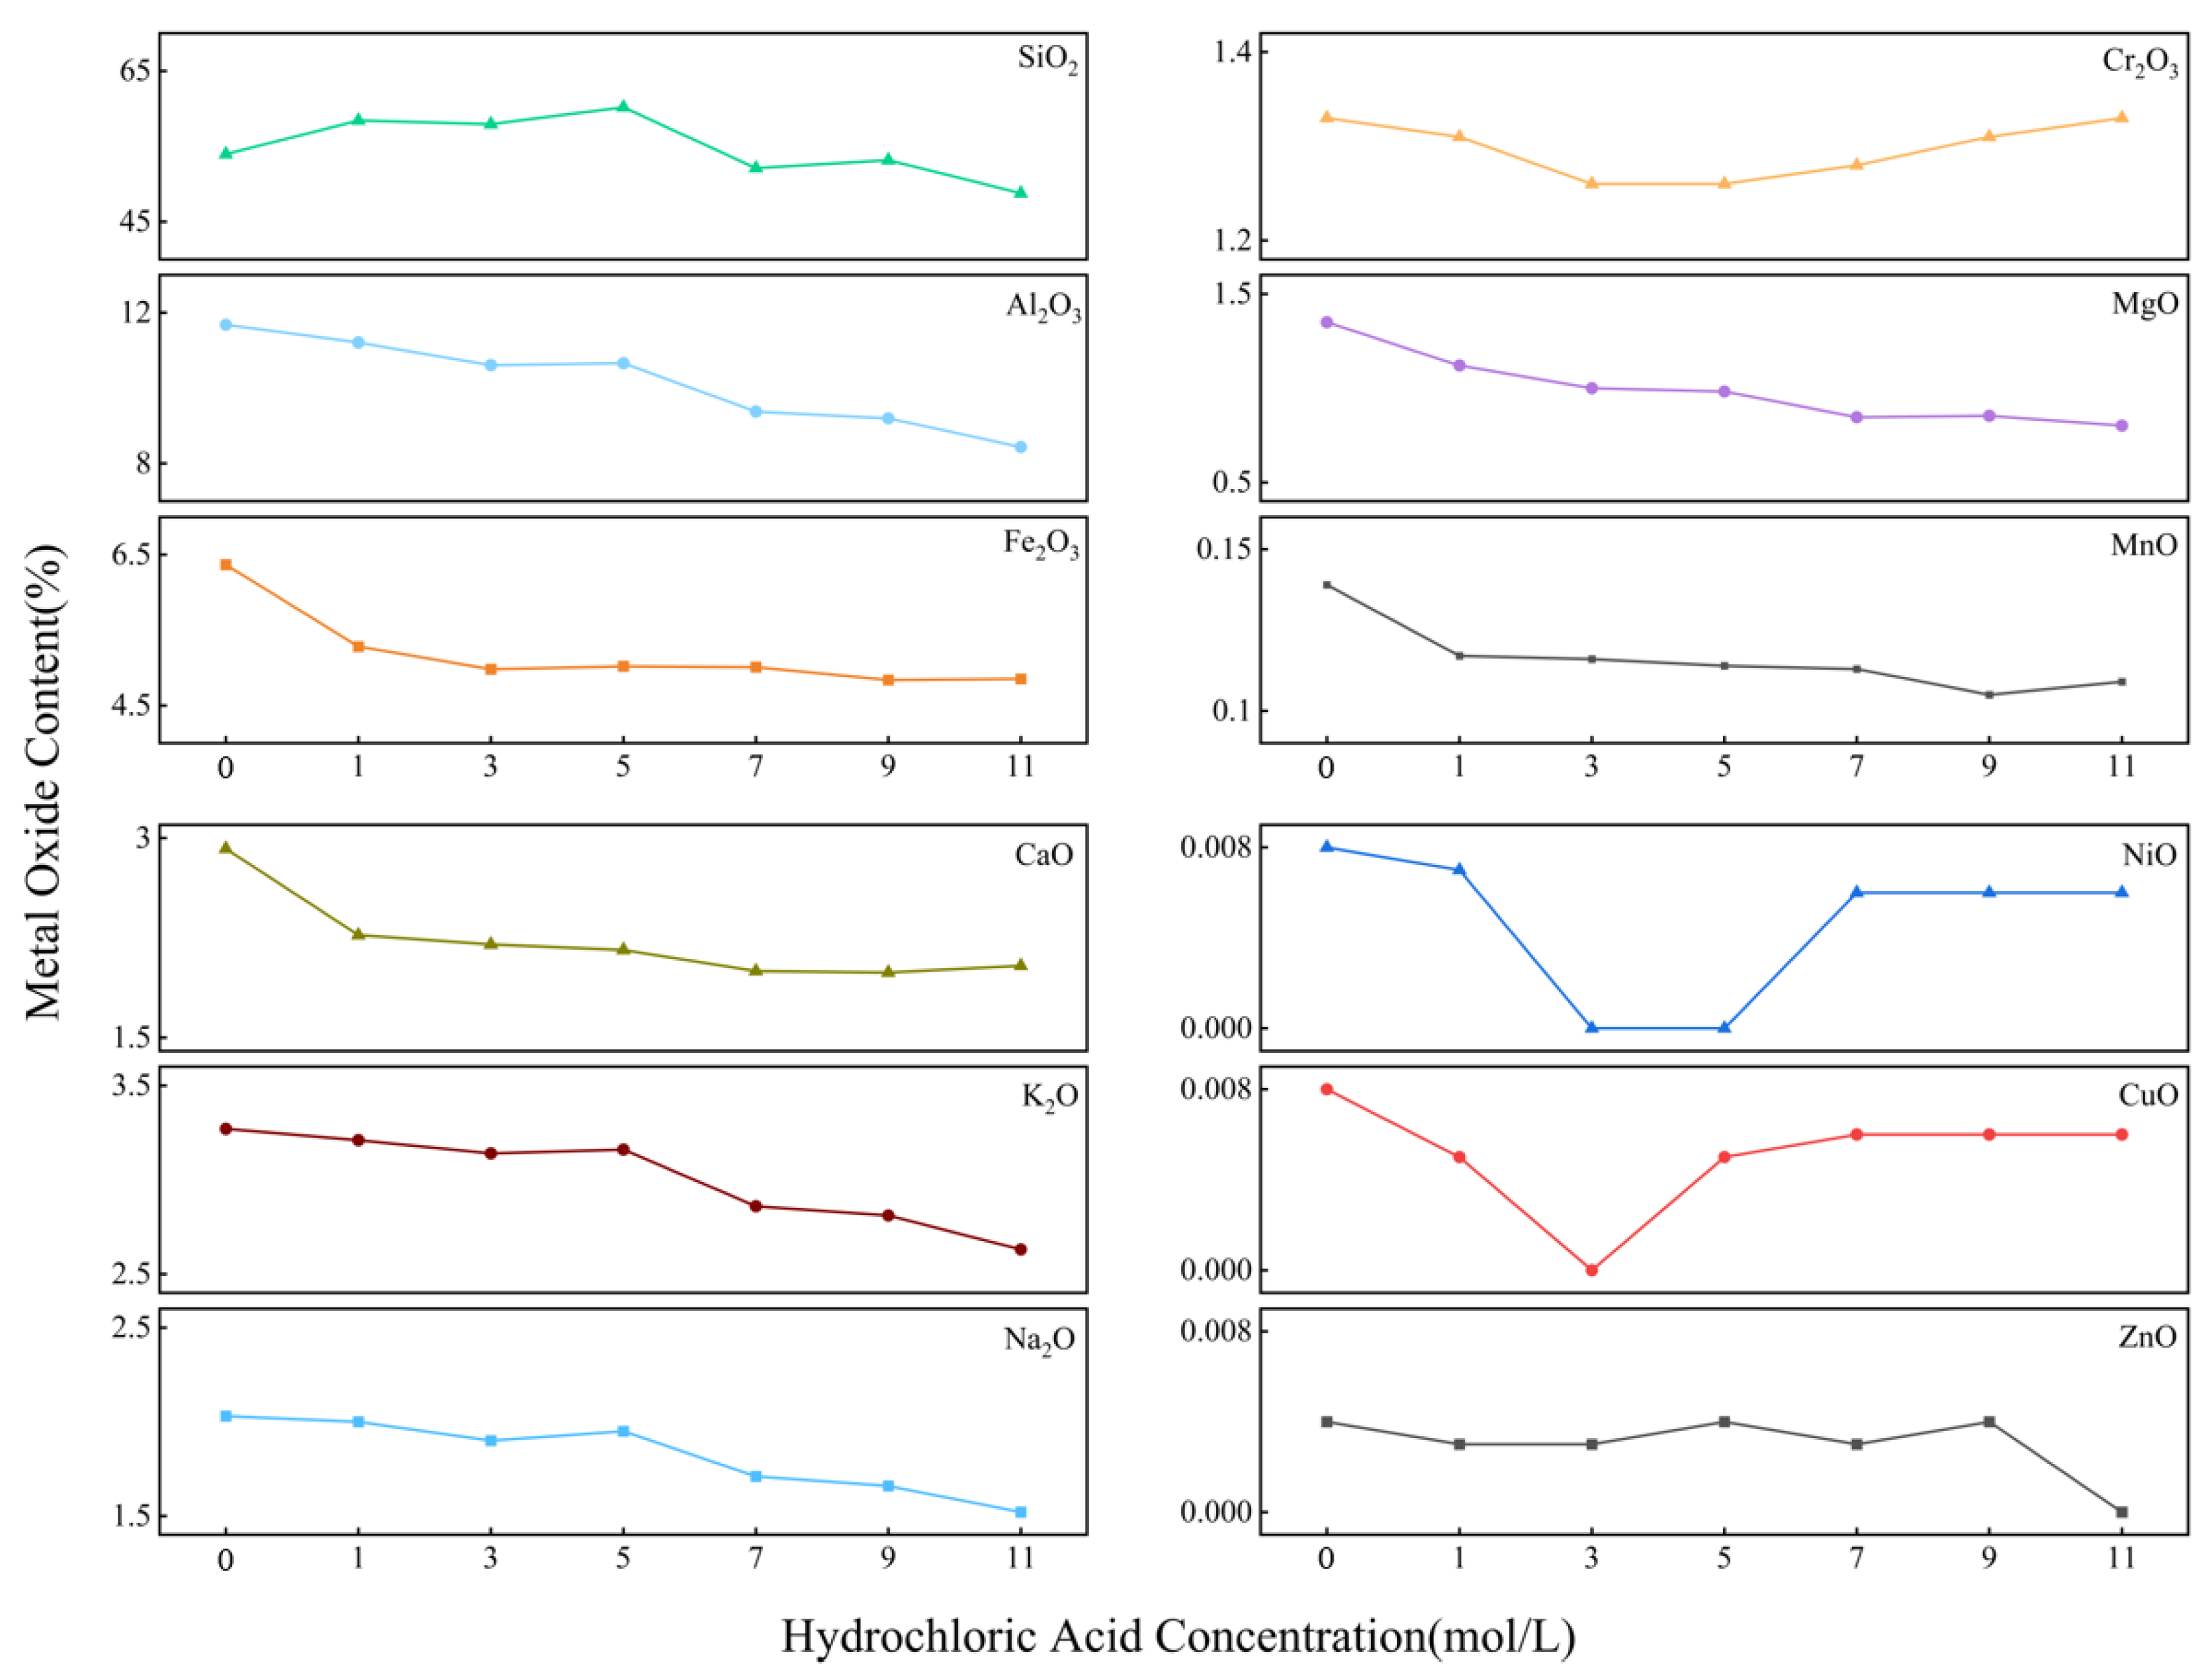
Figure 7.
Content of amorphous silica in bottom slag after treatment with different concentrations of acid (0: unprocessed bottom slag).
Figure 7.
Content of amorphous silica in bottom slag after treatment with different concentrations of acid (0: unprocessed bottom slag).
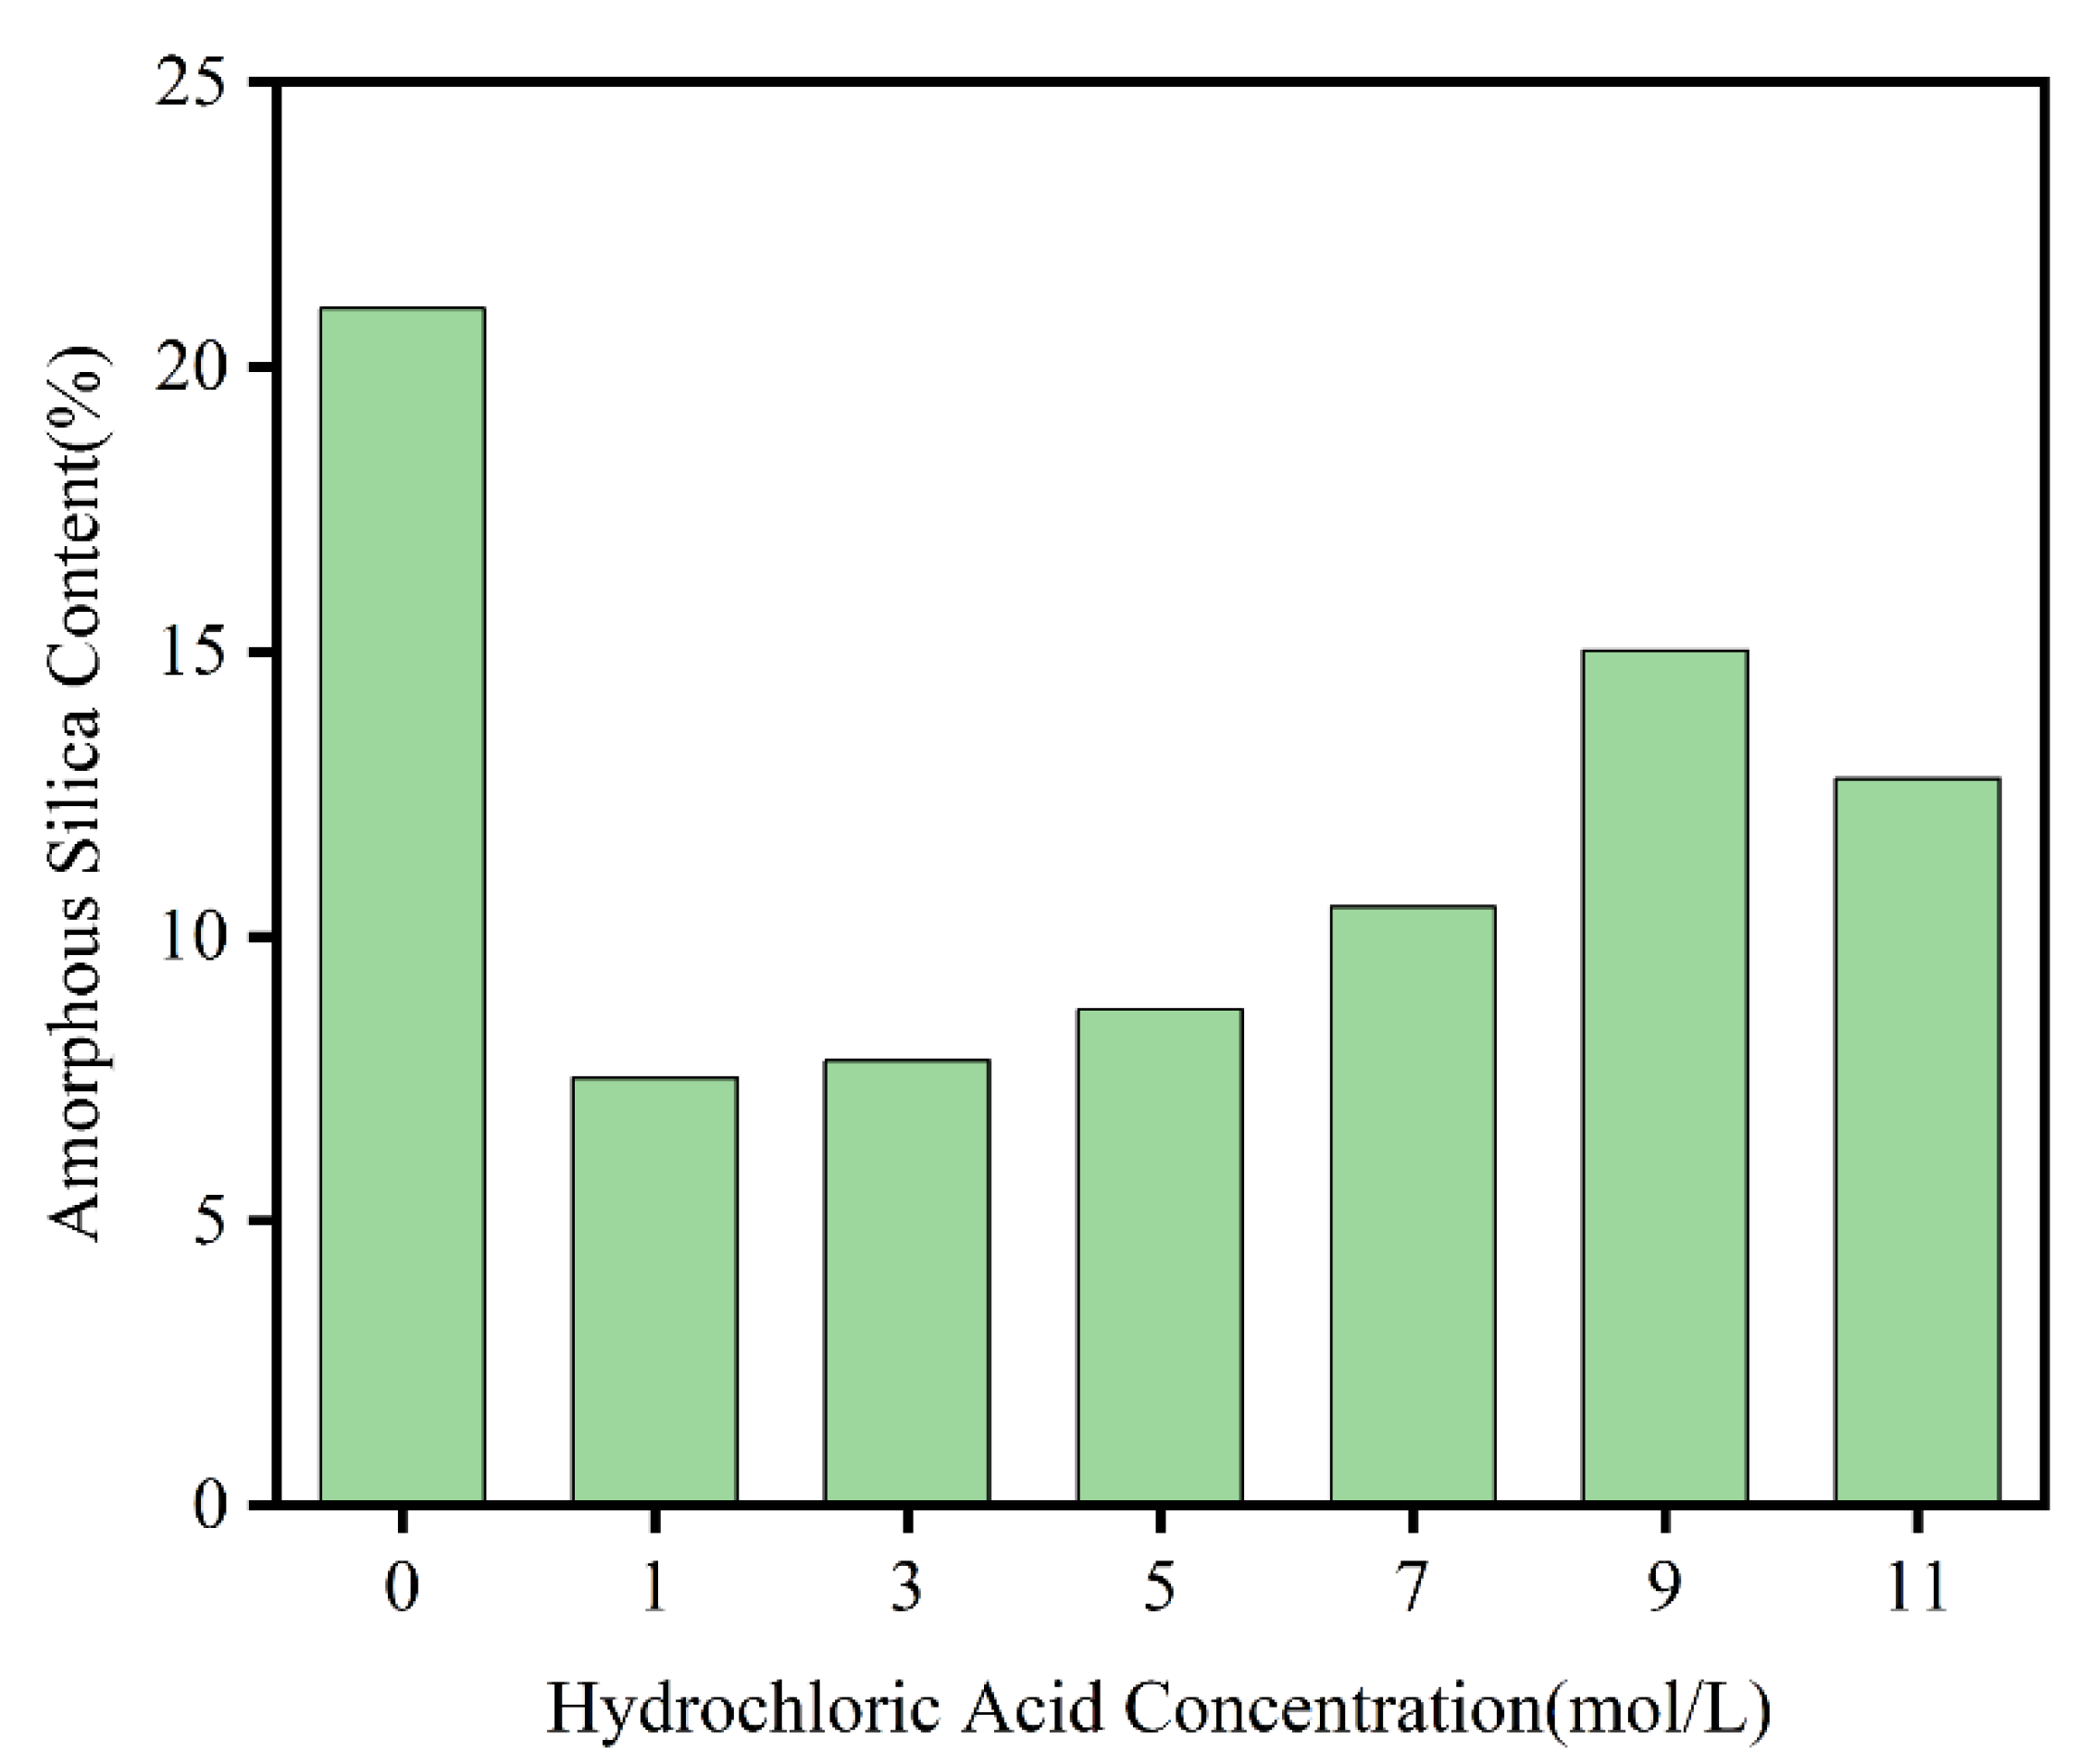
Figure 8.
XRD diffraction patterns of bottom slag before and after alkali fused.
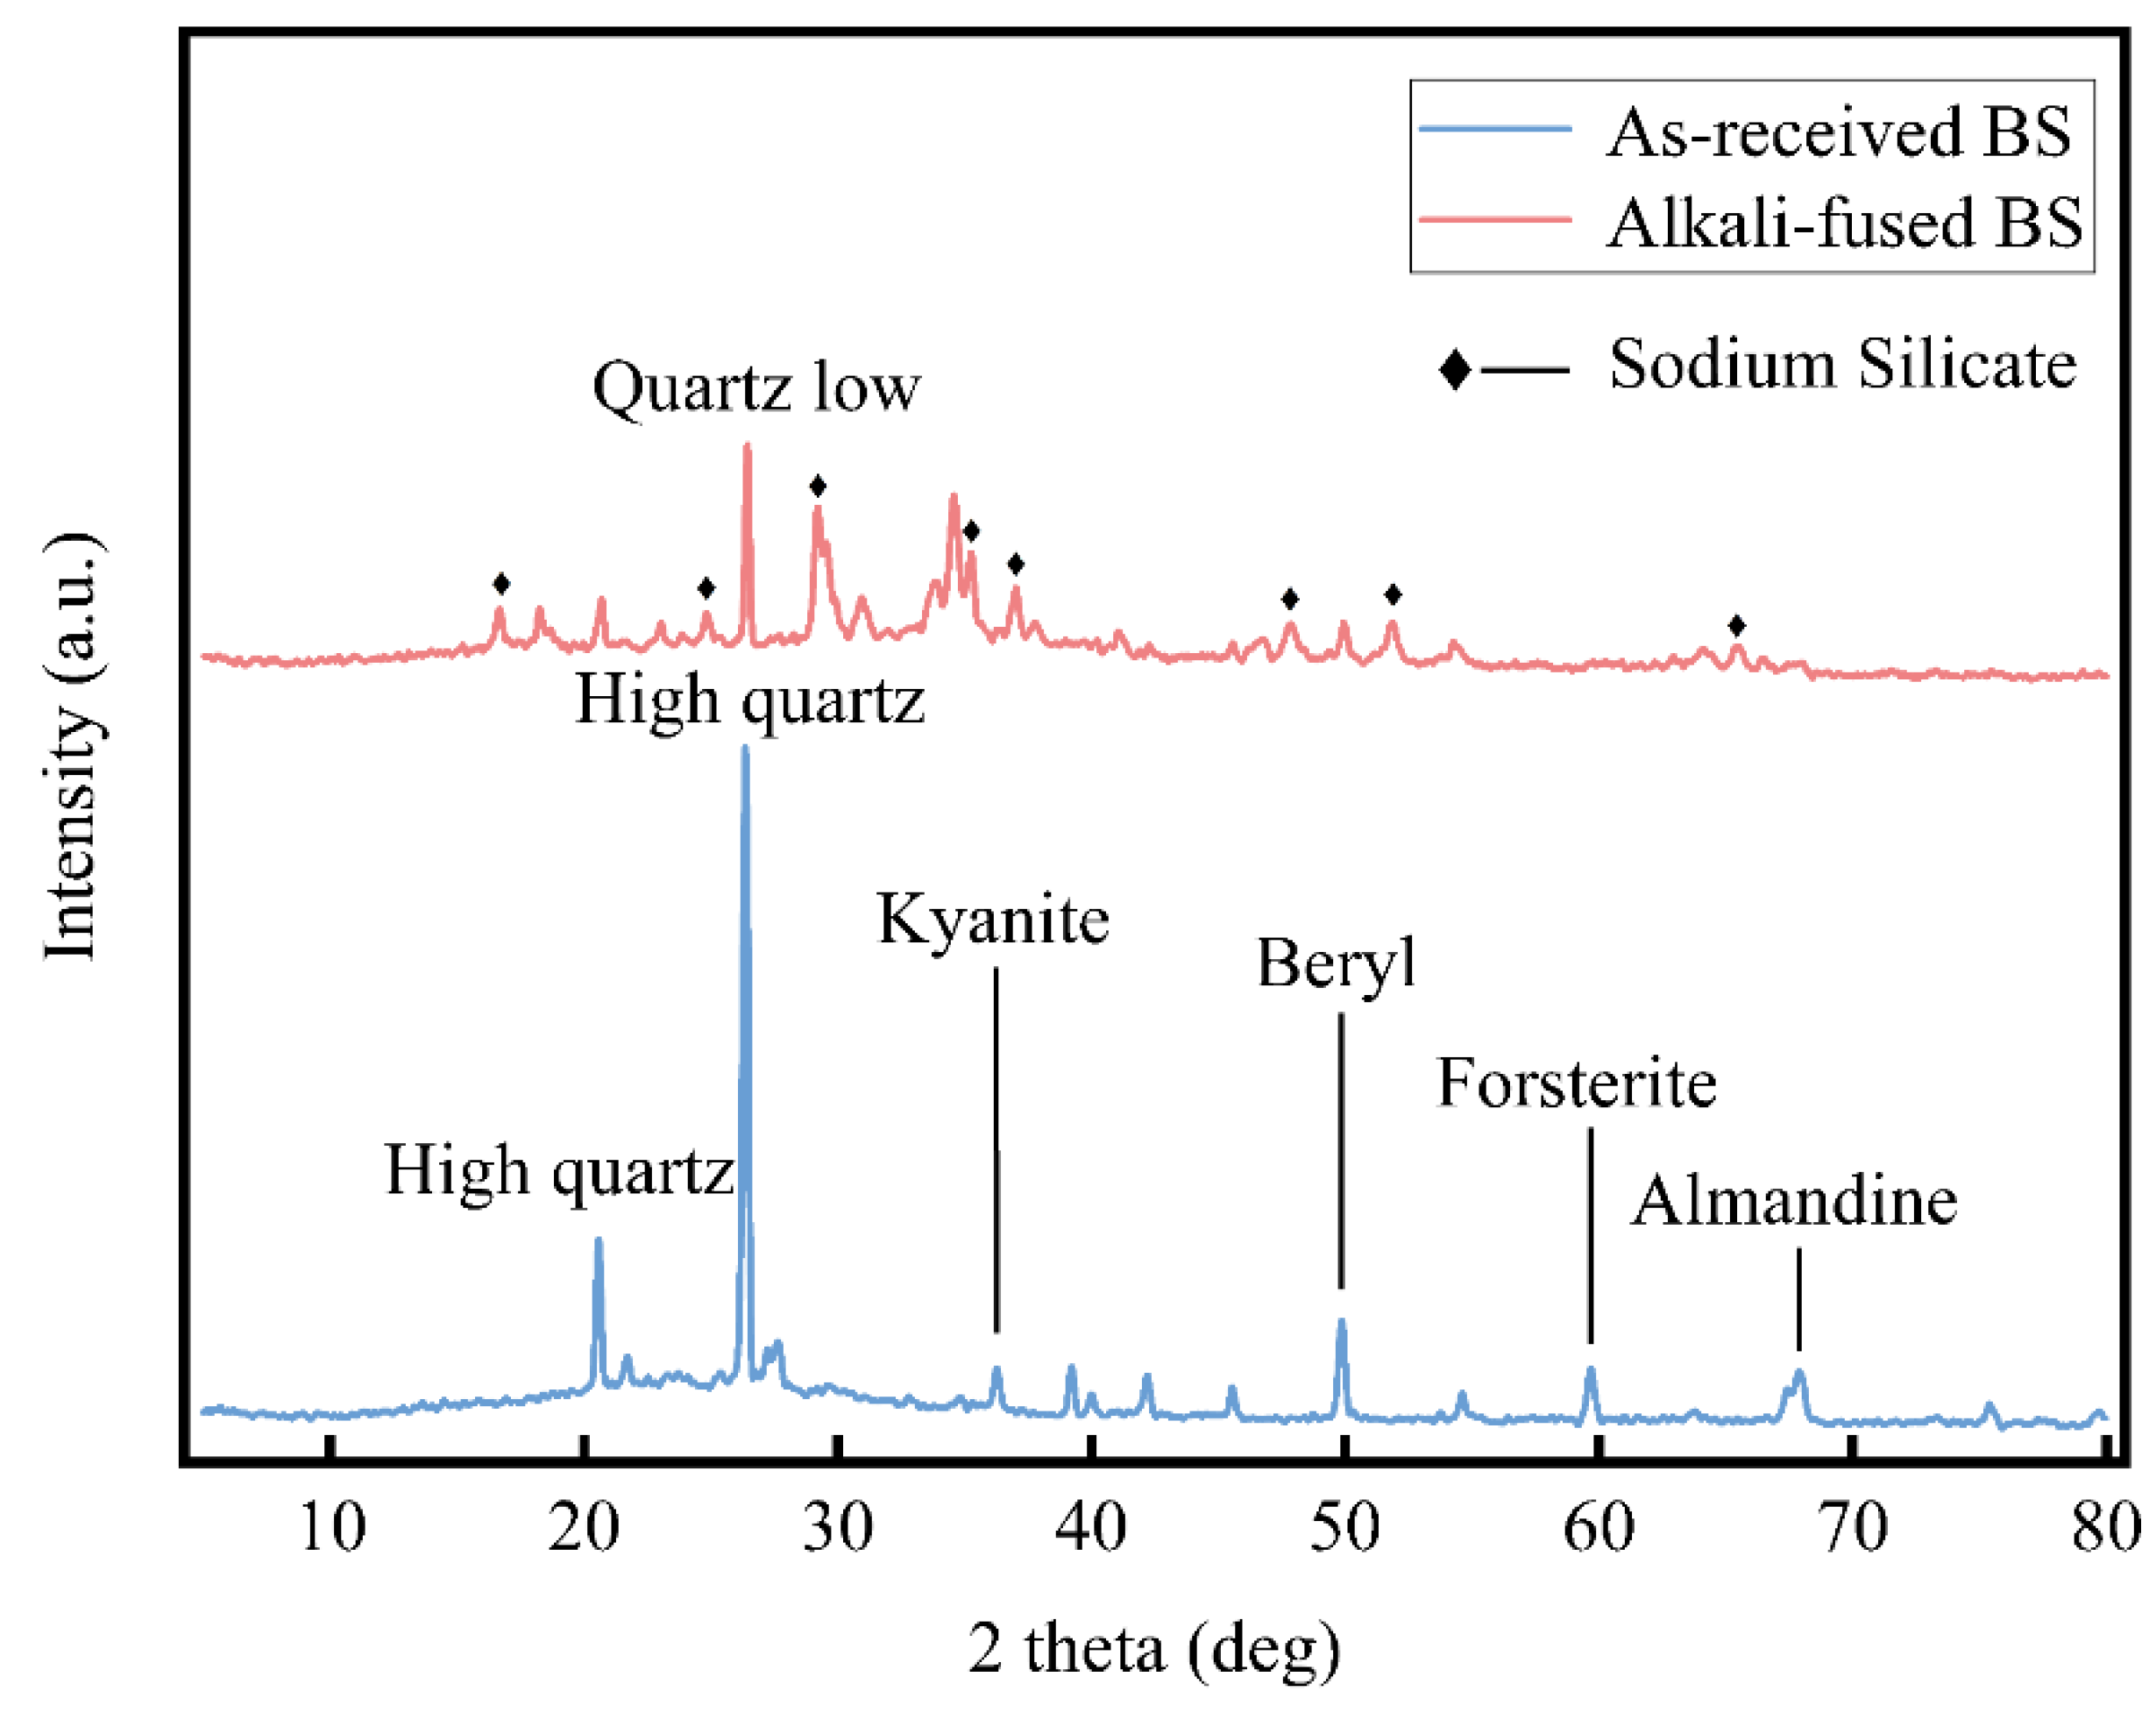
Figure 9.
Effects of different mixing ratio on purity, extraction rate, and amorphous silica content.
Figure 9.
Effects of different mixing ratio on purity, extraction rate, and amorphous silica content.
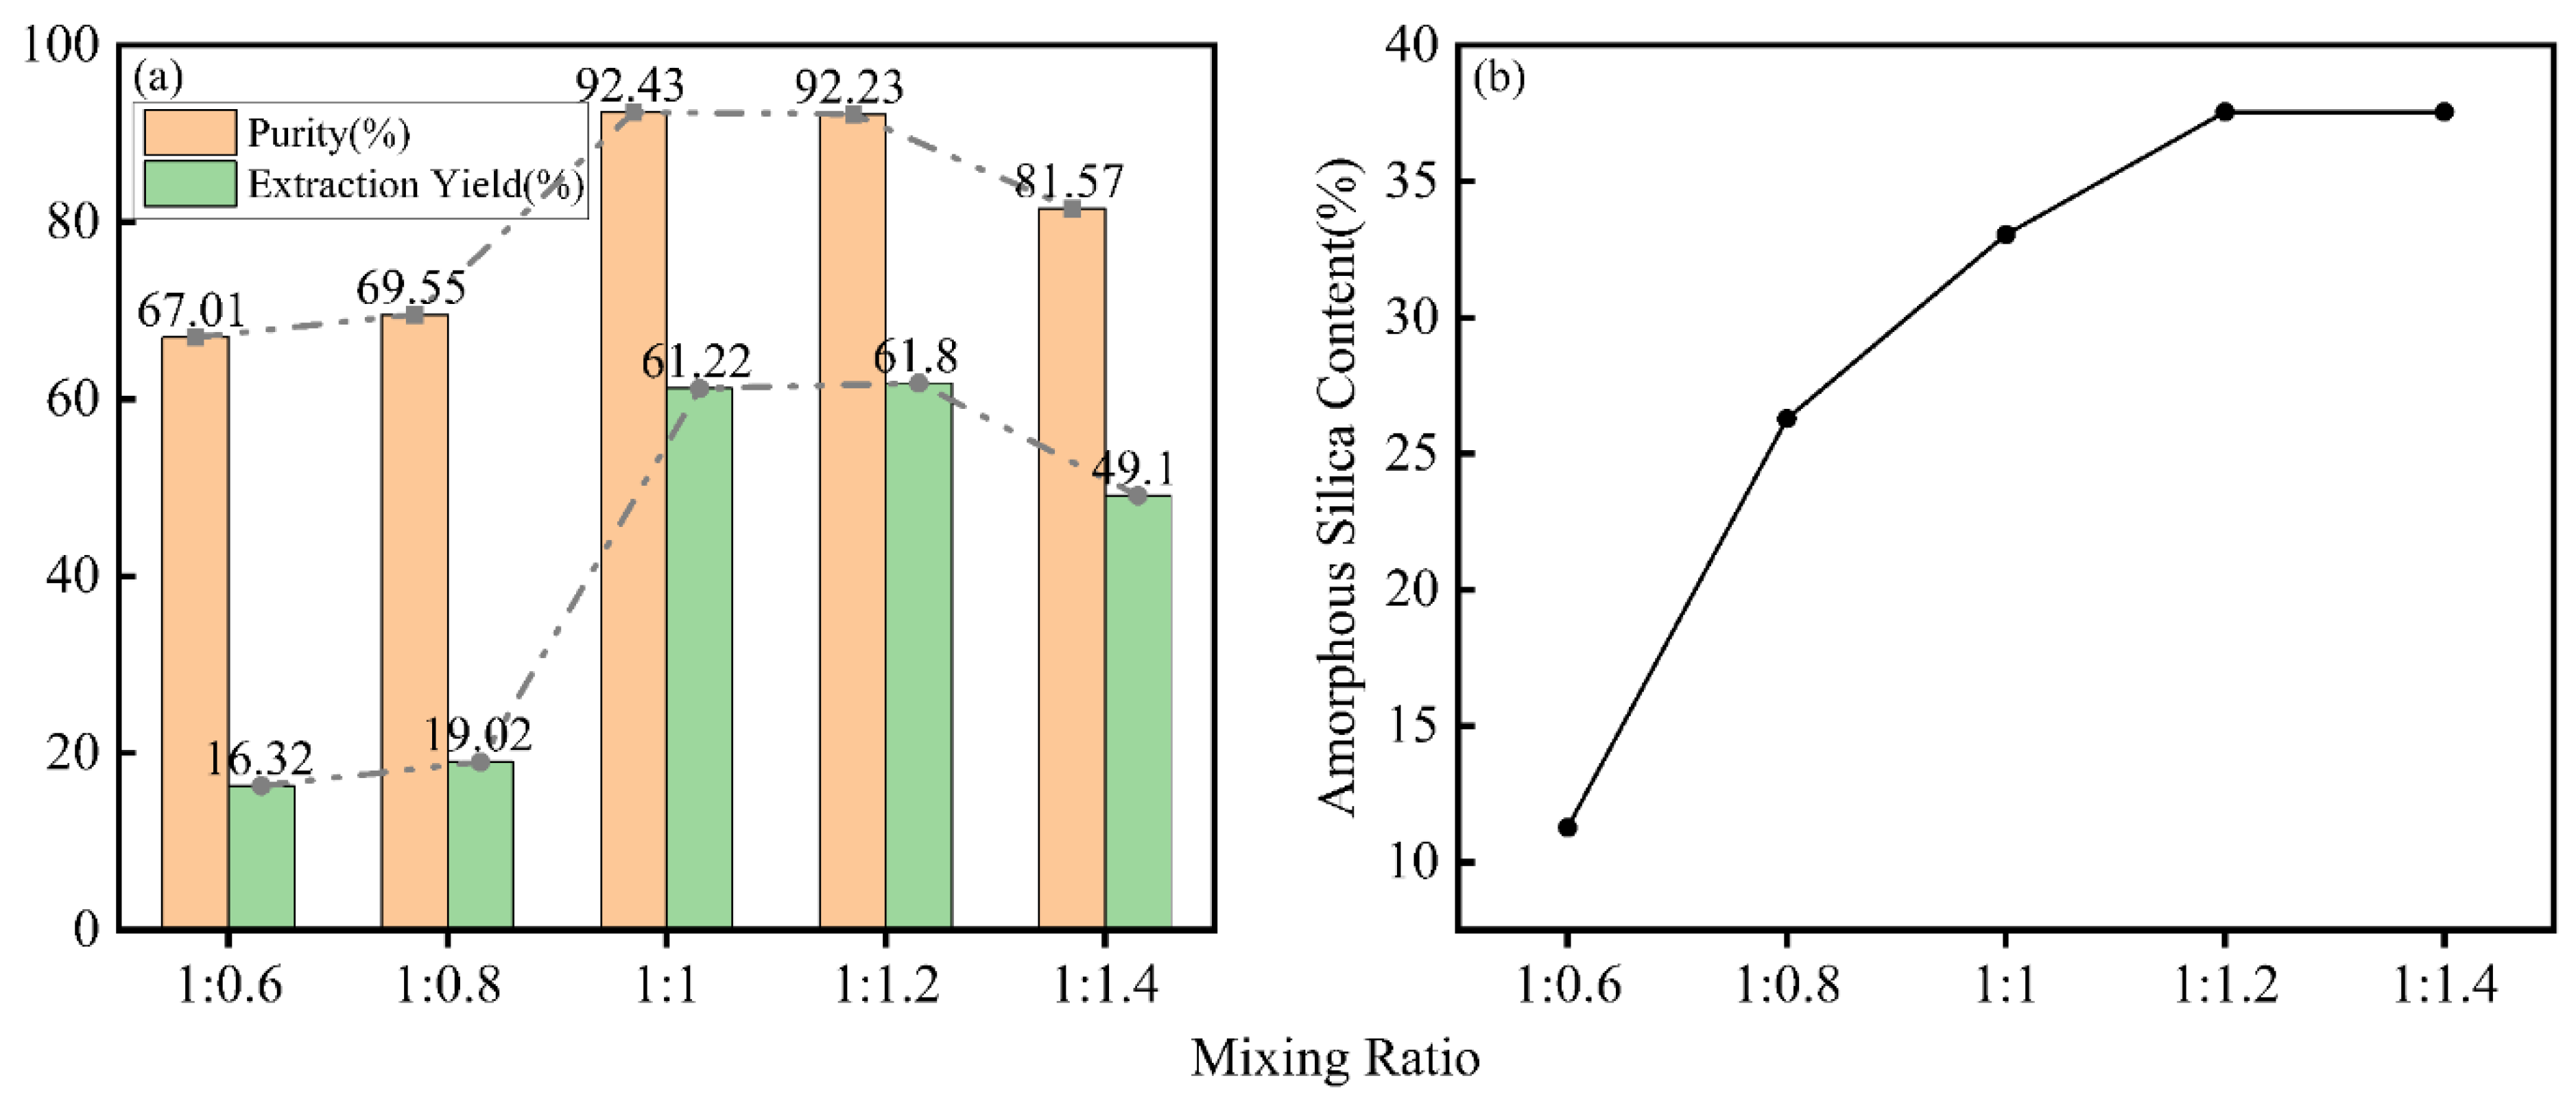
Figure 10.
Effects of ripening time on extraction rate and oil absorption value.
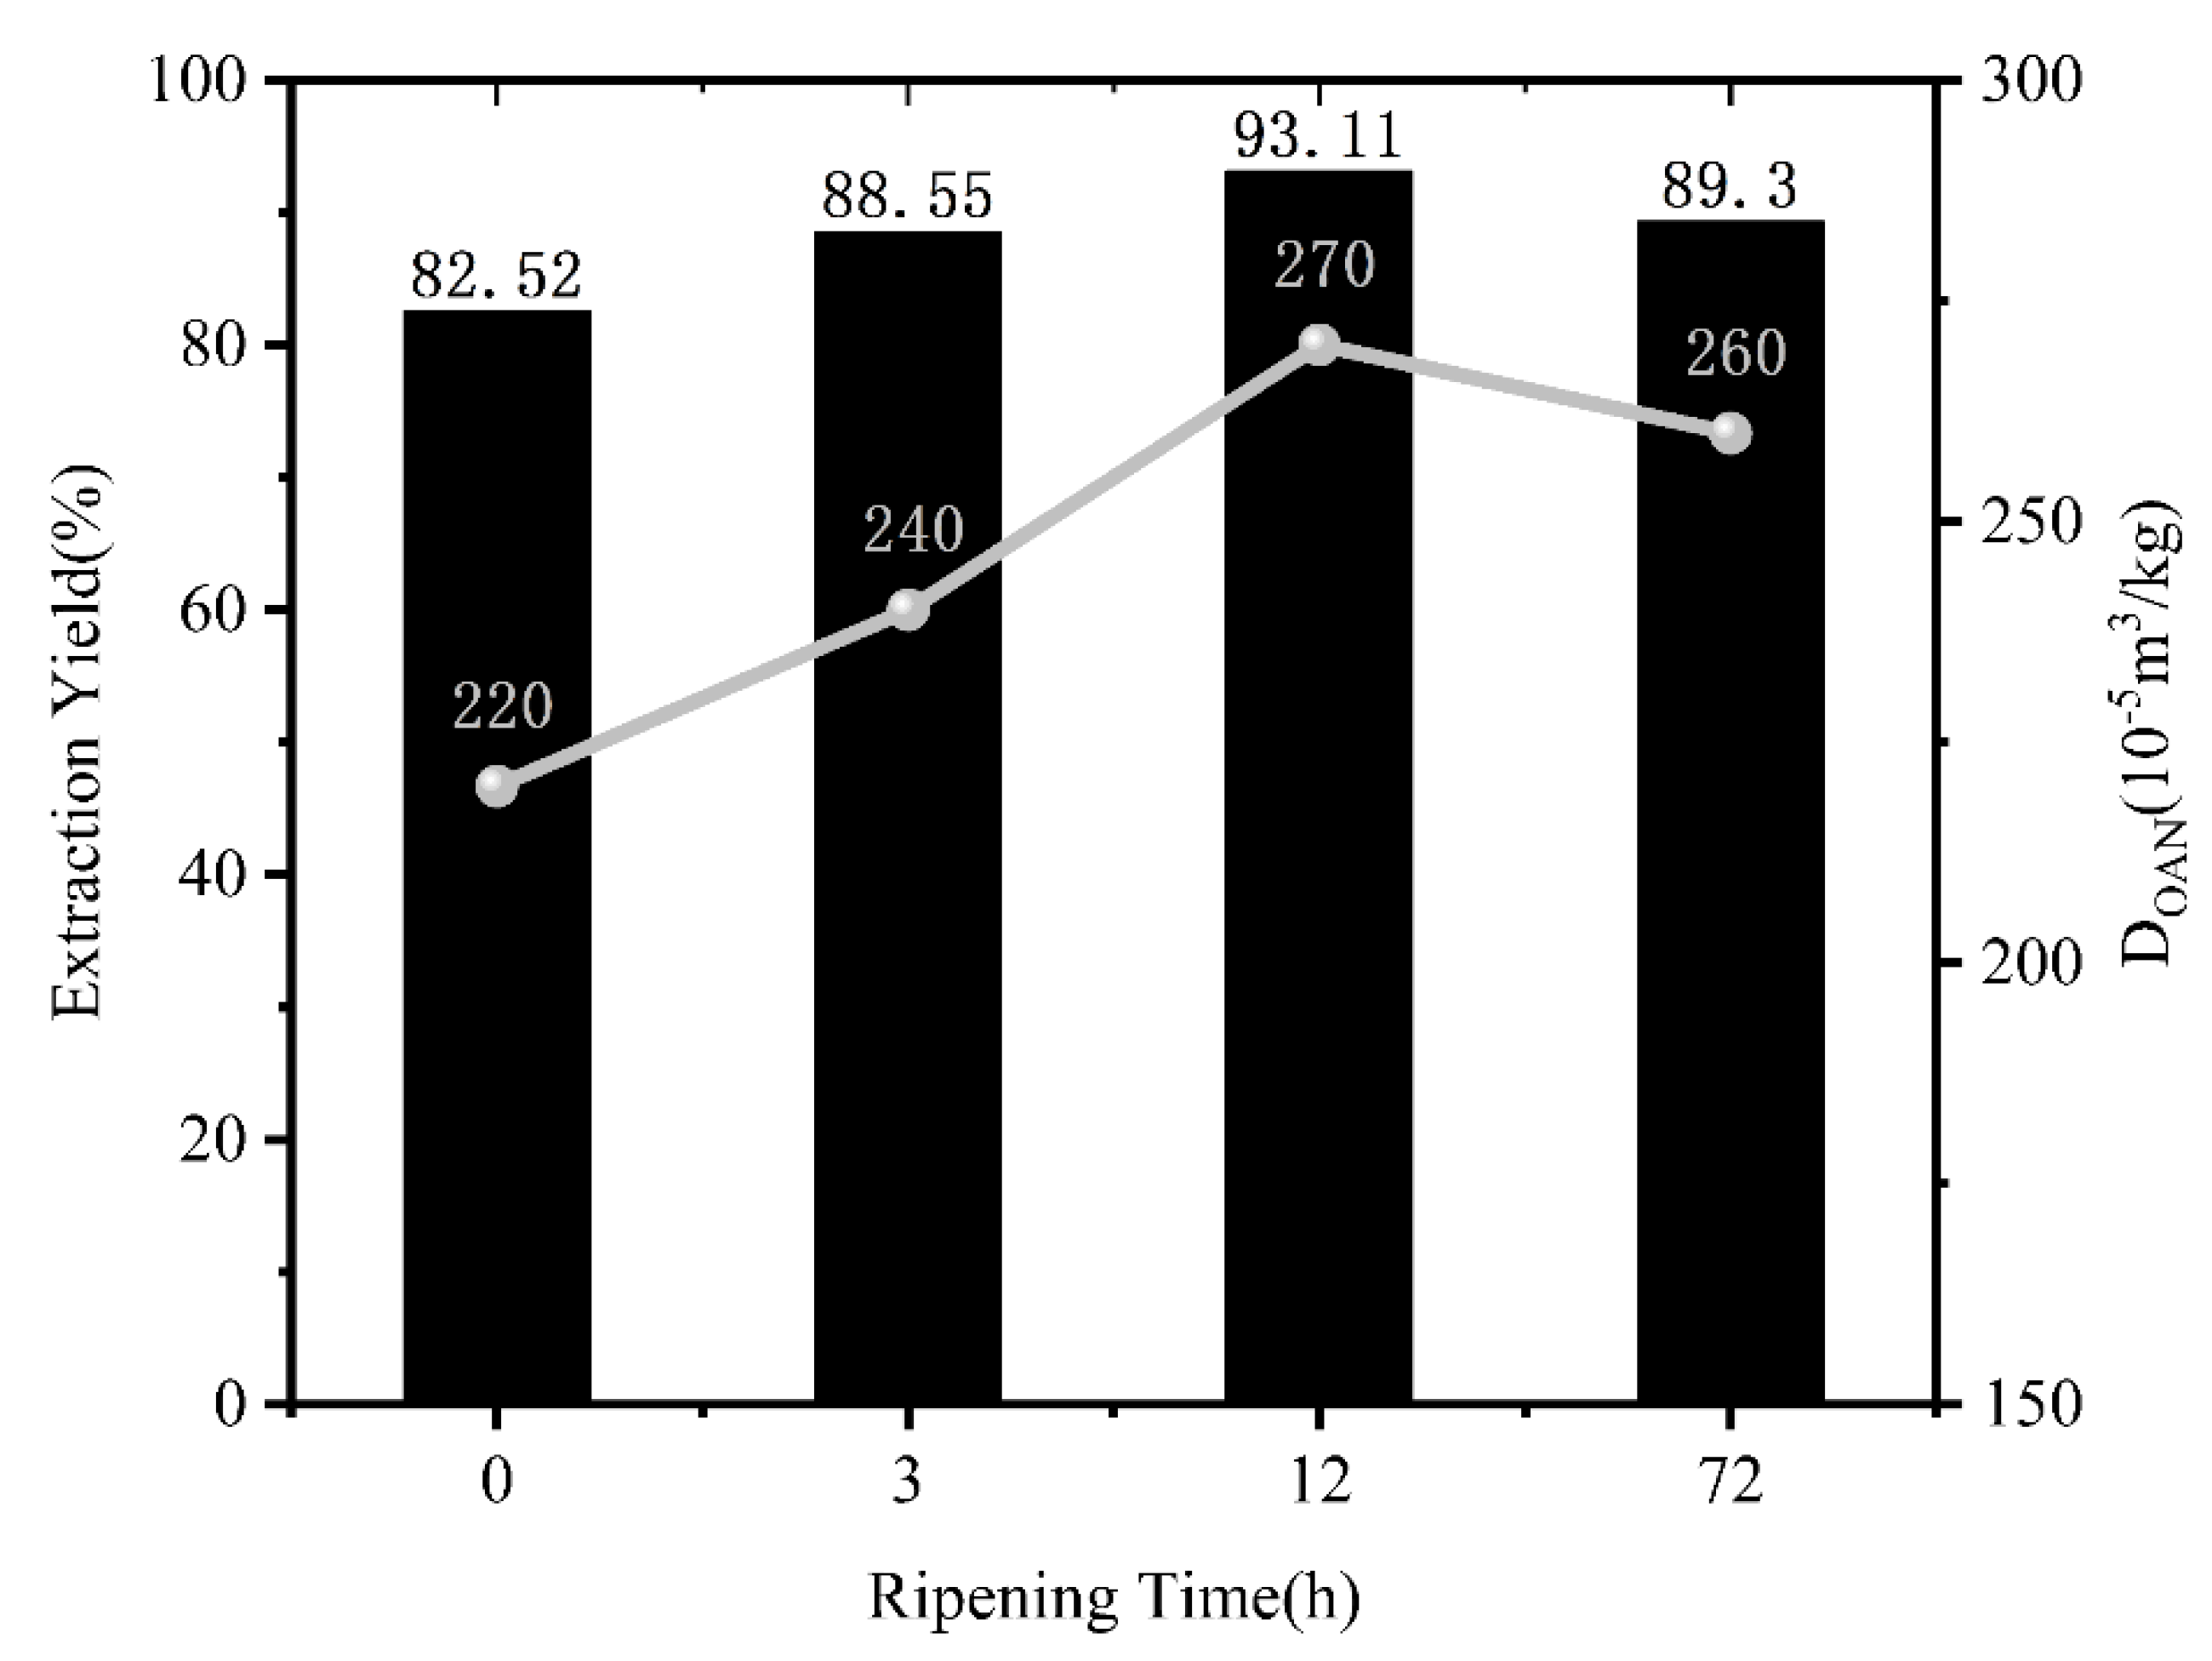
Figure 11.
X-ray diffraction pattern and nitrogen adsorption-desorption isotherm curves, along with desorption pore volume curve of nano-silica.
Figure 11.
X-ray diffraction pattern and nitrogen adsorption-desorption isotherm curves, along with desorption pore volume curve of nano-silica.
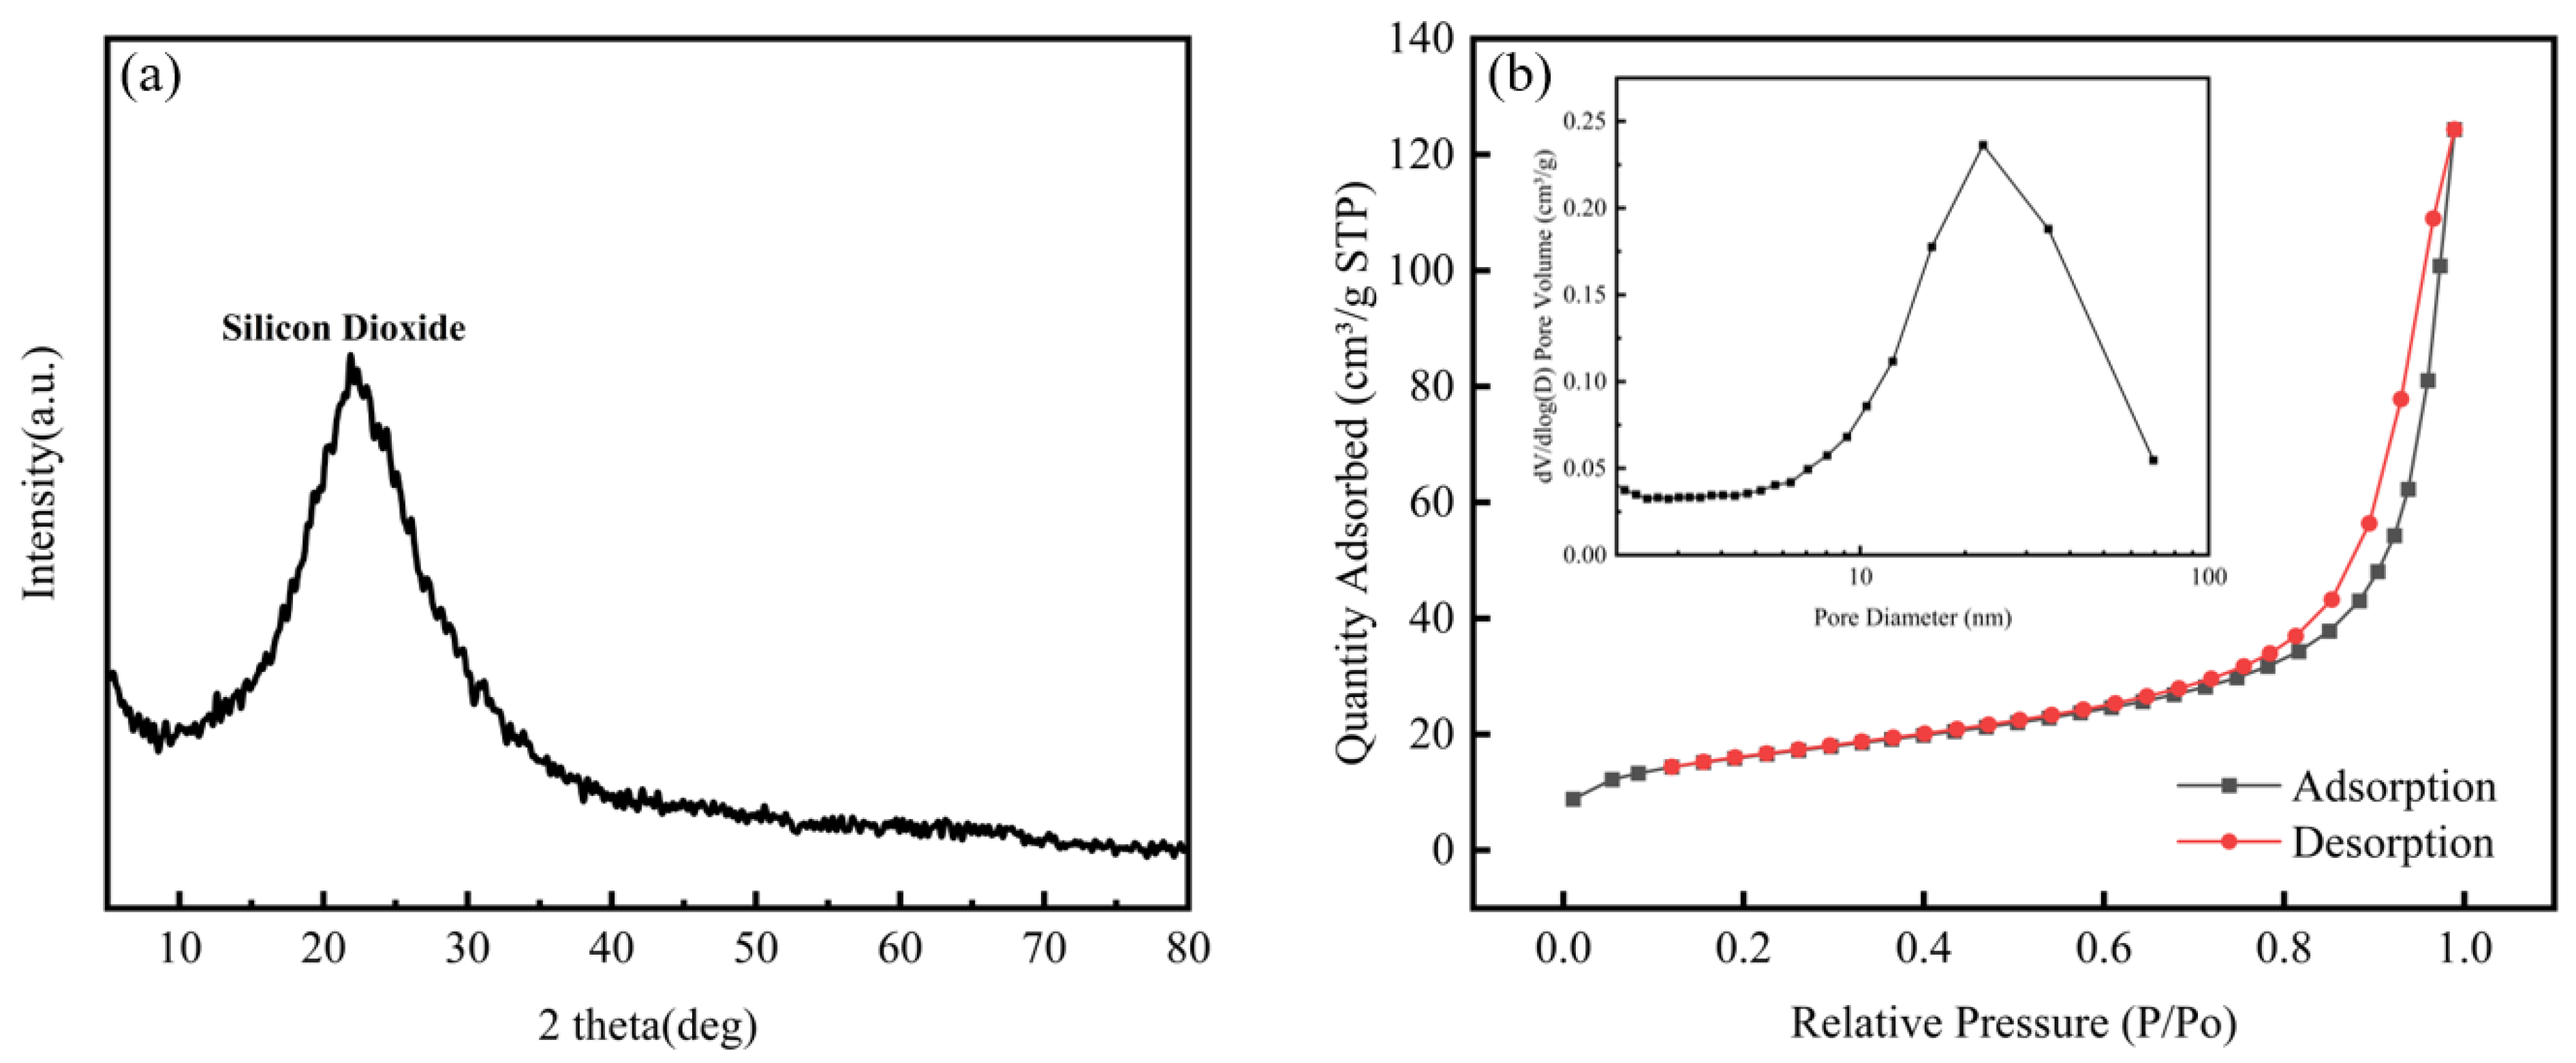
Figure 12.
TEM and SEM images of nano-silica.
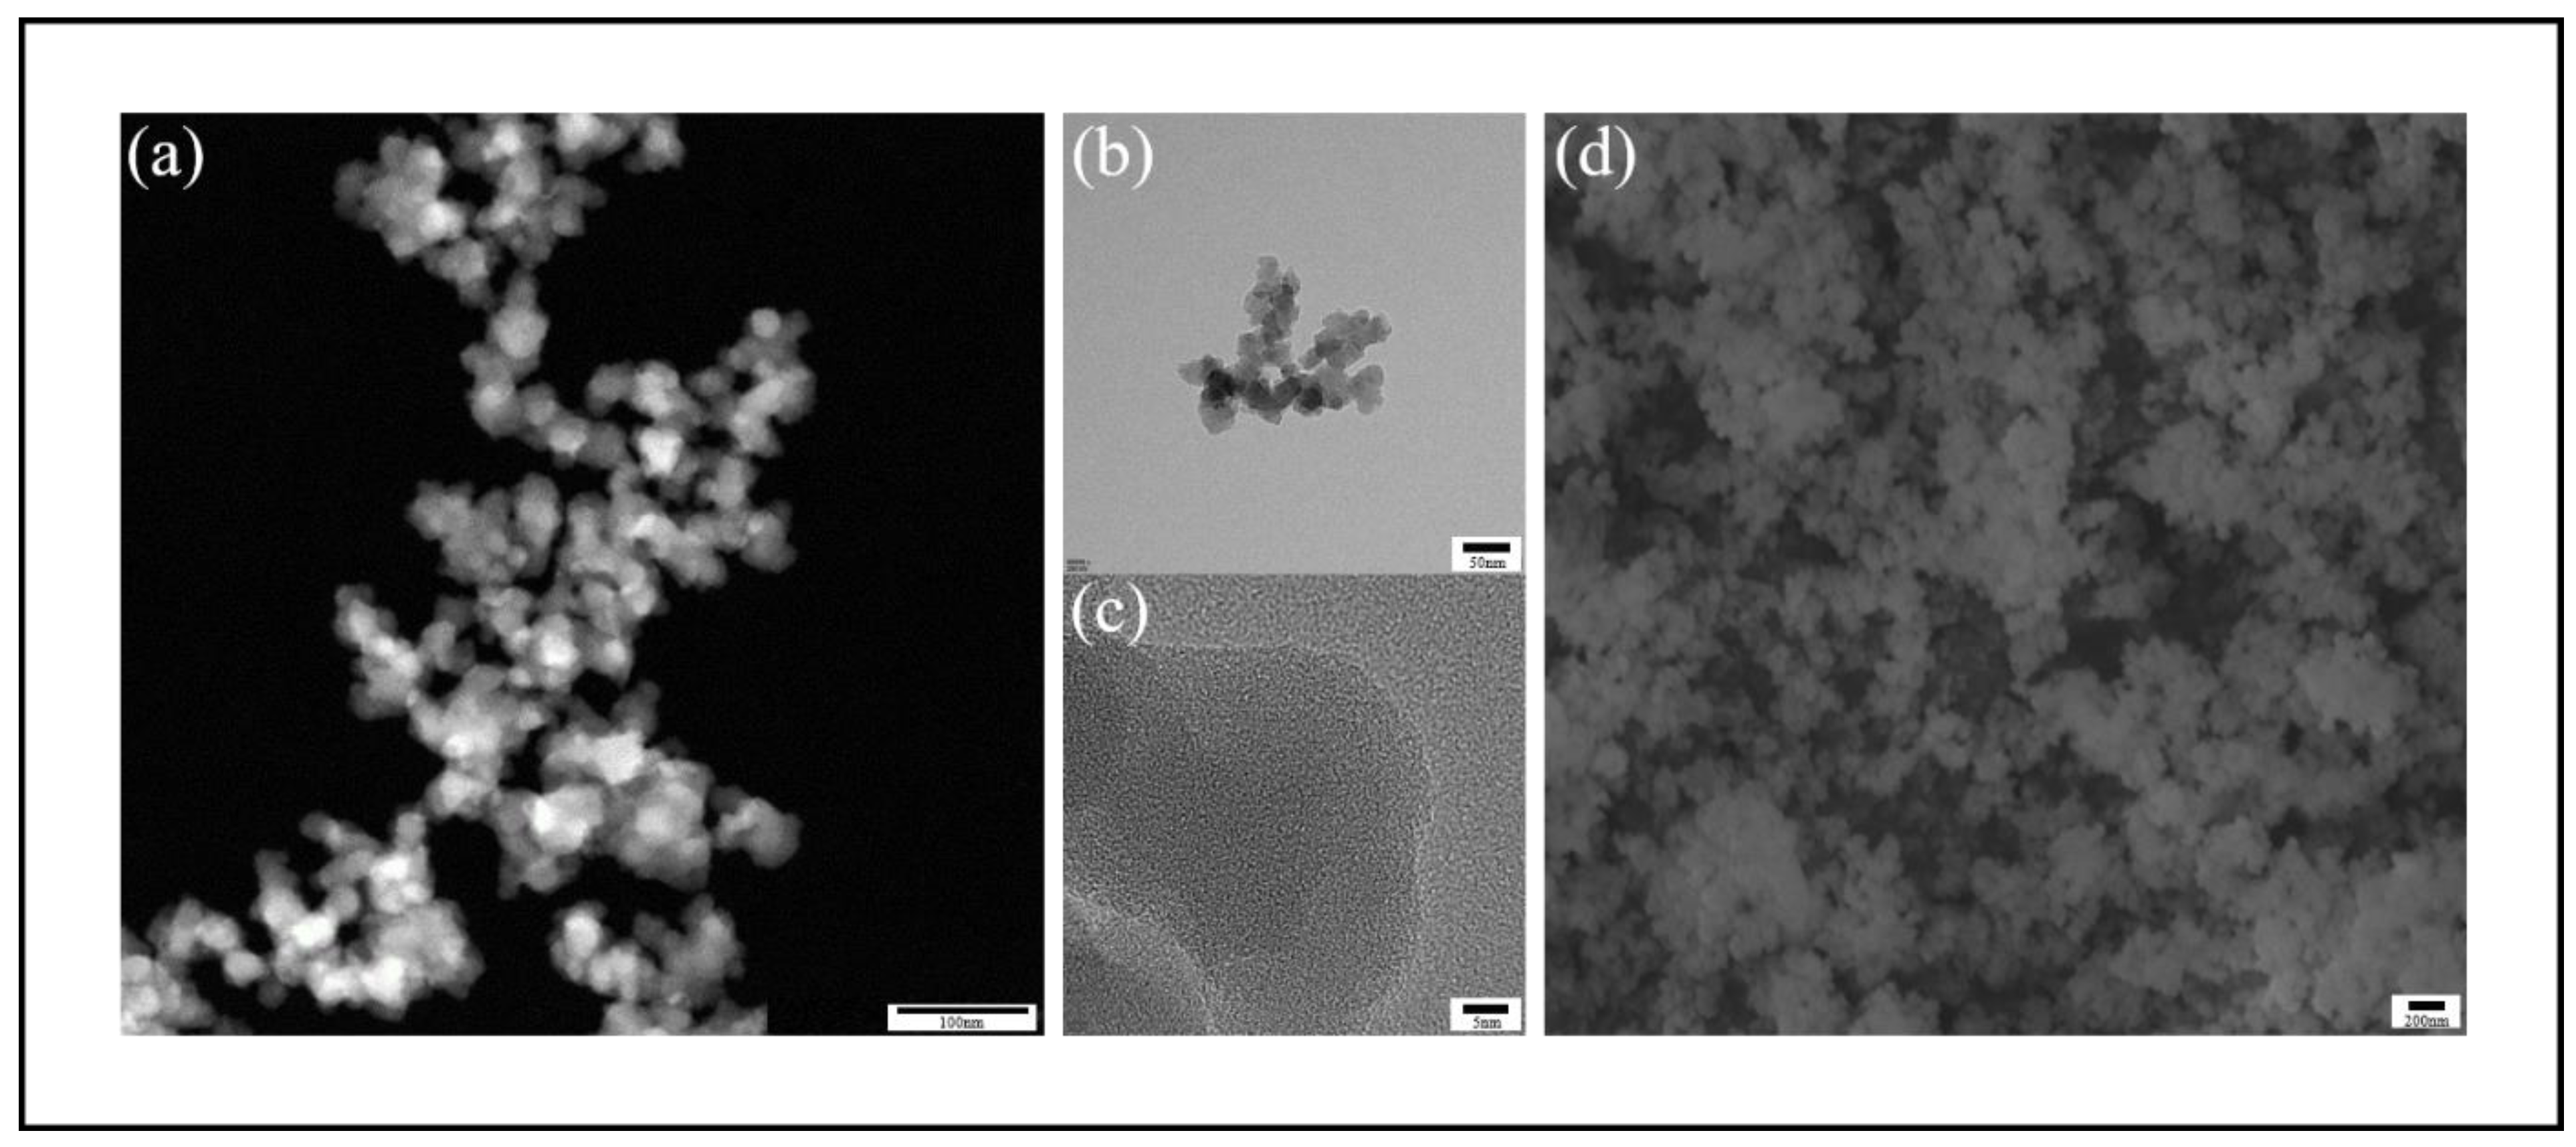

Table 1.
Metal oxide concentrations in bottom slag (BS) by X-ray fluorescence analysis.
| SiO2 | CaO | Na2O | K2O | Fe2O3 | Al2O3 | P2O5 | MgO | Cr2O3 | ZnO | MnO | CuO |
| 53.96 | 2.92 | 2.03 | 3.27 | 6.369 | 11.68 | 0.333 | 1.35 | 1.33 | 0.004 | 0.139 | 0.008 |
All data in the table are in %.
Table 2.
Elemental analysis and industrial analysis results of bottom slag (BS).
| N | C | H | S | O | Mad | Aad | Vad | FCad |
| 0.19 | 1.15 | 0.01 | 0 | 0.13 | 0.38 | 98.15 | 1.25 | 0.22 |
All data in the table are in %.
Table 3.
Extraction yield and composion of nano-silica obtained from different solvents.
| Mixed Solvent | Extraction Yield (%) | SiO2(%) | Na2O(%) |
| Deionized Water | 65.09 | 86.92 | 4.06 |
| 1M NaOH | 64.27 | 87.53 | 4.87 |
| 3M NaOH | 95.24 | 92.73 | 5.62 |
Table 4.
Parameters of Nano-Silica.
| No. | Item | Parameter |
| 1 | Silicon dioxide content % | 92.73 |
| 2 | Extraction yield % | 93.11 |
| 3 | LOD % | 6.38 |
| 4 | LOI % | 6.69 |
| 5 | Cu mg/kg | 30 |
| 6 | Fe mg/kg | 165 |
| 7 | Mn mg/kg | 39 |
| 8 | DBP oil absorption value 10-5m3/kg | 270 |
| 9 | Specific surface area m2/g | 55.99 |
| 10 | Average pore size nm | 16.27 |
| 11 | Particle size nm | 10~50 |
Table 5.
Comparison table of silica obtained in this study with other silica parameters (Ps: particle size Sa: surface area Pd: DBP).
Table 5.
Comparison table of silica obtained in this study with other silica parameters (Ps: particle size Sa: surface area Pd: DBP).
| Silicon source | SiO2 content (%) |
Overall process efficiency(%) | Properties | Reference |
| The calcined ash from rice husk humus | - | 88 | Ps:55nm | [21] |
| Corncob | - | 47 | Ps:40-70nm | [20] |
| Rice husk calcined ash at 700 °C | 96.44 | - | Sa:400.96m2/g | [23] |
| Biomass power plant straw ash | 92-99 | 68.01 | Ps:>100nm Pd:320m3/kg | [14] |
| Mixed ash from straw and rice husk at a biomass power plant | 44.41-93.63 | 20.45 | Ps:20-40nm Sa:24-115m2/g | [19] |
| Straw ash from biomass power plant | 92-97 | - | Ps:29-32nm Sa:54.6-58.1m2/g Pd:260-320m3/kg | [2] |
| Bagasse ash | 99 | - | Sa:265m2/g | [28] |
| Acid-leached coal ash residue | 92.34 | - | Ps:20nm Sa:480.36 m2/g Pd:245m3/kg | [29] |
| Acid-leached coal ash residue | 91.88 | - | Ps:20-40nm Sa:250 m2/g Pd:310m3/kg | [25] |
| Directly combusted corn stalk ash from a biomass power plant | 92.73 | 93.11 | Ps:10-50nm Sa:55.99 m2/g Pd:270m3/kg | This study |
Disclaimer/Publisher’s Note: The statements, opinions and data contained in all publications are solely those of the individual author(s) and contributor(s) and not of MDPI and/or the editor(s). MDPI and/or the editor(s) disclaim responsibility for any injury to people or property resulting from any ideas, methods, instructions or products referred to in the content. |
© 2025 by the authors. Licensee MDPI, Basel, Switzerland. This article is an open access article distributed under the terms and conditions of the Creative Commons Attribution (CC BY) license (http://creativecommons.org/licenses/by/4.0/).
Copyright: This open access article is published under a Creative Commons CC BY 4.0 license, which permit the free download, distribution, and reuse, provided that the author and preprint are cited in any reuse.


