
Submitted:
14 October 2024
Posted:
15 October 2024
You are already at the latest version
Abstract
This study analyzes the elemental and oxide compositions of three selected agricultural residues—Dried Pawpaw Leaves (DPL), Kolanut Pod (KNP), and Sweet Orange Peel (SOP)—for their potential as heterogeneous catalysts. Energy Dispersive X-ray (EDX) analysis identified calcium (25%) and potassium (29%) as the primary elements in DPL and KNP, with calcium oxide (CaO) and potassium oxide (K2O) as the dominant oxides. SOP had a similar composition but lacked vanadium. Calcined residues were analyzed at temperatures ranging from 500°C to 900°C using X-ray Fluorescence (XRF), revealing stable silicon dioxide (SiO2) content and temperature-dependent variations in CaO and K2O, indicating their catalytic potential for transesterification processes. Scanning Electron Microscopy (SEM) showed non-uniform, spongy microstructures, enhancing the surface area and catalytic efficiency. Fourier Transform Infrared Spectroscopy (FTIR) identified functional groups essential for catalytic activity, such as hydroxyls, methyl, and carboxyl. X-ray Diffraction (XRD) confirmed the presence of crystalline phases like calcium carbonate and calcium oxide, crucial for catalytic performance. Experimental biodiesel production using a mixture of the calcined residues (33.33% each of KNPA, SOPA, and DPLA) resulted in the highest biodiesel yield at 65.3%. Model summary statistics, including R² (0.9824) values and standard deviations (0.0026), validated the experimental design, indicating high precision and prediction accuracy. These results suggest that the selected agricultural residues, when calcined and mixed properly, can serve as effective heterogeneous catalysts, with significant implications for biodiesel production, supporting previous research on the importance of calcium in catalytic processes.
Keywords:
Agricultural Residue
; Biodiesel
; Kola Nut Pod
; Sweet Orange Peel
; Pawpaw Dried Leaves
; Waste Frying Oil
1. Introduction
Energy is a key driver of economic development in any nation, impacting various sectors such as agriculture, industries, and transportation. The global energy demand has increased significantly, growing by 2.9% from 2017 to 2018, twice the 1.5% recorded in the previous decade [1]. This heightened demand is closely linked to the world's population growth [1,2,3,4].
Fossil fuels, the primary global energy source, have raised environmental concerns due to associated issues like carbon emissions and Greenhouse gases (GHGs), leading to climate change and adverse effects on human health [4,5]. Climate change exacerbates challenges in agriculture, contributing to risks like desertification, rising temperatures, changing rainfall patterns, and sea-level rise [6,7]. To address these challenges, diverse energy sources are imperative [8,9]. Example of alternatve energy sources are biogas [10,11], solid biofules obtained through densification, torrefaction and by extension pyrolysis [12,13].
Bioenergy researchers advocate for biodiesel as a viable alternative to fossil fuels, citing its non-toxic, energy-efficient, biodegradable, and environmentally friendly nature [14,15,16]. However, the cost of biodiesel production, mainly attributed to expensive feedstocks like refined vegetable oils, remains a significant hurdle [14,16]. Transesterification, particularly with chemical catalysts like KOH, NaOH, H2SO4, and HCl, is the preferred method for biodiesel production [17]. Despite their efficiency, these chemical catalysts pose challenges in terms of reusability, negative environmental impact, and complex downstream purification steps [18].
Recent research has shifted focus to low-cost feedstocks such as Waste Frying Oil (WFO) and catalysts derived from agricultural residues, contributing to environmental pollution control [1,19]. Bio-based catalysts, being heterogeneous and sourced from natural materials, present advantages in terms of easy recovery and reusability across multiple catalytic cycles [19,20].
This study investigates the potential of a heterogeneous composite catalyst derived from three selected agricultural residues—Dried Pawpaw Leaves (DPL), Kola Nut Pod (KNP), and Sweet Orange Peels (SOP). The aim is to explore alternative, environmentally friendly catalysts for biodiesel production, contributing to sustainable energy practices.
2. Materials and Methods
2.1. Materials Collection and Preparation
The selected agricultural residues are Dried Pawpaw Leaf (DPL), Kola Nut Pod (KNP), and Sweet Orange Peel (SOP). The dried fallen pawpaw leaves were gathered from their parent trees at the Research Farm of the Department of Agricultural and Bio-Environmental Engineering, Federal Polytechnic Ado Ekiti. Manual sorting was conducted to eliminate foreign matter, and the leaves were sun-dried for three days until a constant weight was achieved. Subsequently, they were ground to a granular consistency using a pestle and mortar. The ground sample was sieved to a uniform particle size of 150 µm using a standard sieve with a mechanical shaker. The sieved sample was stored in airtight containers for further analysis. The sample preparation method aligns with that reported by Betiku et al. [21], Oladipo et al. [22], and Oladipo et al. [23].
The KNP was obtained fresh from a farm in Ile Ife (7.49°N 4.55°E), Osun State, Nigeria, due to its abundance in the region. Manual sorting was performed to remove dirt, immature pods, and fresh husks. The fresh pods were cut into pieces, washed with clean tap water, and sun-dried. Further drying was carried out in the oven at 105 °C until a constant weight was achieved to remove moisture content [21]. The oven-dried sample was ground into powder form using a disk mill and sieved into a uniform powder particle size of 150 µm using a standard sieve with a mechanical shaker machine. The sieved sample was stored in airtight containers for further analysis. The sample preparation follows the method reported by Betiku et al. [21], Oladipo et al. [22], and Oladipo et al. [23]. Sweet orange peels, often discarded by fruit vendors, were collected. Manual sorting of dirt and foreign matter from fresh peels was conducted. The peels were washed with clean tap water and sun-dried for three weeks. The sun-dried samples were ground into granules using a pestle and mortar and sieved using a 0.15 mm mesh size. The sieved product was stored in a sealed container for further analysis.
WFO was sourced from local food restaurants. The collected WFO underwent centrifugation and filtration to remove any suspended matter and burned food bits. Subsequently, it was heated at 105 °C for 2 h to eliminate water through evaporation, following the suggestion of Yogeeswara et al. [24]. The oil was stored at room temperature in a closed container for characterization.
Catalyst Preparation
The raw powdered samples were divided into two parts. One part was reserved for further analysis, while the remaining portion of each DPL, KNP, and SOP was calcined at varying temperatures from 500 to 900 ℃ at 100 oC intervals for 4 h per sample in a muffle furnace (Galenkamp). This process aimed to eliminate carbonaceous and volatile matter, obtaining ash products. The resulting calcined ash samples, designated as Calcined Dried Pawpaw Leaf Ash (CDPLA), Calcined Kola Nut Pod Ash (CKNPA), and Calcined Sweet Orange Peel Ash (CSOPA), were placed in a desiccator and then stored in airtight containers to prevent moisture interaction before further usage. Catalyst preparation procedures followed those detailed by Betiku et al. [21], Oladipo et al. [22], and Oloyede et al. [25].
2.2. Catalyst Characterization
Characterizations involved Scanning Electron Microscopy/Energy Dispersive X-ray (SEM/EDX), Fourier Transform Infrared (FTIR), and X-ray diffraction analysis (XRD). These analyses aimed to assess elemental composition, morphology, crystalline structures, and active surface functional groups present in the raw powdered samples and calcined ashes (catalysts). Procedures followed those reported by Betiku et al. [26] and Etim et al. [15].
2.2.1. XRF Analysis
The chemical composition of the raw samples was determined through XRF analysis using a PANalytical England Philips Fluorescence Machine at the National Geological Research Laboratory (NGRL), Barnawa Kaduna, with a 15 kV acceleration voltage and 10 nA beam current.
2.2.2. Scanning Electron Microscopy (SEM) Analysis
SEM-EDX analysis was employed to observe the physical morphology of sample surfaces and analyze the element compositions, including visible light elements such as carbon, nitrogen, and oxygen. The EDX detector, equipped with ultra-thin element light windows detecting elements with atomic numbers greater than four, was utilized to analyze contamination, which may impact content quality [3,27].
2.2.3. Fourier Transform Infrared (FTIR) Analysis
2.2.4. X-ray Diffraction Analysis
X-ray diffraction (XRD) analysis of each catalyst sample was conducted using a Rigaku-binary diffractometer (SmartL Ab, Japan). The Rigaku-binary instrument measured XRD over Cu-Kα2 radiation with a wavelength of 1.5444 Å, a voltage of 45 kV, and a current of 40 mA. The samples underwent scanning at a speed of 5°/min within the 2θ range of 5 – 76° to determine the crystalline structure of the catalyst samples [29].
2.3. Development of the Composite Catalyst
Samples of CDPLA, CKNPA, and CSOPA at 900 °C, 900 °C, and 500 °C, respectively, were selected and combined based on the highest level of alkaline metal oxide to develop a heterogeneous catalyst composite from the three selected residues. The simplex lattice design from Design Expert software (12.0.1) was employed to generate mixing ratios. Component levels of 10% and 80% for low and high levels, respectively, were chosen and input into the software to produce a wide range of mixture levels (Table 1). CDPLA, CKNPA, and CSOPA were mixed at different ratios following the fourteen experimental runs generated by the software.
2.4. Catalytic Testing of the Developed Heterogeneous Composite Catalysts
The effectiveness of the developed heterogeneous composite catalysts was assessed through the transesterification of WFO with ethanol. Laboratory experiments were conducted to produce biodiesel with each of the fourteen mixing ratios generated. The reaction conditions included a 4.5 wt.% catalyst loading, 6:1 ethanol-to-oil molar ratio, 65 ℃ reaction temperature, and 120 mins reaction time, all under constant agitation at 700 rpm. Biodiesel yield served as the response variable [24,30].
The transesterification of WFO took place in a 500 ml three-necked round-bottom flask equipped with a reflux condenser, heating source controller, thermometer, and magnetic stirrer [25,31]. After the reaction concluded, the catalyst was recovered through filtration using Wartman filter paper (100 microns). The resulting mixture was then transferred into a separating funnel, allowing it to separate into two distinct layers. The top layer constituted biodiesel, also known as WFO Ethyl Ester (WFOEE), while the lower layer comprised a mixture of excess ethanol and glycerol. Following separation, excess ethanol was removed through evaporation at a temperature of 78 °C. The quantity of biodiesel obtained was measured using Eqn 1. The transesterification process adhered to the procedures outlined by Oladipo et al. [23], Falowo [32], and Nguyen et al. [18].
Where: = Biodiesel yield, = Weight of biodiesel produced, = weight of oil use
3. Results and Discussion
3.1. Elemental Composition of the Raw Agricultural Residues
Chemical analyses were conducted on the raw residues (DPL, KNP, and SOP) to determine their elemental compositions using EDX analysis. For DPL, the analysis identified the following elements: O, Mg, Al, Si, P, S, Cl, K, Ca, Ti, V, Cr, Mn, Fe, Co, Ni, Cu, Zn, Sr, Zr, Nb, Ag, Sn, Ba, W, and Pb. Ta was not detected (Table 2). The top five elements identified in DPL were calcium (38.3%), oxygen (33.8%), potassium (7.4%), silicon (7.2%), and iron (2.9%). Similarly, the elemental composition of KNP was comparable, with potassium being the most abundant element at 31.7%, followed by calcium (17%), and magnesium (7.4%). These results suggest that DPL and KNP share similar compositions, with calcium and potassium being the predominant elements in both samples. Vanadium (V) was absent from SOP, and the elemental composition analysis of SOP revealed the same components as those identified in DPL and KNP. The composition percentages of Ca (25%) and K (29%), respectively, were the highest in DPL and KNP. The most prevalent elements were Ca and K, based.
3.2. The Basic Oxide Composition of Selected Raw Agricultural Residues
The corresponding basic oxides of the elements identified by XRF are presented in Table 3, including SiO2, V2O5, Cr2O3, MnO, Fe2O3, Co3O4, NiO, CuO, Nb2O3, MoO3, WO3, P2O5, SO3, CaO, MgO, K2O, BaO, Al2O3, Ta2O5, TiO2, ZnO, AgO2, Cl, ZrO2, SnO2, SrO, and PbO. In raw DPL, the five major compounds are CaO (59.9%), SiO2 (16.1%), K2O (5.9%), Cl (4.3%), and SO3 (4.1%). The lowest oxide detected was NiO (0.001%). The results reveal that calcium oxide (CaO) is the most prominent compound in DPL, followed by silicon oxide (SiO2). Other trace compounds include Fe2O3, SO3, MgO, K2O, and Al2O3.
3.3. Characterization of the Selected Calcined Agricultural Residue
Chemical composition analysis of the calcined residues at different temperatures for each of the three selected residues (DPLA, KNPA, and SOPA) was conducted using XRF analysis. The basic oxide composition at different calcination temperatures (500 to 900 oC) identified the presence of SiO2, Al2O3, CaO, Fe2O3, MgO, K2O, Cl, P2O5, SO3, TiO2, and MnO. The Loss of Ignition (LOI) was also estimated for each sample (Table 4). The prominent oxides present are calcium oxide (CaO), Silicon Dioxide (SiO2), and potassium oxide (K2O), similar to their composition in their raw forms. The percentage of SiO2 remains relatively stable across all temperatures for all three samples. There is a slight increase in SiO2 content from 500 to 700 oC, followed by a slight decrease at higher temperatures (Table 4). The composition of CaO initially decreases from 500 to 700 oC for DPLA and KNPA but significantly increases for SOPA. At temperatures above 700 oC, the CaO content remains relatively stable for all samples. The percentage of K2O remains relatively stable across all temperatures for DPLA and KNPA samples.
However, in the SOPA sample, there is an increase in K2O content with increasing temperature. These major oxides found in the three samples establish the good potential of the selected residues as heterogeneous catalysts for the transesterification process. This aligns with past studies [3,33] where a major compound found in the heterogeneous catalyst is crucial for the transesterification process. The Loss of Ignition (LOI) represents the weight loss due to the release of volatile components during the calcination process. The LOI values vary significantly across different samples and temperatures. In general, the LOI decreases with increasing temperatures, indicating the release of volatile components.
3.4. EDX Analysis of the Composite Heterogeneous Catalyst (CHC)
The elemental composition result from the EDX analysis of the CHC is presented in Table 5. It was observed that Ca had the highest mass fraction (59.03%), thus corroborating the EDX spectra of the elemental composition of CHC as shown in Figure 2. Magnesium (Mg) and sodium (Na) were present as trace elements, having mass fractions of 2.7% and 1.3%, respectively. This finding was in agreement with the analysis of the raw samples (Table 2), which indicated calcium as the most prominent element. The finding was also consistent with previous works [18,23,34]. The result reveals that the composite is suitable for use as a heterogeneous catalyst as it retained the active element after calcination.
3.5. Scanning Electron Microscopy (SEM) for CHC
The SEM image of the CHC was viewed at a resolution of 500,000, as shown in Figure 3. The image reveals the agglomeration of non-uniform particles, clusters of various shapes and sizes, and layered spongy fibrous microstructures that occur during calcination. The SEM image (Figure 3) indicates that the crystal structure of the CHC displays a vesicular structure; some particles are bonded together as aggregates. These aggregates could provide higher specific surface areas, enabling the catalyst to fully contact the reactant mixture. Similar images were obtained with eggshells used as heterogeneous catalysts by Li et al. [35]. The particles are arranged in an irregular shape. The porous and spongy nature of the ash particles results from the high calcination temperature, leading to the sintering of small mineral aggregates and agglomeration of the particles. The non-uniform structure of the particle size distribution might form due to the merging of the particle size structures of the three residue materials during catalyst synthesis. After calcination, a fine powdered-form crystal was observed, suggesting the efficacy of good catalytic performance due to the increase in the surface area of the catalyst [36].
3.6. Functional Group Composition of the Raw and Calcined Composite Residue
3.6.1. FTIR of Raw Composite Residue
The major peak from the FTIR spectra for the raw composite of the selected residue is presented in Figure 4. The peak at 3437.88 cm-1 corresponds to the OH stretching vibration, observed in alcohols, phenols, and carboxylic acids containing hydroxyl groups. The specific peak at this wavelength is attributed to inter- and intra-molecular hydrogen bonding [37]. The peak at 3050.13 cm-1 corresponds to the -CH stretching vibrations of -CH3 and -CH2 functional groups, commonly found in compounds containing methyl (-CH3) and methylene (-CH2) groups [38]. The peak at 2573.11 cm-1 corresponds to C-H stretching vibrations, characteristic of alkanes, and hydrocarbons consisting of only carbon and hydrogen atoms, where the stretching of C-H bonds gives rise to this peak [39]. The peak at 1950.04 cm-1 corresponds to the C=O stretching vibration of the carbonyl group, characteristic of compounds like ketones and aldehydes [39]. The peak at 1748.21 cm-1 corresponds to the -CO stretching vibration of ether functional groups, present in ethers with an oxygen atom bonded to two alkyl or aryl groups, resulting in the stretching of the C-O bond [39]. The peak at 1592.53 cm-1 corresponds to C=C stretching vibrations observed in aromatic rings, such as benzene derivatives, due to the stretching of the carbon-carbon double bonds in the aromatic ring [39].
The peak at 1400.62 cm-1 corresponds to C-O stretching vibrations in carboxyl functional groups. Carboxyl groups contain both a carbonyl group (C=O) and a hydroxyl group (OH). The stretching of the C-O bond in the carboxyl group gives rise to this peak [40]. The peak at 1009.52 cm-1 corresponds to C-N stretching vibrations in aliphatic amines. Amines are organic compounds containing a nitrogen atom bonded to one or more alkyl or aryl groups. The stretching of the C-N bond in amines leads to this peak [40].
3.6.2. FTIR of Composite Calcined Heterogeneous Catalysts
The major peaks for FTIR analysis of the composite calcined heterogeneous catalyst development are shown in Figure 5. The peak at 3450.47 cm-1 corresponds to the O-H stretching vibration of hydroxyl groups. In this case, the vibration mode also corresponds to the presence of moisture. The stretching of the O-H bond in hydroxyl groups, along with the moisture effect, contributes to this peak [41]. The peak at 2446.20 cm-1 corresponds to the -CH stretching vibrations of -CH3 and -CH2 functional groups. These vibrations are commonly observed in alkanes, which are hydrocarbons consisting of carbon and hydrogen atoms. The stretching of the -CH bonds give rise to this peak [41]. The peak at 1601.26 cm-1 corresponds to C=C stretching vibrations observed in aromatic rings. Aromatic compounds, such as those with aromatic rings, exhibit this peak due to the stretching of the carbon-carbon double bonds in the aromatic ring [40]. The peak at 1528.40 cm-1 corresponds to the asymmetrical stretching vibrations of C=O and C-O groups in carbonate ions (CO32-). Carbonates contain a carbon atom bonded to three oxygen atoms and exhibit specific vibrations corresponding to the stretching of C=O and C-O bonds [40].
3.7. XRD Analysis of Composite Heterogeneous Catalyst (CHC)
The related XRD diffractogram in Figure 6 describes the crystalline structure of the calcined composite catalyst (CHC). The presence of crystalline phases is indicated by the presence of multiple peaks in the diffraction peak centered at 2θ = 16.0o, 21.0o, 24.0o, 29.0o, 35.0o, 38.5o, 42.0o, 46.0o, 49.5o, 56.0o, and 67.0o. These peaks were characteristics of calcium carbonate. The highest peak at 2θ = 35.0° predicts the formation of CaO. The peaks, which were characteristics of calcium oxide, arose at 2θ = 21.0°, 35.0°, 38.5°, and 56.0°. Heterogeneous catalysts such as CaO, MgO, and K2O that could be used in biodiesel production were found in the composite catalyst developed. The 2θ diffraction peaks of CaO are more than those for other compounds, implying a higher yield of CaO. This result is in agreement with the result obtained from FTIR analysis. The result also agrees with previous works of [23,31,35]
3.8. Responses from Experimental Data
D-Optimal Design (DOD) under the Mixture Methodology (MM) of Design-Expert Software (version 12.0.1) was adopted for the analysis of data obtained in this study. The results obtained show that Run 5 of the catalyst mixture, comprising 33.33% Kolanut Pod Ash (KNPA), 33.33% Sweet Orange Peel Ash (SOPA), and 33.33% Dried Pawpaw Leaves Ash (DPLA), respectively, gave the highest biodiesel yield of 65.3% (Table 6). In contrast, the mixing ratio in Run 1, with a mixture of 45.0% KNPA, 10.0% SOPA, and 45.0% DPLA, yielded the least biodiesel values at 16.0% (Table 5). The biodiesel yield from this study (65.3%) is higher than the 46.3% reported for the use of waste vegetable oil and ethanol, with Epobond Pseudomonas cepacia as a catalyst [42], but less than the 98% reported by Banani et al. [43] from the use of WFO with KOH as the catalyst.

Table 5.
Biodiesel yield of different mixing ratios of the catalysts.
| Run | Component (%) | Response | |||
| A: KNPA | B: SOPA | C: DPLA | Biodiesel yield (%) | ||
| 1 | 45.00 | 10.00 | 45.00 | 16.0 | |
| 2 | 21.67 | 56.67 | 21.67 | 32.0 | |
| 3 | 21.67 | 21.67 | 56.67 | 61.0 | |
| 4 | 10.00 | 10.00 | 80.00 | 47.0 | |
| 5 | 33.33 | 33.33 | 33.33 | 65.3 | |
| 6 | 80.00 | 10.00 | 10.00 | 52.0 | |
| 7 | 10.00 | 45.00 | 45.00 | 54.0 | |
| 8 | 45.00 | 45.00 | 10.00 | 36.0 | |
| 9 | 80.00 | 10.00 | 10.00 | 44.0 | |
| 10 | 10.00 | 10.00 | 80.00 | 60.0 | |
| 11 | 56.67 | 21.67 | 21.67 | 37.3 | |
| 12 | 10.00 | 80.00 | 10.00 | 44.0 | |
| 13 | 10.00 | 80.00 | 10.00 | 47.7 | |
| 14 | 45.00 | 45.00 | 10.00 | 30.7 | |
3.8.1. Model Summary Statistics for the Responses
The model summary statistics obtained from the software were utilized to determine the most suitable model for the selected study responses. Properties such as 'Standard Deviation' (Std. Dev.), indicating the degree of error between experimental and predicted values, were examined. The coefficient of Determination (R2) reveals the efficiency of the experiment, with higher values expected (≈ 1), while the Adjusted R2 (Adj R2) and predicted R2 (Pred R2) represent R2 values adjusted and predicted by the Design Expert Software, respectively.
The Std. Dev. values obtained from the available models (Linear, Quadratic, Special Cubic, and Cubic) embedded in the software are 0.0127, 0.0102, 0.0068, and 0.0026, respectively. Corresponding R2 values were 0.04455, 0.5495, 0.8269, and 0.9824 (Table 6). Similarly, their Adj R2 values were -0.1292, 0.2679, 0.6785, and 0.9542; Linear, Quadratic, Special Cubic, and Cubic had Pred R2 values of -0.3848, -1.3850, -0.6881, and 0.7417, respectively, while the PRESS was 0.0026, 0.0044, 0.0031, and 0.0005, respectively.
The cubic model demonstrated the highest R2, lowest Std. Dev., and the minimum difference between Adj R2 and Pred R2, with values of 0.9824, 0.0026, and 0.2125, respectively. However, the software suggested 'cubic' as the suitable model for the study. Moreover, the Special Quartic model was considered based on its relatively high R2 (0.9824), small differences (0.2125) between the Adj R2 (0.9542) and Pred R2 (0.7417), the smallest PRESS value of 0.0005, and the lowest standard deviation (0.0026) of the data obtained compared to the mean values [44,45].
3.8.2. ANOVA for the Developed Catalyst Composite
The biodiesel yield response, presented as a mixture quadratic model in Table 7, has a model F-value of 34.88, indicating a significant model. There is only a 0.06% chance that a model with such a large “F-value” could occur due to noise. The linear mixture components are equally significant because their “Prob>F” values (p=0.0428) are less than 0.05 (p<0.05). Similarly, the model terms such as AB, AC, A2BC, AB2C, and ABC2 are significant with p-values of 0.0105, 0.0001, 0.0056, 0.0198, and 0.0009, respectively. The only insignificant model term is BC with a p-value of 0.5760. This result implies that the combination of SOPA and DPLA does not influence the composite catalyst, while other model terms determine the output of the composite catalyst.
3.8.3. Regression Statistics for the Development of Catalyst Composite
The significance level of the model terms on the yield and ANOVA results for the regression model (Table 8). The values of R2 and adj R2 indicate that there is a very high relationship between the observed and predicted values obtained from the response [23]. A high value of R2 indicates that the variables in the model are in agreement, while a low value of R2 implies that the variables in the model are poor [46]). The R2 obtained for biodiesel yield was 0.9824, while the adj R2 value was 0.9542 (Table 8), implying that the observed and predicted values in the model have a reasonable agreement. The value of the R2 = 0.9824, being a measure of goodness of fit to the model, indicates a high degree of correlation between the observed value and predicted values. The R2 = 0.9824 suggests that more than 98.24 percent of the variance is attributable to the variables, indicating a high significance of the model. Thus, 1.76 percent of the total variance cannot be explained by the model.
Adequate Precision, having a ratio greater than 4, is desirable because it indicates an adequate signal of the model, which could be used to navigate the design space [47]. The PRESS is used in determining the suitability of the model in predicting the responses in new experiments; however, small values are desirable [39]. The PRESS value for the Biodiesel yield was 0.0005 (Table 8), which shows a desirable PRESS. The Coefficient of Variations (CV) obtained for the Biodiesel yield response of this model is 10.11. CV is the ratio of the standard error of estimate to the mean value of the observed response. It determines the reproducibility of the model; this can be estimated when the value is not more than 10 percent [48]. Hence, low values of CV and SD obtained for the Biodiesel yield showed the adequacy with which the experiment was conducted. The model has high R2 values, a significant F-value, a low coefficient of variation, and a low standard deviation. Therefore, the results showed a high precision in predicting the Biodiesel yield using the developed heterogeneous composite from KNP, DPL, and SOP residues.
3.8.4. Model Equations of Responses for the Development of Catalyst Composite
The final model equation in terms of real components for the Biodiesel yield is presented in Equation 4. The model equations show the relationship between the biodiesel yield and the components used (KNPA, SOPA, and DPLA). The terms “A, B, and C” represent KNPA, SOPA, and DPLA, respectively. Each quadratic response of Biodiesel yield is discussed based on the two factors' interaction that can be applied in all experimental regions. This allows one factor to be varied while the other factor is kept constant [49,50].
The quadratic equation generated by the software is represented in Equations 2. The equation, can be used to predict the response for given levels of each factor. The high levels of the mixture components are coded as +1, and the low levels are coded as 0. The coded equation is useful for identifying the relative impact of the factors by comparing the factor coefficients. The positive and negative coefficients of a model equation usually indicate the positive and negative effects of the independent variables on the selected responses [51]. The coefficients +47.62, +45.66, and +52.63, obtained for model terms A (KNPA), B (SOPA), and C (DPLA), suggest that the biodiesel yield of WFOB was highly influenced by the three residues used [52]. It is also suggested that the order of influence is C > A > B. Similarly, the coefficient obtained for the mixture of KNPA and SOPA has a positive coefficient of +28.33, suggesting that the mixture of the two residues has a stronger influence on biodiesel yield than the mixture of KNPA and DPLA with a positive coefficient of +5.85. The coefficient of +1.17 also suggests that the mixture of KNPA and DPLA with the square of SOPA influences the biodiesel yield.
Where A is the coded variable for KNPA, B is the coded variable for SOPA and C is the coded variable for DPLA.
The findings in this study show improvement in the catalyst performance over the work of Oyedoh et al. [53] that used coconut shells as heterogeneous catalyst to esterified waste cooking oil. The reported elemental composition of CaO (17.32%) and SiO2 (21.40%) are lower than 42.81% and 27.53% respectively obtained in this study. The predicted R2 (0.7705) and actual R2 (0.9541) values found by Oyedoh et al. [53] are closely in agreement with 0.7417 and 0.9542, respectively obtain in this work.
4. Conclusions
A composite catalyst from the ashes of three selected Agro-residues of Dried Pawpaw Leaves (DPL), Kola Nut Pods (KNP), and Sweet Orange Peels (SOP) was developed and used for transesterification of Waste Frying Oil (WFO) with ethanol. The composite developed with D-Optimal Design under the Mixture Methodology (MM) of the Design Expert Software (12.0) gave the best mixing ratio of the three residues as 1:1:1 w/w. The application of the catalyst in the transesterification of WFO with ethanol produces WFO Biodiesel (WFOB) with a yield of 65%. The physicochemical analysis of the WFOB produced was found to meet the biodiesel standards. The feasibility of combining the three selected residues (KNPA, SOPA, and DPLA) to develop a composite catalyst for transesterification of WFO is established. The model equation developed can be used to predict biodiesel yield during the transesterification of WFO using the composite catalyst.
Author Contributions
Conceptualization, OAO.; methodology, OAO.; software, OAO.; validation, SOJ and AOA.; formal analysis, OAO; investigation, OAO.; resources, OAO, AOA and SOJ; data curation, OAO; writing—original draft preparation, OAO; writing—review and editing, SOJ, AOA, OOA, CCE.; visualization, AOA, CCE and OAO.; supervision, SOJ and AOA; project administration, SOJ.; funding acquisition, SOJ. All authors have read and agreed to the published version of the manuscript.
Funding
This research received no external funding.
Data Availability Statement
The original contributions presented in the study are included in the article, further inquiries can be directed to the corresponding author.
Acknowledgments
The second author (SOJ) acknowledges the Equipment Subsidy Grant from Alexander von Humboldt Foundation, Germany which aided the execution of this research. All authors wish to appreciate the effort of technical staff of the Department of Agricultural Engineering, Ladoke Akintola University of Technology, Ogbomoso, Nigeria for their due diligence and support in providing technical materials and equipment’s used for this study.
Conflicts of Interest
The authors declare no conflicts of interest.
References
- Mandari V, Devarai SK. Biodiesel Production Using Homogeneous, Heterogeneous, and Enzyme Catalysts via Transesterification and Esterification Reactions: a Critical Review. BioEnergy Res. 2022, 15, 935–961. [Google Scholar] [CrossRef] [PubMed]
- Yang L, Takase M, Zhang M. Potential non-edible oil feedstock for biodiesel production in Africa: a survey. Renew Sustain Energy Rev. 2014, 38, 461–477. [Google Scholar] [CrossRef]
- Basumatary S, Nath B, Kalita P. Application of agro-waste derived materials as heterogeneous base catalysts for biodiesel synthesis. J Renew Sustain Energy [Internet]. 2018 [cited 2024 Oct 3];10(4). Available from: https://pubs.aip.org/aip/jrse/article/10/4/043105/383974.
- Gupta A, Kumar H. Multi-dimensional perspectives on electric vehicles design: A mind map approach. Clean Eng Technol. 2022, 8, 100483. [Google Scholar] [CrossRef]
- Jekayinfa SO, Scholz V. Assessment of Availability and Cost of Energetically Usable Crop Residues in Nigeria. Nat gas. 2007, 24, 25. [Google Scholar]
- Degfie TA, Mamo TT, Mekonnen YS. Optimized Biodiesel Production from Waste Cooking Oil (WCO) using Calcium Oxide (CaO) Nano-catalyst. Sci Rep. 2019 Dec 12;9(18982):1–8.
- Kamat S, Bandyopadhyay S. Optimization of regeneration temperature for energy integrated water allocation networks. Clean Eng Technol. 2022; 8, 100490. [Google Scholar]
- Jekayinfa SO, Orisaleye JI, Pecenka R. An Assessment of Potential Resources for Biomass Energy in Nigeria. Resources. 2020 Aug 6;9(8):92.
- Jekayinfa SO, Adebayo AO, Oniya OO, Olatunji KO. Comparative Analysis of Biogas and Methane Yields from Different Sizes of Groundnut Shell in a Batch Reactor at Mesophilic Temperature. J Energy Res Rev. 2020 May 27;34–44.
- Jekayinfa SO, Linke B, Pecenka R. Biogas production from selected crop residues in Nigeria and estimation of its electricity value. Int J Renew Energy Technol. 2015;6(2):101.
- Olatunji KO, Madyira DM, Ahmed NA. Modelling the effects of particle size pretreatment method on biogas yield of groundnut shells. Waste Manag Res J Sustain Circ Econ. 2022, 40, 1176–1188. [Google Scholar] [CrossRef] [PubMed]
- Ola FA, Jekayinfa SO. Pyrolysis of sandbox (Hura crepitans) shell: Effect of pyrolysis parameters on biochar yield. Res Agric Eng. 2015 Dec 31;61(4):170–6.
- Orisaleye JI, Jekayinfa SO, Pecenka R, Ogundare AA, Akinseloyin MO, Fadipe OL. Investigation of the Effects of Torrefaction Temperature and Residence Time on the Fuel Quality of Corncobs in a Fixed-Bed Reactor. Energies. 2022 Jul 21;15(14):5284.
- Okpalaeke KE, Ibrahim TH, Latinwo LM, Betiku E. Mathematical modeling and optimization studies by Artificial neural network, genetic algorithm and response surface methodology: a case of ferric sulfate–catalyzed esterification of Neem (Azadirachta indica) seed oil. Front Energy Res. 2020;8:614621.
- Etim AO, Musonge P, Eloka-Eboka AC. An effective green and renewable from the fusion of bi-component transesterification of linseed oil methyl ester. Biofuels Bioprod Biorefining. 2021;15:1461–72.
- Lv L, Dai L, Du W, Liu D. Progress in Enzymatic Biodiesel Production and Commercialization. Processes. 2021;9(2):1–10.
- Onukwuli DO, Emembolu LN, Ude CN, Aliozo SO, Menkiti MC. Optimization of biodiesel production from refined cotton seed oil and its characterization. Egypt J Pet. 2017;26(1):103–10.
- Nguyen HC, Nguyen ML, Su CH, Ong HC, Juan HY, Wu SJ. Bio-derived catalysts: A current trend of catalysts used in biodiesel production. Catalysts. 2021;11(7):1–28.
- Oloyede CT, Jekayinfa SO, Alade AO, Ogunkunle O, Otung NU, Laseinde OT. Exploration of agricultural residue ash as a solid green heterogeneous base catalyst for biodiesel production. Eng Rep. 2023 Jan;5(1):e12585.
- Yusuff AS, Adeniyi OD, Olutoye MA, Akpan UG. Kinetic Study of Transesterification of Waste Frying Oil to Biodiesel Using Anthilleggshell-Ni-Co Mixed Oxide Composite Catalyst. Pet Coal [Internet]. 2018 [cited 2024 Oct 3];60(1). Available from: https://search.ebscohost.com/login.aspx?direct=true&profile=ehost&scope=site&authtype=crawler&jrnl=13377027&AN=130713109&h=xojvTAOYzCOfkupbLVIMHoi2haZFH76e4mpMPdymijPXMxzpD8jcSjpBOXLOcbr16fXDmVMe%2BeAMEsD7gPp5ow%3D%3D&crl=c.
- Betiku E, Akintunde AM, Ojumu TV. Banana peels as a biobase catalyst for fatty acid methyl esters production using Napoleon’s plume (Bauhinia monandra) seed oil: A process parameters optimization study. Energy. 2016;103:797–806.
- Oladipo B, Ojumu TV, Betiku E. Potential of pawpaw peels as a base heterogeneous catalyst for biodiesel production: modeling and optimization studies. In: Nigerian Society of Chemical Engineers 48th Annual Conference [Internet]. 2018 [cited 2024 Oct 3]. p. 1–11. Available from: https://www.researchgate.net/profile/Eriola-Betiku/publication/329070825_Potential_of_pawpaw_peels_as_a_base_heterogeneous_catalyst_for_biodiesel_production_Modeling_and_optimization_studies/links/5bf41b0b92851c6b27cc42f8/Potential-of-pawpaw-peels-as-a-base-heterogeneous-catalyst-for-biodiesel-production-Modeling-and-optimization-studies.pdf.
- Oladipo B, Ojumu TV, Latinwo LM, Betiku E. Pawpaw (Carica papaya) peel waste as a novel green heterogeneous catalyst for moringa oil methyl esters synthesis: process optimization and kinetic study. Energies. 2020;13(21):5834.
- Yogeeswara T, Devendra U, Kalaisselvane A. Physical and chemical characterization of waste frying palm oil biodiesel and its blends with diesel. In: AIP Conference Proceedings [Internet]. AIP Publishing; 2020 [cited 2024 Oct 3]. Available from: https://pubs.aip.org/aip/acp/article-abstract/2225/1/030003/721622.
- Tunji Oloyede C, Olatayo Jekayinfa S, Olanrewaju Alade A, Ogunkunle O, Timothy Laseinde O, Oyejide Adebayo A, Veza I, Rizwanul Fattah IMd. Potential Heterogeneous Catalysts from Three Biogenic Residues toward Sustainable Biodiesel Production: Synthesis and Characterization. ChemistrySelect. 2022 Dec 27;7(48):e202203816.
- Betiku E, Etim AO, Pereao O, Ojumu TV. Two-Step Conversion of Neem ( Azadirachta indica ) Seed Oil into Fatty Methyl Esters Using a Heterogeneous Biomass-Based Catalyst: An Example of Cocoa Pod Husk. Energy Fuels. 2017 Jun 15;31(6):6182–93.
- Neupane, D. Biofuels from Renewable Sources, a Potential Option for Biodiesel Production. Bioengineering 2022, 25, 29. [Google Scholar] [CrossRef] [PubMed]
- Linggawati, A. Preparation and Characterization of Calcium Oxide Heterogeneous Catalyst Derived from Anadara Granosa Shell for Biodiesel Synthesis. KnE Eng [Internet]. 2016 Sep 5 [cited 2024 Oct 8];1(1). Available from: http://knepublishing.com/index.php/KnE-Engineering/article/view/494.
- Quispe CAG, Coronado CJ, Carvalho Jr JA. Biodiesel from waste oils: Production and Environmental Benefits. Renew Sustain Energy Rev. 2020;27:475–93.
- Ismail S, Ahmed AS, Anr R, Hamdan S. Biodiesel Production from Castor Oil by Using Calcium Oxide Derived from Mud Clam Shell. J Renew Energy. 2016;2016(1):5274917.
- Oloyede CT, Jekayinfa SO, Alade AO, Ogunkunle O, Laseinde OT, Adebayo AO, Abdulkareem AI, Smaisim GF, Fattah IMR. Synthesis of biobased composite heterogeneous catalyst for biodiesel production using simplex lattice design mixture: optimization process by Taguchi method. Energies. 2023;16(5):2197.
- Falowo OA, Oladipo B, Taiwo AE, Olaiya AT, Oyekola OO, Betiku E. Green heterogeneous base catalyst from ripe and unripe plantain peels mixture for the transesterification of waste cooking oil. Chem Eng J Adv. 2022 May;10:100293.
- Odude VO, Adesina AJ, Oyetunde OO, Adeyemi OO, Ishola NB, Etim AO, Betiku E. Application of Agricultural Waste-Based Catalysts to Transesterification of Esterified Palm Kernel Oil into Biodiesel: A Case of Banana Fruit Peel Versus Cocoa Pod Husk. Waste Biomass Valorization. 2019 Apr;10(4):877–88.
- Falowo OA, Oladipo B, Taiwo AE, Olaiya AT, Oyekola OO, Betiku E. Green heterogeneous base catalyst from ripe and unripe plantain peels mixture for the transesterification of waste cooking oil. Chem Eng J Adv. 2022 May 15;10:100293.
- Li Z, Wang P, Yang C, Zhang Y. XRD and FTIR Analysis of Calcium-Based Catalysts for Biodiesel Production. J Renew Energy. 2015;85:94–101.
- Etim AO, Eloka-Eboka AC, Musonge P. Potential of Carica papaya peels as effective biocatalyst in the optimized parametric transesterification of used vegetable oil. Environ Eng Res. 2021;26(4):200229.
- Sarjadi MS, Oladipo A. Fourier Transform Infrared (FTIR) Spectroscopy: Fundamentals and Applications. 2019. (Advances in Materials Science and Engineering).
- Marimuthu V, Kumaran S, Kumar A, Ganesan S. Spectral Characterization and Vibrational Analysis of Organic Compounds. J Mol Struct. 2020;1208:127887.
- Muzio G, Carrillo R, Del Campo J. Analysis of Functional Groups in Hydrocaron Derivatives by FTIR. J Anal Chem. 2020;75(6):1021–30.
- Autelitano F, Bellucci D, Catauro M, Gianni E. Structural and Spectral Analysis of Functional Groups in Organic Comounds Using FTIR Specroscopy. J Spectrosc.
- Pascoal JAR, Souza JR, Lima LM. FTIR Analysis of Hydroxyl and Alkane Functional Groups in Organic Compounds. J Mater Sci Chem Eng. 2016;4(8):23–31.
- Lopresto CG, Naccarato S, Albo L, De Paola MG, Chakraborty S, Curcio S, Calabro V. Enzymatic transesterification of waste vegetable oil to produce biodiesel. Ecotoxicol Environ Saf. 2015;121(7):229–35.
- Banani R, Youssef S, Bezzarga M, Abderrabba M. Waste frying oil with high levels of free fatty acids as one of the prominent sources of biodiesel production. J Mater Env Sci. 2015;6(4):1178–85.
- Aremu MO, Ibrahim H, Bamidele TO. Physicochemical characteristics of the oils extracted from some Nigerian plant foods–a review. Chem Process Eng Res. 2015;32:36–52.
- Xu ShiZhong XS. Predicted residual error sum of squares of mixed models: an application for genomic prediction. 2017 [cited 2024 Oct 3]; Available from: https://www.cabidigitallibrary.org/doi/full/10.5555/20173281105.
- Chicco D, Warrens MJ, Jurman G. The coefficient of determination R-squared is more informative than SMAPE, MAE, MAPE, MSE and RMSE in regression analysis evaluation. PeerJ Comput Sci. 2021;7:1–24.
- Finch, H. Multilevel modeling in the presence of outliers: A comparison of robust estimation methods. Psicol Int J Methodol Exp Psychol 2017, 38, 57–92. [Google Scholar]
- Samuel, E. A, Oladipupo O. O. Factorial Designs Application to Study Enhanced Bioremediation of Soil Artificially Contaminated with Weathered Bonny Light Crude Oil through Biostimulation and Bioaugmentation Strategy. J Environ Prot. 2012 Aug 20;3(8):748–59.
- Sulaiman S, Syakirah NK, Jamal P, Alam MZ. Fish bone waste as catalyst for biodiesel production. J Trop Resour Sustain Sci JTRSS. 2015;3(1):180–4.
- Rajesh Y, Kolakoti A, Sheakar BC, Bhargavi J. Optimization of biodiesel production from waste frying palm oil using definitive screening design. Int J Eng Sci Technol. 2019;11(2):48–57.
- Bharti VK, Singh G. Application of Response Surface Methodology in Optimization of Process Parameters. J Chem Eng Res. 2019;7(2):15–22.
- Mbah CG, Esonye CV, Onukwuli DO, Eze VC. Use of response surface methodology (RSM) in optimisation of biodiesel production from cow tallow. Int J Innov Eng Res Technol. 2021;8(8):91–102.
- Oyedoh EA, Okoduwa GU, Madojemu GO. Production of Biodiesel from the Transesterification of Waste Cooking Oil using Biobased Sulphonated Catalyst prepared from Coconut Shells. J Appl Sci Environ Manag. 2022, 26, 1977–1987. [Google Scholar] [CrossRef]
Figure 2.
The EDX for elemental composition of the selected CHC.
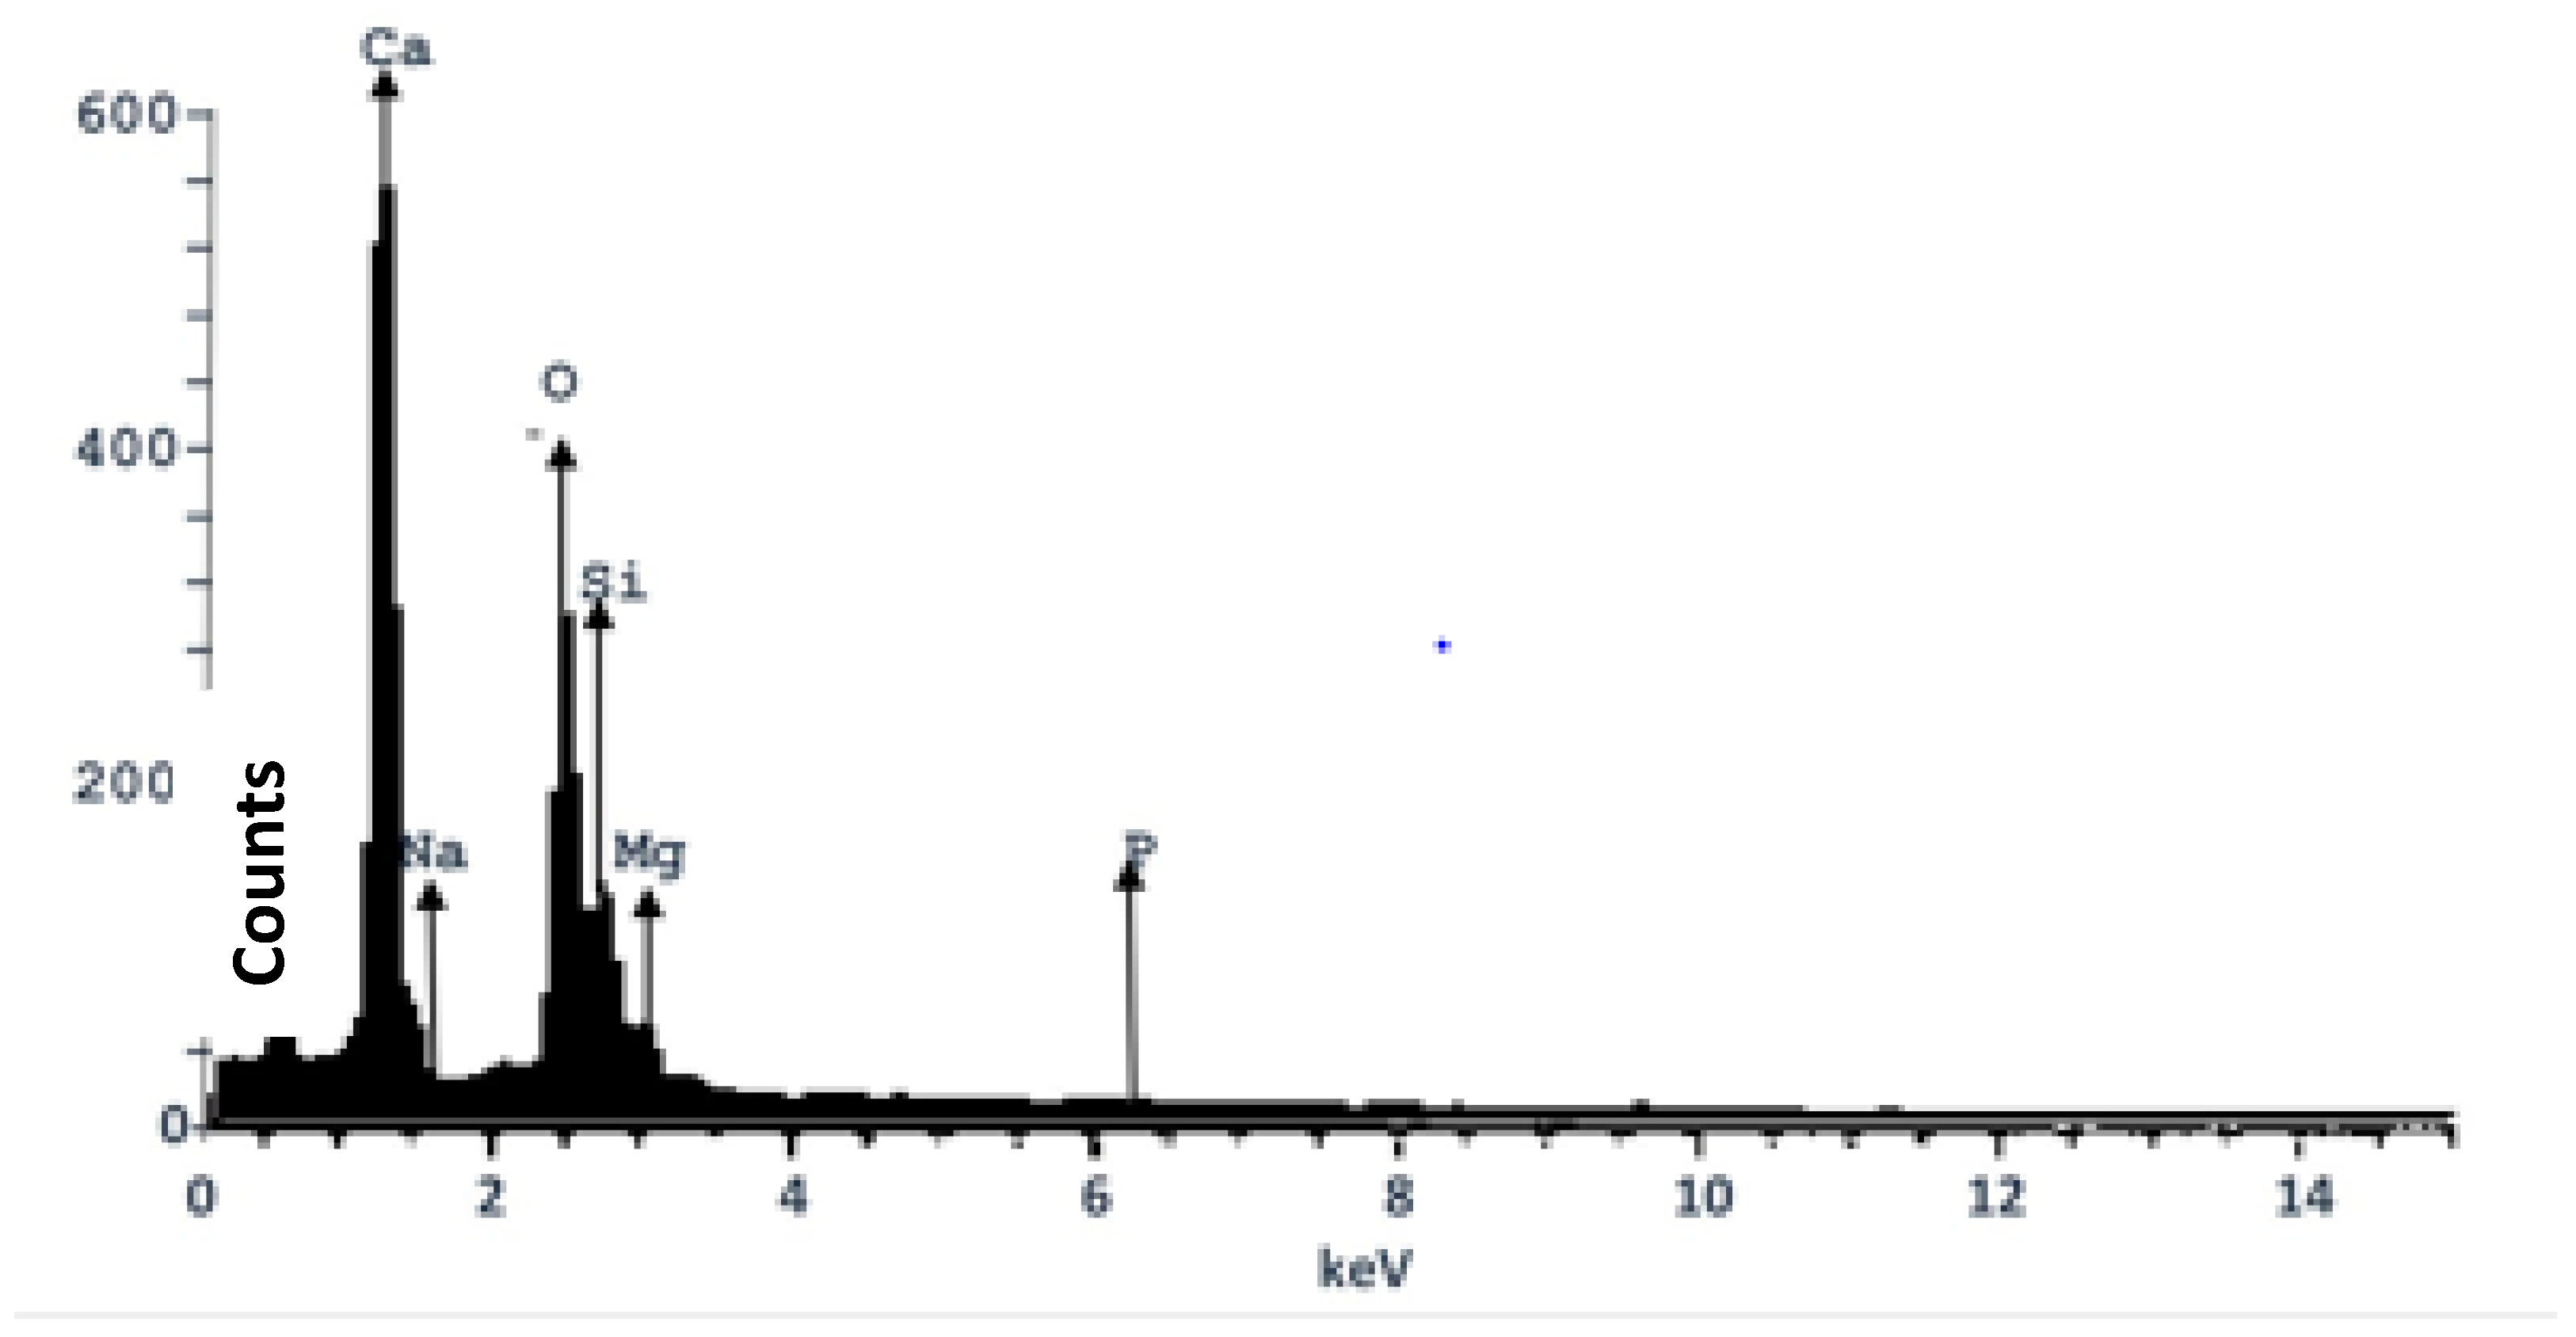
Figure 3.
SEM for the selected CHC.
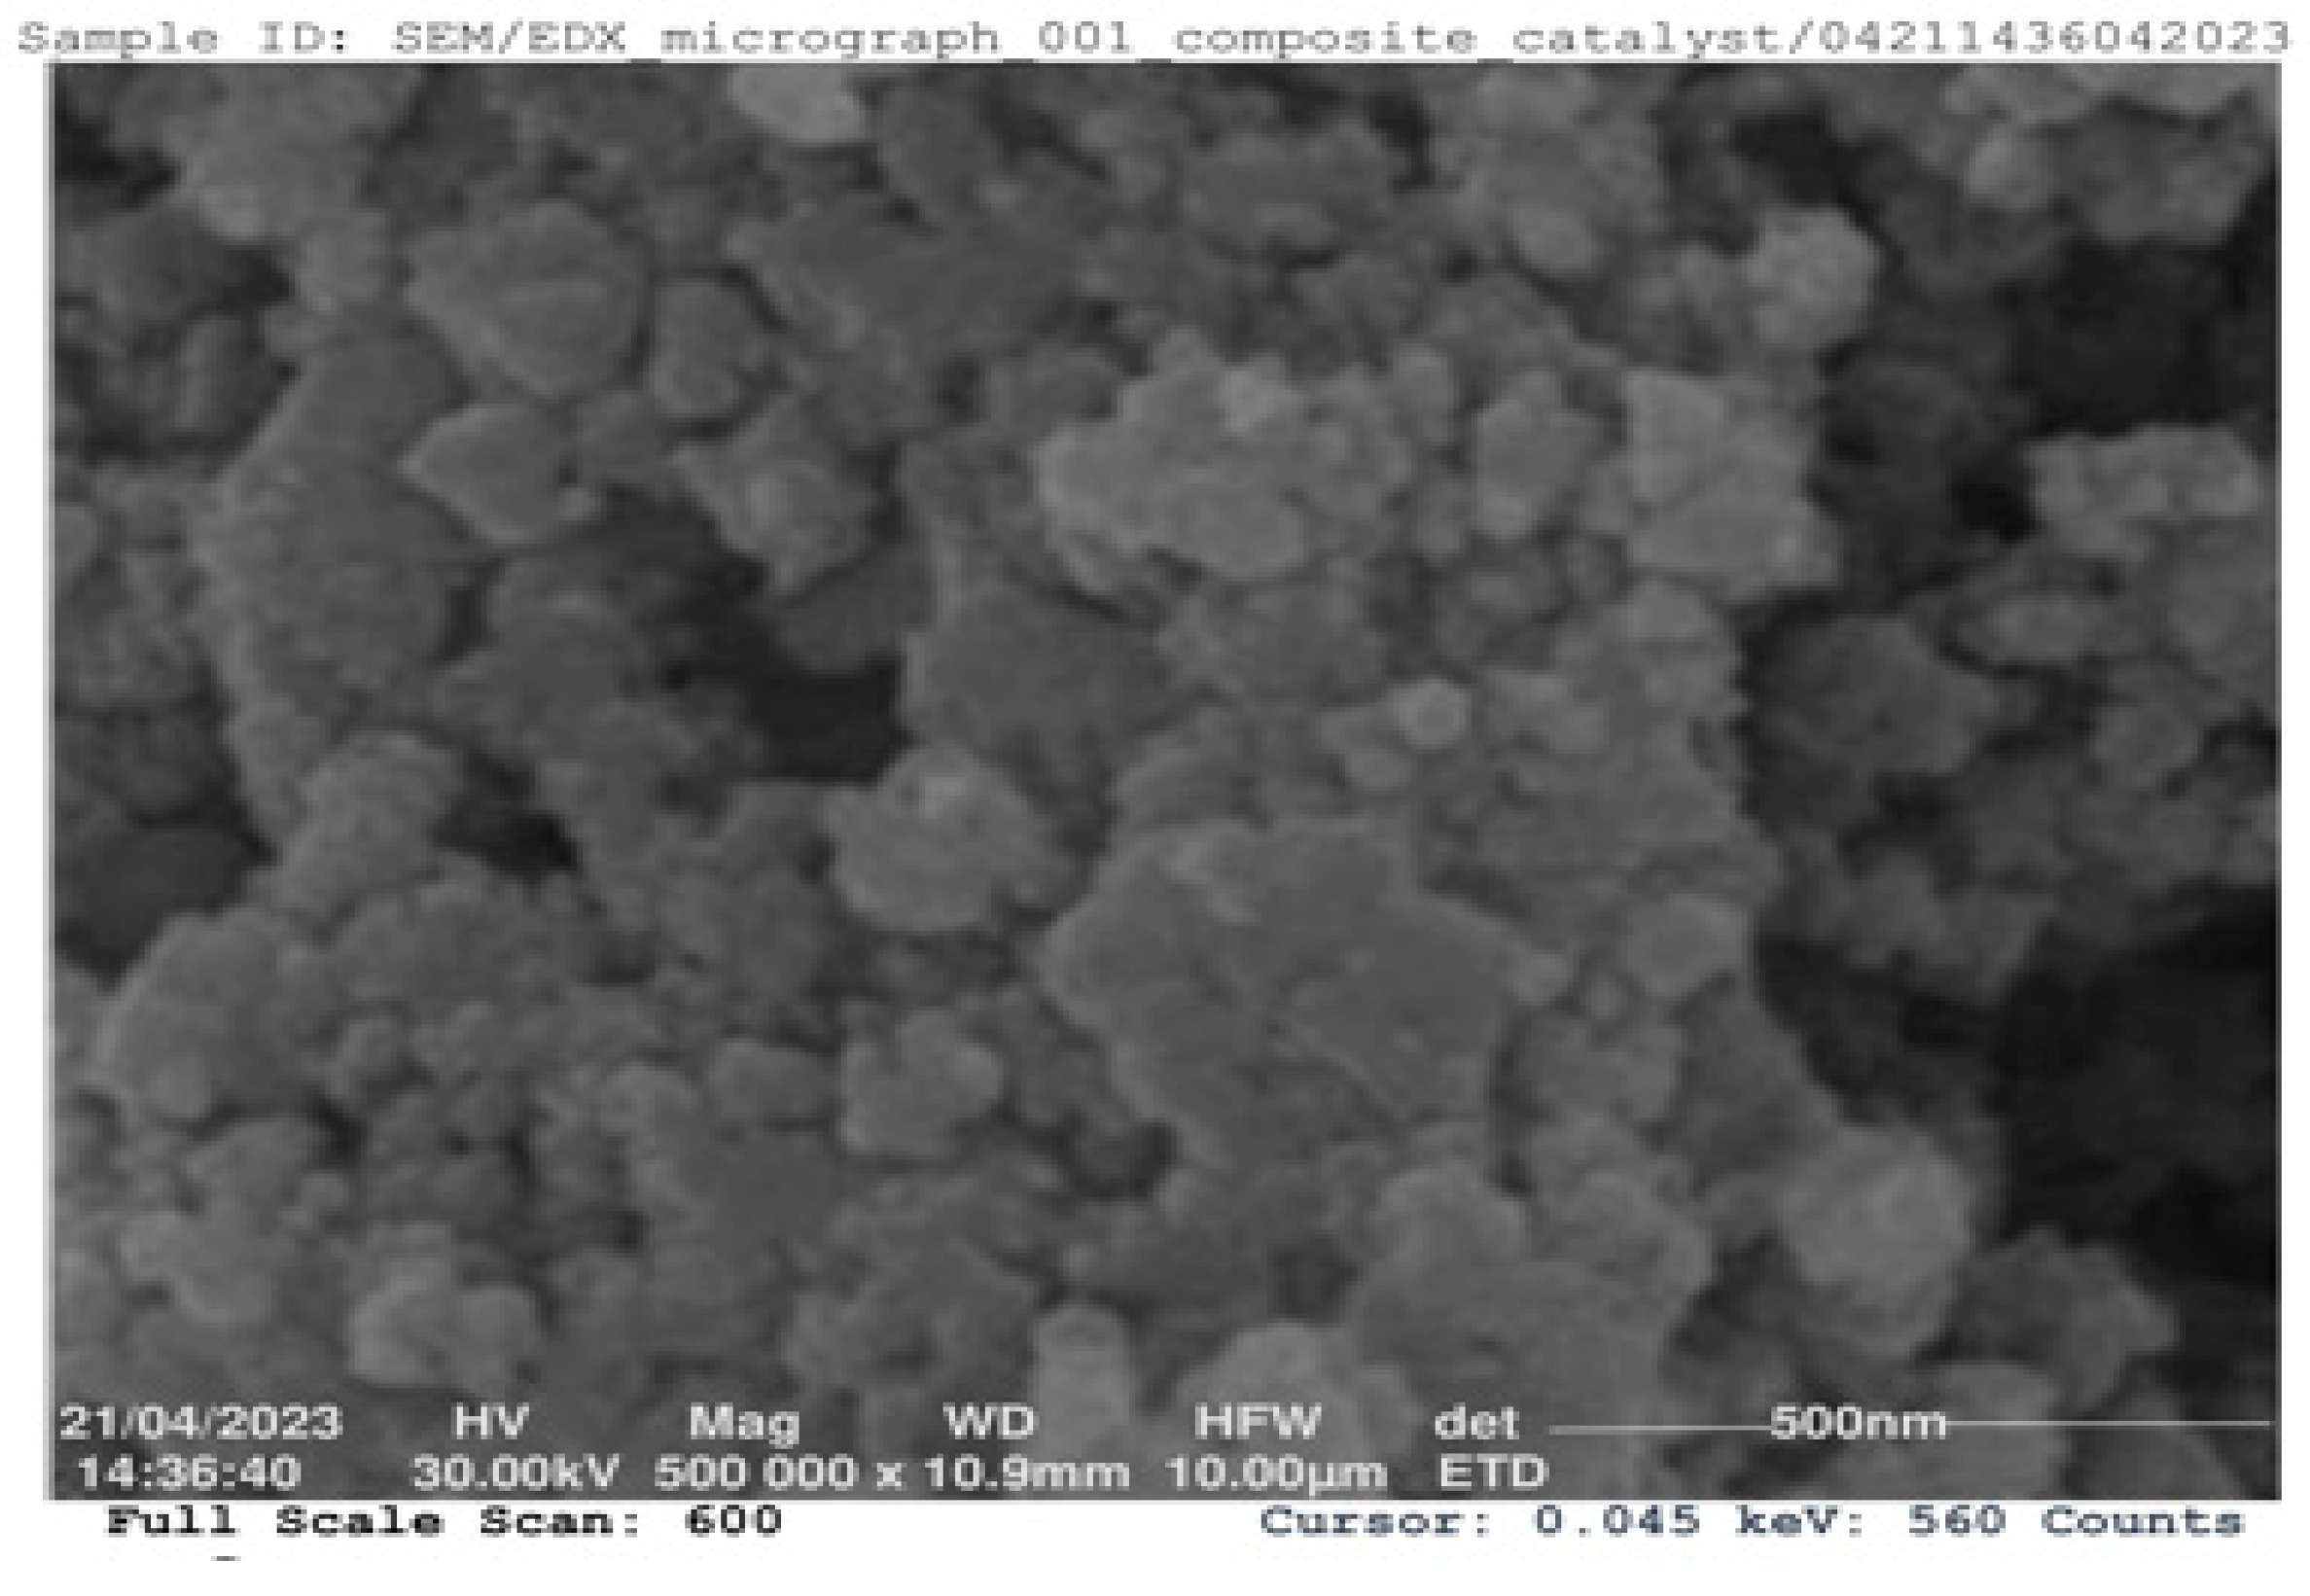
Figure 4.
The FTIR spectrum for the raw composite selected residue.
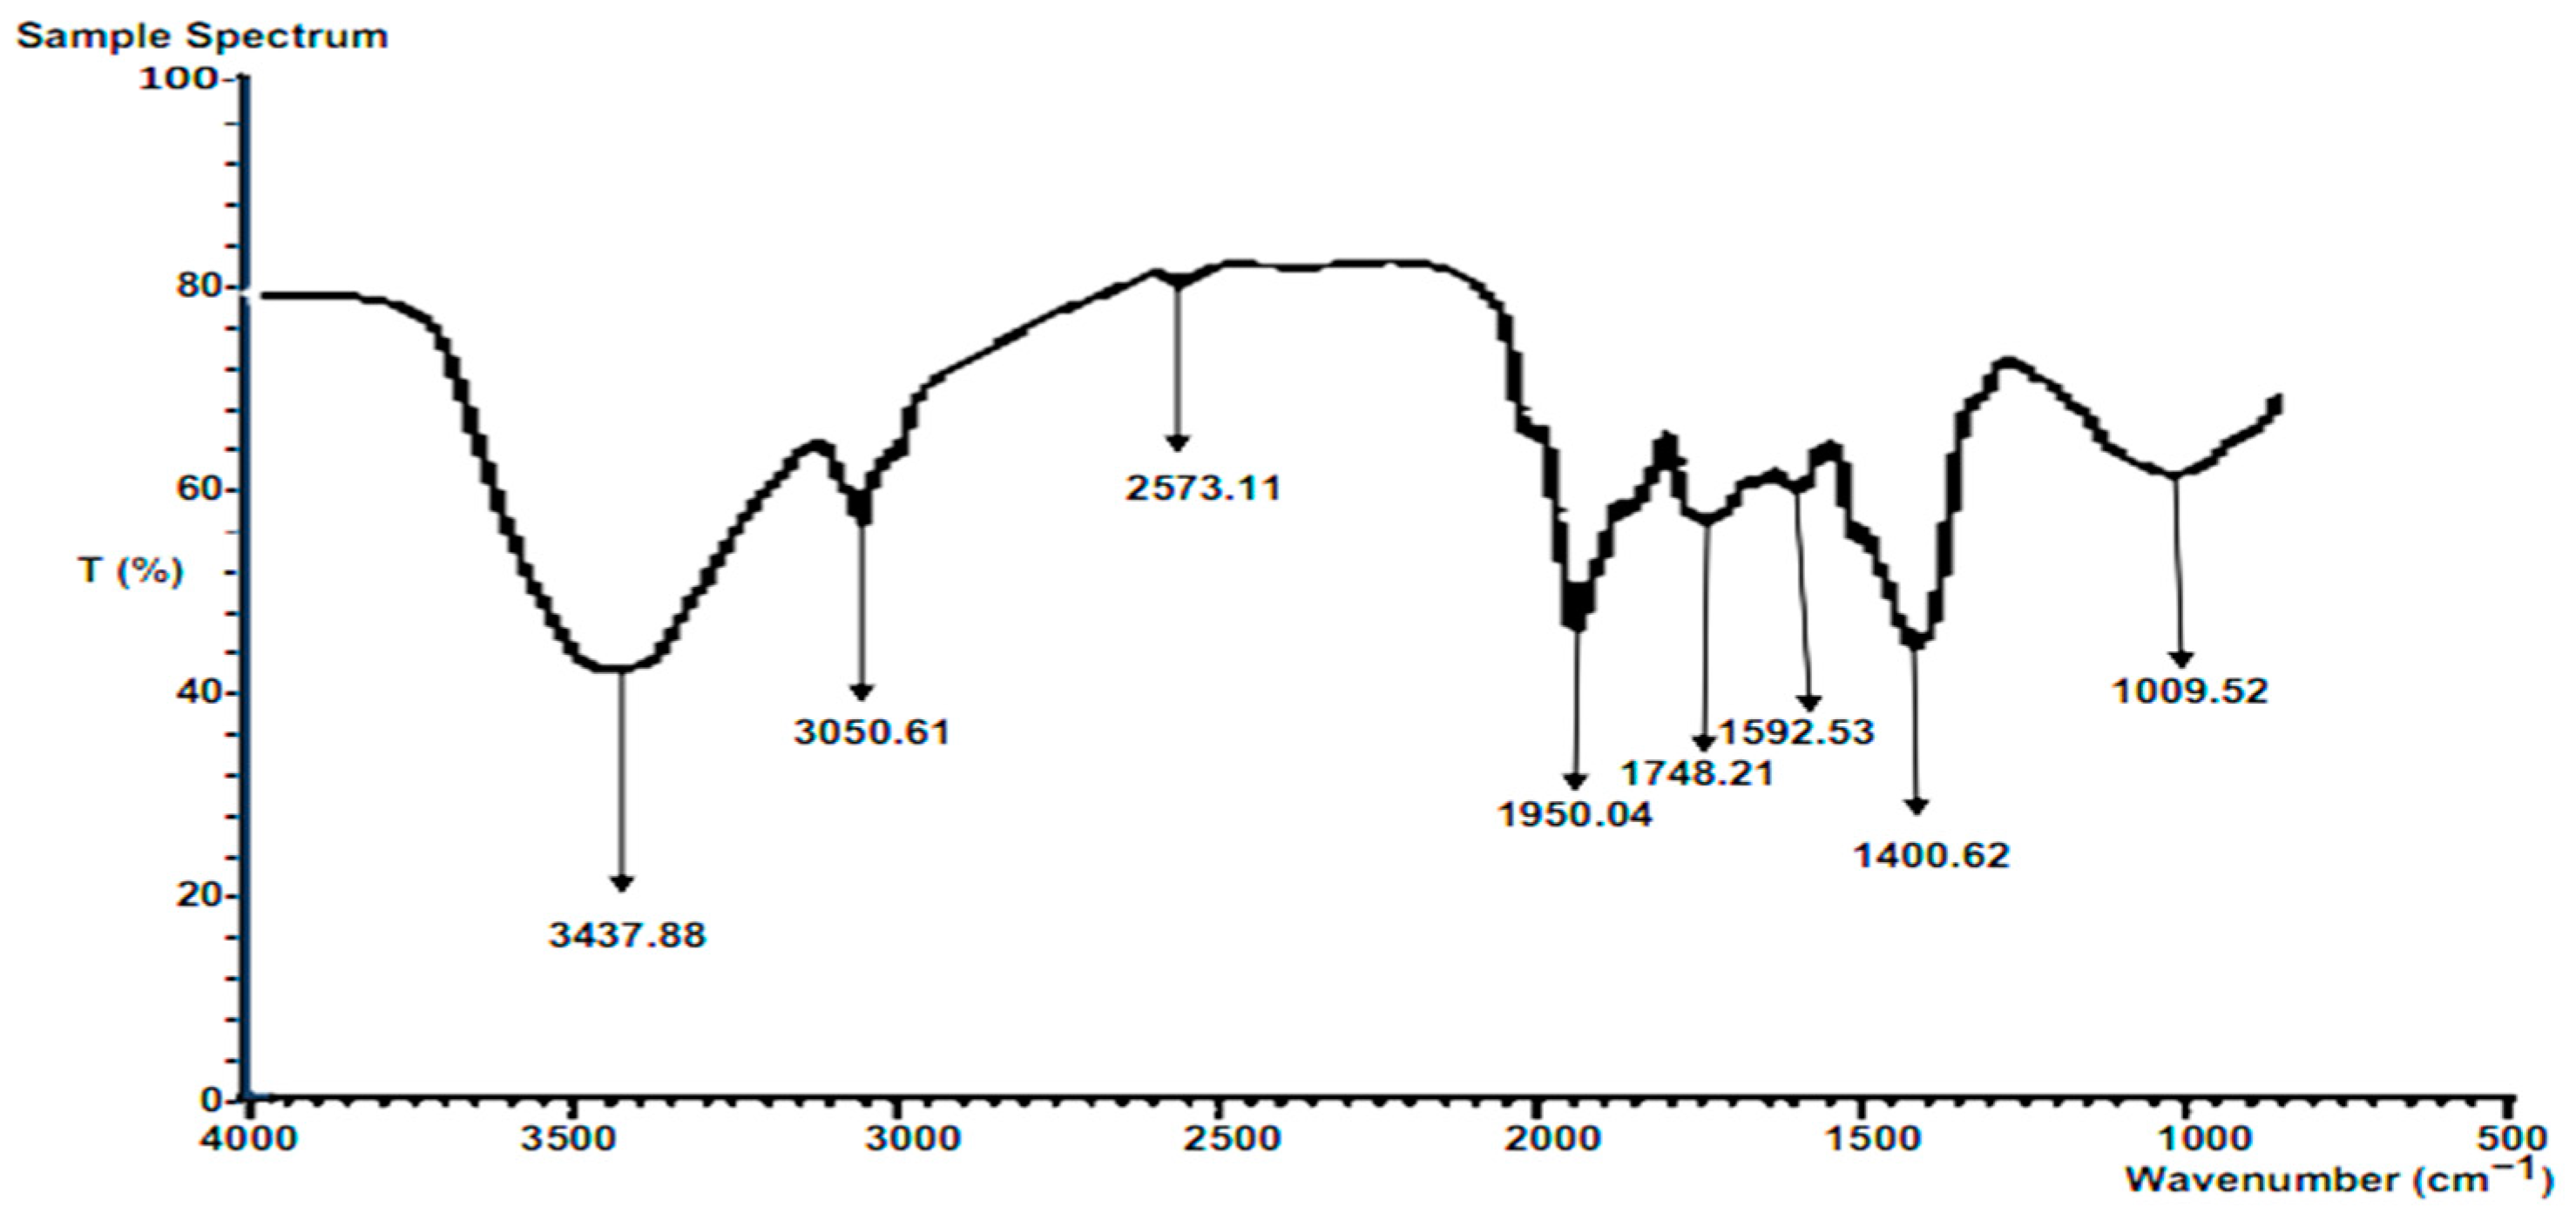
Figure 5.
The FTIR spectrum of the composite calcined heterogeneous catalysts.
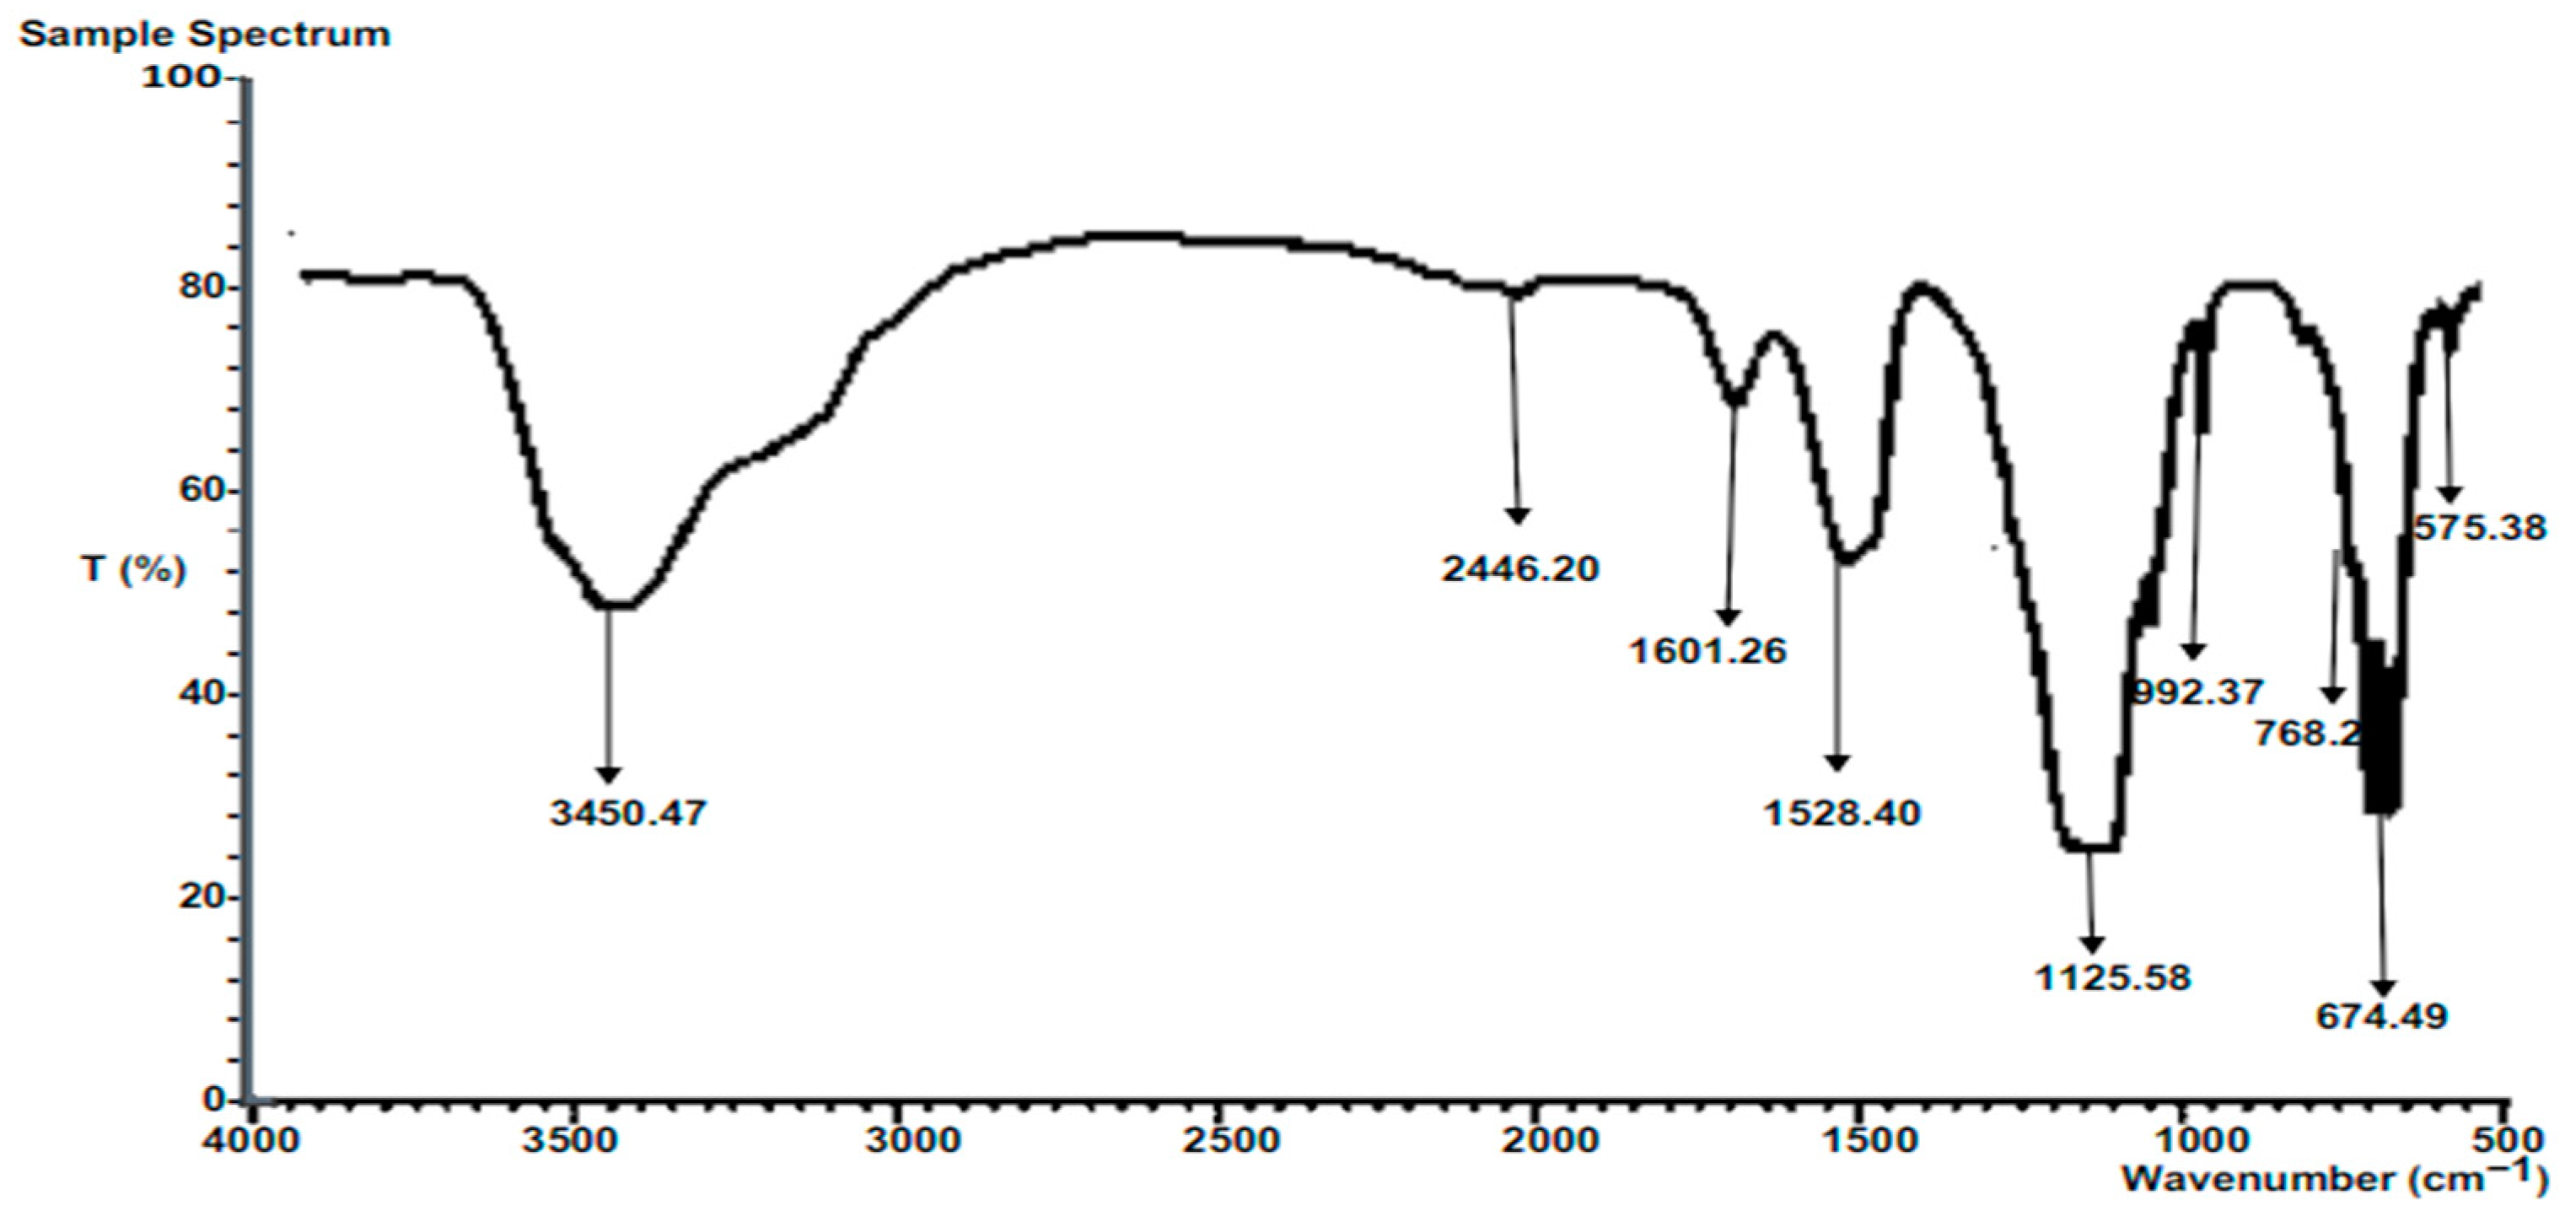
Figure 6.
XRD spectrum for CHC.
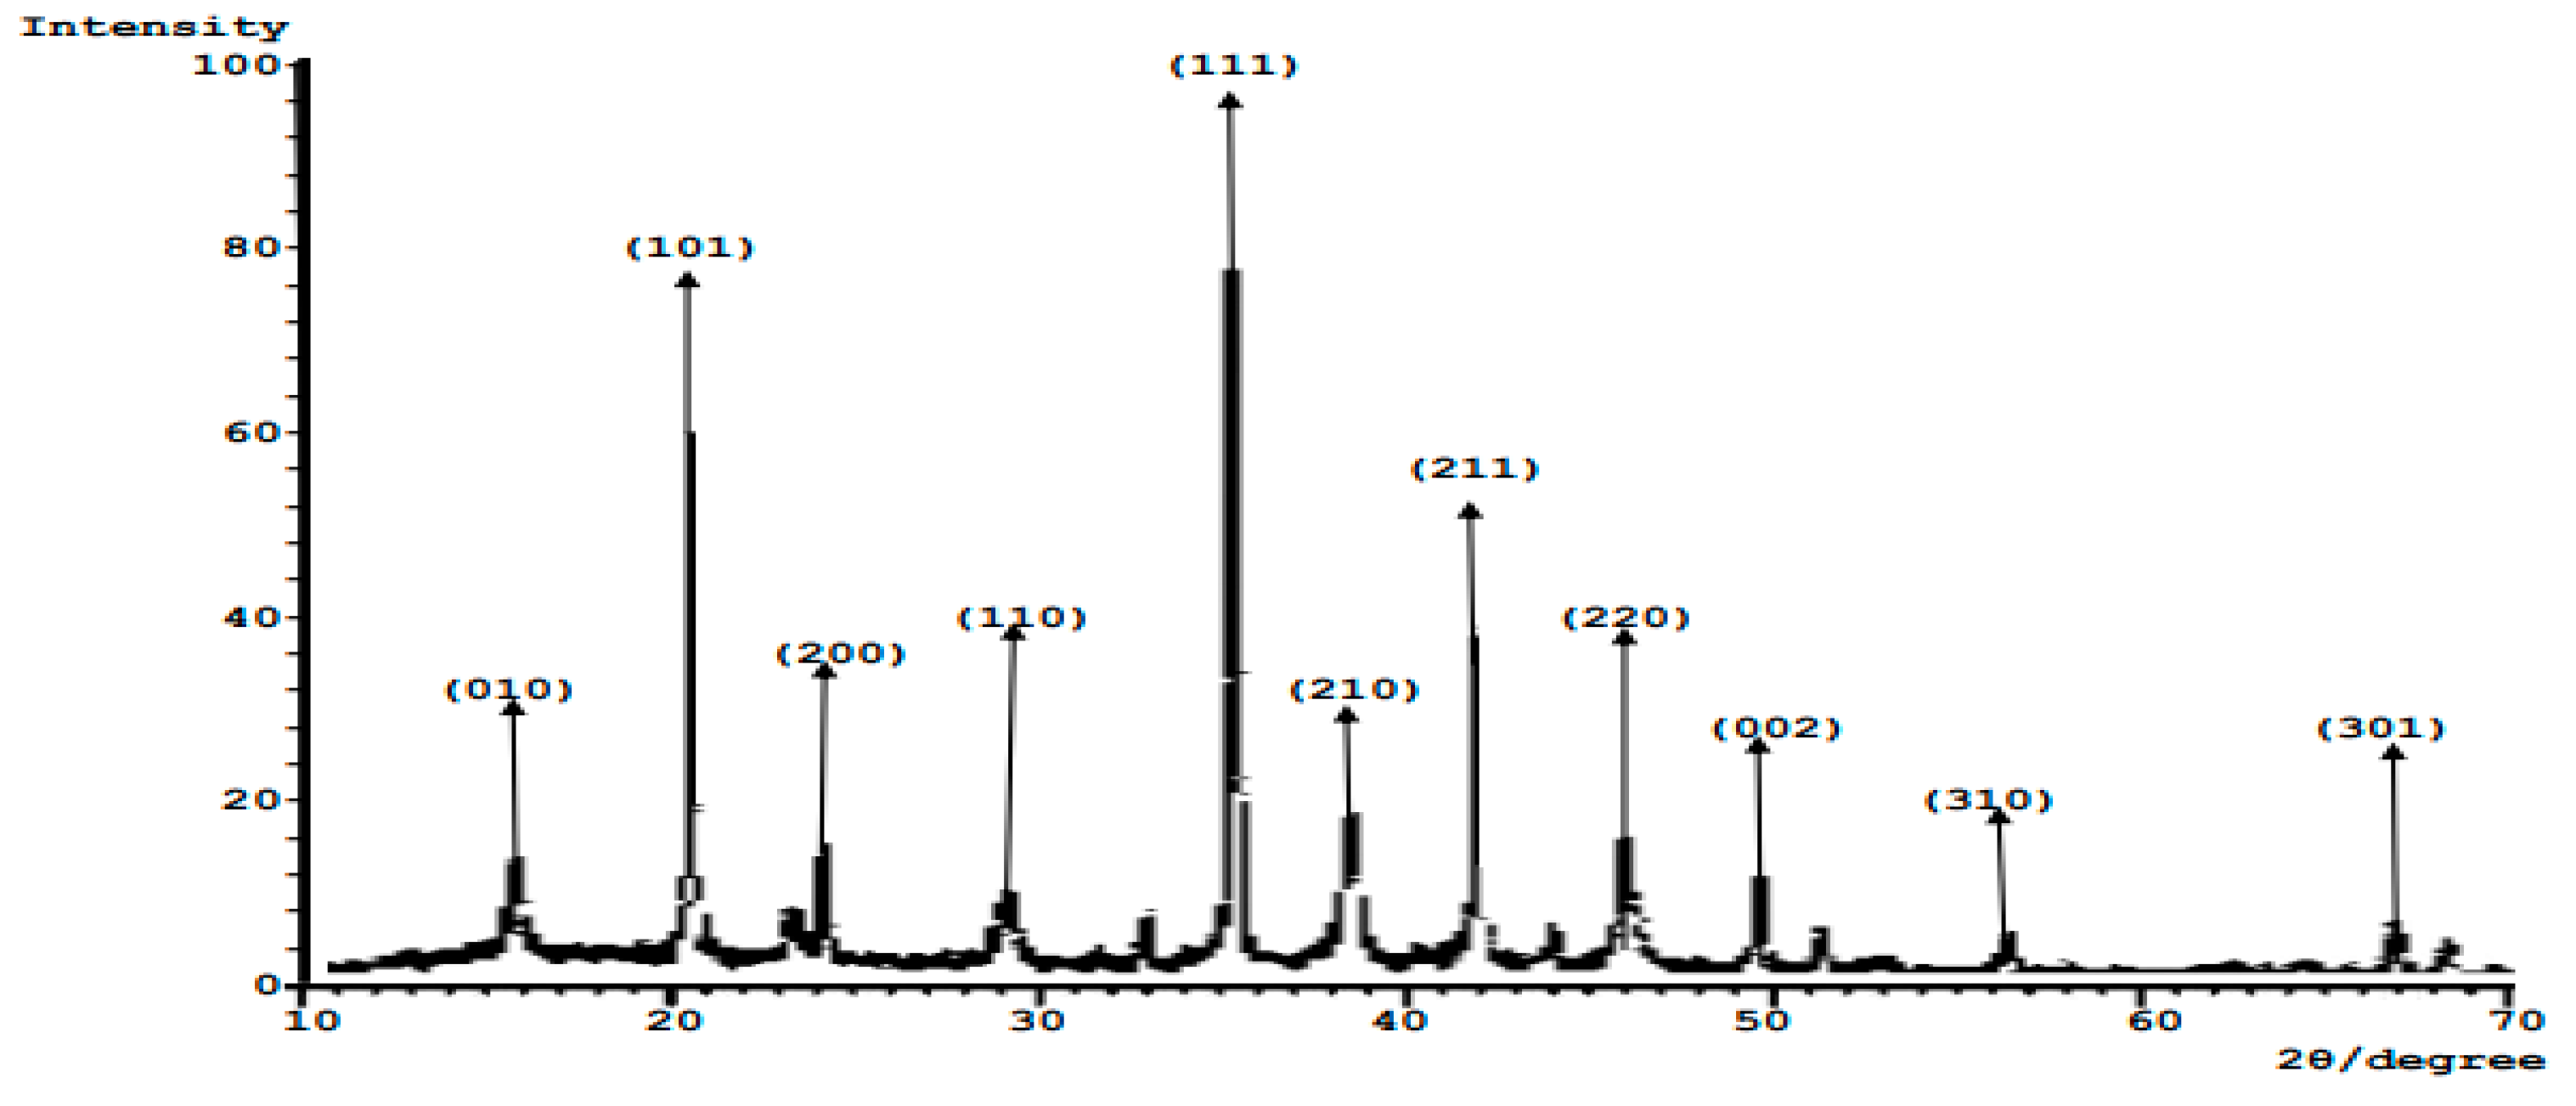
Table 1.
Selected levels for generation of predicted mixing ratio.
| Name | Components | Levels | ||
| Code | Unit | Low | High | |
| CKNPA | A | % | 10 | 80 |
| CDPLA | C | % | 10 | 80 |
| CSOPA | B | % | 10 | 80 |
Table 2.
The elemental composition of the raw samples’ residues.
| S/N | Element | Concentration (%) | ||
| DPL | KNP | SOP | ||
| 1 | O | 33.83 | 29.21 | 28.90 |
| 2 | Mg | 1.18 | 7.39 | 0.13 |
| 3 | Al | 2.75 | 4.15 | 3.73 |
| 4 | Si | 7.21 | 1.64 | 4.17 |
| 5 | P | 0.59 | 0.74 | 0.31 |
| 6 | S | 2.12 | 1.98 | 0.98 |
| 7 | Cl | 2.42 | 2.03 | 1.72 |
| 8 | K | 7.39 | 31.18 | 25.18 |
| 9 | Ca | 38.31 | 17.09 | 29.53 |
| 10 | Ti | 0.22 | 0.21 | 0.40 |
| 11 | V | 0.01 | 0.01 | Nil |
| 12 | Cr | 0.01 | 0.01 | 0.01 |
| 13 | Mn | 0.30 | 0.46 | 0.19 |
| 14 | Fe | 2.93 | 2.28 | 2.71 |
| 15 | Co | 0.01 | 0.03 | 0.04 |
| 16 | Ni | 0.00 | 0.01 | 0.01 |
| 17 | Cu | 0.18 | 0.21 | 0.29 |
| 18 | Zn | 0.11 | 0.12 | 0.15 |
| 19 | Sr | 0.15 | 0.08 | 0.18 |
| 20 | Zr | 0.02 | 0.04 | 0.09 |
| 21 | Nb | 0.03 | 0.05 | 0.06 |
| 22 | Mo | 0.01 | 0.01 | 0.02 |
| 23 | Ag | 0.02 | 0.06 | 0.08 |
| 24 | Sn | 0.08 | 0.96 | 0.62 |
| 25 | Ba | 0.10 | 0.06 | 0.43 |
| 26 | Ta | Nil | Nil | Nil |
| 27 | W | 0.01 | 0.01 | 0.01 |
| 28 | Pb | 0.02 | 0.03 | 0.05 |
Table 3.
The oxides composition of the raw residues.
| S/N | Compound | Concentration (%) | ||
| DPL | KNP | SOP | ||
| 1 | SiO2 | 16.10 | 4.05 | 10.44 |
| 2 | V2O5 | 0.00 | 0.01 | 0.00 |
| 3 | Cr2O3 | 0.01 | 0.01 | 0.01 |
| 4 | MnO | 0.35 | 0.58 | 0.25 |
| 5 | Fe2O3 | 1.64 | 1.41 | 1.70 |
| 6 | Co3O4 | 0.00 | 0.01 | 0.02 |
| 7 | NiO | 0.00 | 0.01 | 0.01 |
| 8 | CuO | 0.18 | 0.23 | 0.33 |
| 9 | Nb2O3 | 0.01 | 0.02 | 0.02 |
| 10 | MoO3 | 0.01 | 0.01 | 0.01 |
| 11 | WO3 | 0.00 | 0.00 | 0.00 |
| 12 | P2O5 | 0.59 | 0.82 | 0.35 |
| 13 | SO3 | 4.15 | 4.27 | 2.15 |
| 14 | CaO | 59.92 | 29.52 | 51.81 |
| 15 | MgO | 3.04 | 21.04 | 0.39 |
| 16 | K2O | 5.92 | 27.61 | 22.65 |
| 17 | BaO | 0.05 | 0.03 | 0.22 |
| 18 | Al2O3 | 3.19 | 5.33 | 4.86 |
| 19 | Ta2O5 | Nil | Nil | Nil |
| 20 | TiO2 | 0.28 | 0.31 | 0.59 |
| 21 | ZnO | 0.10 | 0.129 | 0.16 |
| 22 | Ag2O | 0.01 | 0.02 | 0.03 |
| 23 | Cl | 4.28 | 3.96 | 3.42 |
| 24 | ZrO2 | 0.01 | 0.03 | 0.07 |
| 25 | SnO2 | 0.04 | 0.56 | 0.37 |
| 26 | SrO | 0.12 | 0.06 | 0.14 |
| 27 | PbO | 0.01 | 0.01 | 0.02 |
Table 4.
Chemical composition of the individual calcined residue at different temperatures.
| S/N | Oxide | Calcined temperatures for DPLA (oC) | Calcined temperatures for KNPA (oC) | Calcined temperatures for SOPA (oC) | ||||||||||||
| 500 | 600 | 700 | 800 | 900 | 500 | 600 | 700 | 800 | 900 | 500 | 600 | 700 | 800 | 900 | ||
| 1 | SiO2 | 21.94 | 20.19 | 24.08 | 23.32 | 23.13 | 24.39 | 27.11 | 27.08 | 27.41 | 27.53 | 23.00 | 23.28 | 22.95 | 23.93 | 23.42 |
| 2 | Al2O3 | 6.70 | 5.31 | 4.66 | 4.60 | 4.71 | 5.37 | 4.31 | 5.44 | 5.63 | 5.72 | 1.78 | 2.41 | 2.38 | 2.24 | 1.87 |
| 3 | CaO | 25.24 | 26.62 | 27.21 | 27.08 | 27.00 | 42.81 | 42.81 | 41.53 | 41.72 | 41.46 | 30.02 | 30.74 | 29.42 | 30.32 | 31.62 |
| 4 | Fe2O3 | 6.02 | 4.79 | 4.62 | 4.75 | 4.68 | 2.00 | 1.43 | 2.46 | 2.50 | 2.31 | 1.26 | 2.17 | 1.68 | 1.63 | 1.87 |
| 5 | MgO | 4.25 | 4.03 | 5.48 | 5.68 | 5.36 | 1.26 | 1.65 | 3.14 | 2.45 | 2.29 | 3.40 | 3.64 | 3.79 | 4.21 | 4.08 |
| 6 | K2O | 22.73 | 21.28 | 21.78 | 21.12 | 21.27 | 12.08 | 10.03 | 10.26 | 10.00 | 10.31 | 22.42 | 22.73 | 23.26 | 24.07 | 25.93 |
| 7 | Cl | 1.30 | 1.27 | 1.31 | 1.44 | 1.53 | 1.65 | 1.41 | 1.38 | 1.42 | 1.48 | 0.05 | 0.04 | 0.03 | 0.05 | 0.03 |
| 8 | P2O5 | 2.00 | 2.13 | 2.35 | 2.61 | 2.50 | 2.44 | 2.29 | 2.32 | 2.40 | 2.32 | 2.07 | 2.58 | 2.4 | 2.52 | 2.27 |
| 9 | SO3 | 1.32 | 1.30 | 1.63 | 1.49 | 1.32 | 4.00 | 4.21 | 2.16 | 2.03 | 2.11 | 0.3 | 0.61 | 0.53 | 0.33 | 0.86 |
| 10 | TiO2 | 2.10 | 2.10 | 2.02 | 2.00 | 2.05 | 0.85 | 0.80 | 0.63 | 0.74 | 0.61 | 0.61 | 0.59 | 0.38 | 0.35 | 0.39 |
| 11 | MnO | 0.56 | 0.24 | 0.33 | 0.31 | 0.34 | 1.40 | 1.40 | 1.51 | 1.59 | 1.38 | 0.27 | 0.29 | 0.32 | 0.30 | 0.32 |
| 12 | LOI | 5.30 | 8.34 | 4.52 | 5.54 | 6.02 | 1.70 | 1.84 | 2.06 | 2.00 | 2.02 | 13.98 | 10.54 | 12.63 | 9.97 | 7.31 |
Note: LOI means Loss of Ignition.
Table 5.
Elemental composition of calcined composite heterogeneous catalyst.
| Element | Composition (%) |
|---|---|
| Silicon (Si) | 4.81 |
| Carbon (C) | 24.56 |
| Oxygen (O) | 7.24 |
| Calcium (Ca) | 59.03 |
| Magnesium (Mg) | 2.74 |
| Sodium (Na) | 1.29 |
Table 6.
Model summary statistics for the responses from developed catalyst mixture.
| Source | Std. Dev. | R² | Adjusted R² | Predicted R² | PRESS |
|---|---|---|---|---|---|
| Linear | 0.0127 | 0.0445 | -0.1292 | -0.3848 | 0.0026 |
| Quadratic | 0.0102 | 0.5495 | 0.2679 | -1.3850 | 0.0044 |
| Special Cubic | 0.0068 | 0.8269 | 0.6785 | -0.6881 | 0.0031 |
| Cubic | 0.0026 | 0.9824 | 0.9542 | 0.7417 | 0.0005* |
| Special Quartic | 0.0026 | 0.9824 | 0.9542 | 0.7417 | 0.0005 |
| Quartic | 0.0027 | 0.9840 | 0.9481 |
* Suggested.
Table 7.
ANOVA for biodiesel yield response for the development of catalyst composite.
| Source | Sum of Squares | Df | Mean Square | F-value | p-value |
| Model | 0.0018 | 8 | 0.0002 | 34.88 | 0.0006* |
| Linear Mixture | 0.0001 | 2 | 0.0000 | 6.32 | 0.0428* |
| AB | 0.0001 | 1 | 0.0001 | 15.84 | 0.0105* |
| AC | 0.0015 | 1 | 0.0015 | 224.22 | < 0.0001* |
| BC | 2.348E-06 | 1 | 2.348E-06 | 0.3575 | 0.5760 |
| A²BC | 0.0001 | 1 | 0.0001 | 21.62 | 0.0056* |
| AB²C | 0.0001 | 1 | 0.0001 | 11.39 | 0.0198* |
| ABC² | 0.0003 | 1 | 0.0003 | 49.93 | 0.0009* |
| Residual | 0.0000 | 5 | 6.567E-06 | ||
| Lack of Fit | 3.045E-06 | 1 | 3.045E-06 | 0.4088 | 0.5573 |
| Pure Error | 0.0000 | 4 | 7.448E-06 | ||
| Cor Total | 0.0019 | 13 |
Note: *Significant at 0.05< (prob>F) < 0.1 A = KNPA, B = SOPA and C = DPLA.
Table 8.
Regression statistics for the development of composite catalyst.
| Properties | Biodiesel yield |
|---|---|
| Standard Deviation | 0.0026 |
| Mean | 0.0253 |
| C.V | 10.11 |
| PRESS | 0.0005 |
| R2 | 0.9824 |
| Adjusted R2 | 0.9542 |
| Predicted R2 | 0.7417 |
| Adequate Precision | 22.9195 |
Disclaimer/Publisher’s Note: The statements, opinions and data contained in all publications are solely those of the individual author(s) and contributor(s) and not of MDPI and/or the editor(s). MDPI and/or the editor(s) disclaim responsibility for any injury to people or property resulting from any ideas, methods, instructions or products referred to in the content. |
© 2024 by the authors. Licensee MDPI, Basel, Switzerland. This article is an open access article distributed under the terms and conditions of the Creative Commons Attribution (CC BY) license (http://creativecommons.org/licenses/by/4.0/).
Copyright: This open access article is published under a Creative Commons CC BY 4.0 license, which permit the free download, distribution, and reuse, provided that the author and preprint are cited in any reuse.


