
Submitted:
09 October 2025
Posted:
10 October 2025
You are already at the latest version
Abstract
Synthesis of nanoparticles via green environmentally friendly approaches is gaining interest in their potential advantage over physico-chemical approaches. Herein, we explored the potential of lignin extracted from black liquor during isolation of cellulose from Parthenium Hysterophorus as a reducing and capping agent to synthesize silver nanoparticles (AgNPs). The synthesis process was optimized by varying the reaction time, temperature, the concentration of silver nitrate (AgNO3) and LMwLg. The optimum parameters were 60°C, 140 mins, 0.1 M AgNO3, and 0.4% w/v LMwLg. The synthesized silver nanoparticles were characterized using UV-Vis spectroscopy, Fourier transform infrared spectroscopy, transmission electron microscopy, energy dispersive X-ray spectroscopy, and X-ray diffraction spectroscopy. From the results obtained, the AgNPs showed a SPR peak at 436 nm. The TEM showed that the nanoparticles were monodispersed and spherical with a mean size of 20.81 nm. From XRD results, AgNPs were of crystalline structure with an average particle size of 20.1 nm. The EDX analysis confirmed that the nanoparticles were majorly composed of silver. These findings highlight the potential of LMwLg as a green reducing and capping agent in the synthesis of silver nanoparticles, offering a promising alternative to conventional chemical synthesis methods for silver synthesis.
Keywords:
green chemistry
; Kraft process
; black Liquor
; lignin
; silver nanoparticles
Introduction
Recently, the field of nanotechnology has developed due to its wide applications in sectors such as chemical, electrical, environmental remediation, food industries, biomedical, and biotechnology industries (Alazaiza et al., 2021). Nanomaterials, usually in the range 1-100 nm, have attracted interest owing to their physiochemical properties such as small sizes, high surface area and catalytic properties, which differ from their counterpart bulk materials (M. Ider et al., 2016). The methods used to synthesize nanomaterials are physical, chemical, and biological methods, employing the top-down and bottom-up synthesis approaches (Mistry et al., 2021). The optical, electrical, and catalytic properties of the nanomaterials are highly influenced by the control of size, and shape during synthesis (Dikshit et al., 2021).
One of the nanomaterials are the silver nanoparticles (AgNPs). AgNps have been reported to exhibit high antimicrobial, antioxidant, antibacterial, electrical, optical, and catalytic properties which enable them to be have wide applications in electronics, biological and chemical sensors, biotechnology applications, cosmetic and pharmaceutical industries (Nguyen et al., 2023). The commonly method used to synthesize AgNPs is the chemical method through the reduction of silver ions by the use of chemical reducing agents such as sodium borohydride (Nur et al., 2018), which are toxic and, in some cases, the synthesis process involves high energy and temperature intensive processes (Mistry et al., 2021), necessitating the use environmentally friendly synthesis methods such as green synthesis methods including the use of plants, bacteria, and fungi which reduce silver ions and are environmentally friendly compared to the physical and chemical methods (Azad et al., 2023). Natural compounds and plant extracts have been used as reducing and capping agents in the synthesis of AgNPs i.e. β-d-Glucose and starch as the reducing and capping agent respectively (Raveendran et al., 2003), Azadirachta indica leaf extract (Nazeruddin et al., 2014), and the use of tannic acid (Kalidas Sivaraman et al., 2009) have been used as both reducing and capping agents.
Lignocellulosic biomass is composed of cellulose 38 to 50%, hemicellulose 23 to 32%, and lignin 12 to 25% that primarily form the plant cell wall (Saratale et al., 2022). The rigidity and mechanical strength of the plant cell wall is enhanced by the presence of lignin, making it crucial to hydrolyze the cellulose and hemicellulose components of the plant (Mujtaba et al., 2023). Lignin is the most abundant, renewable and biodegradable natural biopolymer, an under-utilized agricultural and industrial waste from paper-making industries, that comprises of a large number of aromatic and aliphatic groups such as p–coumaryl alcohol, p–hydroxyphenyl propanol, coniferyl alcohol, and also various hydroxyl and aldehyde groups that aid in silver nanoparticles by acting as reducing and caping agents (P. Li et al., 2016). The high structural diversity of lignin and molecular weight distribution make its valorization and applicability challenging due to variations in sizes of its molecules within the same sample, making it necessary to fractionate lignin to obtain a specific fraction (Toledano et al., 2010).
Some of the methods used in the fractionation of lignin include differential precipitation, which involves extracting lignin from black liquor with a gradual decrease in the pH of the solution (Sun & Tomkinson, 2001), and the use of selective solvents, enzymes, and ionic liquids (Kilpeläinen et al., 2007). Lastly, the application of membrane technology, which involves obtaining lignin fractions with defined molecular weights (Colyar et al., 2008). Lignin-mediated AgNPs have been reported (E. S. Madivoli et al., 2023; Maršík et al., 2024; Saratale et al., 2022; Slavin et al., 2021). This work aimed to utilize the low molecular weight lignin fractions as a reducing and capping agent in the synthesis of AgNPs. Alkaline pretreatment was used to obtain lignin from Parthenium hysterophorus biomass, followed by fractionation to obtain low molecular weight and high molecular weight lignin fractions. The low molecular weight lignin fraction was further used in the biosynthesis of AgNPs which were then characterized using Fourier transform infrared spectroscopy, UV-Vis spectrophotometry, X-ray diffraction, transmission electron microscopy, and energy dispersive X-ray analysis.
Materials and Methods
Reagents and Chemicals
Analytical-grade chemicals and reagents were used during the experiments. Silver nitrate (99.9%), AgNO3, sodium hydroxide, NaOH, methanol (99%), CH3OH, ethanol (CH3CH2OH)
Sample Collection and Lignin Extraction
Parthenium hysterophorus was collected from the Jomo Kenyatta University of Agriculture and Technology (JKUAT) Botanical Garden and placed in labelled sample bags. Plant identification was conducted at the JKUAT Botany Laboratory, and all relevant details were recorded. The plant material was thoroughly cleaned with tap water to remove dust and undesirable particles, rinsed properly with distilled water, and then air-dried at room temperature for 21 days to remove moisture. The dried plant material was ground using a milling machine into a fine powder and stored in a dry place for further use.
Lignin Extraction and Fractionation
Figure 1 depicts the extraction of lignin and fractionation into low molecular weight and high molecular weight lignin.
Soda lignin was obtained from black liquor by alkaline treatment of Parthenium hysterophorus which involved mixing approximately 200g of biomass with 2.5 M aqueous NaOH solution in a ratio of 1:10 biomass to alkali ratio and the mixture was stirred mechanically for 3 hours at 100 ℃, followed by filtration, washing with 10% ethanol and distilled water to remove the base. To obtain soda lignin from the black liquor, the solution was dried in an oven at 105 ℃ for several days to remove water (Nigam et al., 2021a). Upon drying, the solid residue was subjected to fractionation by dispersing approximately 10 g powdered soda lignin in 250 mL methanol to separate Low Molecular weight Lignin (LMwLg) from High Molecular weight Lignin (HMwLg) (Pang et al., 2021; Saito et al., 2014; Zhang et al., 2017; Zhao et al., 2014). This solution was filtered under reduced pressure and the filtrate was subjected to rotary evaporation. The LMwLg was dried in an oven at 105 ℃ to constant weight (Saito et al., 2014; Zhang et al., 2017; Zhao et al., 2014). The insoluble fraction HMwLg was then redissolved in 100 mL deionized water to remove residual salts followed by precipitation by the addition of 500 mL 95% methanol, filtered and dried at 105 ℃ to constant weight (Farooq et al., 2019; Pang et al., 2021).
Biosynthesis of silver nanoparticles (AgNPs) using LMwLg
Silver nanoparticles were synthesized using silver nitrate solution as the precursor salt and LMwLg as the reducing and capping agent as shown in Figure 2.
One molar AgNO3 solution was prepared by dissolving approximately 17 g of AgNO3 in 100 ml of deionized water followed by serial dilutions to obtain 0.01 M and 0.1 M solutions. LMwLg solution was prepared by dissolving approximately 1g of LMwLg in 100 ml of deionized water. To formulate AgNPs, 10 ml of silver nitrate solution was mixed with 90 ml of LMwLg and stirred continuously. The formation of AgNPs was monitored using a UV-Vis spectrophotometer (Shimadzu UV-1800) which was set to acquire the absorbance spectra between 200-800 nm (M. Li et al., 2019; E. Madivoli et al., 2023; Morsali et al., 2022). The complete formation of these NPs was confirmed by the color change of the solution from yellow to dark brown (Prakash & Soni, 2011). The formed NPs were washed with distilled water and ethanol to remove impurities and centrifuged for 20 min at 12,000 rpm, after which they were oven dried at 45 °C (Agnihotri et al., 2013). To form AgNPs with uniform size and morphology, four parameters, including silver ion concentration (0.01, 0.1, and 1 M), LMwLg concentration (0.2, 0.4, and 0.5% w/v), reaction time (different time intervals for 2.5 h), and reaction temperature (25, 40, 50, 60, and 80 °C) were investigated using UV-Vis measurement to determine the optimal conditions. The optimization experiments were performed by one factor at a time method (Prakash & Soni, 2011).
Characterization of the Lignin, LMwLg, HMwLg, and AgNPs
The physicochemical properties of the synthesized AgNPs were determined using UV–Visible spectroscopy, Fourier Transform Infrared spectroscopy (FTIR), X-ray diffraction (XRD), Transmission Electron Microscopy (TEM), and Energy Dispersive X-ray spectroscopy (EDX) (Titus et al., 2018). The functional groups in the lignin fractions and silver nanoparticles were evaluated using an FTIR-ATR spectrometer Shimadzu IRAffinity-1S, Kenya in the 400-4000 cm-1 spectral range. The optical properties of AgNPs were determined using a UV-Vis spectrophotometer, Shimadzu UV-18000, Kenya in the wavelength range of 200-800 nm. Tauc plot or Tauc equation was used to determine a material’s optical band gap (Eg) from its absorption spectrum. The equation relates a material’s absorption coefficient (α) and the incident photon energy (hv) (Jiang et al., 2022).
The crystallinity of the AgNPs was evaluated using an X-ray diffractometer, Rigaku ULTIMA IV, Japan by irradiating the samples with Cu Kα radiation (λ=1.5418Å), and the diffractograms were acquired between 2 to 70° θ values with a scan speed of 2 and a step of 0.02°.
The average crystallite size was calculated using the Debye-Scherrer equation:
The interplanar spacing (dhkl) of the diffractograms was estimated using Bragg’s law equation
The morphology and particle size of the nanoparticles were determined using transmission electron microscopy, Jeol JEM-2100 TEM, Japan. The sample was loaded on a copper grid. The elemental composition of the nanoparticles was determined using an energy dispersive X-ray analysis, Bruker Xflash Detector 3001, Quantax 1.7, Finland. The sample was loaded on carbon coating and air-dried.
Results and Discussions
FTIR Spectral Analysis of Lignin Fractions and AgNPs
The FTIR spectra of Lg, LMwLg, HMwLg, and the synthesized AgNPs are shown in Figure 9(a) and (b) respectively.
The band at 1739 cm-1 is attributed to the C=O stretching of the ester bonds of the carboxylic groups of ferulic and p-coumaric acids of lignin (Nigam et al., 2021). The band at 1525 – 1560 cm-1 are assigned to C=C and C-C skeletal vibrations of the aromatic rings (Maršík et al., 2024). The broad band at 2840 – 3600 cm-1 is assigned to O-H stretching for phenolic hydroxyl groups (Margarida Martins et al., 2024). The band at 870 cm-1 was attributed to the deformation vibrations of C-H of lignin aromatic rings (Slavin et al., 2021). The band at 1425 cm-1 was a result of aromatic ring stretching with in-plane C-H deformation and CH3 antisymmetric deformation of the G and S structural units of lignin (Margarida Martins et al., 2024; Sammons et al., 2013). The band at 1225 cm-1 is attributed to the C-C, C-O, C=O stretching of the G ring (Sammons et al., 2013). The peak at 518 cm-1 is as a result of C-O-C ether or aromatic skeletal vibrations (Sammons et al., 2013). In Figure 9(b), all the peaks in LMwLg spectrum are also present in AgNPs spectrum, with a difference in reduced intensity in the AgNPs spectrum indicating the involvement of LMwLg functional groups in the synthesis of AgNPs (Barapatre et al., 2016).
Biosynthesis of silver nanoparticles
The synthesis process of AgNPs should be simple, and cost-effective with minimal usage of chemical-reducing agents. Thus, LMwLg, being a non-toxic and biodegradable polymer, was utilized for the synthesis of AgNPs as both a reducing and capping agent. AgNPs formation was confirmed after LMwLg solution was mixed with AgNO3 solution and the solution changed color from yellow to dark brown (Figure 3). The intense dark brown color results from excitation of the localized surface plasmon resonance (SPR) in the nanoparticles and depends on the concentration of AgNPs in the solution (Leyu et al., 2023). This indicated the complete bio reduction of Ag+ to Ag0 (Saratale et al., 2022).
Optimization of AgNPs synthesis
The optimization technique during the synthesis of nanoparticles is crucial to ensure stability and quality of the nanoparticles formed under ideal conditions, especially when using bio-reducing and bio-capping agents (Doan et al., 2020). To determine the optimum experimental conditions for the synthesis of silver nanoparticles using LMwLg from Parthenium hysterophorus, it was crucial to evaluate the effects of the reaction time, temperature, LMwLg concentration, and silver ion concentration through UV-Vis measurements based on the SPR phenomenon in the AgNPs. The position, symmetry, narrowness, or broadness of the SPR peak gives information about the presence, shape, size, agglomeration, and oxidation of nanoparticles which is used to determine the optimum experimental conditions for AgNPs synthesis (Velgosová et al., 2016). Symmetrical and narrow SPR band indicates small-sized and uniformly shaped silver nanoparticles. Additionally, the SPR band can experience wavelength shifts, changes in shape, and changes in absorbance capacity (M. Ider et al., 2016). The synthesized AgNPs exhibited the SPR peak at 439 nm which agrees with other reported values where the silver nanoparticles show an SPR peak at a wavelength range of 439 nm (Bindhu & Umadevi, 2014).
The effect of silver ion concentration
Figure 4 shows the effect of AgNO3 concentration on the synthesis of silver nanoparticles.
The results showed that different maximum absorbance, peak intensities, and shapes were obtained at various concentrations. Upon increasing the concentration of AgNO3 from 0.01 to 0.1 M, the reduction rate of Ag+ to Ag0 increases drastically as well as the number of nanoparticles formed, resulting in enhanced peak intensity and a sharp SPR peak due to small size distribution of the AgNPs (M. Ider et al., 2016; Nguyen et al., 2023). A broad and weak SPR band was observed for lower AgNO3 concentrations (0.01 M), indicating the presence of AgNPs with broader size distributions (M. Ider et al., 2016). The concentration of Ag0 is directly proportional to the initial concentration of AgNO3 (Nguyen et al., 2023). Thus, at higher AgNO3 concentrations,1 M, excess Ag0 results in distortion of the SPR peak’s symmetry, flattening, and reduced SPR band intensity due to a decrease in effective surface area for light absorption, a non-homogeneous distribution of the nanoparticles, and agglomerations of the large nanoparticles by Van der Waals interactions between neighboring nanoparticles (Alim-Al-Razy et al., 2020; Iravani et al., 2014; M. Ider et al., 2016; Nakamura et al., 2011). The formation of large nanoparticles at higher concentrations can also be explained by collision theory (K.J. Laidler et al., 1996). For a chemical reaction to occur, molecules must collide (effective collisions) with sufficient energy for the reaction to proceed. Our experiments demonstrated that, when 1 M AgNO3 was added, the silver ion concentration was high in a volume of the same unit, increasing the probability of molecular collisions, leading to a higher rate of nucleation and a higher yield and formation of larger nanoparticles. Ider et al observed that upon increasing the concentration of silver nitrate from 0.005 g/L to 0.05 g/L the SPR band becomes narrow with increased intensity. However, increasing the concentration to 0.1 g/L, the SPR band broadens and the intensity decreases (M. Ider et al., 2016). Comparing the SPR bands, it was found that 0.1 M was the optimal concentration to be used to synthesize AgNPs due to its narrow and symmetrical SPR peak compared to 0.01 M and 1 M.
The Effect of LMwLg Concentration
Figure 5 depicts the effect of LMwLg in the synthesis of silver nanoparticles.
Varying the concentration of LMwLg during the synthesis of AgNPs affects various characteristics of AgNPs, including their size, shape, yield, rate of formation, stability, and optical properties (Dikshit et al., 2021). To evaluate the effect of LMwLg on the production of AgNPs, 90 ml of 0.2, 0.4, and 0.5% w/v of LMwLg solution were mixed with 10 ml of 0.1 M AgNO3 at room temperature. From Figure 5, increasing lignin concentration from 0.2 to 0.4% w/v leads to a sharper and more defined SPR peak, indicative of uniform particle size and shape (Saratale et al., 2022; Shankar & Rhim, 2017). At higher lignin concentrations (0.5% w/v), the SPR band broadens, the intensity reduces, and there is a redshift. The intensity decreases due to the formation of larger silver nanoparticles or aggregates at higher concentrations, which reduces efficient light absorption, resulting in decreased absorbance values (Maršík et al., 2024). At higher lignin concentrations, redshift is caused by the resonance of larger nanoparticles at slightly different wavelengths, resulting in a more dispersed spectral feature (Muzamil et al., 2014) in addition to an increase in the overall refractive index of the medium surrounding the silver nanoparticles (Tanabe et al., 2020; Wang et al., 2001). The broadening of the SPR peak indicates a more heterogeneous particle distribution caused by an increase in the hydrodynamic diameter and polydispersity index (PDI) of AgNPs as well as the alteration of the electron density at the surface of the nanoparticles by the thicker lignin capping layers around the nanoparticles at higher concentrations (Hu & Hsieh, 2016; D. Li & Chen, 2024; Maršík et al., 2024). At lower lignin concentrations, the yield of silver nanoparticles is low due to insufficient capping and stabilization of the silver nanoparticles (Saratale et al., 2022). In a previous study, increasing the concentration of lignosulfonate from 0.2 mM to 1.6 mM led to an increase in intensity of the SPR band. A further increase in concentration to 2 mM, the intensity of the SPR band decreases (Saratale et al., 2022). Per our findings, 0.4% w/v of the LMwLg was chosen to optimize the next parameter.
The effect of reaction temperature
Figure 6 depicts the effect of temperature in the synthesis of silver nanoparticles.
Temperature plays a crucial role in the synthesis of silver nanoparticles as it affects the size, shape, intensity of the SPR peak, and the rate of formation of the nanoparticles (Azad et al., 2023). The rate of formation of the nanoparticles is dependent on the temperature and an increase in temperature increases the rate of reduction of silver ions and the formation of nanoparticles, increasing the intensity of the SPR peak (Prakash & Soni, 2011). The optimum reaction temperature was determined by reacting 0.4% w/v LMwLg solution with 0.1 M AgNO3 over a range of temperatures of 25 °C to 80 °C and observing the UV-Vis spectra. At higher temperatures, the reaction rate increases due to an increase in the kinetic energy of the silver ions as well as an increase in the number of effective collisions. This results to the formation of larger particles, leading to a decrease in optical density (Doan et al., 2020; Nguyen et al., 2023). From Figure 6, when the temperature is increased from 25 °C to 60 °C, the SPR band becomes narrower and the intensity increases due to an increase in the yield of AgNPs (Ansari et al., 2023). At 80 °C, a redshift (from 436 nm to 497 nm) is observed as shown in Figure 6 as well an increase in the intensity of the broad SPR band due to agglomeration of the large AgNPs formed at higher temperatures (Anbu et al., 2019). Therefore, the optimal temperature in the synthesis of AgNPs was 60 °C.
The effect of reaction time
Reaction time is one of the factors to consider during the synthesis of silver nanoparticles since the stability, size, shape and yield of the nanoparticles depends on the reaction time (Nasruddin et al., 2024). The UV-Vis spectra in Figure 7 illustrates the synthesis of AgNPs over time.
A strong absorption peak around 430 – 450 nm is observed which characteristic of the SPR peak of silver nanoparticles (Maršík et al., 2024). At 0 minutes, the absorbance is low and there is no formation of the SPR peak, an indication of no formation of silver nanoparticles (Iravani et al., 2014). As time increases, until 150 minutes, the intensity of the SPR band continually increases and becomes narrower due to the blueshift, indicating continuous formation of smaller and uniform AgNPs (Darroudi et al., 2011). After 140 minutes, there is no significant increase in the intensity of the SPR band, confirming complete formation of silver nanoparticles (Muzamil et al., 2014).
Characterization of the Synthesized Silver Nanoparticles
Bandgap and optical characteristics of AgNPs
Figure 8 shows the optical properties of silver nanoparticles including the Tauc’s plots for (a) direct transitions, and (b) indirect transitions and the UV-Vis spectra of (c) AgNPs, (d) AgNO3 and (e) LMwLg confirming the formation of AgNPs.
The electron cloud on the surface of the NPs oscillates when it absorbs electromagnetic waves of a specific frequency through a phenomenon called localized surface plasmon resonance (SPR) and is normally recorded as electromagnetic wavelengths by a UV-Vis spectrophotometer (Mat Yusuf et al., 2020). The reduction of Ag+ to Ag0 by LMwLg was monitored using a UV-Vis spectrophotometer as shown in Figure 8. In the absence of LMwLg, there is no formation of SPR band (Figure 8). Silver nanoparticles showed a SPR band at 439 nm. According to (Leyu et al., 2023), AgNPs with maximum absorbance at around 420 - 440 nm have a spherical shape and uniform distribution, implying that the produced AgNPs in this study were spherical and uniform. From Figure 8(a), the optical bandgap energy for direct transitions was found to be Eg = 2.49 eV, indicating the energy required for direct electron transitions. For indirect transitions, Eg = 1.94 eV, Figure 8(b), indicating the transitions involving phonons. These values are similar to other reported values (Daoudi et al., 2024; Mistry et al., 2021).
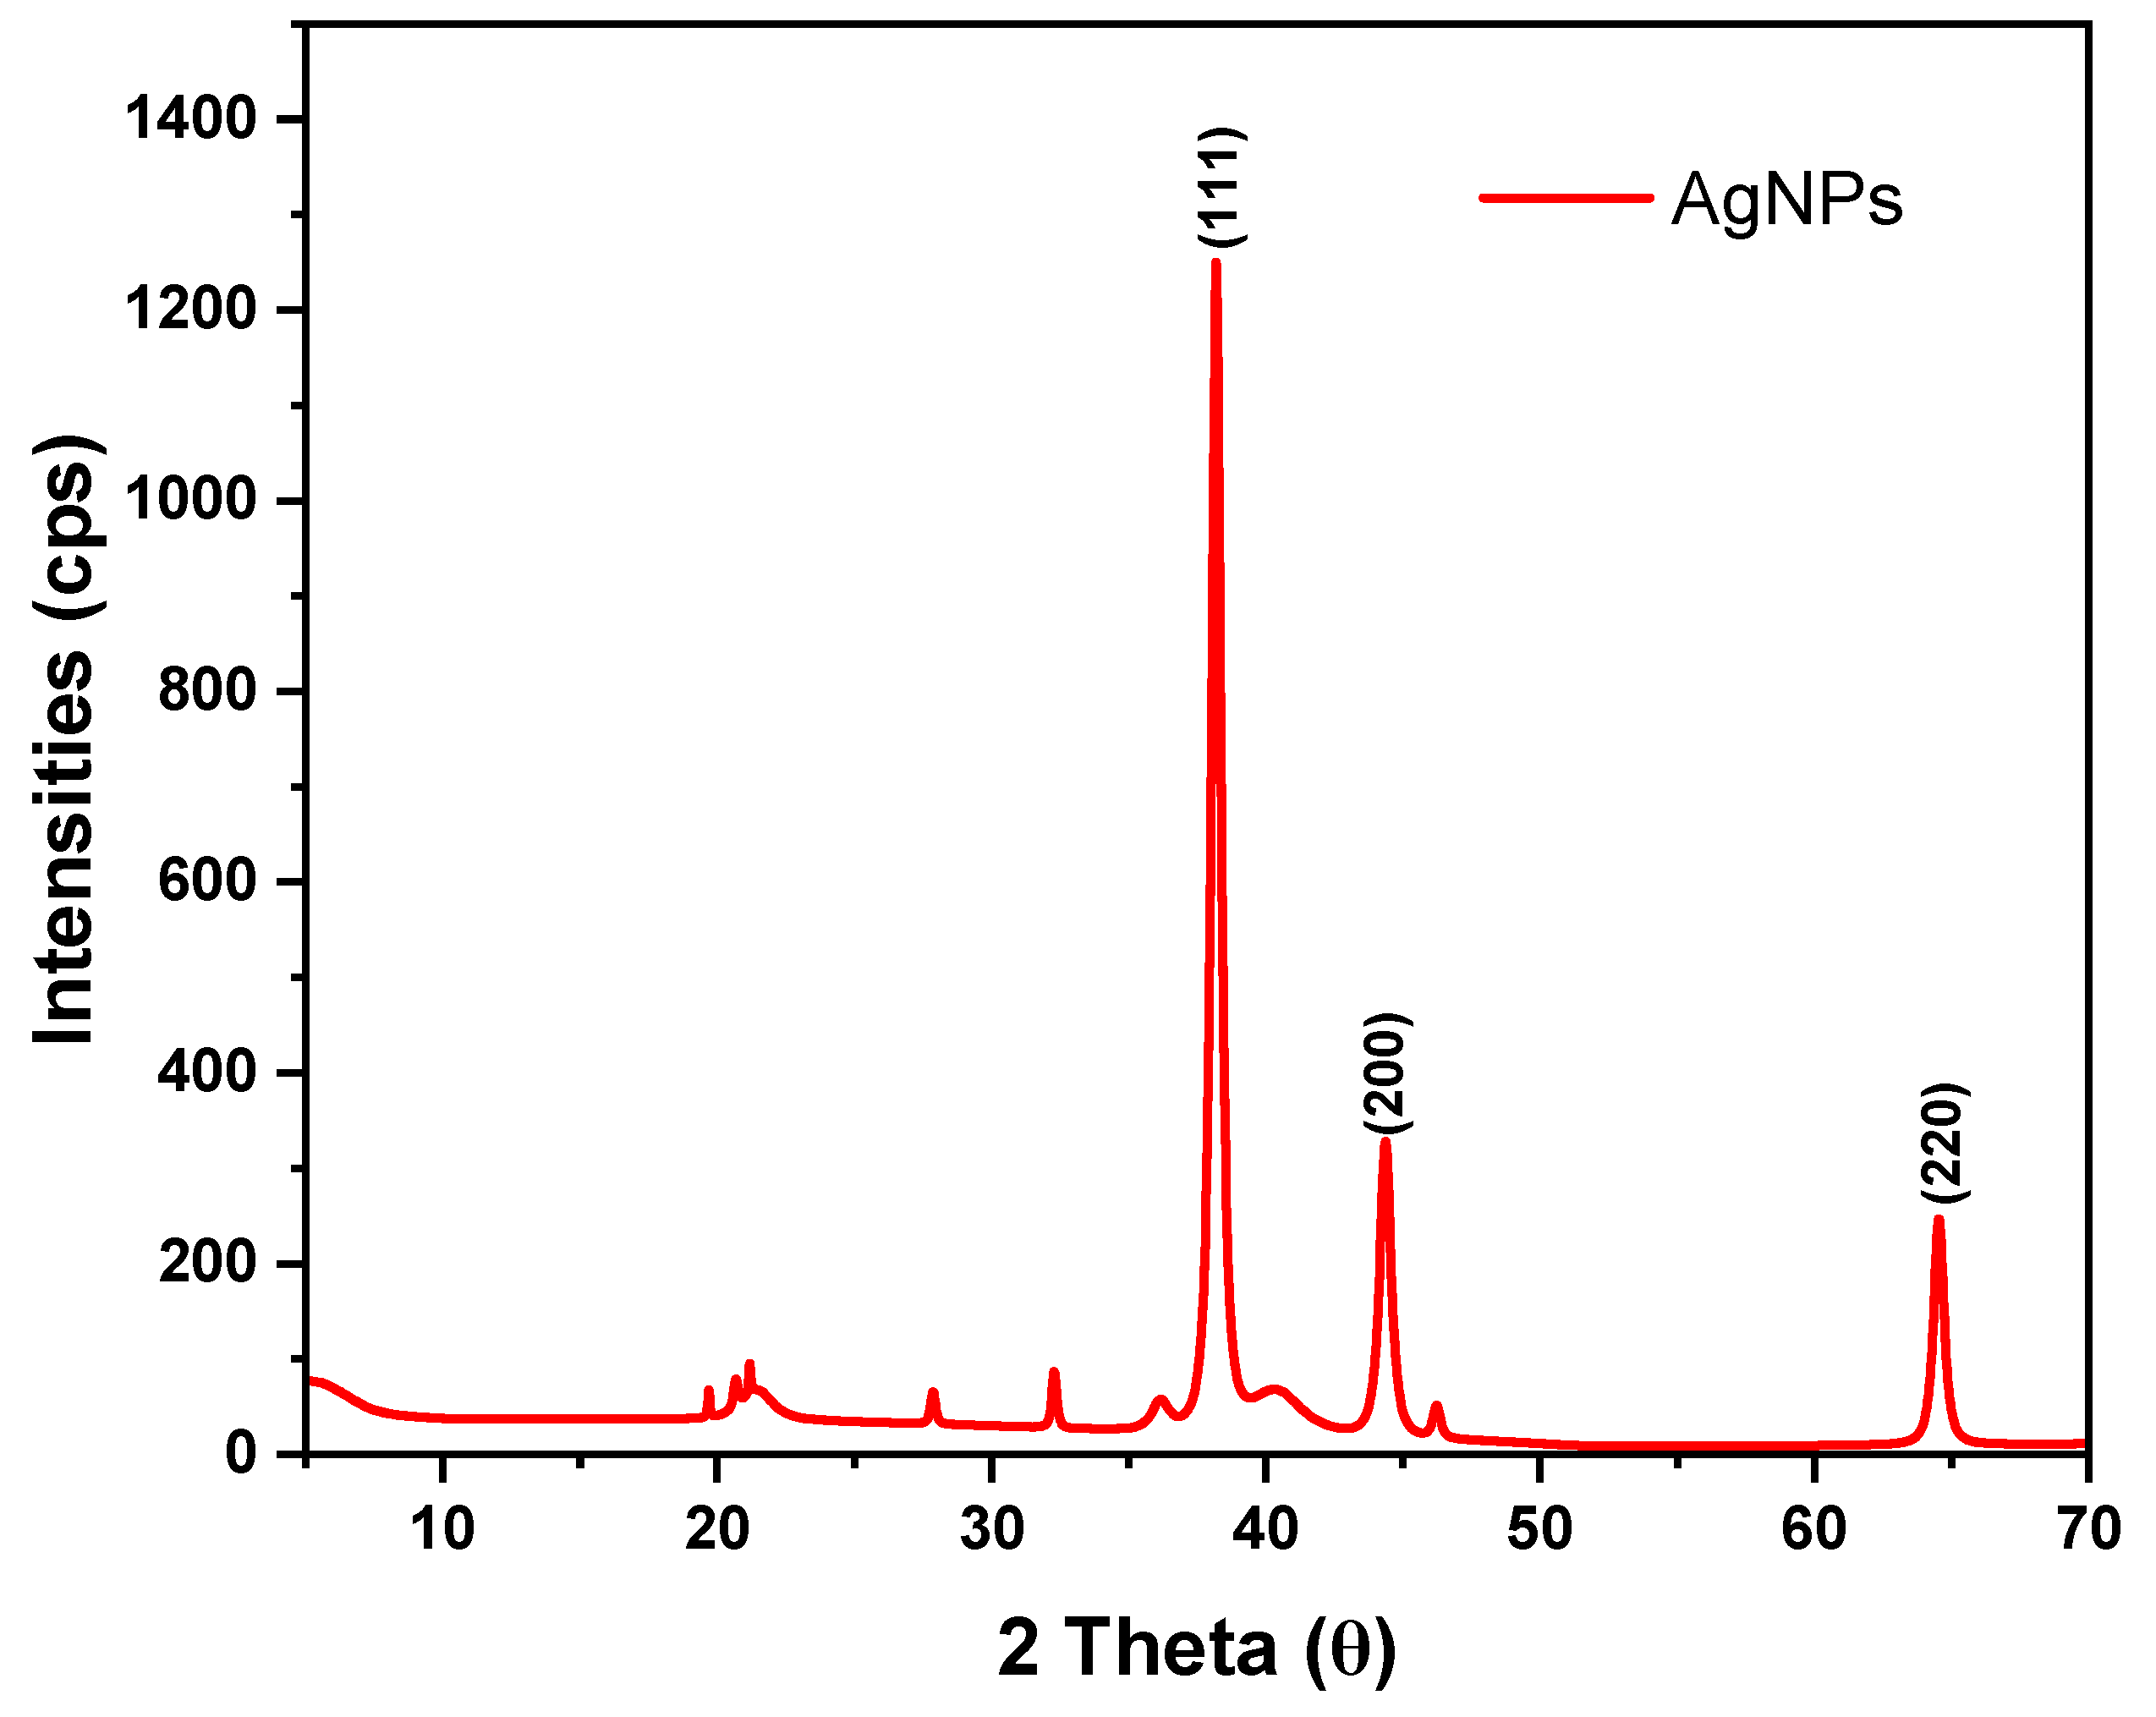
X-ray diffraction analysis
X-ray powder diffraction (XRD) was used to determine the crystallinity and phase identification of AgNPs as shown in Figure 10.
| 2θ (°) | β (radians) | hkl | d-spacing (Å) | D (nm) |
| 38.2282 | 0.00698132 | 111 | 2.3524 | 21.0388 |
| 44.4008 | 0.00837758 | 200 | 2.0386 | 17.892 |
| 64.5868 | 0.007679449 | 220 | 1.4418 | 21.3787 |
In this work, three distinct peaks were observed at 2θ of 38.23°, 44.40°, and 64.59°, corresponding to crystal planes (111), (200), and (220) respectively that are typical for a face-centered cubic structure (Space group: F m -3 m (225)). The values match the standard data (JCPDS Card No 04-0783). The interplanar spacing of the diffractograms at 2θ of 38.23°, 44.40°, and 64.59°, were 2.3524Å, 2.0386Å, and 1.4418Å respectively. The obtained XRD data agree with earlier findings (Daoudi et al., 2024; Doan et al., 2020; Saratale et al., 2022).
TEM Analysis
Transmission electron micrographs were used to determine the size and morphology of AgNPs as shown in Figure 11(a–d).
TEM image of AgNPs at different magnification of 20 nm, 50 nm, and 100 nm showed that AgNPs are spherical and monodispersed, Figure 11(a–c). A histogram is a bar graph that illustrates the frequency of occurrence against the particle size. Figure 11(d) is a histogram representing the particle size distribution of silver nanoparticles. The mean particle size was 20.81 nm which was close but slightly higher than the particle size obtained from XRD analysis (20.1 nm). This difference is due to the fact that XRD measures the crystallite size of crystallites that contribute to XRD peak broadening while TEM measures the overall particle size including the amorphous regions and the surface regions that don’t necessarily contribute to XRD peak broadening (Gorimbo et al., 2024; Rabiei et al., 2020).
EDX Analysis
Energy dispersive X-ray spectroscopy (EDX) is a technique that is used to analyze near surface elements as well estimate their composition (Lin et al., 2014).
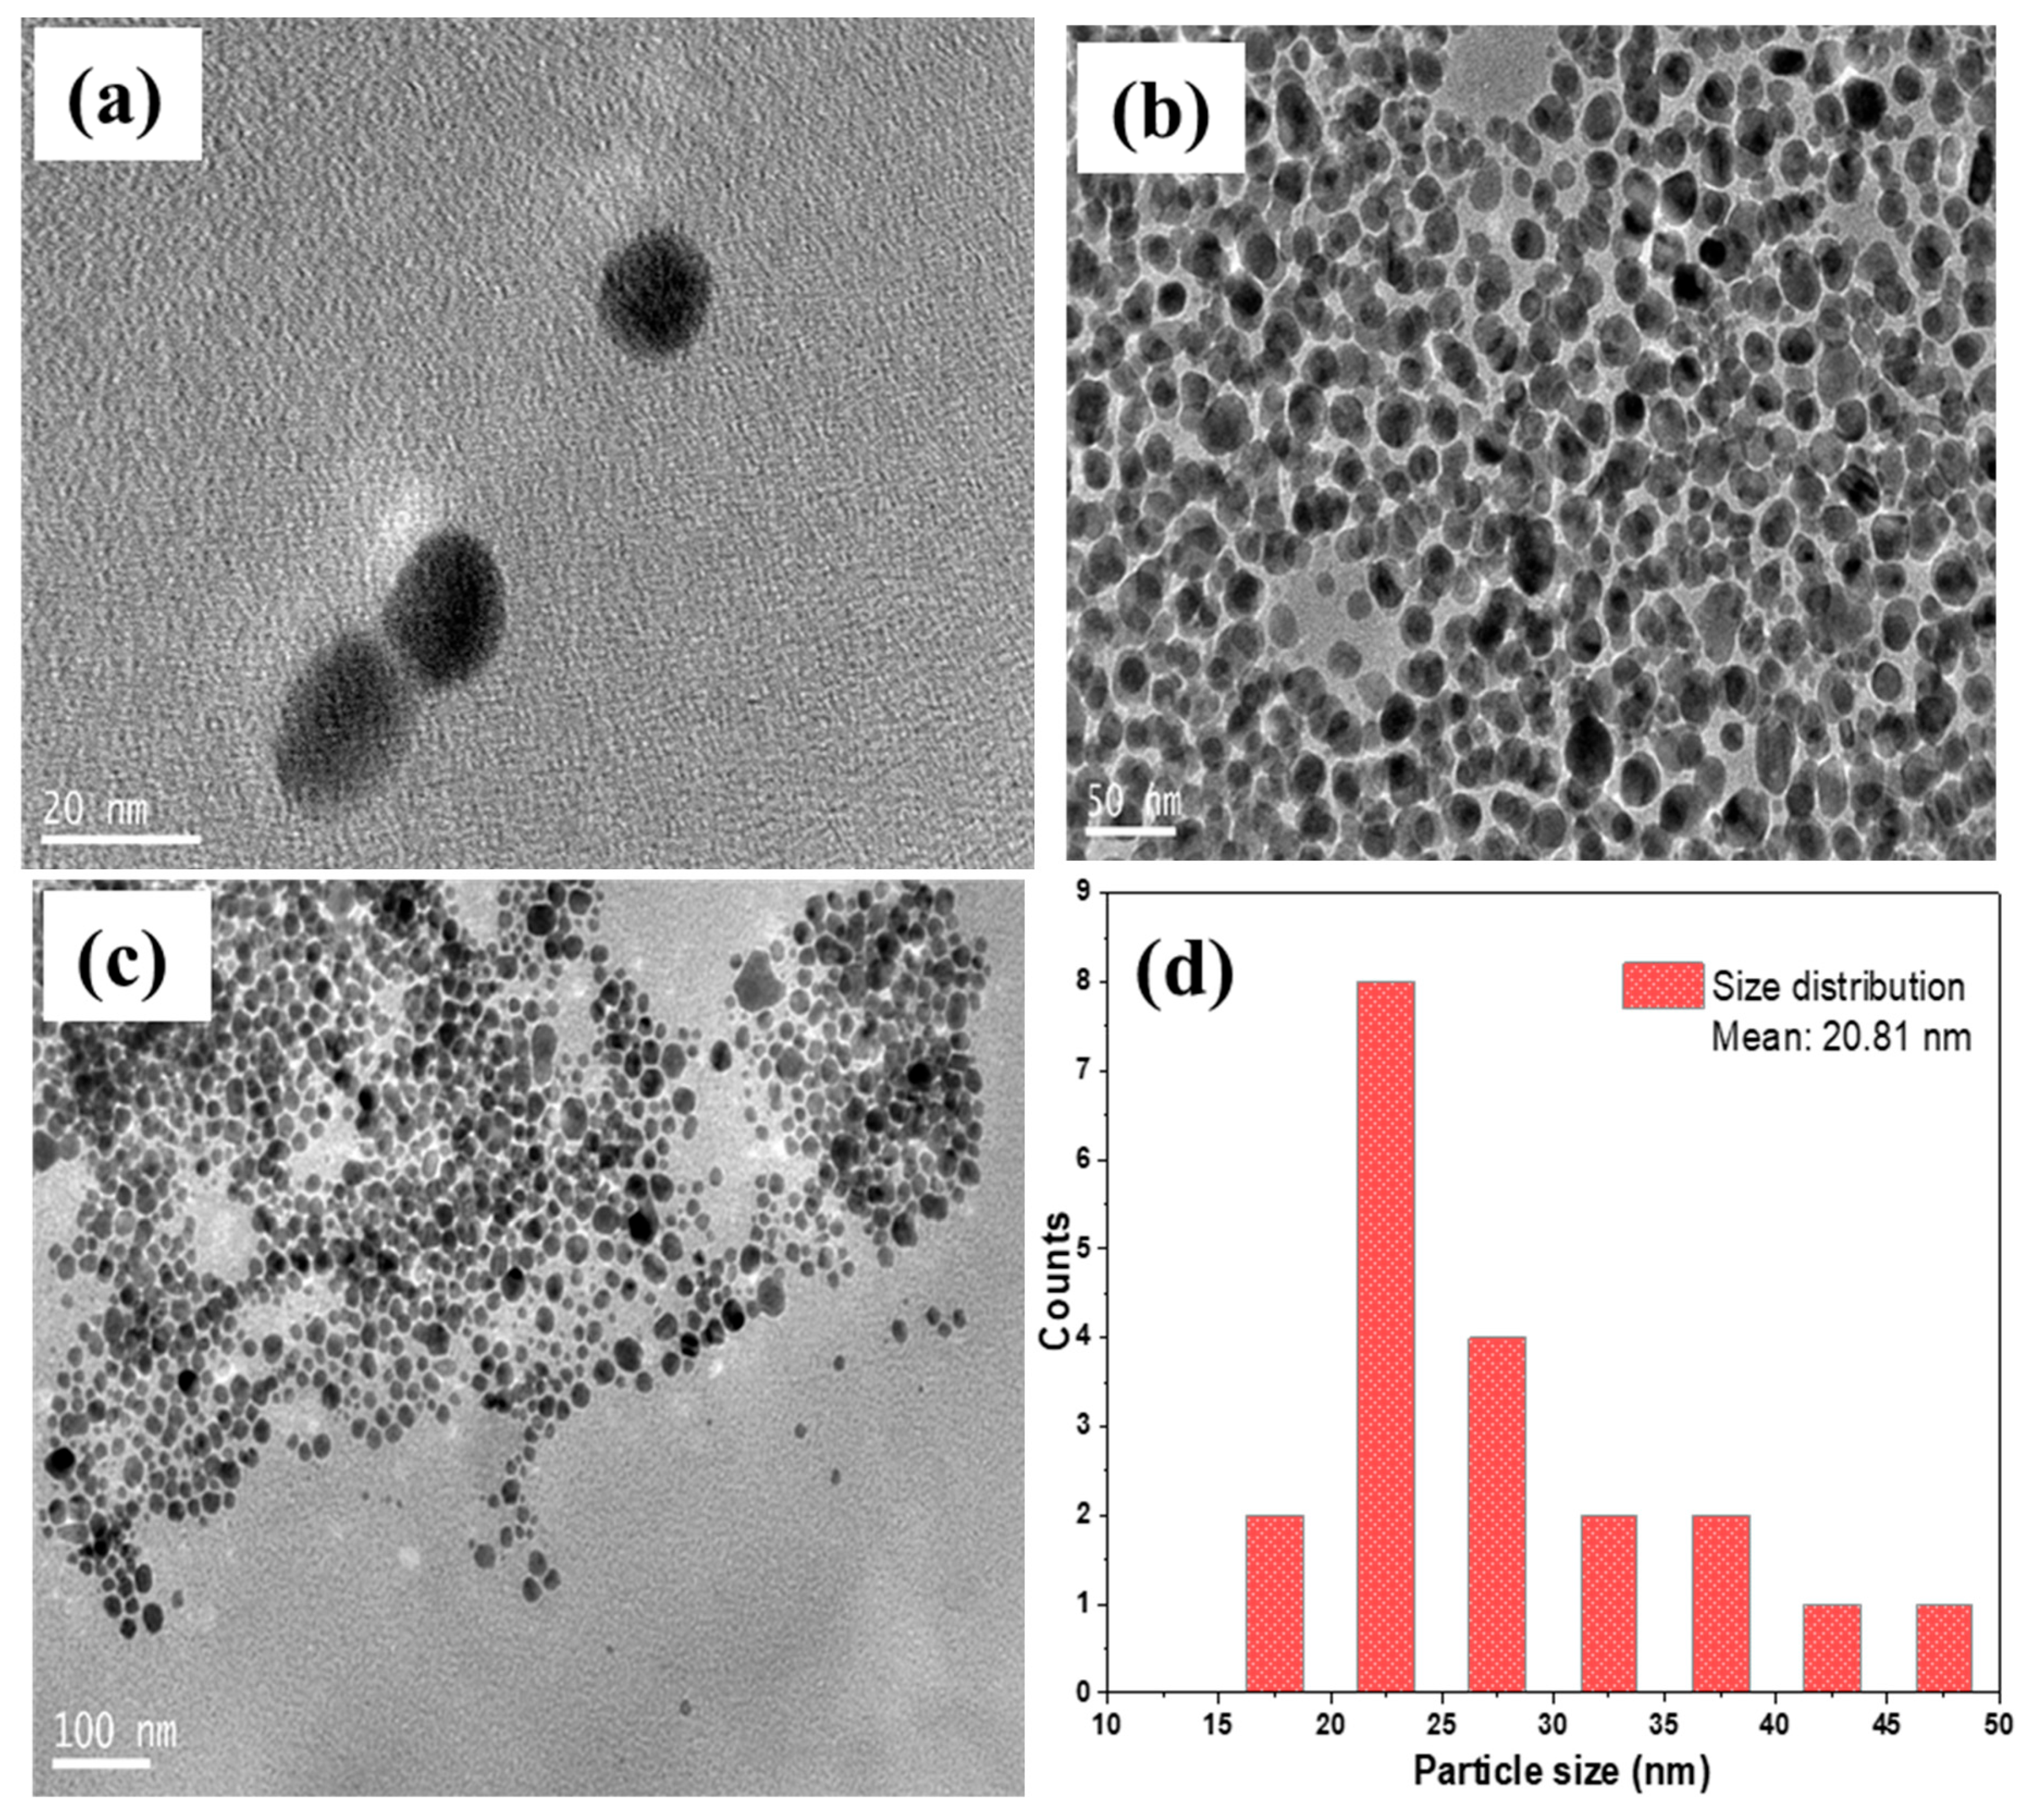
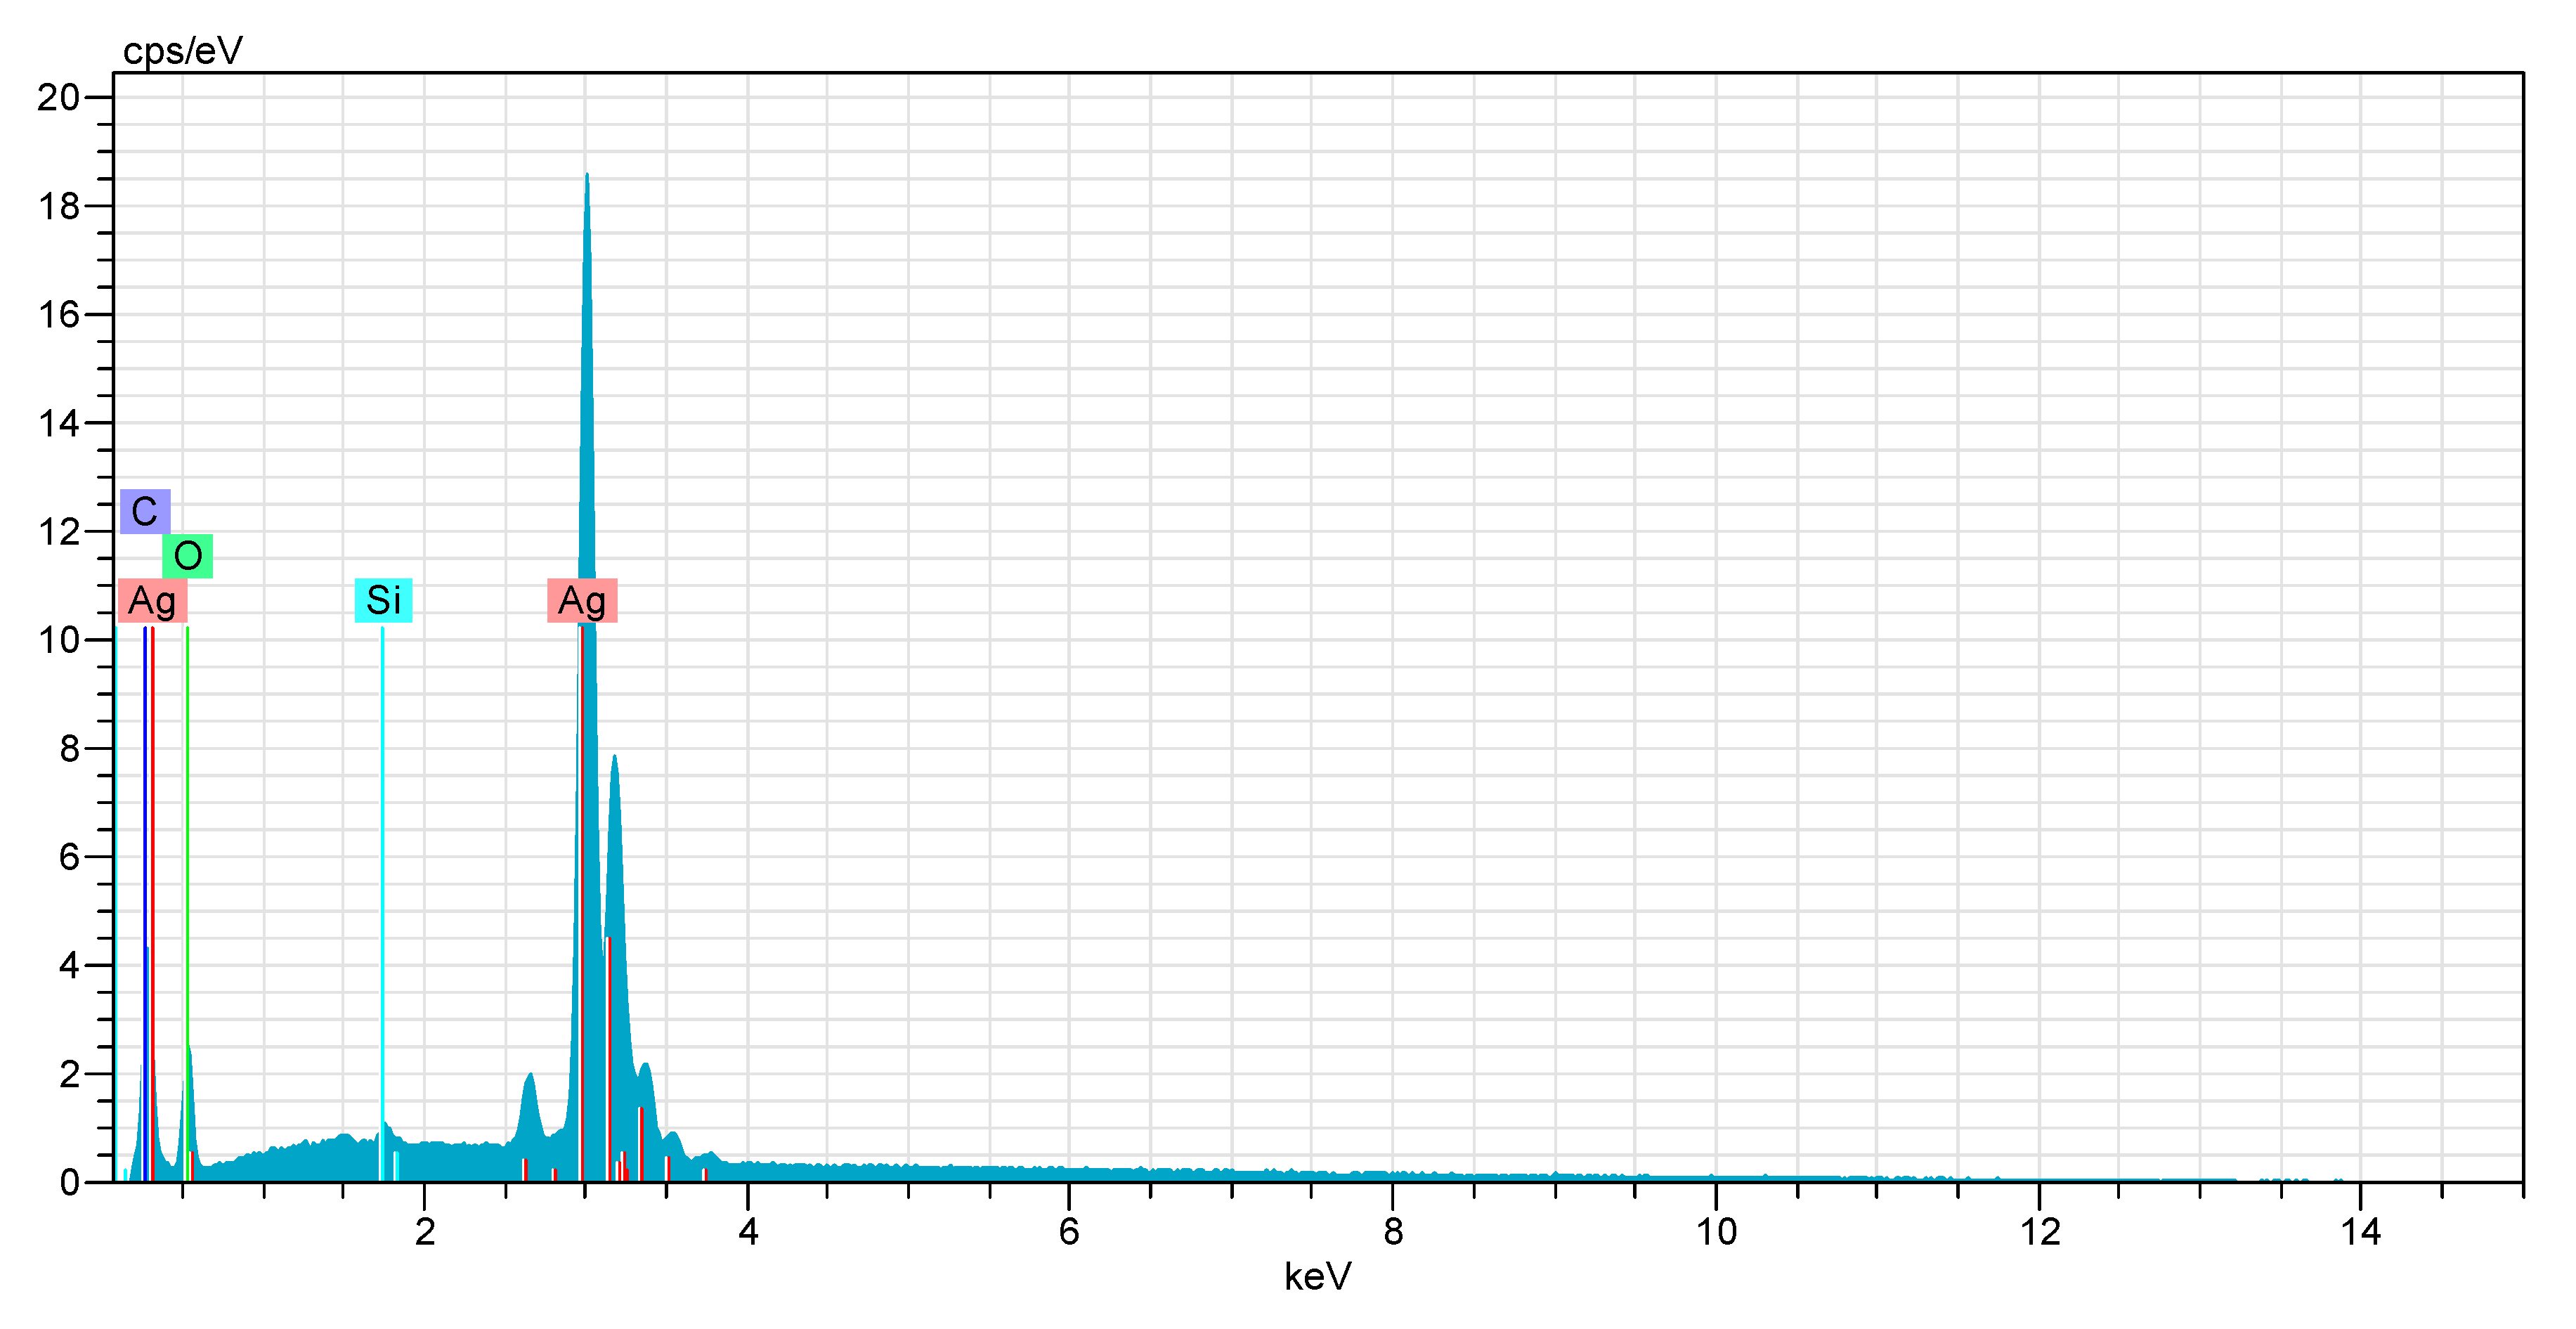
Figure 11.
TEM images of AgNPs showing their morphology at different magnifications, (a) 20 nm, (b) 50 nm, and (c) 100 nm. (d) is the histogram representing particle size distribution of AgNPs.
Figure 11.
TEM images of AgNPs showing their morphology at different magnifications, (a) 20 nm, (b) 50 nm, and (c) 100 nm. (d) is the histogram representing particle size distribution of AgNPs.
Figure 12.
EDX analysis of AgNPs.
| El | AN | Series | unn.C% | norm.C% | Atom. % | Error % |
| Ag | 47 | L | 78.46 | 77.66 | 33.05 | 2.7 |
| C | 6 | K | 3.47 | 3.44 | 13.13 | 0.7 |
| Si | 14 | K | 0.33 | 0.33 | 0.54 | 0.2 |
| O | 8 | K | 18.76 | 18.57 | 53.28 | 3.8 |
The elemental composition of silver nanoparticles was determined using EDX, which confirmed the presence of silver, carbon, oxygen, and silicon. The intense peak at 3.0 keV was attributed to silver (Daoudi et al., 2024). High weight (78%) and atomic (33%) show silver is the major constituent of the sample. The relatively low error suggests good signal quality. The presence of oxygen confirms that silver is embedded in an oxygenated matrix, as lignin contains phenol groups that contain oxygen.
Conclusions
In conclusion, the successful synthesis of silver nanoparticles using low molecular weight lignin confirmed the successful fractionation of lignin and its potential as a reducing and capping agent for nanoparticle synthesis. The optimum parameters to obtain uniform and stable silver nanoparticles were 60 °C, 140 mins, 0.1 M AgNO3, and 0.4% w/v LMwLg. The position of the SPR peak at 436 nm confirmed that the synthesized nanoparticles were silver. TEM and XRD results confirmed the average size of the nanoparticles to be 20 nm. EDX analysis confirmed the nanoparticles were mainly composed of silver.
Ethical Review
This study did not involve any human or animal testing.
Data Availability
All data gathered in the scope of the study are embedded within the manuscript.
Funding
This work was supported by Africa-ai-Japan of Jomo Kenyatta University of Agriculture and Technology.
Acknowledgement
The authors are grateful for support and access to equipment facilities from Jomo Kenyatta University of Agriculture and Technology, Gifu University, and the University of Jyväskylä.
Conflict of Interest
The authors have no relevant financial or non-financial interests to disclose.
References
- Agnihotri, S. , Mukherji, S., & Mukherji, S. (2013). Immobilized silver nanoparticles enhance contact killing and show highest efficacy: Elucidation of the mechanism of bactericidal action of silver. In Nanoscale (Vol. 5, Issue 16, pp. 7328–7340). [CrossRef]
- Alazaiza, M. Y. D. , Albahnasawi, A., Ali, G. A. M., Bashir, M. J. K., Copty, N. K., Amr, S. S. A., Abushammala, M. F. M., & Al Maskari, T. (2021). Recent advances of nanoremediation technologies for soil and groundwater remediation: A review. In Water (Switzerland) (Vol. 13, Issue 16). MDPI. [CrossRef]
- Alim-Al-Razy, M. , Bayazid, G. M. A., Rahman, R. U., Bosu, R., & Shamma, S. S. (2020). Silver nanoparticle synthesis, UV-Vis spectroscopy to find particle size and measure resistance of colloidal solutions. Journal of Physics: Conference Series, 1706(1). [CrossRef]
- Anbu, P. , Gopinath, S. C. B., Yun, H. S., & Lee, C. G. (2019). Temperature-dependent green biosynthesis and characterization of silver nanoparticles using balloon flower plants and their antibacterial potential Journal of Molecular Structure, 1177, 302–309. [CrossRef]
- Ansari, M. , Ahmed, S., Abbasi, A., Khan, M. T., Subhan, M., Bukhari, N. A., Hatamleh, A. A., & Abdelsalam, N. R. (2023). Plant mediated fabrication of silver nanoparticles, process optimization, and impact on tomato plant. Scientific Reports, 13(1). [CrossRef]
- Azad, A. , Zafar, H., Raza, F., & Sulaiman, M. (2023). Factors Influencing the Green Synthesis of Metallic Nanoparticles Using Plant Extracts: A Comprehensive Review. Pharmaceutical Fronts, 05(03), e117–e131. [CrossRef]
- Barapatre, A. , Aadil, K. R., & Jha, H. (2016). Synergistic antibacterial and antibiofilm activity of silver nanoparticles biosynthesized by lignin-degrading fungus. Bioresources and Bioprocessing, 3(1). [CrossRef]
- Bindhu, M. R. , & Umadevi, M. (2014). Surface plasmon resonance optical sensor and antibacterial activities of biosynthesized silver nanoparticles. Spectrochimica Acta Part A: Molecular and Biomolecular Spectroscopy, 121, 596–604. [CrossRef]
- Colyar, K. R. , Pellegrino, J., & Kadam, K. (2008). Fractionation of pre-hydrolysis products from lignocellulosic biomass by an ultrafiltration ceramic tubular membrane. Separation Science and Technology, 43(3), 447–476. [CrossRef]
- Daoudi, H. , Bouafia, A., Laouini, S. E., Meneceur, S., Fellah, M., Iqbal, A., El-Hiti, G. A., & Selmi, B. (2024). In vitro and in silico study of biosynthesized silver nanoparticles using Nigella sativa extract against SARS-CoV-2 and Candida albicans. Journal of Molecular Liquids, 405, 125059. [CrossRef]
- Darroudi, M. , Ahmad, M. Bin, Zamiri, R., Zak, A. K., Abdullah, A. H., & Ibrahim, N. A. (2011). Time-dependent effect in green synthesis of silver nanoparticles. International Journal of Nanomedicine, 6(1), 677–681. [CrossRef]
- Dikshit, P. K. , Kumar, J., Das, A. K., Sadhu, S., Sharma, S., Singh, S., Gupta, P. K., & Kim, B. S. (2021). Green synthesis of metallic nanoparticles: Applications and limitations. In Catalysts (Vol. 11, Issue 8). MDPI. [CrossRef]
- Doan, V. D., Huynh, B. A., Nguyen, T. D., Cao, X. T., Nguyen, V. C., Nguyen, T. L. H., Nguyen, H. T., & Le, V. T. (2020). Biosynthesis of Silver and Gold Nanoparticles Using Aqueous Extract of Codonopsis pilosula Roots for Antibacterial and Catalytic Applications. Journal of Nanomaterials, 2020. [CrossRef]
- Farooq, M. , Zou, T., Riviere, G., Sipponen, M. H., & Österberg, M. (2019). Strong, Ductile, and Waterproof Cellulose Nanofibril Composite Films with Colloidal Lignin Particles. Biomacromolecules 20, 693–704. [CrossRef] [PubMed]
- Gorimbo, J. , Chikati, R., Khangale, P., Beas, I. N., Mguni, L. L., & Nkazi, D. (2024). Debunking the impact of crystallite/particle size in cobalt-based Fischer-Tropsch synthesis. In Chemical Engineering Communications (Vol. 211, Issue 8, pp. 1262–1287). Taylor and Francis Ltd. [CrossRef]
- Hu, S. , & Hsieh, Y. Lo. (2016). Silver nanoparticle synthesis using lignin as reducing and capping agents: A kinetic and mechanistic study. International Journal of Biological Macromolecules, 82, 856–862. [CrossRef]
- Iravani, S. , Korbekandi, H., Mirmohammadi, S. V, & Zolfaghari, B. (2014). Synthesis of silver nanoparticles: chemical, physical and biological methods. In Research in Pharmaceutical Sciences (Vol. 9, Issue 6).
- Jiang, Z. , Han, X., Zhao, C., Wang, S., & Tang, X. (2022). Recent Advance in Biological Responsive Nanomaterials for Biosensing and Molecular Imaging Application. In International Journal of Molecular Sciences (Vol. 23, Issue 3). MDPI. [CrossRef]
- Kalidas Sivaraman, S. , Elango, I., Kumar, S., & Santhanam, V. (2009). A green protocol for room temperature synthesis of silver nanoparticles in seconds. In CURRENT SCIENCE (Vol. 97, Issue 7).
- Kilpeläinen, I. , Xie, H., King, A., Granstrom, M., Heikkinen, S., & Argyropoulos, D. S. (2007). Dissolution of wood in ionic liquids. Journal of Agricultural and Food Chemistry 55, 9142–9148. [CrossRef] [PubMed]
- K.J. Laidler, E.T. K.J. Laidler, E.T. Denisov, W.C. Purdy, B.A. Thrush, & J. Villermaux. (1996). A glossary of terms used in chemical kinetics, including reaction dynamics, Pure Appl. Chem. In Pure & Appl. Chem (Vol. 68, Issue 1).
- Leyu, A. M. , Debebe, S. E., Bachheti, A., Rawat, Y. S., & Bachheti, R. K. (2023). Green Synthesis of Gold and Silver Nanoparticles Using Invasive Alien Plant Parthenium hysterophorus and Their Antimicrobial and Antioxidant Activities. Sustainability (Switzerland),15(12). [CrossRef]
- Li, D. , & Chen, L. (2024). Solvent-Induced Lignin Conformation Changes Affect Synthesis and Antibacterial Performance of Silver Nanoparticle Nanomaterials, 14(11). [CrossRef]
- Li, M. , Jiang, X., Wang, D., Xu, Z., & Yang, M. (2019). In situ reduction of silver nanoparticles in the lignin based hydrogel for enhanced antibacterial application. Colloids and Surfaces B: Biointerfaces 177, 370–376. [CrossRef]
- Li, P., Lv, W., & Ai, S. (2016). Green and gentle synthesis of Cu2O nanoparticles using lignin as reducing and capping reagent with antibacterial properties. Journal of Experimental Nanoscience, 11(1), 18–27. [CrossRef]
- Lin, P. C. , Lin, S., Wang, P. C., & Sridhar, R. (2014). Techniques for physicochemical characterization of nanomaterials. In Biotechnology Advances (Vol. 32, Issue 4, pp. 711–726). Elsevier Inc. [CrossRef]
- M. Ider, K. Abderrafi, A. Eddahbi, S. Ouaskit, & A. Kassiba. (2016). Silver Metallic Nanoparticles with Surface PlasmonResonance Synthesis and Characterizations. Journal of Cluster ScienceIncluding Nanoclusters AndNanoparticles, 27(5).
- Madivoli, E. S., Wanakai, S. I., Kairigo, P. K., & Odhiambo, R. S. (2023). Encapsulation of AgNPs in a Lignin Isocyanate Film: Characterization and Antimicrobial Properties. Materials, 16(12). [CrossRef]
- Madivoli, E., Wanakai, S. I., Kairigo, P. K., & Odhiambo, R. S. (2023). Encapsulation of AgNPs in a Lignin Isocyanate Film: Characterization and Antimicrobial Properties. Materials, 16(12). [CrossRef]
- Margarida Martins, M., Carvalheiro, F., & Gírio, F. (2024). An overview of lignin pathways of valorization: from isolation to refining and conversion into value-added products. In Biomass Conversion and Biorefinery (Vol. 14, Issue 3, pp. 3183–3207). Springer Science and Business Media Deutschland GmbH. [CrossRef]
- Maršík, D., Thoresen, P. P., Maťátková, O., Masák, J., Sialini, P., Rova, U., Tsikourkitoudi, V., Christakopoulos, P., Matsakas, L., & Jarošová Kolouchová, I. (2024). Synthesis and Characterization of Lignin-Silver Nanoparticles. Molecules, 29(10). [CrossRef]
- Mat Yusuf, S. N. A. , Che Mood, C. N. A., Ahmad, N. H., Sandai, D., Lee, C. K., & Lim, V. (2020). Optimization of biogenic synthesis of silver nanoparticles from flavonoid-rich Clinacanthus nutans leaf and stem aqueous extracts. Royal Society Open Science, 7(7). [CrossRef]
- Mistry, H., Thakor, R., Patil, C., Trivedi, J., & Bariya, H. (2021). Biogenically proficient synthesis and characterization of silver nanoparticles employing marine procured fungi Aspergillus brunneoviolaceus along with their antibacterial and antioxidative potency. Biotechnology Letters, 43(1), 307–316. [CrossRef]
- Morsali, M., Moreno, A., Loukovitou, A., Pylypchuk, I., & Sipponen, M. H. (2022). Stabilized Lignin Nanoparticles for Versatile Hybrid and Functional Nanomaterials. Biomacromolecules, 23(11), 4597–4606. [CrossRef]
- Mujtaba, M., Fernandes Fraceto, L., Fazeli, M., Mukherjee, S., Savassa, S. M., Araujo de Medeiros, G., do Espírito Santo Pereira, A., Mancini, S. D., Lipponen, J., & Vilaplana, F. (2023). Lignocellulosic biomass from agricultural waste to the circular economy: a review with focus on biofuels, biocomposites and bioplastics. Journal of Cleaner Production, 402, 136815. [CrossRef]
- Muzamil, M., Khalid, N., Aziz, M. D., & Abbas, S. A. (2014). Synthesis of silver nanoparticles by silver salt reduction and its characterization. IOP Conference Series: Materials Science and Engineering, 60(1). [CrossRef]
- Nakamura, T., Magara, H., Herbani, Y., & Sato, S. (2011). Fabrication of silver nanoparticles by highly intense laser irradiation of aqueous solution. Applied Physics A: Materials Science and Processing, 104(4), 1021–1024. [CrossRef]
- Nasruddin, N. A., Ithnin, N. R., Othman, H. B., Iffah Binti Abu Hasan, Z., & Misni, N. (2024). Green Synthesis of Silver Nanoparticles using Aqueous Fruit Peel Extract of Citrus aurantifolia: Optimization, Its Characterization and Stability Test. Sains Malaysiana, 53(5), 1119–1131. [CrossRef]
- Nazeruddin, G. M., Prasad, N. R., Waghmare, S. R., Garadkar, K. M., & Mulla, I. S. (2014). Extracellular biosynthesis of silver nanoparticle using Azadirachta indica leaf extract and its anti-microbial activity. Journal of Alloys and Compounds, 583, 272–277. [CrossRef]
- Nguyen, N. P. U., Dang, N. T., Doan, L., & Nguyen, T. T. H. (2023). Synthesis of Silver Nanoparticles: From Conventional to ‘Modern’ Methods—A Review. In Processes (Vol. 11, Issue 9). Multidisciplinary Digital Publishing Institute (MDPI). [CrossRef]
- Nigam, S., Das, A. K., & Patidar, M. K. (2021a). Valorization of Parthenium hysterophorus weed for cellulose extraction and its application for bioplastic preparation. Journal of Environmental Chemical Engineering, 9(4), 105424. [CrossRef]
- Nigam, S., Das, A. K., & Patidar, M. K. (2021b). Valorization of Parthenium hysterophorus weed for cellulose extraction and its application for bioplastic preparation. Journal of Environmental Chemical Engineering, 9(4), 105424. [CrossRef]
- Nur, S. U., Anung, P., Enny, L., Endang, S., Hotman, L., Triani, W., & Siska, F. (2018). Special Issue II) August (2018) Res. In Research Journal of Chemistry and Environment_______________________________Vol (Vol. 22).
- Pang, T., Wang, G., Sun, H., Sui, W., & Si, C. (2021). Lignin fractionation: Effective strategy to reduce molecule weight dependent heterogeneity for upgraded lignin valorization. Industrial Crops and Products, 165(29), 113442. [CrossRef]
- Prakash, S., & Soni, N. (2011). Factors Affecting the Geometry of Silver Nanoparticles Synthesis in Chrysosporium Tropicum and Fusarium Oxysporum. American Journal of Nanotechnology, 2(1), 112–121.
- Rabiei, M., Palevicius, A., Monshi, A., Nasiri, S., Vilkauskas, A., & Janusas, G. (2020). Comparing methods for calculating nano crystal size of natural hydroxyapatite using X-ray diffraction. Nanomaterials, 10(9), 1–21. [CrossRef]
- Raveendran, P., Fu, J., & Wallen, S. L. (2003). Completely “Green” Synthesis and Stabilization of Metal Nanoparticles. Journal of the American Chemical Society, 125(46), 13940–13941. [CrossRef]
- Saito, T., Perkins, J. H., Vautard, F., Meyer, H. M., Messman, J. M., Tolnai, B., & Naskar, A. K. (2014). Methanol fractionation of softwood Kraft lignin: Impact on the lignin properties. ChemSusChem, 7(1), 221–228. [CrossRef]
- Sammons, R. J., Harper, D. P., Labbé, N., Bozell, J. J., Elder, T., & Rials, T. G. (2013). Characterization of organosolv lignins using thermal and FT-IR spectroscopic analysis. BioResources, 8(2), 2752–2767. [CrossRef]
- Saratale, R. G., Cho, S. K., Saratale, G. D., Kadam, A. A., Ghodake, G. S., Magotra, V. K., Kumar, M., Bharagava, R. N., Varjani, S., Palem, R. R., Mulla, S. I., Kim, D. S., & Shin, H. S. (2022). Lignin-Mediated Silver Nanoparticle Synthesis for Photocatalytic Degradation of Reactive Yellow 4G and In Vitro Assessment of Antioxidant, Antidiabetic, and Antibacterial Activities. Polymers, 14(3). [CrossRef]
- Shah, M. Z., Guan, Z. H., Din, A. U., Ali, A., Rehman, A. U., Jan, K., Faisal, S., Saud, S., Adnan, M., Wahid, F., Alamri, S., Siddiqui, M. H., Ali, S., Nasim, W., Hammad, H. M., & Fahad, S. (2021). Synthesis of silver nanoparticles using Plantago lanceolata extract and assessing their antibacterial and antioxidant activities. Scientific Reports, 11(1). [CrossRef]
- Shankar, S., & Rhim, J. W. (2017). Preparation and characterization of agar/lignin/silver nanoparticles composite films with ultraviolet light barrier and antibacterial properties. Food Hydrocolloids, 71, 76–84. [CrossRef]
- Slavin, Y. N., Ivanova, K., Hoyo, J., Perelshtein, I., Owen, G., Haegert, A., Lin, Y. Y., Lebihan, S., Gedanken, A., Häfeli, U. O., Tzanov, T., & Bach, H. (2021). Novel Lignin-Capped Silver Nanoparticles against Multidrug-Resistant Bacteria. ACS Applied Materials and Interfaces, 13(19), 22098–22109. [CrossRef]
- Sun, R. C., & Tomkinson, J. (2001). Fractional separation and physico-chemical analysis of lignins from the black liquor of oil palm trunk fibre pulping. Separation and Purification Technology, 24(3), 529–539. [CrossRef]
- Tanabe, I., Tanaka, Y. Y., Watari, K., Inami, W., Kawata, Y., & Ozaki, Y. (2020). Enhanced Surface Plasmon Resonance Wavelength Shifts by Molecular Electronic Absorption in Far- and Deep-Ultraviolet Regions. Scientific Reports, 10(1). [CrossRef]
- Toledano, A., García, A., Mondragon, I., & Labidi, J. (2010). Lignin separation and fractionation by ultrafiltration. Separation and Purification Technology, 71(1), 38–43. [CrossRef]
- Velgosová, O., Mražíková, A., & Marcinčáková, R. (2016). Influence of pH on green synthesis of Ag nanoparticles. Materials Letters, 180, 336–339. [CrossRef]
- Wang, S., Boussaad, S., & Tao, N. J. (2001). Surface plasmon resonance enhanced optical absorption spectroscopy for studying molecular adsorbates. Review of Scientific Instruments, 72(7), 3055–3060. [CrossRef]
- Zhang, H., Bai, Y., Yu, B., Liu, X., & Chen, F. (2017). A practicable process for lignin color reduction: Fractionation of lignin using methanol/water as a solvent. Green Chemistry, 19(21), 5152–5162. [CrossRef]
- Zhao, J., Xiuwen, W., Hu, J., Liu, Q., Shen, D., & Xiao, R. (2014). Thermal degradation of softwood lignin and hardwood lignin by TG-FTIR and Py-GC/MS. Polymer Degradation and Stability, 108, 133–138. [CrossRef]
Figure 1.
Lignin isolation from black liquor after alkaline treatment of Parthenium hysterophorus biomass .
Figure 1.
Lignin isolation from black liquor after alkaline treatment of Parthenium hysterophorus biomass .
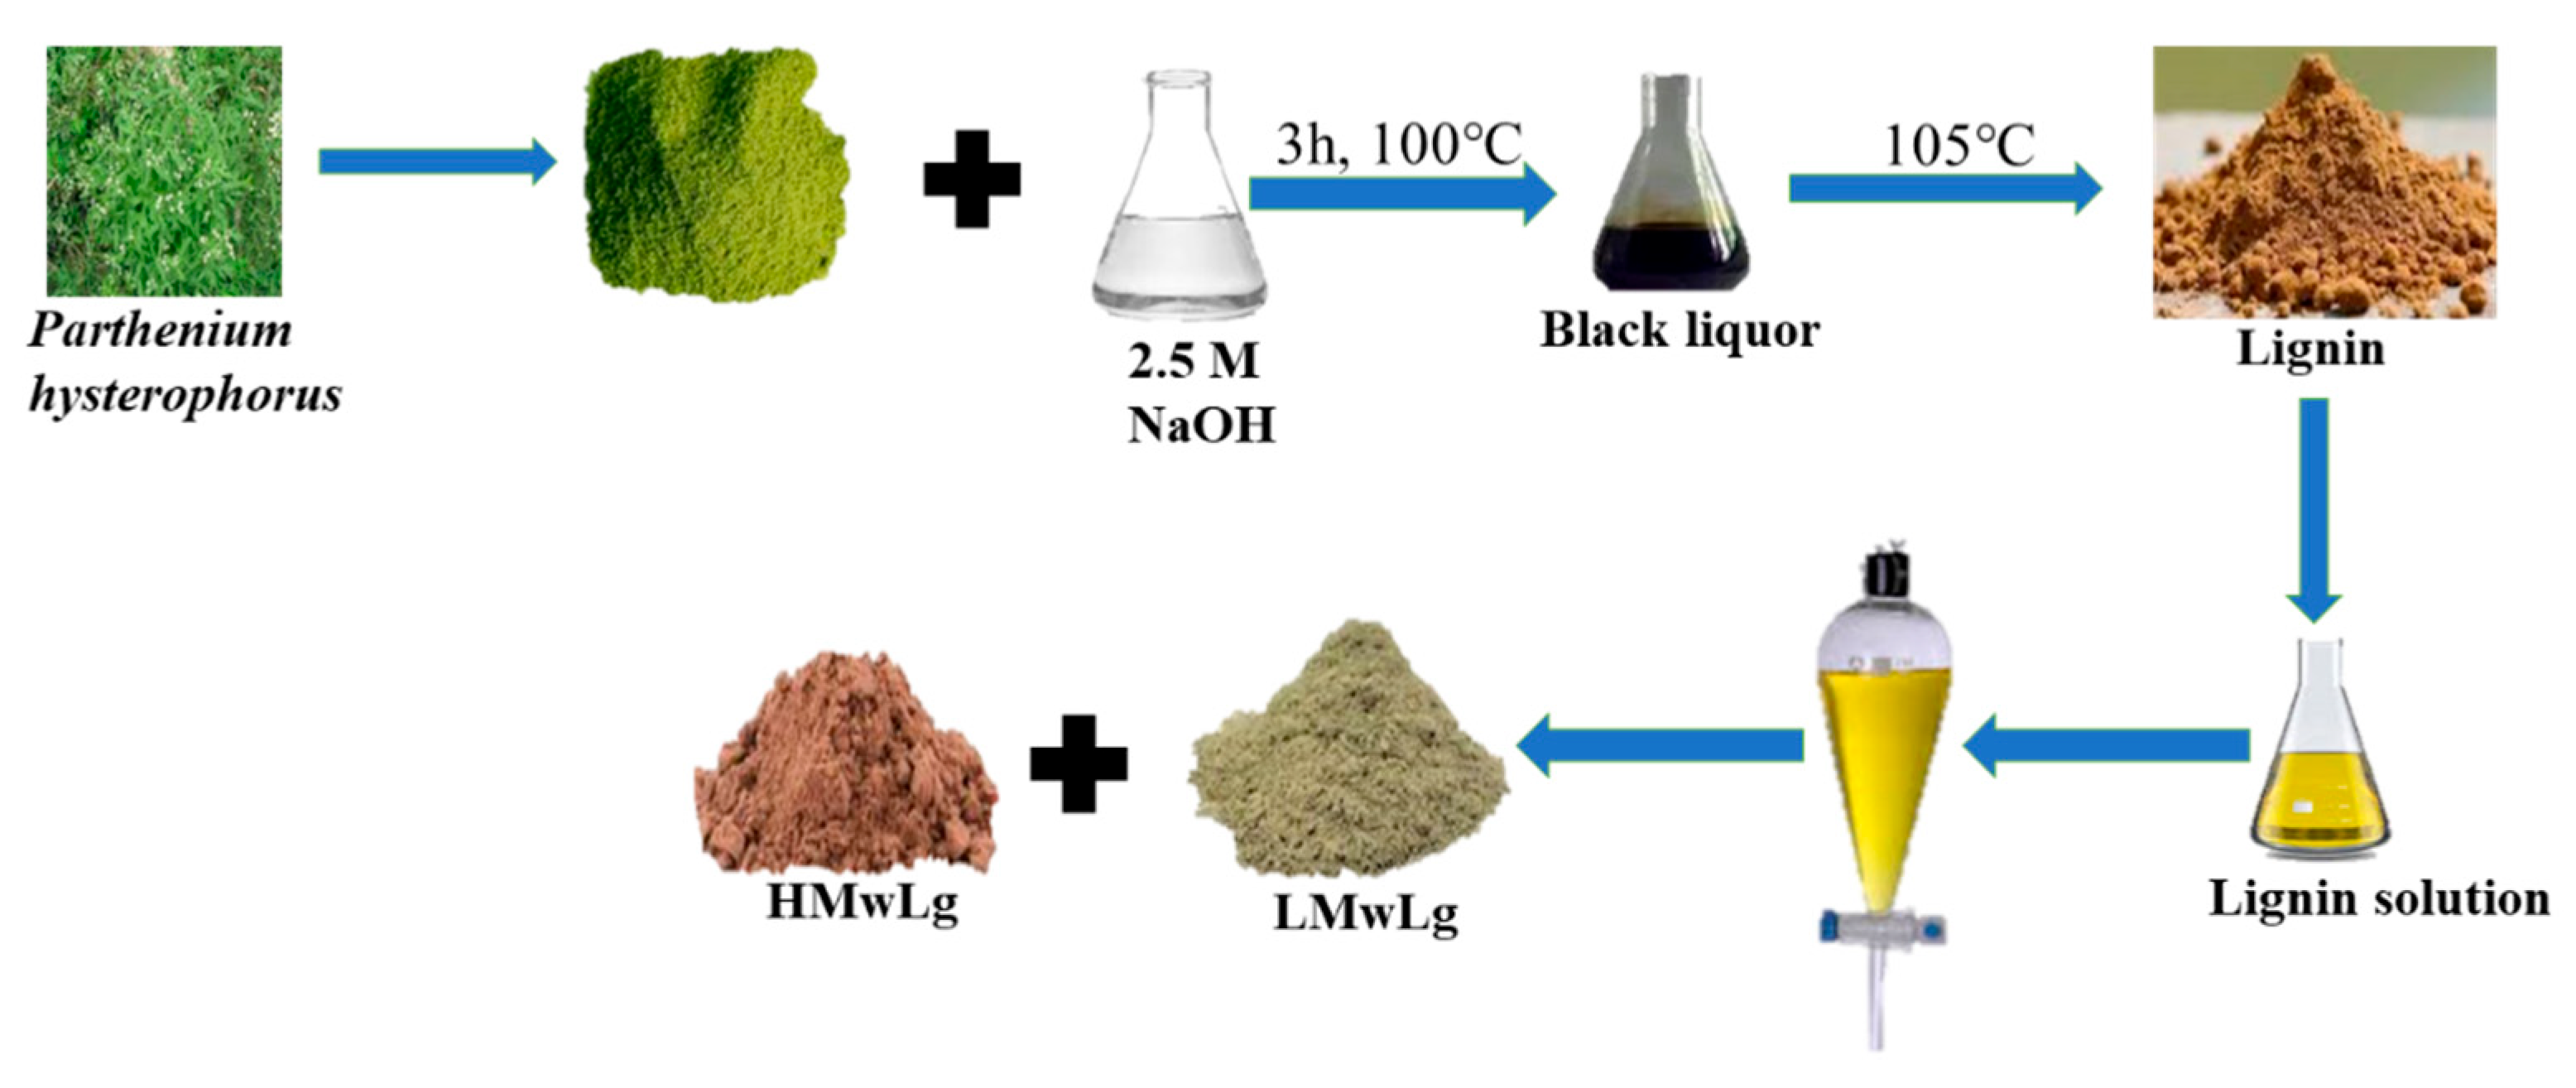
Figure 2.
Bio-synthesis of silver nanoparticles.
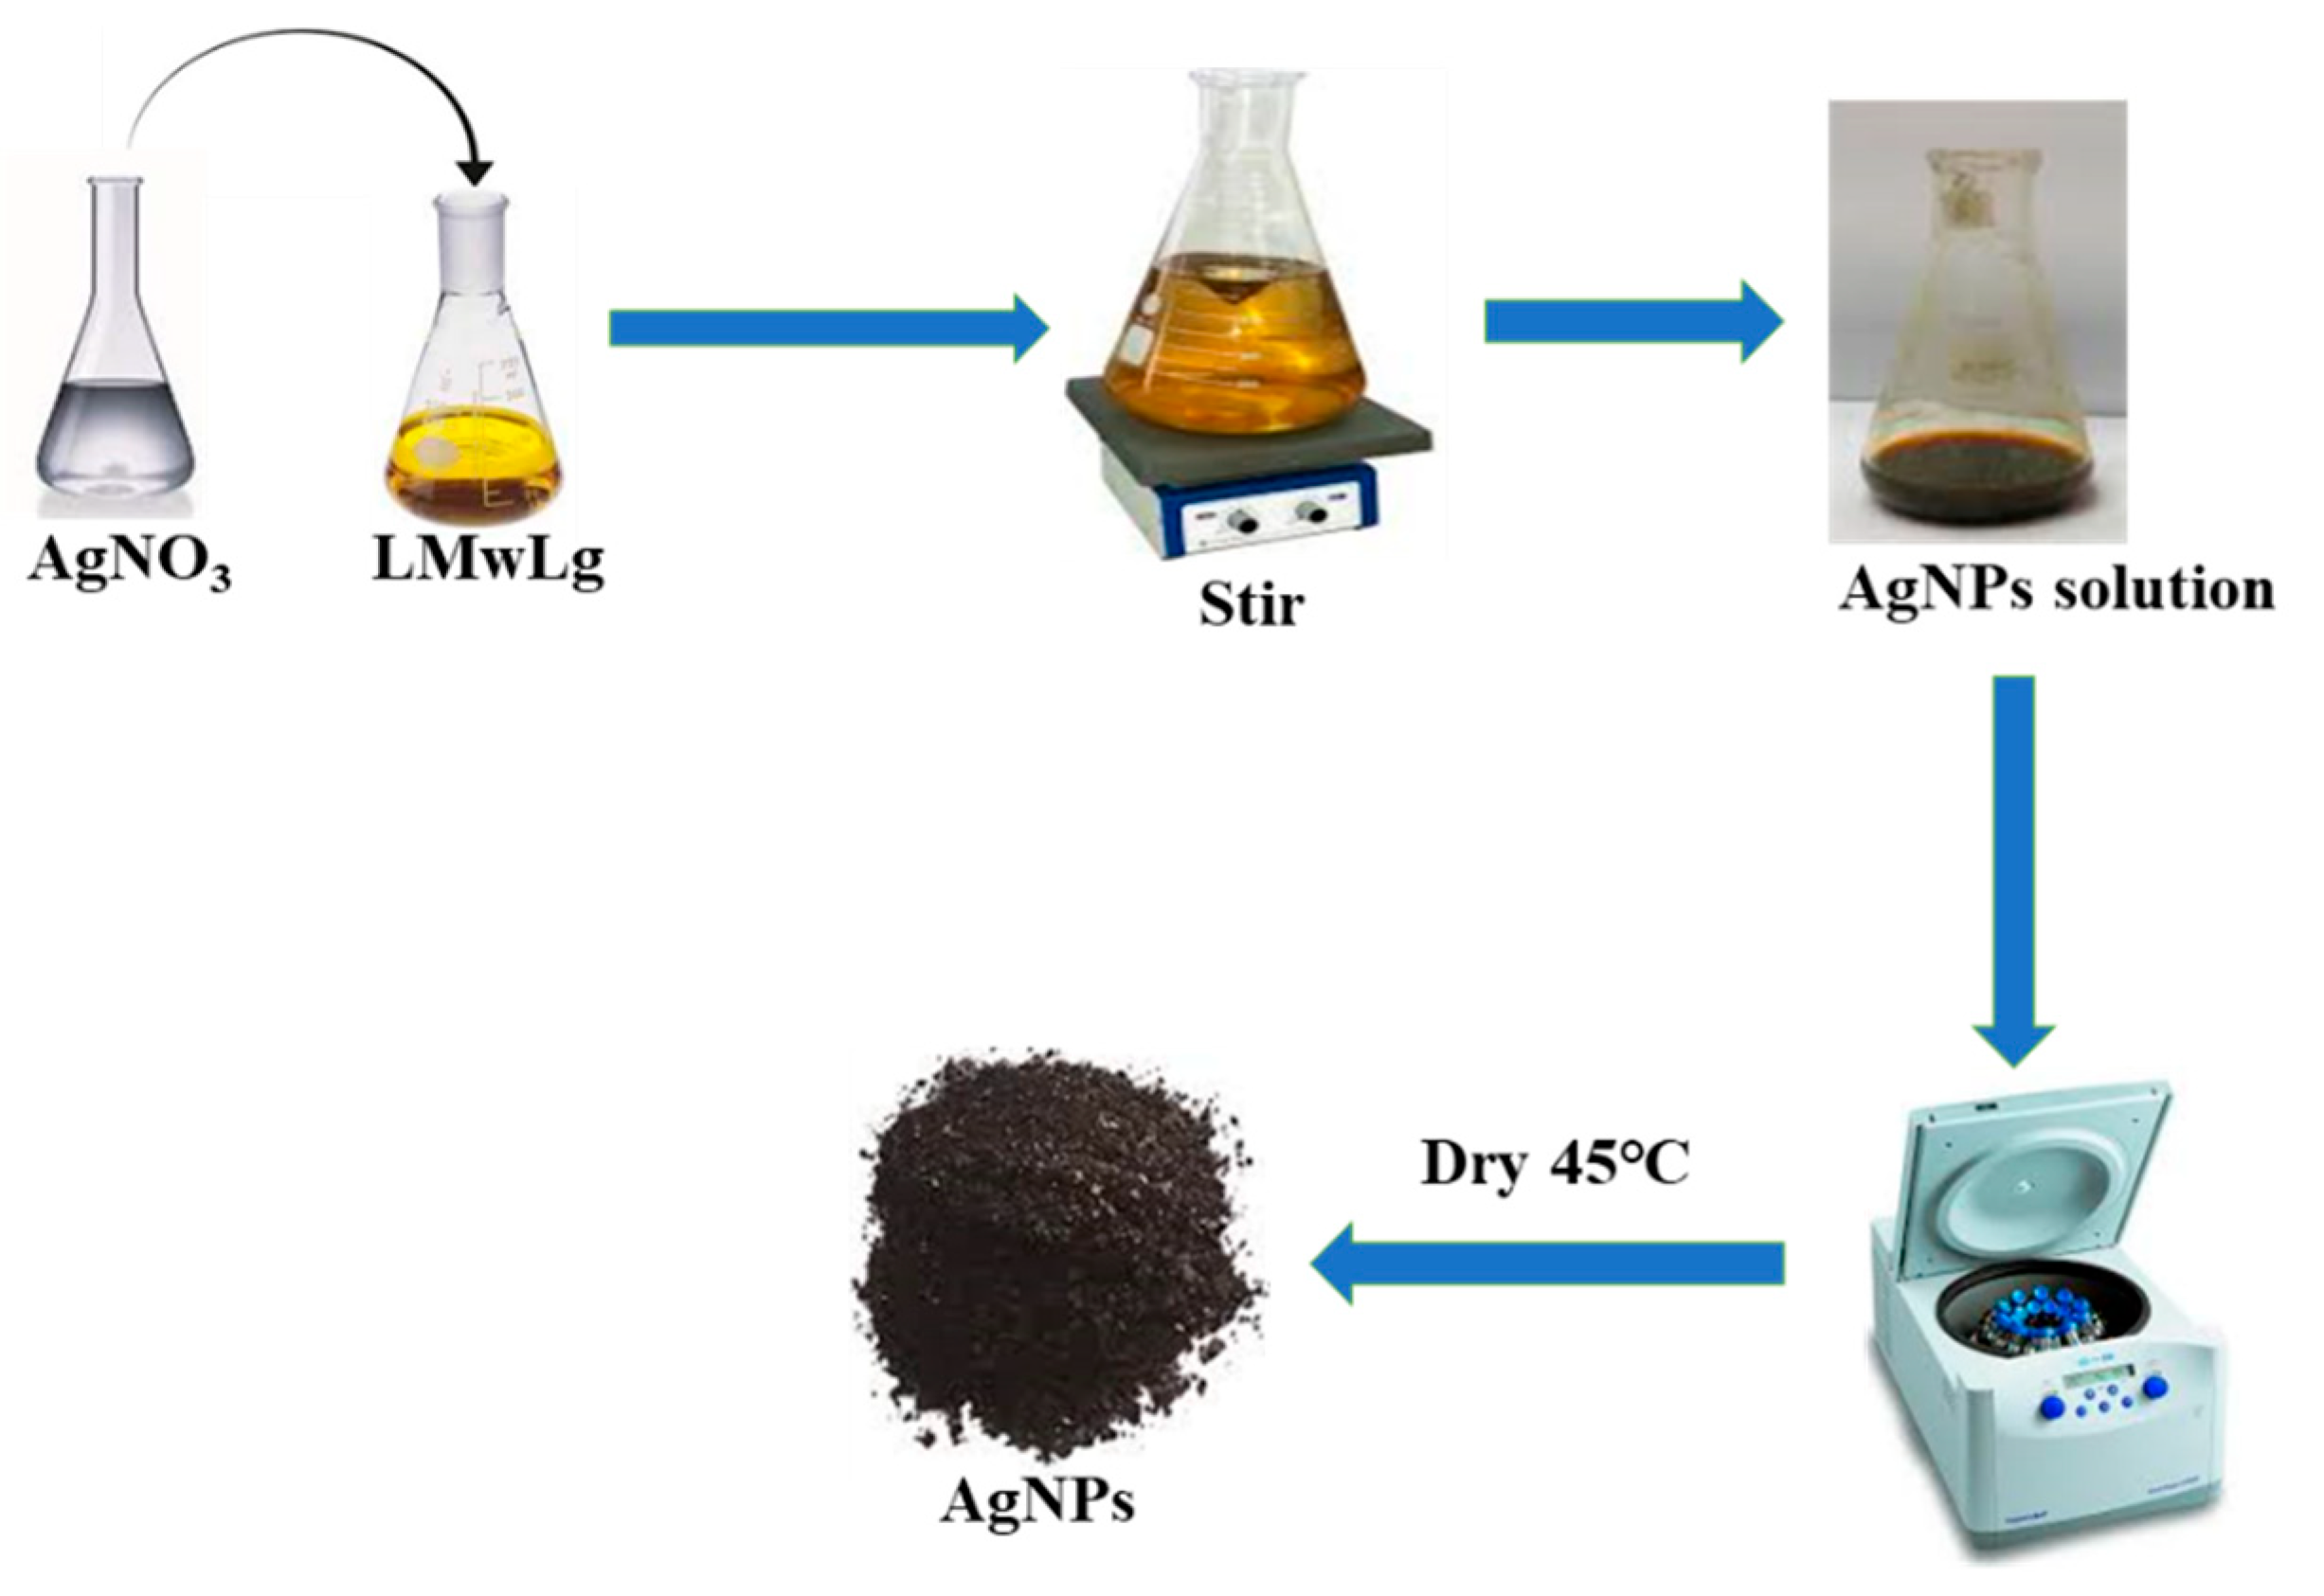
Figure 9.
(a): FTIR analysis of Lg, LMwLg, and HMwLg lignin fractions from Parthenium hysterophorus. (b): FTIR analysis of LMwLg and AgNPs.
Figure 9.
(a): FTIR analysis of Lg, LMwLg, and HMwLg lignin fractions from Parthenium hysterophorus. (b): FTIR analysis of LMwLg and AgNPs.
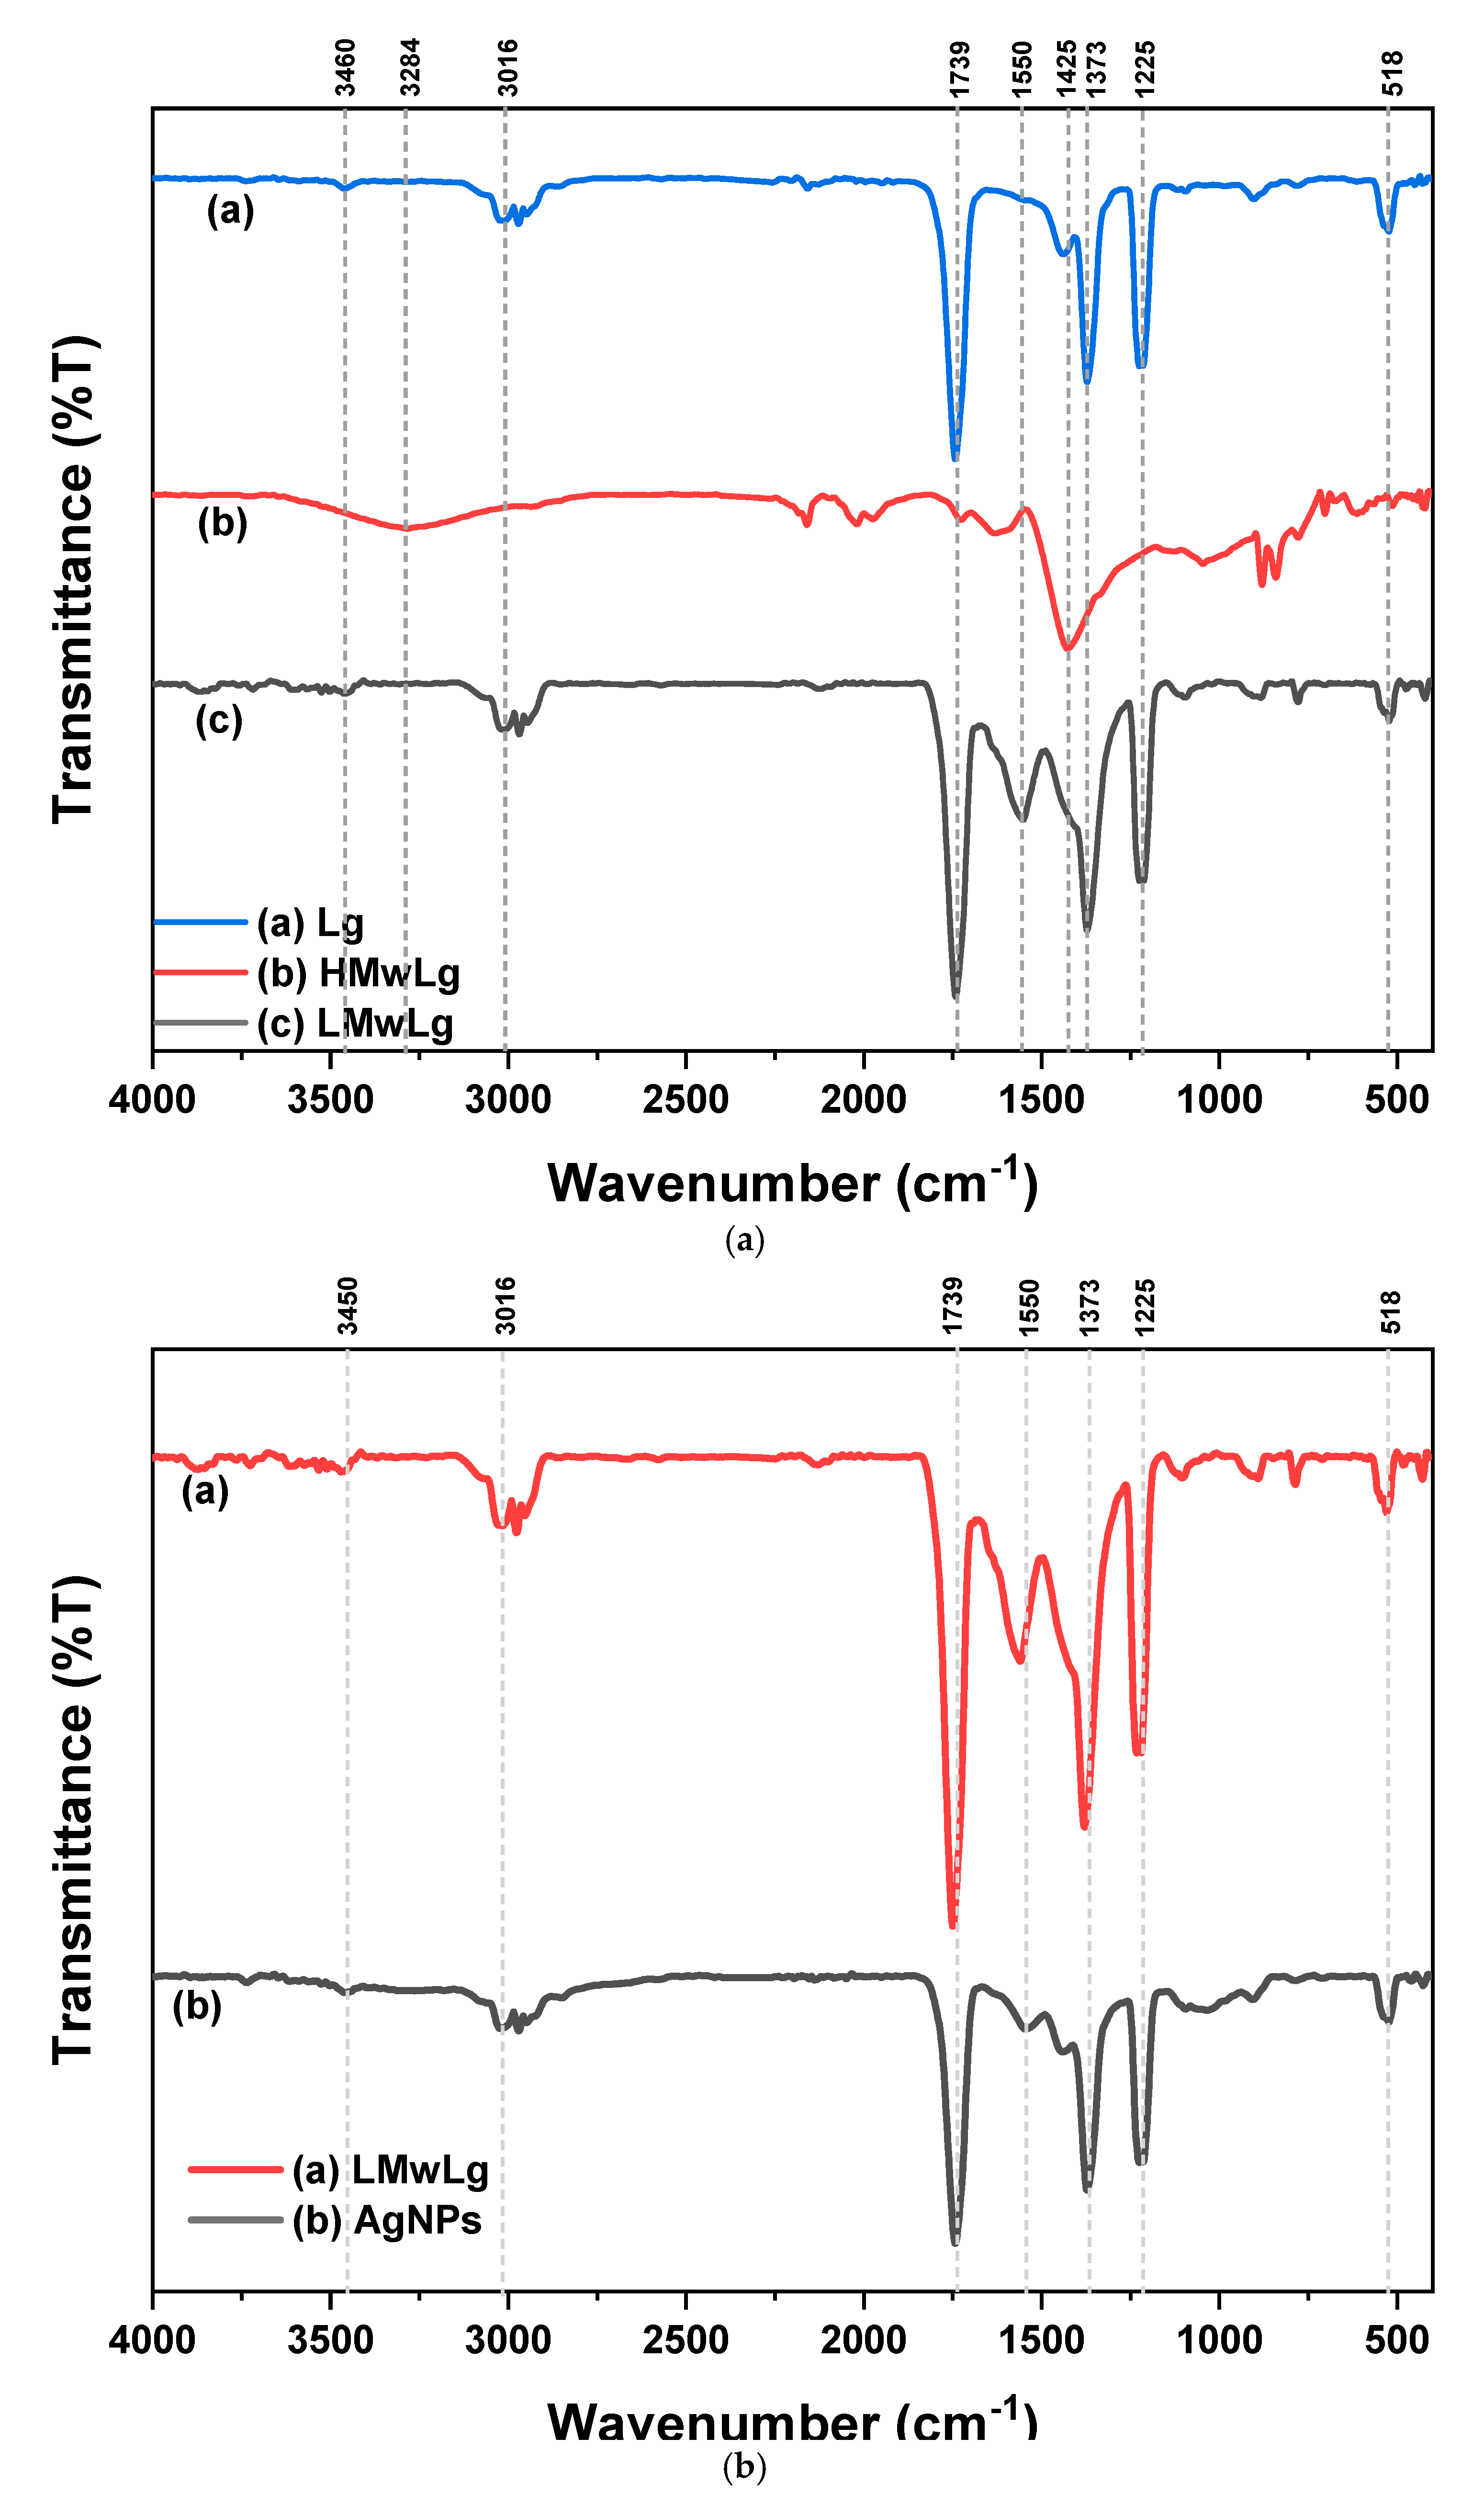
Figure 3.
Bio-reduction of Ag+ to Ag0.
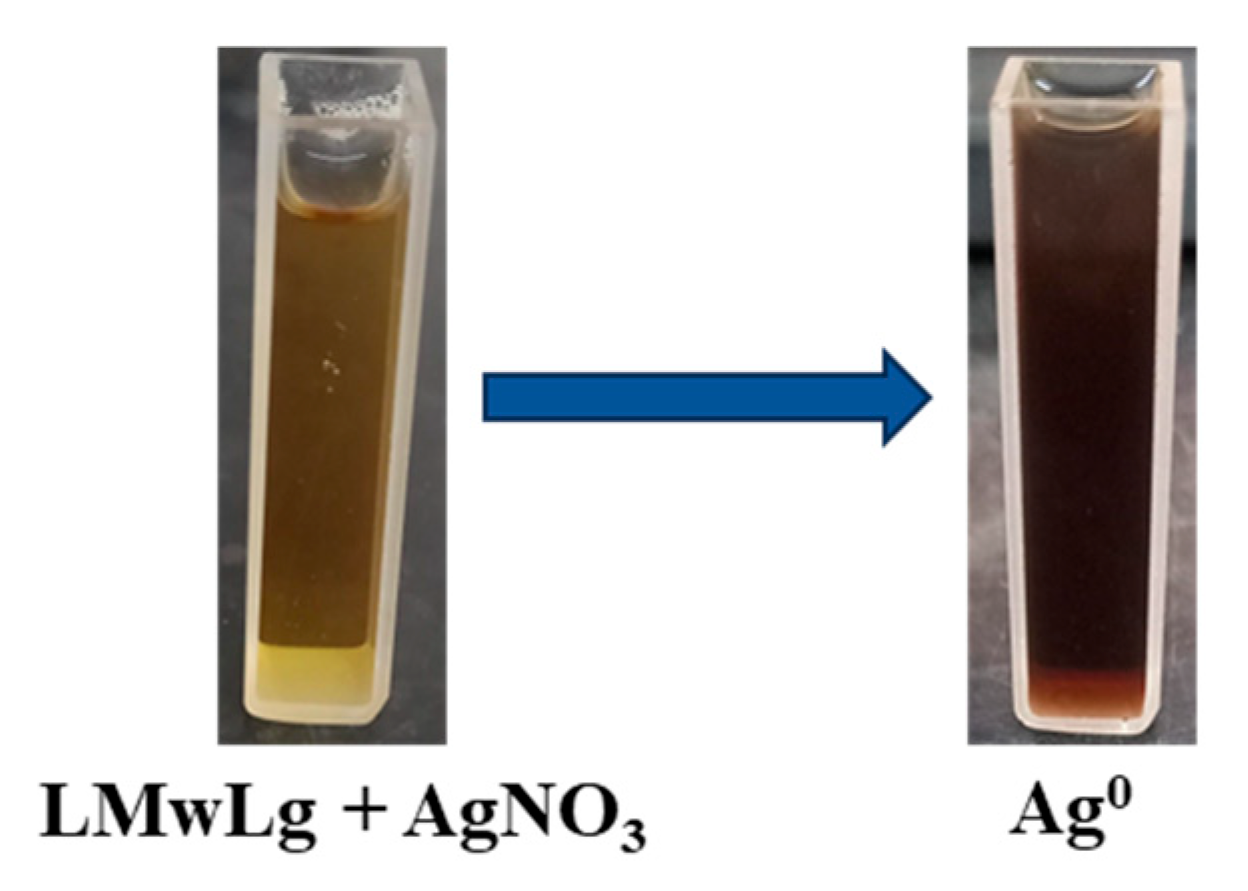
Figure 4.
The effect of silver ion concentration.
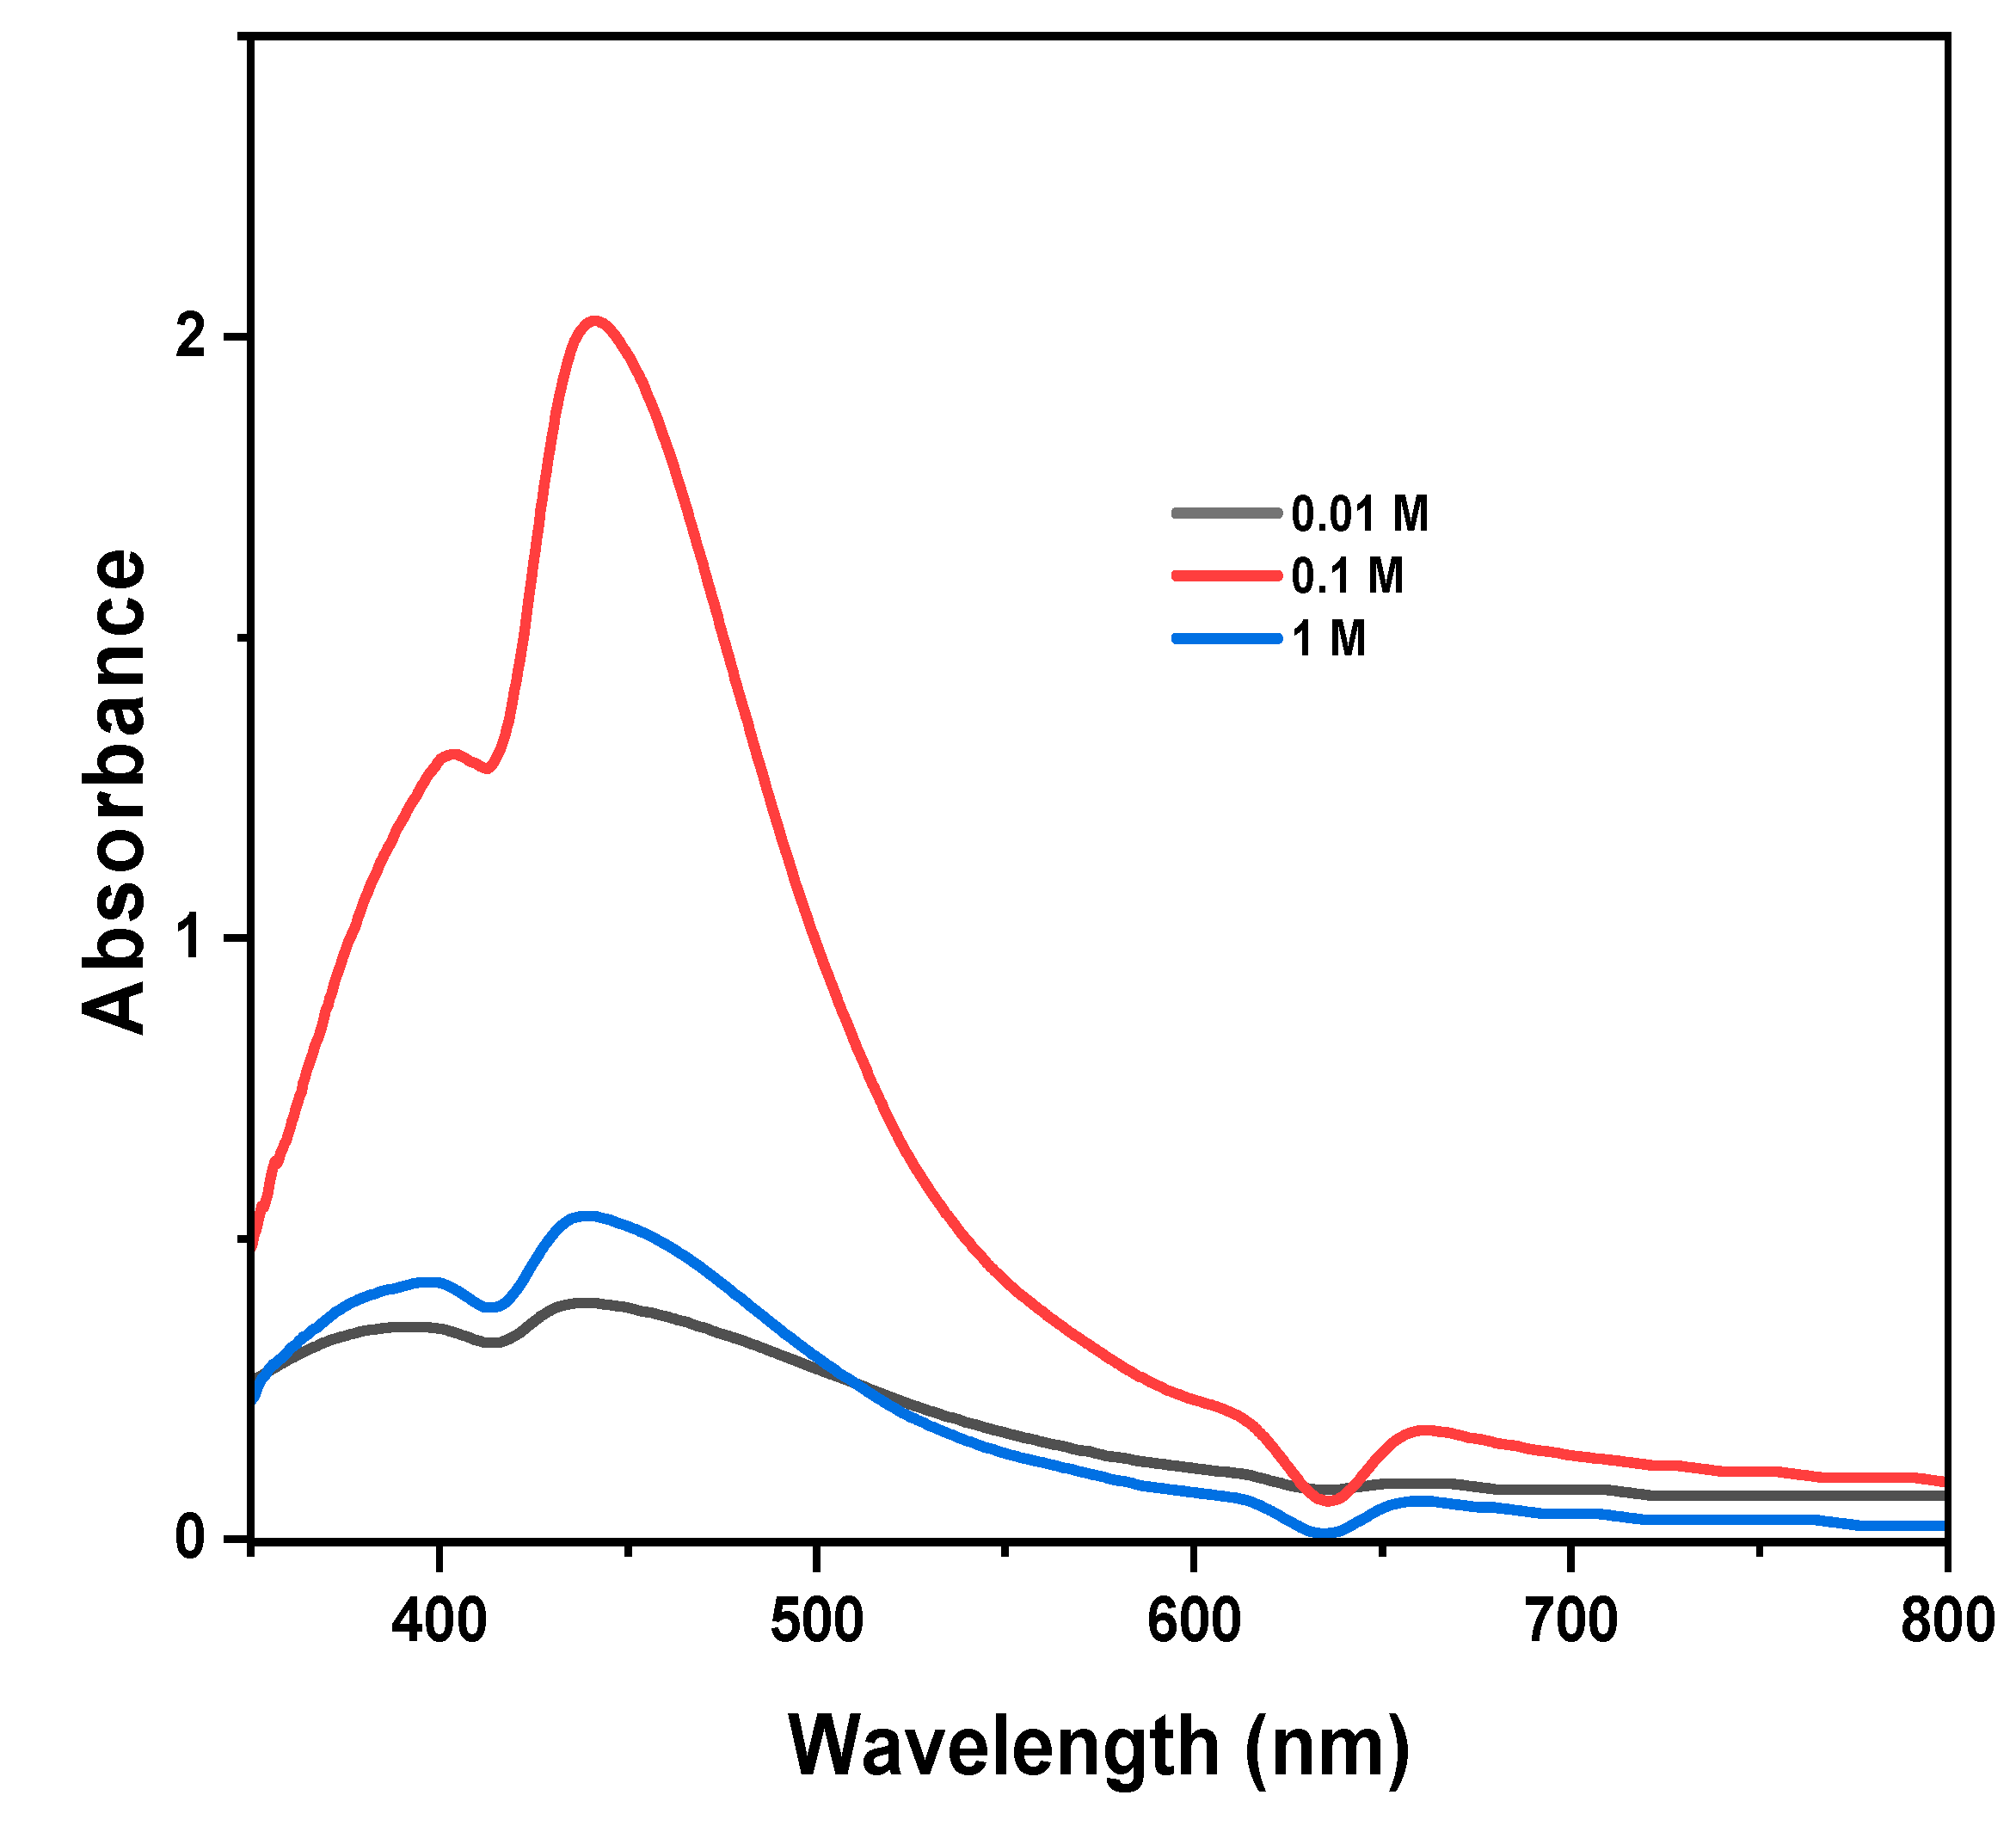
Figure 5.
The effect of LMwLg concentration.
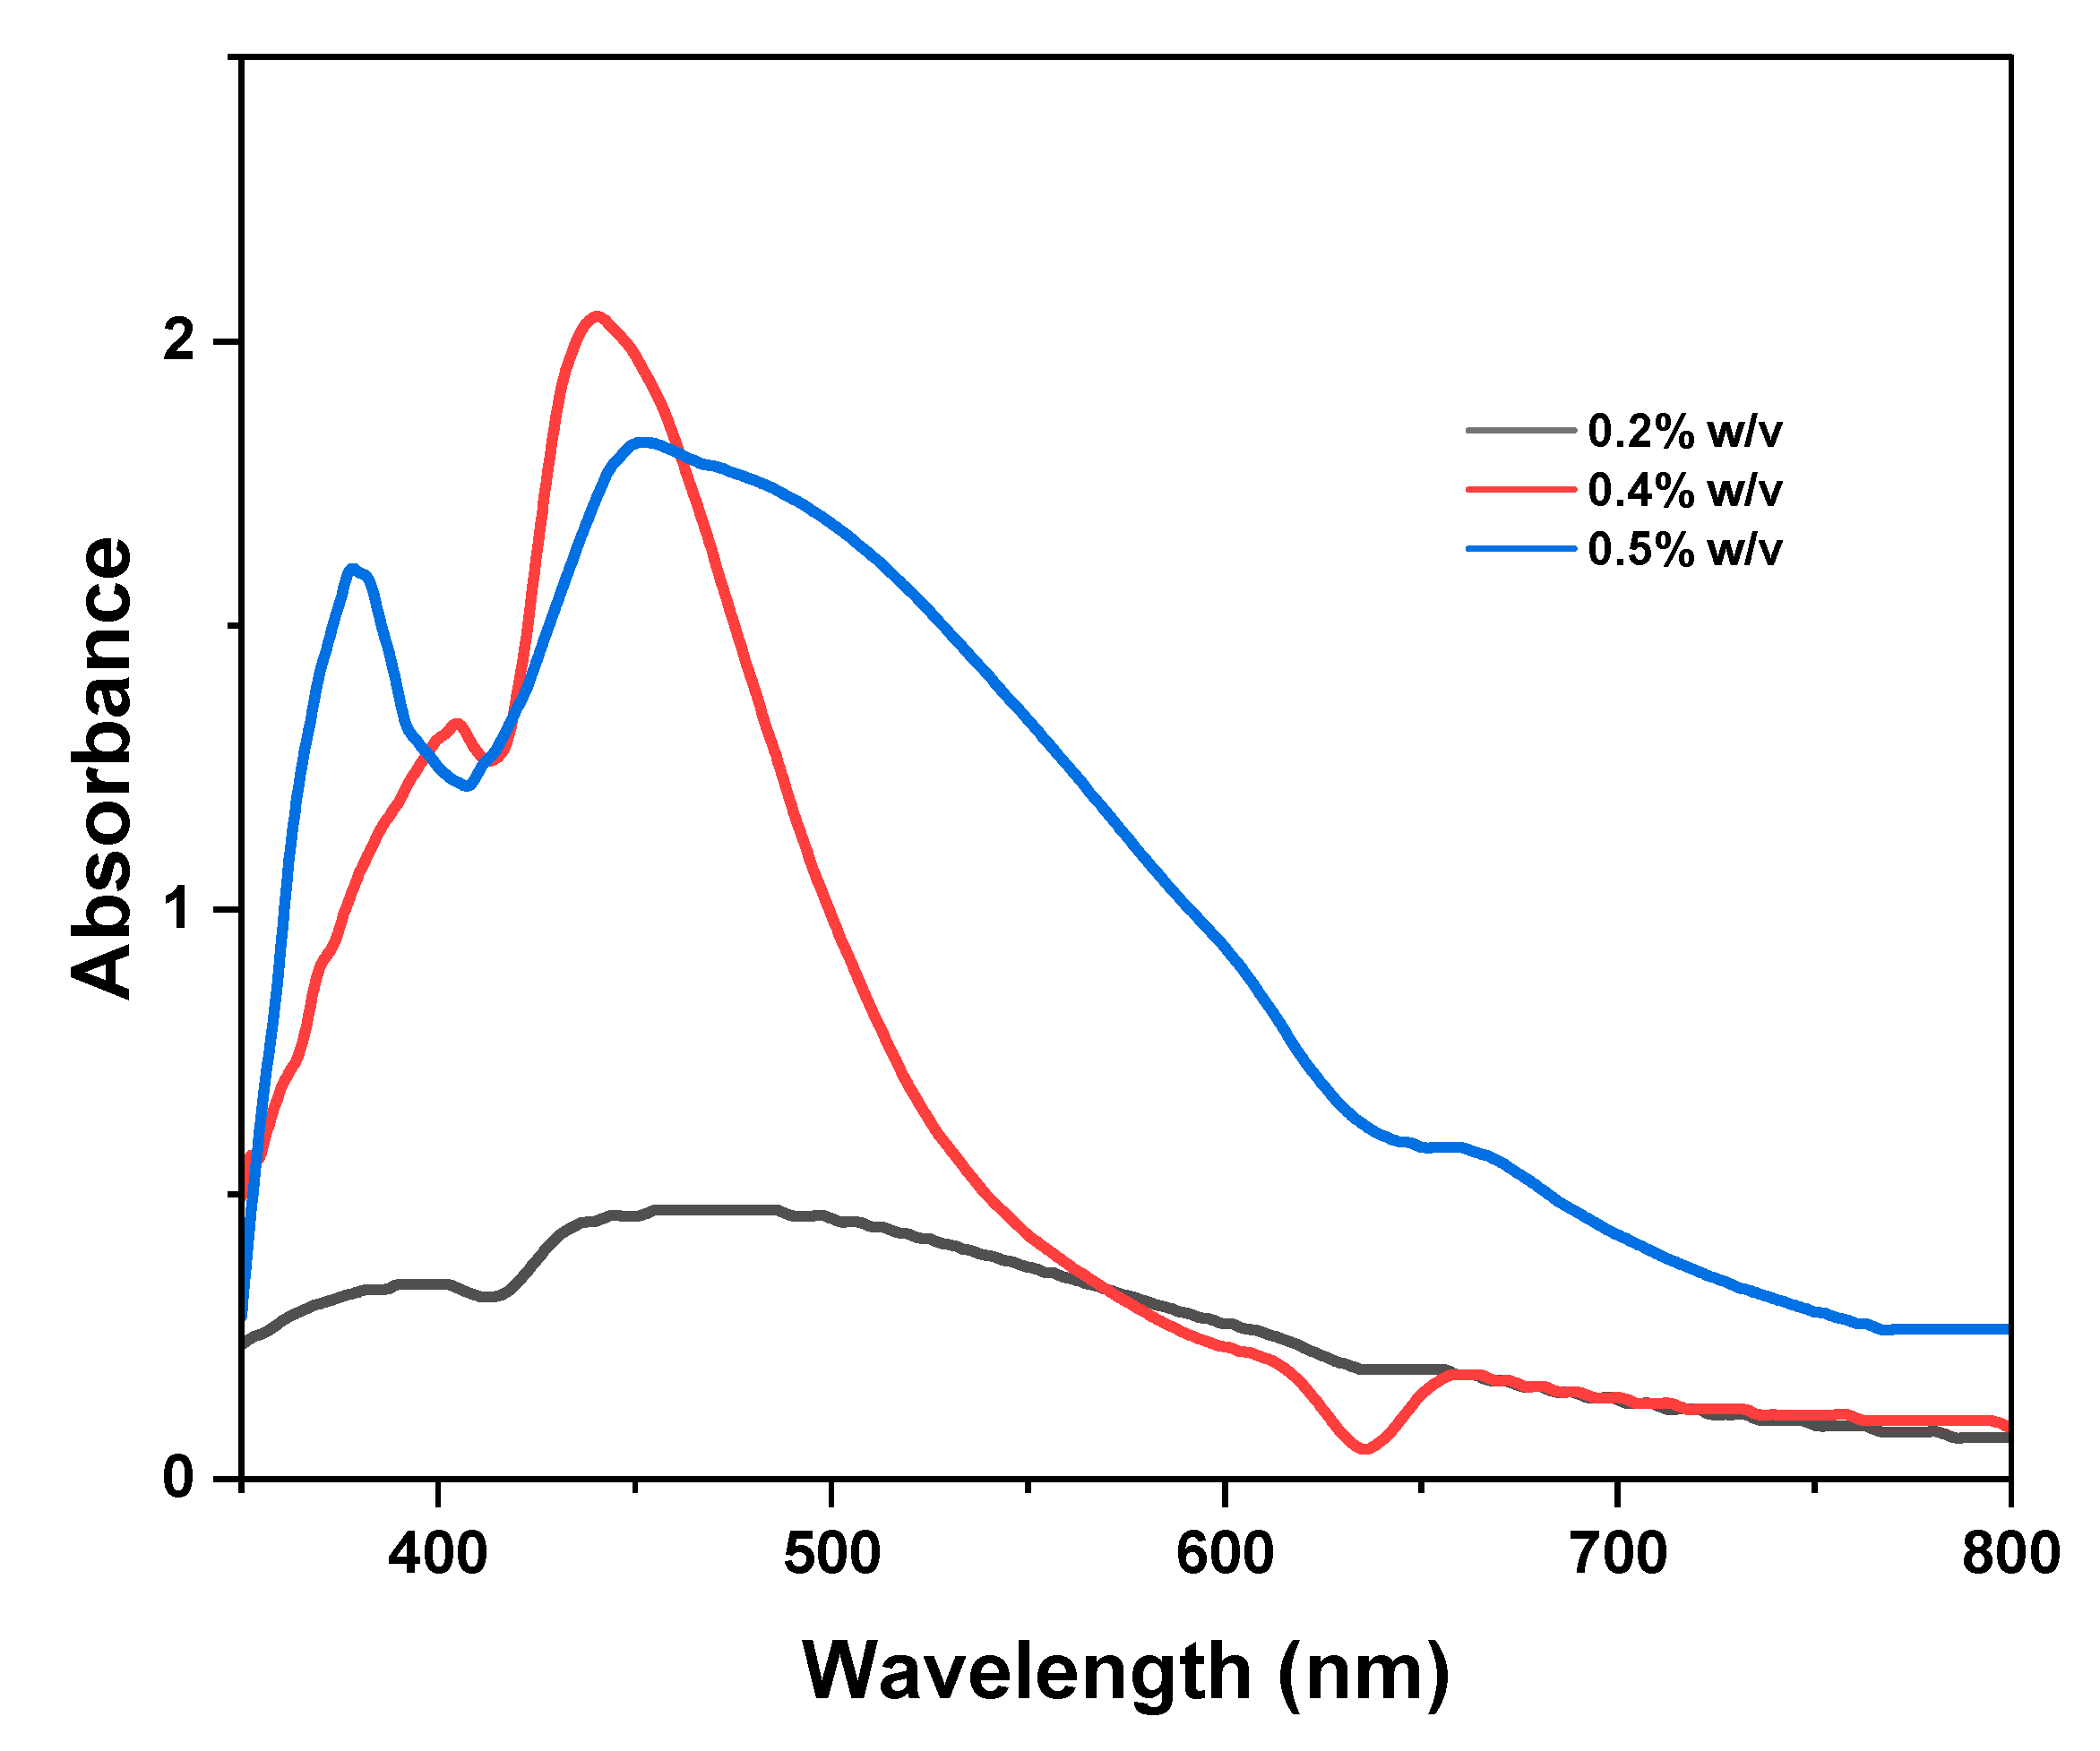
Figure 6.
The effect of reaction temperature.
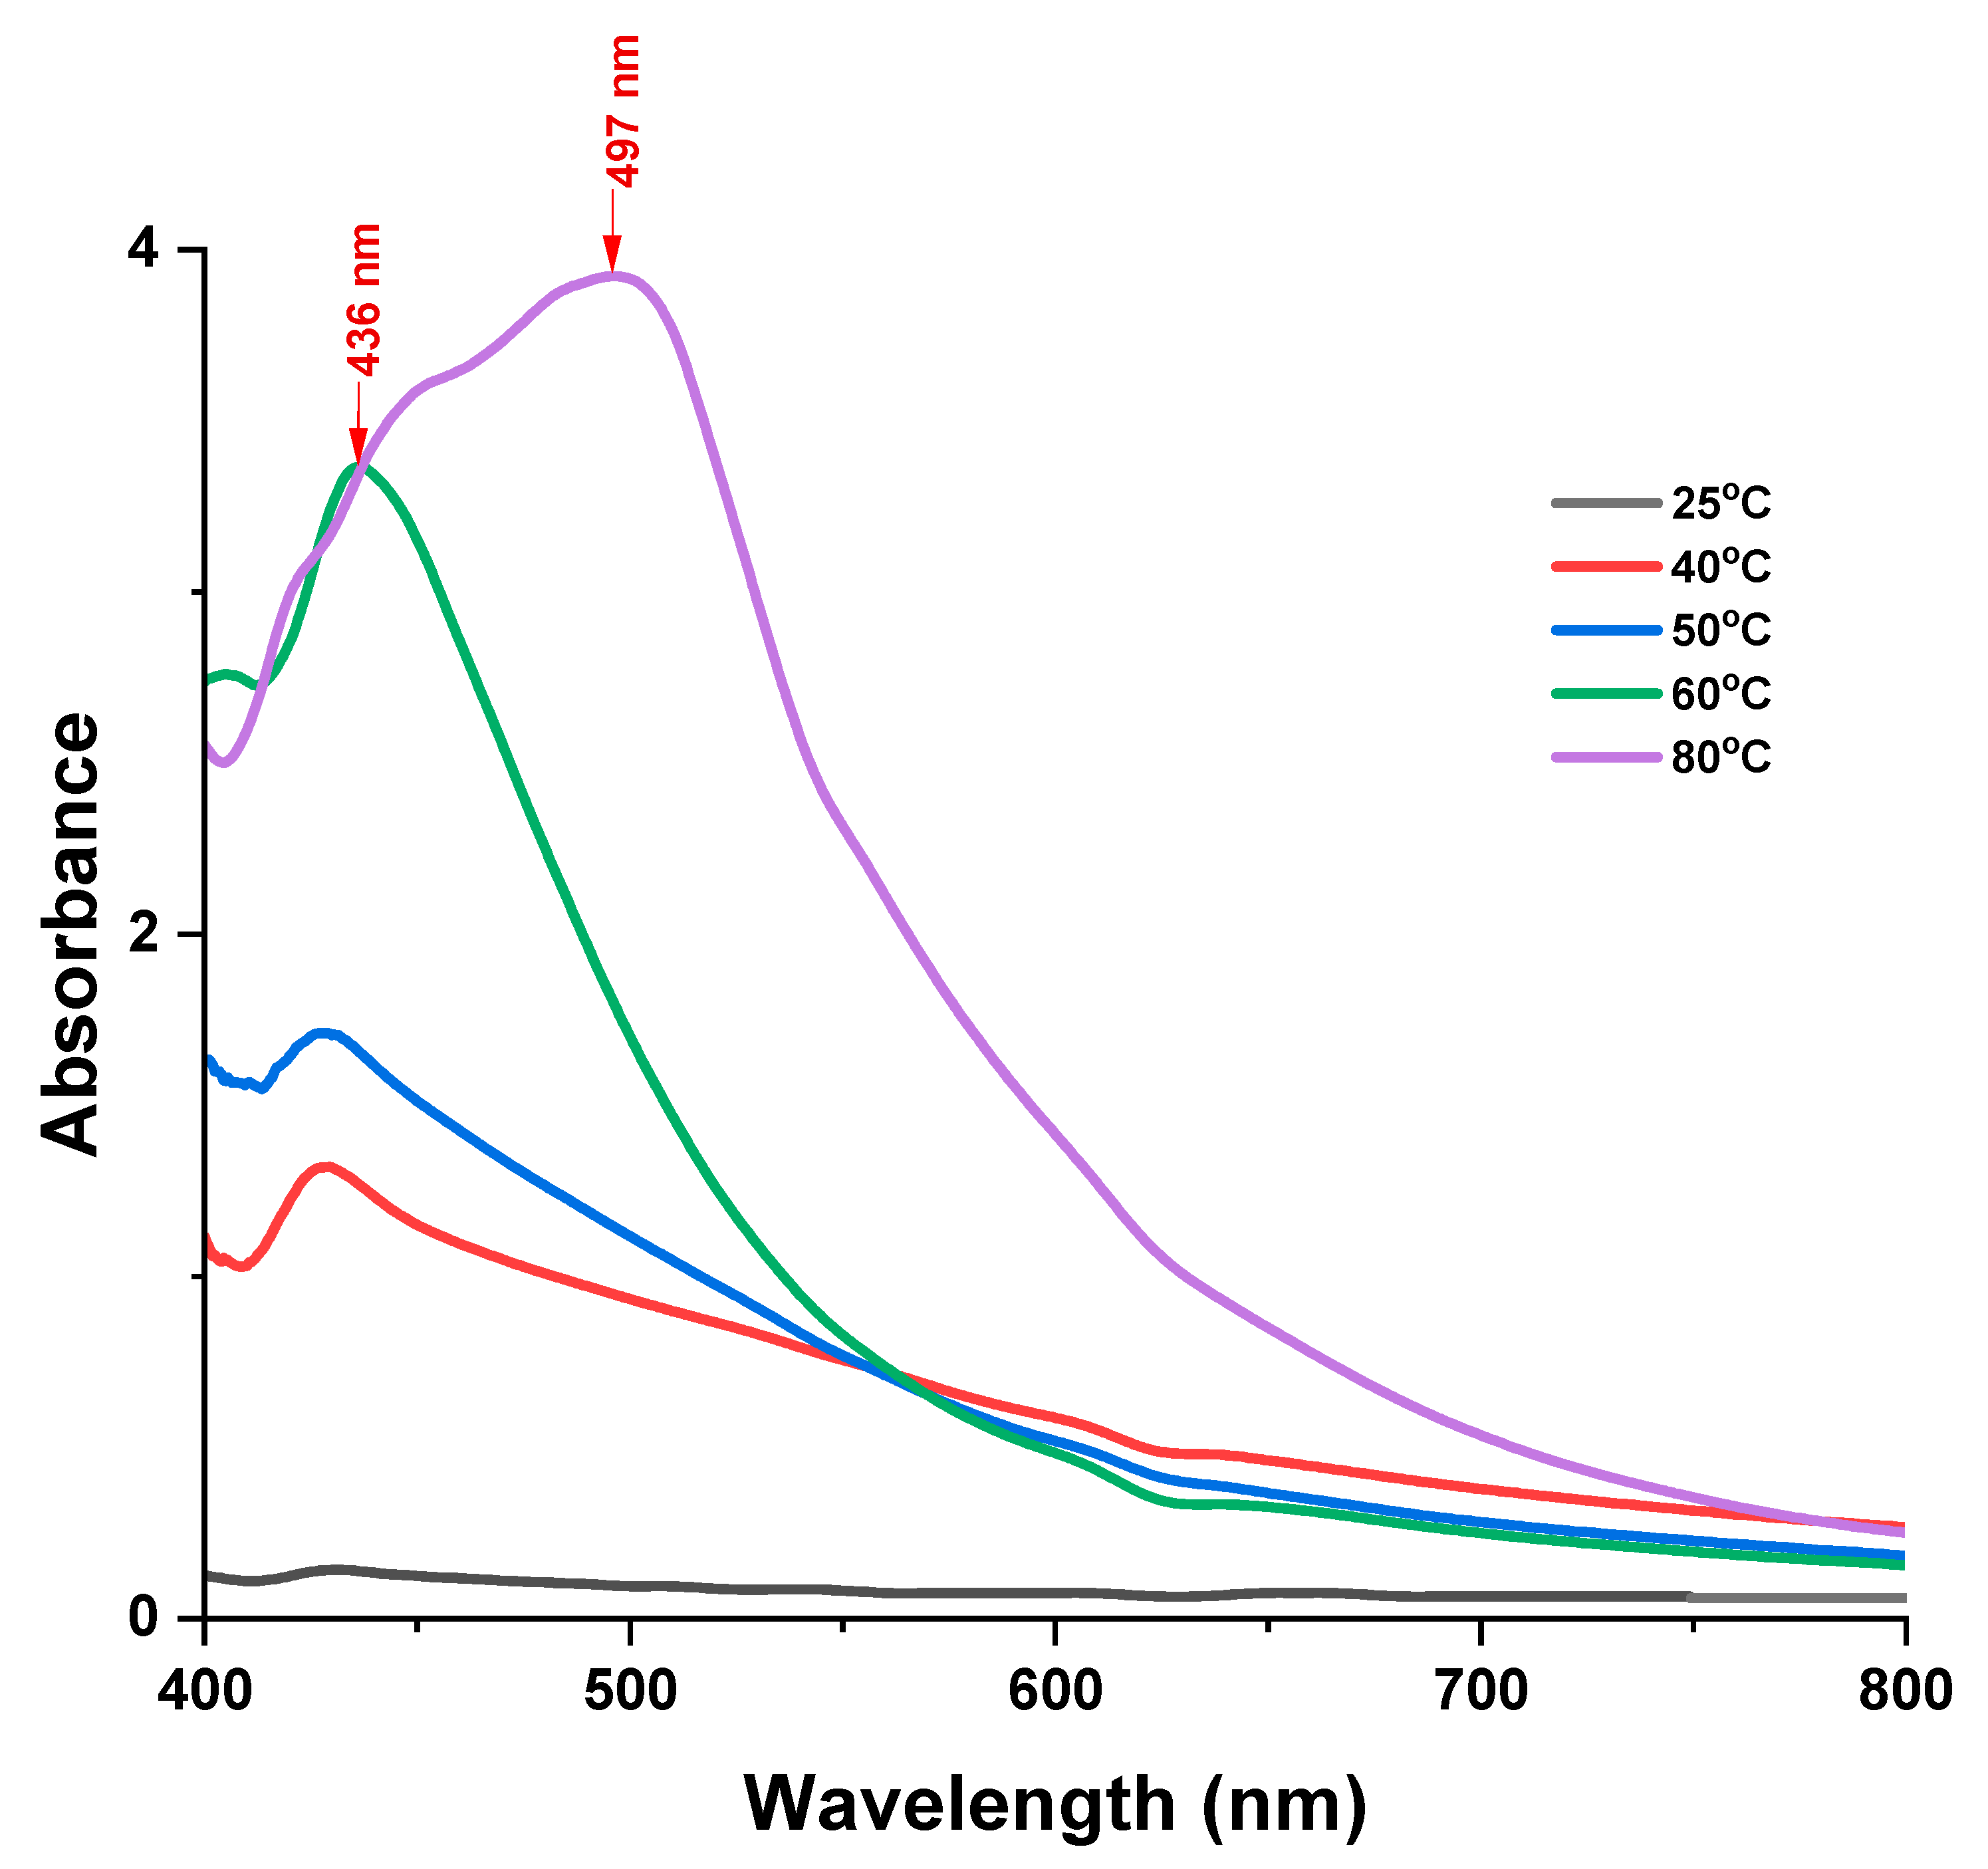
Figure 7.
The effect of reaction time on the synthesis of silver nanoparticles.
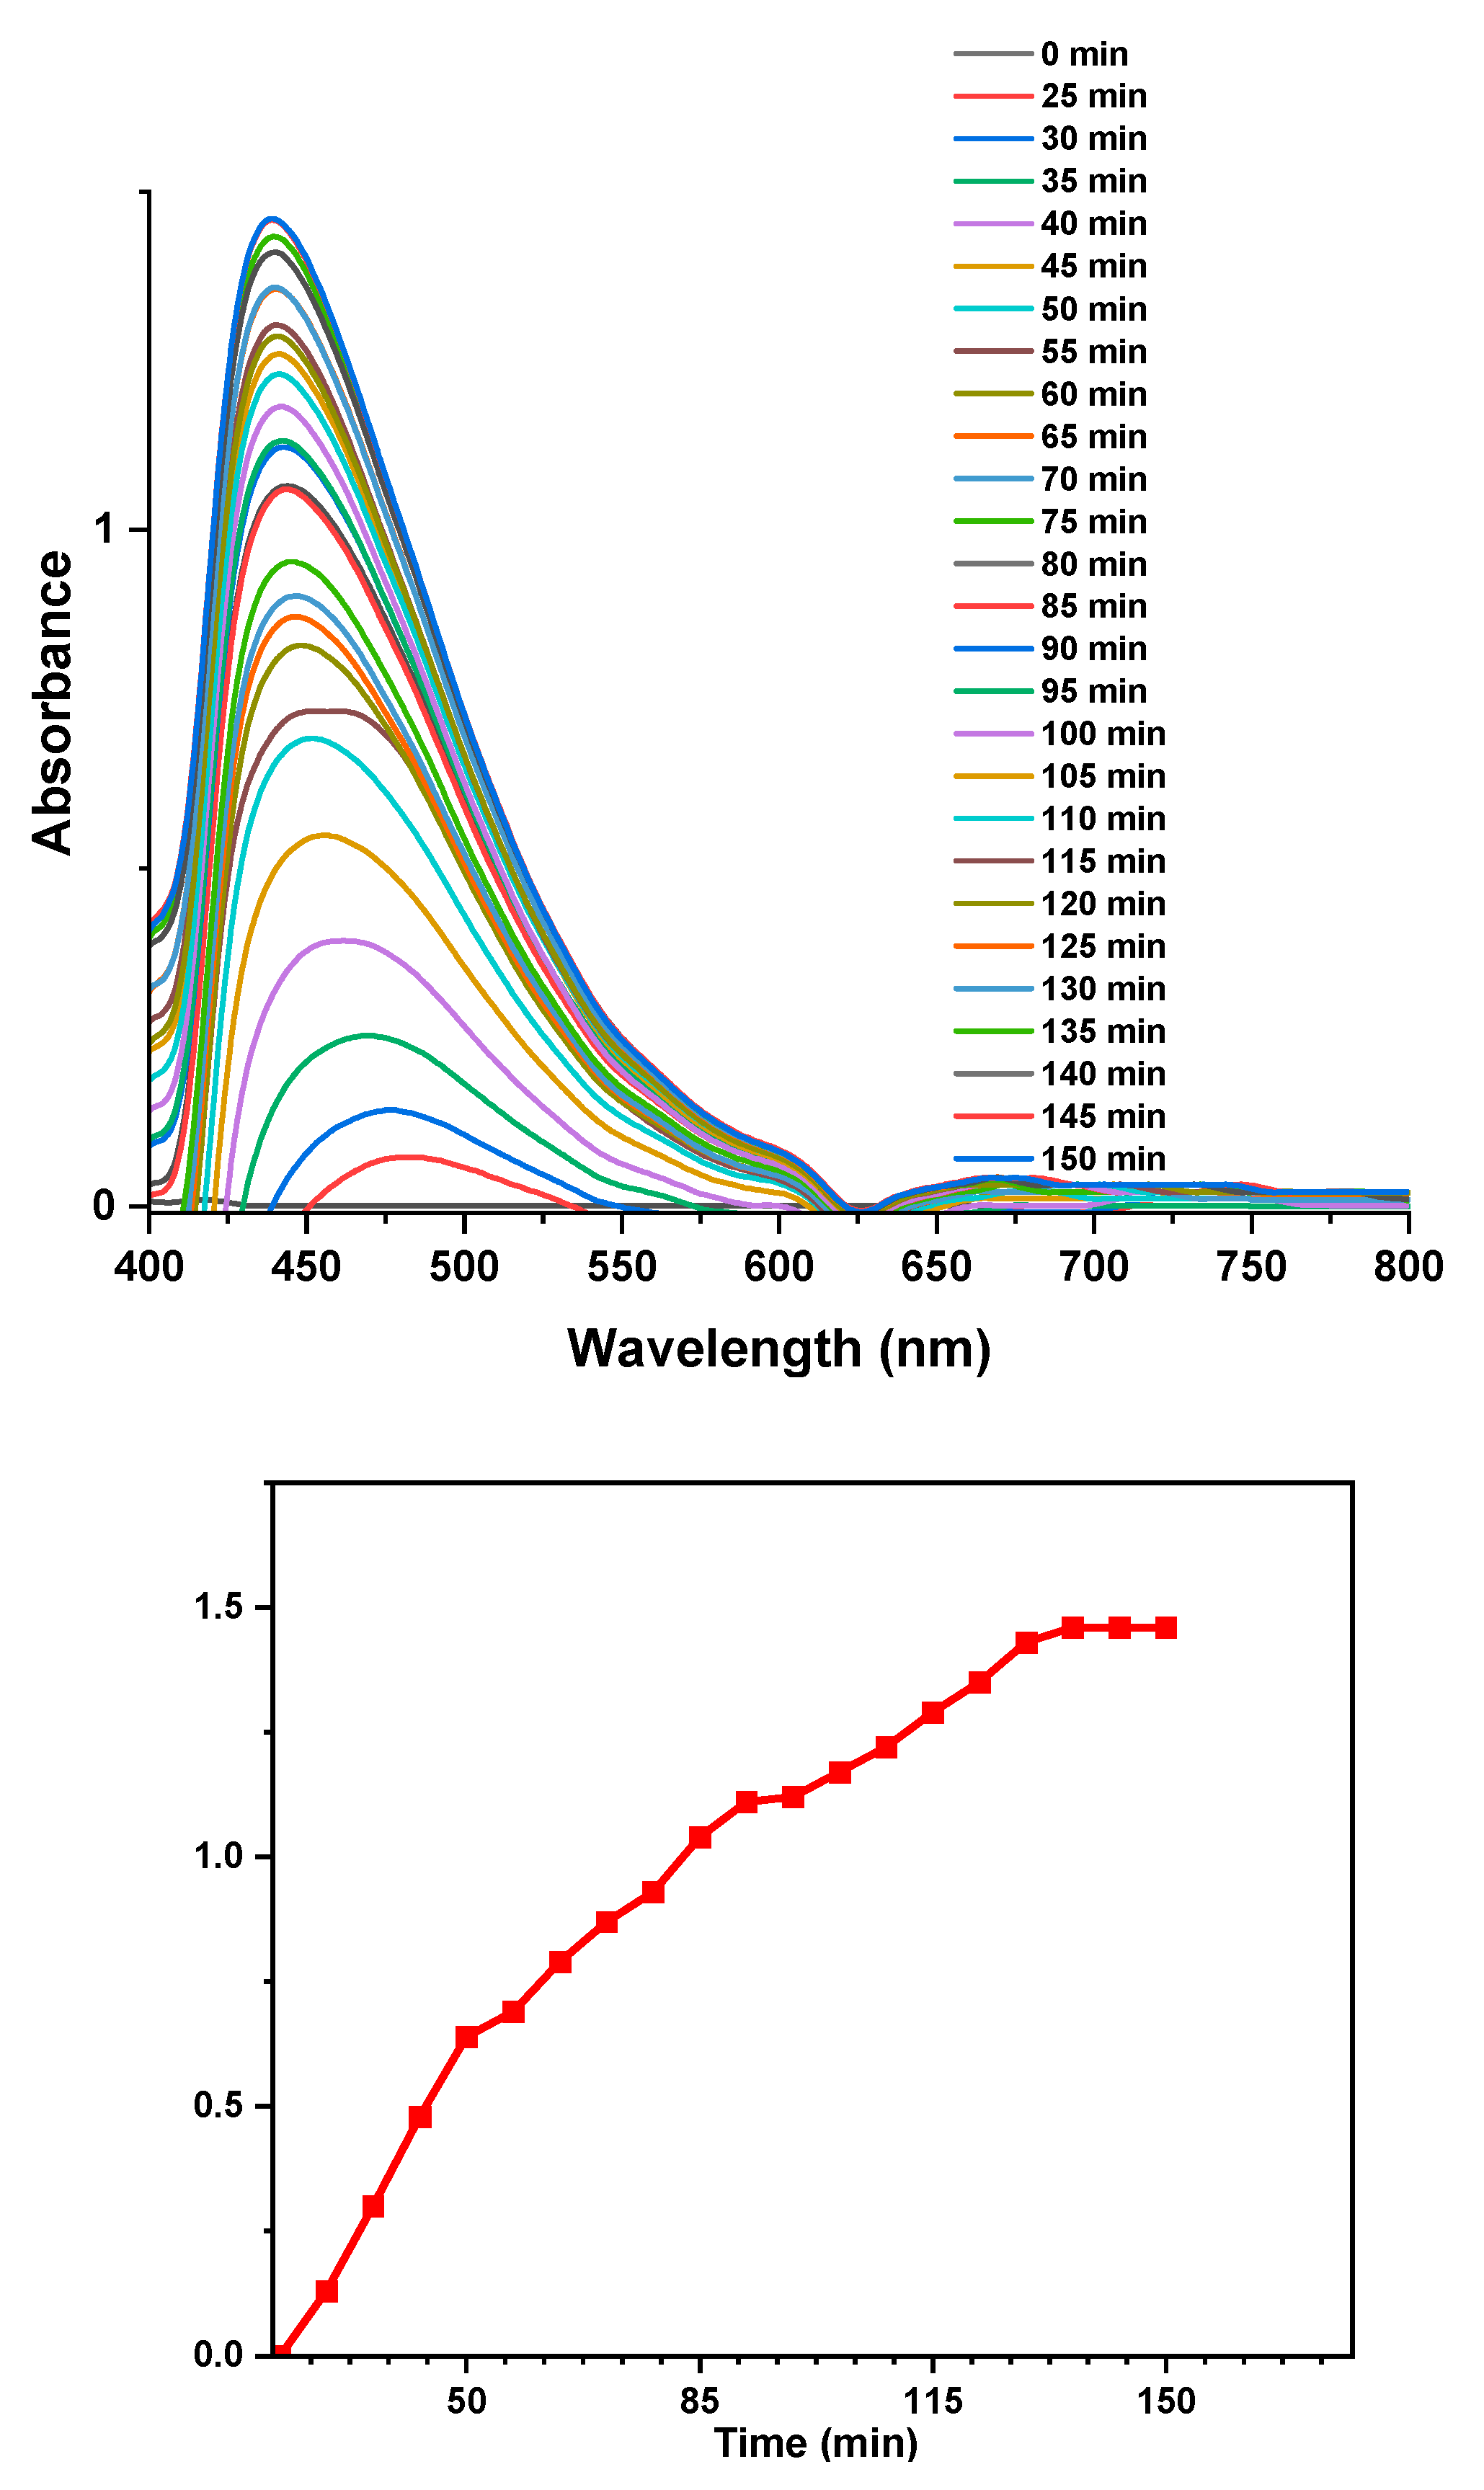
Figure 8.
The optical properties of silver nanoparticles including the Tauc’s plots for (a) direct transitions, and (b) indirect transitions and the UV-Vis spectra of (c) AgNPs, (d) AgNO3 and (e) LMwLg confirming the formation of AgNPs.
Figure 8.
The optical properties of silver nanoparticles including the Tauc’s plots for (a) direct transitions, and (b) indirect transitions and the UV-Vis spectra of (c) AgNPs, (d) AgNO3 and (e) LMwLg confirming the formation of AgNPs.
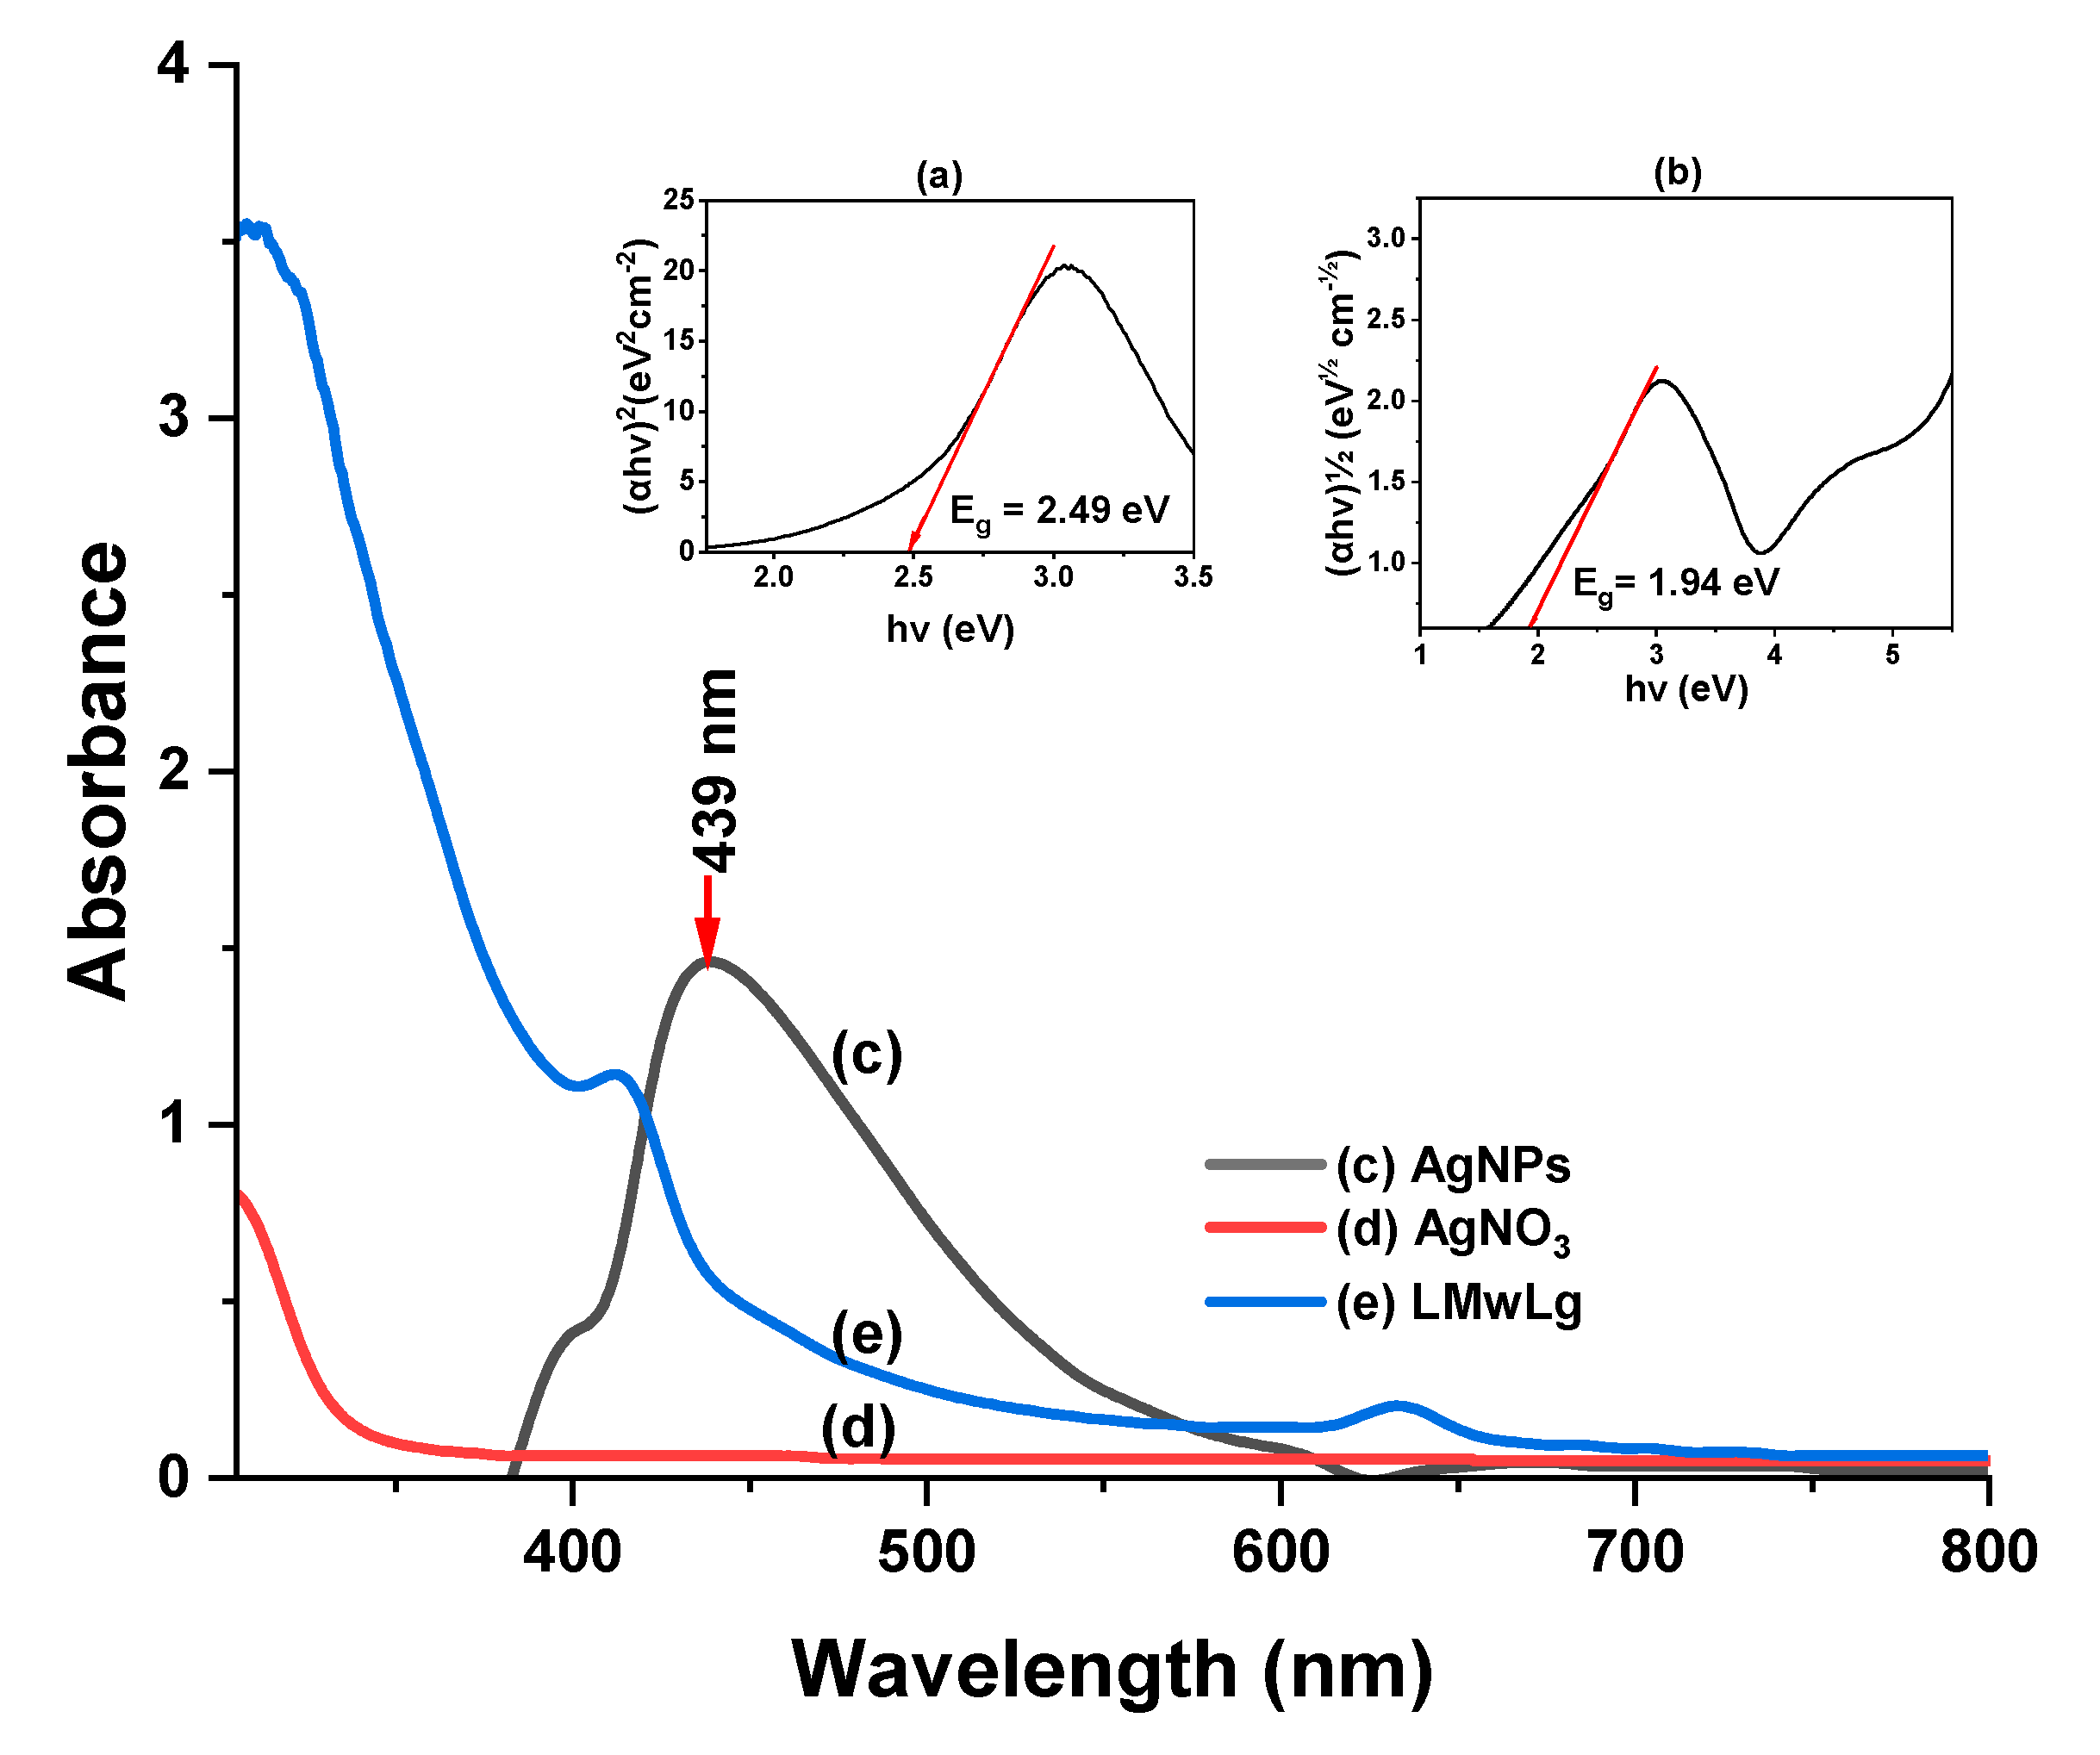
Figure 10.
Silver nanoparticle powder diffractograms.
Disclaimer/Publisher’s Note: The statements, opinions and data contained in all publications are solely those of the individual author(s) and contributor(s) and not of MDPI and/or the editor(s). MDPI and/or the editor(s) disclaim responsibility for any injury to people or property resulting from any ideas, methods, instructions or products referred to in the content. |
© 2025 by the authors. Licensee MDPI, Basel, Switzerland. This article is an open access article distributed under the terms and conditions of the Creative Commons Attribution (CC BY) license (http://creativecommons.org/licenses/by/4.0/).
Copyright: This open access article is published under a Creative Commons CC BY 4.0 license, which permit the free download, distribution, and reuse, provided that the author and preprint are cited in any reuse.


