
Submitted:
03 October 2025
Posted:
07 October 2025
You are already at the latest version
Abstract
Liquid hydrogen, a cryogenic fluid with extremely low density and viscosity, plays a crucial role in zero-carbon energy strategies. It has become a prominent research focus in the field of new energy strategy. In most processes within the liquid hydrogen industry chain, liquid hydrogen flow measurement is involved. This paper focuses on the study of the flow diverter, a key component of the liquid hydrogen flow standard device. Aiming at the high thermal insulation requirement of liquid hydrogen, the straight piping in the conventional flow standard device is optimized. A combined coiled-vertical piping with key equipment is enclosed in a vacuum cold box for centralized thermal insulation. Fluid flow during diverter switching under four piping configurations was simulated using ANSYS Fluent for both water and liquid hydrogen. The influence of piping structure on flow error during the switching of the diverter is systematically studied. From the simulation results, it can be concluded that the U-shaped piping effectively avoids the inertia and overshoot effects during fluid switching, which helps to reduce errors caused by commutation.
Keywords:
liquid hydrogen
; flow standard
; flow diverter performance
; flow measurement
1. Introduction
As a green, efficient, clean, zero-carbon, and recyclable energy source, hydrogen is considered one of the key elements in solving energy problems in the 21st century[1,2,3]. Hydrogen is an indispensable energy carrier in various fields, including transportation, aerospace, national defense, power generation, and heating[4,5]. To date, only a handful of standard devices in the world have the function of cryogenic fluid flow value transfer and traceability[6,7,8]. The cryogenic fluid flow measurement system still needs to be further improved to meet the evolving demands of global energy development[9,10].
Scholars both domestically and internationally primarily focus on the research on standard devices for normal temperature fluid flow[11], while there is relatively little research on cryogenic fluid flow standard devices, mainly due to the physical characteristics of cryogenic fluids such as low viscosity and low density[12,13]. In the late 1960s, NASA developed a liquid hydrogen flow standard device based on the volumetric method[14,15,16], as shown in Figure 1.1. This device can achieve verification of mass flow rates in the range of 0.023~0.45 kg/s, with a calibration error of approximately 0.25% (k=2)[17]. During the verification preparation stage, a vacuum pump and a purge pump are used to purge impurity gases in the device to ensure stability and safety during verification[18]. During the verification process, liquid hydrogen in the supply tank flows Into the flowmeter under test In the test section, through the bottom diffuser to the collection tank under the pressure of cold helium gas. The liquid hydrogen level and density changes in the supply tank are measured by a float and a densitometer, and corrected in combination with the pressure and temperature changes in the test section, to realize the verification and calibration of the flowmeter. Based on the actual flow test, it was found that complete calibration of this device requires approximately 2 hours of operating time, which indirectly confirms the extremely high difficulty and requirements of liquid hydrogen flow measurement. This device eliminates the primary source of error in previous flowmeter calibrations, namely ensuring the constant, uniform, and single-phase flow state of liquid hydrogen during calibration.
In the 1970s, the Central Technical Institute (TNO) in the Netherlands developed a liquid hydrogen flow standard device[19] using the static mass method, enabling the calibration of turbine flowmeters with a maximum diameter of 2 inches. As shown in Figure 1.2, the device mainly consists of a helium air source, supply tank, weighing system, receiving tank, vacuum test section, flow regulating valve, and piping system. Similar to the NASA facility, this device also employs a precooling operation and helium gas pressurization drive. At the start of the calibration, the liquid hydrogen in the supply tank begins to flow under helium gas pressurization, while simultaneously starting the timer. The liquid hydrogen flows through the vacuum test section, passes the flowmeter under test, and then enters the receiving tank. The mass flow rate is calculated by the liquid hydrogen mass difference in the supply tank and the calibration time interval, completing the calibration of the flowmeter[20]. The measurement uncertainty of this device is approximately 0.4% (k=2), and its main uncertainty components are due to static mass and liquid hydrogen density measurement errors. Most of the working media of the existing low-temperature fluid flow standard devices at home and abroad are liquid nitrogen, and only a few are liquid hydrogen. Table 1 summarizes different institutions cryogenic fluid standard devices.
As the energy system continues to evolve, hydrogen trade volumes are expected to grow rapidly, leading to an increased demand for liquid hydrogen flow measurement[21,22]. Currently, the standard devices developed by NASA and TNO both use helium-driven systems and are not configured with a diverter, which prevents dynamic calibration at stable flow points, limiting it to cumulative flow measurements. Building on existing research on low-temperature fluid flow standard devices domestically and internationally[23,24], this paper proposes a design for a liquid hydrogen flow standard device that combines dynamic and static mass measurement methods. This design utilizes a diverter to control the direction of liquid hydrogen flow between different piping systems[25]. The diverter used in this liquid hydrogen flow standard apparatus adopts a dual high-precision electromagnetic valve linkage structure. Simulation studies analyzed the fluid reversing process for the piping configurations planned within the adiabatic vacuum cryostat, primarily analyzing the flow field characteristics and reversing performance under four piping structures: T-shaped, Y-shaped, U-shaped, and coil-shaped[26].
This paper will focus on the influence of different piping configuration on the switching process of the diverter [27]. Using water and liquid hydrogen as simulation media, the fluid flow state after the switching of the diverter under different piping is numerically simulated and analyzed[28,29]. The aim is to explore the rationality of the piping configuration design in the liquid hydrogen flow standard device, to reduce the standard uncertainty of device flow measurement.
2. Numerical Method
2.1. Geometric Modeling and Mesh Partitioning
To reduce the influence of the internal piping system of the cold box on the error during the actuator’s action, the computational fluid dynamics(CFD) method simulates the fluid flow state during the switching of the switching actuator under different piping configuration [30]. The overall flow field of the piping and the switching actuator is analyzed to ensure the rationality of the structural design of the internal piping system of the cold box. The switching actuator in the liquid hydrogen flow standard device consists of two high-precision solenoid valves. The internal structure of the valve is approximately “n” shaped. When closed, the valve core is in contact with the baffle to block fluid flow. When opened, the valve core separates from the baffle to allow fluid to pass through. To optimize calculation time and resources, the key device is structurally simplified, retaining its internal “n” shaped flow channel, as shown in Figure 1. Meanwhile, fluid switching simulations are conducted based on the currently proposed piping configuration inside the adiabatic vacuum cold box. The main piping configuration include T-shaped, Y-shaped, U-shaped, and coiled structures. SpaceClaim is utilized to model different piping configuration.
To ensure accuracy and precision during the numerical simulation solving process, hexahedral meshing of the piping configuration is performed using Fluent Meshing, as shown in Figure 2. Since the focus of this paper is on the fluid flow state in different piping during commutation, considering the flow region and computational accuracy, it was decided to use a minimum mesh size of 0.48 mm and a maximum mesh size of 1.95 mm. At the same time, the valve area in all piping configuration is refined as the research focus. For the overall calculation area of the piping, a 3-layer boundary layer is constructed by refining the mesh, as shown in Figure 3(a), to balance computational accuracy and efficiency.
2.2. Numerical Model
During the design and construction phase of the dynamic and static mass method liquid hydrogen flow standard device[31,32], ANSYS Fluent is used to simulate and analyze the fluid flow during diverter switching under different piping configurations. The piping structure with the least influence on the switching error of the diverter can be found, to ensure the rationality of the device structure design and the high reliability of the measurement accuracy.
Fluid flows through complex flow field structures with multiple pipeline bends, branches, and connection points. When the diverter switches direction, this causes vortices to form, creating a typical turbulence model[33]. During the process of fluid flow direction switching in different piping, the scales of the vortices exhibit diversity. Large-scale vortices obtain energy from the mainstream and gradually transfer the energy to small-scale vortices through interaction with other vortices. The small-scale vortices are eventually affected by fluid viscosity and dissipate, converting mechanical energy into thermal energy. The model is based on the RANS turbulence model, which describes turbulence by solving the turbulent kinetic energy () and turbulent dissipation rate () equations. It is one of the most widely used turbulence models in engineering and is suitable for many flow problems. In this model, the general forms of the equation and the equation are as follows:
(2-1)
(2-2)
Where: is the fluid density; is the velocity component; is the dynamic viscosity; is the turbulent viscosity; is the model parameter; is the turbulence production term; is the turbulence dissipation rate; is the model parameter; and are empirical constants.
The numerical simulation in this paper involves turbulence and includes complex flow structures such as pipeline bends, branches, and connection points. The Standard model can usually provide more reasonable results when dealing with these complex flow fields. Therefore, this paper chooses to use the Standard model for numerical simulation and solution.
3. Results and Discussion
3.1. Effects of T-Shaped Piping on the Internal Flow Field of the Diverter
The numerical simulation results of the velocity for the fluid flow state during the switching operation of the T-shaped piping diverter are shown in Figure 3. Figure 3(b1) and (d1) show the flow velocity distribution when the diverter opening is maximum in the self-circulating piping and the checking piping under the water condition, respectively. In the piping at the rear end of the diverter under the T-shaped piping, the fluid is subjected to inertia during the flow process, which biases it toward the lower wall of the piping. This not only leads to differences in flow velocity distribution, but may also induce fluid oscillations, and when the valve is suddenly converted from the closed state to the open state, the pressure accumulated by the fluid in front of the valve triggers a sudden increase in the flow velocity, resulting in the overshoot phenomenon.
In order to ensure the consistency of numerical simulation, the piping structure is the same as that of water when liquid hydrogen is used as the test medium. For the T-shaped piping, the numerical simulation results of the fluid flow state when the liquid hydrogen diverter is switched are shown in Figure 3. At the right-angle connection, the flow rate at the outer wall of the piping is small, while the flow rate at the inner wall is large, and the maximum flow rate of the fluid in the piping is larger than that of the water medium. Compared to the water, the fluid inertia of liquid hydrogen is much smaller than that of water at the same flow rate, and liquid hydrogen produces a greater change in velocity. Liquid hydrogen is more susceptible to compression than water, which may result in greater pressure fluctuations during commutation[34].
3.2. Effects of Y-Shaped Piping on the Internal Flow Field of the Diverter
Y-shaped piping can form different structures according to the angle between the two branch piping, which increases the rationality of the internal space and the stability of the fluid flow, the fluid flow velocity cloud diagram of the diverter action under the piping is shown in Figure 4, and the distribution of the flow velocity in the Y-shaped piping is affected by the viscous effect. Near the wall of the piping, the flow velocity decreases due to the viscous effect. At the same time between the two branches turbulent regions are generated due to the divergence of the fluid, resulting in the non-uniformity of the flow velocity distribution.
According to the numerical simulation velocity plot in the Y-shaped piping under the liquid hydrogen shown in Figure 4, the fluid flow state exhibits obvious non-uniformity when the diverter is switched. When the diverter is in action, the flow velocity distribution at the rear end of the diverter is characterized by an increase in the local fluid flow velocity, and the flow velocity distribution on the upper and lower walls shows a larger area. This non-uniformity of the flow velocity distribution may have a large impact on the switching of the diverter, thus reducing the accuracy of the calibration.
3.3. Effects of Coiled Piping on the Internal Flow Field of the Diverter
The fluid flow velocity plot when the diverter is operated under coil piping is shown in Figure 5. In the coiled part of the coil piping, the flow velocity changes differently due to the curvature of the piping. The fluid overshoot phenomenon at the rear end of the diverter when the diverter is actuated is inferior to that of the U-shaped piping, which has a larger fluid flow velocity retention. But this distribution of flow velocity in the coil piping helps to minimize the dead space, it is less likely to form a region of static fluid inside the piping.
Since liquid hydrogen is a low-temperature liquid and needs to be maintained at a low temperature in the piping, a coiled structure can provide sufficient surface area for more efficient cooling and heat transfer. According to the coiled structure shown in Figure 5, the distribution of the liquid hydrogen flow state presents a relatively uniform flow rate in the straight piping section as well as in the coiled structure. When the diverter is switched, a certain residual fluid flow rate is retained in the front and rear sections of the diverter, which negatively affects the piping structure and related equipment. In addition, accurate weighing of weighing vessels in liquid hydrogen fluid environments requires consideration of changes in flow velocity, as it may affect the flow behavior of liquid hydrogen in the vessel, which can have a significant impact on the weight measurement results, thereby reducing the accuracy of the calibration results.
3.4. Effects of U-Shaped Piping on the Internal Flow Field of the Diverter
U-shaped piping structure is slightly more complex, but its piping configuration can make the system in the space occupation is relatively small. Under the water, the flow velocity plot of the U-shaped piping is shown in Figure 6. The flow velocity is higher in the center of the U-shaped piping and lower at the edge of the piping. At the edge portion of the U-piping, the resistance to flow in the piping becomes greater, resulting in a decrease in the flow velocity of the fluid along the piping wall.
The design of U-shaped piping helps to minimize the velocity non-uniformity of the fluid in the piping as compared to T-shaped piping. As shown in Fig 6(a2), compared to a right-angle bend, the fluid experiences a smoother flow at the bend, which reduces the occurrence of turbulence and makes the flow velocity distribution relatively uniform. At the same time the flow velocity distribution at the diverter does not change much compared to the T-shaped piping, but the overshoot effect at the valve during diverter is significantly better than that of the T-shaped piping, which can effectively improve the measurement accuracy of the device, as shown in Figure 6(b2) and (d2). The geometrical configuration of the diverter results in a complex flow pattern at the diverter, in which the fluid also tends to the lower wall. The structure of the diverter plays a key role in the whole piping system and directly affects the flow distribution characteristics there.
Under the liquid hydrogen, the fluid flow distribution in the piping is approximately the same because the piping configuration is consistent with that in the water. The fluid flow rate distribution in the piping mainly reflects that the flow rate is larger at the outer wall and smaller at the inner wall, and the maximum flow rate in the piping exceeds that in the water. Given the low density physical properties of liquid hydrogen, this leads to a more pronounced effect of inertial forces on the fluid flow in the U-shaped piping. This effect causes liquid hydrogen to exhibit a turbulent structure in the U-shaped piping that is different from that of water, especially in the bends of the piping, where it causes a large centrifugal effect, leading to rotation and vortexing of the fluid, which results in a significant increase in flow velocity at the bends. At the same time, the low viscosity of liquid hydrogen causes the fluid molecules to be influenced by the piping walls. The viscous effect causes the fluid to be resisted by the wall, and thus the flow velocity is lower at the inner wall of the straight piping section. However, in straight piping sections, the flow rate is more uniform due to relatively few geometric constraints.
In the self-circulation piping system and the calibration piping, the sudden increase in flow velocity at the valve when the diverter is switched is mainly due to the rapid flow of fluid triggered at the instant of valve switching, which results in a significant increase in the flow velocity at the upper and lower walls, as shown in Figure 4(b2) and (d2). This phenomenon may be caused by the instantaneous pressure change of the fluid in the vicinity of the valve at the moment of diverter opening and closing. However, during the diverter action, the overshoot of the fluid before and after the diverter is relatively small, which largely reduces the uncertainty introduced by the diverter.
4. Conclusion
In this paper, the fluid flow state during the switching of the diverter in four different pipings is numerically simulated using Fluent Software. By constructing the piping and diverter structure model and using Fluent Meshing for mesh generation, transient simulation is performed using the standard turbulence model. The simulation results reveal the flow rate distribution of different piping structures under water and liquid hydrogen. The simulation results indicate that different piping structures can cause flow field disturbance and fluid overshoot during diverter. The “n” structure of the diverter is a key factor leading to uneven flow velocity distribution. Compared to water, liquid hydrogen exhibits more significant flow instability and overshoot effects due to its low density and low viscosity. Comprehensively comparing the four piping configuration, the U-shaped piping can most effectively suppress configuration overshoot, and its flow field stability is optimal, providing the optimal piping structure design scheme for reducing the measurement uncertainty of the device.
Author Contributions
Conceptualization, Yu Meng and Xiaobin Zhang; methodology, Xiang Li; software, Qingsong Shi and Xianlei Chen; validation, Yalei Zhao, Chengxu Tu and Fubing Bao; formal analysis, Shanyi Xu and Naifeng Nie; investigation, Daolin Wang and Zexian Zu; resources, Menghui Wu and Yanbo Peng; data curation, Xiang Li; writing—original draft preparation, Qingsong Shi; writing—review and editing, Yalei Zhao, Chengxu Tu and Fubing Bao; visualization, Shanyi Xu and Naifeng Nie; supervision, Yalei Zhao, Chengxu Tu and Fubing Bao; project administration, Yu Meng; funding acquisition, Yu Meng. All authors have read and agreed to the published version of the manuscript.
Funding
This work was supported by National Key R&D Program of China (2024YFF0620003), the Key R&D Program of Zhejiang Province (2021C01099), Major Projects of Zhejiang Provincial Natural Science Foundation (LD24E050002), Key Project of the Science and Technology Plan of Zhejiang Provincial Market Supervision Administration for the Year 2025 (Grant No ZD2025025), Open Fund of Fujian Key Laboratory of Energy and Carbon Measurement (Fujian Metrology Institute) (NYJL-KFKT-2022-03)
Data Availability Statement
Data will be made available upon request.
Conflicts of Interest
The authors declare no conflicts of interest.
References
- VEZIROĞLU T N, ŞAHI S. 21st Century’s energy: Hydrogen energy system [J]. Energy conversion and management, 2008, 49(7): 1820-31.
- FONSECA J D, CAMARGO M, COMMENGE J-M, et al. Trends in design of distributed energy systems using hydrogen as energy vector: A systematic literature review [J]. International journal of hydrogen energy, 2019, 44(19): 9486-504. [CrossRef]
- DEWAR J. Liquid hydrogen [J]. Nature, 1898, 58(1501): 319-.
- GERHOLD J. Cryogenic liquids-a prospective insulation basis for future power equipment [J]. IEEE transactions on dielectrics and electrical insulation, 2002, 9(1): 68-75. [CrossRef]
- AHMAD A, AL-DADAH R, MAHMOUD S. Air conditioning and power generation for residential applications using liquid nitrogen [J]. Applied energy, 2016, 184: 630-40. [CrossRef]
- QIU Y, YANG H, TONG L, et al. Research Progress of Cryogenic Materials for Storage and Transportation of Liquid Hydrogen [J]. Metals, 2021, 11(7). [CrossRef]
- LI M, MING P, HUO R, et al. Economic assessment and comparative analysis of hydrogen transportation with various technical processes [J]. Journal of Renewable and Sustainable Energy, 2023, 15(2). [CrossRef]
- GIL-ESMENDIA A, FLORES R J, BROUWER J. Modeling and improving liquid hydrogen transfer processes [J]. Applied Energy, 2025, 390. [CrossRef]
- CASTRO-CARRANZA A, VEGA-HERNANDEZ P, NOLASCO J C, et al. Detection of Hydrogen Dissolved in Liquid Media: A Review and Outlook [J]. Physica Status Solidi a-Applications and Materials Science, 2022, 219(12). [CrossRef]
- NAQUASH A, AGARWAL N, LEE M. A Review on Liquid Hydrogen Storage: Current Status, Challenges and Future Directions [J]. Sustainability, 2024, 16(18). [CrossRef]
- FURUICHI N, SATO H, TERAO Y, et al. A new calibration facility for water flowrate at high Reynolds number [J]. Flow Measurement and Instrumentation, 2009, 20(1): 38-47. [CrossRef]
- SCOTT T A. Solid and liquid nitrogen [J]. Physics Reports, 1976, 27(3): 89-157.
- KENT A. Properties of liquid helium [M]. Experimental low-temperature physics. Springer. 1993: 52-75.
- WARSHAWSKY I, HOBART H, MINKIN H. Small turbine-shaped flowmeters for liquid hydrogen [J]. Flow-Its Measurement and Control in Science and Industry, 1974, 1.
- MINKIN H L, HOBART H F, WARSHAWSKY I. Liquid-hydrogen flowmeter calibration facility; proceedings of the Advances in Cryogenic Engineering: Proceedings of the 1961 Cryogenic Engineering Conference University of Michigan Ann Arbor, Michigan August 15–17, 1961, F, 1962 [C]. Springer.
- DEAN J, BRENNAN J, MANN D. Cryogenic Flow Research Facility of the National Bureau of Standards; proceedings of the Advances in Cryogenic Engineering: Proceedings of the 1968 Cryogenic Engineering Conference Case Western Reserve University Cleveland, Ohio August 19–21, 1968, F, 1969 [C]. Springer.
- BIRMINGHAM B, BROWN E H, CLASS C, et al. Vessels for the storage and transport of liquid hydrogen [J]. Journal of Research of the National Bureau of Standards, 1957, 58(5): 243. [CrossRef]
- OH S J, KWON J, JEON K S, et al. A numerical analysis study on the characteristics of evaporation in liquid hydrogen tank with vacuum layer according to changes in heat flux and vacuum pressure [J]. International Journal of Hydrogen Energy, 2024, 50: 542-57.
- COLENBRANDER C, OPSCHOOR G. Calibration test rig for liquid hydrogen flowmeters [J]. Cryogenics, 1974, 14(8): 455-8. [CrossRef]
- XIONG M, YANG J-B, ZHAO P-J, et al. Liquefied Natural Gas (LNG) dispenser verification device; proceedings of the Eighth International Symposium on Precision Engineering Measurement and Instrumentation, F, 2013 [C]. SPIE.
- RIGAS F, SKLAVOUNOS S. Evaluation of hazards associated with hydrogen storage facilities [J]. International Journal of Hydrogen Energy, 2005, 30(13-14): 1501-10. [CrossRef]
- AASADNIA M, MEHRPOOYA M. Large-scale liquid hydrogen production methods and approaches: A review [J]. Applied Energy, 2018, 212: 57-83. [CrossRef]
- JEWETT R P, WALTER R, CHANDLER W, et al. Hydrogen environment embrittlement of metals [R], 1973.
- KIM J H, PARK D K, KIM T J, et al. Thermal-Structural Characteristics of Multi-Layer Vacuum-Insulated Pipeline for the Transfer of Cryogenic Liquid Hydrogen [J]. Metals, 2022, 12(4).
- QIU Y, HU Z, LI Q, et al. Analysis of pressure control for CSNS cryogenic hydrogen circulation; proceedings of the Asia-Pacific Power and Energy Engineering Conference (APPEEC), Shanghai, PEOPLES R CHINA, F 2012, Mar 27-29, 2012 [C]. 2012.
- SHU Z, LEI G, LIANG W, et al. Rapid prediction of water hammer characteristics in liquid hydrogen storage and transportation systems: A theoretical model [J]. Renewable Energy, 2024, 230. [CrossRef]
- MENG J, GUO F, IEEE. Production, Storage, Transportation and Simulation Scheme of Hydrogen Energy; proceedings of the 5th International Symposium on New Energy and Electrical Technology-ISNEET, Hangzhou, PEOPLES R CHINA, F 2024, Dec 27-29, 2024 [C]. 2024.
- KUNNIYOOR K R, GOVIND R, VENKATESWARAN K S, et al. Liquid hydrogen pipeline chill-down: Mathematical modelling and investigation [J]. Cryogenics, 2021, 118. [CrossRef]
- BA Q, HE Q, ZHOU B, et al. Modeling of cryogenic hydrogen releases [J]. International Journal of Hydrogen Energy, 2020, 45(55): 31315-26. [CrossRef]
- HARTWIG J W, DARR S R, MEYERHOFER P, et al. EDU liquid acquisition device outflow tests in liquid hydrogen: Experiments and analytical modeling [J]. Cryogenics, 2017, 87: 85-95. [CrossRef]
- HARTWIG J W, CHATO D J, MCQUILLEN J B, et al. Screen channel liquid acquisition device outflow tests in liquid hydrogen [J]. Cryogenics, 2014, 64: 295-306. [CrossRef]
- HARTWIG J, MANN J A, JR., DARR S R. Parametric analysis of the liquid hydrogen and nitrogen bubble point pressure for cryogenic liquid acquisition devices [J]. Cryogenics, 2014, 63: 25-36.
- WILCOX D. Turbulence modeling-an overview; proceedings of the 39th aerospace sciences meeting and exhibit, F, 2001 [C].
- SHU Z, LIANG W, QIN B, et al. Transient flow dynamics behaviors during quick shut-off of ball valves in liquid hydrogen pipelines and storage systems [J]. Journal of Energy Storage, 2023, 73. [CrossRef]
Figure 1.
Structure diagram of diverter, (a) Valve mechanical structure diagram(b) Valve simplified model diagram.
Figure 1.
Structure diagram of diverter, (a) Valve mechanical structure diagram(b) Valve simplified model diagram.
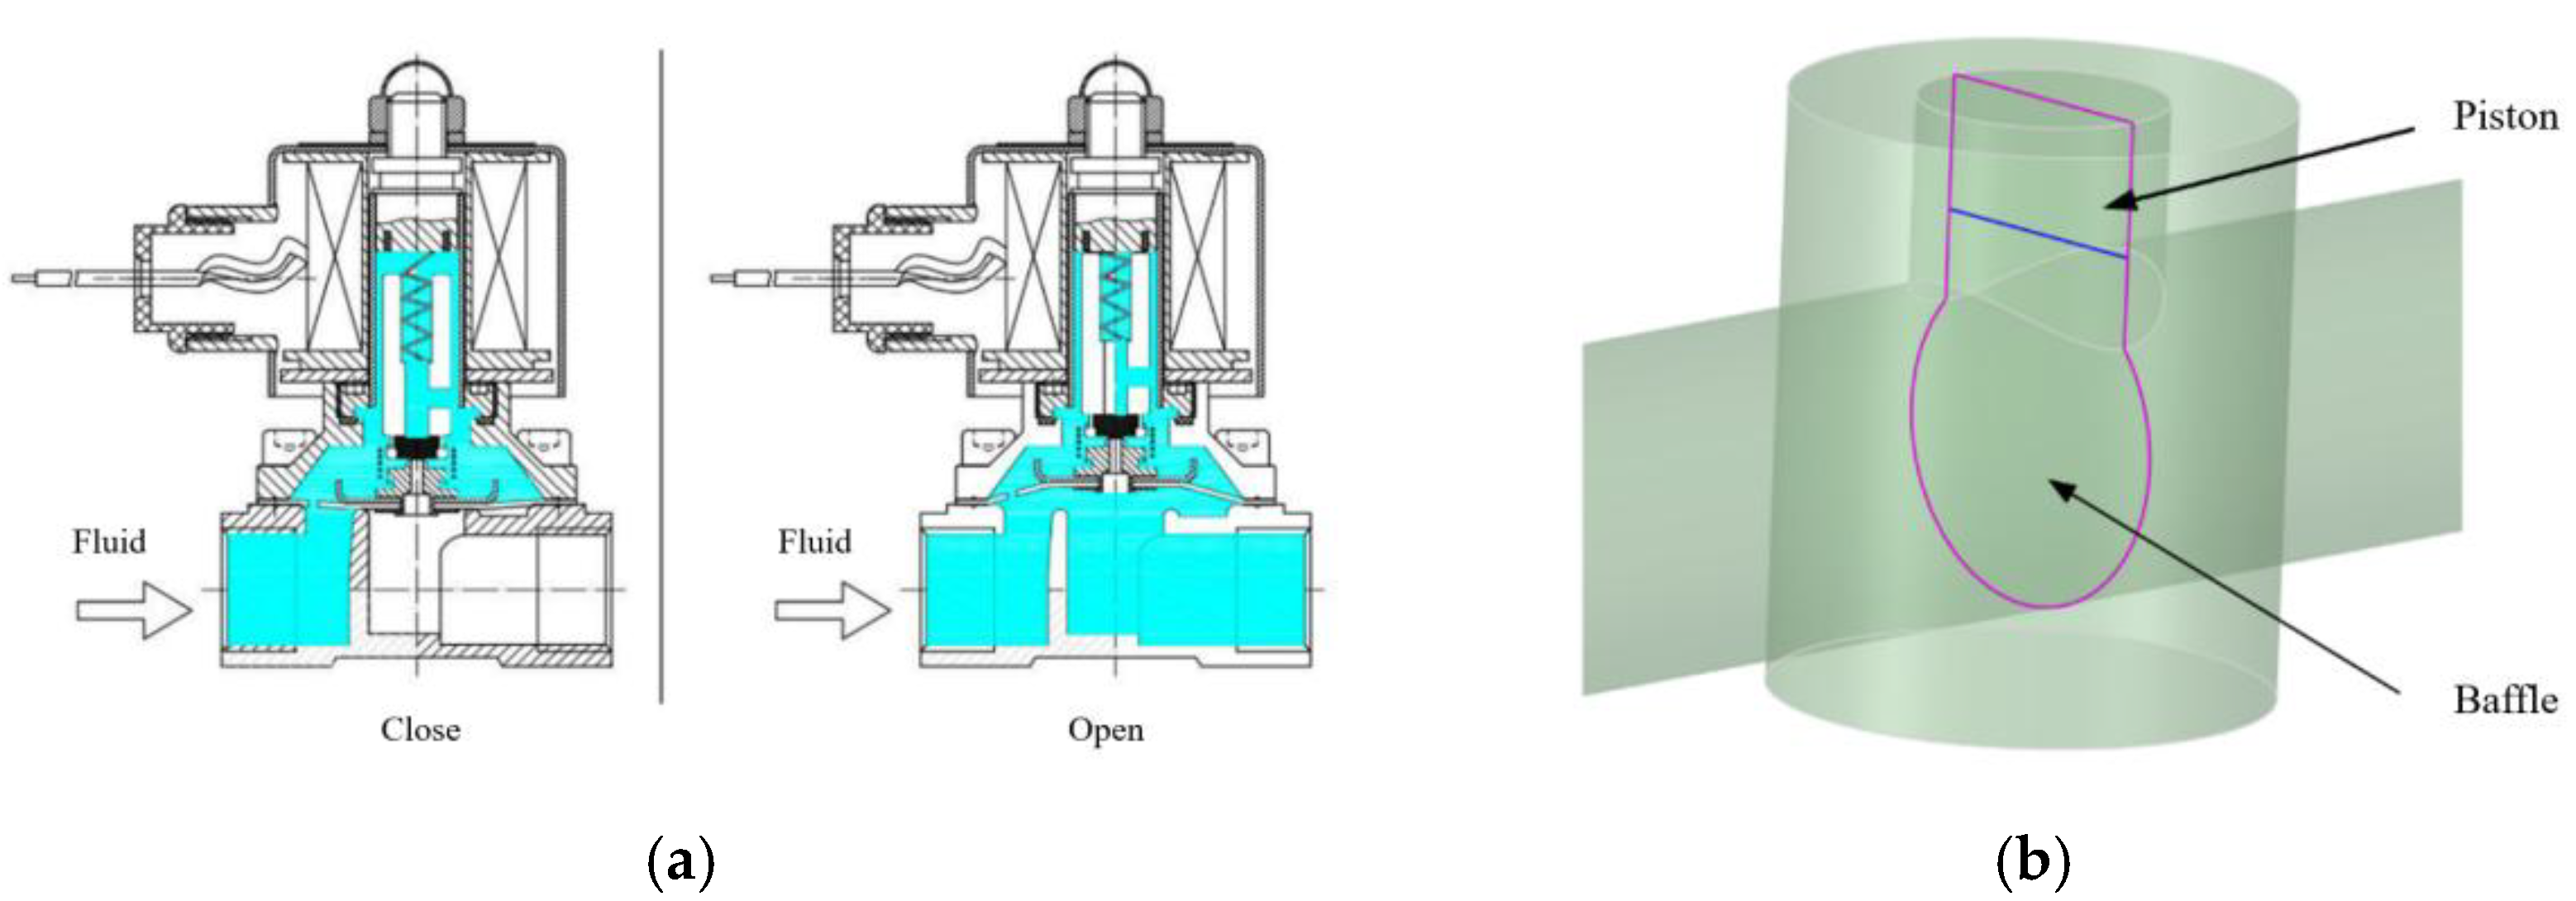
Figure 2.
Mesh of piping structure model, (a) T-shaped piping model mesh generation(b) U-shaped piping model mesh generation(c) Y-shaped piping model mesh generation(d) Coiled piping model mesh generation.
Figure 2.
Mesh of piping structure model, (a) T-shaped piping model mesh generation(b) U-shaped piping model mesh generation(c) Y-shaped piping model mesh generation(d) Coiled piping model mesh generation.
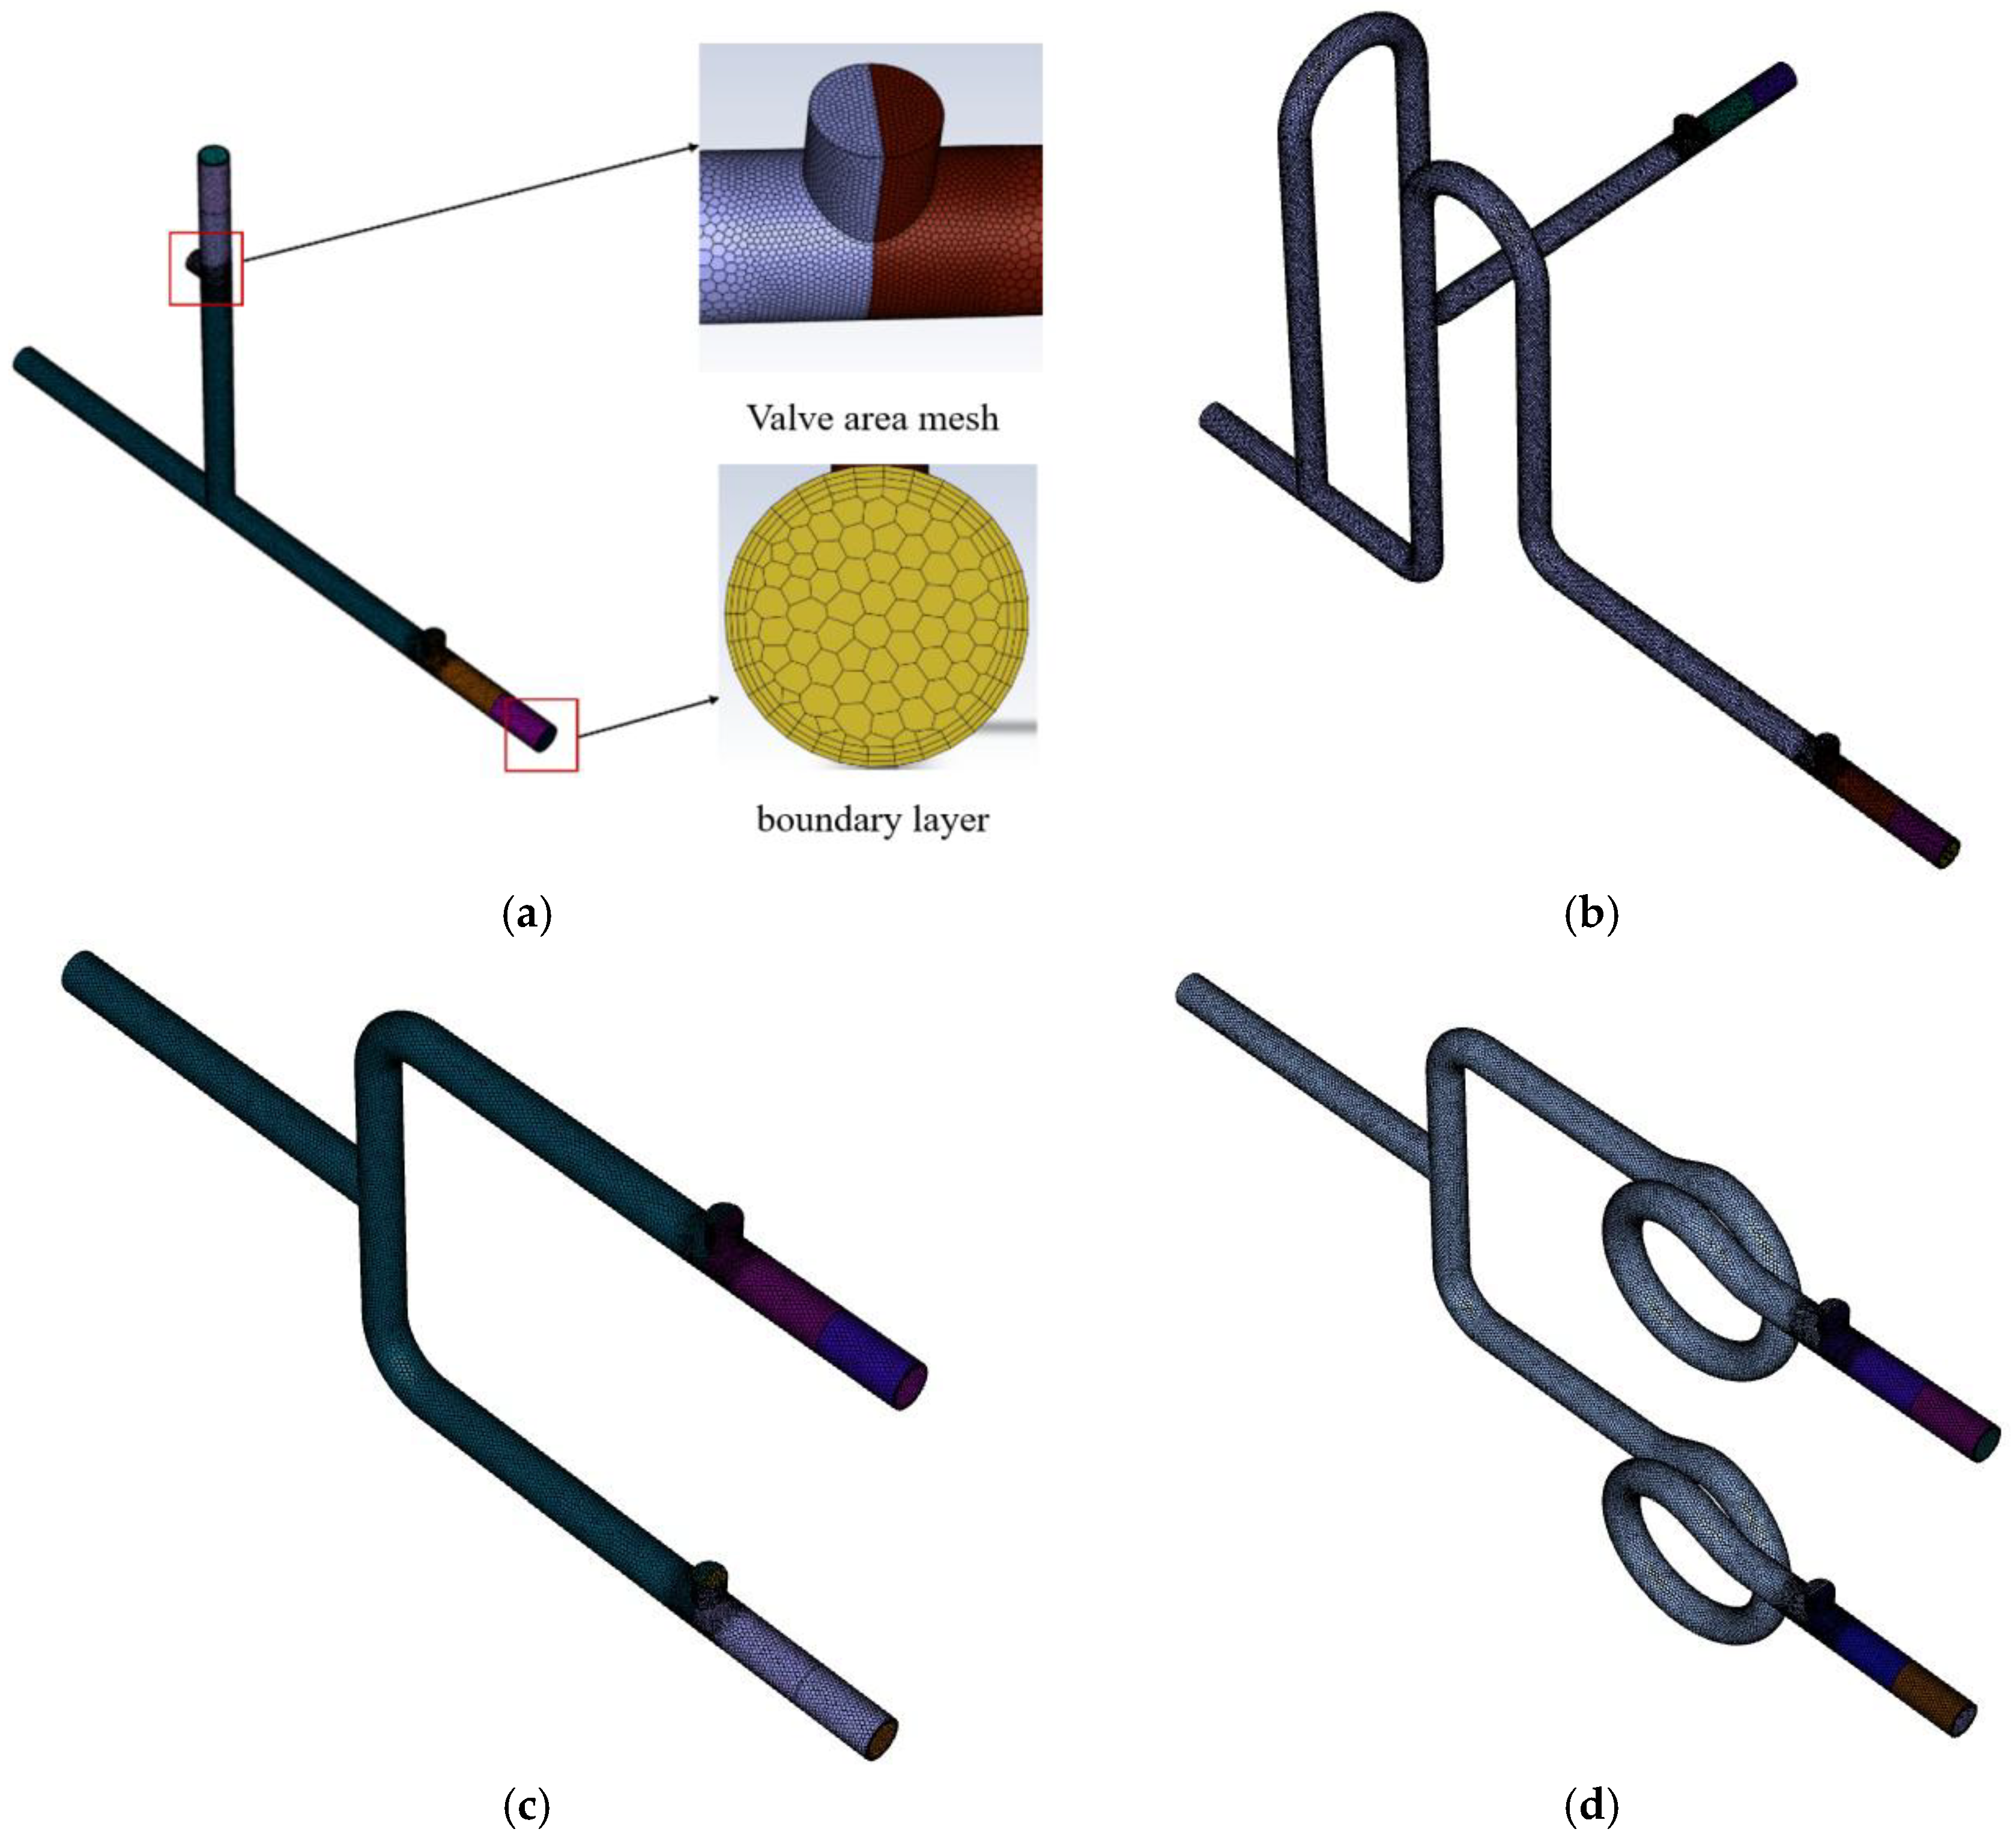
Figure 3.
Velocity plot of diverter switching pipeline under T-shaped piping, The subscript 1 represents the water case, and the subscript 2 represents the liquid hydrogen case. (a1), (a2)Velocity distribution of by-pass; (b1), (b2) Velocity distribution of by-pass at maximum opening; (c1), (c2) Velocity distribution of weighing tank; (d1), (d2) Velocity distribution of weighing tank at maximum opening.
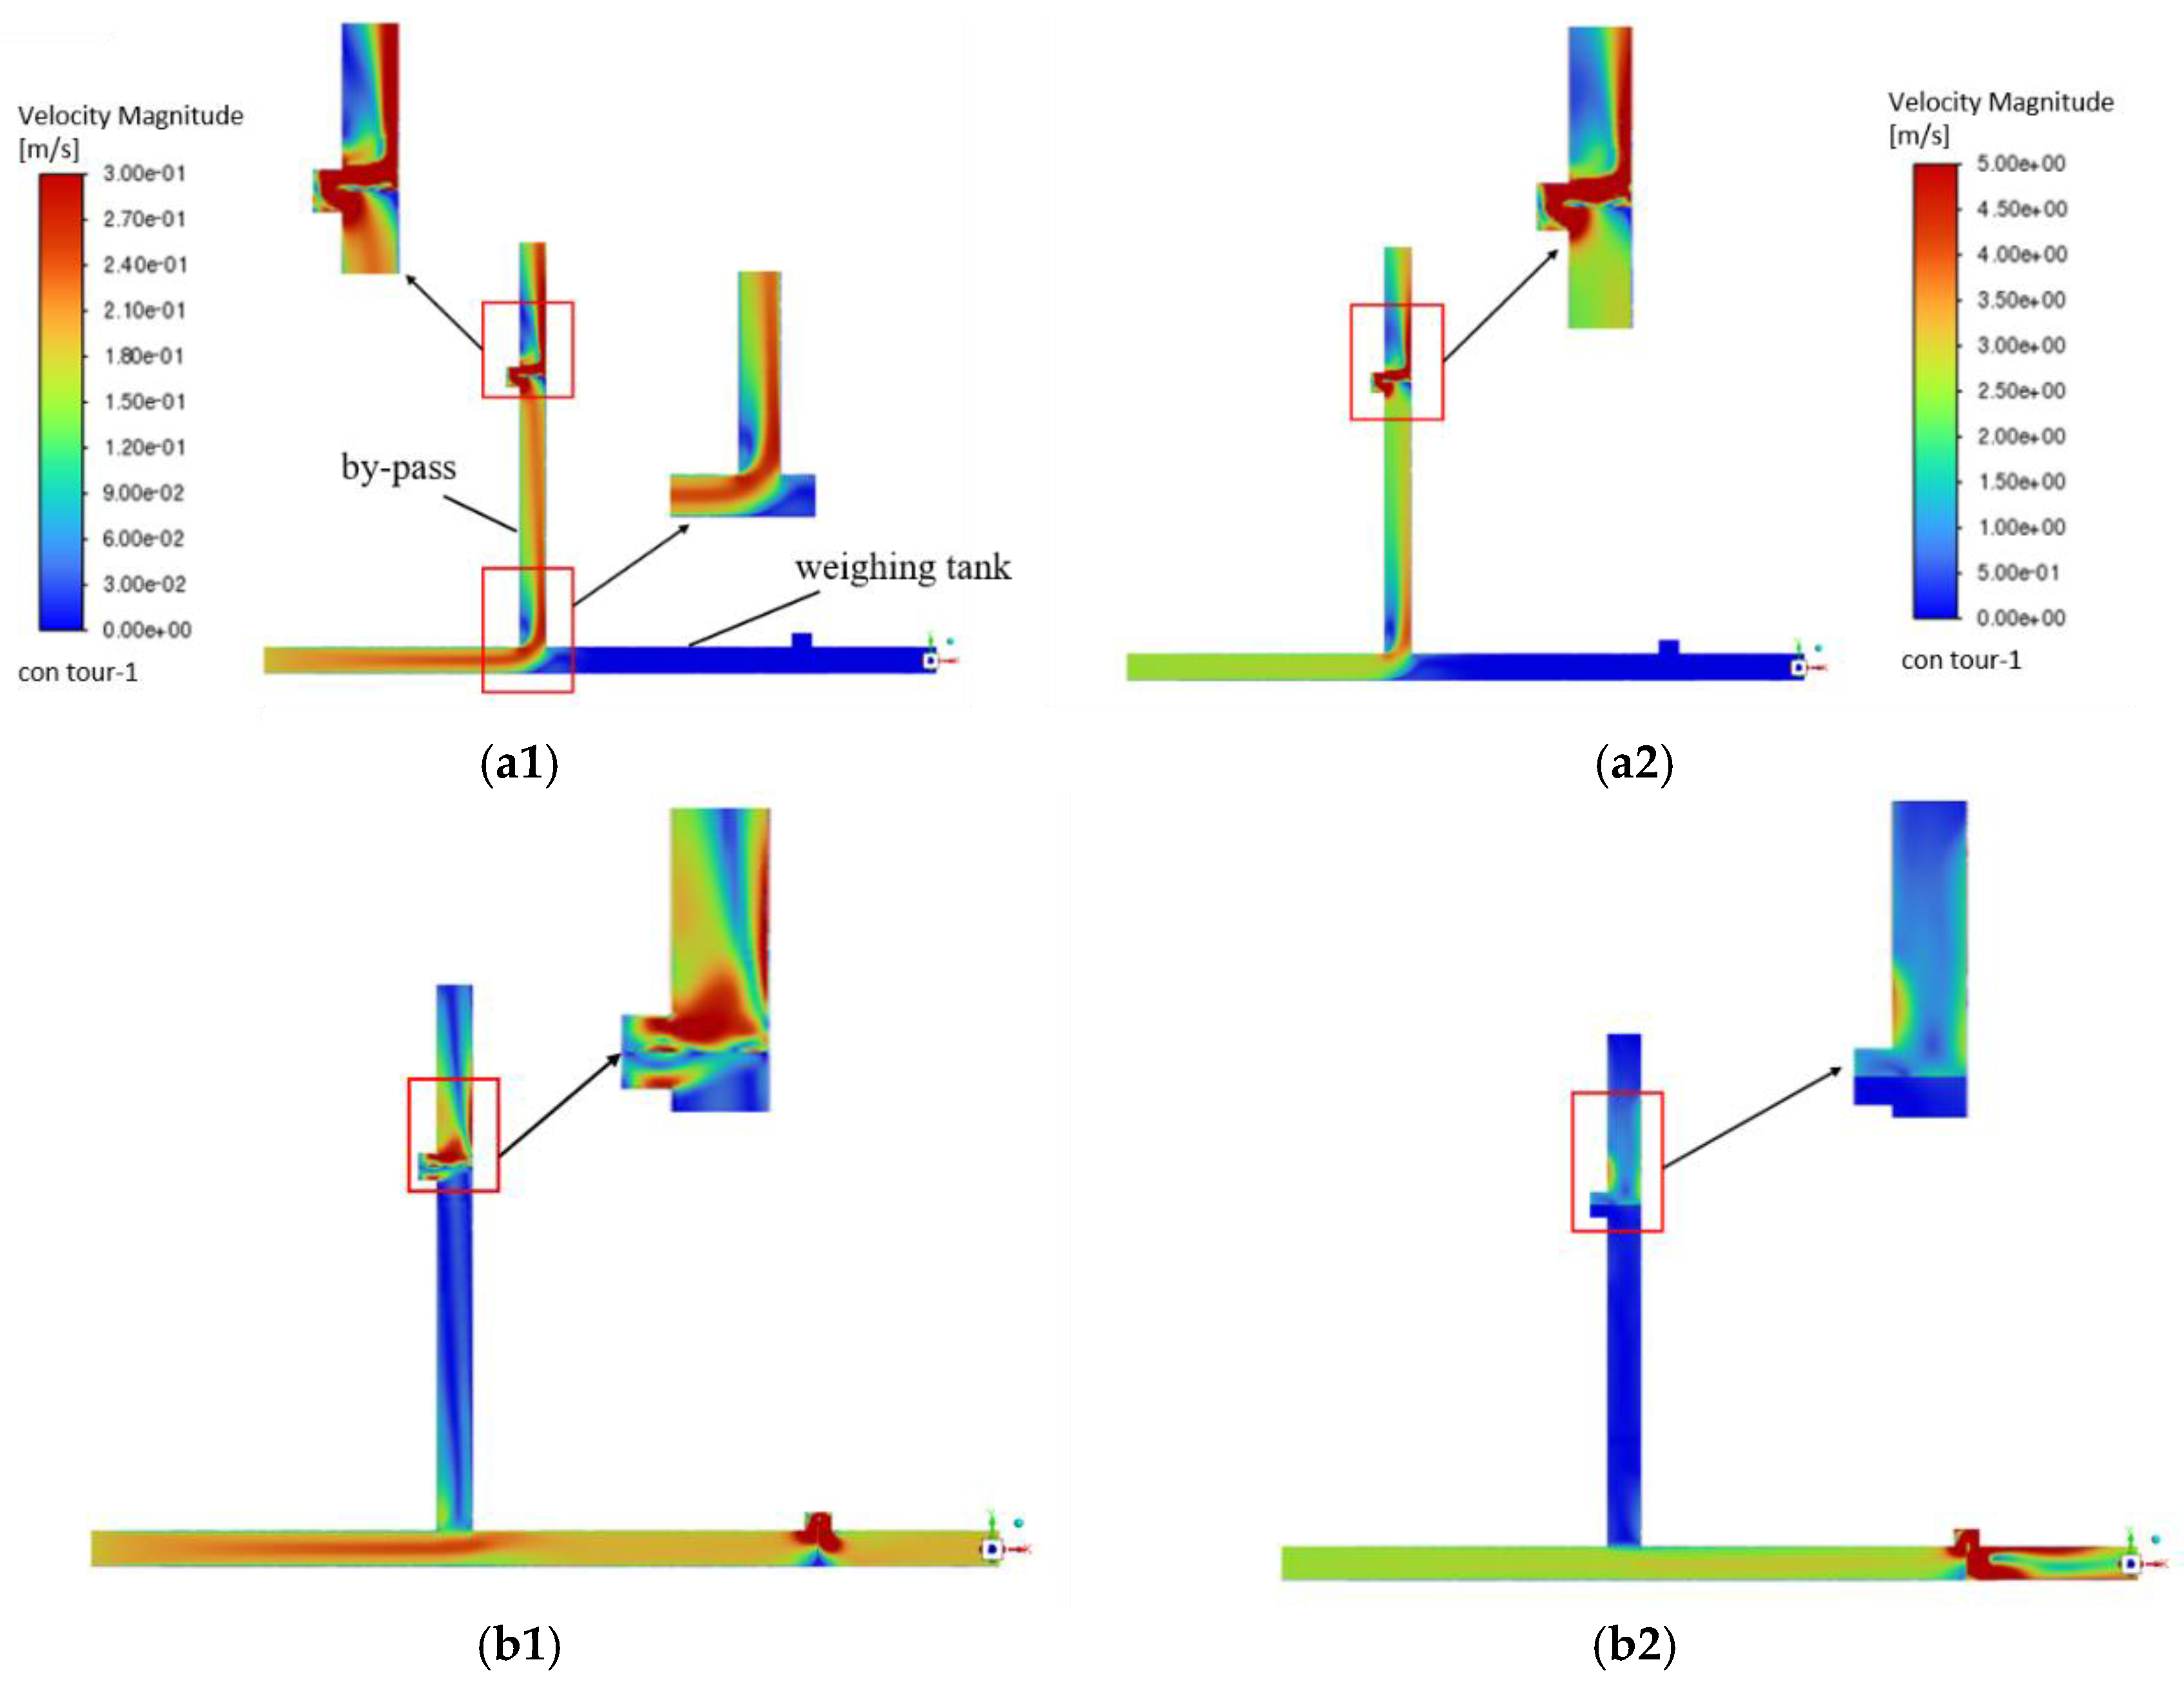
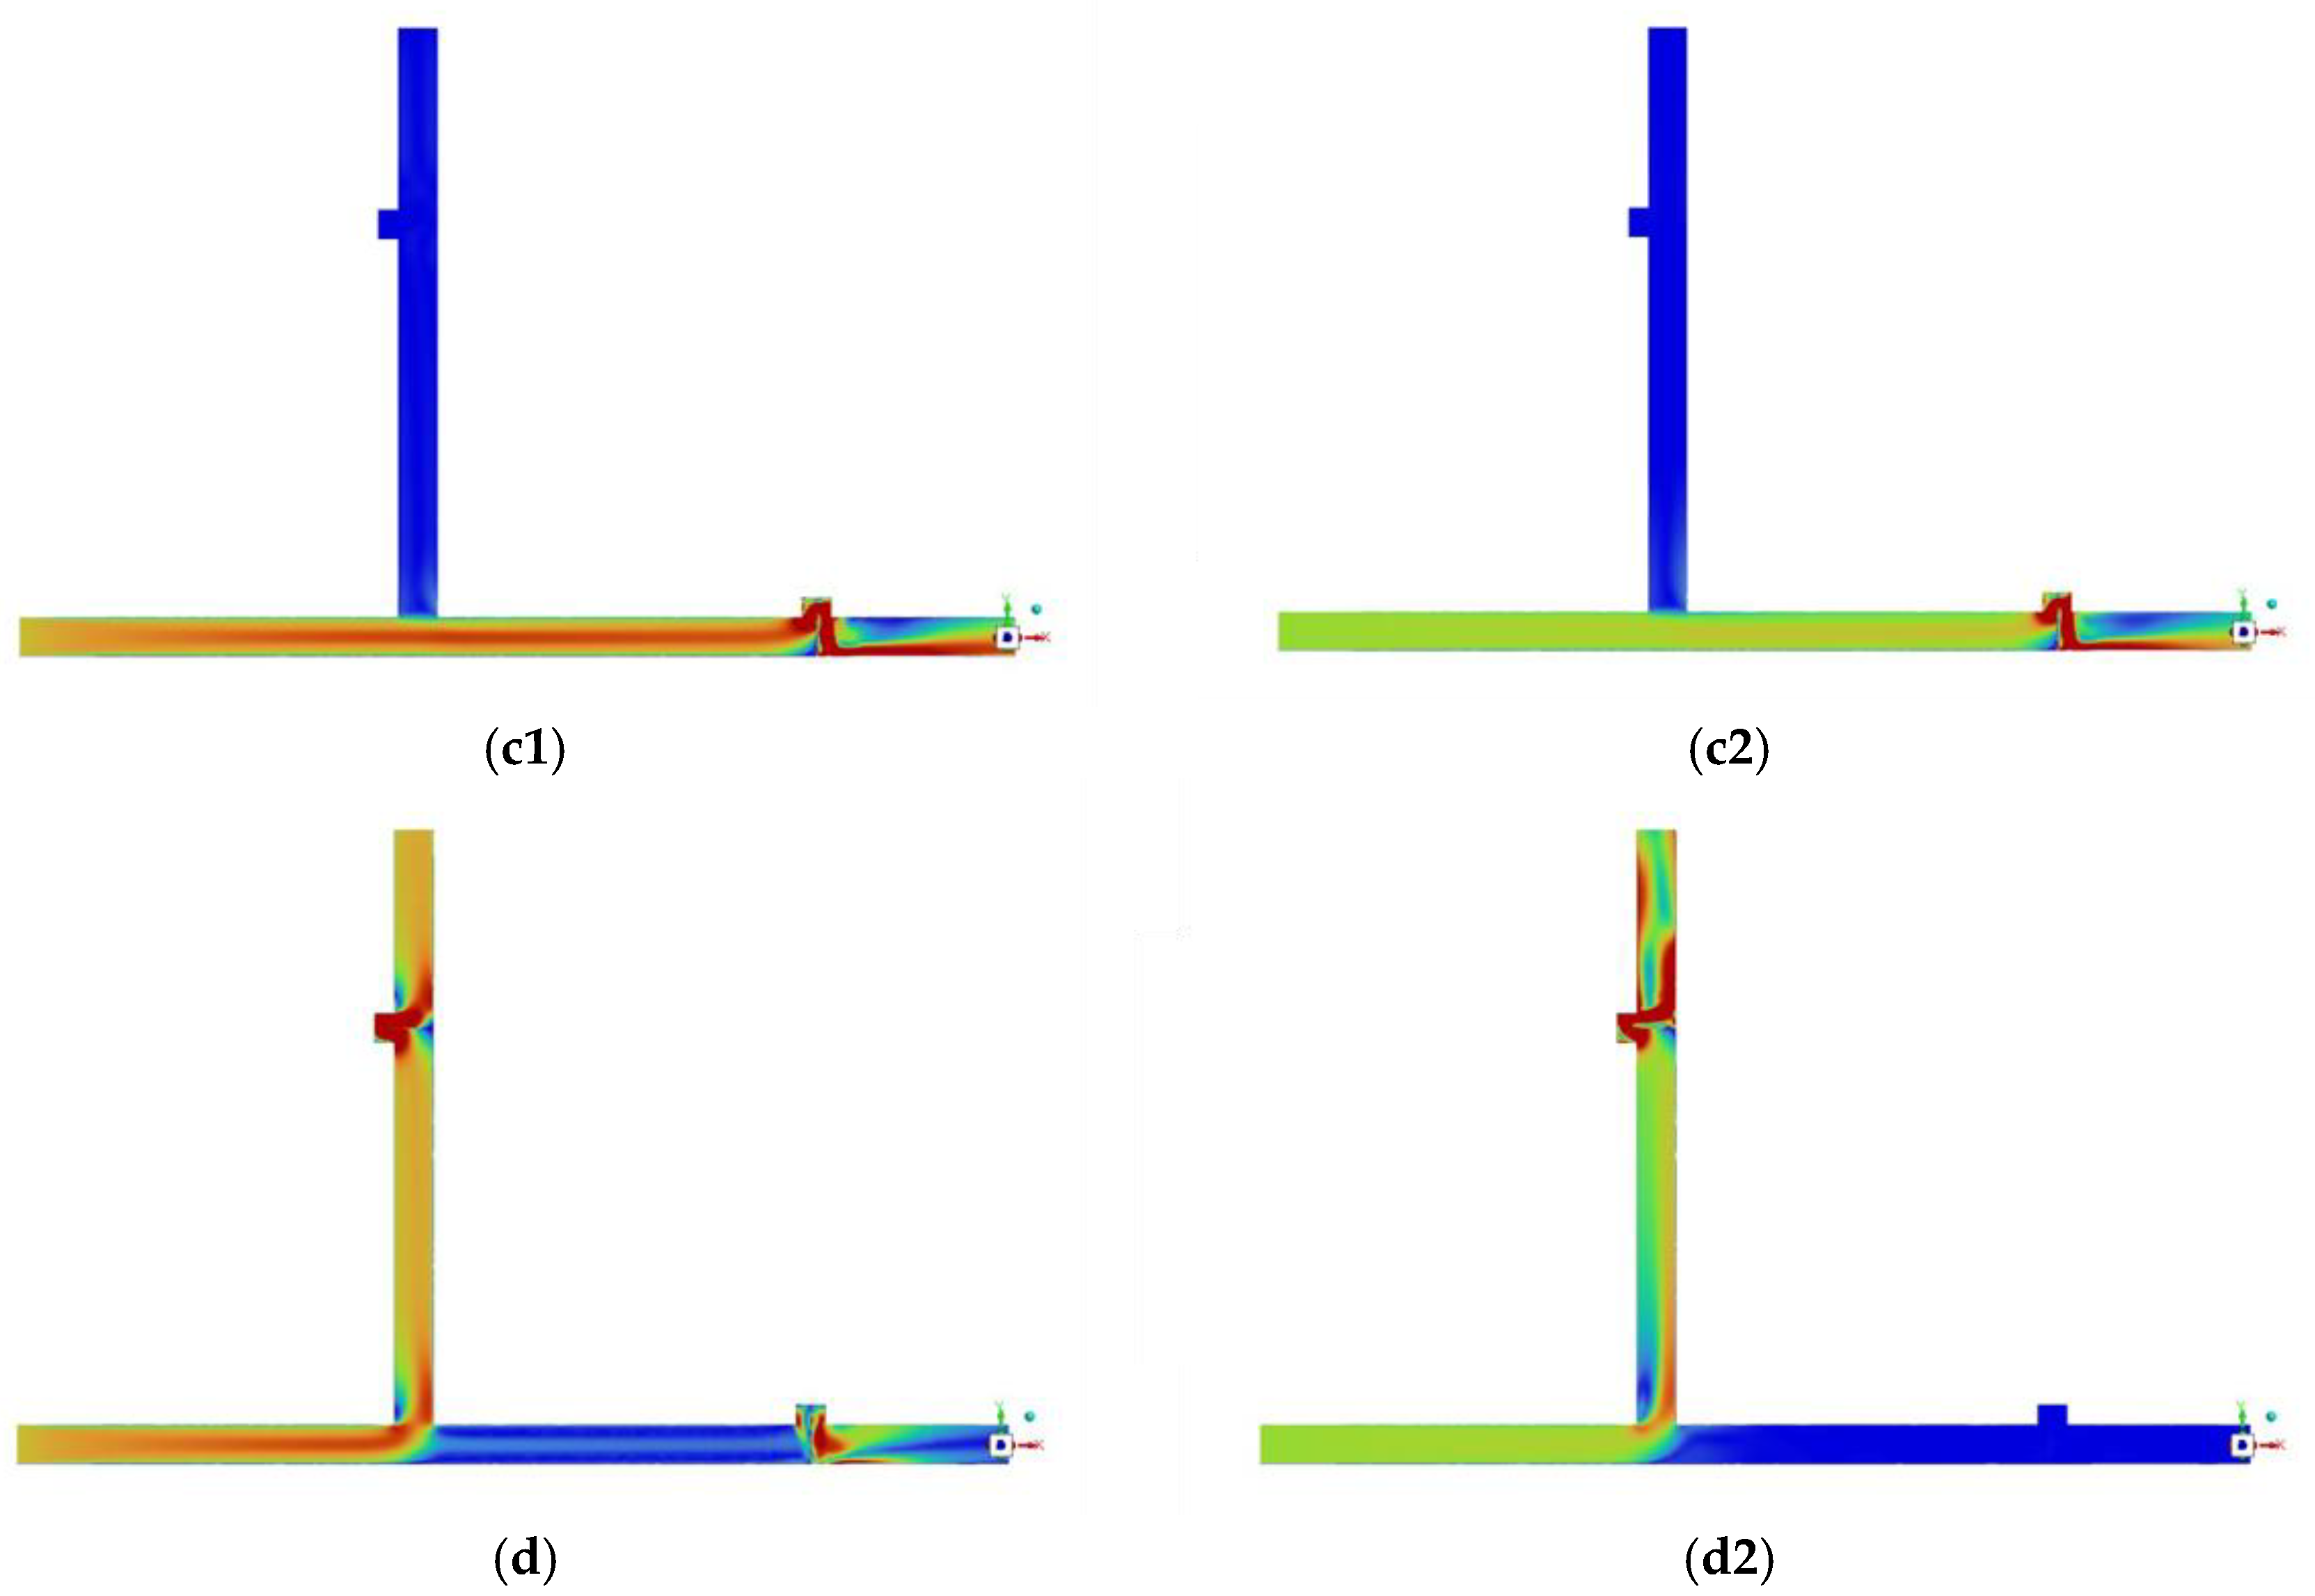
Figure 4.
Velocity plot of diverter switching pipeline under Y-shaped piping, The subscript 1 represents the water case, and the subscript 2 represents the liquid hydrogen case. (a1), (a2)Velocity distribution of by-pass; (b1), (b2) Velocity distribution of by-pass at maximum opening; (c1), (c2) Velocity distribution of weighing tank; (d1), (d2) Velocity distribution of weighing tank at maximum opening.
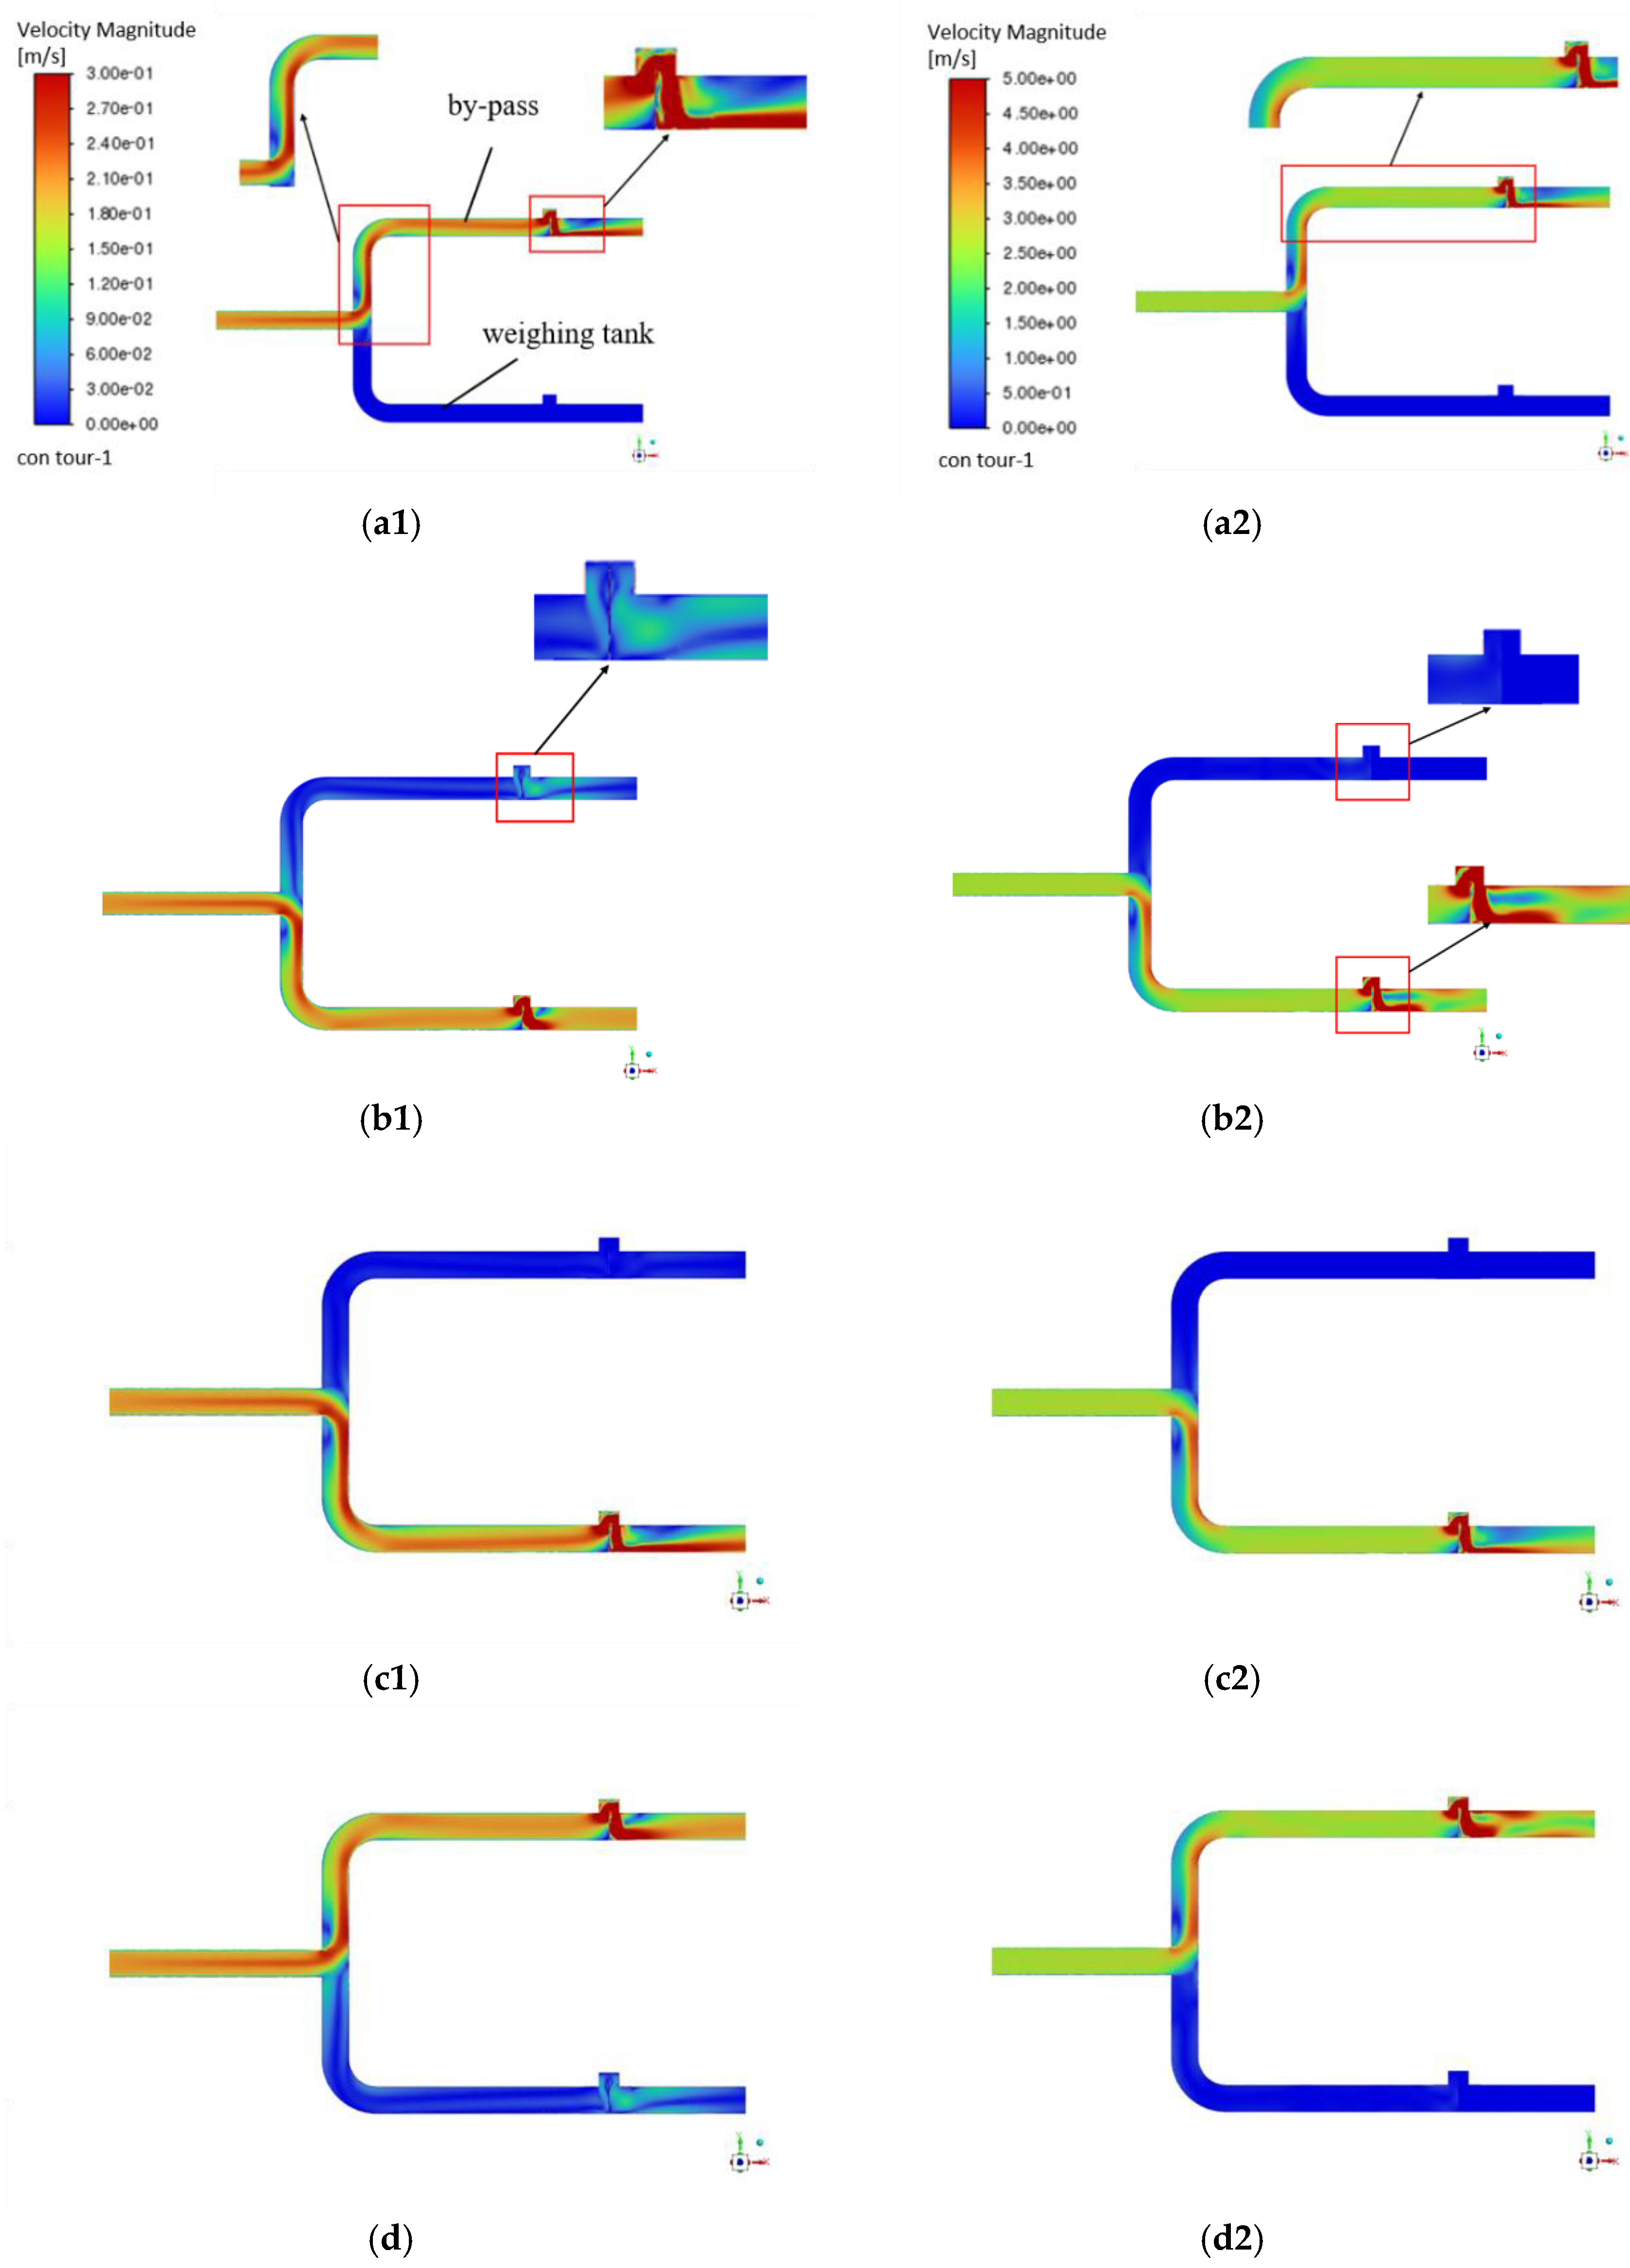
Figure 5.
Velocity plot of diverter switching pipeline under coil pipin, The subscript 1 represents the water case, and the subscript 2 represents the liquid hydrogen case. (a1), (a2)Velocity distribution of by-pass; (b1), (b2) Velocity distribution of by-pass at maximum opening; (c1), (c2) Velocity distribution of weighing tank; (d1), (d2) Velocity distribution of weighing tank at maximum opening.
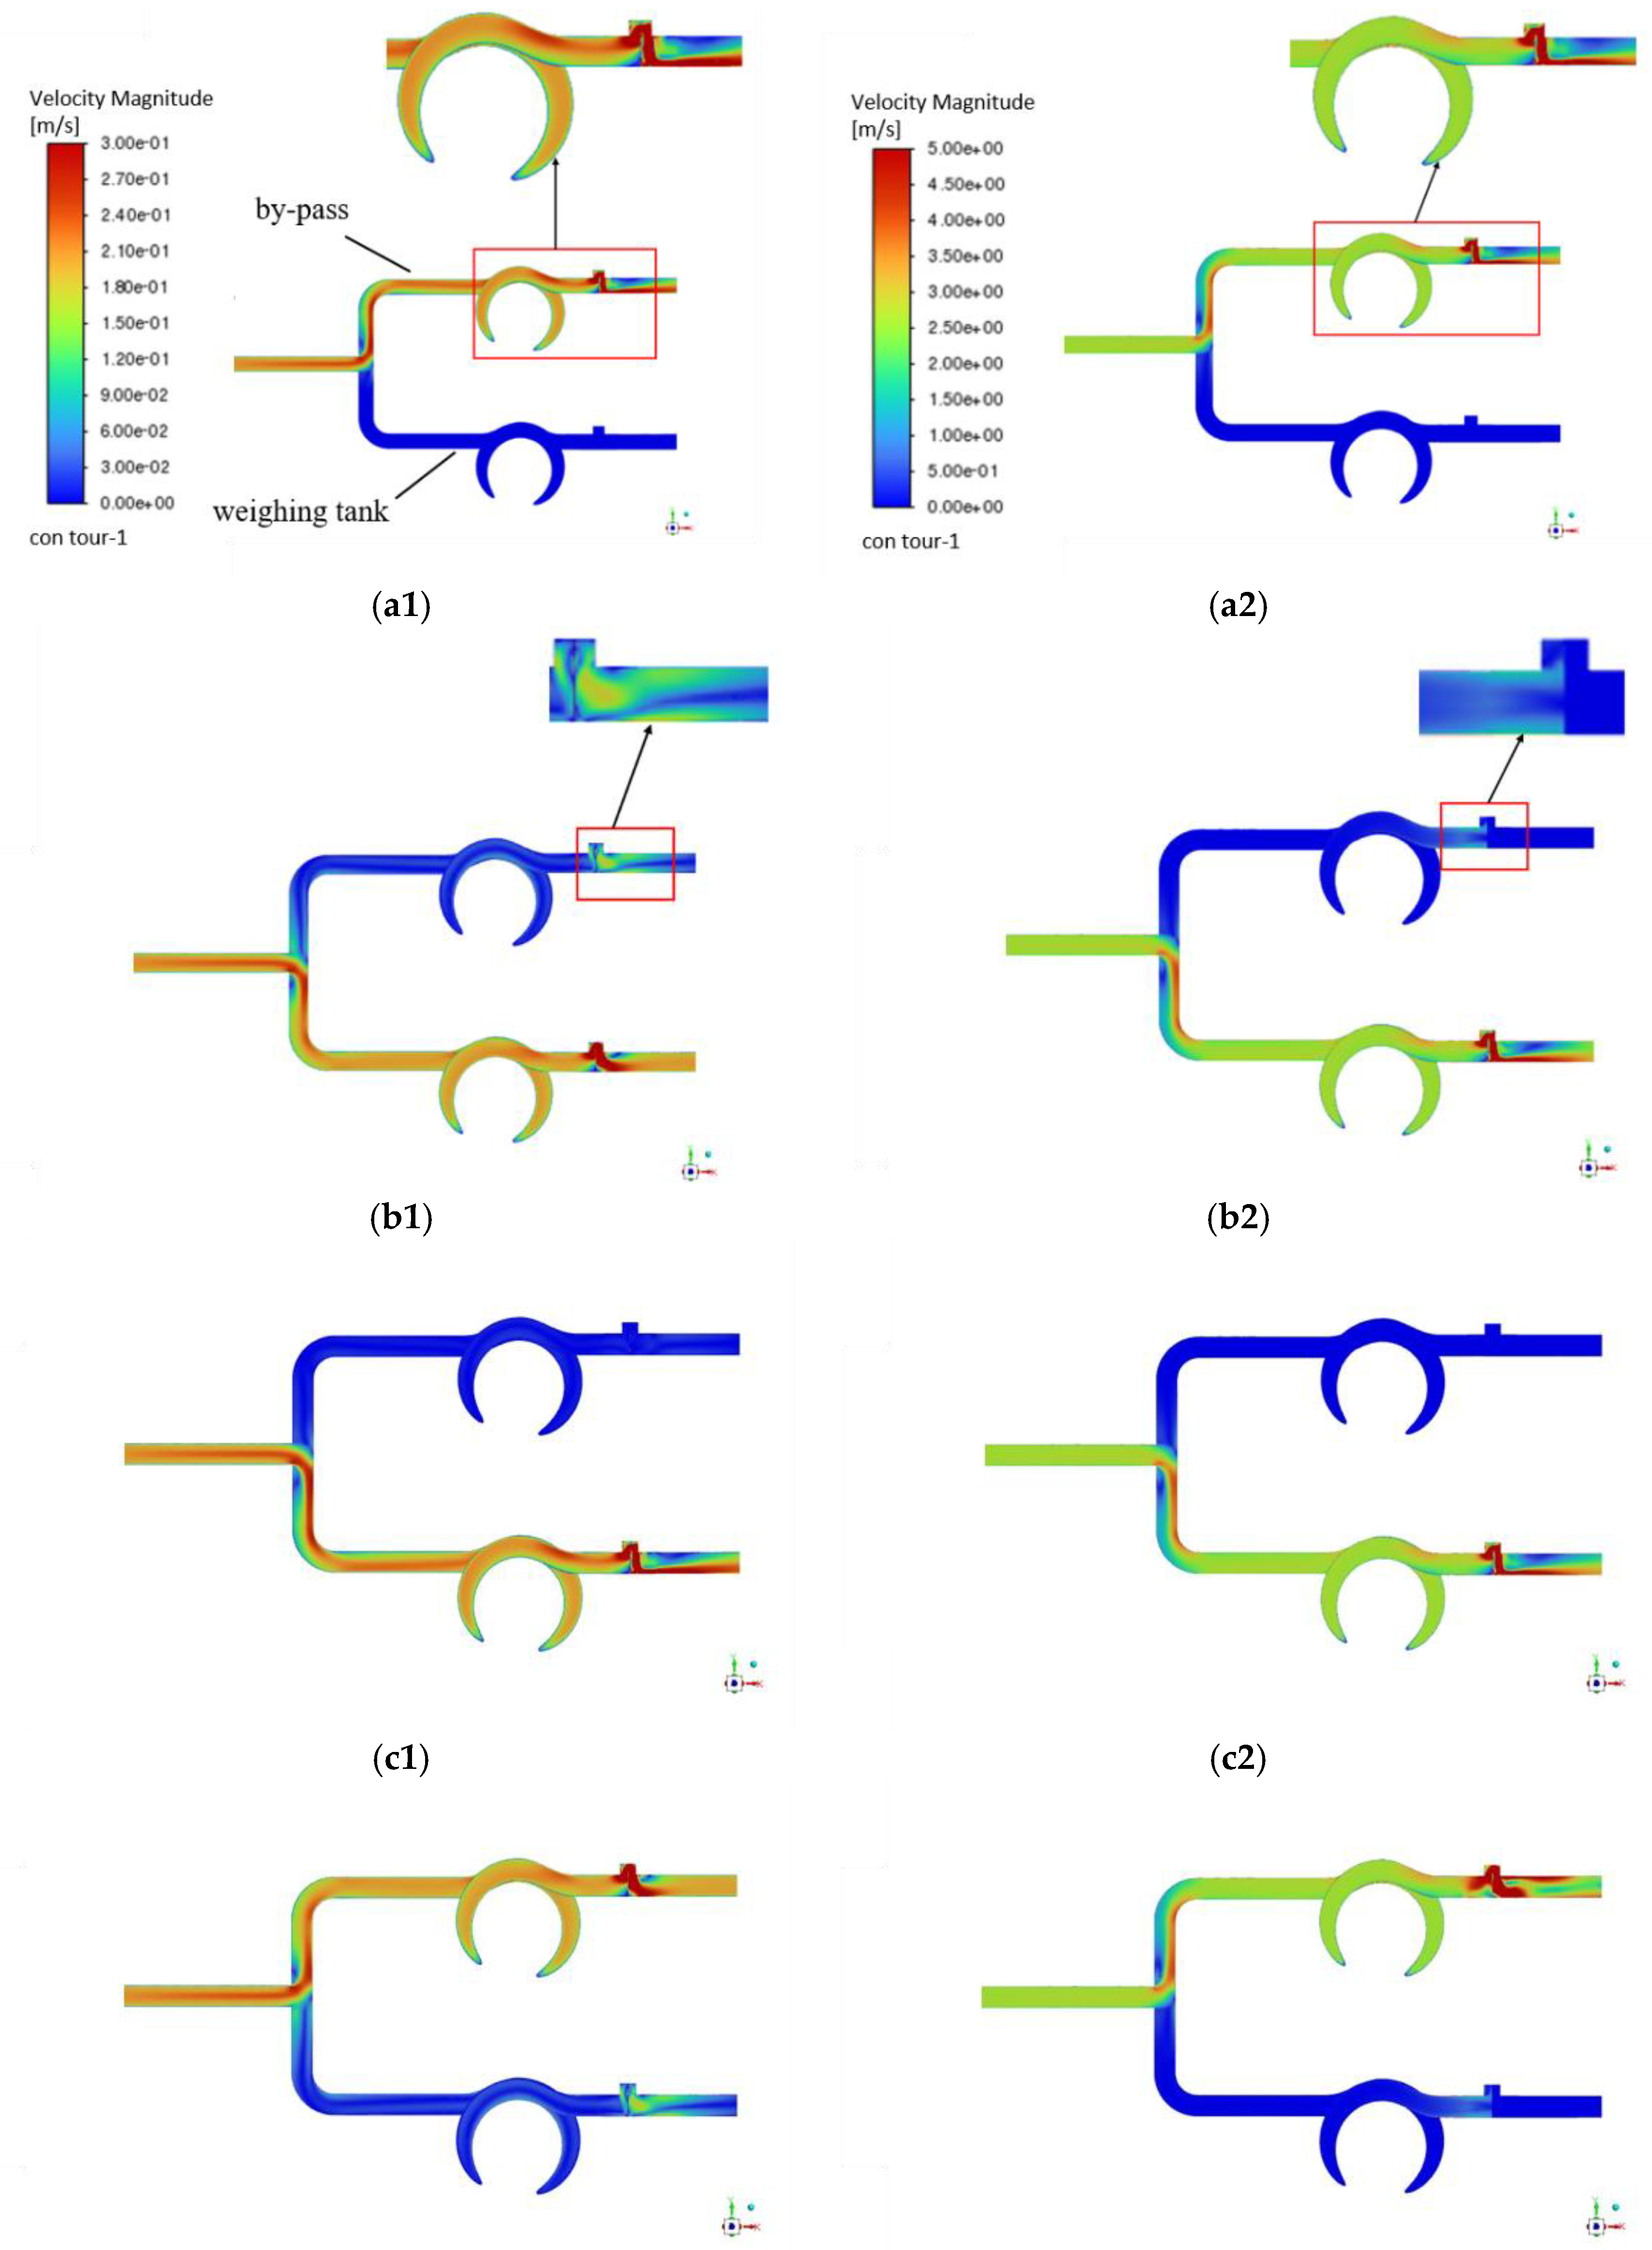

Figure 6.
Velocity plot of diverter switching pipeline under U-shaped piping, The subscript 1 represents the water case, and the subscript 2 represents the liquid hydrogen case. (a1), (a2)Velocity distribution of by-pass; (b1), (b2) Velocity distribution of by-pass at maximum opening; (c1), (c2) Velocity distribution of weighing tank; (d1), (d2) Velocity distribution of weighing tank at maximum opening.
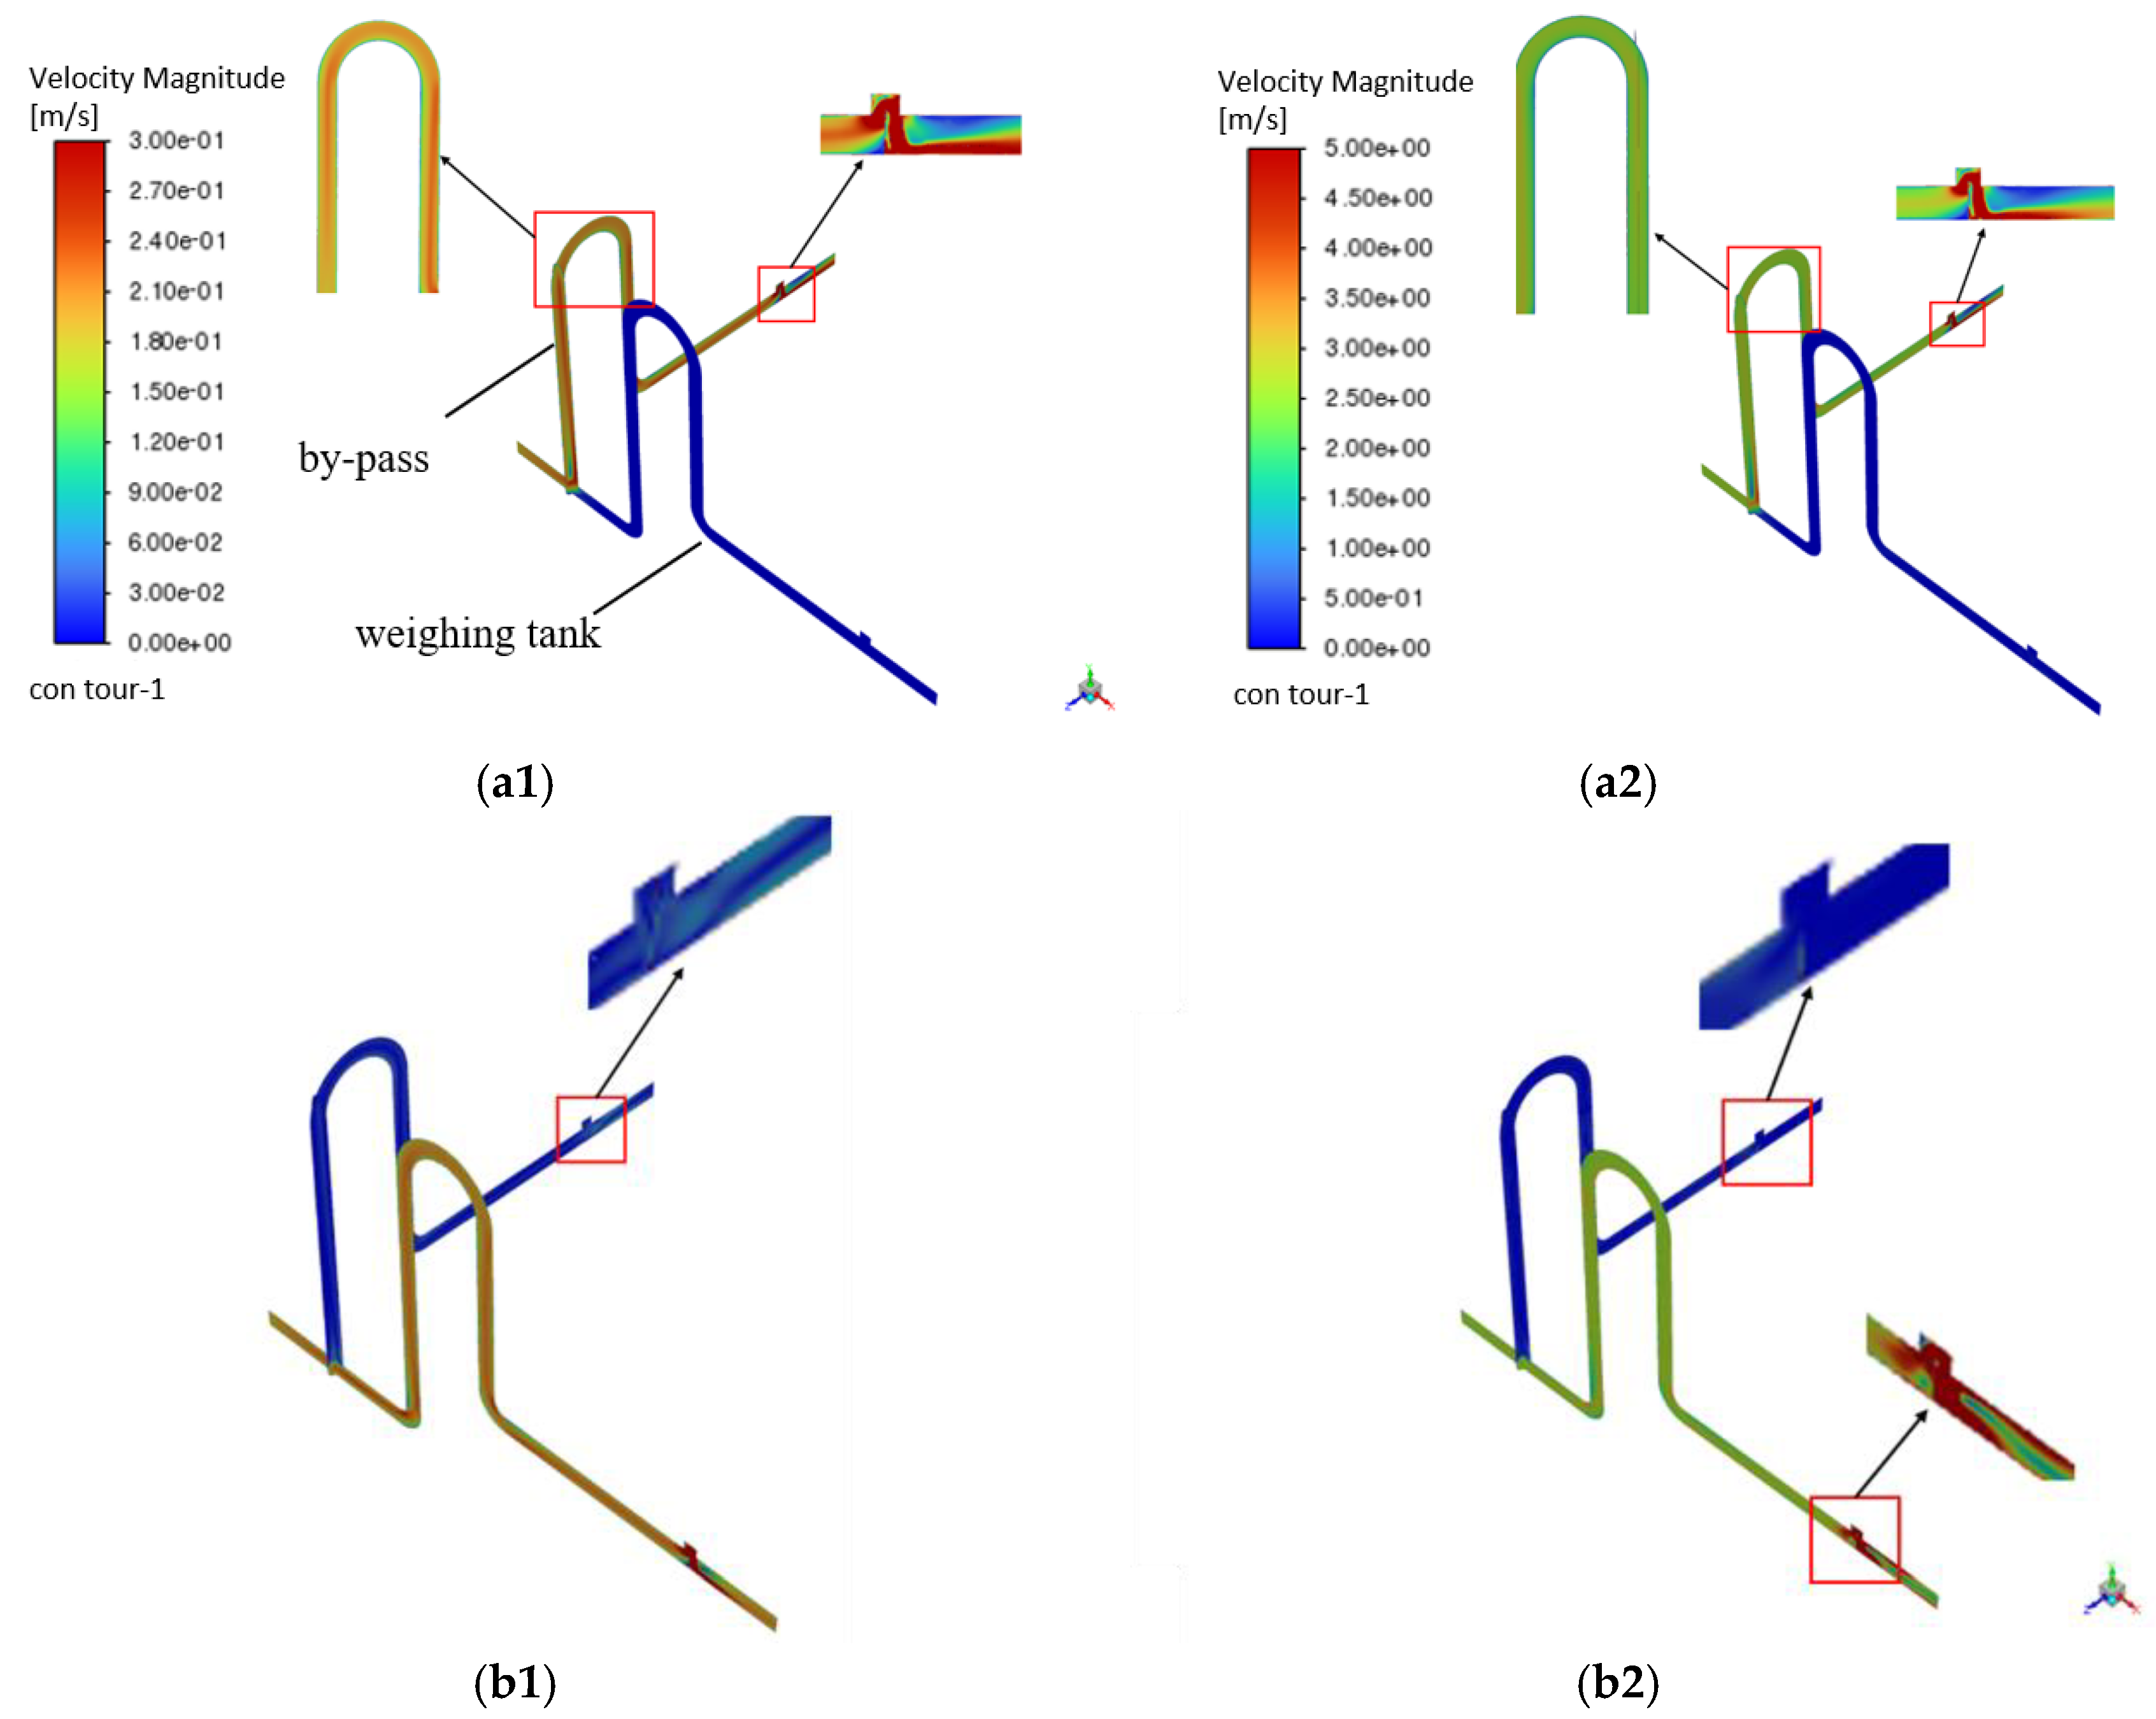
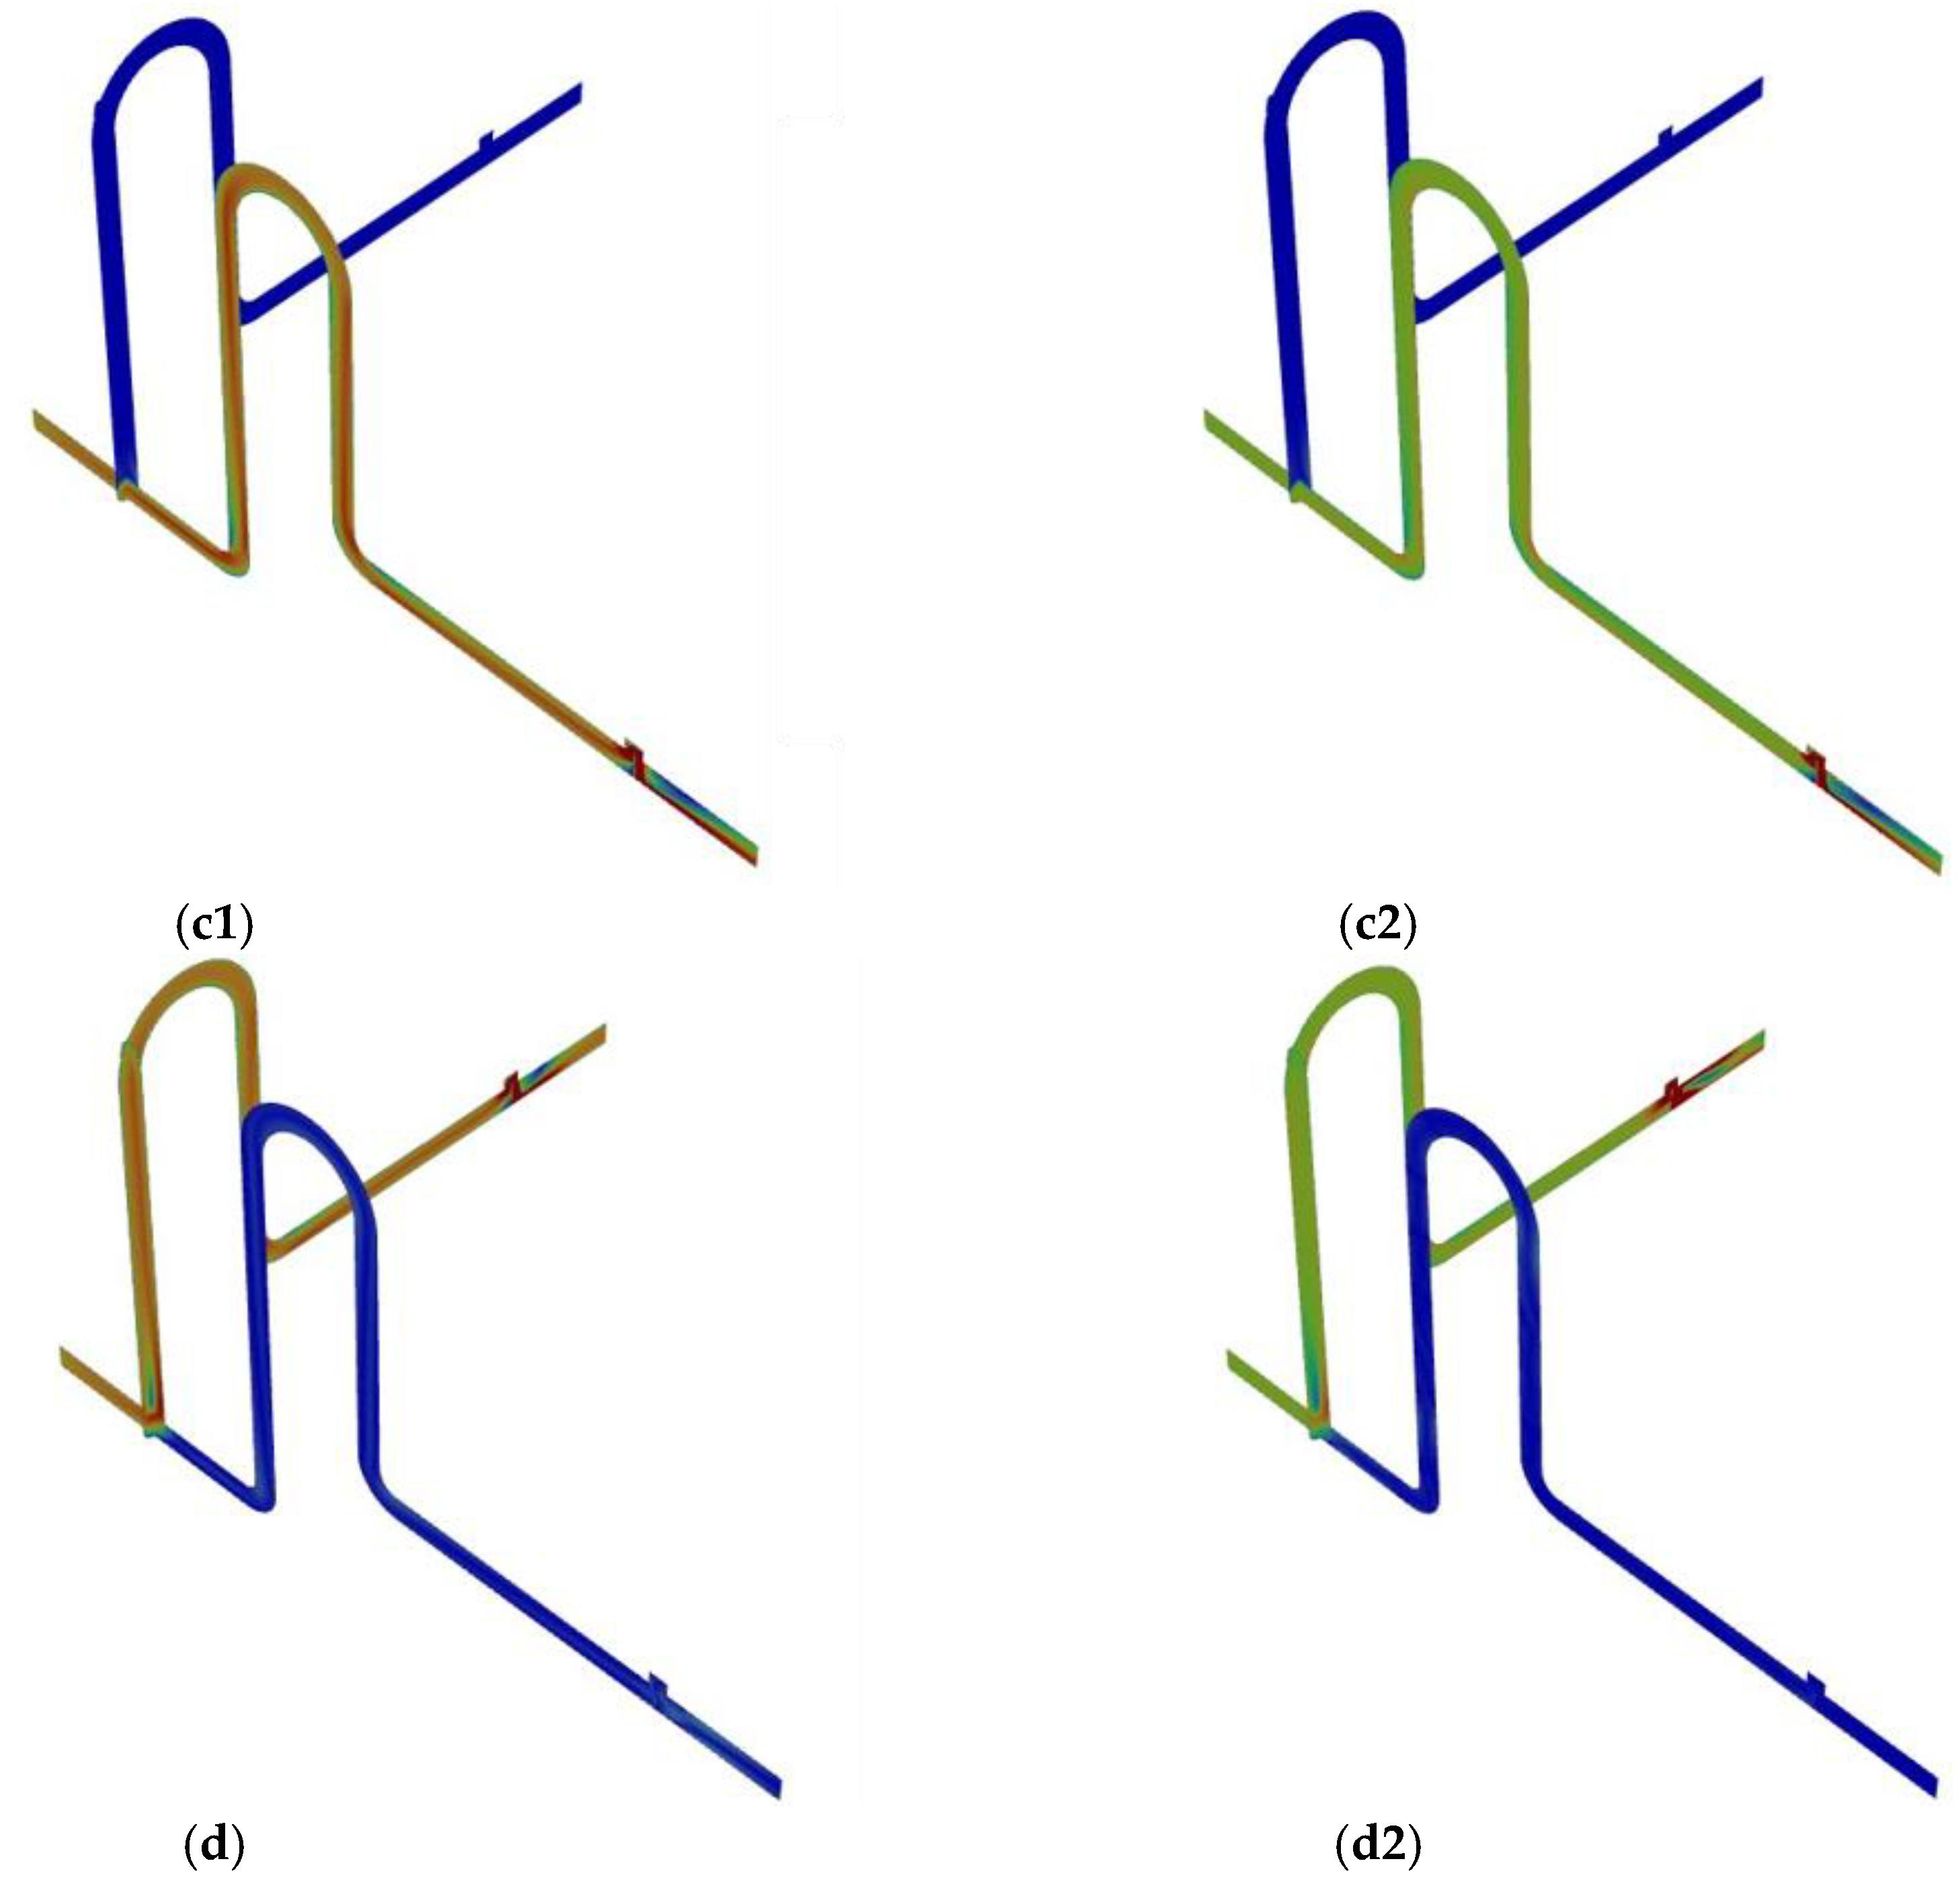

Table 1.
Different institutions cryogenic fluid standard devices.
| Completion date | Institution | Working medium | Principle | Working temperature (°C) | Flow range (kg/s) | Uncertainty |
| 1960 | NASA | Liquid hydrogen | Volumetric method | −253~−251 | 0.022~0.45 | 0.25% |
| 1974 | TNO | Liquid hydrogen | Mass method | −253~−251 | /~1.062 | 0.4% |
| 1970 | NIST | Liquid nitrogen | Mass method | −193~−183 | 0.95~9.5 | 0.5% |
| 2017 | EMERSON | Liquid nitrogen | Mass method | −195~−185 | 0.75~2 | 0.11% |
| 2017 | EMERSON | Liquid nitrogen | Standard meter method | −195~−185 | 0.75~2 | 0.16% |
Disclaimer/Publisher’s Note: The statements, opinions and data contained in all publications are solely those of the individual author(s) and contributor(s) and not of MDPI and/or the editor(s). MDPI and/or the editor(s) disclaim responsibility for any injury to people or property resulting from any ideas, methods, instructions or products referred to in the content. |
© 2025 by the authors. Licensee MDPI, Basel, Switzerland. This article is an open access article distributed under the terms and conditions of the Creative Commons Attribution (CC BY) license (http://creativecommons.org/licenses/by/4.0/).
Copyright: This open access article is published under a Creative Commons CC BY 4.0 license, which permit the free download, distribution, and reuse, provided that the author and preprint are cited in any reuse.


