
Submitted:
30 September 2025
Posted:
01 October 2025
You are already at the latest version
Abstract
As a key zero-carbon energy carrier, the accurate measurement of liquid hydrogen flow in its industrial chain is crucial. However, the ultra-low temperature, ultra-low density and other properties of liquid hydrogen can introduce calibration errors. To enhance the measurement accuracy and reliability of liquid hydrogen flow, this study investigates the heat and mass transfer within a 1 m3 non-vented storage tank during the calibration process of a liquid hydrogen flow standard device that integrates combined dynamic and static gravimetric methods. Building upon research on cryogenic flow standard devices as well as tank experiments and simulations, this study employs computational fluid dynamics (CFD) with Fluent software to numerically simulate liquid hydrogen flow within the non-vented tank. Specifically, the Lee model was enhanced via user-defined functions (UDF) to accurately simulate the key phase-change processes, involving coupled flash evaporation and condensation, during liquid hydrogen refueling. The simulation results demonstrated good agreement with NASA experimental data. This study systematically examined the effects of key parameters, including inlet flow conditions and inlet liquid temperature, on the flow characteristics of liquid hydrogen entering the tank and the subsequent heat and mass transfer behavior within the tank. The results indicated that an increase in mass flow rate elevates tank pressure and reduces filling time. Conversely, a decrease in the inlet liquid hydrogen temperature significantly intensifies heat and mass transfer during the initial refueling stage.These findings provide important theoretical support for a deeper understanding of the complex physical mechanisms of liquid hydrogen flow calibration in non-vented tanks and for optimizing calibration accuracy.
Keywords:
liquid hydrogen flow standard
; mass method
; tank refueling
; flash
; flow metering
1. Introduction
As a zero-carbon energy carrier, hydrogen plays a central role in global strategies for mitigating climate change and advancing energy transition. With the promulgation of China's Medium and Long-Term Plan for the development of the hydrogen energy industry (2021-2035), hydrogen energy has been clearly identified as a key component of the national energy system and an important carrier for achieving the green and low-carbon transformation of terminal energy use. The hydrogen industry chain covers multiple links of production, storage, transportation and application, among which liquid hydrogen (LH₂) has become an important medium due to its high energy density and transportation economy. However, the ultra-low temperature (boiling point about 20 K) and ultra-low density characteristics of liquid hydrogen lead to the introduction of calibration errors in the flow measurement process, and the current lack of high-precision liquid hydrogen flow standard devices in China has become a technical bottleneck restricting the development of the hydrogen energy industry. The accuracy of liquid hydrogen flow measurement directly affects the safe operation of the industrial chain, the fairness of trade settlement and system efficiency. Therefore, the development of reliable measurement standard devices based on real flow testing is of urgent practical significance [1,2,3].
Globally, research on liquid hydrogen flow standard devices remains at a nascent stage, with significant technical gaps persisting due to international monopolies. NASA developed a volume-based liquid hydrogen flow calibration system in the 1960s to calibrate flowmeters through reciprocating flow in two tanks, but the device was structure-complex and relied on high-precision liquid level monitoring [4]. Kyoto University in Japan designed a liquid hydrogen flow standard device based on the principle of the Mass-Time method (m-t method), but its customized nature limited commercial application [5]. The National Institute of Metrology (VSL) of the Netherlands has developed advanced mass method primary standard circuits (PSL) and standard meter method intermediate circuits (MSL) for liquefied natural gas (LNG), with calibration capabilities of 0.12% - 0.15%, providing important references for the measurement of cryogenic fluids [6,7,8]. In contrast, research in the field of liquid hydrogen measurement in China is not yet mature. Existing achievements are concentrated on flow devices for liquid nitrogen and LNG (such as the LNG refueling machine verification system of the China Academy of Testing Technology), while dedicated standard devices for liquid hydrogen are still blank, and core technologies are subject to international monopolies. Table 1 summarizes the existing cryogenic flow standard facilities worldwide.
In response to these challenges, this paper presents the first domestic standard device for liquid hydrogen flow that integrates dynamic and static mass methods. The device uses a dual-tank - dual-balance design. By comparing the data of dynamic weighing (including pipeline system) with static weighing (independent tank), it significantly reduces the influence of pipe capacity effect and parasitic force on weighing accuracy. The operation of the device consists of six stages: functional testing, purging, pre-cooling, verification, reset and emptying to ensure the reliability and safety of liquid hydrogen metering. This study numerically simulates the heat and mass transfer behavior during the liquid hydrogen refueling process in a 1 m³ non-vented vertical tank using computational fluid dynamics (CFD) methods in combination with a custom phase change model (UDF), aiming to reveal the two-phase flow mechanism of liquid hydrogen and provide theoretical support for the development of the device [9,10,11,12,13,14,15].
This study focuses on the effects of parameters such as mass flow rate and inlet temperature on the flow field within the tank. Its innovations are reflected in the following aspects: (1) development of a flash-condensation coupling UDF model to achieve high-precision simulation of phase change processes; (2) addressing critical technological gaps in the establishment of a domestic hydrogen energy measurement system, thereby advancing the civil and commercial adoption of liquid hydrogen [16,17].
We likewise recognize that horizontal cryogenic liquid hydrogen storage tanks demonstrate superior performance and offer a broader range of application scenarios in practice. Based on the economic benefits established by the liquid hydrogen flow standard facility and its alignment with international research, the vertical storage tank was selected. Subsequent research will involve a more extensive investigation into the characteristics of horizontal storage tanks.
2. Numerical Methods
2.1. Geometric Modeling
The liquid hydrogen storage tank is an important component of the hydrogen flow standard apparatus and plays a significant role in it. The tank design of the liquid hydrogen flow standard device in this study is as follows: The tank is externally reinforced by a support structure and insulated with a multi-layer high-vacuum wound blanket and has a monitoring sensor device for measuring parameters such as pressure and temperature and some other automatic control device components inside. For the convenience of subsequent simulation, the geometric structure of the liquid hydrogen storage tank model designed shown in Figure 1. The inner tank, consisting only of cylindrical shells and elliptical domes on top and bottom sides, has long and short radii of the head of 500 mm and 240 mm respectively, the length of the column shell section is 1100 mm, and the total volume of the tank is 1 m ³. Inside the tank, there is a circular pipe with a diameter of 25 mm at the central axis position, and at the end of the pipe connected to the tank, there is a trumpet-shaped diffuser with an opening of 30°, and the total length of the pipe is 1340 mm. The tank and the internal pipes are made of 316 stainless steel (0Cr17Ni12Mo2) with a thickness of 3 mm.
2.2. Meshing and Boundary Conditions
The liquid hydrogen storage tank was meshed using Fluent Meshing with tetrahedral meshing to control the internal flow of the tank, taking into account factors such as inlet boundary conditions with specific mass flow and no slippage on the wall [18]. Subsequently, in order to achieve mesh independence in the simulation, the boundary layer setup needed to take into account the dimensionless distance y+. Based on this dimensionless parameter, appropriate regions can be identified to handle turbulent flow-related phenomena, as shown in Equation (2-2) [19] .
In the formula: is the friction velocity; is the wall shear stress; is the fluid density; is the fluid viscosity.
For the computational domain at the inner pipe wall of the local area of the tank, the boundary layer was established using the mesh refinement method, as shown in Figure 2 of the tank model mesh.
Initial condition setting: Initially, the liquid hydrogen tank is filled with hydrogen at the same temperature as the tank wall at 50 K, at which point the volume fraction of liquid hydrogen in the tank is 0. Inlet Settings Select mass flow inlet, the tank is refilled without venting, no outlet. At the same time, regardless of the heat leakage of the tank, the inner wall of the tank is insulated.
Too few grids can lead to rough calculations and inaccurate results, while too many grids can result in increased calculation time and enhance computational efficiency. So it is necessary to verify the grid independence of the tank model to ensure the rational use of resources. Here, the inlet mass flow rate is set at 0.06 kg/s and the initial pressure inside the tank is set at 0.0255 MPa. Taking into account the variations in the internal flow field of the tank, five different grid numbers were selected in this paper, with grid numbers of 1.47 million, 1.65 million, 1.92 million, 2.23 million, and 2.52 million respectively. The comparison of simulation results is shown in Figure 3, and the curves represent the pressure values inside the tank at different grid numbers. When the number of grids was less than 2.52 million, the simulation results differed significantly from other data and were not accurate enough; For grid counts exceeding 2.23 million, the tank pressure exhibits negligible variation, confirming mesh independence. In order to improve the computational efficiency of the simulation, this study ultimately chose 2.23 million grids for the follow-up study.
2.3. Model Development and UDF Programming
This study employs ANSYS Fluent to conduct numerical simulation of internal flow within the storage tank. The comprehensive numerical framework encompasses: turbulence modeling, surface tension modeling, multiphase flow modeling, evaporation-condensation modeling, and flash evaporation modeling. The following is an introductory section.
2.3.1. Fundamental Models
Turbulence Model: Given the Reynolds number magnitude of 10⁵ during liquid hydrogen flow in the storage tank, the process exhibits turbulent characteristics. The standard k-ε model, as the simplest complete two-equation turbulence closure, is employed under the assumption of fully turbulent flow where molecular viscosity is negligible. This model, through modifications, also accommodates low-Reynolds-number flows. Applied to the fluid domain, it accounts for continuous hydrogen vaporization until thermal stabilization and complete tank filling. Thus, the standard k-ε turbulence model is adopted in this study.
Surface Tension Model: Interfacial surface tension is modeled via the Continuum Surface Force (CSF) approach proposed by Brackbill [20]. This method converts surface tension into a volumetric force, incorporated as a source term in the momentum equation for interface cells, enhancing physical consistency. Surface tension effects are governed by the surface tension coefficient and interface curvature.
is the curvature; is the surface tension coefficient, N/m; is the density of the phase under consideration, kg/m3.
In this paper, when only the gas and liquid phases are present,
The surface tension formula is ultimately expressed as:
is the liquid phase density, kg/m3; is the gas phase density, kg/m3; is the mixture density, kg/m3。
Multiphase Flow Model: The Volume of Fluid (VOF) method captures interfacial convection without violating mass conservation, offering computational efficiency for large-scale domains—a critical advantage for phase-change simulations. During pressurization in liquid hydrogen tank loading, ullage pressure variations significantly alter phase behavior at vapor-liquid interfaces. A thin thermal layer forms beneath the interface, necessitating high-fidelity VOF-based interface tracking to resolve heat and mass transfer mechanisms within the tank [21,22].
2.3.2. UDF Coupled Evaporation-Condensation and Flash Evaporation Models
Self-pressurization occurs when cryogenic liquid hydrogen flows into storage tanks through internal piping. This process involves complex multiphase interactions including vapor-liquid mixing and conjugate heat transfer, where thermodynamic responses such as flash evaporation and evaporation-condensation may emerge during phase-change mass/energy exchange.
The flash evaporation phenomenon is most frequently observed during the initial stages of liquid hydrogen refueling in storage tanks and is primarily attributed to temperature rise [23]. Specifically, vapor bubbles nucleate when the liquid pressure falls below its vapor pressure at the local temperature, governed by the thermodynamic state of the liquid phase [24,25].
Unlike conventional evaporation, flash evaporation cannot be represented by Fluent's native Lee model. Practitioners may implement custom phase-change models via User-Defined Functions (UDF) to characterize flash dynamics. The UDF framework must concurrently account for evaporation-condensation effects by modifying source terms in mass and energy conservation equations, thereby closing the governing equation system. Our approach couples a reformulated Lee evaporation-condensation model with depressurization-induced flash physics, with UDF-compiled phase-change mechanisms solving continuity and energy equations.
In the VOF model within Fluent software, interfacial energy, momentum, and mass balances are applied via source terms to the diffuse interface region. In this sense, the interfacial energy balance is volumetrically satisfied only within cells where the volume fraction changes sharply between 0 and 1, identified as the interface. For the VOF model, evaporation and condensation mass transfer at the interface are accounted for via source terms in the continuity and volume fraction evolution equations, as shown in Eq (2-3).
is the source term for the VOF model's volume fraction equation; is the mass source term; m is Mass Flux Vector,Defined by the Schrage Equation; Ai The interfacial area density, denoted as
α denotes the volume fraction of the Dominant term.
To determine whether flash evaporation occurs at the initial state, we define a specific flash coefficient , representing the real-time pressure ratio between the tank interior and the saturation pressure of liquid hydrogen at the inlet. Subsequently, both the inlet liquid and flash-generated vapor equilibrate to saturation conditions corresponding to the tank pressure as shown in Eqs (2-5) to (2-7)
is the instantaneous pressure inside the storage tank; is the saturation pressure at the current temperature; is the specific enthalpy of the inlet liquid hydrogen, J/kg; is the specific enthalpy of the saturated liquid phase at the current pressure; is the latent heat of vaporization; is the inlet mass flow rate, kg/s.
For evaporation-condensation modeling, the Lee model was adapted via User-Defined Functions (UDF). Within this UDF framework, phase-change source terms are computed by comparing the cell temperature T each timestep to the local saturation temperature Tsat corresponding to the instantaneous pressure. If T > Tsat liquid evaporation occurs, otherwise, vapor condensation takes place. The evaporation and condensation rates calculated via Eqs. (2-8) and (2-9)
is the mass source term for the gas/liquid phasewith positive values indicating condensation and negative values indicating evaporation, kg/m3·s; is the energy source term,W/m3; denotes the relaxation parameter governing the interphase mass transfer rate within computational cells. Its value depends not only on flow geometry and operating conditions but also on grid resolution and timestep selection.
3. Results and Discussion
3.1. Model Validation and Comparative Analysis
To verify the feasibility of the model, this study selected the NASA experiment of filling liquid hydrogen at the bottom inlet of a 34-L tank as model validation, simplified based on the tank data provided by NASA's experiment, as shown in Figure 4 [26].
Figure 5 shows that the Flash Evaporation model proposed in this study is in good agreement with NASA's experimental data. The curve is clearly divided into three distinct phases, the first of which is called the flash phase; The second stage is the evaporative condensation stage; The third stage is the Ullage Gas Compression [27]. The first stage matches to prove that the flash model written in the UDF is effective. Figure 6 shows the phase diagrams of the simulation model at each of the three stages. There are deviations in the latter two stages, and the reasons for the deviations are analyzed as follows: The flow velocity in the actual experiment may decrease with the increase of pressure, which is a variable flow rate, but no exact data is given in the experiment. So there will be some error in the constant flow set in the simulation. The CFD model demonstrates feasibility as the computed deviation is less than 10%.
3.2. The Effect of Mass Flow on Tank Filling
Based on the 1 m3 simplified tank CFD model designed by the engineering research institute described in Section 2.1, four mass flow rates of 0.01 kg/s, 0.03 kg/s, 0.05 kg/s, and 0.06 kg/s were selected for numerical simulation, with liquid hydrogen as the working medium and boundary conditions set as described in Section 3.2. Gravity is 9.81 m/s2 in the negative X-axis direction.
Figure 7 shows the temperature variation curves of the tank at four different mass flow points. In the early stage of refueling, liquid hydrogen enters the tank through a circular pipe. Due to the temperature of the liquid hydrogen being much lower than that inside the tank, intense heat exchange occurs when the liquid hydrogen enters the tank, and the temperature drops rapidly to around 28 K and then slowly. Increasing mass flow rate from 0.01 to 0.06 kg/s accelerates the temperature drop rate by approximately 300%, due to intensified heat exchange and the temperature is lower at the same time. This change is due to the increase in the mass flow rate, which increases the mass of liquid hydrogen flowing in and cools the ambient temperature hydrogen in the tank more rapidly, resulting in an increase in the intensity of heat exchange between the liquid hydrogen and the tank [28] At the beginning of the refilling, when the cryogenic liquid hydrogen enters the tank, intense heat and mass transfer occurs, and the temperature drops rapidly. Subsequently, as the liquid hydrogen is gradually refilled, the temperature of the tank drops.
An analysis and comparison of the liquid hydrogen filling process under different mass flow rates was conducted. As shown in Figure 8, which presents the phase diagrams corresponding to various flow rates after the same filling duration (800 s), it can be observed that a higher mass flow rate results in a faster rise of the liquid level. Mass flow rate exerts significant influence on the initial phase of LH₂ loading, while pronounced unsteady flow phenomena manifest at the bottom region of the cryogenic storage tank, This is demonstrated in Figure 9 by the phase diagram for the mass flow rate of 0.06 kg/s and the filling time of 100 s. The evaporation rate is relatively stable when the liquid surface is submerged in the diffuser at the pipe opening. As the mass flow rate increases, the liquid level tends to flatten. The flow diagram inside the tank is shown in Figure 10. It is observed that many vortices of different sizes are formed inside the vapor space at different mass flow rates. At larger mass flow rates, vortices spread over a larger area and last longer, while larger injection mass flow rates can effectively disrupt the temperature stratification, This enhances energy transfer at the gas-liquid interface, which leads to greater stability of the liquid surface.
As shown in Figure 11, the time taken for liquid hydrogen refueling to achieve the same fill fraction of 90% for the tank at different mass flow rates. When the mass flow is 0.01 kg/s, the time taken is 6000 s; When the mass flow is 0.03 kg/s, the time taken is 2400 s. When the mass flow rate is 0.05 kg/s, it takes 1400 s. When the mass flow rate is 0.06 kg/s, it takes 1200 seconds. A higher mass flow rate results in a shorter filling time. The relationship between time and mass flow rate is not proportional because different mass flow rates at the tank inlet lead to varying intensities of phase change in the liquid hydrogen. The intensity of phase change increases with higher mass flow rates, which explains why the time required under higher mass flow conditions is shorter than expected under normal filling conditions.
3.3. The Effect of Inlet Liquid Hydrogen Temperature on Tank Filling
During the process of injecting liquid hydrogen into the storage tank, the temperature of the liquid hydrogen at the filling inlet is regarded as a key influencing variable. Since the temperature of liquid hydrogen varies with pressure, the impact of inlet liquid hydrogen temperature on tank pressure must be taken into account. The initial tank pressure, tank temperature, and filling flow rate were uniformly set at 0.0255 MPa, 50 K, and 0.05 kg/s respectively, and the set gravitational acceleration was 9.81 m/s2 in the negative X-axis direction. This section examines the temperature changes and evaporative mass transfer behavior of liquid hydrogen in tanks at initial temperatures of 19 K, 20 K, and 21 K. Figure 12 shows the pressure curves at different initial temperatures of liquid hydrogen during tank filling. By comparison, it can be found that during the refueling process, the higher the initial temperature of the inlet liquid hydrogen, the greater the pressure inside the tank. The reasonable reason for this phenomenon is that under the same initial pressure conditions, a lower initial temperature of the inlet liquid hydrogen means a higher degree of undercooling at the same pressure and a greater heat transfer temperature difference with the temperature of the gaseous hydrogen in the tank compared to other conditions, which leads to more intense heat and mass exchange between the undercooled inlet liquid hydrogen and the superheated gaseous hydrogen in the tank. For the case where the inlet liquid hydrogen temperature is 19 K, because the cooling effect of the liquid hydrogen is more significant, the condensation effect in the gas cushion area during the gas-liquid heat and mass transfer process is more intense, resulting in a significant drop in pressure after a period of time in the initial stage. As the initial temperature rises, the tank pressure increases rapidly and remains at a high level, reaching the upper limit of pressure earlier. To sum up, the initial temperature of the imported liquid hydrogen has a significant impact on the pressure inside the tank.
At the initial stage, the temperature of the liquid hydrogen has a significant impact on the pressure inside the tank. As the temperature of the liquid hydrogen gradually increases, the rate of pressure change in the tank slows down. The initial increase in the temperature of the liquid hydrogen leads to a reduction in the temperature difference between the liquid hydrogen and the hydrogen gas, thereby reducing the heat required to bring the liquid hydrogen to saturation. This is a key factor influencing the evaporation of liquid hydrogen, which creates convection during the evaporation process, thereby affecting the heat transfer of hydrogen. When the initial temperature of the liquid hydrogen is below the saturation point, the temperature gradient in the liquid phase region causes the liquid phase part to vaporize. As the initial temperature of the liquid hydrogen rises, the evaporation process becomes slower, resulting in less convective convection in the gas-phase area above the liquid hydrogen, which makes the cold hydrogen gas produced by the evaporation of the liquid hydrogen, although providing cooling for the hot hydrogen gas above, less effective.
Figure 13 shows the temperature curve of the tank at different liquid hydrogen temperatures at the inlet. It can be seen from the figure that the temperature drops rapidly from 50 K to around 26 K at the beginning of the tank filling. This is because the specific heat capacity of liquid hydrogen is greater than that of hydrogen vapor. When liquid hydrogen evaporates at low temperatures, it generates a large amount of latent heat and the temperature drops sharply. It can also be seen that at the same time, the temperature inside the tank decreases as the temperature of the liquid hydrogen at the inlet drops. The reason is that the lower the temperature of the liquid hydrogen, the greater the temperature difference with the hydrogen inside the tank, the lower the degree of subcooling, and thus the cooling effect is more obvious, causing the temperature inside the tank to drop faster. As shown in Figure 14, the phase diagrams of the liquid hydrogen being injected into the 500 s tank at initial temperatures of 21 K, 20 K, and 19 K respectively. At the same injection mass flow rate of 0.05 kg/s, the higher the initial temperature of the liquid hydrogen at the same time, the smaller the volume fraction of the liquid phase, that is, the lower the liquid level. As the initial temperature of the liquid hydrogen is lower, local saturated vapor condensation leads to a decrease in the density of the liquid phase, thus increasing the volume fraction of the liquid phase.
The higher the initial temperature of the liquid hydrogen, the faster the average temperature and average pressure increase in the tank, the less mass transfer between gas and liquid, and the less hydrogen liquefy into liquid hydrogen, resulting in a lower filling rate. Final fill fraction decreases from 93% to 89% as inlet temperature rises from 19 K to 21 K, attributed to reduced condensation mass transfer. The lower the initial temperature of liquid hydrogen, the faster the filling time, the shorter the cooling time, and the higher the filling rate. However, since the initial liquid hydrogen temperatures studied do not differ much, there is no obvious difference in the filling rate.
4. Conclusions
In the study of 1 m3 liquid hydrogen tank refueling, due to the constant changes in pressure and temperature inside the actual tank and the limitations of Fluent software itself, a CFD numerical simulation coupling flash model and evaporative condensation model was implemented by loading UDF to provide a more accurate description of the refueling process under study. In order to obtain more accurate data to provide reasonable suggestions for practical operation, the variation patterns of temperature and pressure and the distribution of the flow field in the tank were simulated and analyzed from the aspects of mass flow rate and inlet temperature. Here's the summary:
- Validation of the validity of CFD models
The model was validated based on data from NASA's 34 L liquid hydrogen tank bottom filling experiment. The simulation was in high agreement with the experimental pressure curve during the flash phase, and the deviation (about 10%) during the evaporative condensation and cushion compression phases was due to unmonitored flow dynamics in the experiment. The error is within the engineering allowable range (≤10%), indicating that the model can accurately predict the phase change behavior, temperature field and pressure field evolution patterns during the charging process, laying the foundation for subsequent parametric studies.
- 2.
- The influence mechanism of mass flow
Thermodynamic behavior: An increase in mass flow rate (0.01→0.06 kg/s) significantly enhances heat transfer intensity. At high flow rates (0.06 kg/s), the liquid hydrogen inlet triggers intense heat exchange, and the tank temperature drops sharply to 28 K initially Hydrodynamic characteristics: Increased flow leads to enhanced liquid surface disturbance, enlarged vortex scale and prolonged duration, effectively disrupting temperature stratification and promoting two-phase mixing. Filling efficiency: The time required to fill 90% decreases nonlinearly with the increase in flow rate (0.01 kg/s: 6000 s → 0.06 kg/s: 1200 s), mainly because the high flow rate intensifies the phase change intensity and accelerates the condensation of gaseous hydrogen.
- 3.
- Mechanism of influence of inlet temperature
Pressure regulation: The low-temperature inlet (19 K) enhances subcooling and intensifies the condensation effect of the gas pillow, resulting in a phased drop in pressure. When the temperature rises (21 K), the tank pressure keeps rising and reaches the limit ahead of time. Mass transfer and filling characteristics: Low-temperature liquid hydrogen (19 K) increases the temperature difference between the air and liquid, enhances mass transfer efficiency, and increases the volume fraction of the liquid phase. At the same filling time (500 s), the liquid level at 19 K is significantly higher than that at 21 K. Final fill rate: When the inlet temperature rises from 19 K to 21 K, the fill rate drops from 93% to 89%, attributed to weakened evaporation of high-temperature liquid hydrogen and the dominance of the gas pillow compression effect.
Author Contributions
Conceptualization, Lianyan Yu and Xiaobin Zhang; methodology, Xiang Li; software, Yiting Zou; validation, Yalei Zhao, Chengxu Tu and Fubing Bao; formal analysis, Yongcheng Zhu and Yanbo Peng; investigation, Daolin Wang and Zexian Zhu; resources, Xiang Li; data curation, Xiang Li; writing—original draft preparation, Yiting Zou; writing—review and editing, Yalei Zhao, Chengxu Tu and Fubing Bao; visualization, Yongcheng Zhu and Yanbo Peng; supervision, Yalei Zhao, Chengxu Tu and Fubing Bao; project administration, Lianyan Yu; funding acquisition, Qun Wei, Zelei Chen. All authors have read and agreed to the published version of the manuscript.
Funding
This work was supported by the National Key R&D Program of China (2024YFF0620003); Key R&D Program of Zhejiang Province (2021C01099); Major Projects of Zhejiang Provincial Natural Science Foundation (LD24E050002); Key Project of the Science and Technology Plan of Zhejiang Provincial Market Supervision Administration (Grant No ZD2025025); Open Fund of Fujian Key Laboratory of Energy and Carbon Measurement (Fujian Metrology Institute) (NYJL-KFKT-2022-03).
Data Availability Statement
Data will be made available upon request.
Conflicts of Interest
The authors declare no conflicts of interest.
References
- Zhang, T.; Uratani, J.; Huang, Y.; Xu, L.; Griffiths, S.; Ding, Y. Hydrogen liquefaction and storage: Recent progress and perspectives. Renew. Sustain. Energy Rev. 2023, 176. [Google Scholar] [CrossRef]
- Ma, H.; Sun, Z.; Xue, Z.; Zhang, C.; Chen, Z. A systemic review of hydrogen supply chain in energy transition. Front. Energy 2023, 17, 102–122. [Google Scholar] [CrossRef]
- Beschkov, V.; Ganev, E. Perspectives on the Development of Technologies for Hydrogen as a Carrier of Sustainable Energy. Energies 2023, 16, 6108. [Google Scholar] [CrossRef]
- Minkin H L, Hobart H F. Liquid-hydrogen-flowmeter calibration facility; preliminary calibrations on some head-type and turbine-type flowmeters [M]. New York: National Aeronautics and Space Administration, 1961.
- Jin, T.; Tian, H.; Gao, X.; Liu, Y.; Wang, J.; Chen, H.; Lan, Y. Simulation and performance analysis of the perforated plate flowmeter for liquid hydrogen. Int. J. Hydrogen Energy 2017, 42, 3890–3898. [Google Scholar] [CrossRef]
- Schakel M D, van der Beek M P, Rahneberg I, et al. Improvements to the primary LNG mass flow standard [C]// 18th Flow Measurement Conference. Portugal Lisbon: LNEC, 2019.
- Schakel M D, Kerkhof O, van der Beek M P, et al. LNG mid-scale loop flow metering–preliminary test results [C]//18th Flow Measurement Conference. Portugal Lisbon: LNEC, 2019.
- Kenbar, A.; Schakel, M. Influence of flow disturbances on the performance of industry-standard LNG flow meters. Flow Meas. Instrum. 2021, 77. [Google Scholar] [CrossRef]
- Kang, D.; Yun, S.; Kim, B.-K.; Kim, J.; Kim, G.; Lee, H.; Choi, S. Numerical Investigation of the Initial Charging Process of the Liquid Hydrogen Tank for Vehicles. Energies 2022, 16, 38. [Google Scholar] [CrossRef]
- Fester, D.A.; Page, G.R.; Bingham, P.E. Liquid fluorine no-vent loading studies. J. Spacecr. Rocket. 1970, 7, 181–185. [Google Scholar] [CrossRef]
- Moran M E, Nyland T W, Papell S S. Liquid transfer cryogenic test facility: initial hydrogen and nitrogen no-vent fill data [R]. United States: National Aeronautics and Space Administration, 1990.
- Moran M E, Nyland T W, Driscoll S L. Hydrogen no-vent fill testing in a 1.2 cubic foot (34 liter) tank [R]. New York: National Aeronautics and Space Administration, 1991.
- CHATO D J. Ground testing on the nonvented fill method of orbital propellant transfer: Results of initial test series [C]//27th Joint Propulsion Conference Exhibit. Sacramento: American Institute of Aeronautics and Astronautics, 1991.
- Flachbart R H, Hedayat A, Holt K A. Modeling and test data analysis of a tank rapid chill and fill system for the advanced shuttle upper stage (ASUS) concept [C]//AIP Conference Proceedings. Wisconsin: American Institute of Physics, 2002, 613(1): 1284-1291.
- Wang, C.; Wang, R. The effects of vertical and horizontal placement on no-vent fill of cryogenic insulated vessels. Cryogenics 2010, 50, 480–485. [Google Scholar] [CrossRef]
- Ma, Y.; Zhu, K.; Li, Y.; Xie, F. Numerical investigation on chill-down and thermal stress characteristics of a LH2 tank during ground filling. Int. J. Hydrogen Energy 2020, 45, 25344–25356. [Google Scholar] [CrossRef]
- Mingbo X, Wenhao Y, Qing Z, et al. Experimental and numerical analysis of the chill-down process of a large horizontal cryogenic storage tank [J]. Applied Thermal Engineering, 2023, 234(1): 121246.
- Liu, Z.; Yang, Y.; Liu, Y.; Li, Y. Effect of gas injection mass flow rates on the thermal behavior in a cryogenic fuel storage tank. Int. J. Hydrogen Energy 2022, 47, 14703–14713. [Google Scholar] [CrossRef]
- Ayala, E.; Rivera, D.; Ronceros, J.; Vinces, N.; Ronceros, G. Design of a Cryogenic Duplex Pressure-Swirl Atomizer through CFDs for the Cold Conservation of Marine Products. Fluids 2023, 8, 271. [Google Scholar] [CrossRef]
- Brackbill, J.; Kothe, D.; Zemach, C. A continuum method for modeling surface tension. J. Comput. Phys. 1992, 100, 335–354. [Google Scholar] [CrossRef]
- McNaughton D J, Vet R J. Eulerian model evaluation field study (EMEFS): A summary of surface network measurements and data quality [J]. Atmospheric Environment, 1996, 30(2): 227-238.
- Hirt C W, Nichols B D. Volume of fluid (VOF) method for the dynamics of free boundaries [J]. Journal of Computational Physics, 1981, 39(1): 201-225.
- Zhu, X.; Pan, X.; Ma, J.; Mei, Y.; Tang, H.; Zhu, Y.; Liu, L.; Jiang, J.; Chen, T. Dynamic behaviors of in-tank subcooled liquid with depressurization-induced phase change and the impact on primary breakup of flashing jet. Int. J. Therm. Sci. 2022, 186. [Google Scholar] [CrossRef]
- Majumdar, A.; LeClair, A.; Hartwig, J.; Ghiaasiaan, S.M. Numerical modeling of no vent filling of a cryogenic tank with thermodynamic vent system augmented injector. Cryogenics 2023, 131. [Google Scholar] [CrossRef]
- Majumdar, A.; LeClair, A.; Hartwig, J.; Ghiaasiaan, S.M. Numerical modeling of no vent filling of a cryogenic tank with thermodynamic vent system augmented injector. Cryogenics 2023, 131. [Google Scholar] [CrossRef]
- Ma, Y.; Li, Y.; Zhu, K.; Wang, Y.; Wang, L.; Tan, H. Investigation on no-vent filling process of liquid hydrogen tank under microgravity condition. Int. J. Hydrogen Energy 2017, 42, 8264–8277. [Google Scholar] [CrossRef]
- Gaertner J W, Kronenburg A, Rees A, et al. Numerical and experimental analysis of flashing cryogenic nitrogen [J]. International Journal of Multiphase Flow, 2020, 130(1): 103360.
- Aydelott J C. Effect of gravity on self-pressurization of spherical liquid-hydrogen tankage [M]. New York: National Aeronautics and Space Administration, 1967.
Figure 1.
Schematic diagram of the geometry of the refueling tank.
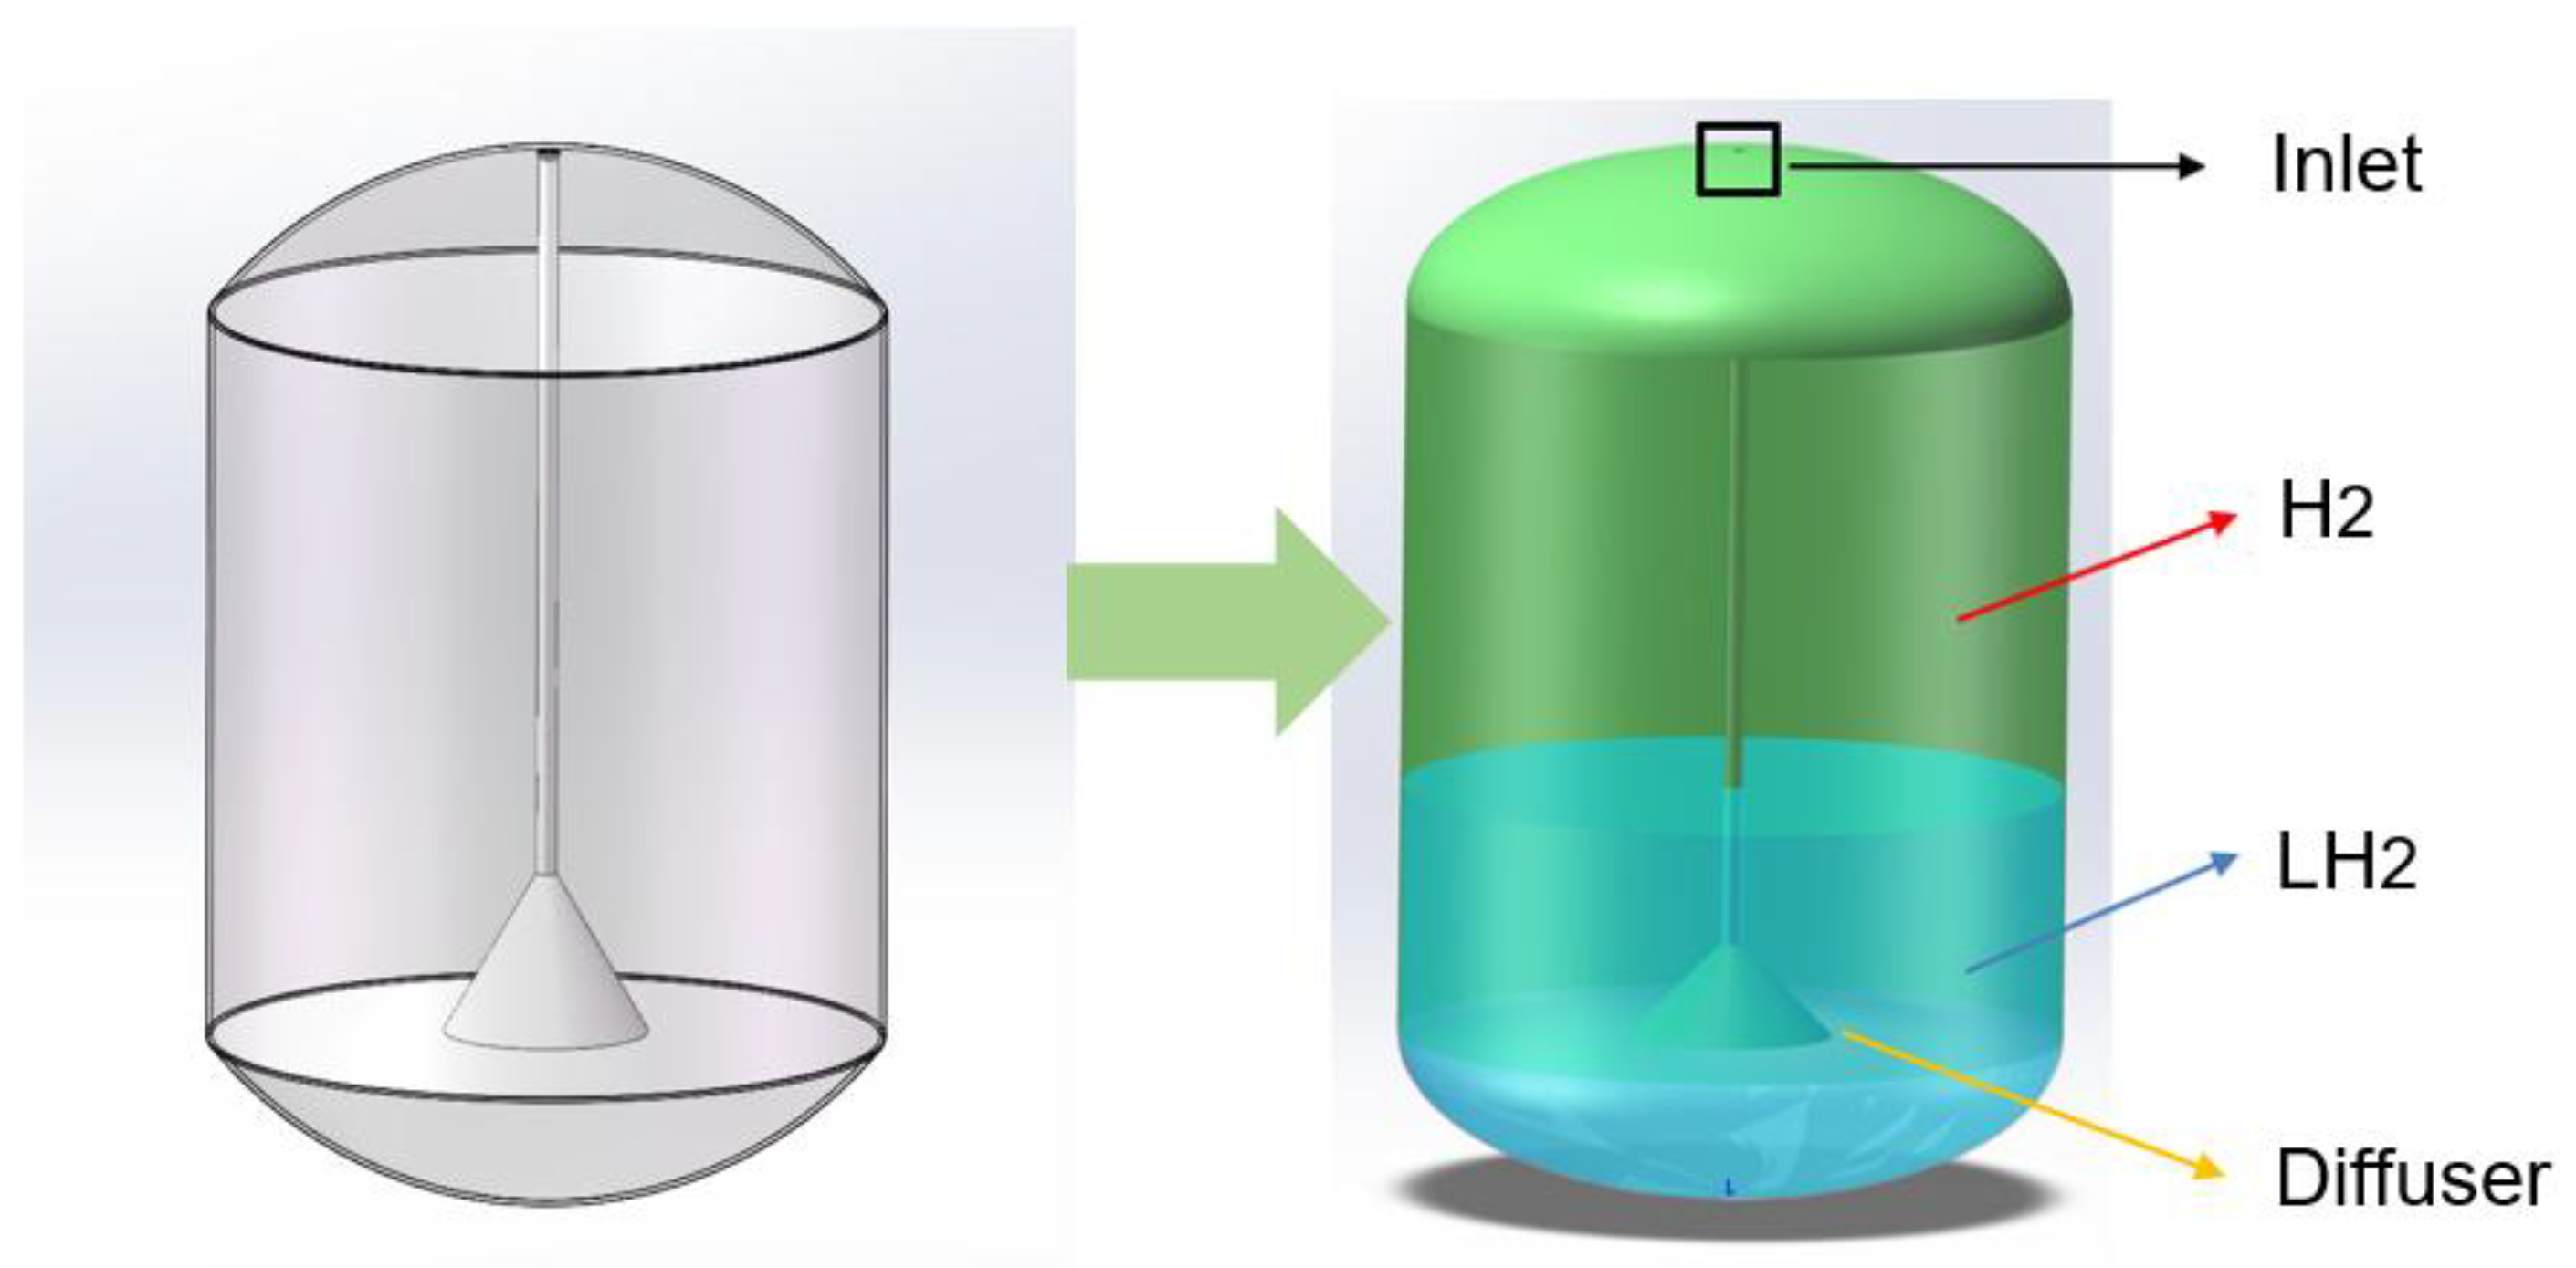
Figure 2.
Mesh Schematic of Liquid Hydrogen Refueling Tank with Regional Meshing.
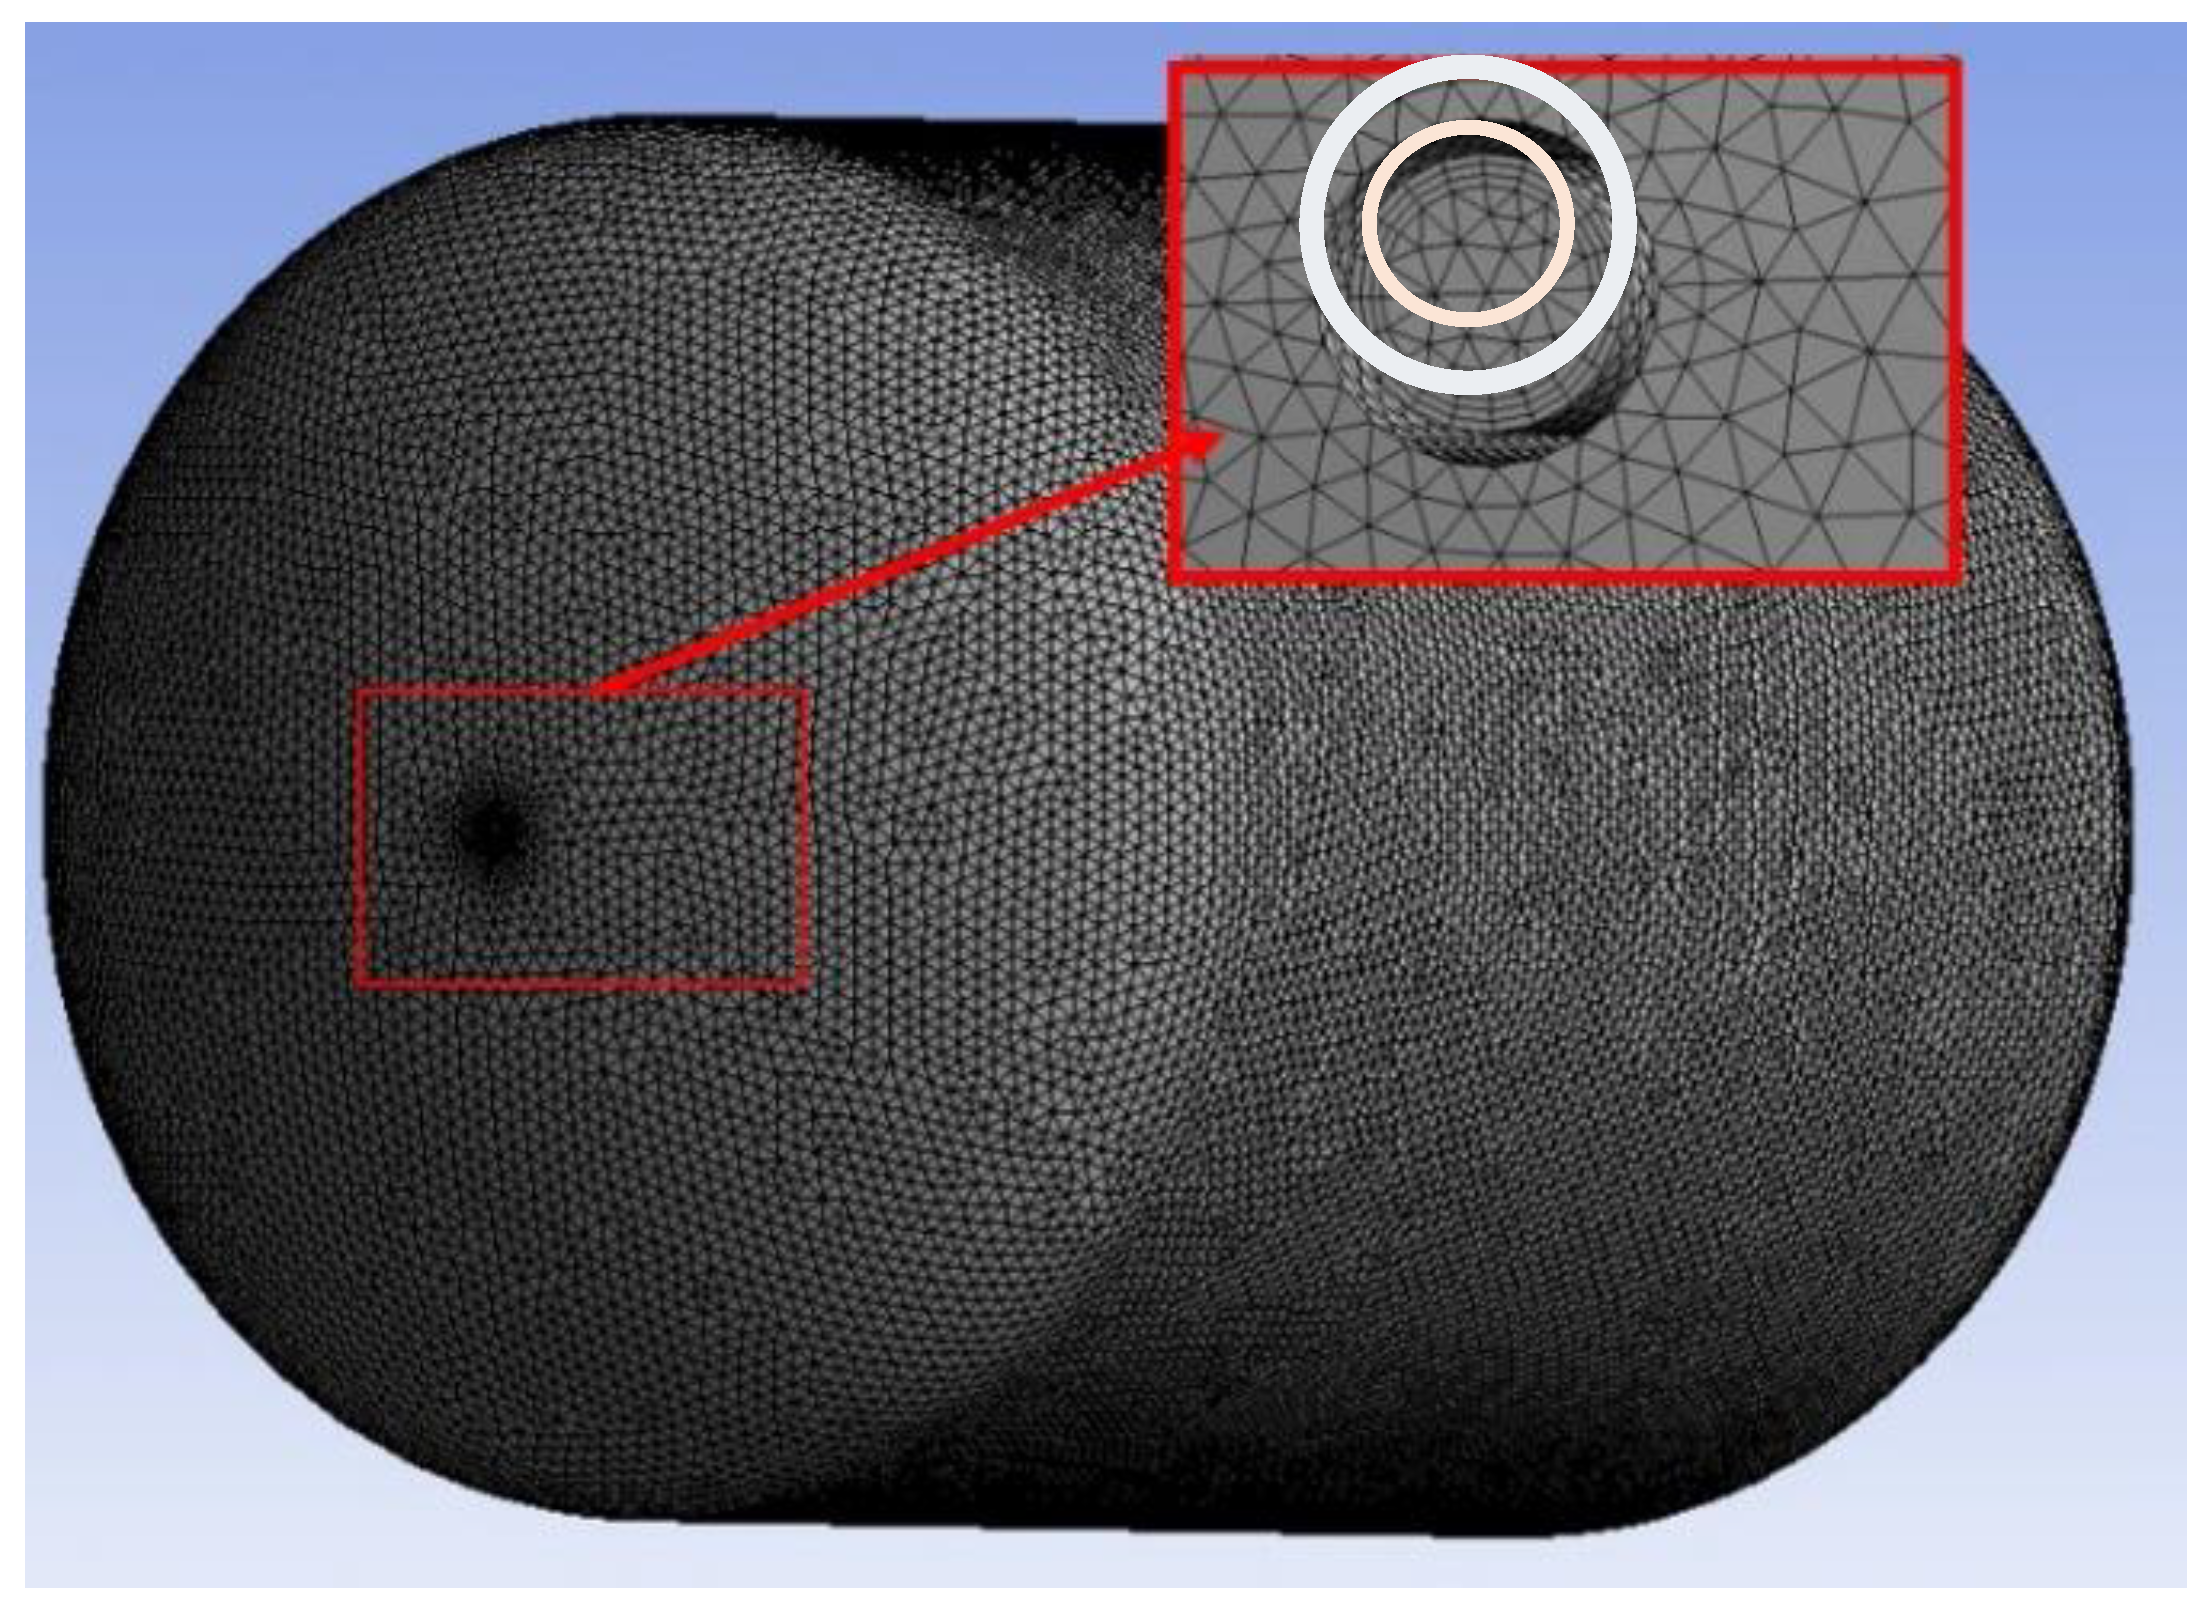
Figure 3.
Tank filling pressure variation at different grid numbers.
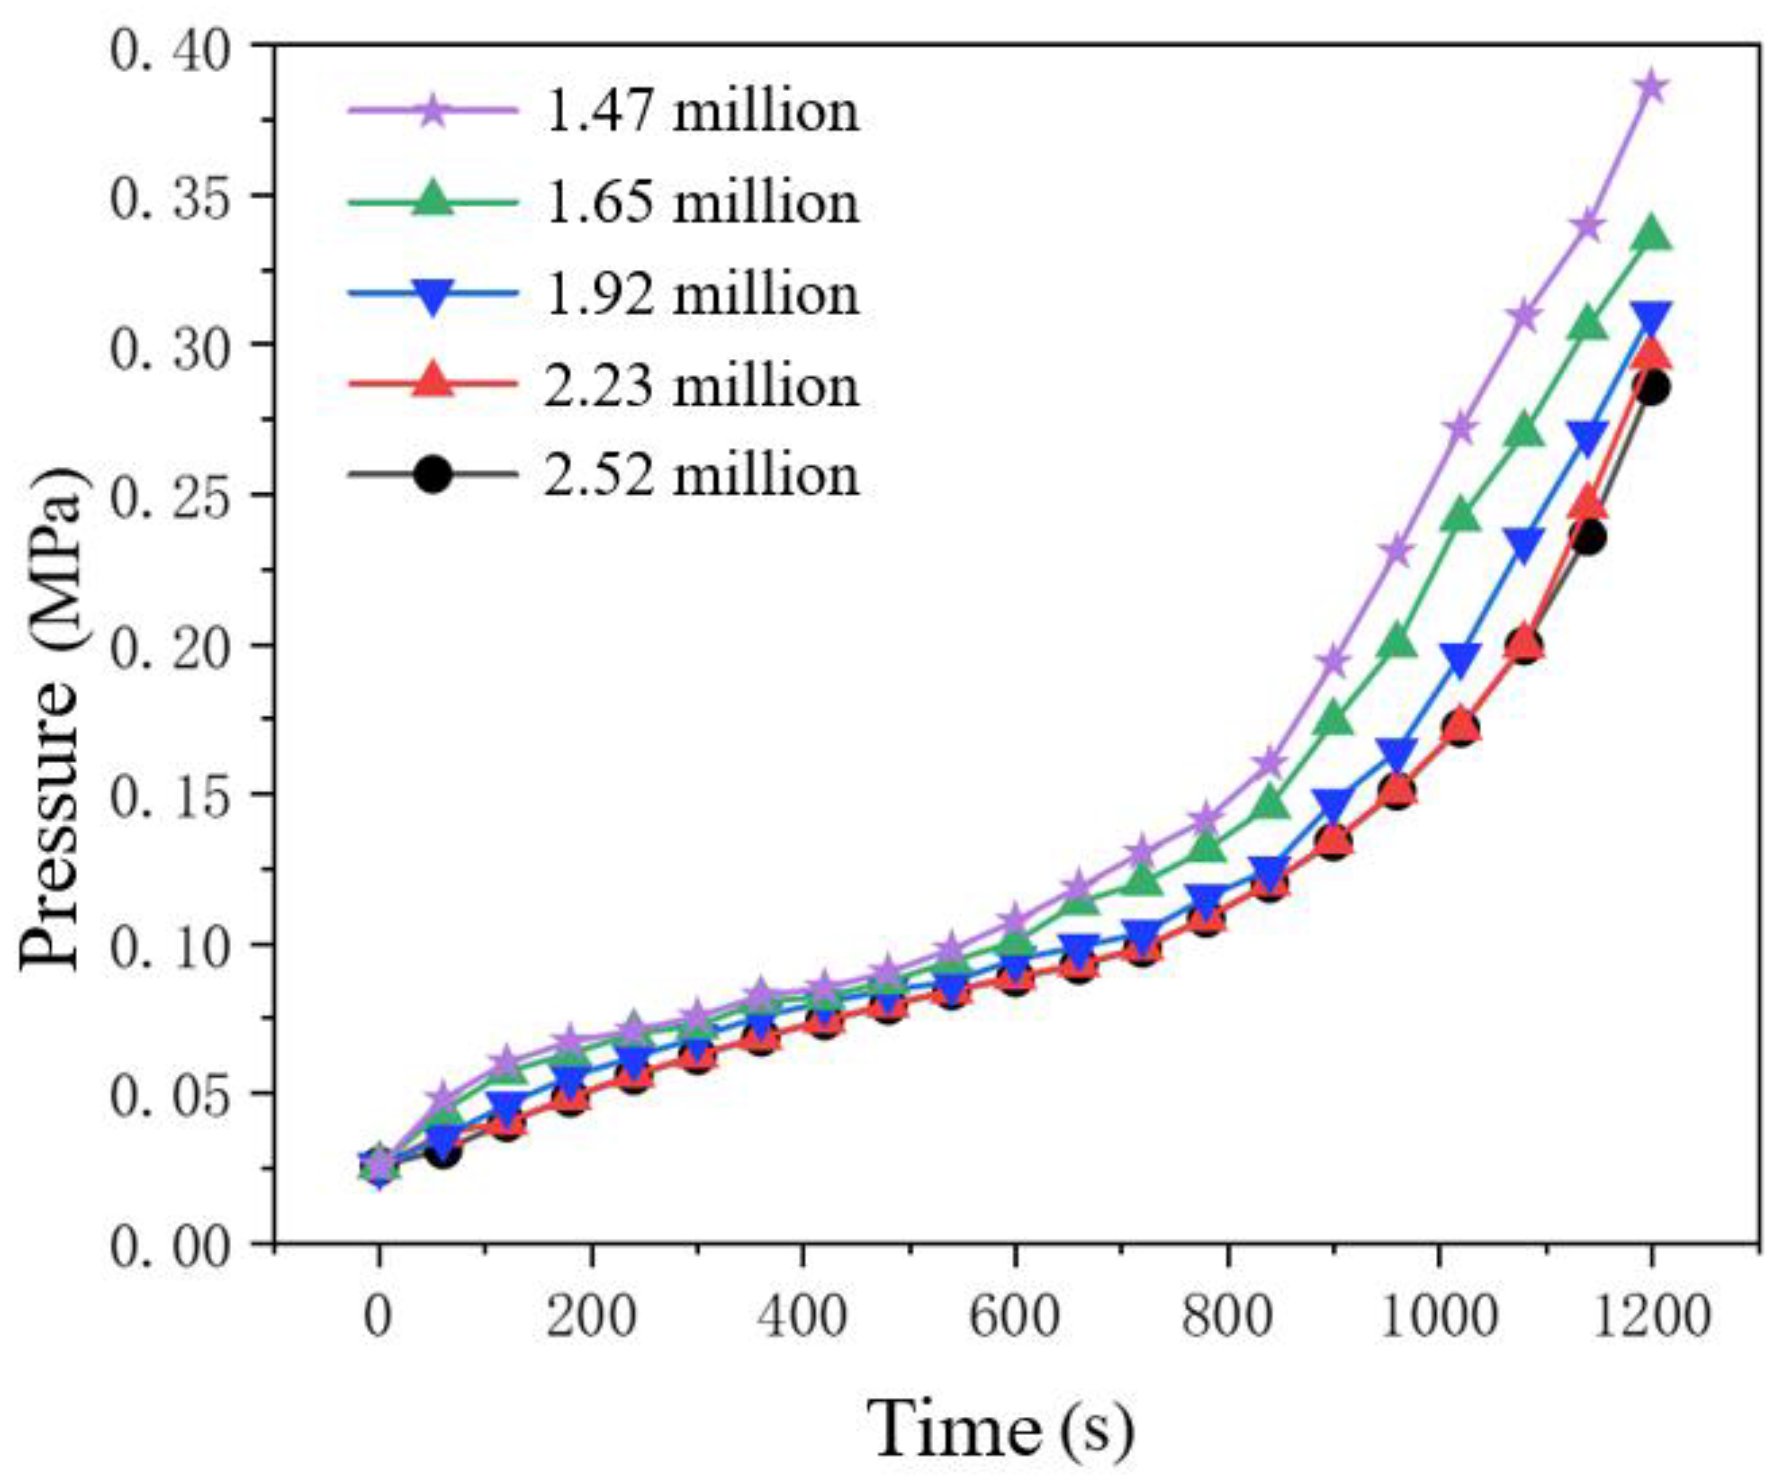
Figure 4.
Schematic diagram of the tank model provided by the NASA experiment [26].
Figure 4.
Schematic diagram of the tank model provided by the NASA experiment [26].
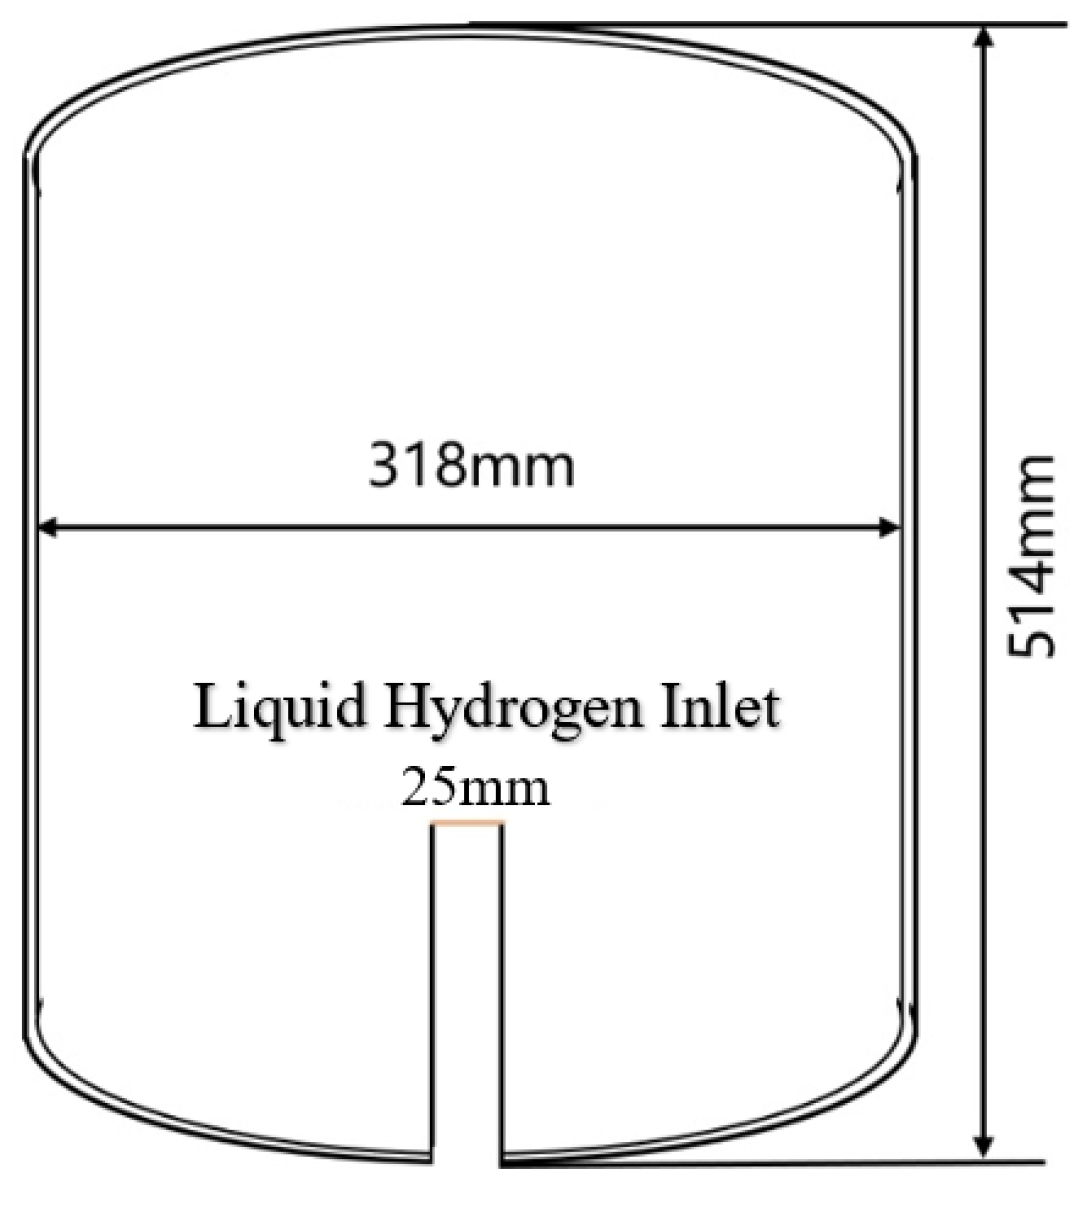
Figure 5.
Phase variation of the simulation model at different stages.
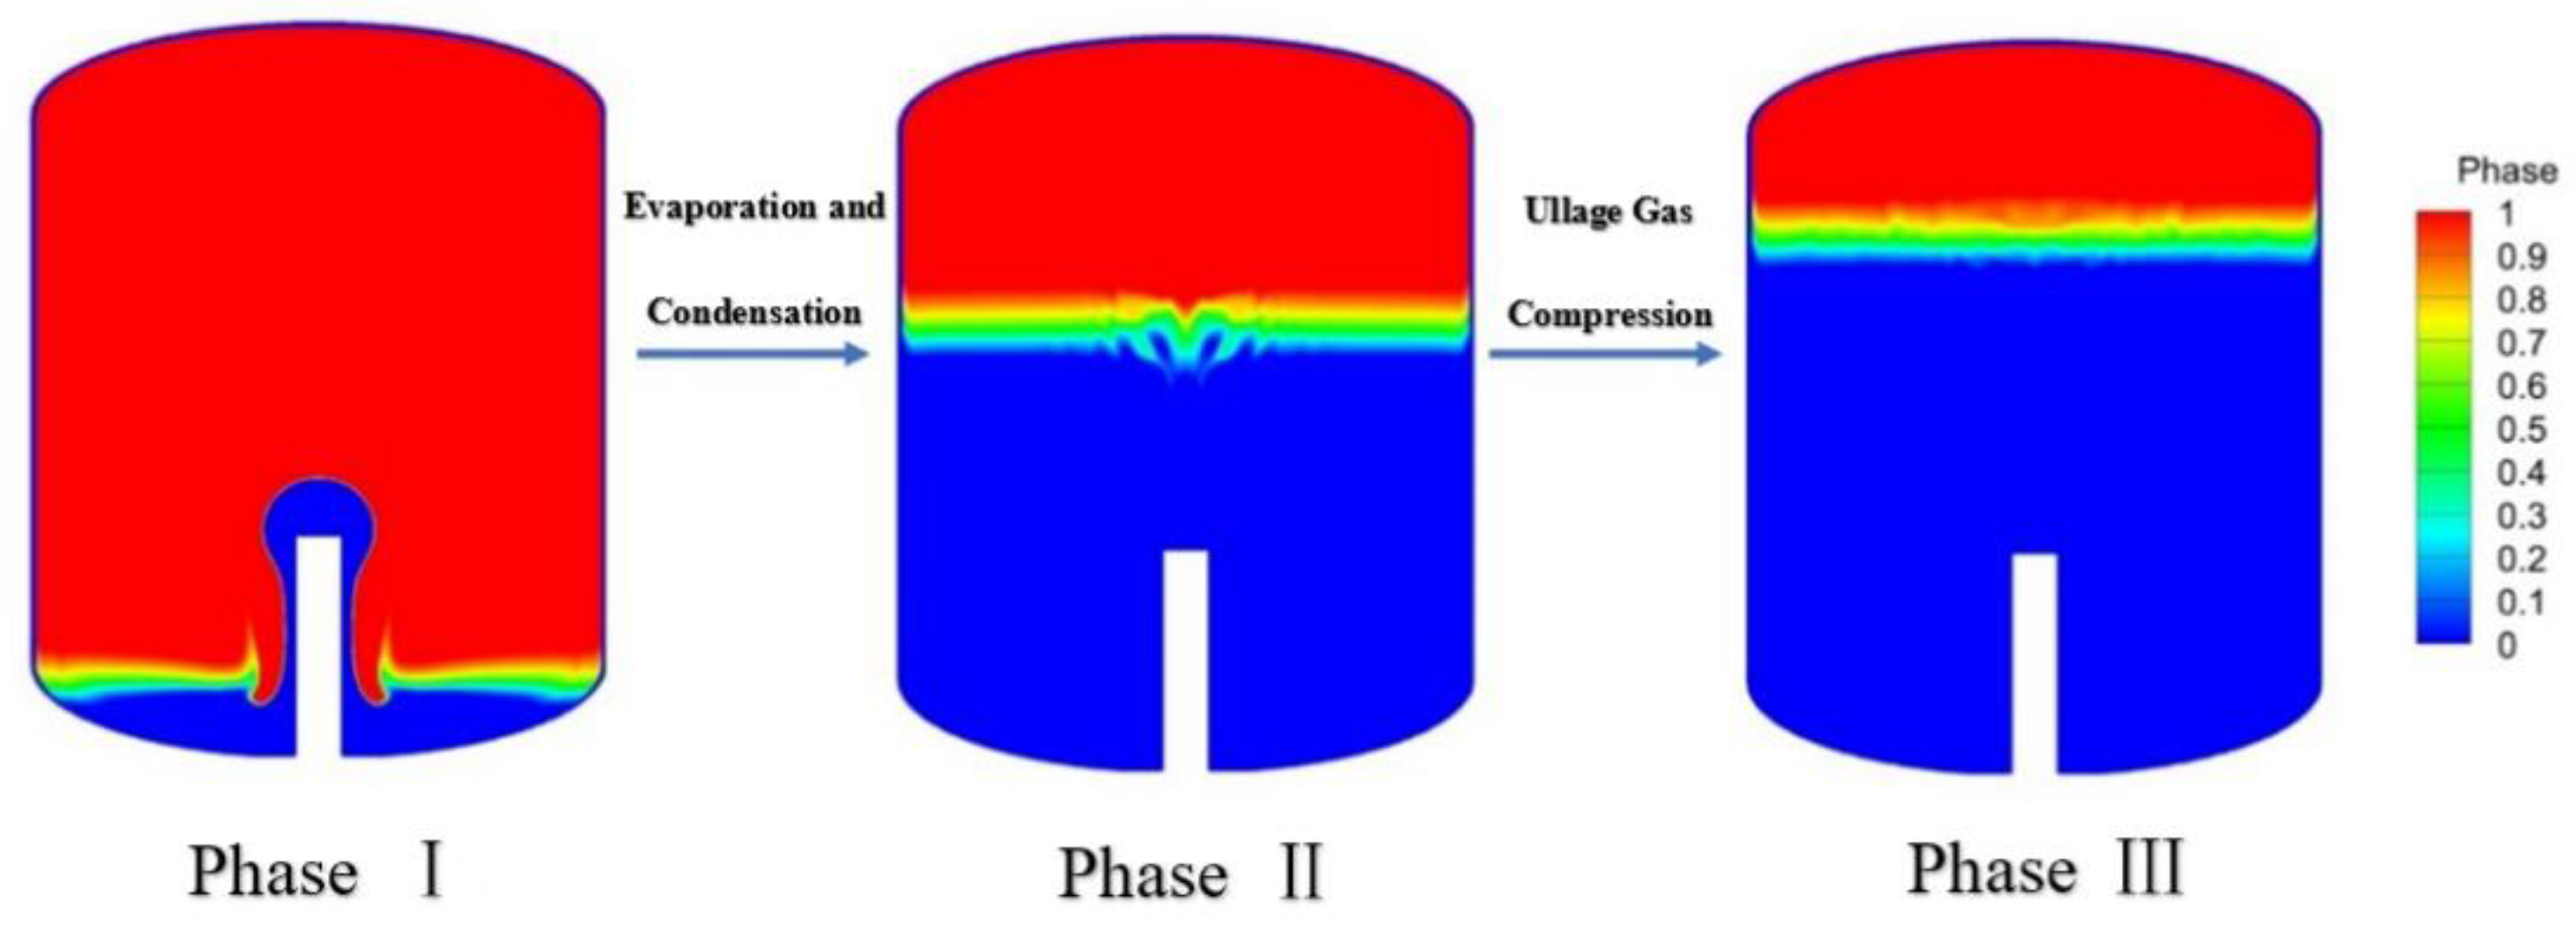
Figure 6.
Comparison of increasing pressure between NASA experimental data and simulation models.
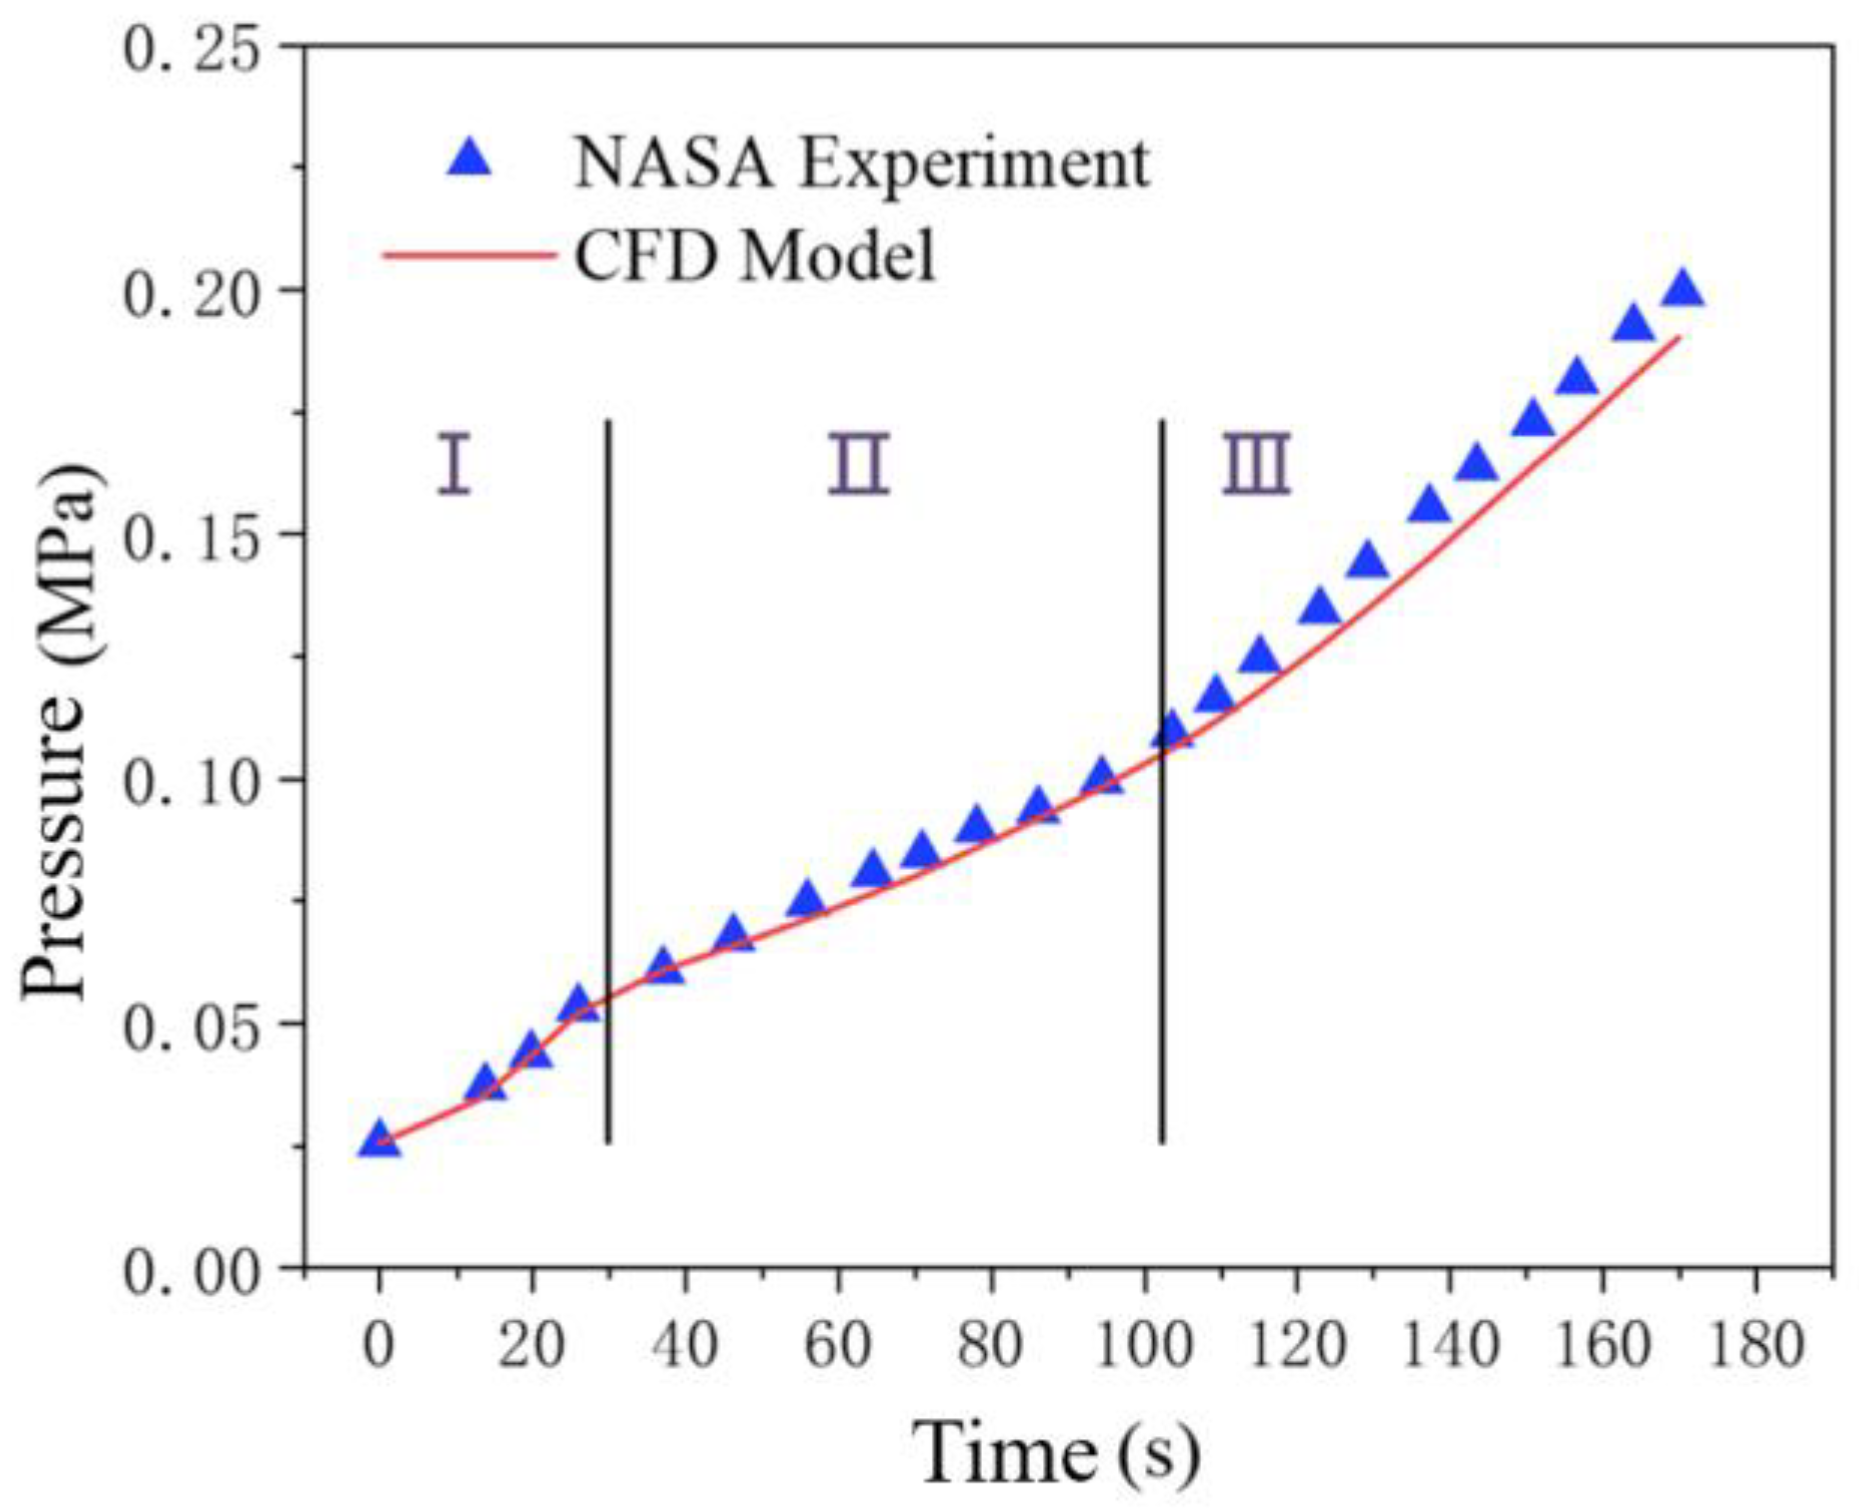
Figure 7.
Temperature variation curves of the storage tank at four different mass flow rate.
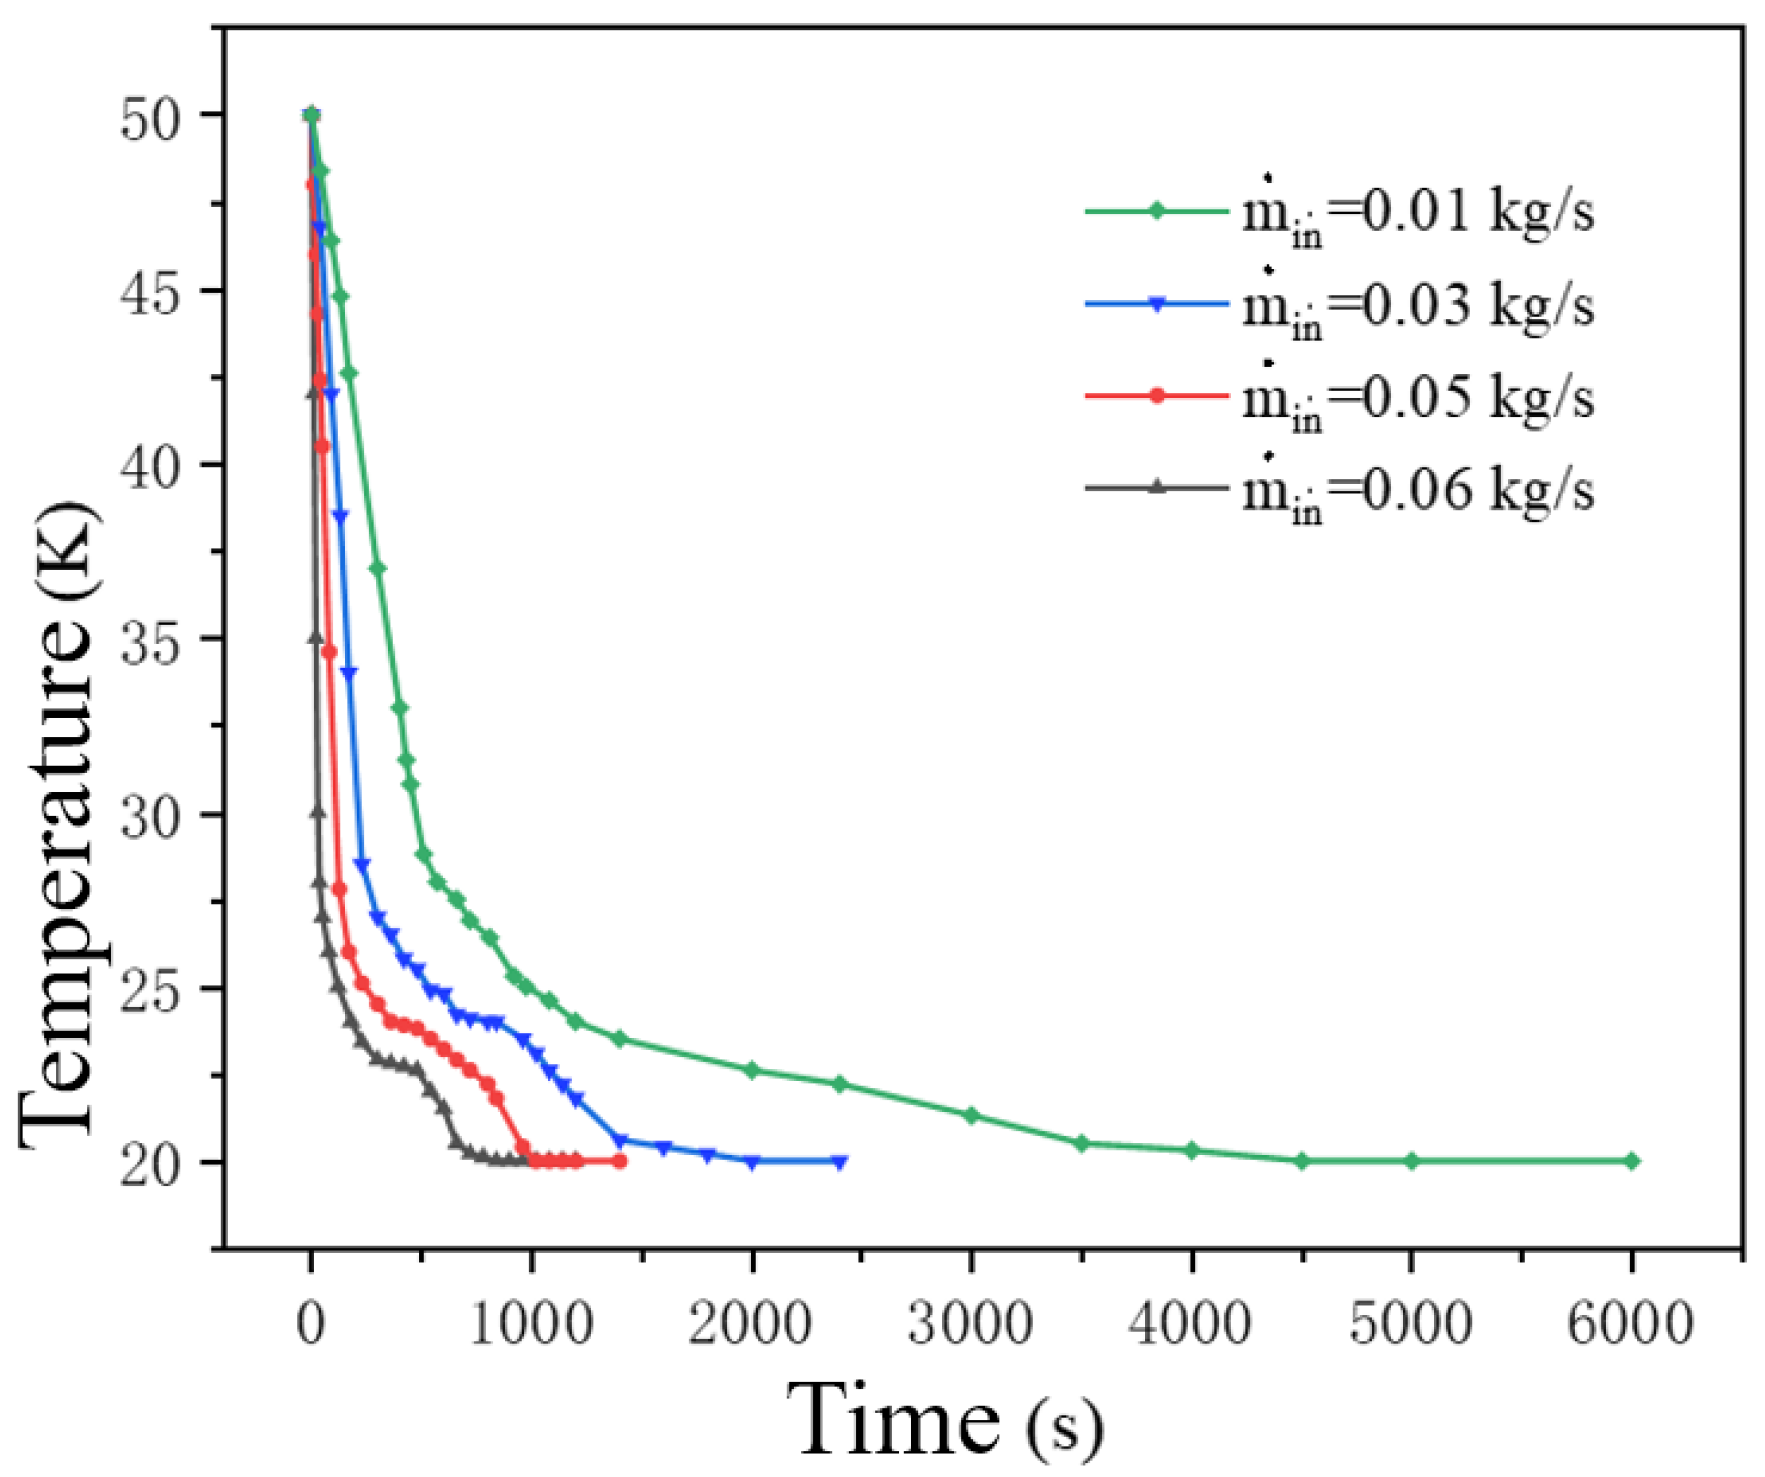
Figure 8.
Phase diagram at different flow rate points from initial time to 800 seconds (a) mass flow of 0.01 kg/s; (b) 0.03 kg/s; (c) 0.05 kg/s; (d) 0.06 kg/s.
Figure 8.
Phase diagram at different flow rate points from initial time to 800 seconds (a) mass flow of 0.01 kg/s; (b) 0.03 kg/s; (c) 0.05 kg/s; (d) 0.06 kg/s.
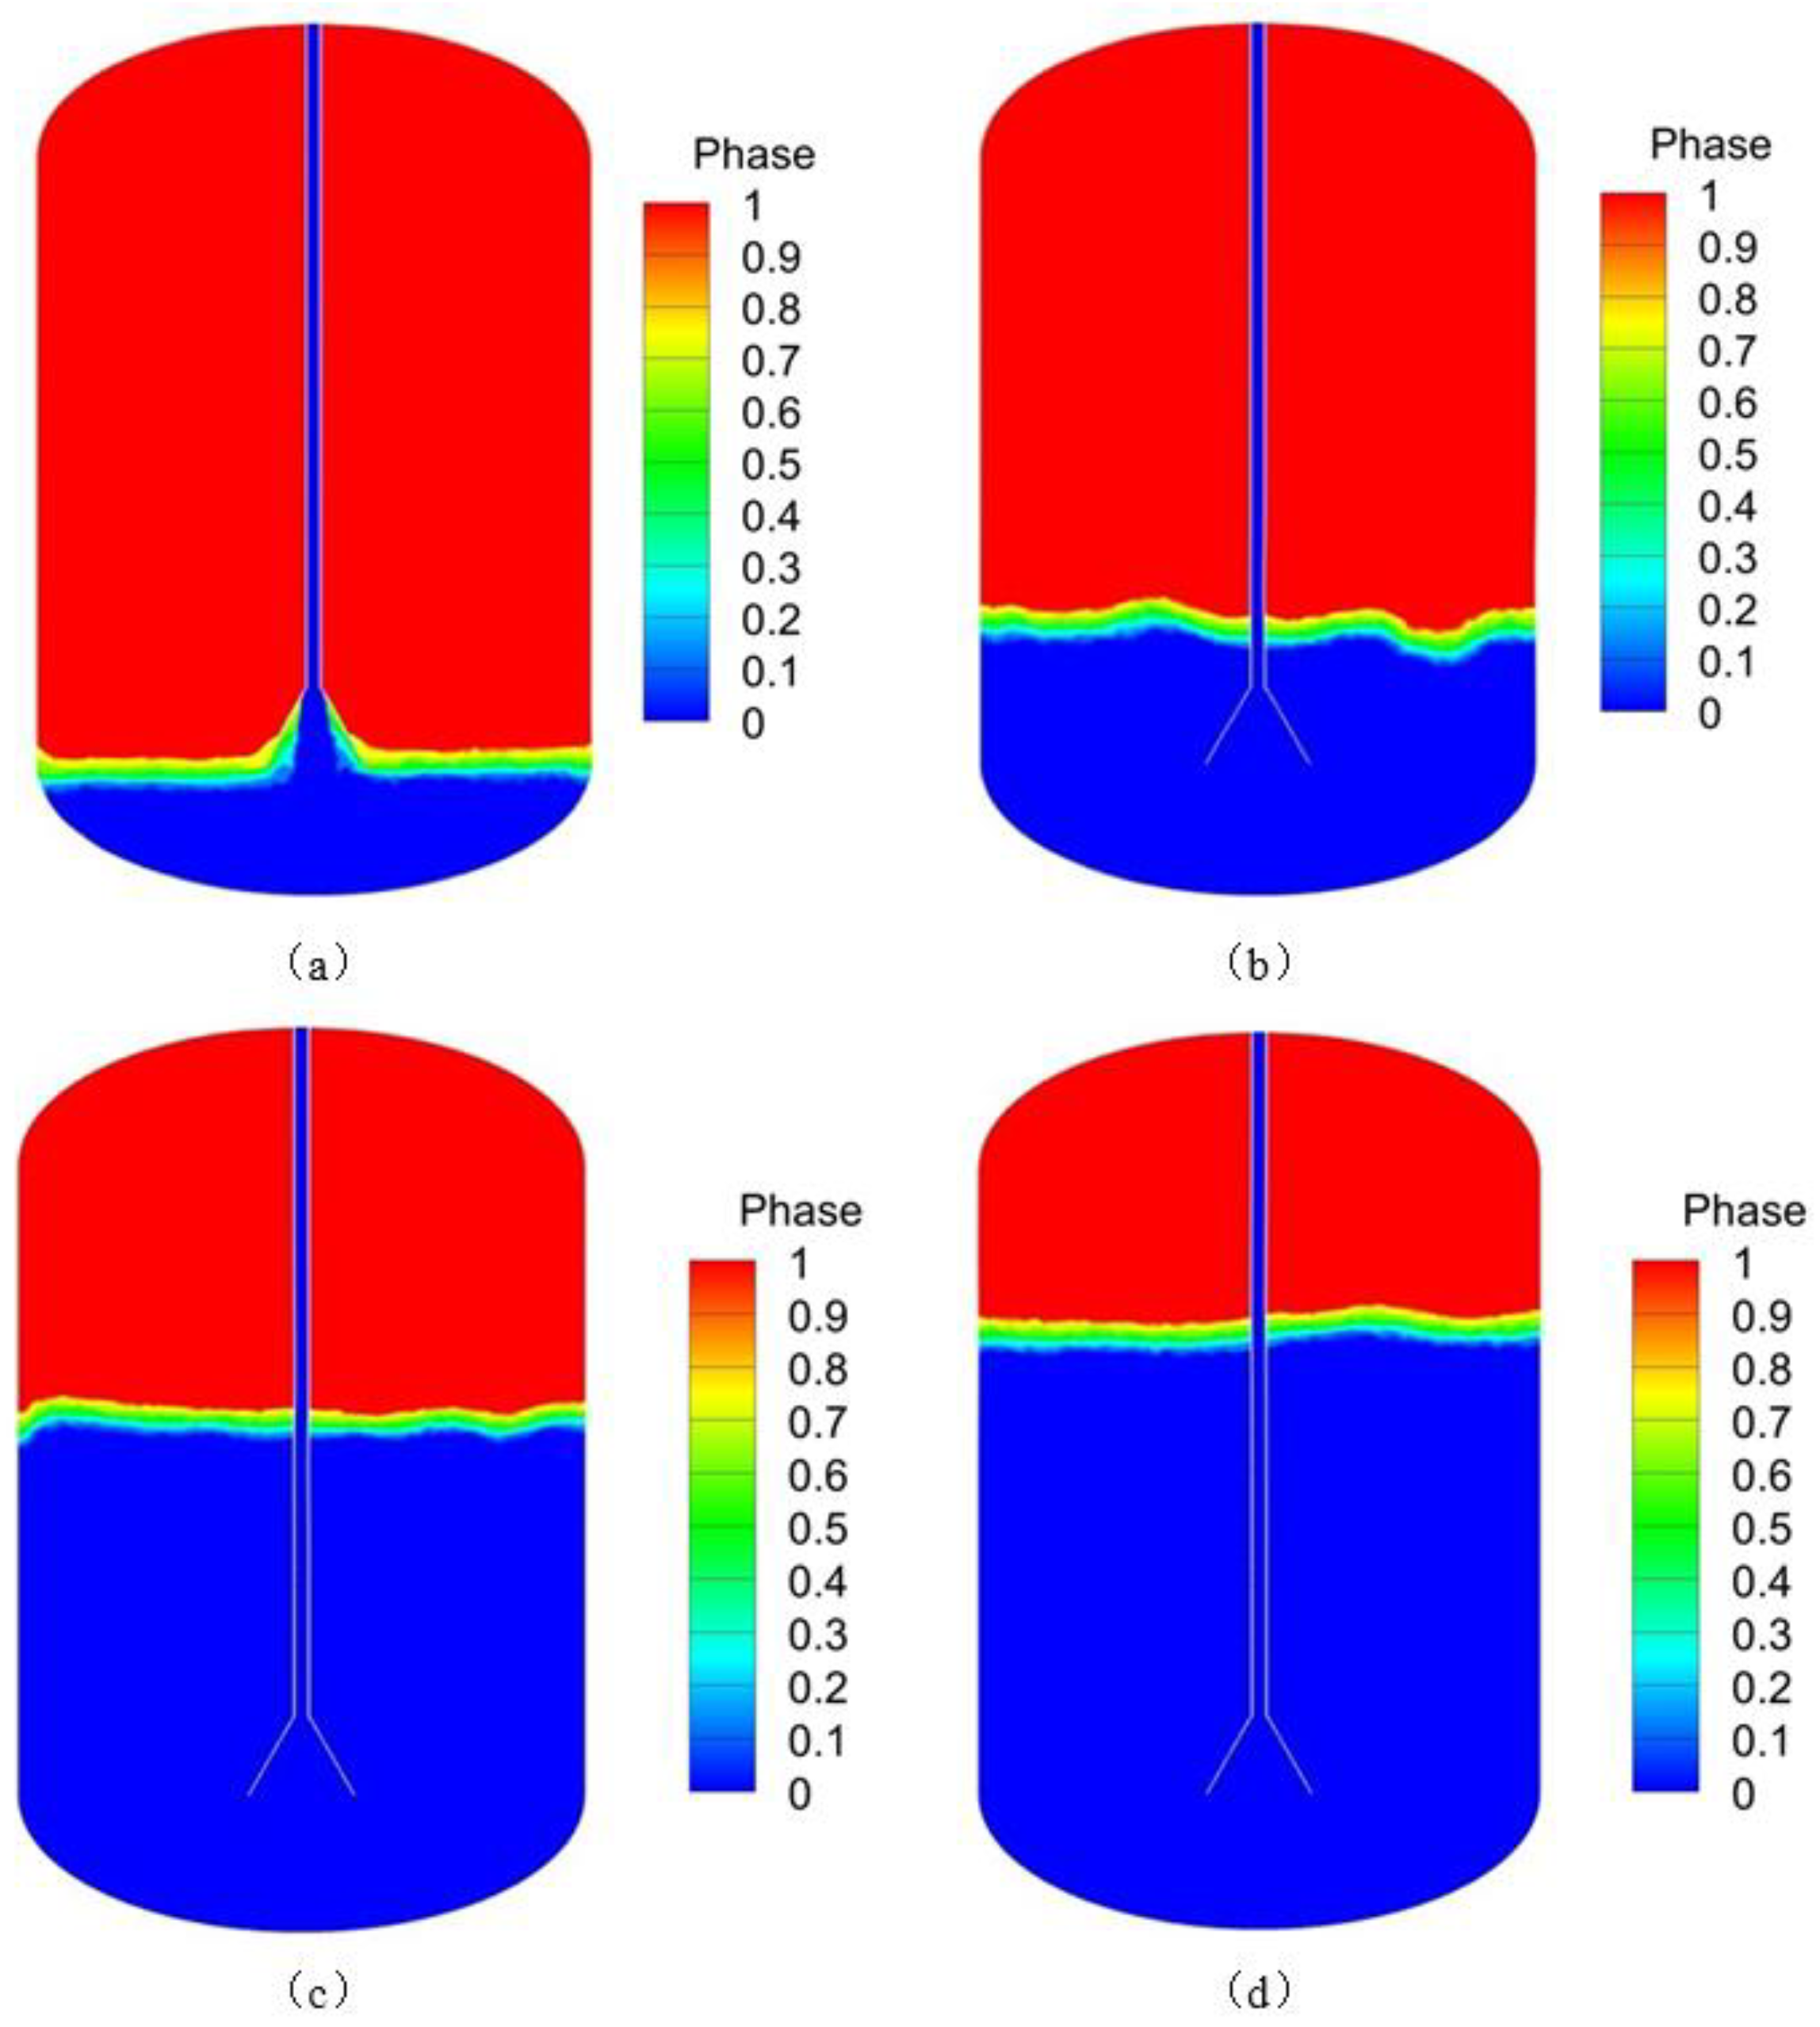
Figure 9.
Unsteady Flow Phenomena in the Bottom Region of Cryogenic Storage Tanks the mass flow rate of 0.06 kg/s and the filling time of 100 s.
Figure 9.
Unsteady Flow Phenomena in the Bottom Region of Cryogenic Storage Tanks the mass flow rate of 0.06 kg/s and the filling time of 100 s.
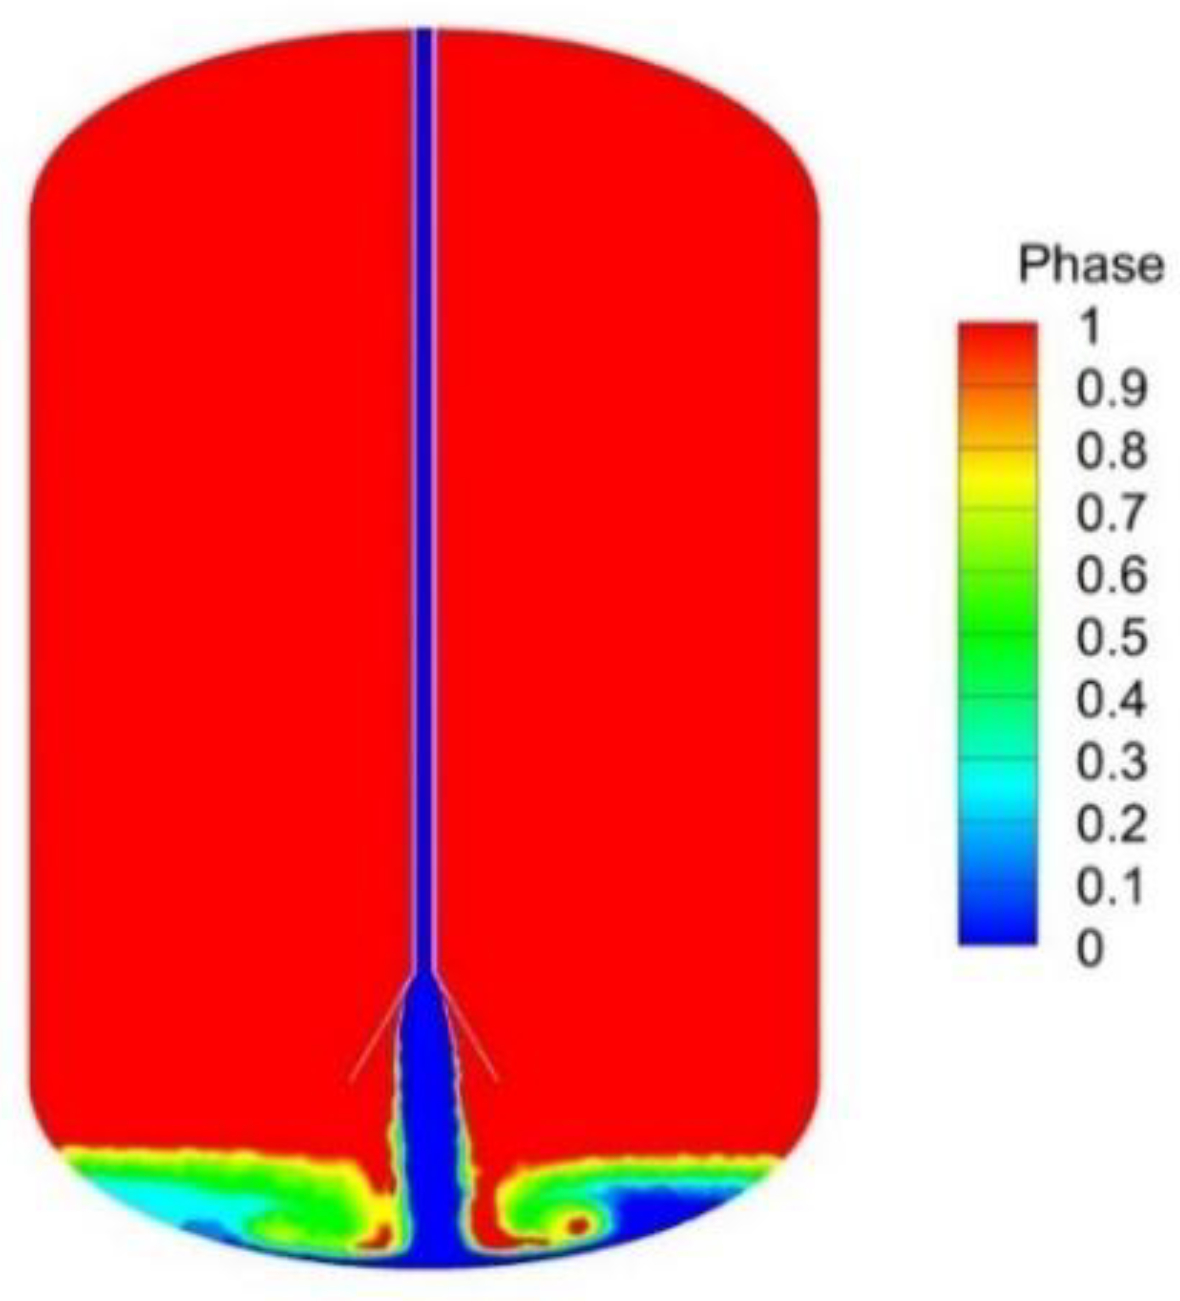
Figure 10.
Phase and Flow Diagram of the tank at different mass flow rates (a) mass flow rate 0.03 kg/s; (b) 0.05 kg/s; (c) 0.06 kg/s.
Figure 10.
Phase and Flow Diagram of the tank at different mass flow rates (a) mass flow rate 0.03 kg/s; (b) 0.05 kg/s; (c) 0.06 kg/s.
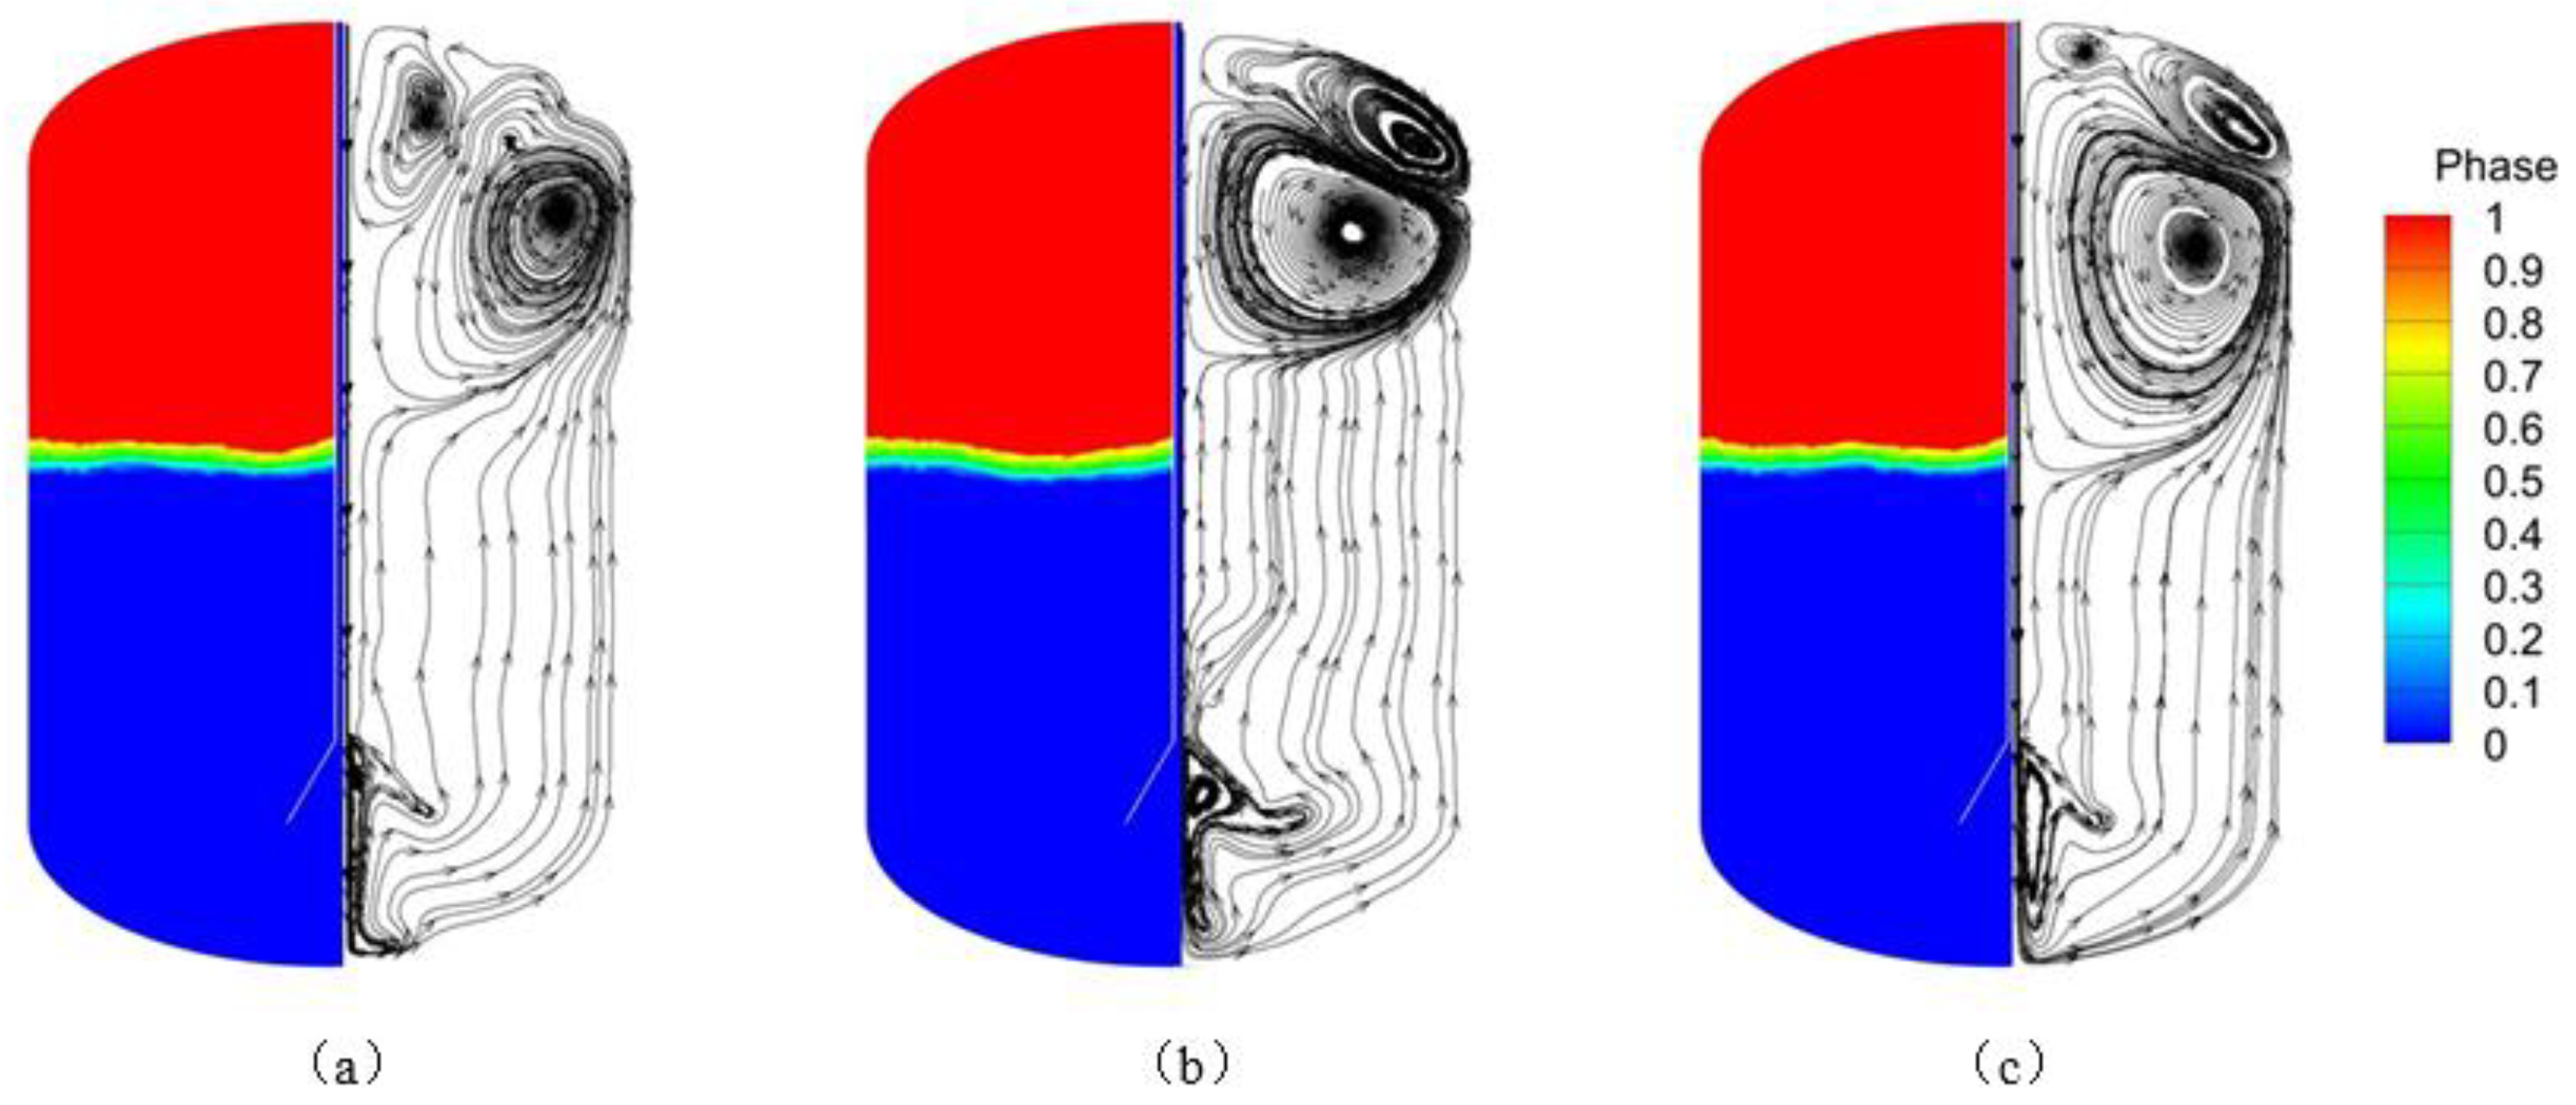
Figure 11.
Time required to achieve 90% fill fraction during liquid hydrogen loading at different mass flow rate.
Figure 11.
Time required to achieve 90% fill fraction during liquid hydrogen loading at different mass flow rate.
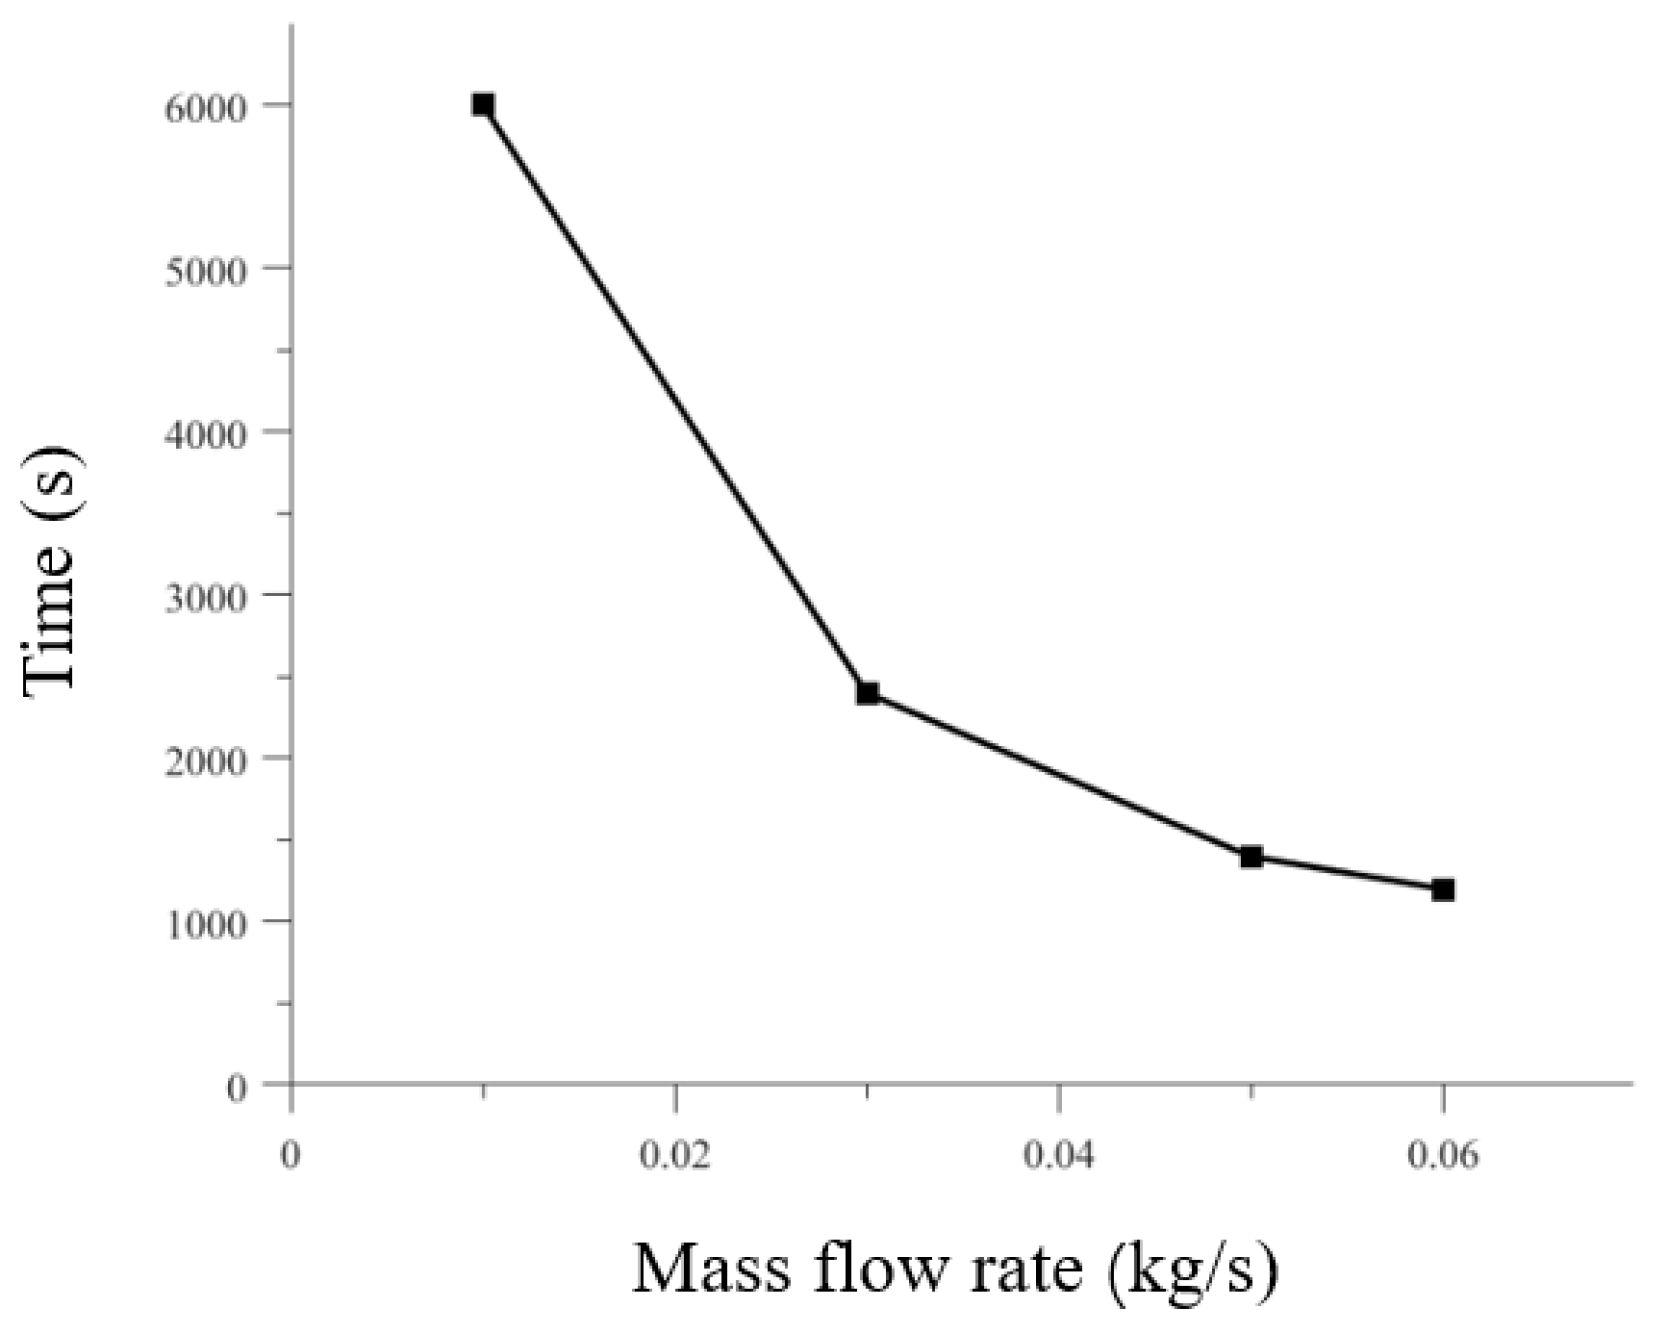
Figure 12.
Evolution of pressure buildup at varying initial liquid hydrogen temperatures.
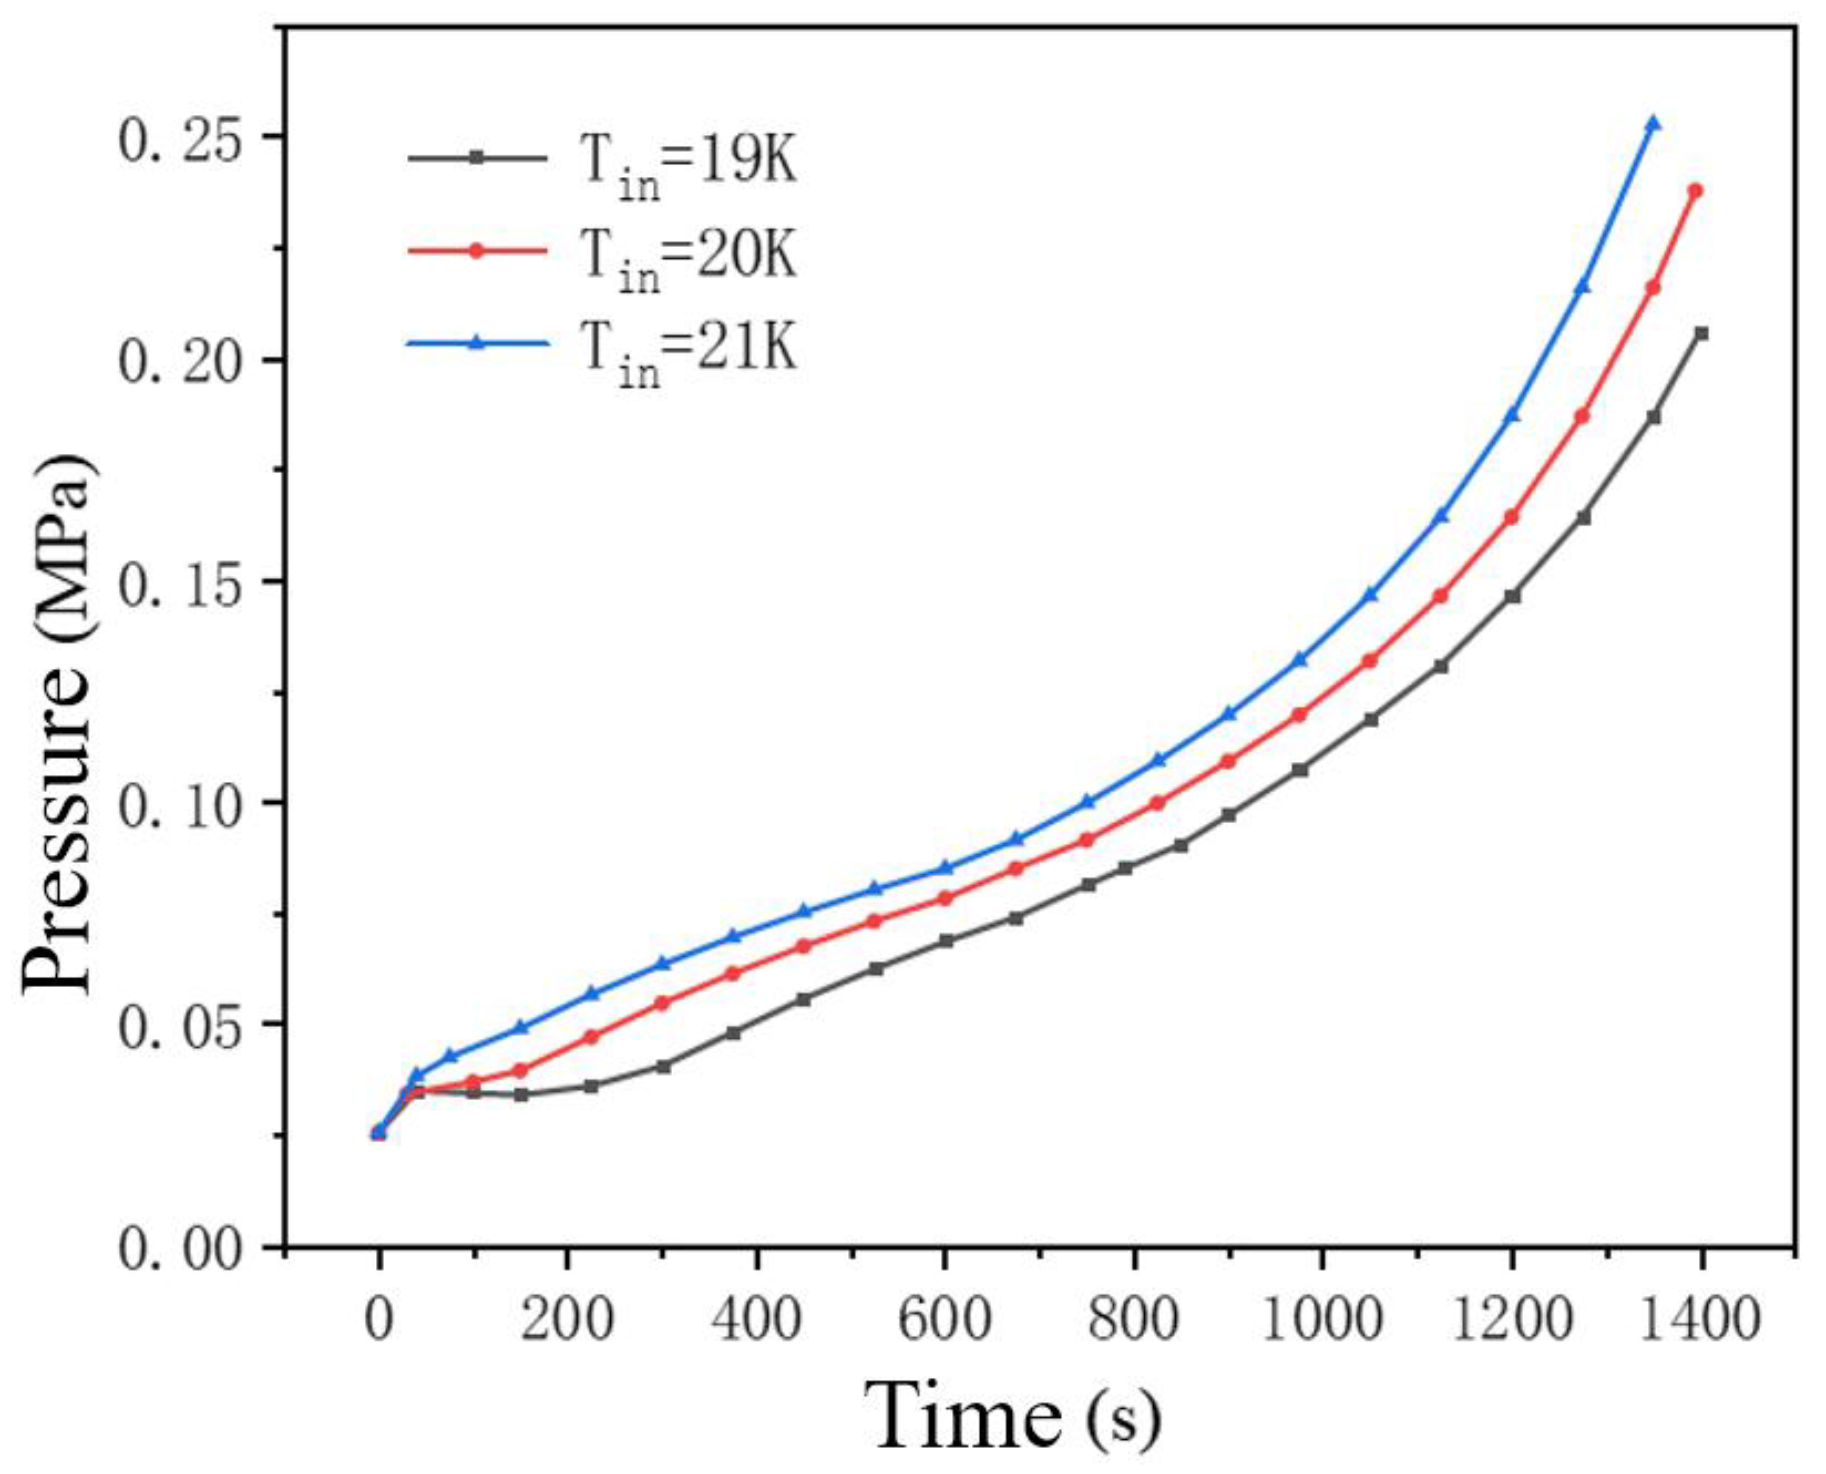
Figure 13.
Tank temperature curves at different initial temperatures of liquid hydrogen.
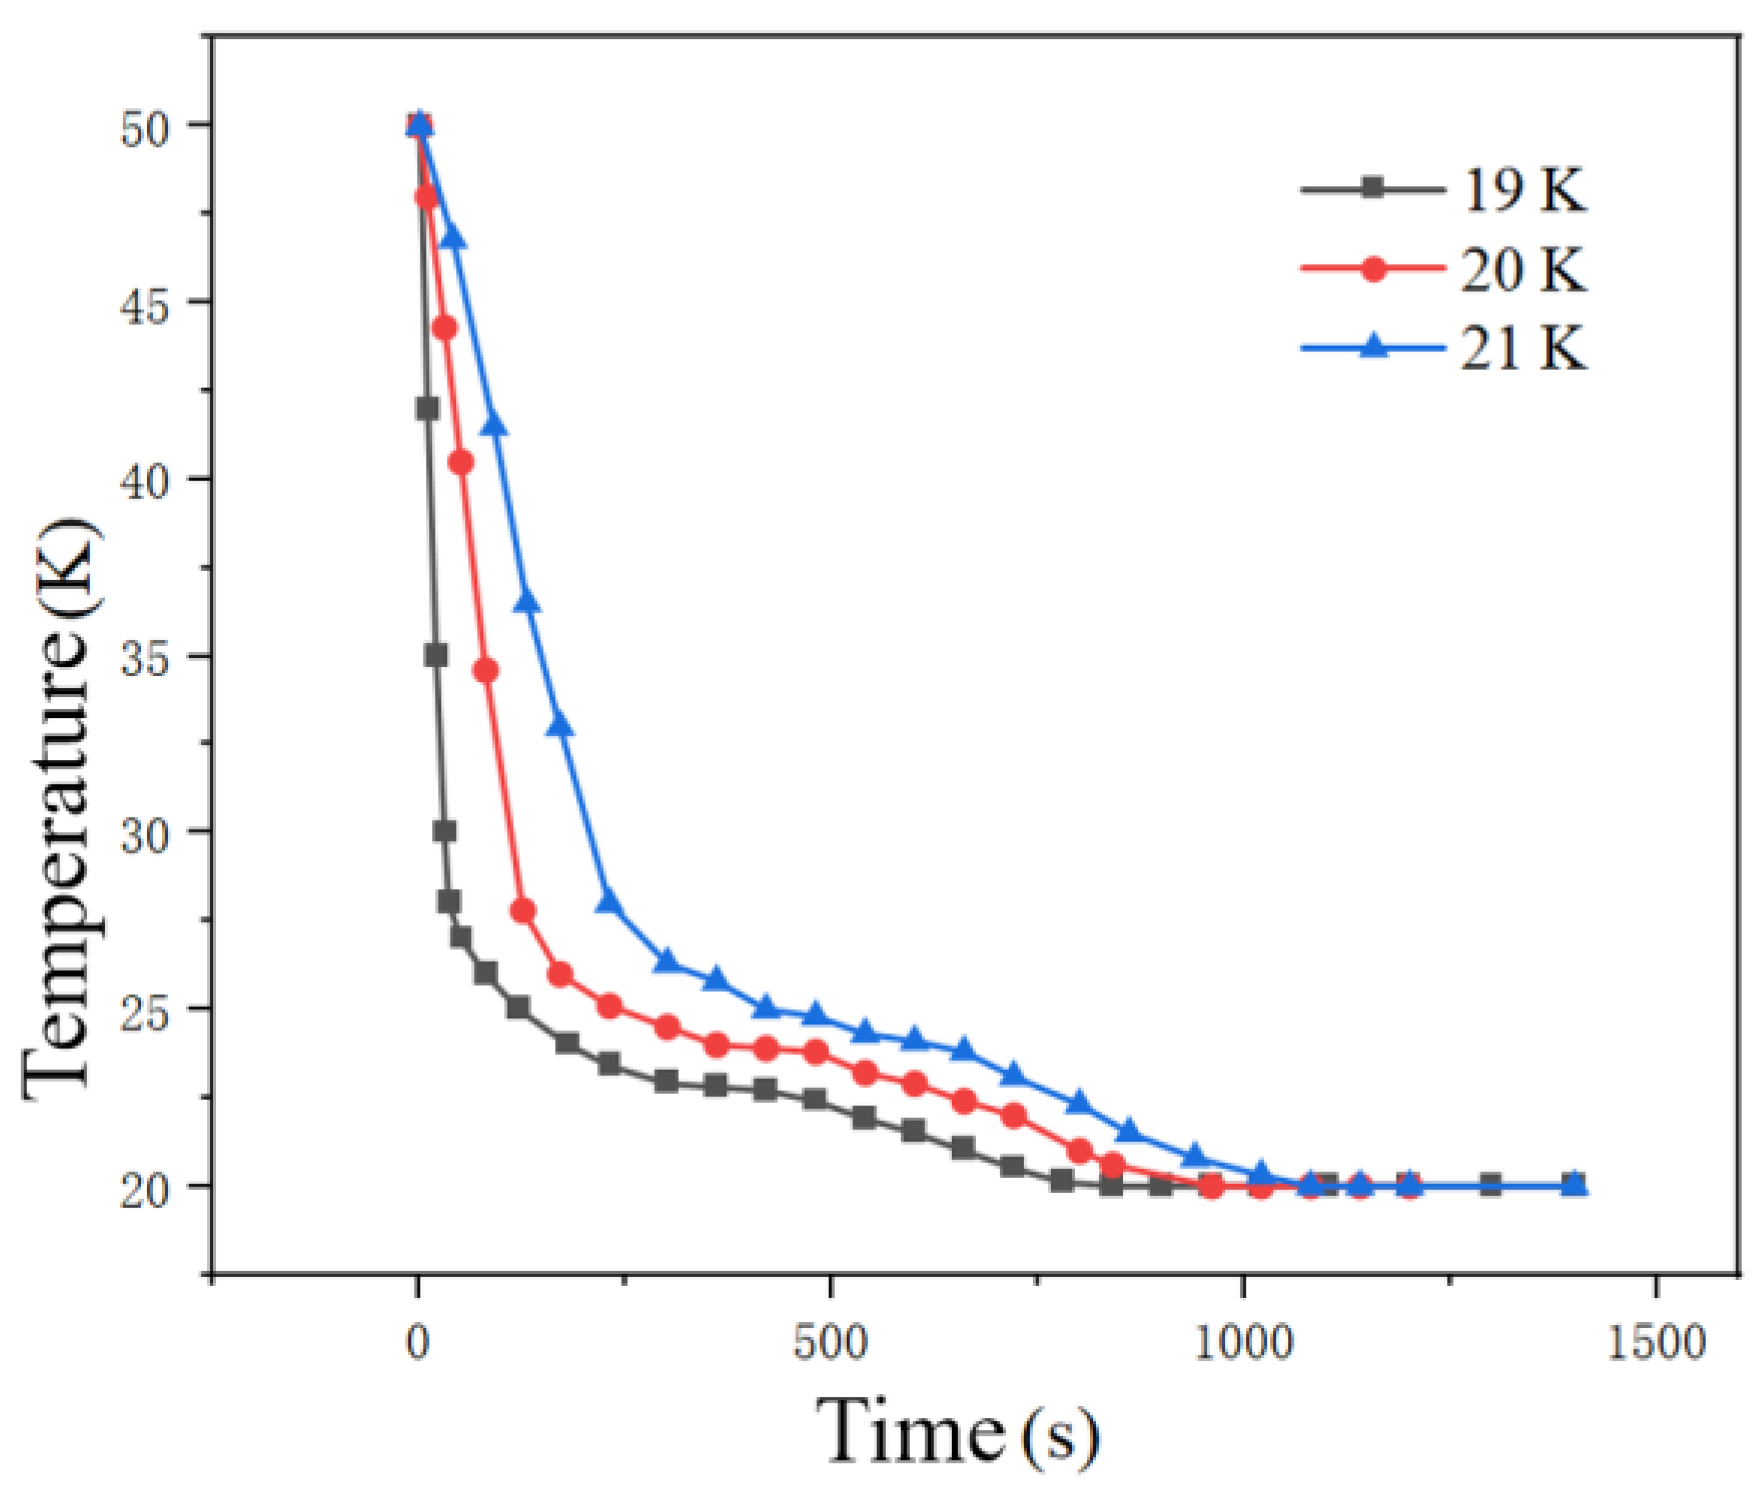
Figure 14.
Phase diagram of the tank at different initial temperatures of liquid hydrogen when filled to 500s. (a) 21k; (b) 20k; (c) 19k.
Figure 14.
Phase diagram of the tank at different initial temperatures of liquid hydrogen when filled to 500s. (a) 21k; (b) 20k; (c) 19k.
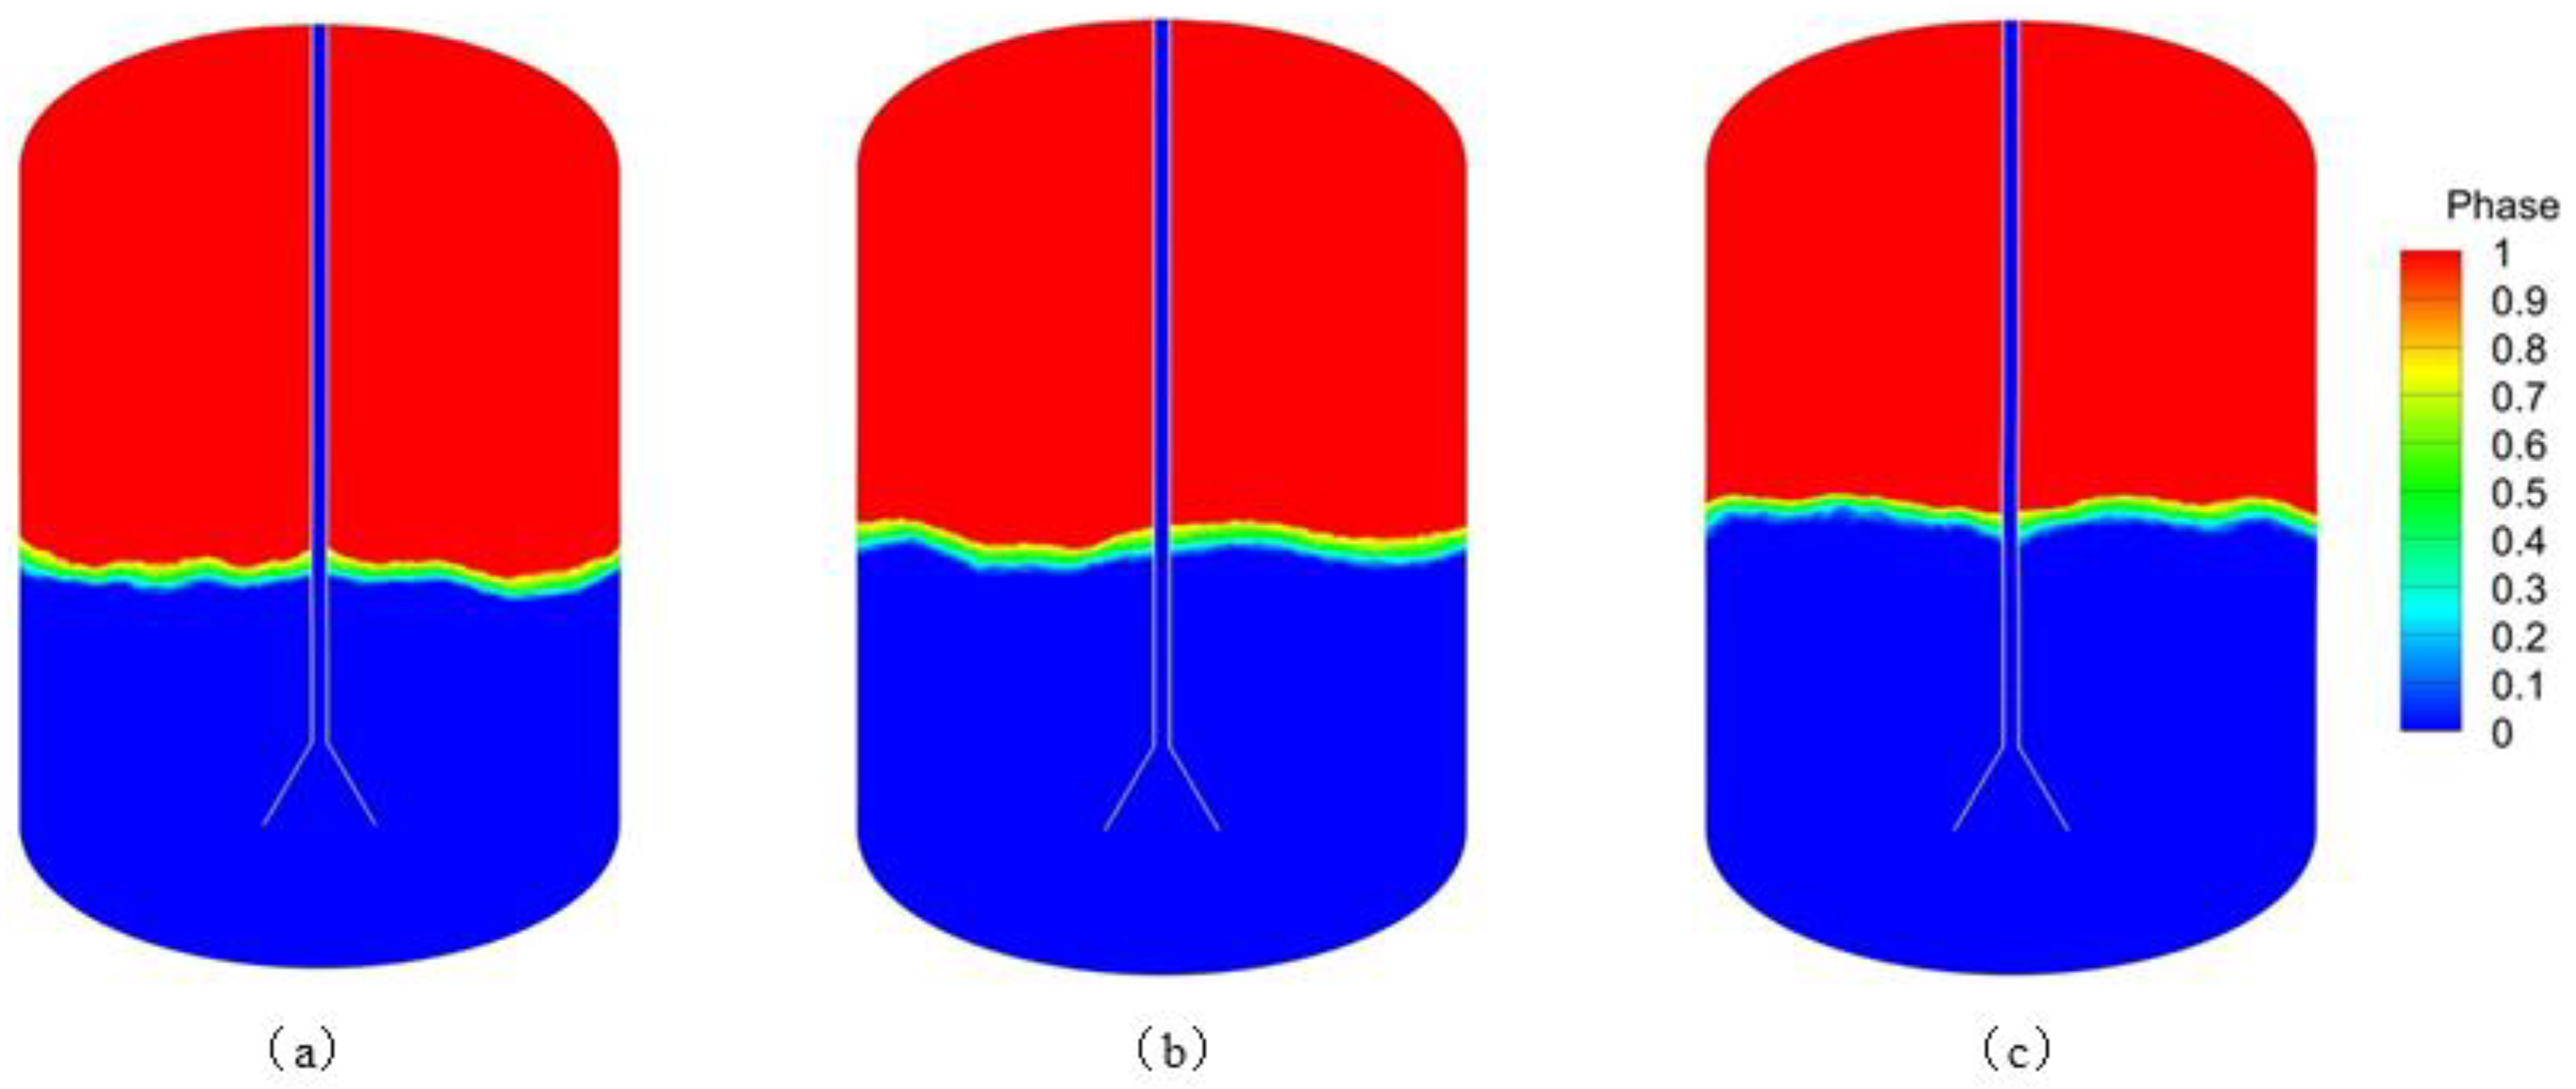

Table 1.
Cryogenic Flow Standard Facilities at Domestic and International Institutions.
| Completion Time | Institution | Working Medium | Principle | Operating Temperature (℃) | Flow Range (kg/s) | Uncertainty |
| About 1960 | NASA | Liquid Hydrogen | Volumetric Method | −253~−251 | 0.022~0.45 | 0.25% |
| About 1974 | TNO | Liquid Hydrogen | m-t Method | −253~−251 | /~1.062 | 0.4% |
| 2014 | Kyoto University | Liquid Hydrogen | m-t Method | −252~−249 | / | / |
| About 1960 | NASA | Slush Hydrogen | Volumetric Method | −253~−240 | / | 1~2% |
| 2004 | Tohoku University | Slush Hydrogen | Volumetric Method | −253~−240 | / | / |
| 2012 | VSL | LNG | m-t Method | −175~−123 | 0.625~3.12 | 0.12~0.15% |
| 2018 | VSL | LNG | Master Meter Method | −175~−123 | 0.625~25 | 0.17% |
Disclaimer/Publisher’s Note: The statements, opinions and data contained in all publications are solely those of the individual author(s) and contributor(s) and not of MDPI and/or the editor(s). MDPI and/or the editor(s) disclaim responsibility for any injury to people or property resulting from any ideas, methods, instructions or products referred to in the content. |
© 2025 by the authors. Licensee MDPI, Basel, Switzerland. This article is an open access article distributed under the terms and conditions of the Creative Commons Attribution (CC BY) license (http://creativecommons.org/licenses/by/4.0/).
Copyright: This open access article is published under a Creative Commons CC BY 4.0 license, which permit the free download, distribution, and reuse, provided that the author and preprint are cited in any reuse.


