
Submitted:
28 October 2024
Posted:
30 October 2024
You are already at the latest version
Abstract
This paper presents the results of numerical simulations examining the thermodynamic processes during hydraulic hydrogen compression, using COMSOL Multiphysics® 6.0. These simulations focus on the application of hydrogen compression systems, particularly in hydrogen refueling stations. The computational models employ the CFD and Heat Transfer modules, along with deforming mesh technology, to simulate gas compression and heat transfer dynamics. The superposition method was applied to simplify the analysis of hydrogen and liquid piston interactions within a stainless-steel chamber, accounting for heat exchange between the hydrogen, the working fluid, and the cylinder walls. The study investigates the effects of varying compression stroke durations and initial hydrogen pressures, providing detailed insights into temperature distributions and energy consumption under different conditions. The results reveal that the upper region of the chamber experiences significant heating, highlighting the need for efficient cooling systems. Additionally, the simulations show that longer compression strokes reduce the power requirement for the liquid pump, offering potential for optimizing system design and reducing equipment costs. This study offers crucial data for enhancing the efficiency of hydraulic hydrogen compression systems, paving the way for improved energy consumption and thermal management in high-pressure applications.
Keywords:
hydrogen
; refueling stations
; hydraulic compressors
; numerical simulations
; COMSOL
; heat transfer
; CFD modelling
; energy efficiency
1. Introduction
Hydrogen is one of the most abundant elements on Earth [1], and recently it has gained increasing attention as a key element in addressing climate change and transitioning to clean energy. Its ability to decarbonize hard to electrify sectors, such as industry and transportation, makes it a promising energy source for the future [2]. Hydrogen can also be used for energy storage from renewable sources, helping to address the intermittency of these sources [3]. At the same time, the European Union has set an ambitious goal to become the first climate-neutral continent by 2050, which is in line with the guidelines of the European Commission, further emphasizing the importance of hydrogen in achieving these sustainability targets [4].
Hydrogen energy is becoming an essential component of a sustainable energy future, highlighting the importance of safety issues for the scientific community and industry [5,6,7]. Analysis of the current state of research reveals main key challenges and future directions. Over the past decades, interest in the issues of hydrogen storage, combustion, and spontaneous ignition has grown significantly, indicating the increasing importance of these aspects [8,9,10,11,12,13]. Nevertheless, the use of hydrogen is associated with high costs, as well as challenges in production, storage, and transportation. The limited infrastructure for its application also poses a barrier to its widespread adoption [14].
The transition to a hydrogen-centric energy landscape requires the integration of knowledge from various fields, such as geochemistry, biology, and engineering, paving the way for a sustainable and environmentally friendly future [3]. Compressed, liquid, and cryo-compressed hydrogen provide high efficiency due to their high volumetric and gravimetric density, making them attractive for compact storage [15]. The development of new storage systems, improved infrastructure, and integration technologies is crucial for realizing the full potential of hydrogen as a clean energy source [16,17].
However, hydrogen is poised to play a central role not only in energy generation but also in various applications, such as electric mobility and industrial processes. In particular, electric mobility is expected to be a key aspect of the decarbonization of the energy system, with hydrogen-powered fuel cell electric vehicles (FCEVs) being strong candidates [18,19]. FCEVs offer specific advantages over battery electric vehicles (BEV), such as longer range and significantly lower refueling times, which make them highly suitable for long-distance travel and commercial applications. These benefits are facilitated by high-pressure hydrogen tanks that can be filled in less than five minutes at dedicated compression storage dispensing (CSD) stations [20]. For refueling vehicles with hydrogen, the infrastructure necessary for this process is required [21]. Because of this hydrogen refueling station (HRS) are created. In a hydrogen refueling station, hydrogen is compressed from low pressure (0.1 -3.0 MPa) to a high pressure in the range of 35.0 bar to 70.0 MPa and is stored in high-pressure cylinders [22].
When deploying hydrogen refueling infrastructure, two main options for supplying hydrogen to refueling stations are considered: on-site hydrogen production and transportation-based delivery [23]. For the transport via truck, hydrogen will be pre-dominantly transported and stored between the storage nodes and the distribution hubs at a high-pressure level of 50 and 54 MPa whilst it will be mainly transported at 25 and 30 MPa [24]. The limitation of the pressure level in the storage system is due to hydrogen's high diffusivity, which can result in significant losses over extended periods at high pressure [25].
A schematic diagram of a refuelling station using hydrogen at inlet pressure from 0.6 up to 25.0 MPa, either brought by trailer or generated by electrolysis at the station itself, is shown in Figure 1 [26]. The proposed concept is especially attractive when combined with the use of green hydrogen produced by electrolysis, fed from wind turbines, solar panels or the electricity grid from the nuclear power plant. Using the booster compressor, the low-pressure hydrogen is raised to the required 70 MPa for cars and 35 MPa for trucks and pumped into the storage tanks. The high-pressure hydrogen is then filled into the vehicle's fuel tanks via a dispenser.
Depending on the production method, hydrogen is conventionally labelled green, blue, pink and grey, and specialised terms like – safe, sustainable, low-carbon and pure – are also used [27]. Utilisation of renewable energy sources, which are practically inexhaustible, for hydrogen generation allows to establish continuous, sustainable, ecologically clean energy production cycle. Thus, “green” hydrogen is one of the most promising approaches for future energy storage infrastructure development projects [28,29].
In the production of green hydrogen, the main emphasis is on the use of wind and solar energy [30,31]. Current level of technological processes ensures the production of hydrogen by electrolysis of water without emission of carbon dioxide into the atmosphere [32]. Thus, the entire process of water electrolysis and hydrogen generation can potentially be carbon free if renewable or nuclear electricity is used.
Nowadays, when deploying hydrogen infrastructure for vehicle refuelling, it is essential to take advantage of simple and affordable devices for hydrogen compression tasks. In articles [32] currently existing technologies of hydrogen compression, their working principles, advantages and limitations are reviewed and discussed. It should be noted, that from a wide variety of compressors, the compressors with a liquid piston have the lowest energy consumption, as only this technology is able to provide a quasiisothermal compression process [33].
This is achieved as a result of the fact that during hydraulic compression there is intense mixing of liquid and gas, between which heat transfer occurs at high speed. This involves a process of compression with near isothermal operation, leading to efficient compression with minimal energy consumption, which helps reduce the weight of the compressor and the overall system cost. Similar conclusions can be drawn from the results of numerical modeling of the hydraulic compression of hydrogen from 1.5 MPa to 45 MPa in a compression chamber with a volume of 31.72 L, as presented in [34].
The liquid piston gas compression concept uses a column of liquid to directly compress gas in a fixed volume chamber [35]. Once the compression stroke is complete, the heated fluid is channelled from the compression chamber into the heat exchanger, where it is cooled. As a result, hydraulic compressors have an advantage over reciprocating compressors in terms of cooling, as there is no need for external heat exchangers on the compression chambers [36].
The use of a liquid piston eliminates gas leakage from the compression chamber and eliminates the friction of the mechanical sliding seals present in the cylinders of mechanical compressors and allows to increase efficiency of gas compression. Using a simplified model, it has been demonstrated that this concept can increase the com-pression efficiency from 70% to over 84-86% [37].
Research and development efforts continue to improve the efficiency and economics of hydrogen compression technologies. All new innovations aim to address challenges such as heat management during compression to enhance overall performance, reducing energy loss, and enhancing system longevity to ensure sustainable performance improvements, etc. [38].
A review of heat transfer in liquid compressors shows that issues related to modeling of heat transfer and assessing its impact are significant but understudied [39,40,41,42,43]. This is partly due to disagreements regarding the severity and complexity of its effects under dynamic conditions in the compressor chamber. However, there is broad consensus in the literature that heat transfer within the cylinder is one of the key factors affecting the efficiency of reciprocating compressors.
The importance of understanding heat transfer in liquid compressors, particularly in relation to reciprocating compressors, lies in its direct impact on system efficiency and performance. Heat transfer processes within the compressor cylinder affect the thermodynamic cycle, influencing the compression temperature and overall energy consumption. When heat dissipation is inadequate or improperly modeled, it can lead to higher temperatures, which increase the energy required for compression and reduce overall efficiency. Additionally, excess heat can cause mechanical stress and wear on components, leading to increased maintenance and reduced equipment lifespan.
Research shows that while heat transfer is universally recognized as critical, the effects of dynamic conditions during compression—such as fluctuating temperatures and pressure—complicate accurate modeling. Addressing these gaps in understanding can help optimize cooling systems, reduce energy losses, and improve the overall design of liquid compressors. By refining heat transfer models, engineers can develop more efficient compressors, ultimately lowering operational costs and contributing to the effective use of energy in hydrogen compression systems.
The authors in [44] noted that heat transfer processes within liquid pistons during compression are quite complex and difficult to describe, especially for transient and turbulent regimes. The authors of [45] used numerical modeling to simulate a single compression stroke to study the heat transfer phenomena inside the compression chamber. Their research results confirm that increasing the heat transfer coefficients at the interfaces and within the walls, along with increasing compression time, plays a key role in reducing the temperature of hydrogen.
A thermal analysis of a liquid piston compressor was performed by authors in [46] but it concerned small pressure ratios below 2.5. In [47], the authors performed calculations using a developed CFD model in the COMSOL 6.0 environment [48] to validate the thermodynamic analysis. Thermodynamic analysis is an important method for under-standing the pressure and temperature that arise when filling a hydrogen storage tank with gas, providing the necessary information for determining the boundary conditions for modeling.
One effective method for reducing temperature is the use of porous media different materials. For example, in [49], the experimental effect of porous media in a high-pressure (0.7 to 21.0 MPa) liquid piston air compressor was studied, which corresponds to the expected pressures for the ICAES system. The experiments showed that placing the porous medium at the top of the chamber proved to be more effective than placing it at the bottom. In [50], a porous medium with intermittent plates was also used to enhance heat dissipation during compression, significantly improving the efficiency of compression in an ionic liquid piston compressor. Systematic studies on the effect of porous media under various fluid flow regimes were conducted using ANSYS Fluent for CFD analysis.
The article [36] and patents [51,52,53] present research findings and innovations that are pivotal for designing the compression chamber geometry and the associated thermodynamic processes in a hydraulic hydrogen compression system. These results also contribute to the calculation of the drive power required for the liquid compressor. Such conception was previously developed a concept for a hydraulic compressor that can serve as a critical component in the hydrogen production and utilization process chain, beginning with hydrogen production via water electrolysis and culminating in fuel dispensing at a filling station.
The article [36] and patents [51,52,53] present research findings and innovations that are pivotal for designing the compression chamber geometry and the associated thermodynamic processes in a hydraulic hydrogen compression system. These results also contribute to the calculation of the drive power required for the liquid compressor. Such conception was previously developed a concept for a hydraulic compressor that can serve as a critical component in the hydrogen production and utilization process chain, beginning with hydrogen production via water electrolysis and culminating in fuel dispensing at a filling station.
The paper is organized as follows. Section 2 details the numerical modeling approach used to analyze hydrogen compression in a closed cylindrical compression chamber. Section 3 covers the numerical modeling of the hydrogen compression process in a closed volume. This was conducted with the COMSOL 6.0 software package to evaluate the effects of chamber dimensions and compression rate on the associated thermo-dynamic processes. Section 4 presents the simulation results, focusing on evaluating the energy costs and power consumption required for driving the liquid pump, as well as assessing the increase in the average temperature of the gas, working fluid, and the walls of the compression chamber. Section 5 and Section 6 – Discussions and Conclusions.
2. Modeling of Hydraulic Hydrogen Compression
The modeling of hydrogen hydraulic compression is a crucial aspect of understanding and optimizing the thermodynamic processes involved in the compression of hydrogen, particularly within a hydraulic compression system [54,55]. Modeling provides valuable insights into the behavior of hydrogen under high-pressure conditions, which is especially important for designing efficient and safe hydrogen storage and transport systems. Hydraulic compression systems are often used to compress hydrogen due to their ability to achieve high pressures while maintaining control over the thermodynamic states of the gas. Accurate modeling of these processes helps engineers and researchers predict how hydrogen will behave during compression, including temperature and pressure changes, heat generation, and heat transfer to the surrounding materials.
One of the key benefits of numerical modeling is that it allows for the simulation of various scenarios, such as different compression speeds, chamber geometries, and fluid properties, without the need for costly and time-consuming physical experiments. This provides a deeper understanding of how the system will respond to changes, enabling better optimization of the compression process. For example, modeling can help determine how much heat is generated during compression and how effectively that heat can be dissipated by the working fluid and cylinder walls. This knowledge is essential for preventing overheating, improving energy efficiency, and ensuring the longevity of the equipment.
Moreover, the ability to simulate the interaction between the gas, the working fluid, and the compression chamber walls gives the ability to evaluate how heat transfer affects the final pressure and temperature of the compressed hydrogen. This is particularly important in non-adiabatic processes where heat is lost to the environment or absorbed by the surrounding materials. By understanding these effects, the system can be fine-tuned to minimize energy losses and reduce the amount of work required to achieve a specific compression ratio.
This section outlines the numerical modeling approach employed to analyze hydrogen compression within a closed compression chamber.
The base model is a closed cylindrical chamber with a height (h) of 145.0 mm and an inner diameter (d) of 100.0 mm, resulting in a total volume (V) of 1.14 liters (Figure 2). The chamber is made of stainless steel, with a wall thickness (dwall) of 5.0 mm, and is divided into an upper section filled with hydrogen and a lower section filled with a working fluid. During the compression process, the working fluid level rises, compressing the hydrogen above it. The numerical model implemented considers heat exchange between the hydrogen gas, the working fluid, and the cylinder walls, as well as convective heat transfer to the surrounding environment.
The purpose of the simulation was to examine the temperature variations of hydrogen, the cylinder walls, and the working fluid, as well as to estimate the actual pressure inside the chamber during the compression process. The pressure increase in the cylinder was modeled as a result of discrete volume changes, achieved by incremental rises in the working fluid level. The model assumed that properties of the gas and fluid are uniformly distributed throughout the compression process, with the time step for discrete volume changes set to Δts = 0.01 s.
The physical properties of hydrogen, the working fluid, and the stainless-steel cylinder used in the model are shown in Table 1, including properties such as molar mass, heat capacity, thermal conductivity, and density. The simulation also accounts for the compressibility of the liquid.
The volume of working fluid VFj in the compression chamber after each step was determined by the expression:
where: V – total volume of the compression chamber;
∆VF – discrete increment in the volume of the working fluid;
j = 1, 2, 3 … n – step number for the discrete increase in the working fluid volume;
n = ts / Δts – total number of steps in one compression stroke.
It should be understood that the gas compression process is accompanied by high heat generation and the high temperature of the compressed gas has an immediate effect on the working fluid. In fact, the fluid and the gas are compressed together, but since the fluid has a higher density and a higher heat capacity, the heat generated during compression is effectively absorbed by the fluid and the surrounding walls of the compression chamber.
The gas was compressed at constant velocity from volume V1 to volume V2 using compression ratio KC=V1/V2 = 5.0.
In the adiabatic case, the ideal gas equation is:
For an adiabatic process:
where γ can be calculated as:
where
P - pressure,
V - volume of chamber,
n - gas quantity (mol),
R = 8.31 J/(mol·K) - universal gas constant,
T - absolute temperature (K),
γ - ratio of the heat capacity at constant pressure (Cp) to heat capacity at constant volume (Cv),
f - degrees of freedom of ideal gas (f = 3 for monoatomic gas, f = 5 for diatomic gas),
t - compression time (s),
v - compression velocity.
In the adiabatic case, if compression is performed from the initial parameters V1, P1 and T1, the final parameters can be calculated using the ideal gas law and the conditions for an adiabatic process:
When heat exchange with the steel cylinder and oil piston is considered, part of the heat is transferred to the oil and steel. Consequently, the final pressure and temperature are lower than in the adiabatic case. The total energy required for compression is also lower than in the adiabatic case due to the reduced final temperature and pressure. Thus, pressure and temperature do not follow the adiabatic law:
This process is implemented in the numerical model as follows:
- The compression is divided into 20 to 100 time steps.
- Within each time step, the process is assumed to be adiabatic.
- The energy added to the gas is introduced as a volumetric heat source.
The instantaneous power density heating the gas is given by:
where:
- is the power,
- represents the rate of work, interpreted here as the instantaneous power,
- is the current volume,
and - are initial pressure and volume, respectively,
- is the adiabatic index (ratio of heat capacities),
- represents the cross-sectional area of the piston,
- is the compression velocity.
3. Numerical Modeling of Hydraulic Compression of Hydrogen in COMSOL
In the context of hydrogen compression, numerical modeling in COMSOL offers several key advantages. It allows for detailed simulations of thermal and fluid behavior, providing valuable insights into the interaction between different materials and physical processes [56,57]. By leveraging its robust numerical solvers and customizable physics modules, COMSOL can accurately model the compression of hydrogen, including heat transfer, pressure distribution, and flow characteristics [58].
The hydrogen compression modeling was carried out using COMSOL Multiphysics® 6.0 software, utilizing the CFD and heat transfer modules to accurately simulate the thermodynamic behavior.
This study uses COMSOL to address critical tasks in hydraulic hydrogen compression, such as predicting temperature distribution, evaluating heat exchange between the gas, fluid, and compression chamber, and estimating energy requirements for various compression ratios. Such simulations are essential for optimizing the design of compression systems, ensuring efficient energy consumption, and improving overall system performance.
The numerical model was constructed under the assumptions that the thermal conductivity of the working fluid is significantly lower than that of hydrogen and that during the filling of the compression chamber with the working fluid, no turbulence or mixing occurs between the media.
The transient heat transfer equation was used in the model to calculate heat transfer processes:
where:
- is thermal conductivity,
- is the specific heat capacity,
- is the velocity vector,
- is the temperature,
- represents the rate of change of temperature over time.
In the numerical model, it is assumed that the compression chamber has an open inlet at the bottom of the steel cylinder, through which the liquid piston rises into the chamber as a column (Figure 3). In the calculations, the height of the liquid column is set as a constant and is equal to 100 mm in the base model.
The form geometry module was used for the gas domain. Mass of the gas was conserved in this domain and heating due to the compression of the gas is introduced as volumetric heat source, which goes into temperature equation. In this model was used prescribed liquid piston motion with constant velocity. To save time of calculation it was not used remesh after every time step but instead was used deforming mesh which means that the same number of cells is conserved but the aspect ratio of the cells changes during the compression process.
An axisymmetric numerical model using a triangular mesh was employed. For accurate calculations of the gas, a relatively coarse mesh is acceptable, however, the boundary layers in the liquid and steel domains require refinement in the steel cylinder chamber, a maximum mesh element size of 2 mm was used, with a maximum growth rate of 1.2. boundary refinement consists of 25 layers, applied with a growth rate of 1.005, to ensure accurate calculation of heat exchange in the contact regions between the oil, hydrogen, and stainless-steel. The complete mesh comprises 20,909 domain elements and 694 boundary elements.
The position of the liquid piston column in the compression chamber filled with hydrogen, during its upward movement over the stroke time of 0, 10, and 20 s, is shown in Figure 4. As seen in the figure, the volume occupied by hydrogen in the compression chamber decreases, causing deformation of the mesh cells in this region. Although the number of domain elements remains constant, their density increases. The qualitative changes in the mesh cells of the numerical model at the interface between the media within the compression chamber, as the hydrogen volume decreases to a compression ratio Kc=5 during a single stroke of 20 seconds, can be seen in Figure 5.
The pressure in the gas domain was considered constant, while the temperature was calculated. A heat source was present throughout the entire volume of the gas due to compression. This heat contributes to both the heating of the gas and the heat exchange between the gas, the steel cylinder, and the working fluid.
The model provides the temperature distribution in each domain, which can then be averaged by calculating the mean temperature for each domain and the total amount of heat transferred to each domain.
The analysis of the numerical modeling results allows for the investigation of the temperature distribution in the gas medium, working fluid, and the walls of the compression chamber. Consequently, this enables the estimation of the energy consumption required to achieve a given pressure increase at a specific compression ratio Kc, depending on the compression speed.
To simplify the calculations, the superposition method was used to describe the processes occurring in the compression chamber. The increase in pressure within the cylinder chamber was modeled as a result of discrete volume changes, accounting for both hydrogen and the working fluid, as well as the corresponding rise in gas temperature.
The time step for each discrete change in the working fluid volume was constant and set at Δts = 0.01 second. Each discrete step increases the fluid height by a specific amount, as described by Eq. 2, determined by the stroke time ts. In this model, it is assumed that, at each time step during the hydraulic compression of hydrogen, the properties of both the working fluid and the gas are uniformly distributed, and their volumes remain unmixed. Heat transfer between the hydrogen, working fluid, and the walls of the stainless-steel cylinder occurs solely through thermal conductivity of the materials involved.
4. Simulation Results of Hydrogen Hydraulic Compression
Based on the model presented in Section 3, the processes occurring during a single compression stroke, with stroke times ts ranging from 0.5 to 20.0 seconds, were simulated. The initial temperature of both the hydrogen and the working fluid was set to 300 K, with a compression ratio Kc = 5.0. Calculations were performed for two scenarios: one at an initial gas pressure P1 = 3.0 and another at P1 = 20.0 MPa.
Figure 5 illustrates the temperature field distributions obtained from the numerical simulations for hydrogen confined within the cylindrical chamber. The figure depicts the temperature evolution of the gas over a 20-second stroke, at time intervals of 0, 10, 15, and 20 seconds. The color scale corresponds to temperature values ranging from 300 K to 550 K, showing how the gas temperature changes due to compression. These results highlight the significant heating effects within the gas as compression progresses, particularly at higher pressures.
Figure 6 presents examples of temperature field distributions obtained from numerical simulations for the cylinder walls. The figure illustrates the changes in wall temperature during a 20-second compression stroke, shown at time intervals of 0, 10, 15, and 20 seconds. The color scale corresponds to temperature values between 300 K and 310 K, demonstrating the relatively minor temperature increase in the cylinder walls compared to the gas, which highlights the effective heat transfer between the gas and the surrounding material during compression.
The use of temperature field distribution in the compression chamber, calculated using the superposition method, is crucial for identifying areas where the thermodynamic processes of hydrogen compression result in maximum heat generation. Understanding the temperature distribution in the cylinder body is particularly important, as it directly informs the design of an efficient cooling system to dissipate heat during the compression process.
Figure 5 and Figure 6 reveal that the upper part of the chamber undergoes the most intense heating during compression. Therefore, to optimize the cooling of hydrogen, it is recommended to design the cylinder body with a closed top, maximizing the surface area exposed to external cooling mechanisms, such as air or liquid cooling. This design approach would enhance the heat removal process and ensure the stability of the compression system.
The results of the compression process simulation allow for estimating the temperature rise in the gas and working fluid, and consequently, determining the energy expended during the hydraulic compression process. In this context, it is important to examine how the compression process is affected by variations in the duration of the compression stroke ts and the initial hydrogen pressures P1. Figure 7, Figure 8 and Figure 9 shows how average temperatures of hydrogen ∆TH, working fluid ∆TF and steel cylinder ∆TC change during a single compression stroke, with stroke times ts ranging from 0.5 to 20.0 seconds, depending on initial pressure P1 = 3.0, 10.0, 15.0 and 20.0 MPa.
The increase in temperature values, previously determined in the model, corresponds to the energy involved in the process of hydraulic compression of hydrogen and accumulated in hydrogen volume, working fluid and cylinder body. The amount of energy stored in the compressed hydrogen, the working fluid, and the stainless-steel walls of the cylinder is determined using an equation based on the laws of thermodynamics:
where:
m –mass, kg;
c – specific heat capacity, J/(Kg*K);
∆T – the total temperature increase in the medium at the end of the compression stroke, K.
The heat capacity values for hydrogen, the working fluid, and the stainless-steel cylinder were provided in Table 1. The model accounts for the change in hydrogen mass as the initial pressure increases.
The distribution of total energy QT between working fluid, hydrogen and stainless-steel cylinder body is shown for different durations of the compression stroke ts. The initial hydrogen pressures are P1 = 3.0 and 20.0 MPa, compression ratio set to Kc= 5.0. It can be noted that with raising inlet pressure up to 20.0 MPa most of the energy is concentrated in hydrogen as its mass increases with increasing pressure.
The modelling of the compression process with the use of a superposition method allows to represent temperature and volumes of energy separately for each medium. Thus, the distribution of the amount of energy QT, which is spent for compression process without taking into account losses on convection, between working fluid, hydrogen and steel of cylinder body depending on duration of compression cycle ts can be presented in the form of a graph shown in Figure 10 and Figure 11. The structure of energy distribution for initial pressures P1 = 3.0 and 20.0 MPa and the compression ratio Kc= 5.0 shows that most of the energy is concentrated in hydrogen.
In real conditions, hydrogen and working fluid inside the cylinder are constantly being mixed and exchanging energy. In this case, it is fair to assume that once hydrogen and working fluid are mixed, the temperature of the medium inside the compression chamber averages out, cooling the gas and increasing the temperature of the working fluid.
To compare different compression scenarios, including stroke duration, initial pressure and cylinder geometry, overall temperature of the system ∆TO, equivalent to the energy consumed for hydrogen compression, is employed. The overall temperature ∆TO is defined as:
where QF, mF, cF; QH, mH, cH; QC, mC, cC – the energy, mass, and heat capacity of the work fluid, compressed hydrogen and cylinder steel respectively.
The changes of the ∆TO for the different durations of compression stroke ts at initial pressures P1 = 3.0, 10.0, 15.0 and 20.0 MPa and compression ratio Kc = 5.0 are shown in Figure 12. As the pressure in the compression chamber increases, the ∆TO increases proportionally, as can be seen by comparing the curves for an initial pressure from 3.0 MPa to 20.0 MPa. The temperature ∆TO inside the compression chamber slightly increases with increasing compression stroke duration and mainly depends on the initial pressure.
However, for the considered compression pressures overall temperature value is within the range of less than 15.0 K. This means that the temperature conditions inside the compression chamber should not exceed the temperature limits defined as a rated values for the working fluid.
It is reasonable to assume that the actual hydrogen pressure will be 5 to 10 % higher than obtained by Eq.2. Bearing in mind the uncertainty of the mixing of liquid and gas inside the compression chamber, the instantaneous temperature of hydrogen and the corresponding pressure can have much higher values at the moment of the compression. Therefore, in order to handle the compression process and control the pressure rise, intensive cooling is required at the top of the cylinder, as this is where the maximum rise in hydrogen temperature is observed, as can be seen from Figure 6.
Analysis of the energy required to perform a hydrogen compression stroke with a given compression ratio makes it possible to estimate the power of the liquid pump drive motor required to perform this work in a given time. As a first approximation, the value of this power can be determined from:
The curves of total power W for the examined models are presented in Figure 13, where power is calculated as a function of duration of compression stroke ts, at initial pressures P1 = 3.0, 10.0, 15.0 and 20.0 MPa and the compression ratio Kc = 5.0.
The Figure 13 illustrates the relationship between the power required for compression and the duration of the compression stroke for four different initial hydrogen pressures. As the duration of the compression stroke increases, the power required for compression decreases significantly across all pressure levels. This indicates that longer compression strokes distribute the work over a longer period, resulting in a reduction in the instantaneous power demand. At any given duration, the power required is higher for higher initial hydrogen pressures. For example, at the shortest duration, 20.0 MPa requires significantly more power than 3.0 MPa, highlighting the increased energy demand at higher pressures. The power drop is most notable in the shorter stroke durations, after which the reduction in power becomes more gradual. Extending the compression stroke duration can be a viable strategy to minimize power consumption, especially at higher pressures, although excessive stroke lengths may reduce system efficiency in certain operational scenarios.
5. Discussion
The numerical simulations of hydraulic hydrogen compression presented in this study have provided valuable insights into the thermodynamic processes occurring during compression. The results highlight key areas where optimization can be achieved, particularly concerning temperature management, energy consumption, and system efficiency.
One of the most significant findings is the temperature distribution within the compression chamber, particularly in the upper part, where the most intense heating occurs. The numerical model demonstrates that this region requires efficient cooling to prevent overheating of the hydrogen and cylinder walls. By designing the chamber with a closed top and enhancing the surface area exposed to external cooling mechanisms, such as air or liquid cooling, the thermal management of the system can be significantly improved. This design consideration is crucial, as elevated temperatures can adversely affect system performance, leading to increased energy consumption and wear on components.
The temperature variation in the hydrogen gas during compression highlights the importance of considering both heat transfer to the surrounding materials and the specific heat capacity of the working fluid. The working fluid's higher heat capacity and density allow it to absorb a significant portion of the heat generated during compression, moderating the temperature rise within the gas. This behavior is essential for maintaining stable operation under high-pressure conditions and optimizing energy efficiency.
The simulation results also demonstrate that increasing the initial pressure of hydrogen leads to a higher temperature within the chamber and a greater amount of energy required for compression. This is particularly evident when comparing the compression scenarios at 3.0 MPa and 20.0 MPa. As the pressure increases, a larger fraction of the energy is stored in the hydrogen gas, which directly affects the overall energy consumption of the system.
In terms of system design, the study suggests that the duration of the compression stroke plays a significant role in determining both the energy requirements and the power needed for the liquid pump drive motor. Longer stroke durations result in slightly lower instantaneous power demands, though total energy consumption remains similar or may increase slightly due to extended operational time. This finding indicates that increasing the compression stroke duration could lead to a more efficient system by reducing the rated power of the pump, ultimately minimizing both the size and cost of the equipment.
The use of the superposition method in the modeling process proved to be an effective way of simplifying the calculations while maintaining accuracy in predicting temperature and energy distributions within the system. This approach provides a clear understanding of how the different components—the hydrogen gas, working fluid, and cylinder walls—interact thermodynamically during compression. By fine-tuning these interactions, it is possible to further enhance the overall efficiency of the hydrogen compression system.
This study provides a comprehensive analysis of hydraulic hydrogen compression using numerical simulations. The insights gained from these simulations will contribute to the development of more efficient hydrogen compression systems, particularly in refueling station applications where energy consumption and thermal management are critical factors. Future research should focus on further optimizing cooling mechanisms and exploring alternative working fluids with improved thermal properties to enhance the overall system performance.
6. Conclusions
This study provides an in-depth analysis of the thermodynamic processes involved in hydraulic hydrogen compression using numerical simulations developed in COMSOL Multiphysics®. The findings reveal important insights that can be leveraged to optimize the design, efficiency, and energy consumption of hydraulic hydrogen compression systems, particularly in high-pressure applications such as refueling stations.
The simulations demonstrate that temperature distribution is a critical factor in system performance, with the upper part of the compression chamber experiencing the most significant heating. Effective thermal management in this region, especially through optimized cooling systems, is essential to prevent overheating and ensure stable operation. By designing the compression chamber with a closed top and increasing the surface area for external cooling, the thermal loads on the system can be efficiently managed, improving the overall performance of the compression process.
The study also highlights the role of compression stroke duration in determining both energy consumption and power requirements. Longer compression strokes result in lower power demands for the liquid pump drive motor, even though total energy consumption may remain similar or rise slightly. This finding suggests that by increasing the stroke duration, the size and cost of the pump motor can be reduced, making the system more energy-efficient and cost-effective. The trade-off between energy consumption and power requirements is crucial for optimizing the system for real-world applications.
Additionally, the results show how total energy is distributed between the compressed hydrogen, the working fluid, and the cylinder walls. At higher initial pressures, a larger portion of energy is stored within the hydrogen, which has important implications for both system design and energy management. Understanding how this energy is distributed allows for more accurate predictions of the system's performance and provides the necessary information for optimizing cooling strategies and improving overall efficiency.
The use of the superposition method in the numerical model enabled the simulation of heat transfer and thermodynamic interactions between the hydrogen, working fluid, and cylinder walls with greater simplicity and precision. This approach is particularly valuable for evaluating the effects of different compression chamber geometries, fluid properties, and compression rates on the system's thermodynamic behavior.
This study offers valuable insights into the design and optimization of hydraulic hydrogen compression systems. The numerical simulations provide a clear understanding of temperature dynamics, energy distribution, and power requirements, which are essential for improving the efficiency and reliability of these systems.
Author Contributions
Conceptualization, V.B. and Vl.B.; methodology, V.B., D.B, I.K.; software, I.K.; validation, V.B., Vl.B. and M.K.; formal analysis, V.B.; investigation, V.B.; resources, M.K.; data curation, A.I.P.; writing—original draft preparation, M.K.; writing—review and editing, M.K., A.I.P.; visualization, M.K, D.B.; supervision, V.B.; project administration, Vl.B.; funding acquisition, V.B. All authors have read and agreed to the published version of the manuscript.
Funding
The research has been financed by ERDF project “Experimental Studies and Development of Technology on Hydraulic Compression of Hydrogen” No 1.1.1.1/20/A/185, being implemented at Ventspils University of Applied Sciences.
Institutional Review Board Statement
Not applicable.
Informed Consent Statement
Not applicable.
Data Availability Statement
In order to obtain access to more information about the model used in this research, the reader can contact the corresponding author.
Acknowledgments
This research has been supported by the HORIZON Coordination and Support Action project MarTe: Marine Technology Excellence Hub for Sustainable Blue Economy in the Baltics, project ID: 101186498. We extend our sincere gratitude to the Process Analysis and Research Centre (PAIC) Ltd for their invaluable assistance with COMSOL modeling.
Conflicts of Interest
The authors declare no conflicts of interest.
References
- Hoffmann, P. (2012). Tomorrow's Energy, revised and expanded edition: Hydrogen, Fuel Cells, and the Prospects for a Cleaner Planet. MIT press.
- Lah, O. (2017). Decarbonizing the transportation sector: policy options, synergies, and institutions to deliver on a low-carbon stabilization pathway. Wiley Interdisciplinary Reviews: Energy and Environment, 6(6), e257.
- Hassanpouryouzband, A., Wilkinson, M., & Haszeldine, R. S. (2024). Hydrogen energy futures–foraging or farming?. Chemical Society Reviews.
- European Commission (2020): Communication from the Commission to the European Parliament, the Council, the Eu-ropean economic and social committee and the committee of the regions. A hydrogen strategy for a climate-neutral Europe. Brussels, 8.7.2020. COM (2020) 301 final.
- Reda, B., Elzamar, A. A., AlFazzani, S., & Ezzat, S. M. (2024). Green hydrogen as a source of renewable energy: a step towards sustainability, an overview. Environment, Development and Sustainability, 1-21. [CrossRef]
- Osman, A. I., Mehta, N., Elgarahy, A. M., Hefny, M., Al-Hinai, A., Al-Muhtaseb, A. A. H., & Rooney, D. W. (2022). Hydrogen production, storage, utilisation and environmental impacts: a review. Environmental Chemistry Letters, 1-36.
- Singla, M. K., Nijhawan, P., & Oberoi, A. S. (2021). Hydrogen fuel and fuel cell technology for cleaner future: a review. Environmental Science and Pollution Research, 28(13), 15607-15626. [CrossRef]
- Zhang, D., Jiang, M., Li, G., & Tang, Y. (2024). An advanced bibliometric analysis and future research insights on safety of hydrogen energy. Journal of Energy Storage, 77, 109833. [CrossRef]
- Cui, G., Li, Y., Wu, D., Li, H., Liu, H., Xing, X., & Liu, J. (2024). The Progress of Autoignition of High-Pressure Hydrogen Gas Leakage: A Comprehensive Review. Fire, 7(8), 268. [CrossRef]
- Sattar, M. A., Rasul, M. G., Jahirul, M. I., & Hasan, M. M. (2024). An up-to-date review on the progress and challenges of hydrogen storage, and its safety and economic analysis. Sustainable Energy & Fuels. [CrossRef]
- Qureshi, F., Yusuf, M., Khan, M. A., Ibrahim, H., Ekeoma, B. C., Kamyab, H., ... & Chelliapan, S. (2023). A State-of-The-Art Review on the Latest trends in Hydrogen production, storage, and transportation techniques. Fuel, 340, 127574. [CrossRef]
- Widera, B. (2020). Renewable hydrogen implementations for combined energy storage, transportation and stationary applications. Thermal Science and Engineering Progress, 16, 100460. [CrossRef]
- Züttel, A. (2003). Materials for hydrogen storage. Materials today, 6(9), 24-33.
- Ali, M. S., Khan, M. S. H., Tuhin, R. A., Kabir, M. A., Azad, A. K., & Farrok, O. (2024). Hydrogen energy storage and transportation challenges: A review of recent advances. Hydrogen Energy Conversion and Management, 255-287.
- Kamran, M., & Turzyński, M. (2024). Exploring hydrogen energy systems: A comprehensive review of technologies, ap-plications, prevailing trends, and associated challenges. Journal of Energy Storage, 96, 112601. [CrossRef]
- Le, T. T., Sharma, P., Bora, B. J., Tran, V. D., Truong, T. H., Le, H. C., & Nguyen, P. Q. P. (2024). Fueling the future: A comprehensive review of hydrogen energy systems and their challenges. International Journal of Hydrogen Energy, 54, 791-816. [CrossRef]
- Halder, P., Babaie, M., Salek, F., Haque, N., Savage, R., Stevanovic, S., ... & Zare, A. (2024). Advancements in hydrogen production, storage, distribution and refuelling for a sustainable transport sector: Hydrogen fuel cell vehicles. International Journal of Hydrogen Energy, 52, 973-1004. [CrossRef]
- Hassan, Q., Azzawi, I. D., Sameen, A. Z., & Salman, H. M. (2023). Hydrogen fuel cell vehicles: Opportunities and challenges. Sustainability, 15(15), 11501. [CrossRef]
- Soleimani, A., Hosseini Dolatabadi, S. H., Heidari, M., Pinnarelli, A., Mehdizadeh Khorrami, B., Luo, Y., ... & Brusco, G. (2024). Progress in hydrogen fuel cell vehicles and up-and-coming technologies for eco-friendly transportation: an inter-national assessment. Multiscale and Multidisciplinary Modeling, Experiments and Design, 1-20.
- Thomas, C. E. (2009). Fuel cell and battery electric vehicles compared. international journal of hydrogen energy, 34(15), 6005-6020. [CrossRef]
- Ziyu, L., & Yan, W. (2024). Hydrogen Refueling Station Siting and Development Planning in the Delivery Industry. In Resilient and Adaptive Tokyo: Towards Sustainable Urbanization in Perspective of Food-energy-water Nexus (pp. 231-251). Singapore: Springer Nature Singapore.
- Bhogilla, S. S., & Niyas, H. (2019). Design of a hydrogen compressor for hydrogen fueling stations. International Journal of Hydrogen Energy, 44(55), 29329-29337. [CrossRef]
- Lundblad, T., Taljegard, M., & Johnsson, F. (2023). Centralized and decentralized electrolysis-based hydrogen supply systems for road transportation–A modeling study of current and future costs. International Journal of Hydrogen Energy, 48(12), 4830-4844. [CrossRef]
- Lahnaoui, A., Wulf, C., Heinrichs, H., & Dalmazzone, D. (2018). Optimizing hydrogen transportation system for mobility by minimizing the cost of transportation via compressed gas truck in North Rhine-Westphalia. Applied energy, 223, 317-328. [CrossRef]
- Pandey, A. P. (2024). Recent Progress and Challenges in Hydrogen Storage Medium and Transportation for Boosting Hydrogen Economy Anant Prakash Pandey, Vijay K. Singh, and Ambesh Dixit. Energy Materials and Devices: Proceedings of E-MAD 2022, 183.
- Bezrukovs, V., Bezrukovs, V., Konuhova, M., Bezrukovs, D., Kaldre, I., & Berzins, A. (2023). R&D of a Hydraulic Hydrogen Compression System for Refuelling Stations. Latvian Journal of Physics and Technical Sciences, 60(4), 21-39. [CrossRef]
- Yu, M., Wang, K., & Vredenburg, H. (2021). Insights into low-carbon hydrogen production methods: Green, blue and aqua hydrogen. International Journal of Hydrogen Energy, 46(41), 21261-21273. [CrossRef]
- Ma, N., Zhao, W., Wang, W., Li, X., & Zhou, H. (2024). Large scale of green hydrogen storage: Opportunities and challenges. International Journal of Hydrogen Energy, 50, 379-396. [CrossRef]
- Kourougianni, F., Arsalis, A., Olympios, A. V., Yiasoumas, G., Konstantinou, C., Papanastasiou, P., & Georghiou, G. E. (2024). A comprehensive review of green hydrogen energy systems. Renewable Energy, 120911. [CrossRef]
- Sebbagh, T., Şahin, M. E., & Beldjaatit, C. (2024). Green hydrogen revolution for a sustainable energy future. Clean Technologies and Environmental Policy, 1-24. [CrossRef]
- Wang, T., Cao, X., & Jiao, L. (2022). PEM water electrolysis for hydrogen production: fundamentals, advances, and pro-spects. Carbon Neutrality, 1(1), 21. [CrossRef]
- Sdanghi, G., Maranzana, G., Celzard, A., & Fierro, V. (2019). Review of the current technologies and performances of hydrogen compression for stationary and automotive applications. Renewable and Sustainable Energy Reviews, 102, 150-170. [CrossRef]
- Jia, G., Cai, M., Xu, W., & Shi, Y. (2018). Energy conversion characteristics of reciprocating piston quasi-isothermal com-pression systems using water sprays. Science China Technological Sciences, 61, 285-298.
- Specklin, M., Deligant, M., Sapin, P., Solis, M., Wagner, M., Markides, C. N., & Bakir, F. (2022). Numerical study of a liquid-piston compressor system for hydrogen applications. Applied Thermal Engineering, 216, 118946. [CrossRef]
- Platzer, M.F., Sarigul-Klijn, N. (2021). Hydrogen Compression Technology. In: The Green Energy Ship Concept. Spring-erBriefs in Applied Sciences and Technology. Springer, Cham.
- Bezrukovs, V., Bezrukovs, V., Konuhova, M., Bezrukovs, D., & Berzins, A. (2022). Hydrogen hydraulic compression system for refuelling stations. Latvian Journal of Physics and Technical Sciences, 59(s3), 96-105. [CrossRef]
- Van de Ven, J. D., & Li, P. Y. (2009). Liquid piston gas compression. Applied Energy, 86(10), 2183-2191.
- Franco, A., & Giovannini, C. (2024). Hydrogen Gas Compression for Efficient Storage: Balancing Energy and Increasing Density. Hydrogen, 5(2), 293-311. [CrossRef]
- Specklina, M., Deliganta, M., Sapinb, P., Solisa, M., Wagnerc, M., Markidesb, C. N., & Bakira, F. CFD study of a liquid-piston compressor system for hydrogen applications.
- Zhou, H., Ooi, K. T., Dong, P., Yang, Z., Zhou, S., & Zhao, S. (2023). Dynamic and energy analysis of a liquid piston hydrogen compressor. International Journal of Hydrogen Energy, 48(54), 20694-20704. [CrossRef]
- Huynh, V. T., & Kim, D. (2024). Numerical investigations of heat transfer enhancement in ionic liquid-piston compressor using cooling pipes. Journal of Visualization, 1-23. [CrossRef]
- Patil, V. C., Liu, J., & Ro, P. I. (2020). Efficiency improvement of liquid piston compressor using metal wire mesh for near-isothermal compressed air energy storage application. Journal of Energy Storage, 28, 101226. [CrossRef]
- Kermani, N. A., & Rokni, M. (2014). Heat Analysis of Liquid piston Compressor for Hydrogen Applications. In 20th World Hydrogen Energy Conference 2014. [CrossRef]
- Gouda, E. M., Fan, Y., Benaouicha, M., Neu, T., & Luo, L. (2021). Review on Liquid Piston technology for compressed air energy storage. Journal of Energy Storage, 43, 103111. [CrossRef]
- Kermani, N. A., & Rokni, M. (2015). Heat transfer analysis of liquid piston compressor for hydrogen applications. Inter-national journal of hydrogen energy, 40(35), 11522-11529. [CrossRef]
- Patil, V. C., Acharya, P., & Ro, P. I. (2019). Experimental investigation of heat transfer in liquid piston compressor. Applied Thermal Engineering, 146, 169-179. [CrossRef]
- Rouhi, S., Xiros, N., Sadeqi, S., Ioup, J., Sultan, C., & Van Zwieten, J. (2021, April). CFD validation of the thermodynamic model of a compressed gaseous hydrogen storage tank. In 5-6th Thermal and Fluids Engineering Conference (TFEC).
- Rouhi, S., Sadeqi, S., Xiros, N., & Ioup, J. (2020, January). CFD analysis of filling process for a hydrogen energy storage system. In 5th Thermal and Fluids Engineering Conference (TFEC).
- Wieberdink, J., Li, P. Y., Simon, T. W., & Van de Ven, J. D. (2018). Effects of porous media insert on the efficiency and power density of a high pressure (210 bar) liquid piston air compressor/expander–An experimental study. Applied energy, 212, 1025-1037. [CrossRef]
- Zhou, H., Dong, P., Zhao, S., Geng, M., Guo, Y., & Wang, Y. (2022). Interrupted plate porous media design for ionic liquid-type liquid piston hydrogen compressor and analysis of the effect on compression efficiency. Journal of Energy Storage, 51, 104410. [CrossRef]
- Bezrukovs, V., Bezrukovs, Vl., Bezrukovs, D., Orlova, S., Konuhova, M., Berzins, A., ...& Pranskus P. (2021). Hydrogen Hydraulic Compression Device. WO2023017306, 16.03.2023.
- Bezrukovs, V., Bezrukovs, Vl., Bezrukovs, D., Konuhova, M., & Berzins, A. (2024): for hydraulic compression of hydrogen with limited foam formation in the working fluid. LV15782, 20.04.2024.
- Bezrukovs, V., Bezrukovs, Vl., Bezrukovs, D., Konuhova, M., & Berzins, A. (2024): Hydrogen hydraulic compression device. European Patent Application No. EP4352368A1, 2024-04-17.
- Kang, X., Gao, X., Liu, Z., Cai, L., & Li, Y. (2023). Modeling and development of a liquid piston hydrogen compressor with a double buffer structure: A new insight. International Journal of Hydrogen Energy, 48(33), 12410-12423. [CrossRef]
- Ye, J., Du, Z., Xie, J., Yin, X., Peng, W., & Yan, Z. (2023). Transient flow performance and heat transfer characteristic in the cylinder of hydraulic driving piston hydrogen compressor during compression stroke. International Journal of Hydrogen Energy, 48(19), 7072-7084. [CrossRef]
- Gkanas, E. I., Makridis, S. S., & Stubos, A. K. Three–Stage Hydrogen Compression System. Simulating Study with Comsol Multiphysics.
- Chabane, D., Serairi, L., Iqbal, M., Djerdir, A., Fenineche, N., & Elkedim, O. (2022). Innovative method to estimate state of charge of the hydride hydrogen tank: application of fuel cell electric vehicles. International Journal of Modelling and Simulation, 42(2), 305-318. [CrossRef]
- Tabatabaian, M. (2015). CFD module. Mercury Learning and Information. Science British Columbia Institute of Technology. 150 pages.
Figure 1.
Schematic diagram of the delivery, storage and preparation of compressed high-pressure hydrogen for use at refuelling stations.
Figure 1.
Schematic diagram of the delivery, storage and preparation of compressed high-pressure hydrogen for use at refuelling stations.
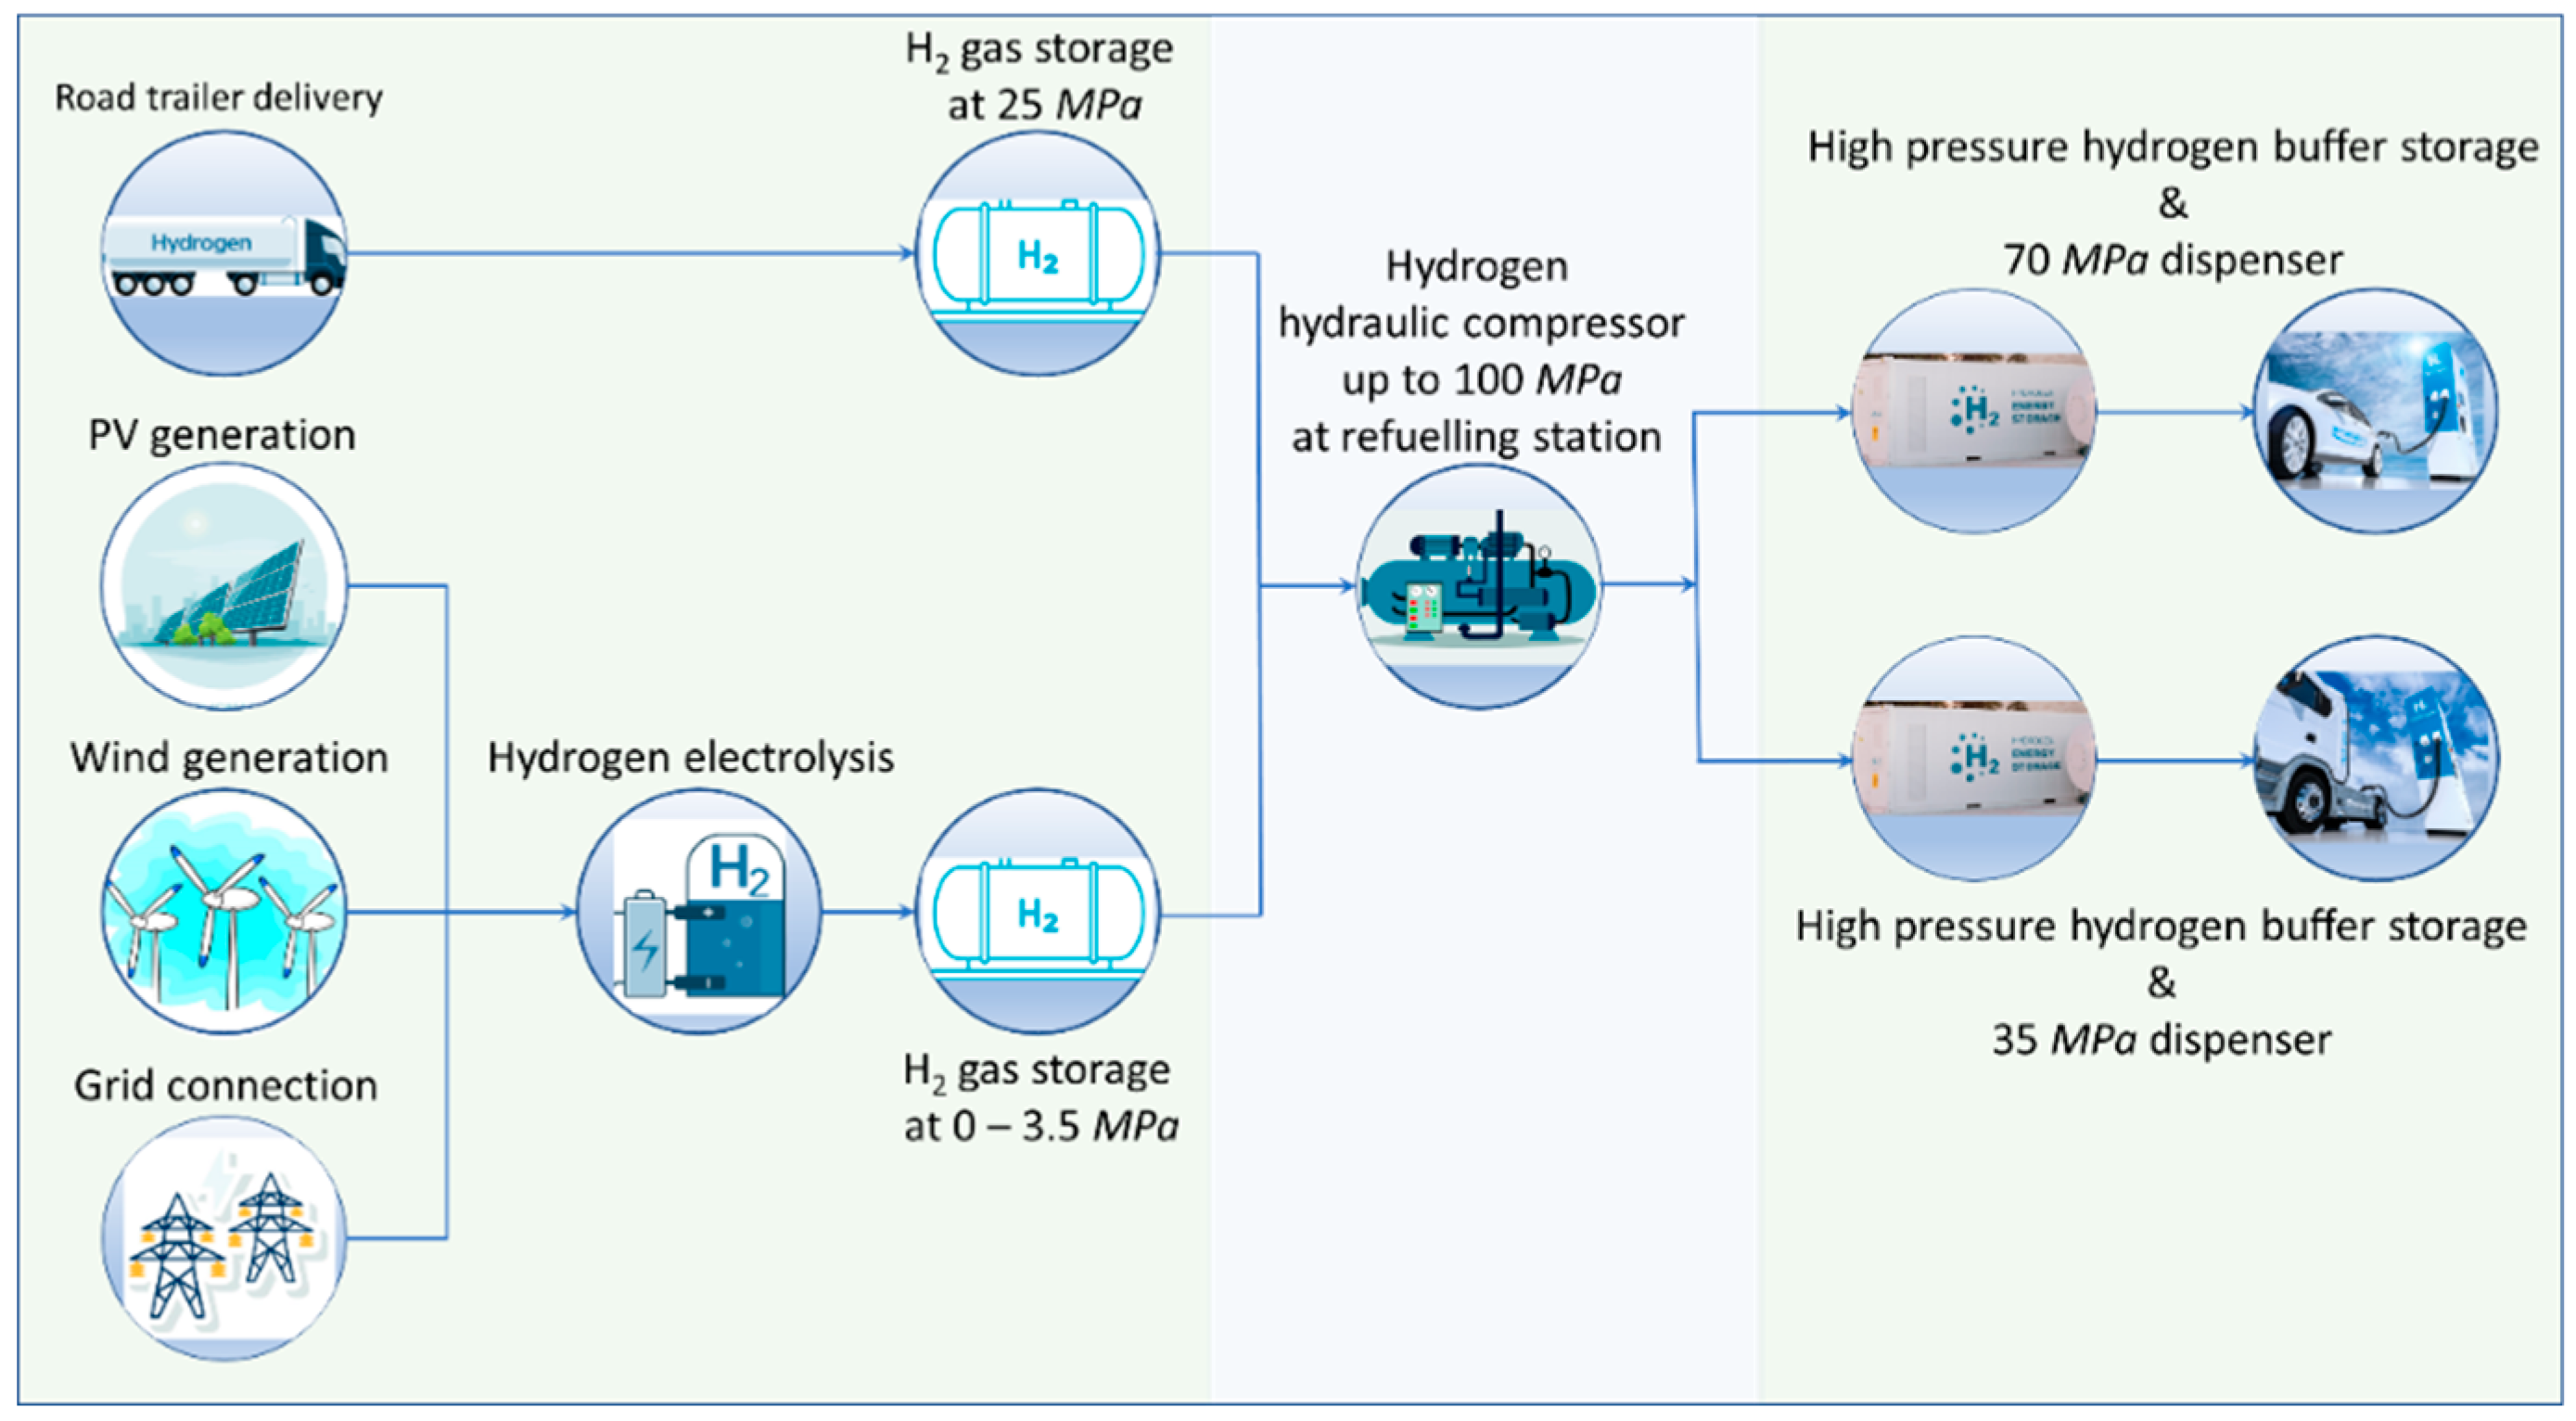
Figure 2.
A model of a steel cylinder shaped chamber where hydrogen is compressed by the working fluid coming from bottom in the direction of the arrow.
Figure 2.
A model of a steel cylinder shaped chamber where hydrogen is compressed by the working fluid coming from bottom in the direction of the arrow.
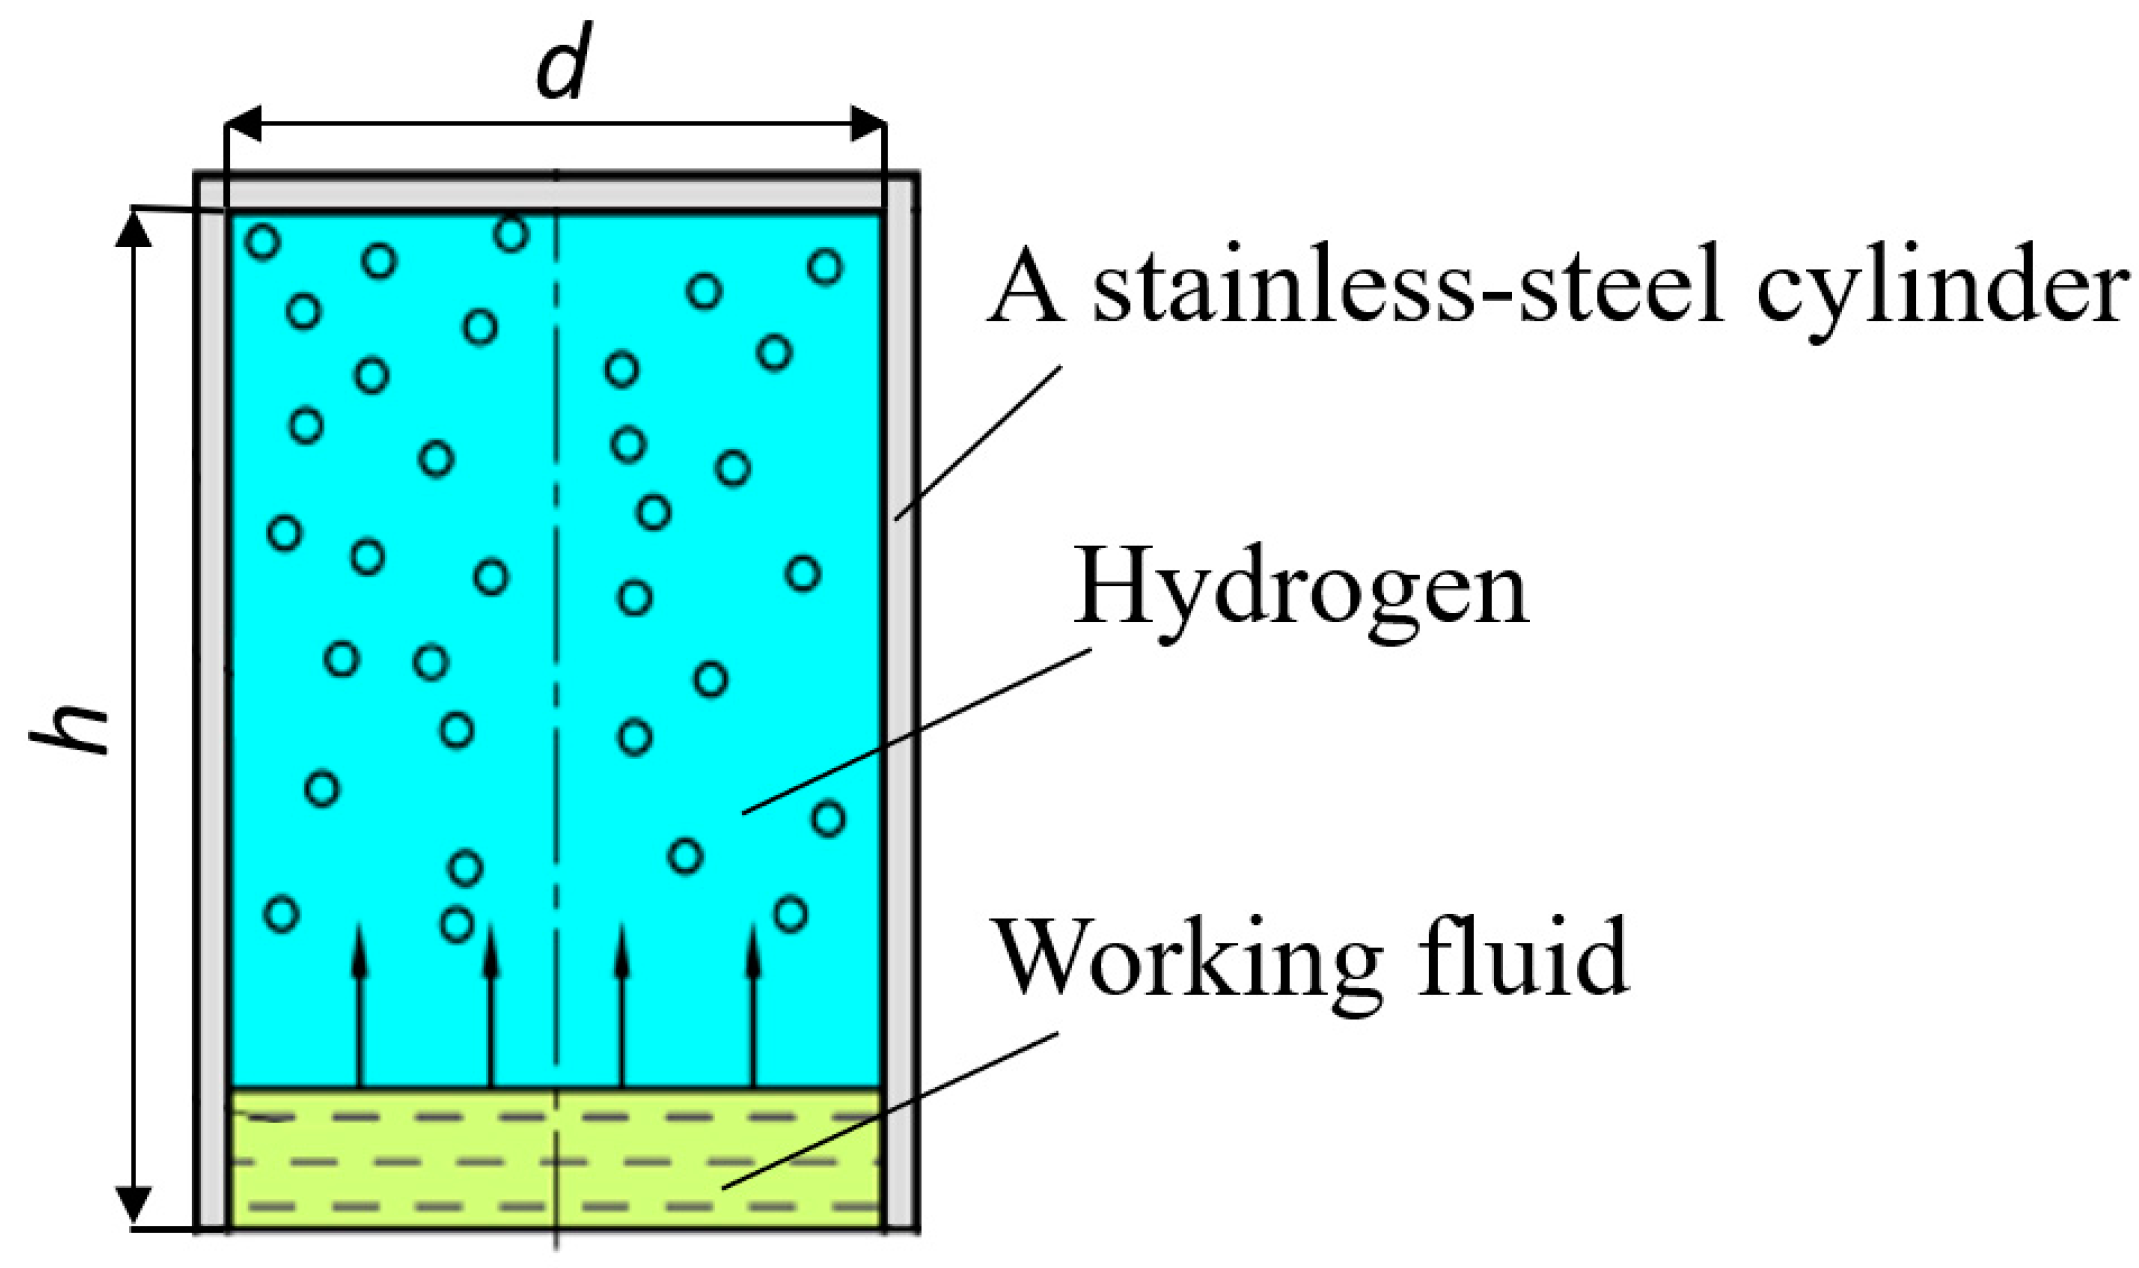
Figure 3.
Model of a stainless-steel cylinder chamber for hydrogen compression via fluid injection.
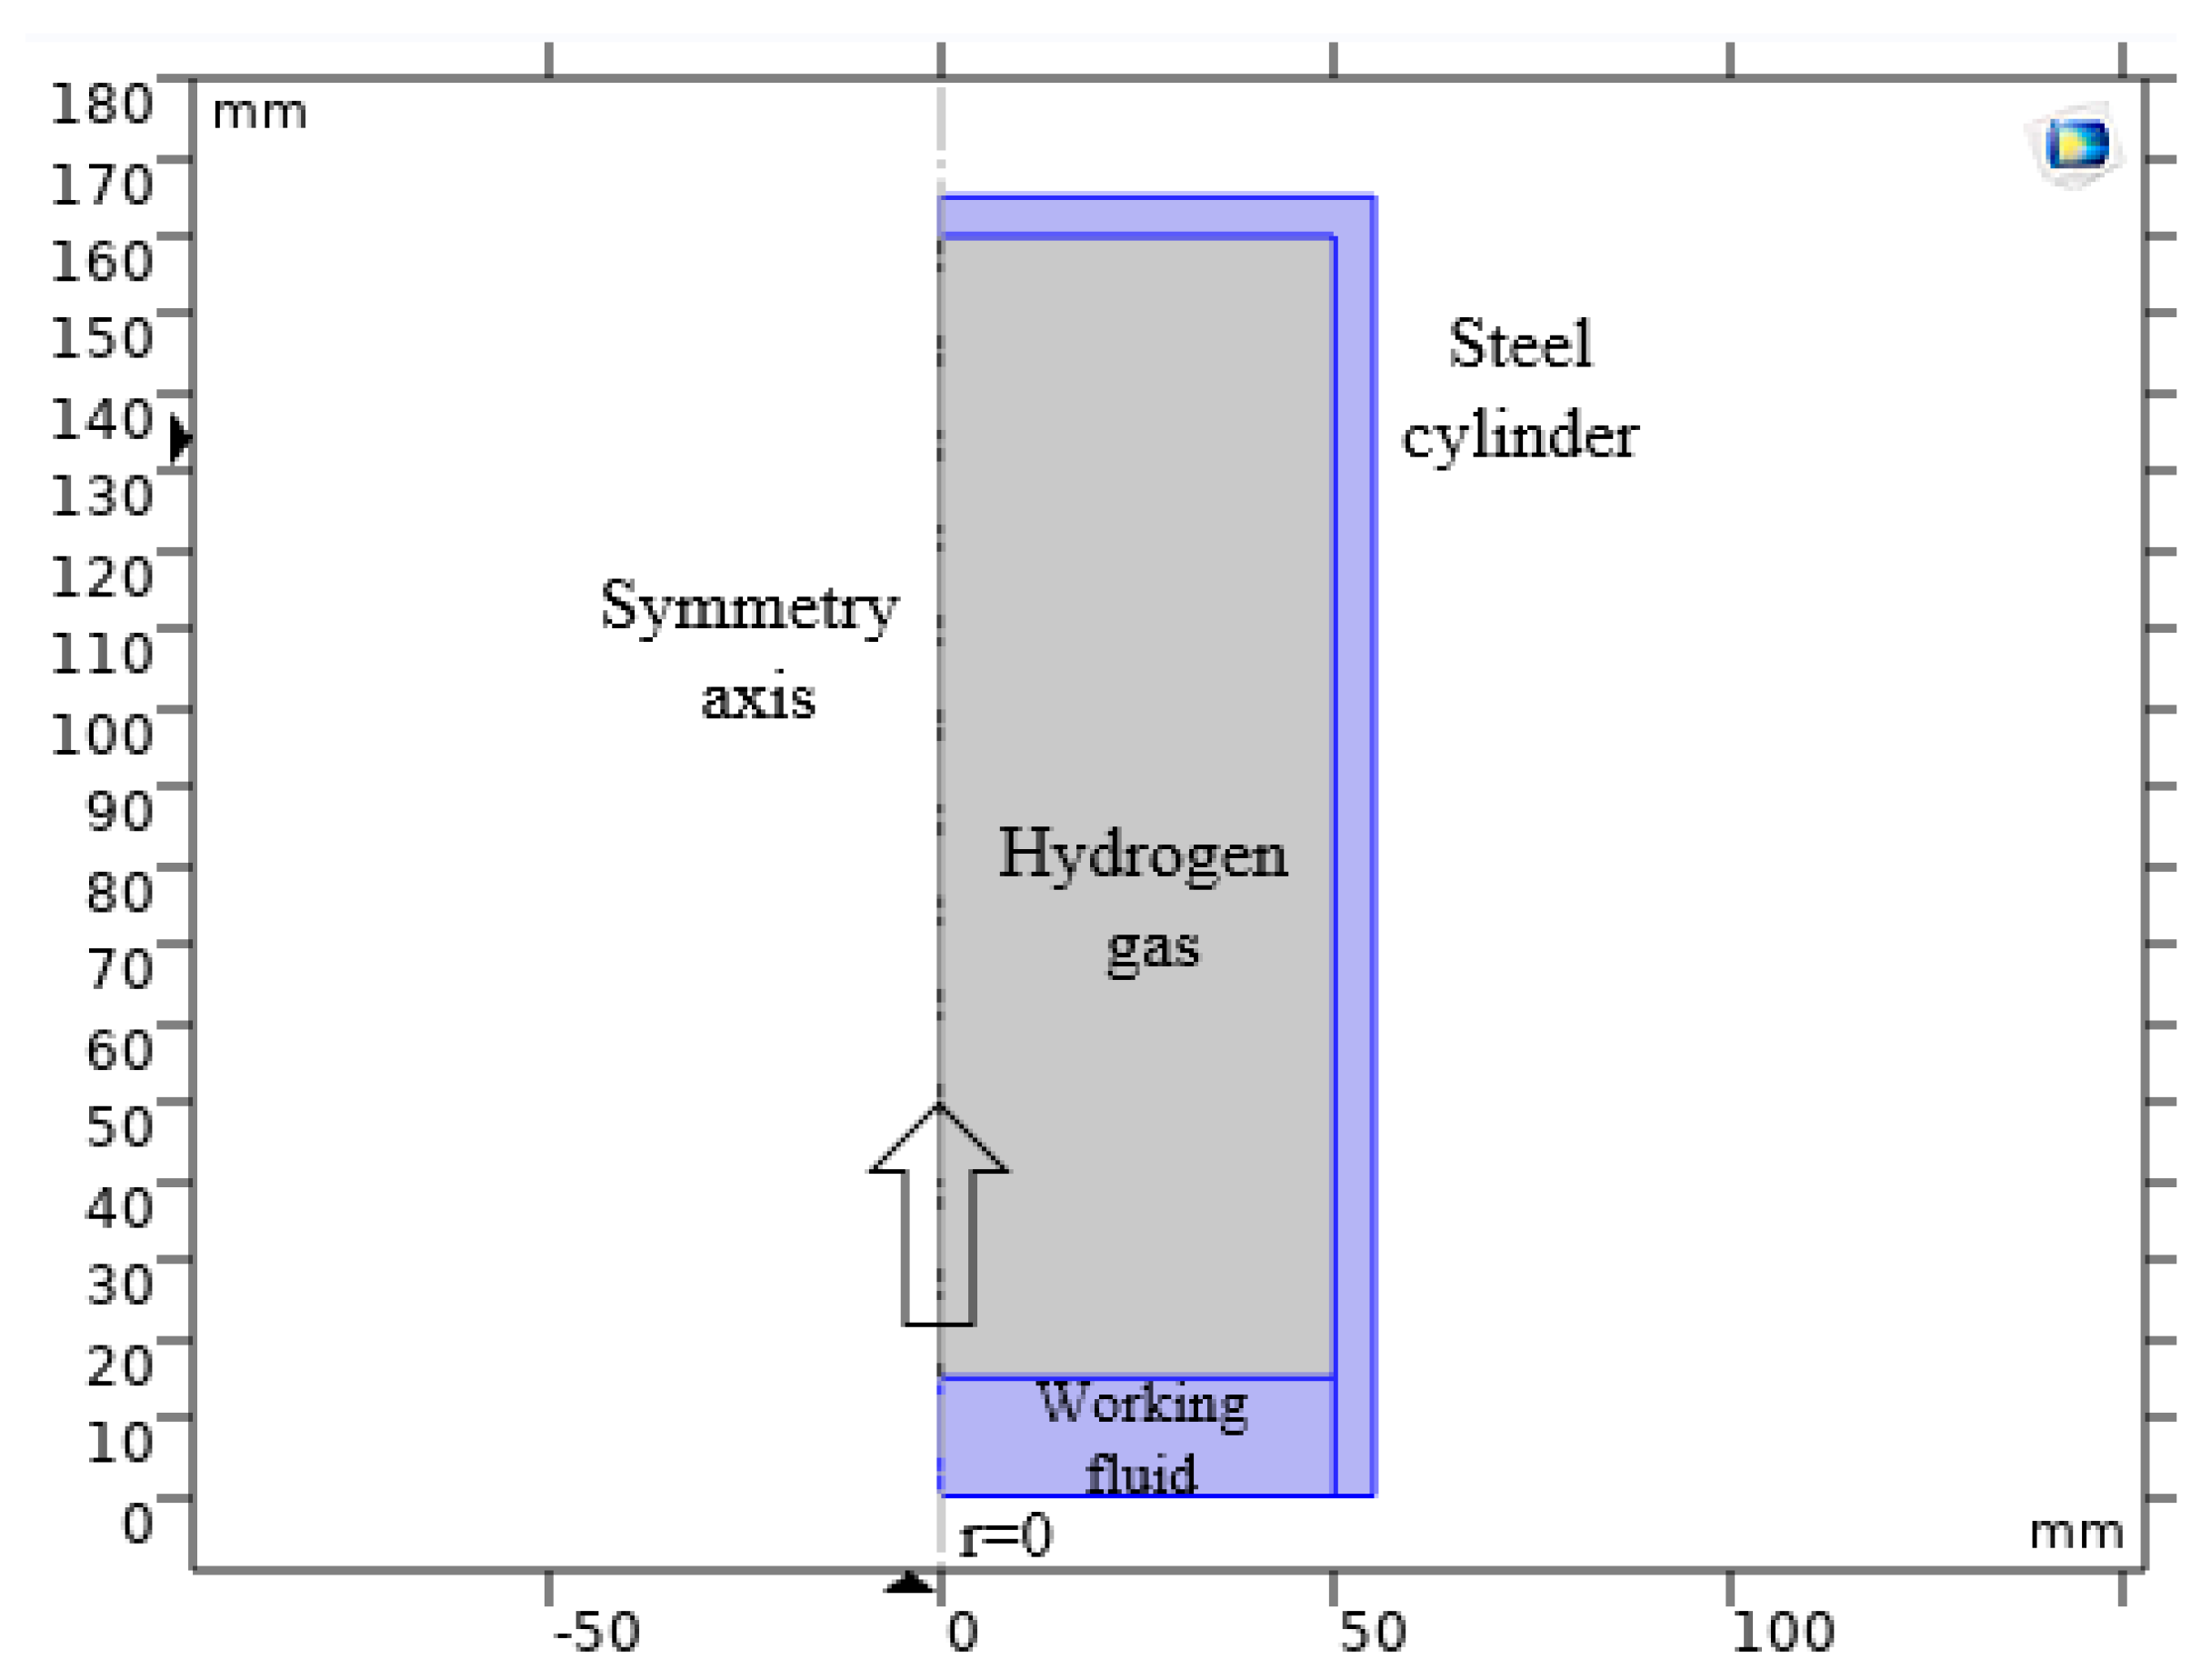
Figure 4.
Mesh cell distribution in the numerical model during the change in hydrogen volume within the compression chamber, and the position of the liquid piston column as it moves upward at times 0, 10, and 20 seconds over a single stroke period.
Figure 4.
Mesh cell distribution in the numerical model during the change in hydrogen volume within the compression chamber, and the position of the liquid piston column as it moves upward at times 0, 10, and 20 seconds over a single stroke period.
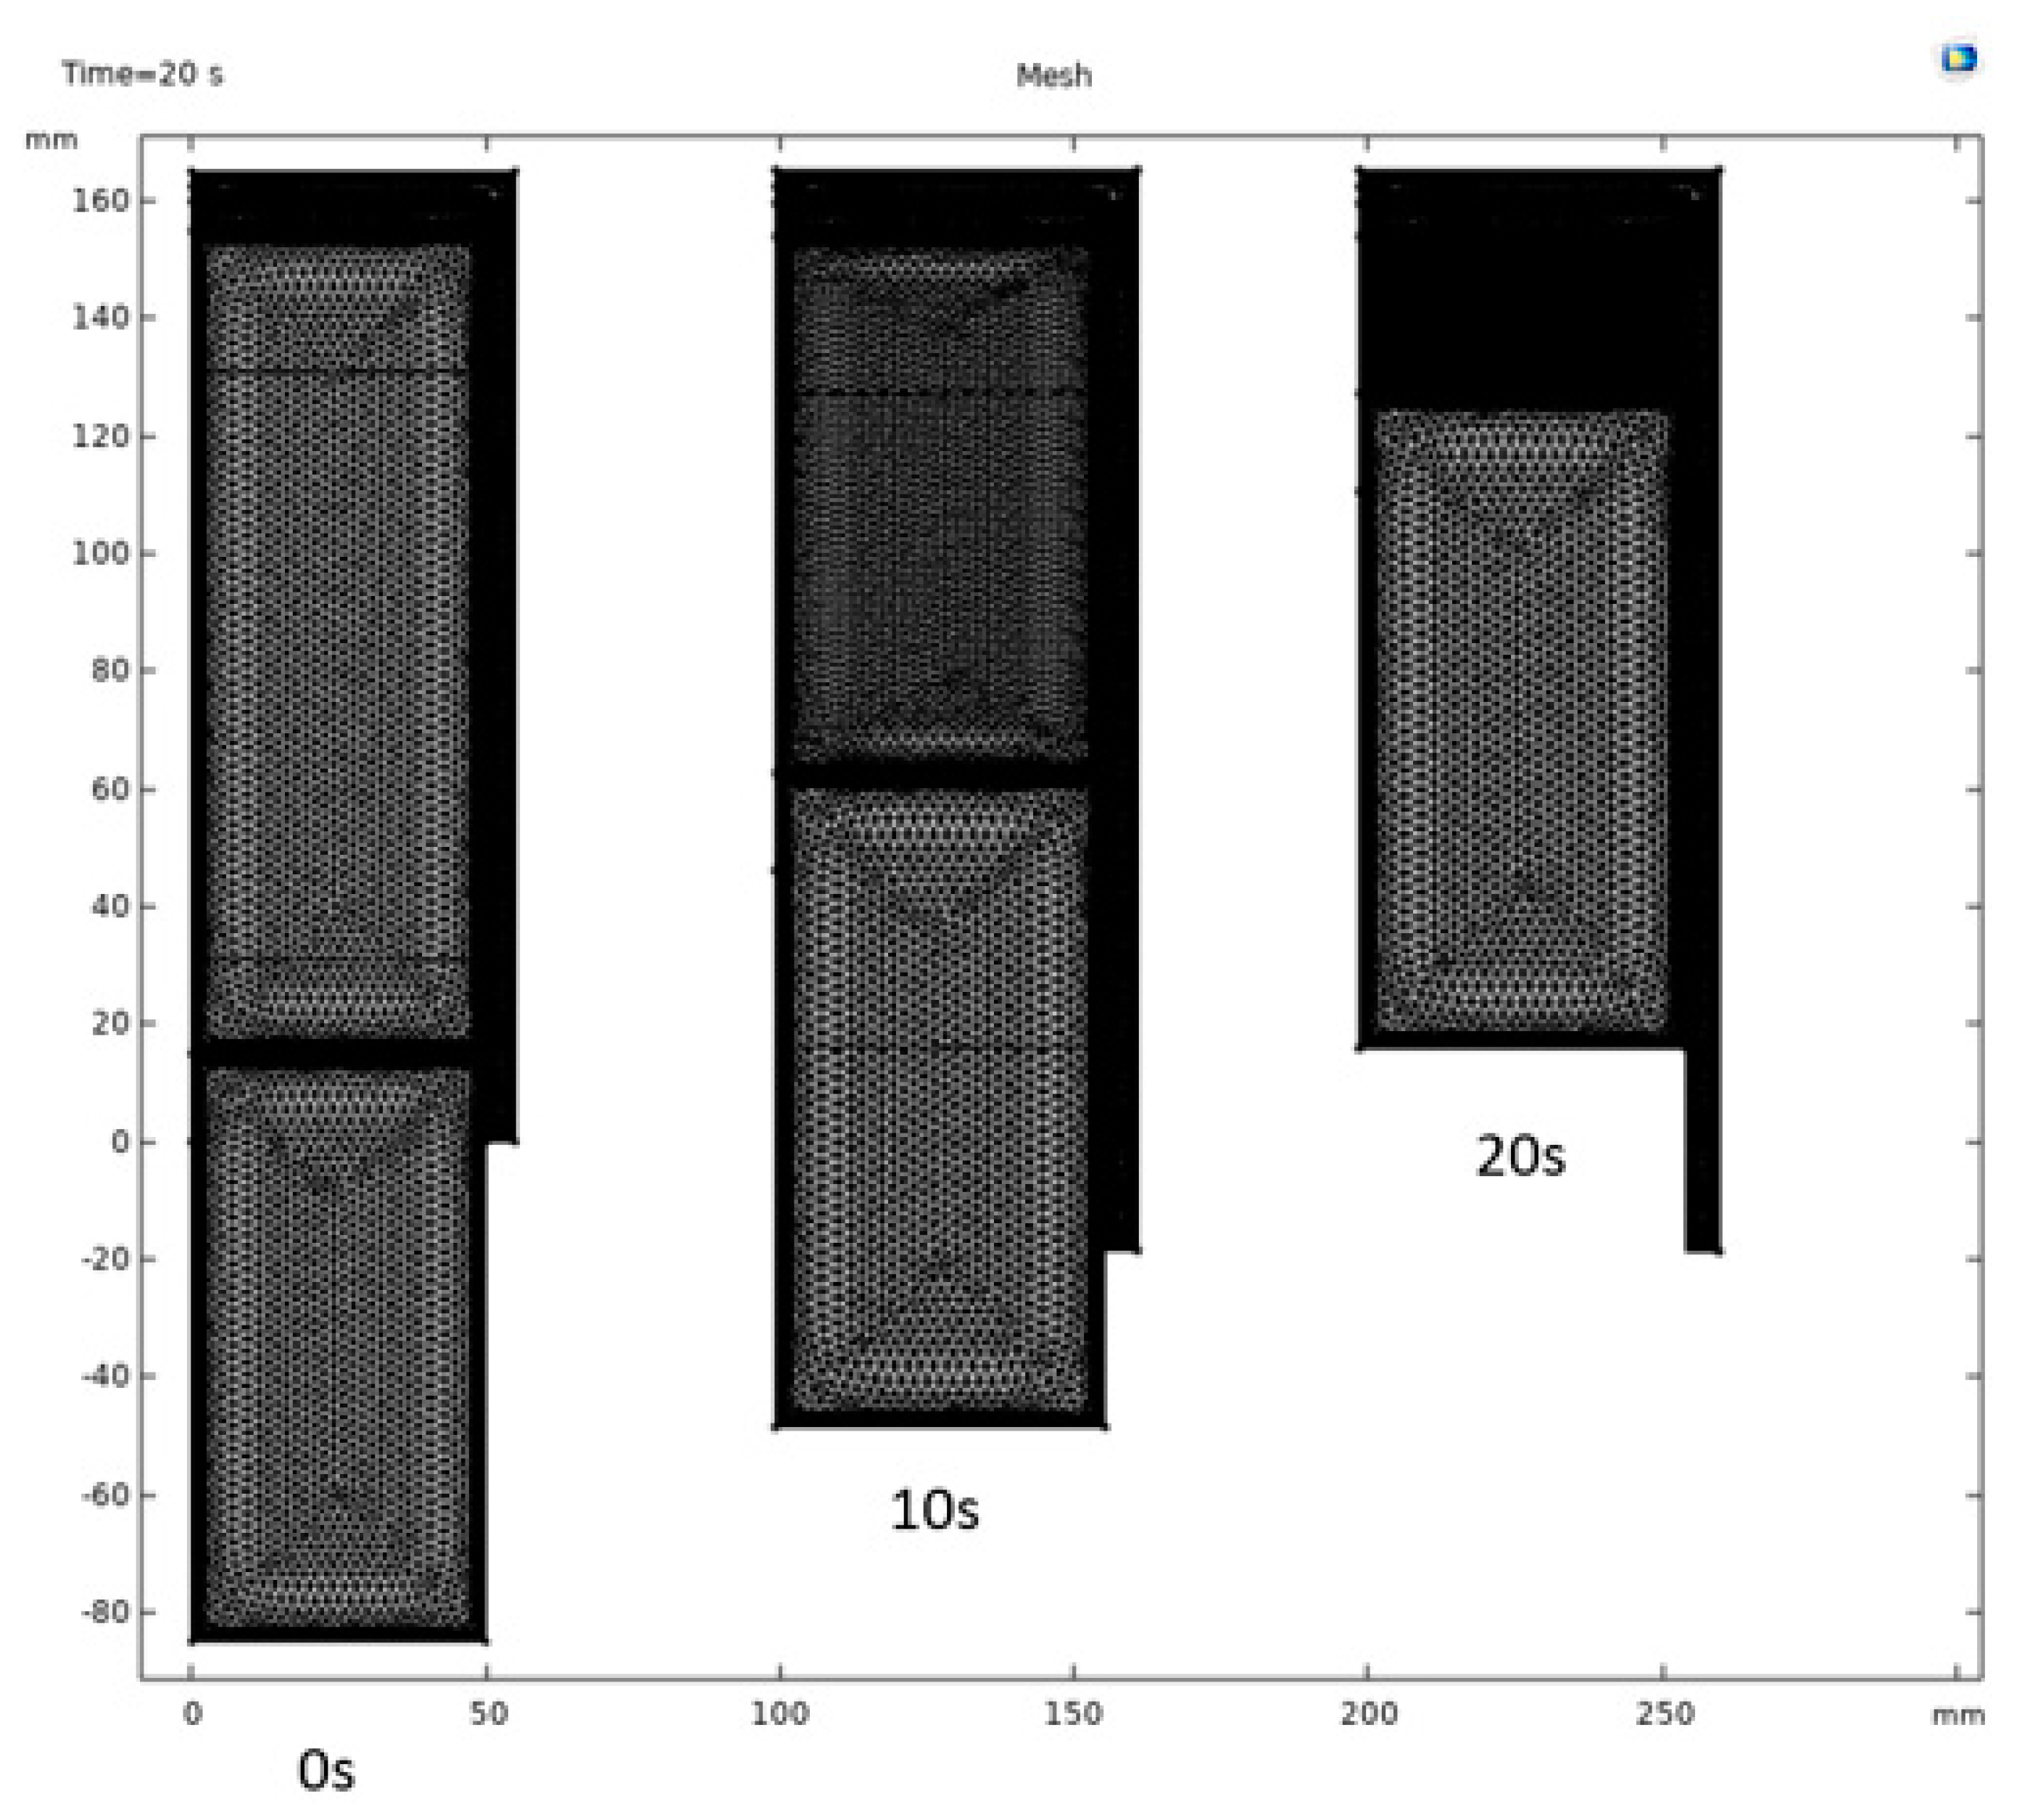
Figure 5.
The structure of the mesh cells in the numerical model during hydrogen compression in the chamber to a compression ratio Kc =5.0 for time intervals of (a) 0 seconds and (b) 20 seconds.
Figure 5.
The structure of the mesh cells in the numerical model during hydrogen compression in the chamber to a compression ratio Kc =5.0 for time intervals of (a) 0 seconds and (b) 20 seconds.
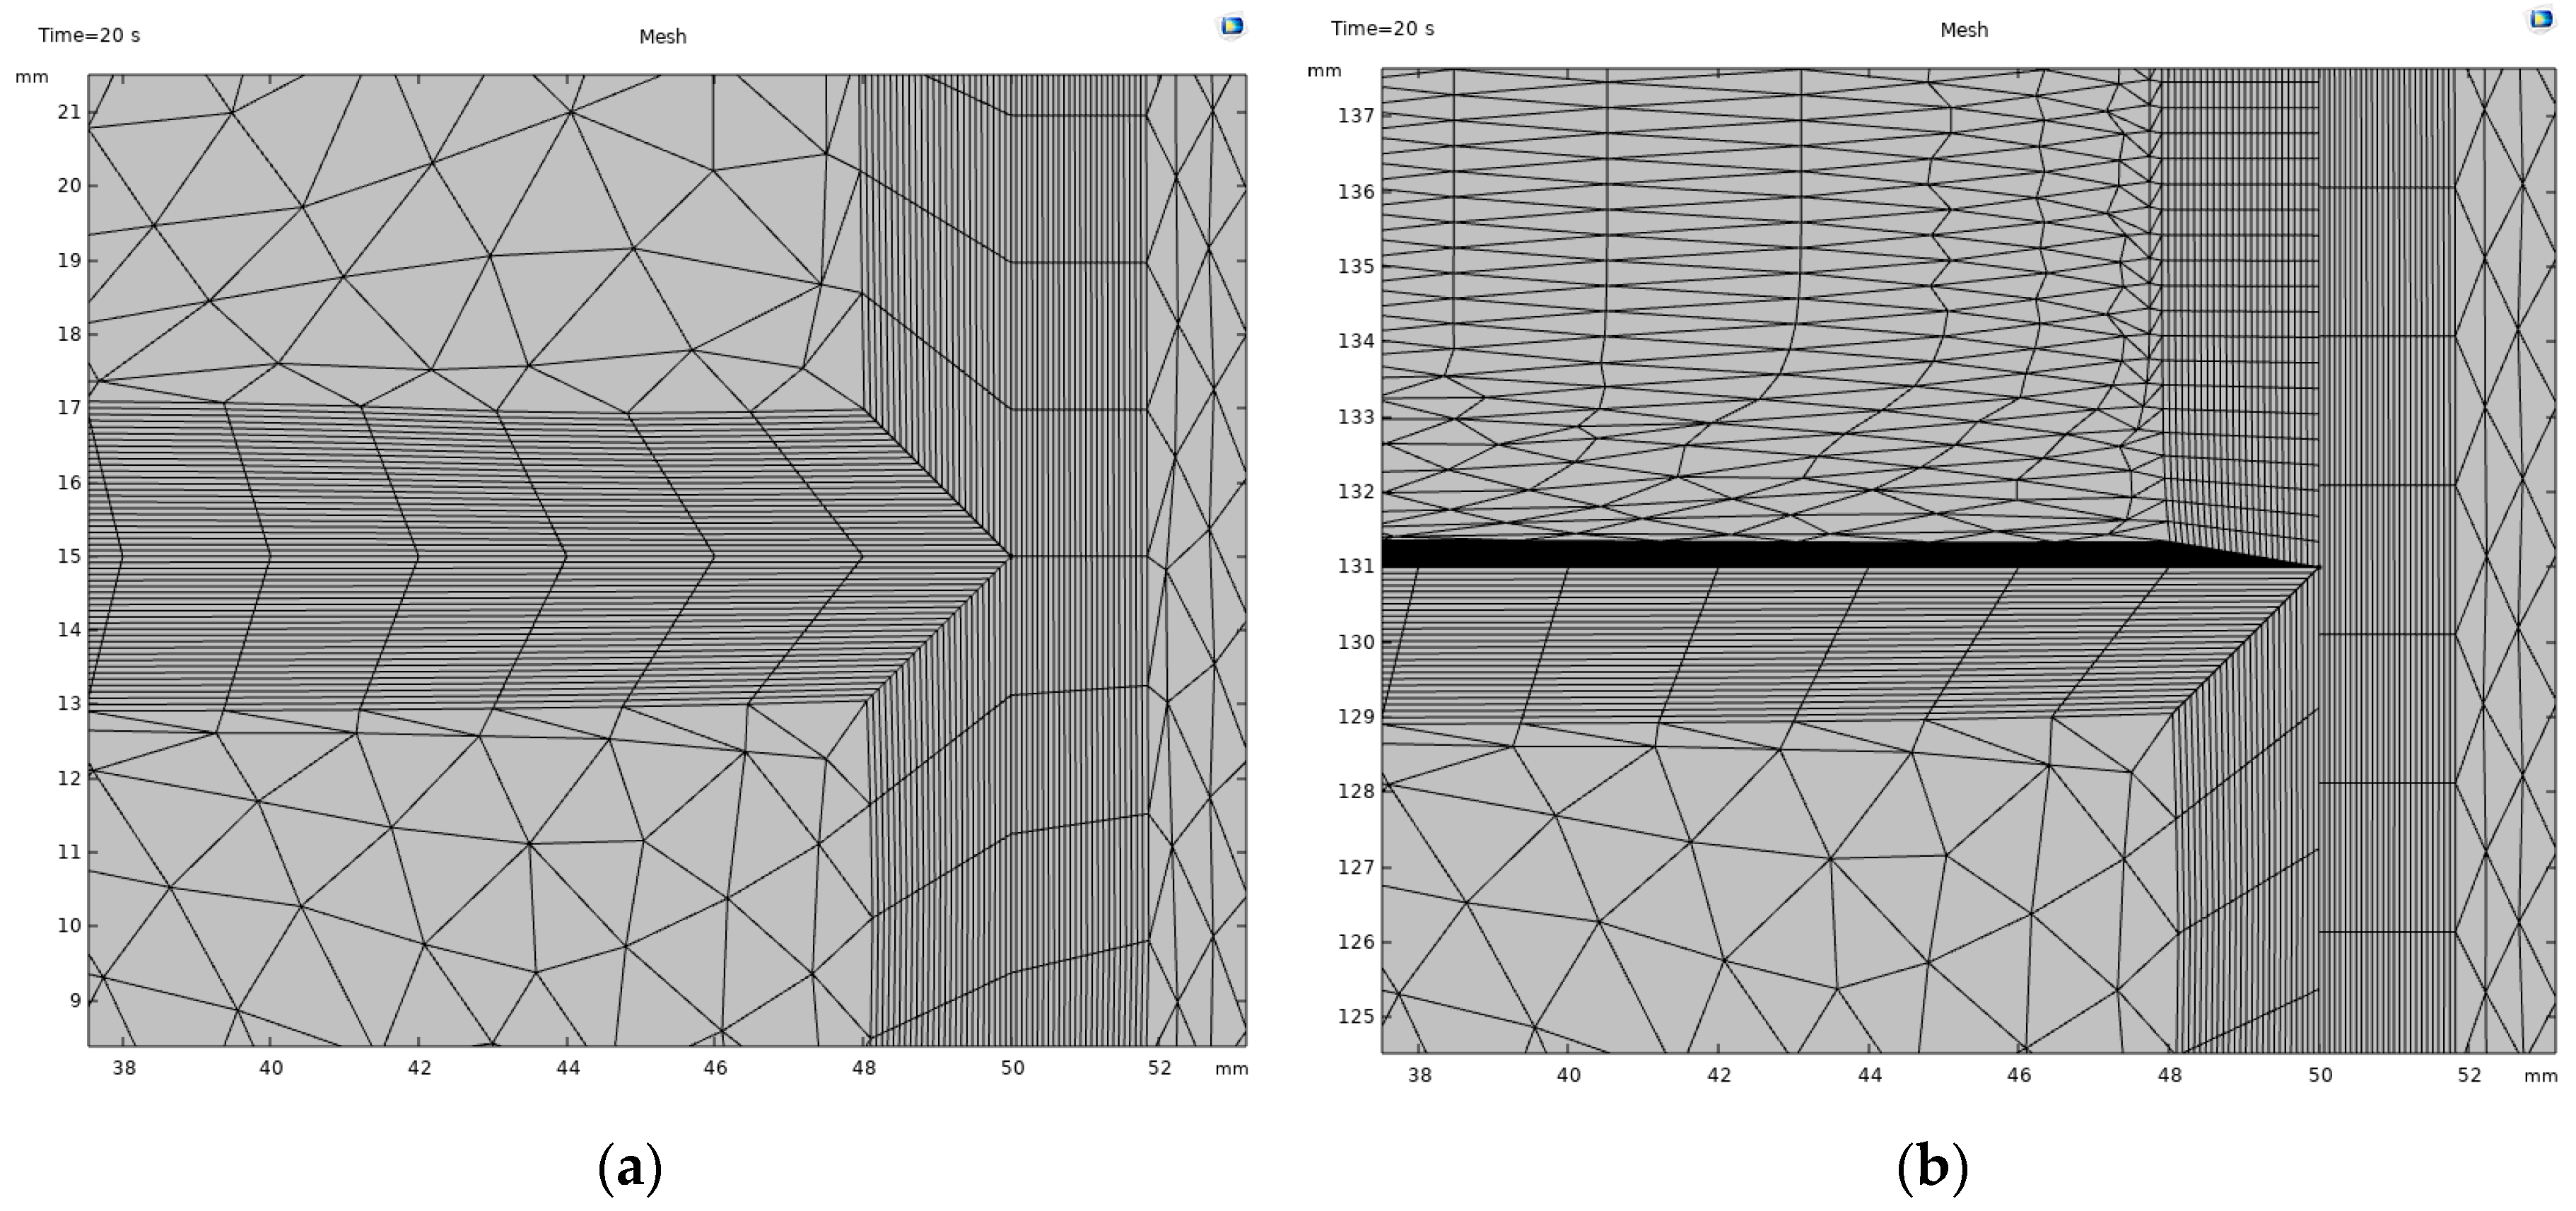
Figure 5.
Distribution of the temperature of hydrogen in the compression chamber during a single 20-second compression stroke. a) the initial pressure 3.0 MPa b) the initial pressure 20.0 MPa.
Figure 5.
Distribution of the temperature of hydrogen in the compression chamber during a single 20-second compression stroke. a) the initial pressure 3.0 MPa b) the initial pressure 20.0 MPa.
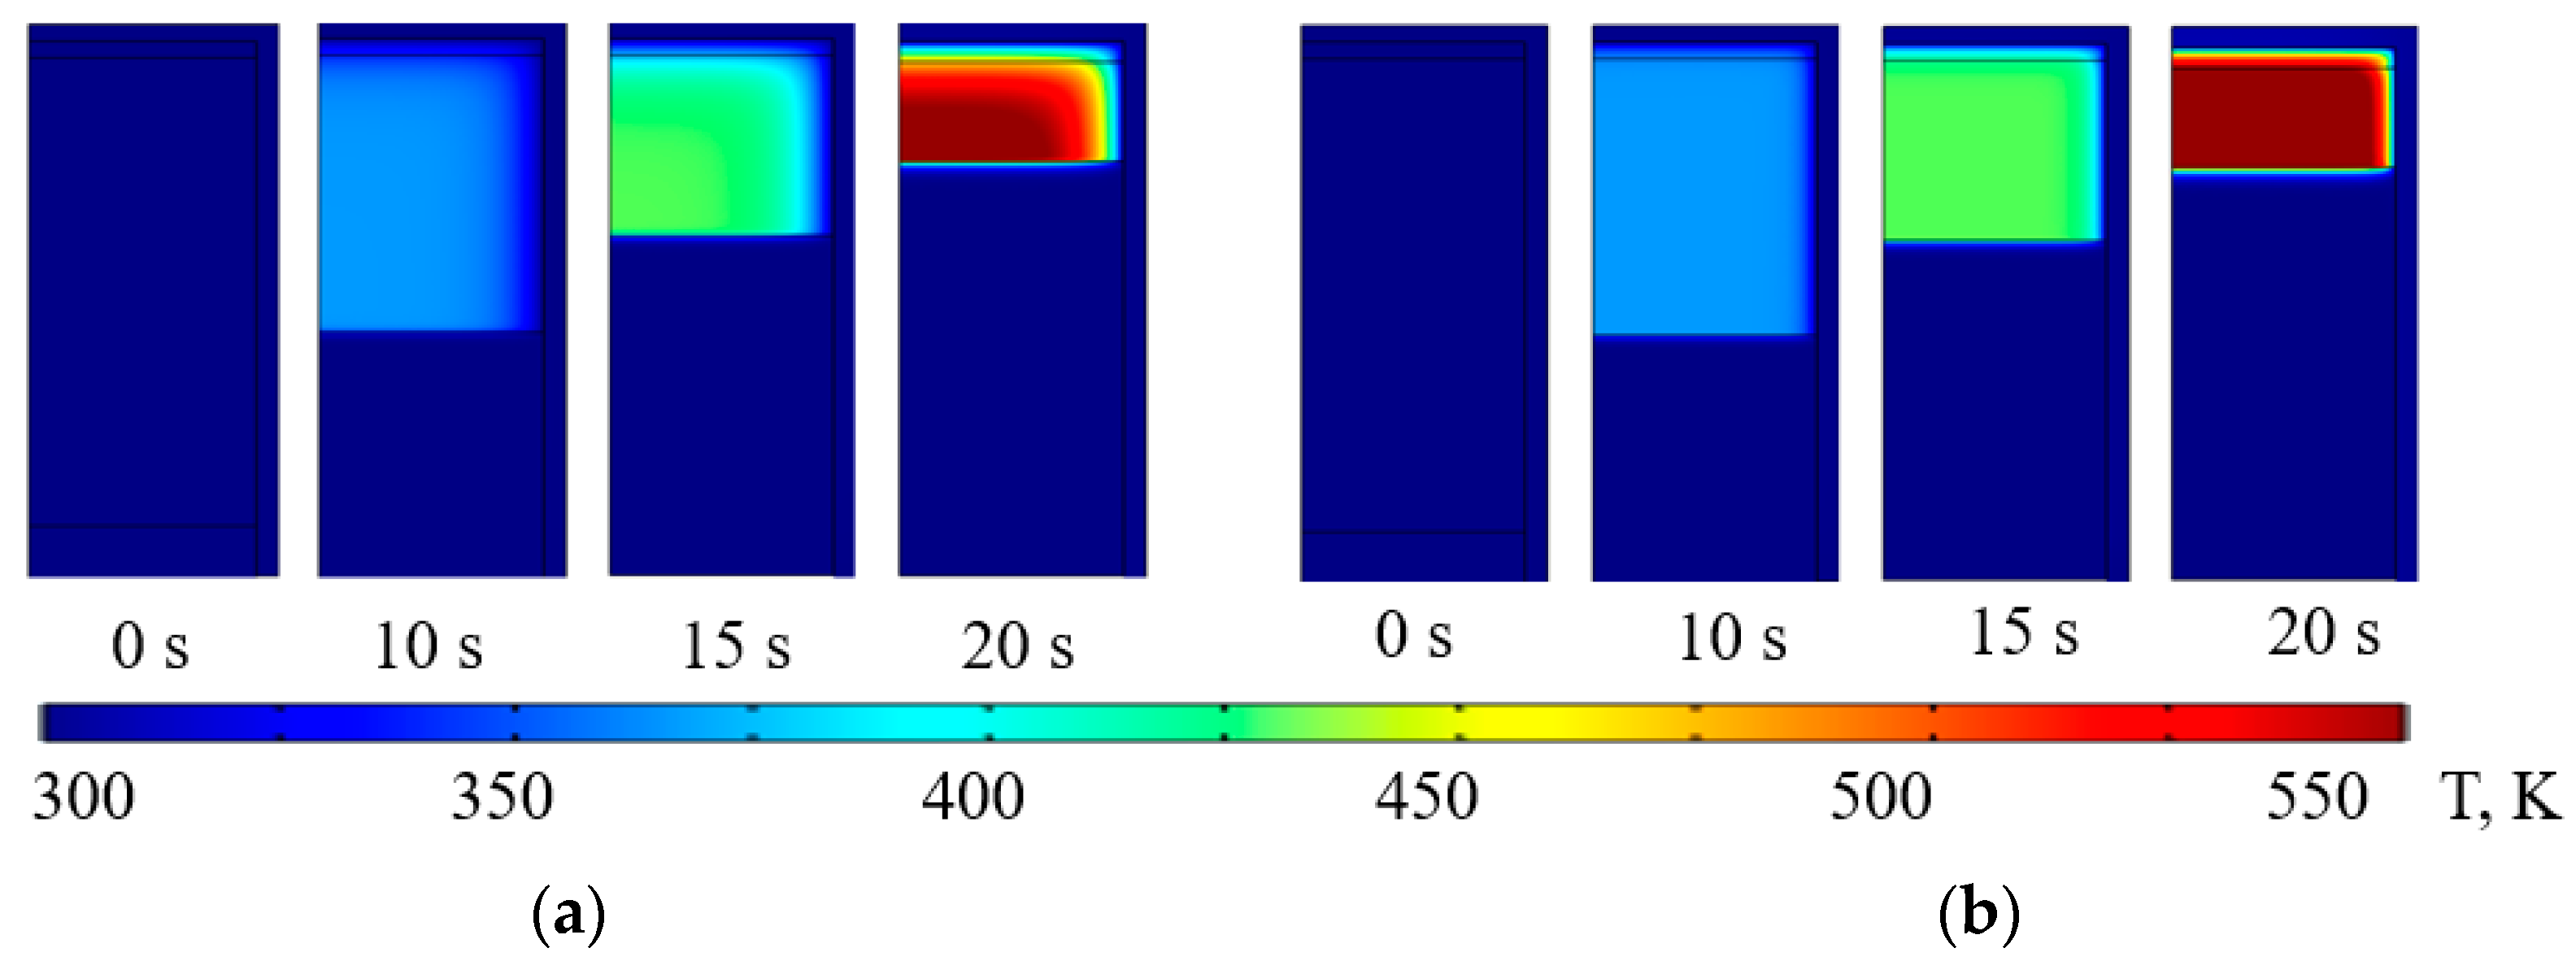
Figure 6.
Temperature distribution in the compression chamber wall during a single 20-second compression stroke: (a) initial pressure of 3.0 MPa, and (b) initial pressure of 20.0 MPa.
Figure 6.
Temperature distribution in the compression chamber wall during a single 20-second compression stroke: (a) initial pressure of 3.0 MPa, and (b) initial pressure of 20.0 MPa.
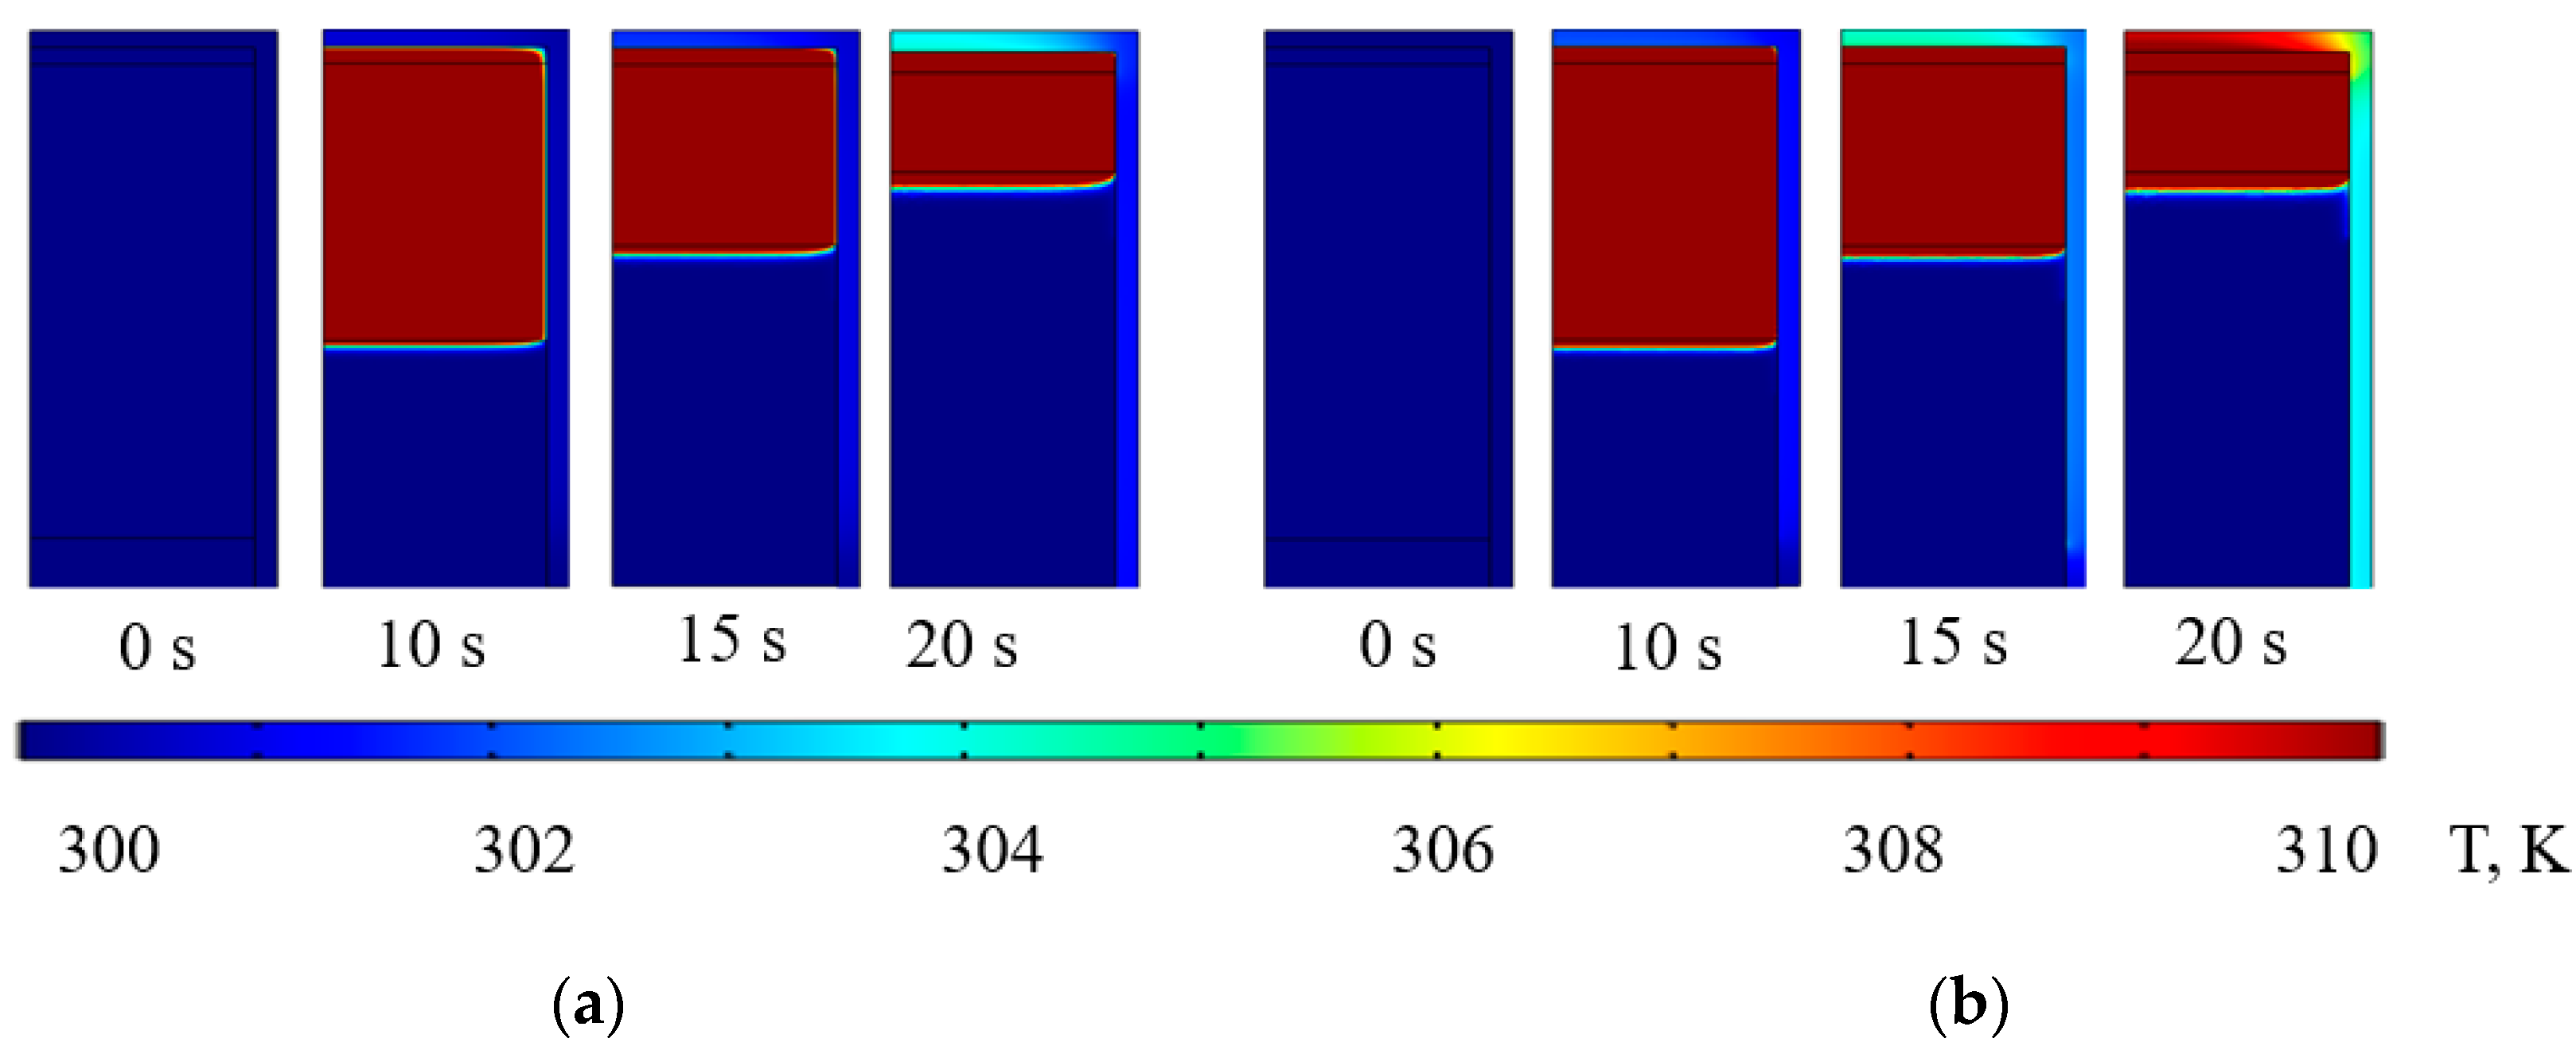
Figure 7.
Average temperature increases in hydrogen ∆TH for different durations of the compression stroke ts, at initial pressures P1 = 3.0, 10.0, 15.0 and 20.0 MPa and compression ratio Kc = 5.
Figure 7.
Average temperature increases in hydrogen ∆TH for different durations of the compression stroke ts, at initial pressures P1 = 3.0, 10.0, 15.0 and 20.0 MPa and compression ratio Kc = 5.
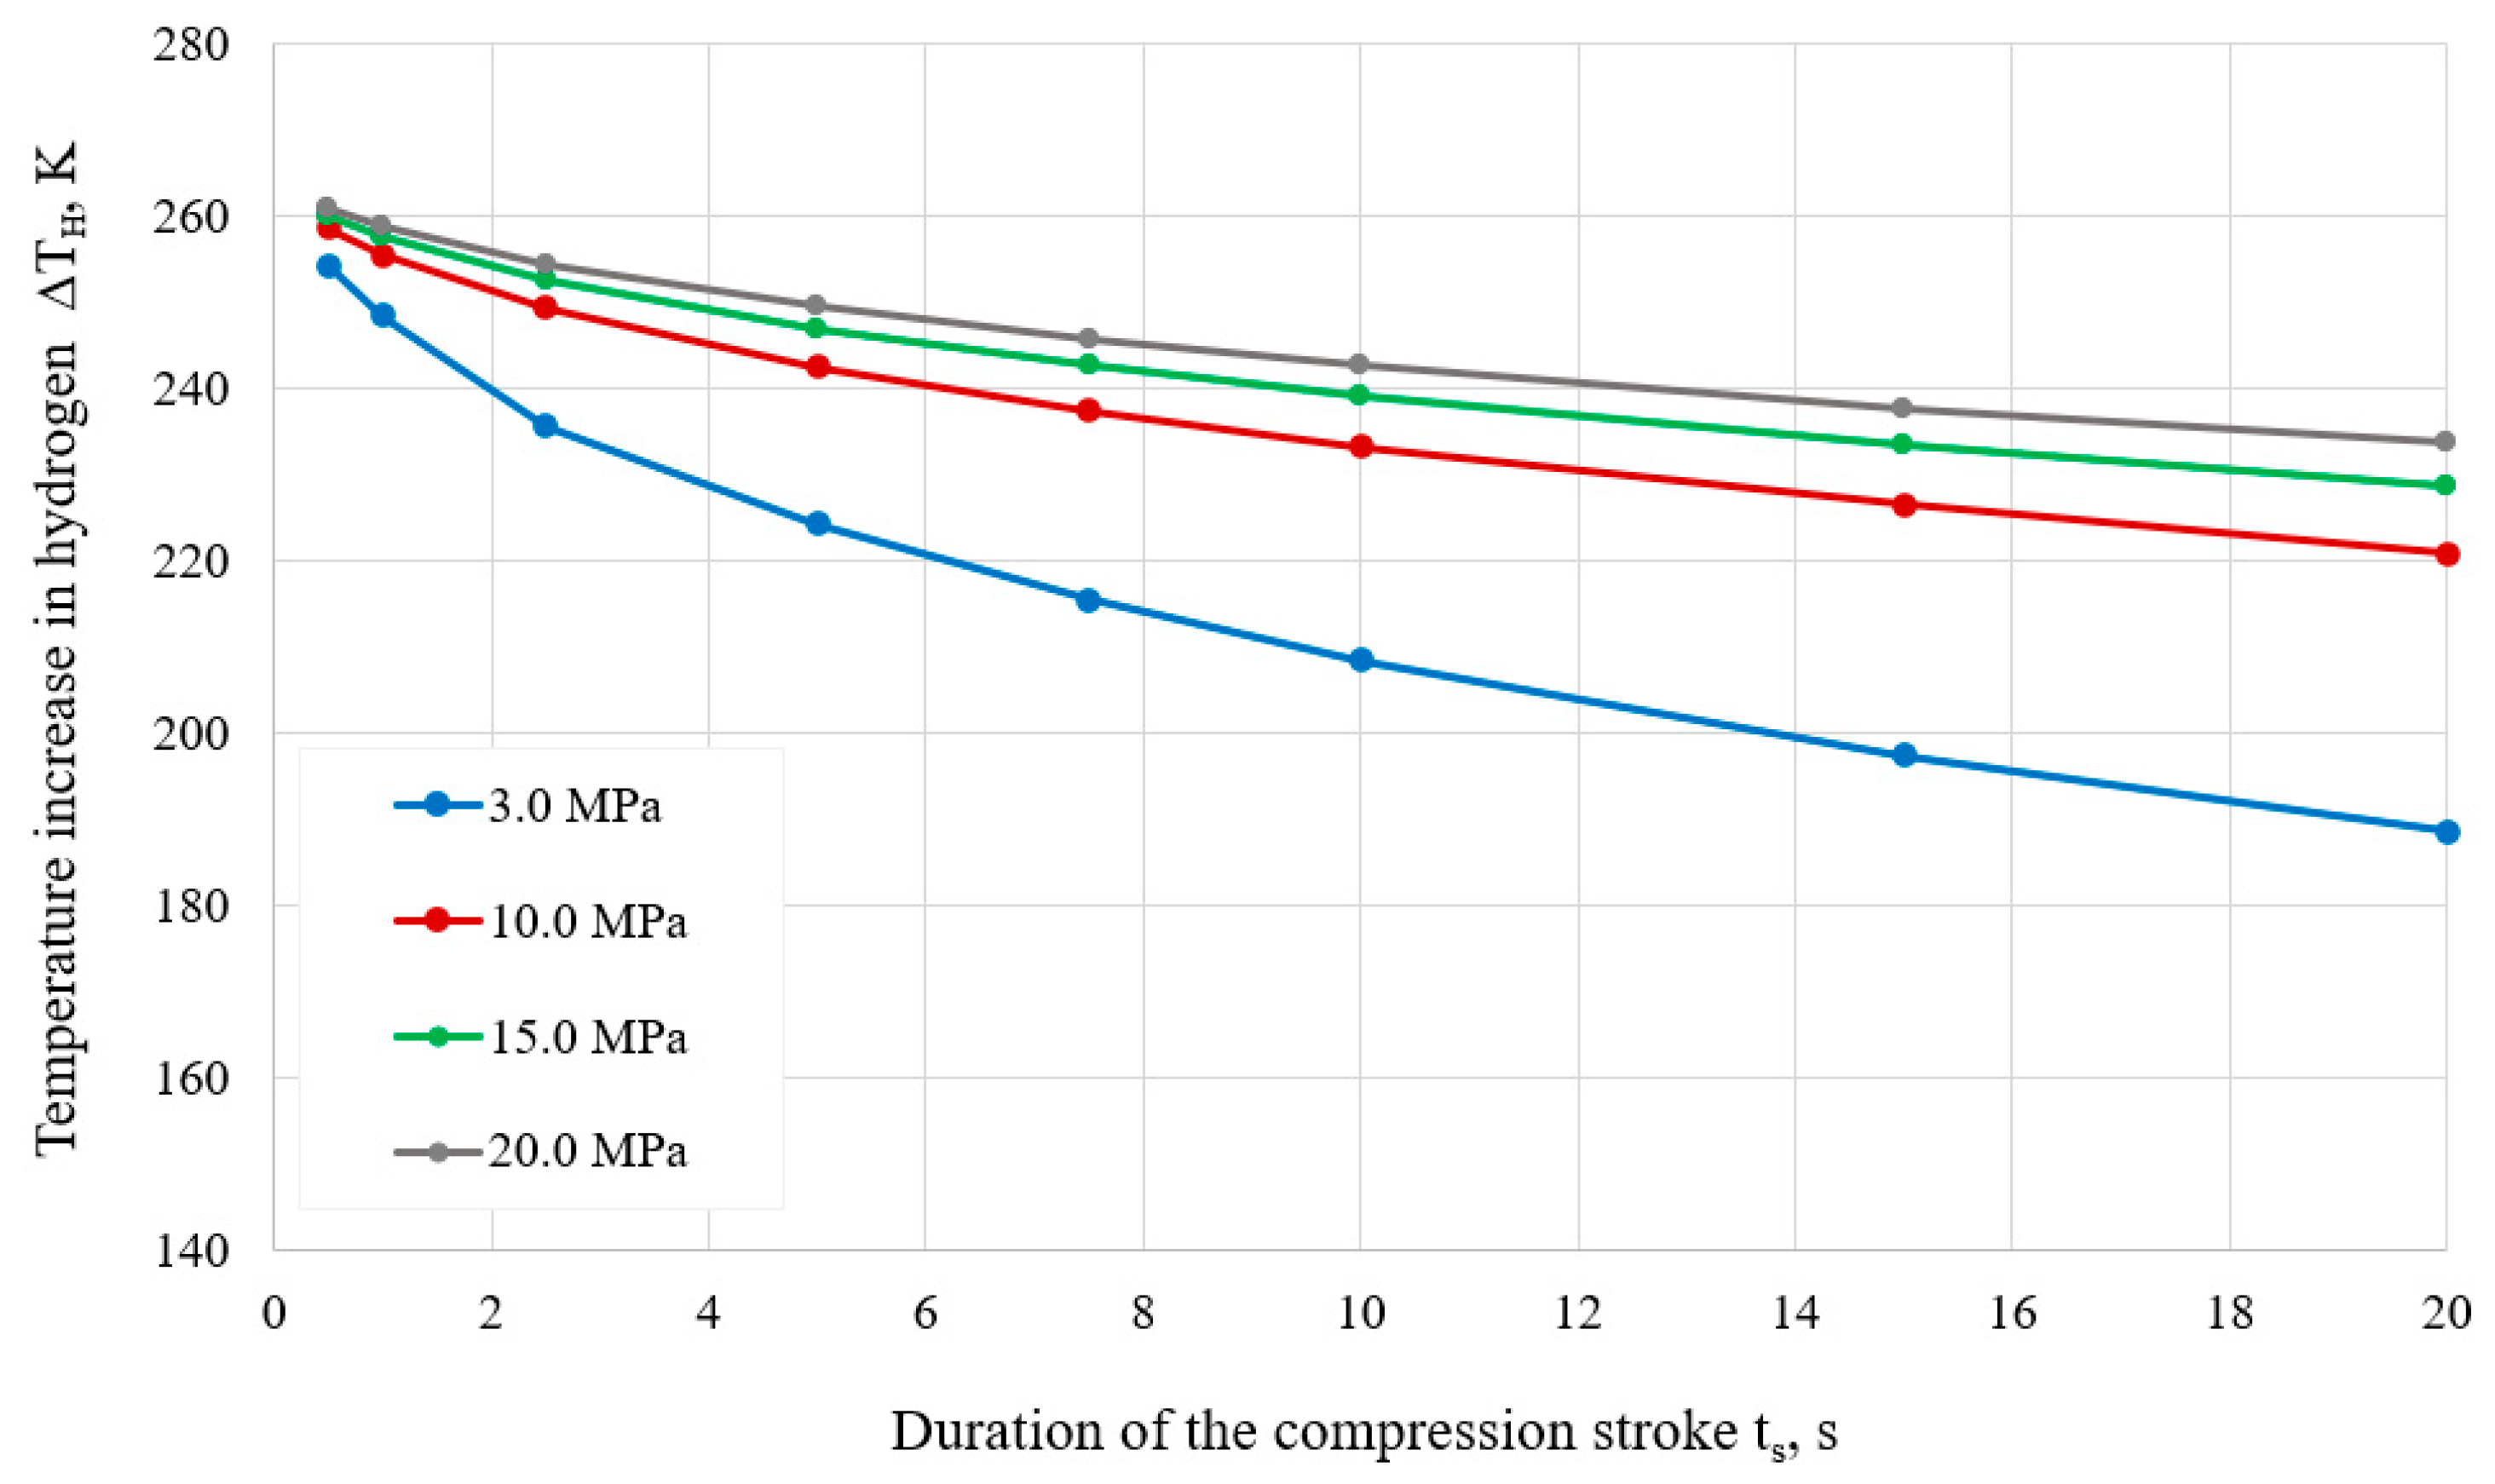
Figure 8.
Average temperature increases in working fluid ∆TF for different durations of the compression stroke ts, at initial pressures P1 = 3.0, 10.0, 15.0 and 20.0 MPa and compression ratio Kc = 5.
Figure 8.
Average temperature increases in working fluid ∆TF for different durations of the compression stroke ts, at initial pressures P1 = 3.0, 10.0, 15.0 and 20.0 MPa and compression ratio Kc = 5.
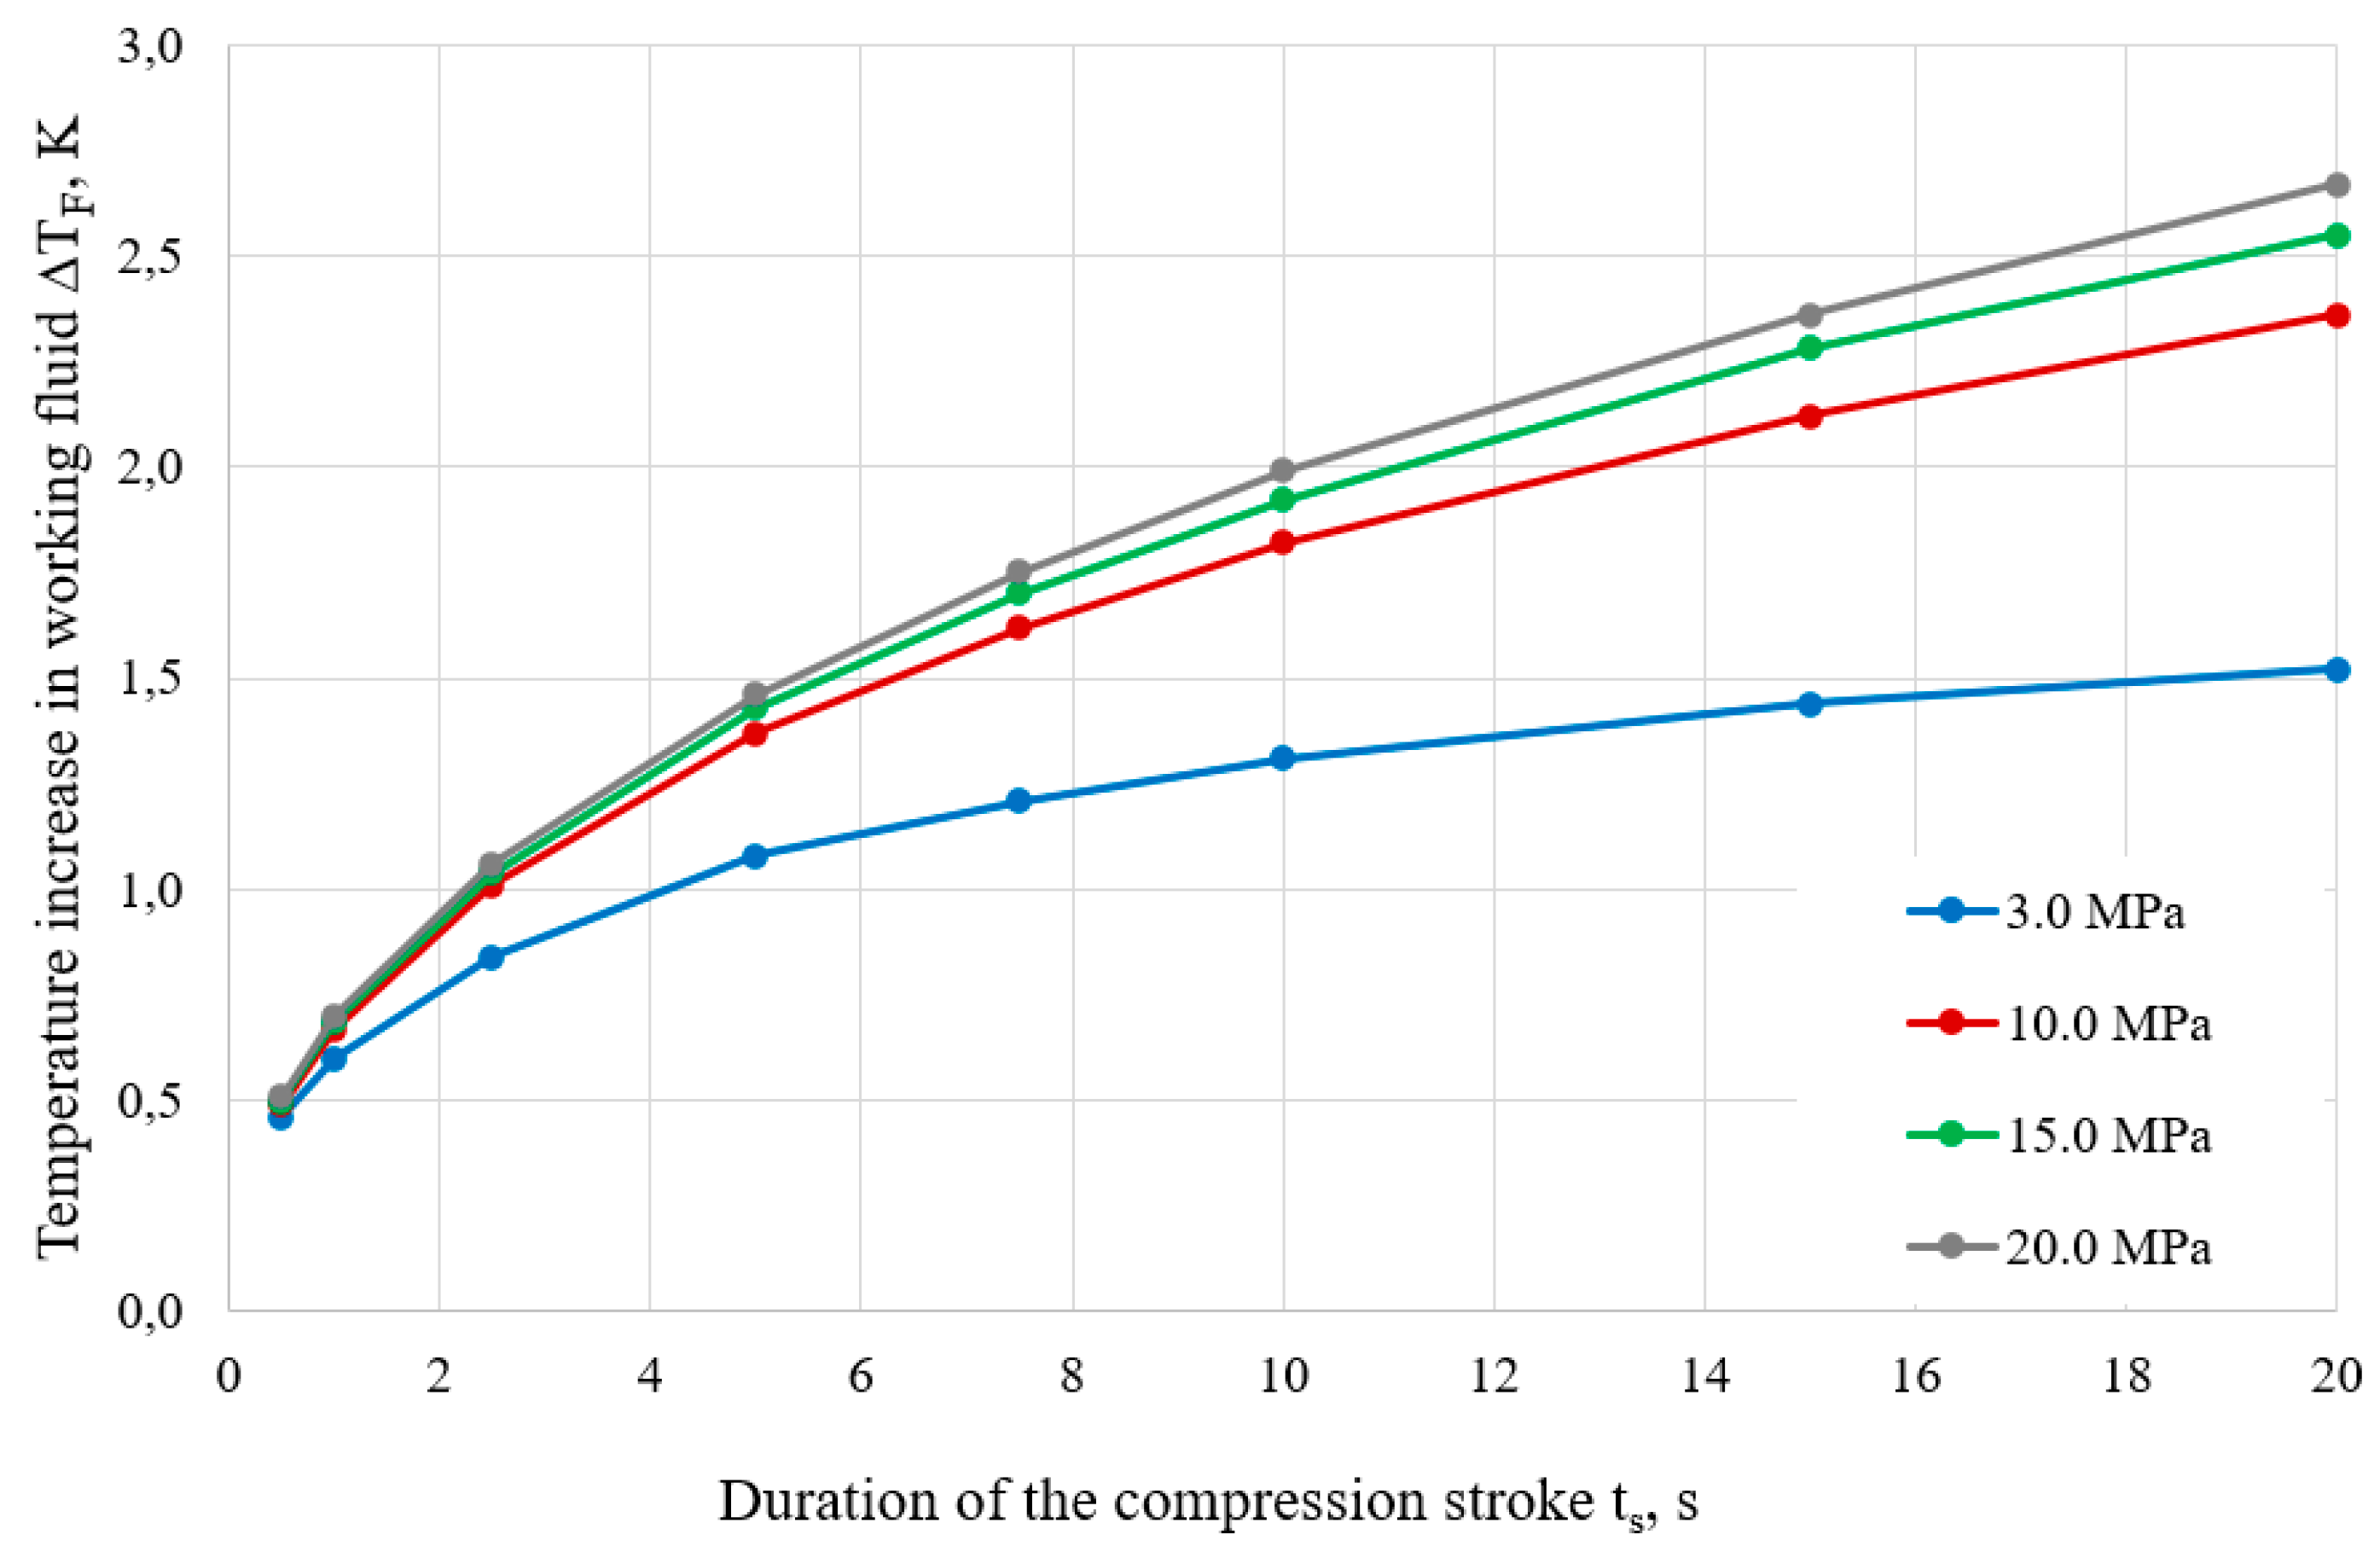
Figure 9.
Average temperature increases in the cylinder body ∆TC for different durations of the compression stroke ts, at initial pressures P1 = 3.0, 10.0, 15.0 and 20.0 MPa and compression ratio Kc = 5.
Figure 9.
Average temperature increases in the cylinder body ∆TC for different durations of the compression stroke ts, at initial pressures P1 = 3.0, 10.0, 15.0 and 20.0 MPa and compression ratio Kc = 5.
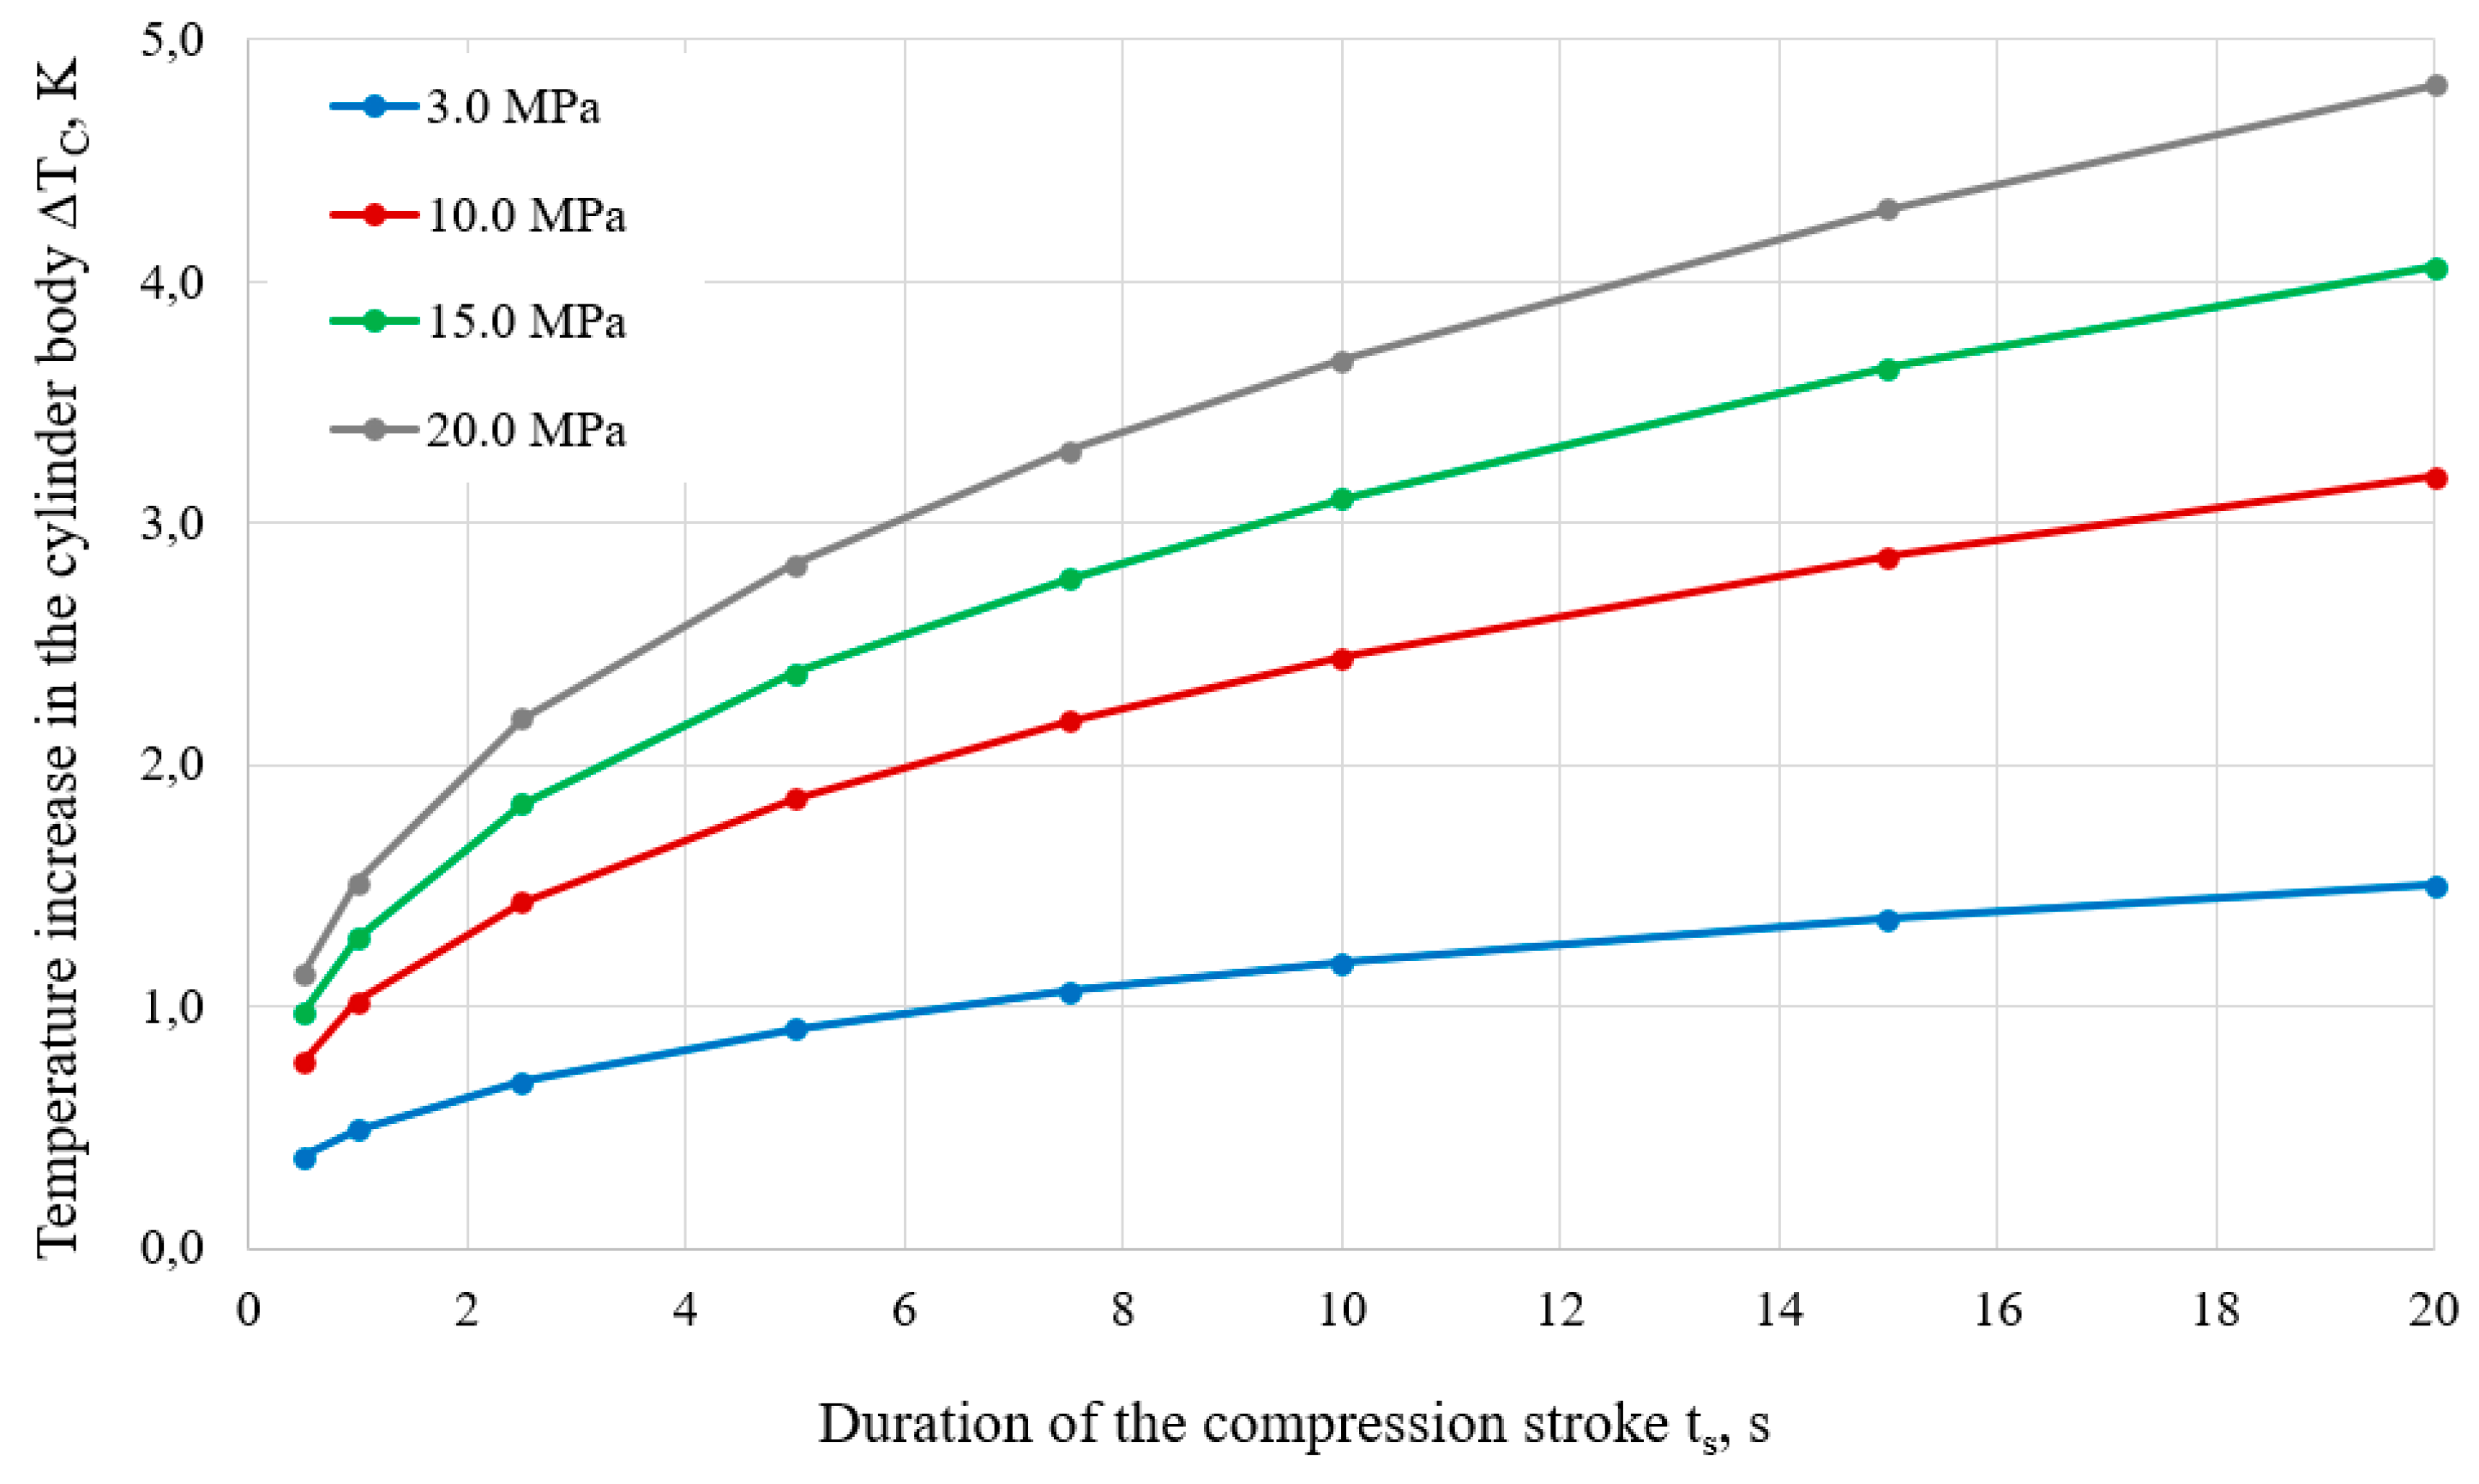
Figure 10.
Diagrams of thermal energy distribution QT between energies accumulated in hydrogen QH, working fluid QF and compression cylinder body QC for different durations of the compression stroke ts at initial pressures P1 = 3.0 MPa and compression ratio Kc = 5.0.
Figure 10.
Diagrams of thermal energy distribution QT between energies accumulated in hydrogen QH, working fluid QF and compression cylinder body QC for different durations of the compression stroke ts at initial pressures P1 = 3.0 MPa and compression ratio Kc = 5.0.
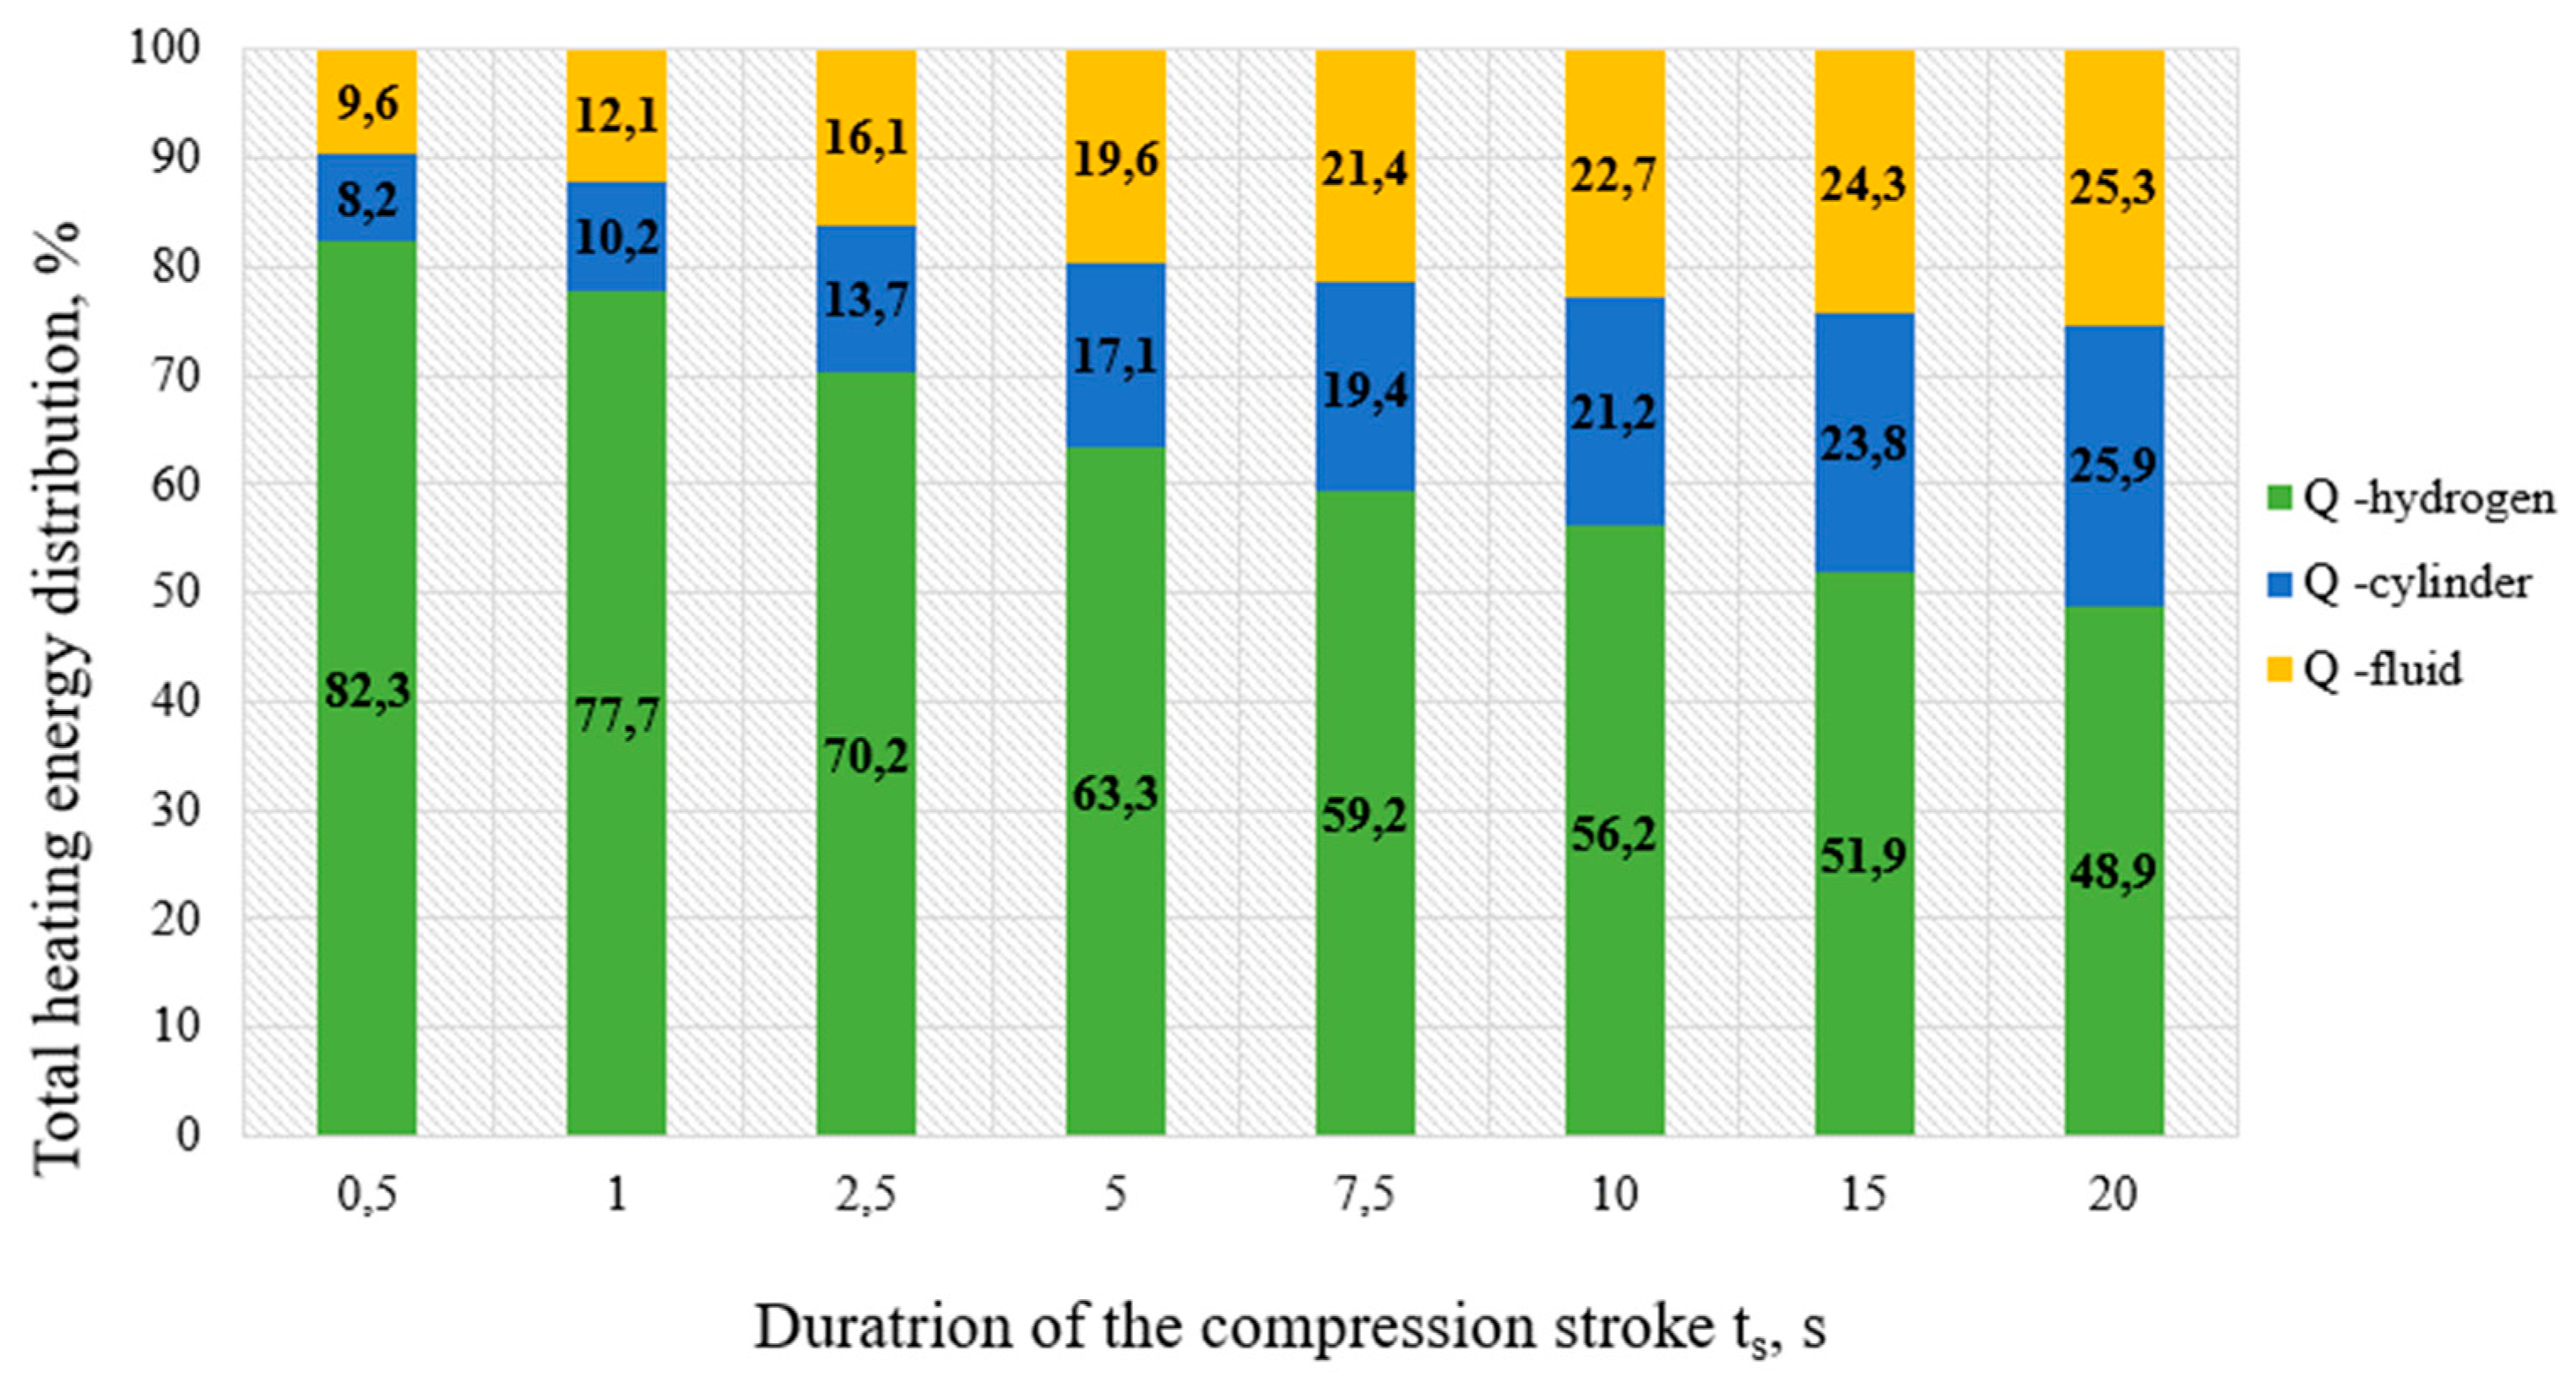
Figure 11.
Diagrams of thermal energy distribution QT between energies accumulated in hydrogen QH, working fluid QF and compression cylinder body QC for different durations of the compression stroke ts at initial pressures P1 = 20.0 MPa and compression ratio Kc = 5.0.
Figure 11.
Diagrams of thermal energy distribution QT between energies accumulated in hydrogen QH, working fluid QF and compression cylinder body QC for different durations of the compression stroke ts at initial pressures P1 = 20.0 MPa and compression ratio Kc = 5.0.
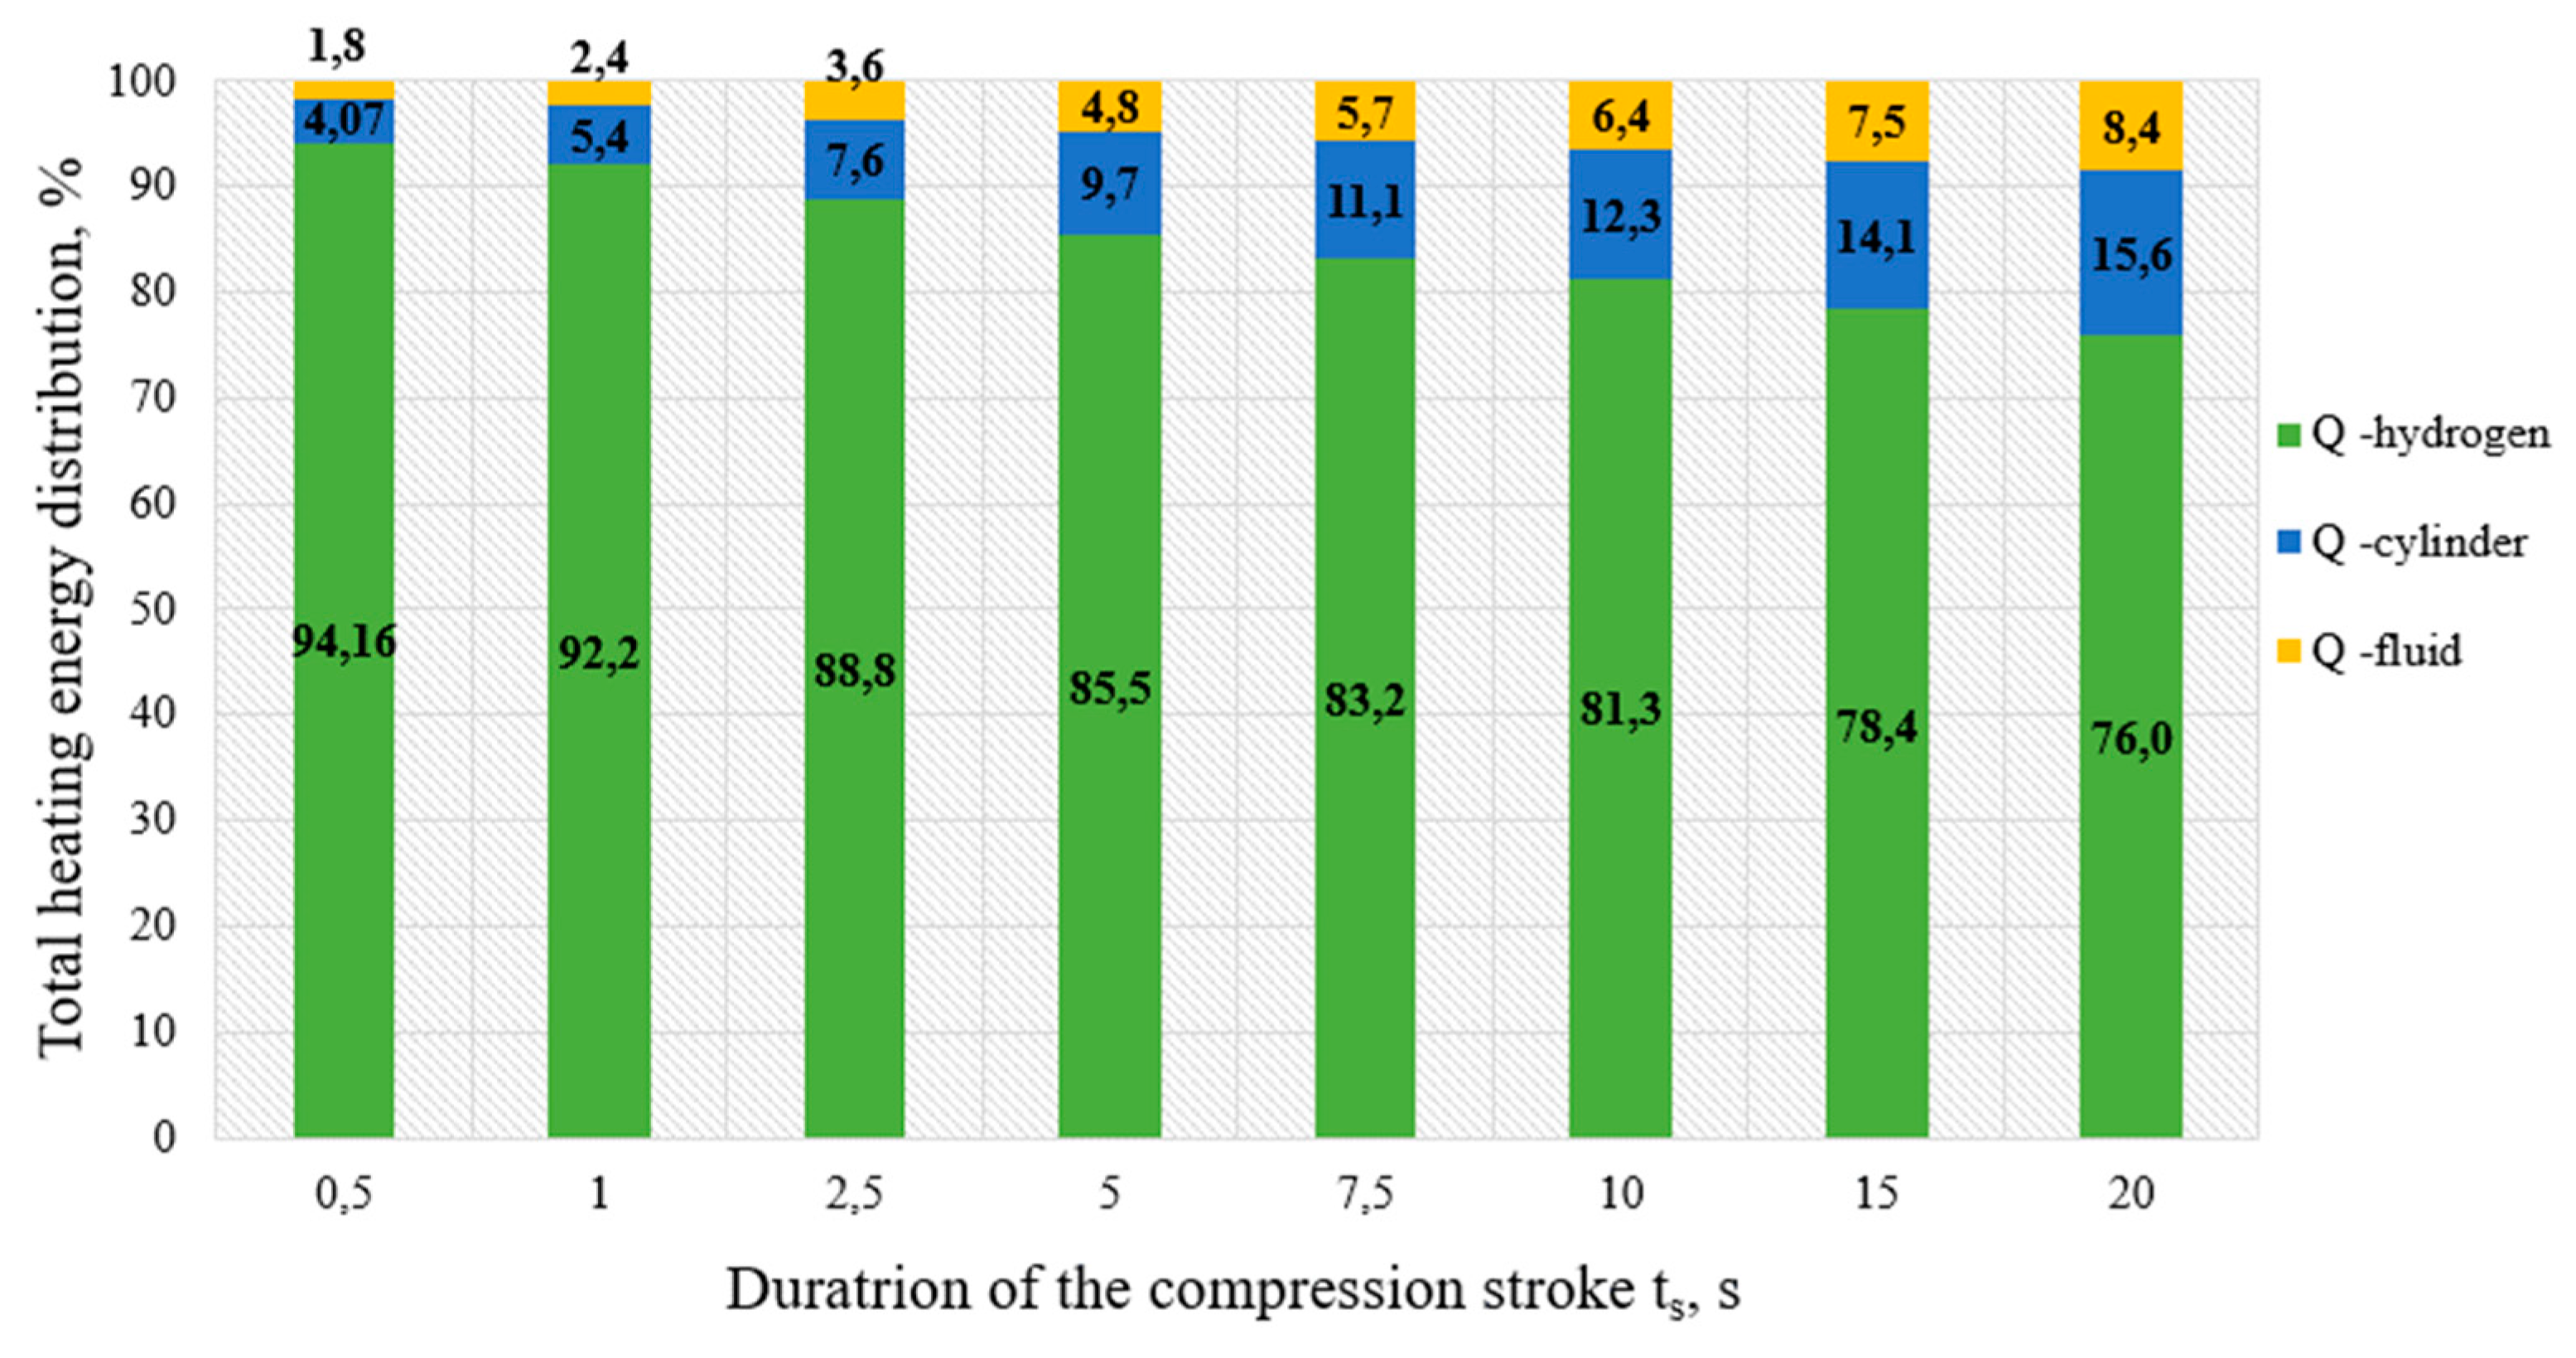
Figure 12.
Increase of overall system temperature ∆TO for different durations of the compression stroke ts, at initial pressures P1 = 3.0, 10.0, 15.0 and 20.0 MPa and compression ratio Kc = 5.0.
Figure 12.
Increase of overall system temperature ∆TO for different durations of the compression stroke ts, at initial pressures P1 = 3.0, 10.0, 15.0 and 20.0 MPa and compression ratio Kc = 5.0.
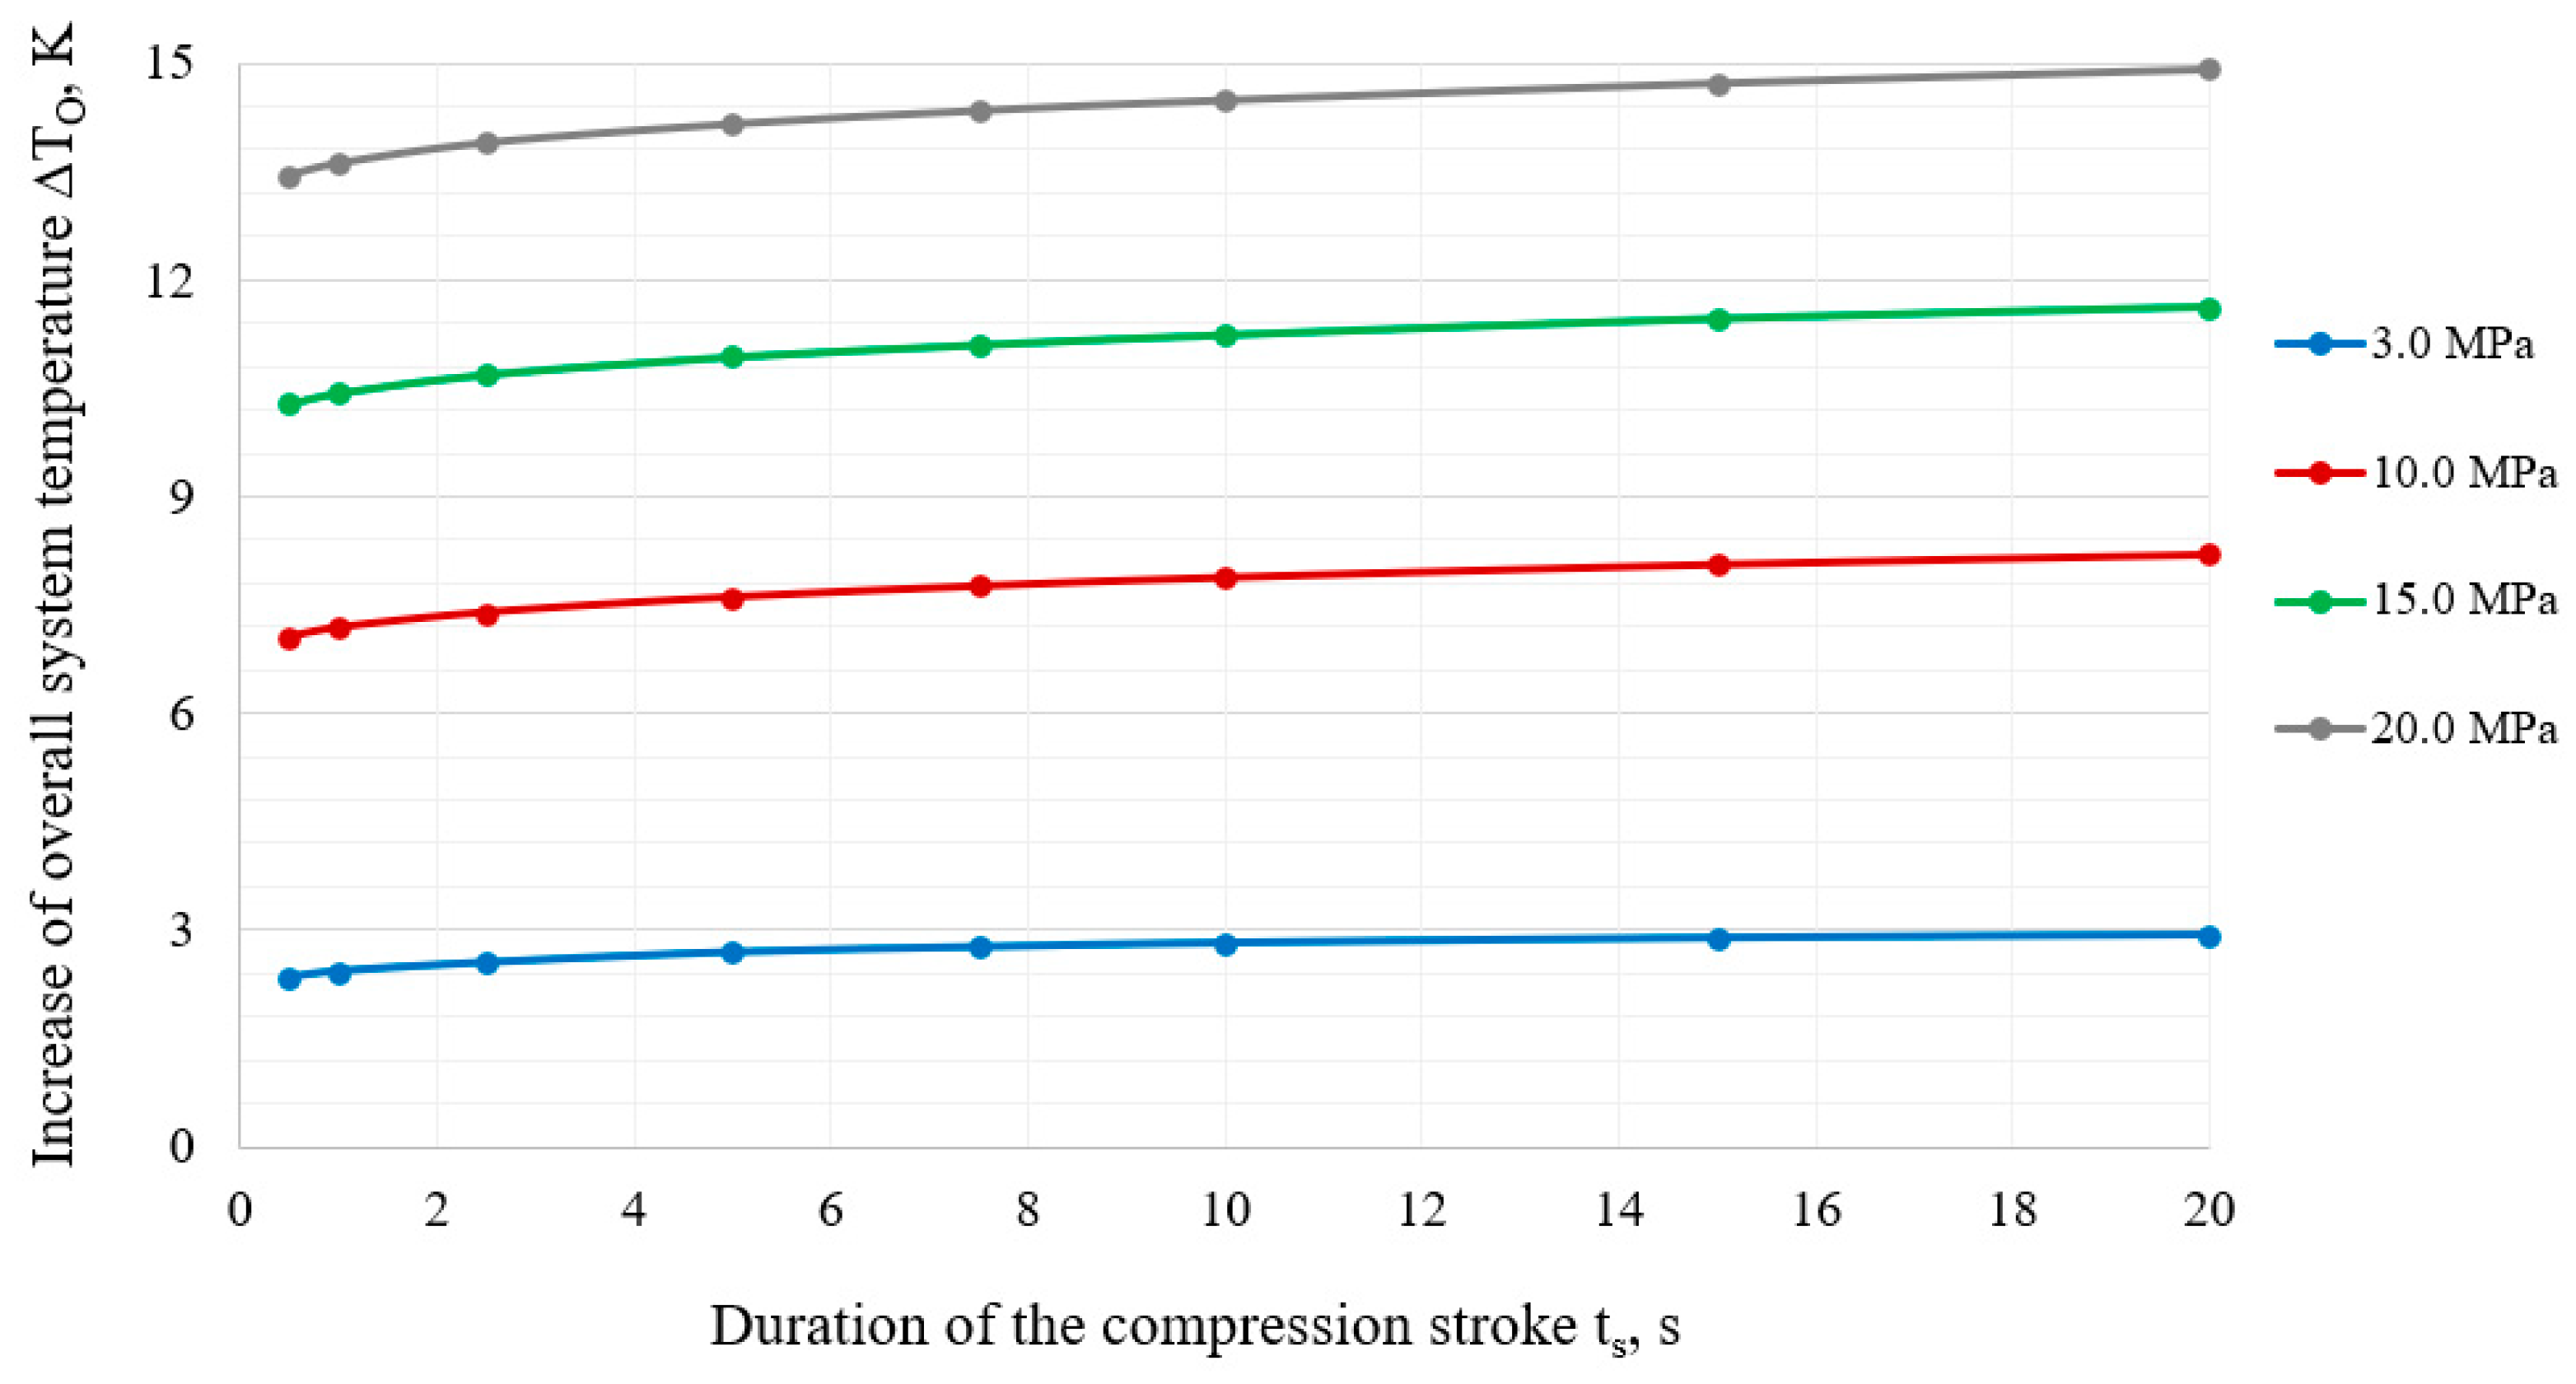
Figure 13.
The power W required for hydrogen compression for different durations of the compression stroke ts, at initial pressures P1 = 3.0, 10.0, 15.0 and 20.0 MPa and compression ratio Kc = 5.0.
Figure 13.
The power W required for hydrogen compression for different durations of the compression stroke ts, at initial pressures P1 = 3.0, 10.0, 15.0 and 20.0 MPa and compression ratio Kc = 5.0.
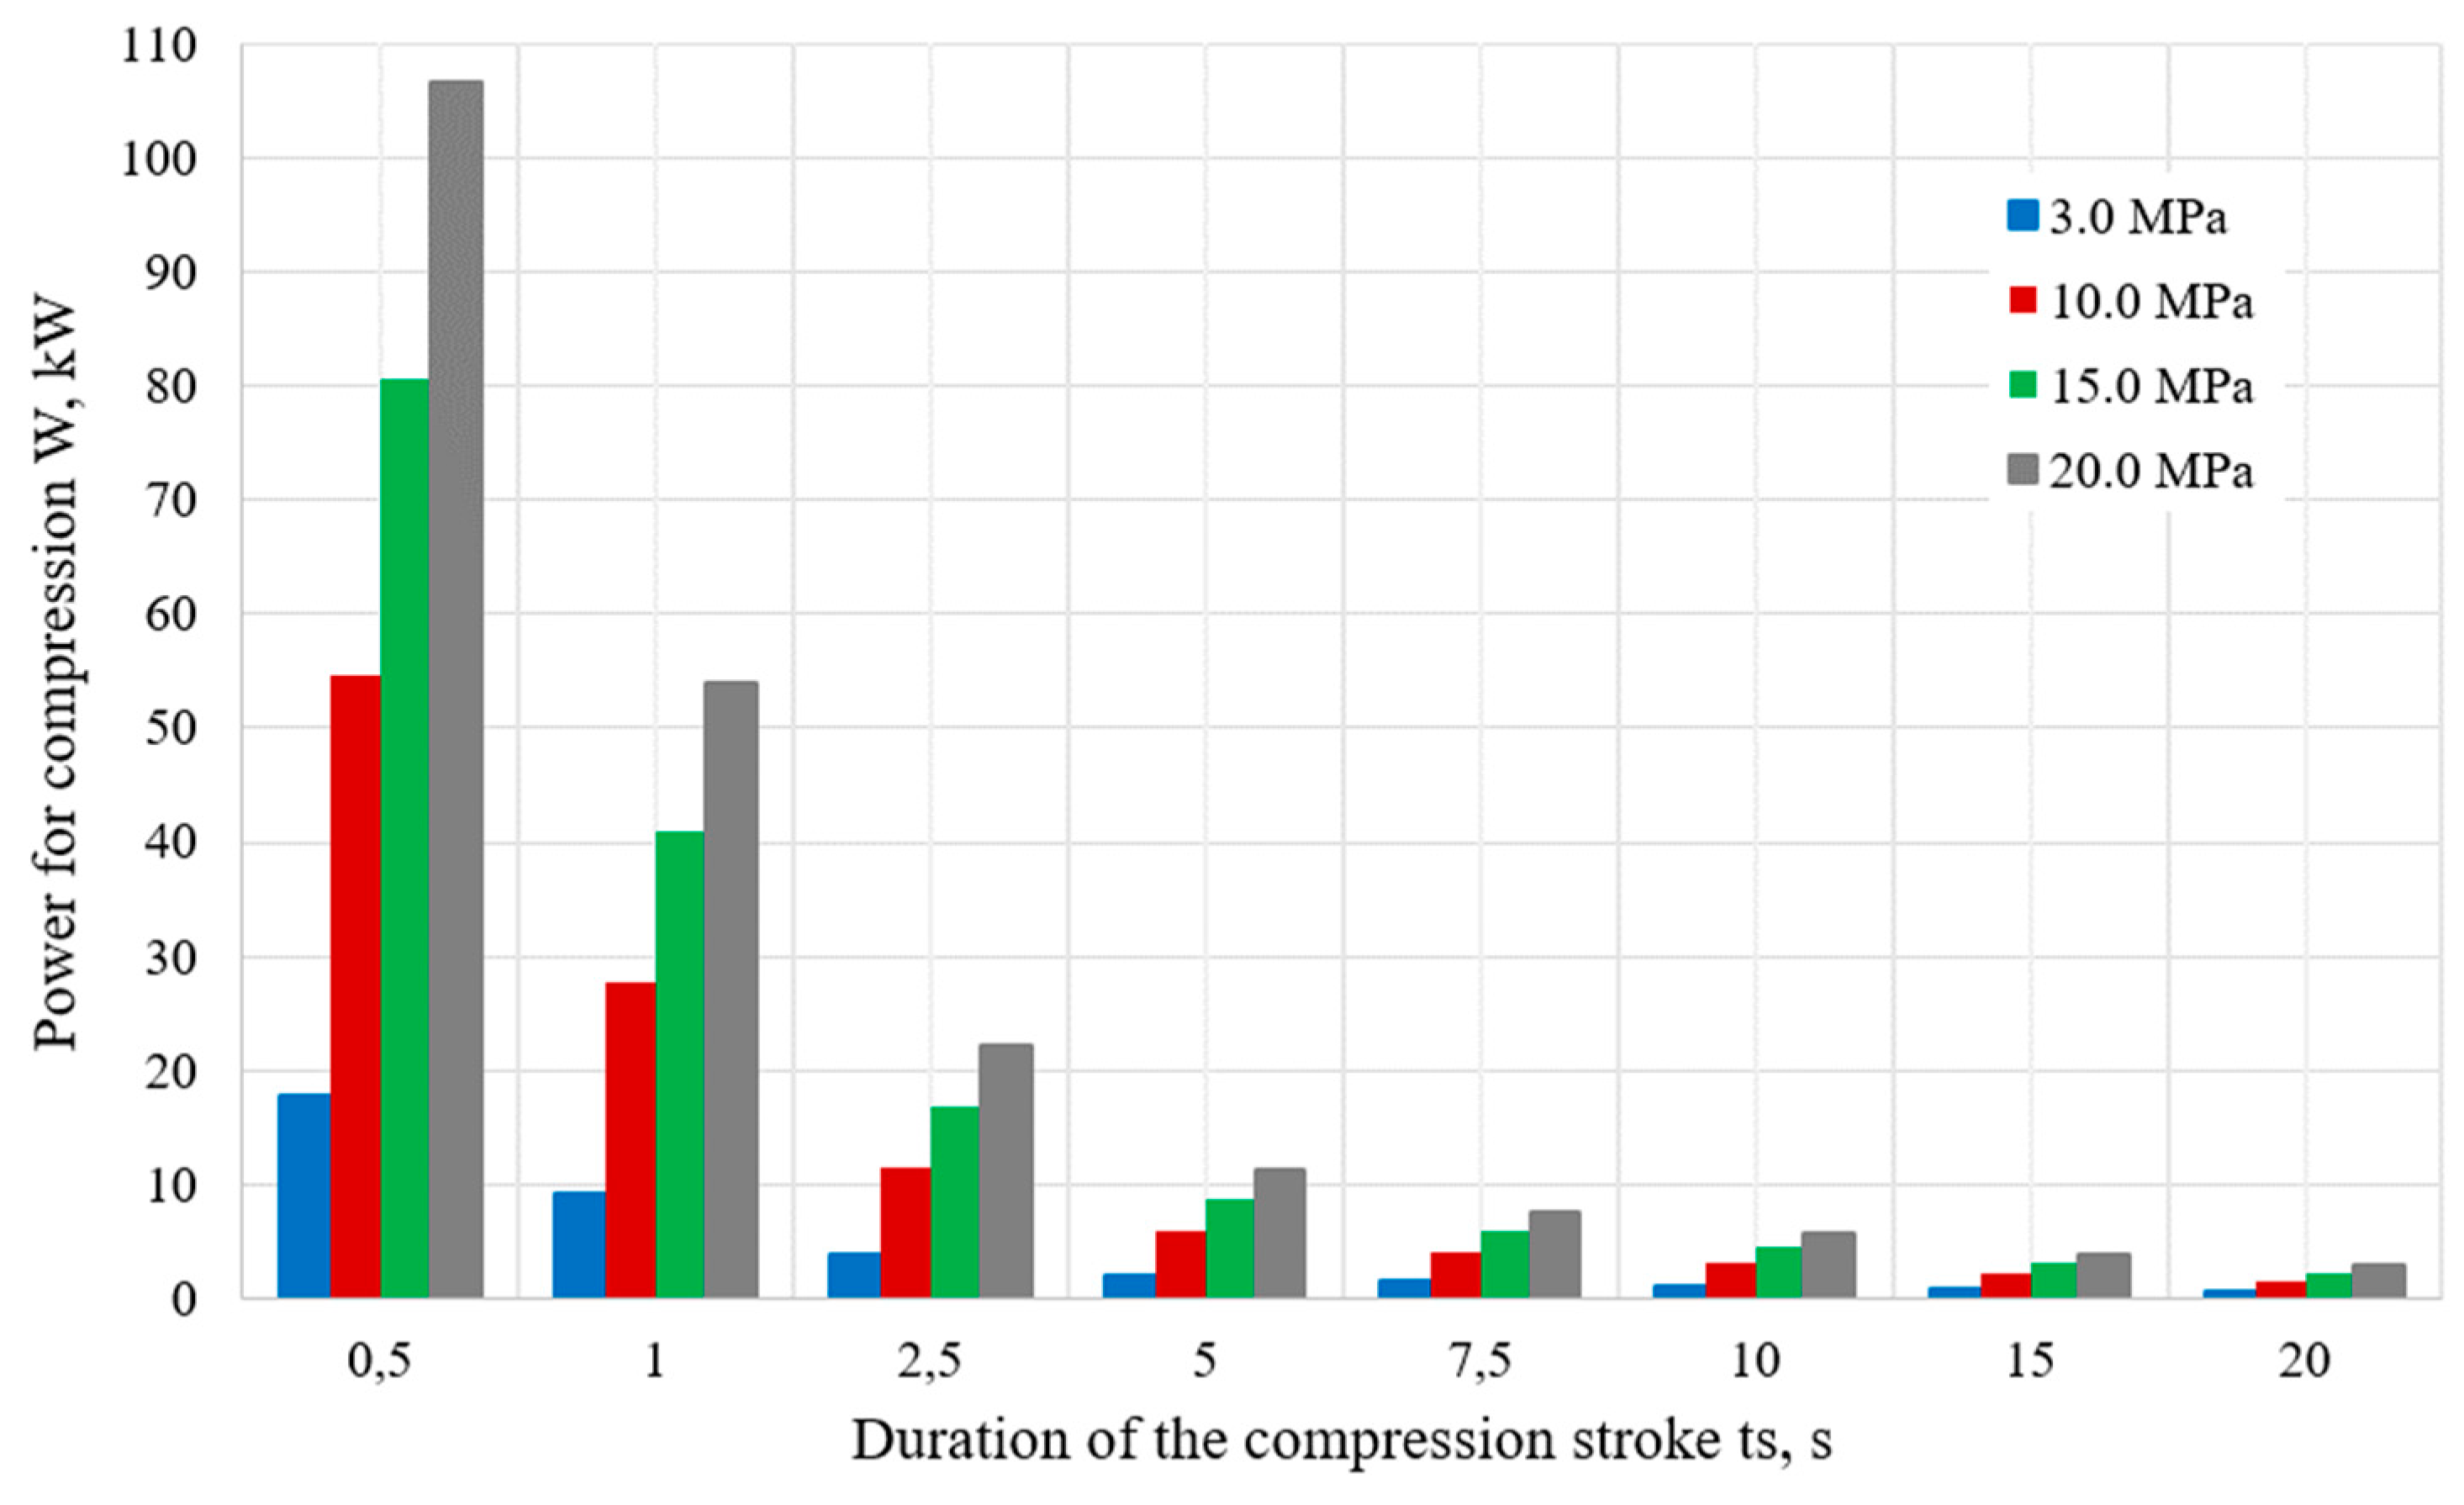

Table 1.
Initial parameters and physical properties of hydrogen, liquid piston and cylinder used in the model.
Table 1.
Initial parameters and physical properties of hydrogen, liquid piston and cylinder used in the model.
|
Initial parameters used in the simulation. |
Initial gas temperature, working fluid, cylinder, and surrounding air: Ti = 300.0 K Initial pressure: P1 = 3.0, 10.0, 15.0 and 20.0 MPa Volume: V = 1.14 L Gas mass in the cylinder: mgas = 2.74 g (at 3.0 MPa); mgas = 9.24 g (at 10.0 MPa); mgas = 13,86 g (at 15.0 MPa), mgas = 18.48 g (at 20.0 MPa) Heat transfer coefficient (cylinder-air): h = 30.0 W/(K∙m2) Cylinder mass: mcylinder = 2400 g Cylinder wall thickness: dwall= 5 mm |
||
| Property and its variable used in COMSOL | Value | Unit | |
| Properties of hydrogen. | Molar mass (M) | 2.016 | g/mol |
| Degrees of freedom (f) | 5.0 | ||
| Ratio of specific heat (γ) | 1.4 | ||
| Heat capacity at constant volume (Cv) | 10307.5 | J/kg∙K | |
| Heat capacity at constant pressure (Cp) | 14429.6 | J/kg∙K | |
| Properties of the liquid piston. | Thermal conductivity | 0.4 | W/(m∙K) |
| Density | 918.0 | kg/m3 | |
| Heat capacity at constant pressure | 2060.0 | J/(kg∙K) | |
| Dynamic viscosity | 130.6 | Pa∙s | |
| Ratio of specific heats | 1.0 | ||
| Properties of the stainless-steel cylinder. | Thermal conductivity | 45.0 | W/(m∙K) |
| Density | 7700.0 | kg/m3 | |
| Heat capacity at constant pressure | 800.0 | J/(kg∙K) | |
Disclaimer/Publisher’s Note: The statements, opinions and data contained in all publications are solely those of the individual author(s) and contributor(s) and not of MDPI and/or the editor(s). MDPI and/or the editor(s) disclaim responsibility for any injury to people or property resulting from any ideas, methods, instructions or products referred to in the content. |
© 2024 by the authors. Licensee MDPI, Basel, Switzerland. This article is an open access article distributed under the terms and conditions of the Creative Commons Attribution (CC BY) license (http://creativecommons.org/licenses/by/4.0/).
Copyright: This open access article is published under a Creative Commons CC BY 4.0 license, which permit the free download, distribution, and reuse, provided that the author and preprint are cited in any reuse.


