
Submitted:
24 September 2025
Posted:
30 September 2025
You are already at the latest version
Abstract
Urban microclimates play a pivotal role in shaping the livability, resilience, and sustainability of rapidly urbanizing cities, particularly those exposed to coastal pressures and high population densities. In Alexandria, Egypt, where intense urbanization coincides with high humidity, the interaction between building form and local climate is increasingly critical. Historically, planning frameworks prioritized land optimization and expansion while overlooking microclimatic implications, yet climate challenges are now urging a transition toward climate-responsive approaches. This study investigates the influence of modifications in building codes specifically building height, plot coverage, and setback regulations on urban microclimatic conditions. Employing ENVI-met v5.7.2, a high-resolution simulation tool, the research analyzed four urban typologies: High-Density Type (El-Mergany Palace, Corniche), Strip Type (El-Naby Daniel Street), Courtyard Type (opposite Casino El-Shatby), and Dot Type (Masaaken El-Zobbat). Key parameters examined included air temperature, relative humidity, wind flow, and thermal comfort indicators such as PMV and Tmrt. Results reveal substantial variation among typologies, with the Courtyard Type demonstrating superior ventilation and lower peak temperatures, while High-Density forms intensified heat retention and restricted airflow. These findings underscore the role of regulatory form in shaping thermal comfort and highlight the potential of microclimate-sensitive planning to advance sustainable, climate-adaptive development in coastal MENA cities.
Keywords:
urban microclimates
; environmental sustainability
; urbanization converge
; urban codes
; outdoor comfort
; MENA cities
1. Introduction
In light of growing climate change and urbanization at a rapid rate, the interaction between the built environment and urban microclimate is a prime concern today in the pursuit of environmental sustainability and urban quality of life. Microclimate, the local atmospheric conditions in a given urban environment, is directly impacted by urban form factors like building density, height, plot coverage, material of construction, and access to open and green space. These are mainly controlled by local building controls and urban policy.
Alexandria, Egypt's second-largest city and principal Mediterranean coastal city, is a difficult and dynamic example for the analysis of this relationship. During the past decades, the city underwent extensive urban growth with successive amendment of building regulations. These regulations, such as increased allowable building heights, plot coverage ratios, and reductions in setback requirements, contribute to modifying the urban fabric with more intensive built-up areas and less open space.
With Alexandria's sea-front site and hot-summer Mediterranean climate, with high solar radiation and high humidity, the effects of poorly planned development or lack of regulations can be particularly detrimental. Impacts like the urban heat island, reduced natural ventilation, and deteriorated outdoor thermal comfort are becoming more apparent, especially in high-density areas. Blocking sea breezes by uncontrolled or excessive developments exacerbates such microclimatic challenges and reduces the city's climate resilience hazard-wise.
Against this backdrop, there is a growing need to investigate the impact of building regulation changes to Alexandria's urban microclimate. This research meets this need by conducting a simulation-based analysis through ENVI-met, a specialized microclimate simulation software. The study examines four different urban neighborhoods in Alexandria, each with its specific morphological and planning characteristics. By simulating various regulatory situations, the research aims to assess the effect of planning decisions on air temperature, wind speed, solar radiation, and thermal comfort, contributing
Urban outdoor spaces are increasingly viewed not only as transit zones but as critical environments for climate resilience, thermal comfort, and public health. In dense coastal cities such as Alexandria, Egypt, microclimatic conditions, particularly temperature, humidity, radiation, and wind, play a significant role in shaping the quality of urban life. While several studies have addressed the influence of green infrastructure, materials, and surface treatments on the local climate, fewer have examined the foundational impact of urban building regulations on outdoor thermal comfort [1].
Urban microclimates are shaped by physical elements such as built mass, surface materials, vegetation, and airflow. Parameters like air temperature, mean radiant temperature (Tmrt), wind speed, and relative humidity interact with human perception to determine thermal comfort in open spaces [2]. The Urban Heat Island (UHI) effect often exacerbates discomfort, especially in cities with dense built environments and inadequate airflow [2].
Urban planning regulations, typically concerned with density control, land use, building heights, and setbacks, often fail to account for their long-term environmental effects. Yet, these regulatory tools fundamentally shape urban morphology, which in turn dictates how heat, air, and solar radiation behave in the built environment. For example, excessive plot coverage and minimal setbacks can obstruct airflow and increase surface heat retention, while well-considered block orientations and façade designs can facilitate natural ventilation and shading [3], [4].
In Alexandria, a city with a layered urban history and diverse architectural patterns, building regulations have evolved over decades with limited integration of climate-responsive principles. As the city faces increasing pressure from rapid urbanization and rising coastal temperatures, there is a growing need to reassess how planning policies influence the microclimatic behavior of urban spaces [5].
This study examines the environmental implications of urban morphology through the lens of regulatory frameworks. It adopts a case-based approach to evaluate how different interpretations of Alexandria’s building codes manifest spatially and climatically.
2. Research Methodology
This research aims to comprehensively explore the relationship between changes in building regulations and their impact on the urban microclimate in Alexandria, Egypt. The research methodology is divided into three phases: theoretical, analytical, and empirical (Figure 1).
2.1. Theoretical Phase
The first phase of the research involves extensive literature review and historical analysis. This involves a chronological analysis of Egyptian building regulations, from the first legislative frameworks to recent amendments, focusing on building height, plot ratio, setbacks, and land use regulations. Concurrently, the research explores the phenomenon of the urban microclimate and its relevance in architectural and urban planning discourse. Target microclimatic variables are identified, e.g., air temperature, solar radiation, wind flow, surface cover, and vegetation cover, and their implications for urban morphology. In theory, this framework stipulates the environmental significance of building codes and sets the stage for additional analysis (Figure 1).
2.2. Analytical Phase
The second phase is comparative analysis between various versions of the building codes in Egypt with specific regard to how developments in regulations impacted urban form. The analysis considers the spatial and morphological implications of building regulation modifications, particularly in high-density urban spaces like Alexandria. The stage also identifies important parameters to be experimented within the simulation phase to help define the scope and depth of the microclimatic analysis (Figure 1).
2.3. Empirical Phase
During the third empirical phase, the study performs a series of simulations of microclimate using ENVI-met (version 5.7.2), which is three-dimensional environmental modeling software. Four districts of the urban environment in Alexandria were selected based on their varying urban pattern, density level, and regulatory history. Each district is simulated on its own conditions as present. Simulated variables include air temperature, wind direction and speed, thermal comfort (PMV index), and relative humidity. The results are then contrasted to assess the influence of variations in urban form, restrained by building constraints, on neighborhood microclimate. This stage provides concrete remarks on the climate implications of regulatory decisions and facilitate recommendations for climate-responsive urban policy (Figure 1).
3. Literature Review
The following table summarizes ten key peer-reviewed studies relevant to the impact of urban morphology, building regulations, and climate-responsive planning on outdoor microclimate. Each entry includes details on the authors, year of publication, methodology, core findings, and whether the study examined a specific location. These studies form the empirical and conceptual foundation for evaluating how spatial and regulatory variables shape environmental outcomes in urban settings (Table 1).

Table 1.
Literature Review summary.
| No. | Study Title | Authors | Year | Methodology | Key Findings | Case Study |
| [1] | Microclimate impact of urban design in hot-arid climates | Johansson et al. | 2021 | Literature review | Found that open, low-rise urban forms with integrated greenery significantly improve outdoor thermal comfort in hot climates. | Global (hot-arid climates) |
| [2] | Urban form and microclimate: A systematic review | Mueller & Zhang | 2020 | Systematic review | Identified building height-to-street width ratios, façade patterns, and greenery as primary drivers of local thermal variation. | Multiple global case studies |
| [3] | Thermal comfort mapping along Alexandria’s coastal edge | El-Shimy & El-Bastawesy | 2023 | GIS-based analysis and thermal mapping | Demonstrated how unregulated high-rise buildings disrupt airflow and increase heat accumulation along Alexandria’s shoreline. | Alexandria, Egypt |
| [4] | Improving the accuracy of ENVI-met for heat stress simulation | Crank & Masson | 2022 | Model calibration and simulation validation | Validated ENVI-met’s ability to simulate urban heat stress accurately, especially in daytime scenarios. | Paris, France |
| [5] | ENVI-met simulation in evaluating thermal comfort in public spaces | Fabbri & Pretelli | 2019 | ENVI-met simulations in Mediterranean settings | Found ENVI-met reliable in predicting thermal conditions in semi-enclosed and open urban environments. | Mediterranean cities |
| [6] | Revising urban planning codes for climate resilience | Li et al. | 2021 | Global policy analysis | Concluded that updated planning codes can measurably improve urban ventilation and solar exposure, especially in compact cities. | Global |
| [7] | Coastal urban morphology and its impact on microclimate | Gao et al. | 2020 | Field measurements + CFD simulations | Concluded that coastal block structures strongly affect wind patterns, humidity levels, and human comfort. | Coastal cities in China |
| [8] | Climate-responsive urban design in Alexandria | Hamed & Elsharkawy | 2021 | Urban planning and microclimate analysis | Highlighted Alexandria’s lack of regulatory alignment with thermal comfort and proposed planning solutions. | Alexandria, Egypt |
| [9] | Thermal comfort and psychological adaptation in urban space design | Nikolopoulou & Steemers | 2003 | Field-based behavioral surveys | Emphasized the role of user adaptation and expectations in influencing perceived comfort in outdoor settings. | United Kingdom |
| [10] | Regulating urban form to mitigate urban heat islands | Santamouris | 2015 | Multi-city empirical analysis | Asserted that mitigation of the Urban Heat Island effect requires coordinated spatial and regulatory interventions. | Multiple cities |
This table supports the research rationale and justifies the methodological and analytical approaches adopted in the following sections. It demonstrates that a wide array of studies, from simulation-based evaluations to empirical thermal mapping in Alexandria, support the argument that spatial configuration and planning codes have measurable impacts on urban climate. The convergence of evidence from different geographic regions and methodologies (e.g., GIS analysis, ENVI-met simulations, policy synthesis) strengthens the relevance of this research in Alexandria's context. Together, these references provide a robust scholarly basis for assessing how built form and regulations shape microclimatic behavior and human comfort in dense coastal cities (table 1)
4. Microclimate Concept
Microclimate is a term used to describe local climatic conditions that prevail in a small area or limited space, and that differ from the climatic conditions prevailing in a larger region or surrounding area. These conditions are influenced by several factors, such as terrain, vegetation, buildings, human factors, and local activities [11]. The microclimate is a local set of meteorological conditions, where they may differ from surrounding areas [12].
4.1. Methods of Measuring Microclimate [12]
Local climate is measured through a number of climatic variables that reflect the micro-environmental characteristics of the site under study. According to him, these variables include:
- ▪ Ambient temperature: This is the air temperature measured at a standard height above the ground.
- ▪ Surface temperature: This includes the temperature of the ground, buildings, and vegetation, and reflects the interaction between materials and climatic factors.
- ▪ Wind speed: This is measured at a standard height, as it has a direct impact on ventilation and heat distribution.
- ▪ Relative humidity: This is measured at the same height as the temperature measurement, and represents the percentage of water vapor in the air compared to the maximum amount the air can hold at a given temperature.
- ▪ Solar radiation and duration of sunlight: This includes measuring the amount of solar radiation a site is exposed to, as well as determining the timing, location, and duration of sunlight exposure, which is a factor influencing thermal comfort and the thermal characteristics of a site.
These variables are essential tools for understanding the impact of the built environment and natural factors on the thermal comfort of users and are therefore used as a reference in climate analysis of urban sites.
4.2. Types of Local Climates [13]
Table 2.
Types of Local Climates [13].
Table 2.
Types of Local Climates [13].
| Types of Local Climates | Basic Characteristics |
| High-Altitude Areas | Temperatures decrease with altitude. The higher the altitude above sea level, the lower the temperature. These areas are also more susceptible to winds, and clouds often form due to upward air movement. |
| Coastal Areas | Areas close to the sea are affected by the temperatures of the sea and land. During the day, a cool sea breeze blows over land, and at night, the opposite occurs: a warm land breeze over the sea. The result is a moderate temperature that doesn't change quickly. |
| Forests | The presence of trees provides shade and makes the air relatively cooler, and also increases the humidity in the air. Forests reduce wind speed, and their effect varies depending on the type and density of trees. |
| Urban Areas (Cities) | Cities are typically hotter than the countryside because materials such as cement and asphalt absorb and store heat. This makes the temperature higher, causing a phenomenon known as the urban heat island. |
4.3. Factors That Create Micro-Climates [14]
4.3.1. Geological Formations
In mountainous regions, during the day the slopes get heated up and air moves upslope and to fill the resulting gap the air from the valley blows up the valley. This wind is known as the valley breeze. During the night the slopes get cooled and the dense air descends into the valley as the mountain wind. The cool air, of the high plateaus and ice fields draining into the valley is called katabatic wind.
Another type of warm wind (katabatic wind) occurs on the leeward side of the mountain ranges. The moisture in these winds, while crossing the mountain ranges condense and precipitate. When it descends down the leeward side of the slope the dry air gets warmed up by adiabatic process. This dry air may melt the snow in a short time.
When air reaches the mountains, it is forced to rise over this barrier. As the air moves up the windward side of a mountain, it cools, and the volume decreases. As a result, humidity increases and orographic clouds and precipitation can develop. When the air descends the leeward side, it warms and is drier because the moisture in the air was wrung out during the ascent. This area with a lack of moisture is known as a rain shadow (Figure 2).
4.3.2. Surface Water
The land and sea absorb and transfer heat differently. During the day the land heats up faster and becomes warmer than the sea. Therefore, over the land the air rises giving rise to a low-pressure area, whereas the sea is relatively cool and the pressure over sea is relatively high. Thus, pressure gradient from sea to land is created and the wind blows from the sea to the land as the sea breeze. In the night the reversal of condition takes place. The land loses heat faster and is cooler than the sea. The pressure gradient is from the land to the sea and hence land breeze results (Figure 2).
4.3.3. Prevailing Winds
Are winds that blow from the same direction most days of the year, and they affect microclimate depending on their source. If they come from the sea, they are humid, moderate the weather, and may cause rain. If they come from the desert, they are dry and hot, leading to higher temperatures (Figure 2).
4.3.4. Vegetation
Trees act as windbreaks, reducing wind speed and redirecting its force. This helps prevent soil erosion, which can damage crops. Additionally, trees help reduce the likelihood of buildings and other structures being damaged by strong winds (Figure 2).
Trees help regulate temperature and humidity. By providing shade and releasing moisture into the air through transpiration, trees help cool areas exposed to strong winds and high temperatures.
Transpiration: the process of water movement through a plant and its evaporation from aerial parts, such as leaves, stems and flowers. It is a passive process that requires no energy expense by the plant (Figure 2).
4.3.5. Surface Reflection
Different types of surface materials, such as asphalt, concrete, and water, can absorb and reflect heat differently, resulting in differences in temperature and humidity levels. For example, urban areas with high concentrations of concrete and asphalt tend to be hotter than rural areas with natural vegetation and roofs (Figure 2).
4.3.6. Human Activity
Human activities, such as construction, transportation and industrial processes, can generate heat, pollutants and other emissions that affect the local climate of the region. Urban areas with high levels of human activity tend to have higher temperatures and lower air quality than rural areas (Figure 2).
4.4. The Impact of Urban and Natural Factors on Local Climate
An urban heat island is an urban or metropolitan area that is significantly warmer than its surrounding rural areas due to modification of land surfaces and human activities. The term "Urban Heat Island Effect" refers to the phenomenon resulting in the temperature difference especially at night [15].
Figure 3.
Typical Urban Heat Island Profile [15].
Figure 3.
Typical Urban Heat Island Profile [15].
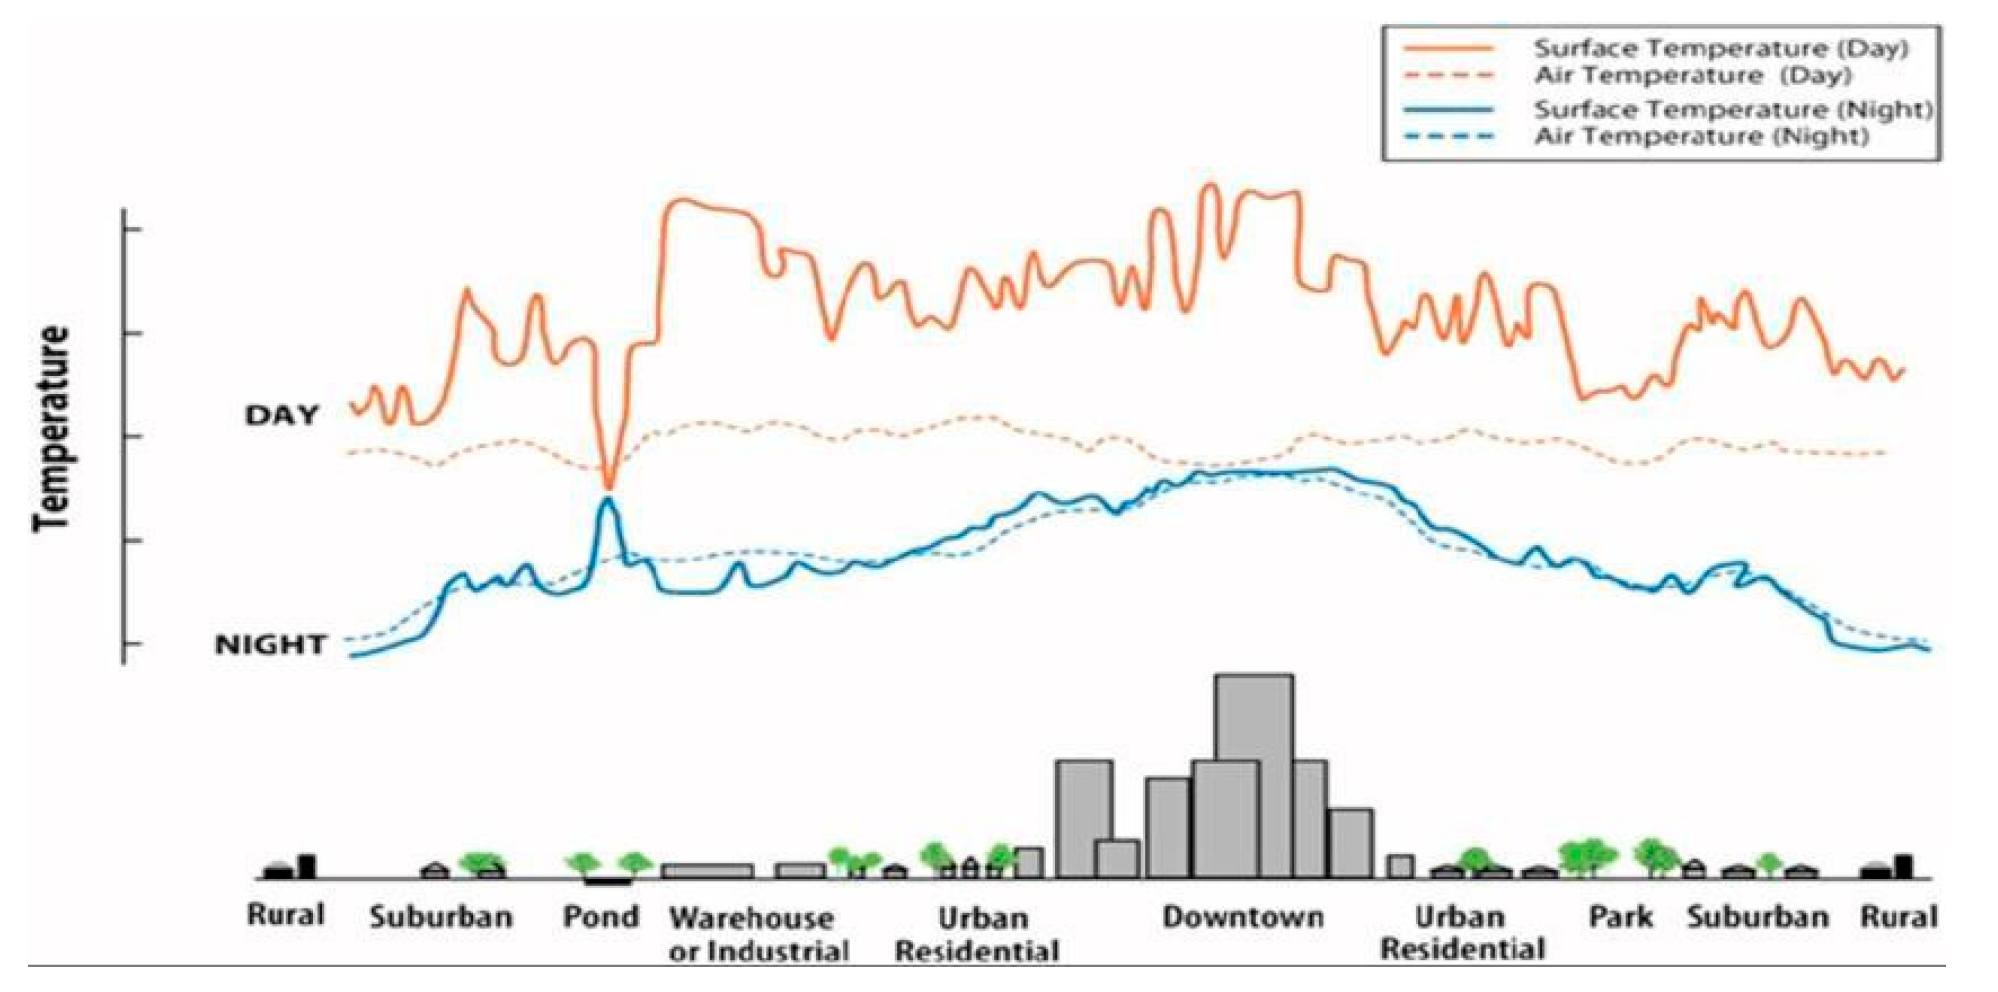
Figure 4.
Urban structure, landscape, land-cover and metabolism contribute UHI effect in cities [15].
Figure 4.
Urban structure, landscape, land-cover and metabolism contribute UHI effect in cities [15].
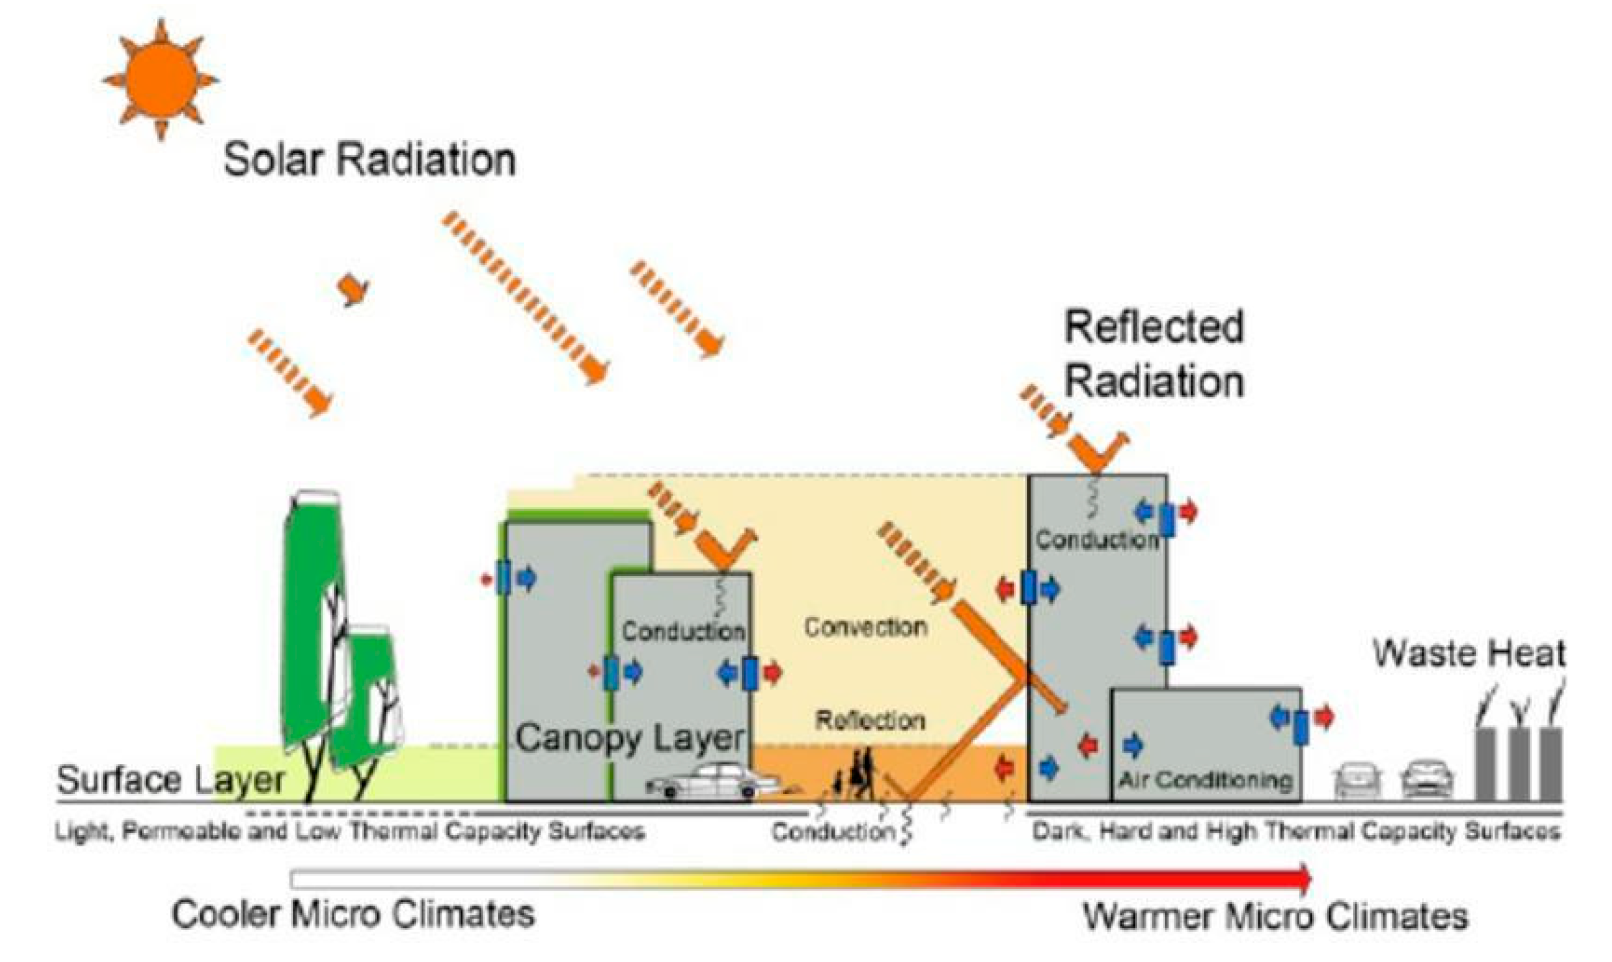
Hot-climate cities are increasingly problematic due to congestion, pollution and deteriorating microclimates, not least growing urban heat island (UHI) effects. This statement aptly reflects the current environmental challenges facing Mediterranean coastal cities like Alexandria, where rapid urban growth, evolving building regulations, and a dense built environment have collectively contributed to rising surface temperatures and degraded outdoor thermal comfort [15].
This image reflects a comparative analysis of the impact of a range of urban and natural factors on local temperature within urban areas. Data indicate that factors associated with the built environment, such as city shape, building density and height, and urban planning (city geometry), lead to higher temperatures due to restricted air movement and increased absorption of solar radiation. Human activities, particularly those related to domestic and industrial heating (heat from human activities), also represent an additional source of heat within the urban environment (Figure 5).
Figure 5.
Shows the Impact of Urban and Natural Factors on Local Climate. adapted by [16].
Figure 5.
Shows the Impact of Urban and Natural Factors on Local Climate. adapted by [16].
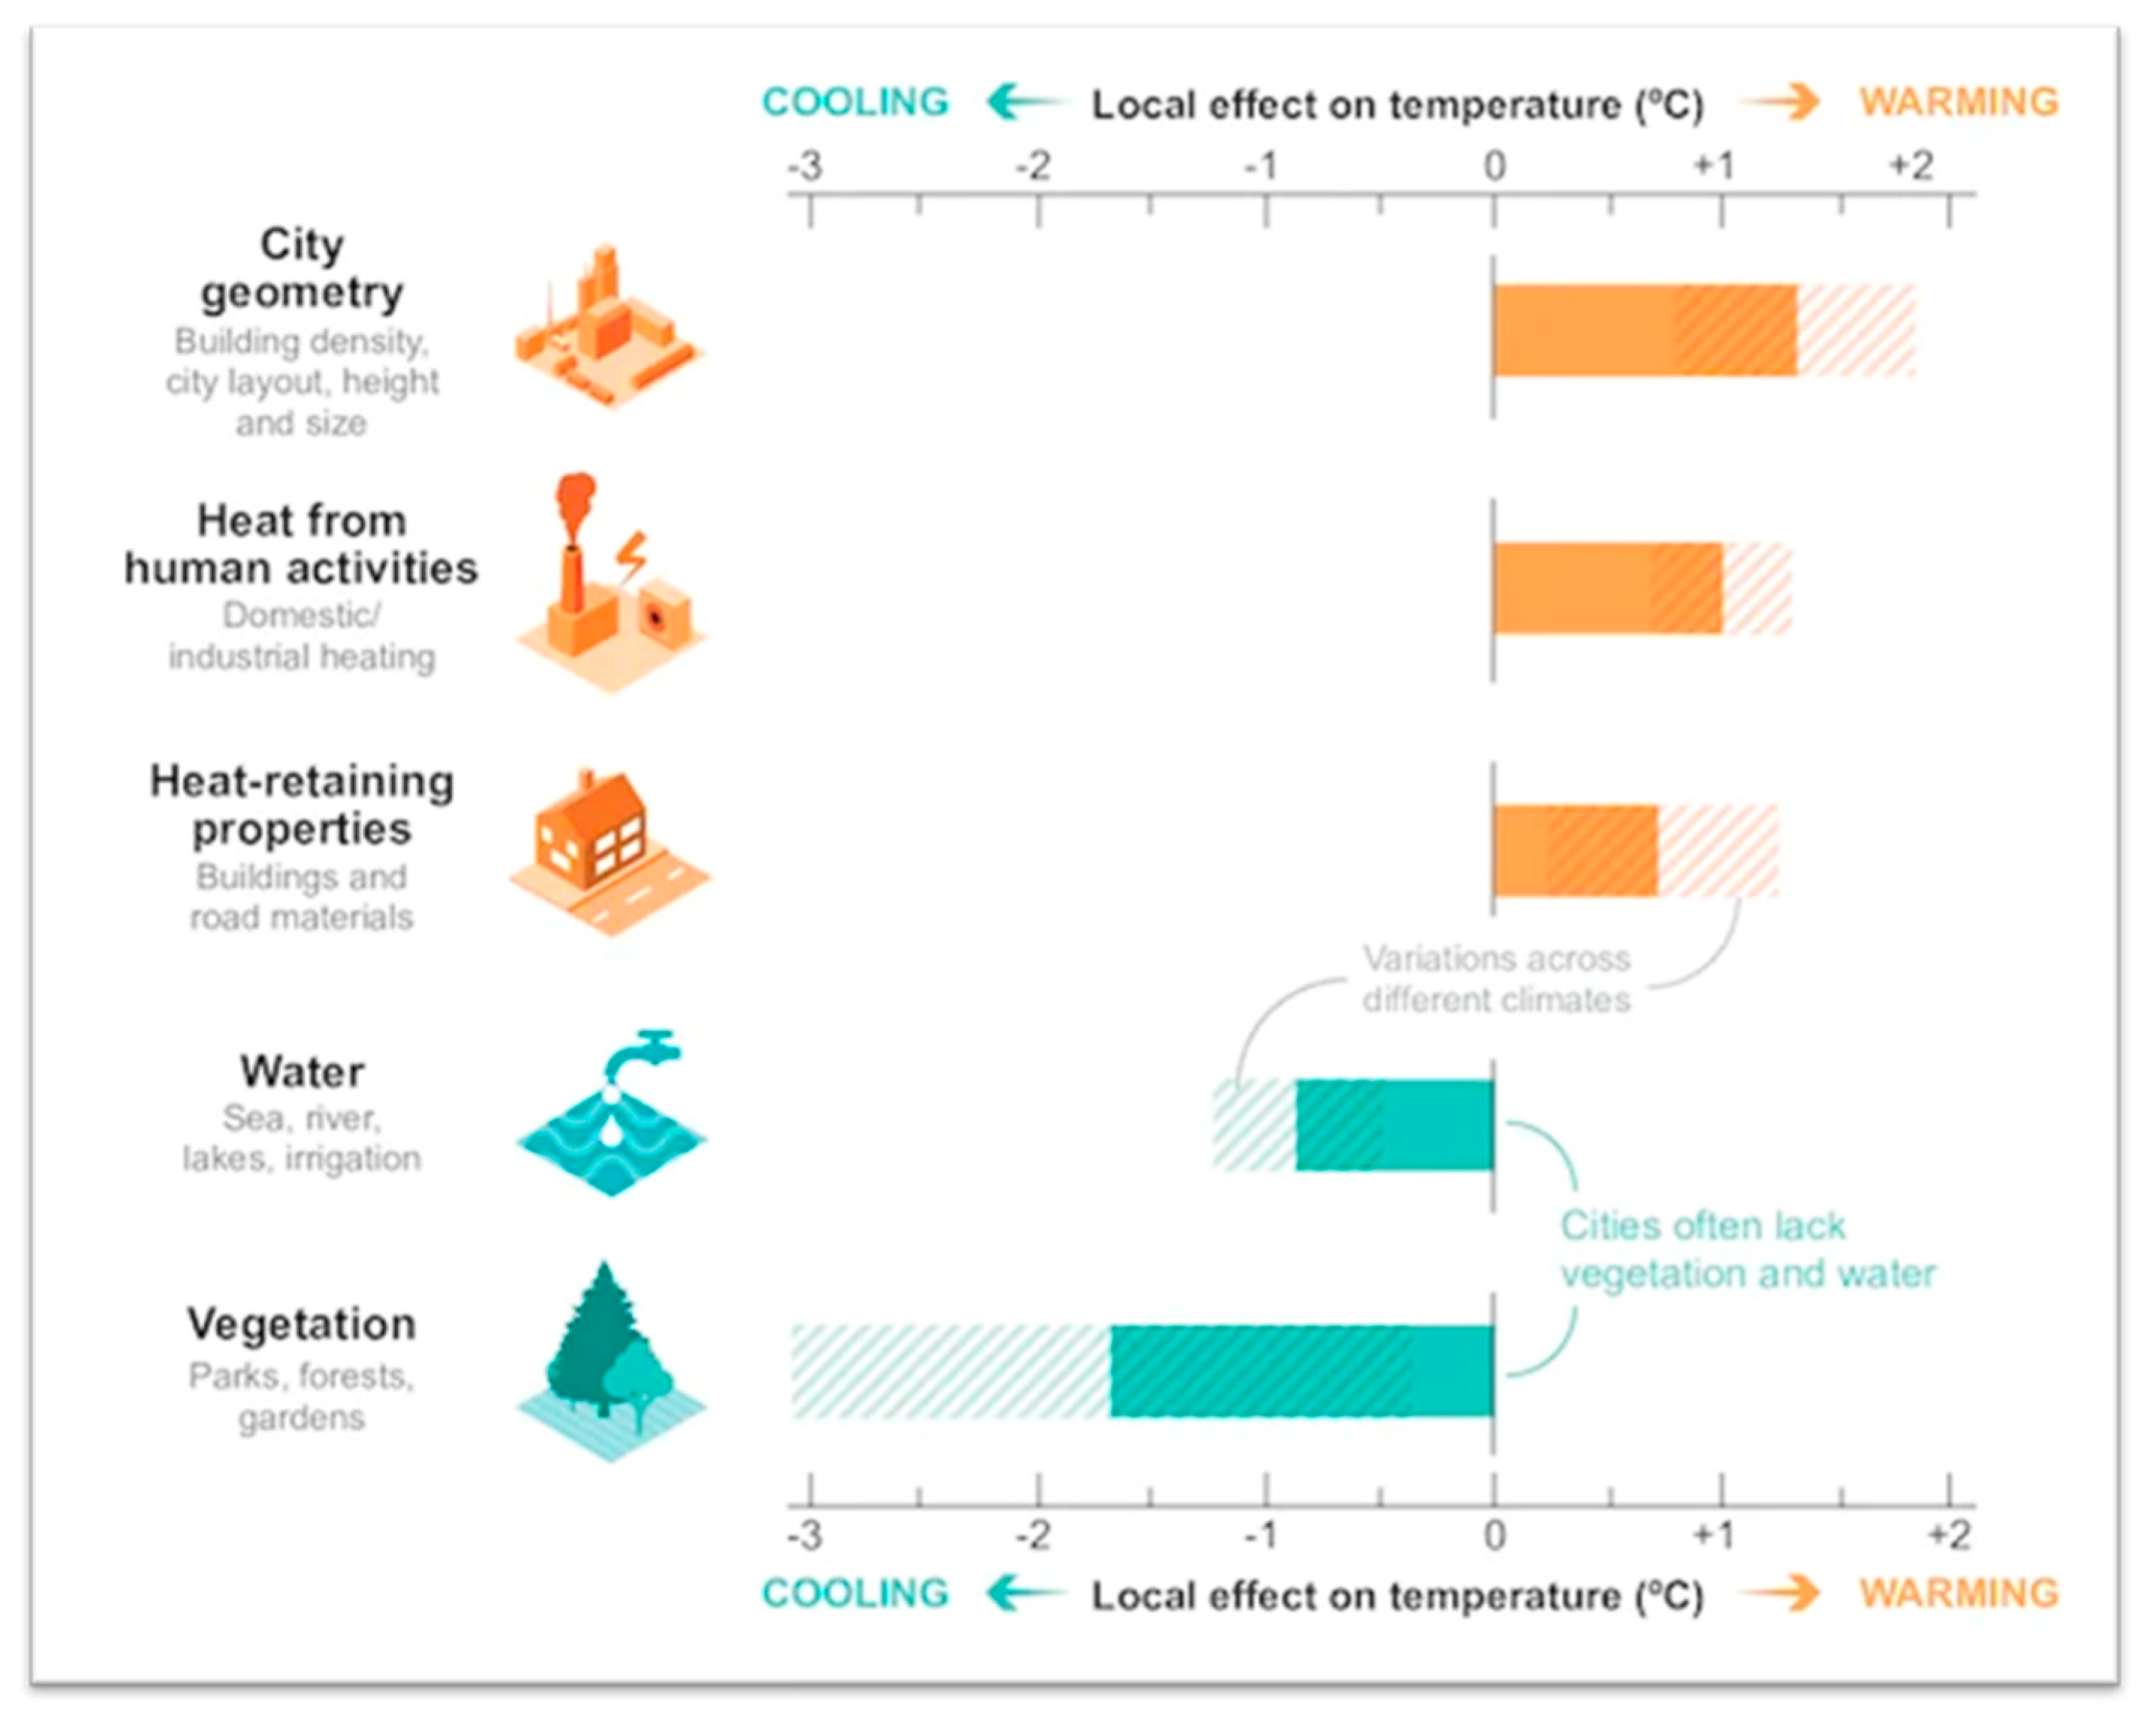
The construction materials used in buildings and roads, which have high heat-retaining properties, also contribute to the accumulation of heat within cities, especially at night. Conversely, natural factors such as water bodies and vegetation contribute to lowering temperatures through evaporation, transpiration, and shade. However, the low availability of these elements in modern cities reduces their cooling effectiveness, exacerbating the urban heat island phenomenon (Figure 5).
These data highlight the importance of integrating environmental and natural solutions into urban planning to mitigate the effects of global warming and improve the quality of the urban environment.
4.5. Importance of Understanding Local Climates in Architecture [17]
Table 3.
shows the Importance of Understanding Local Climates in Architecture.
| Points | Explanation |
| Improving Thermal Comfort |
|
| Increasing Energy Efficiency |
|
| Promoting Environmental Sustainability |
|
| Improving the building's resistance to climate change |
|
| Improving Aesthetics and Integration with the Environment |
|
4.6. Design Strategies for Local Climates [17]
Table 4.
shows the Design Strategies for Local Climates.
| Types of Local Climates | Basic Characteristics |
| High-Altitude Areas | Temperatures decrease with altitude. The higher the altitude above sea level, the lower the temperature. These areas are also more susceptible to winds, and clouds often form due to upward air movement. |
| Coastal Areas | Areas close to the sea are affected by the temperatures of the sea and land. During the day, a cool sea breeze blows over land, and at night, the opposite occurs: a warm land breeze over the sea. The result is a moderate temperature that doesn't change quickly. |
| Forests | The presence of trees provides shade and makes the air relatively cooler, and also increases the humidity in the air. Forests reduce wind speed, and their effect varies depending on the type and density of trees. |
| Urban Areas (Cities) | Cities are typically hotter than the countryside because materials such as cement and asphalt absorb and store heat. This makes the temperature higher, causing a phenomenon known as the urban heat island. |
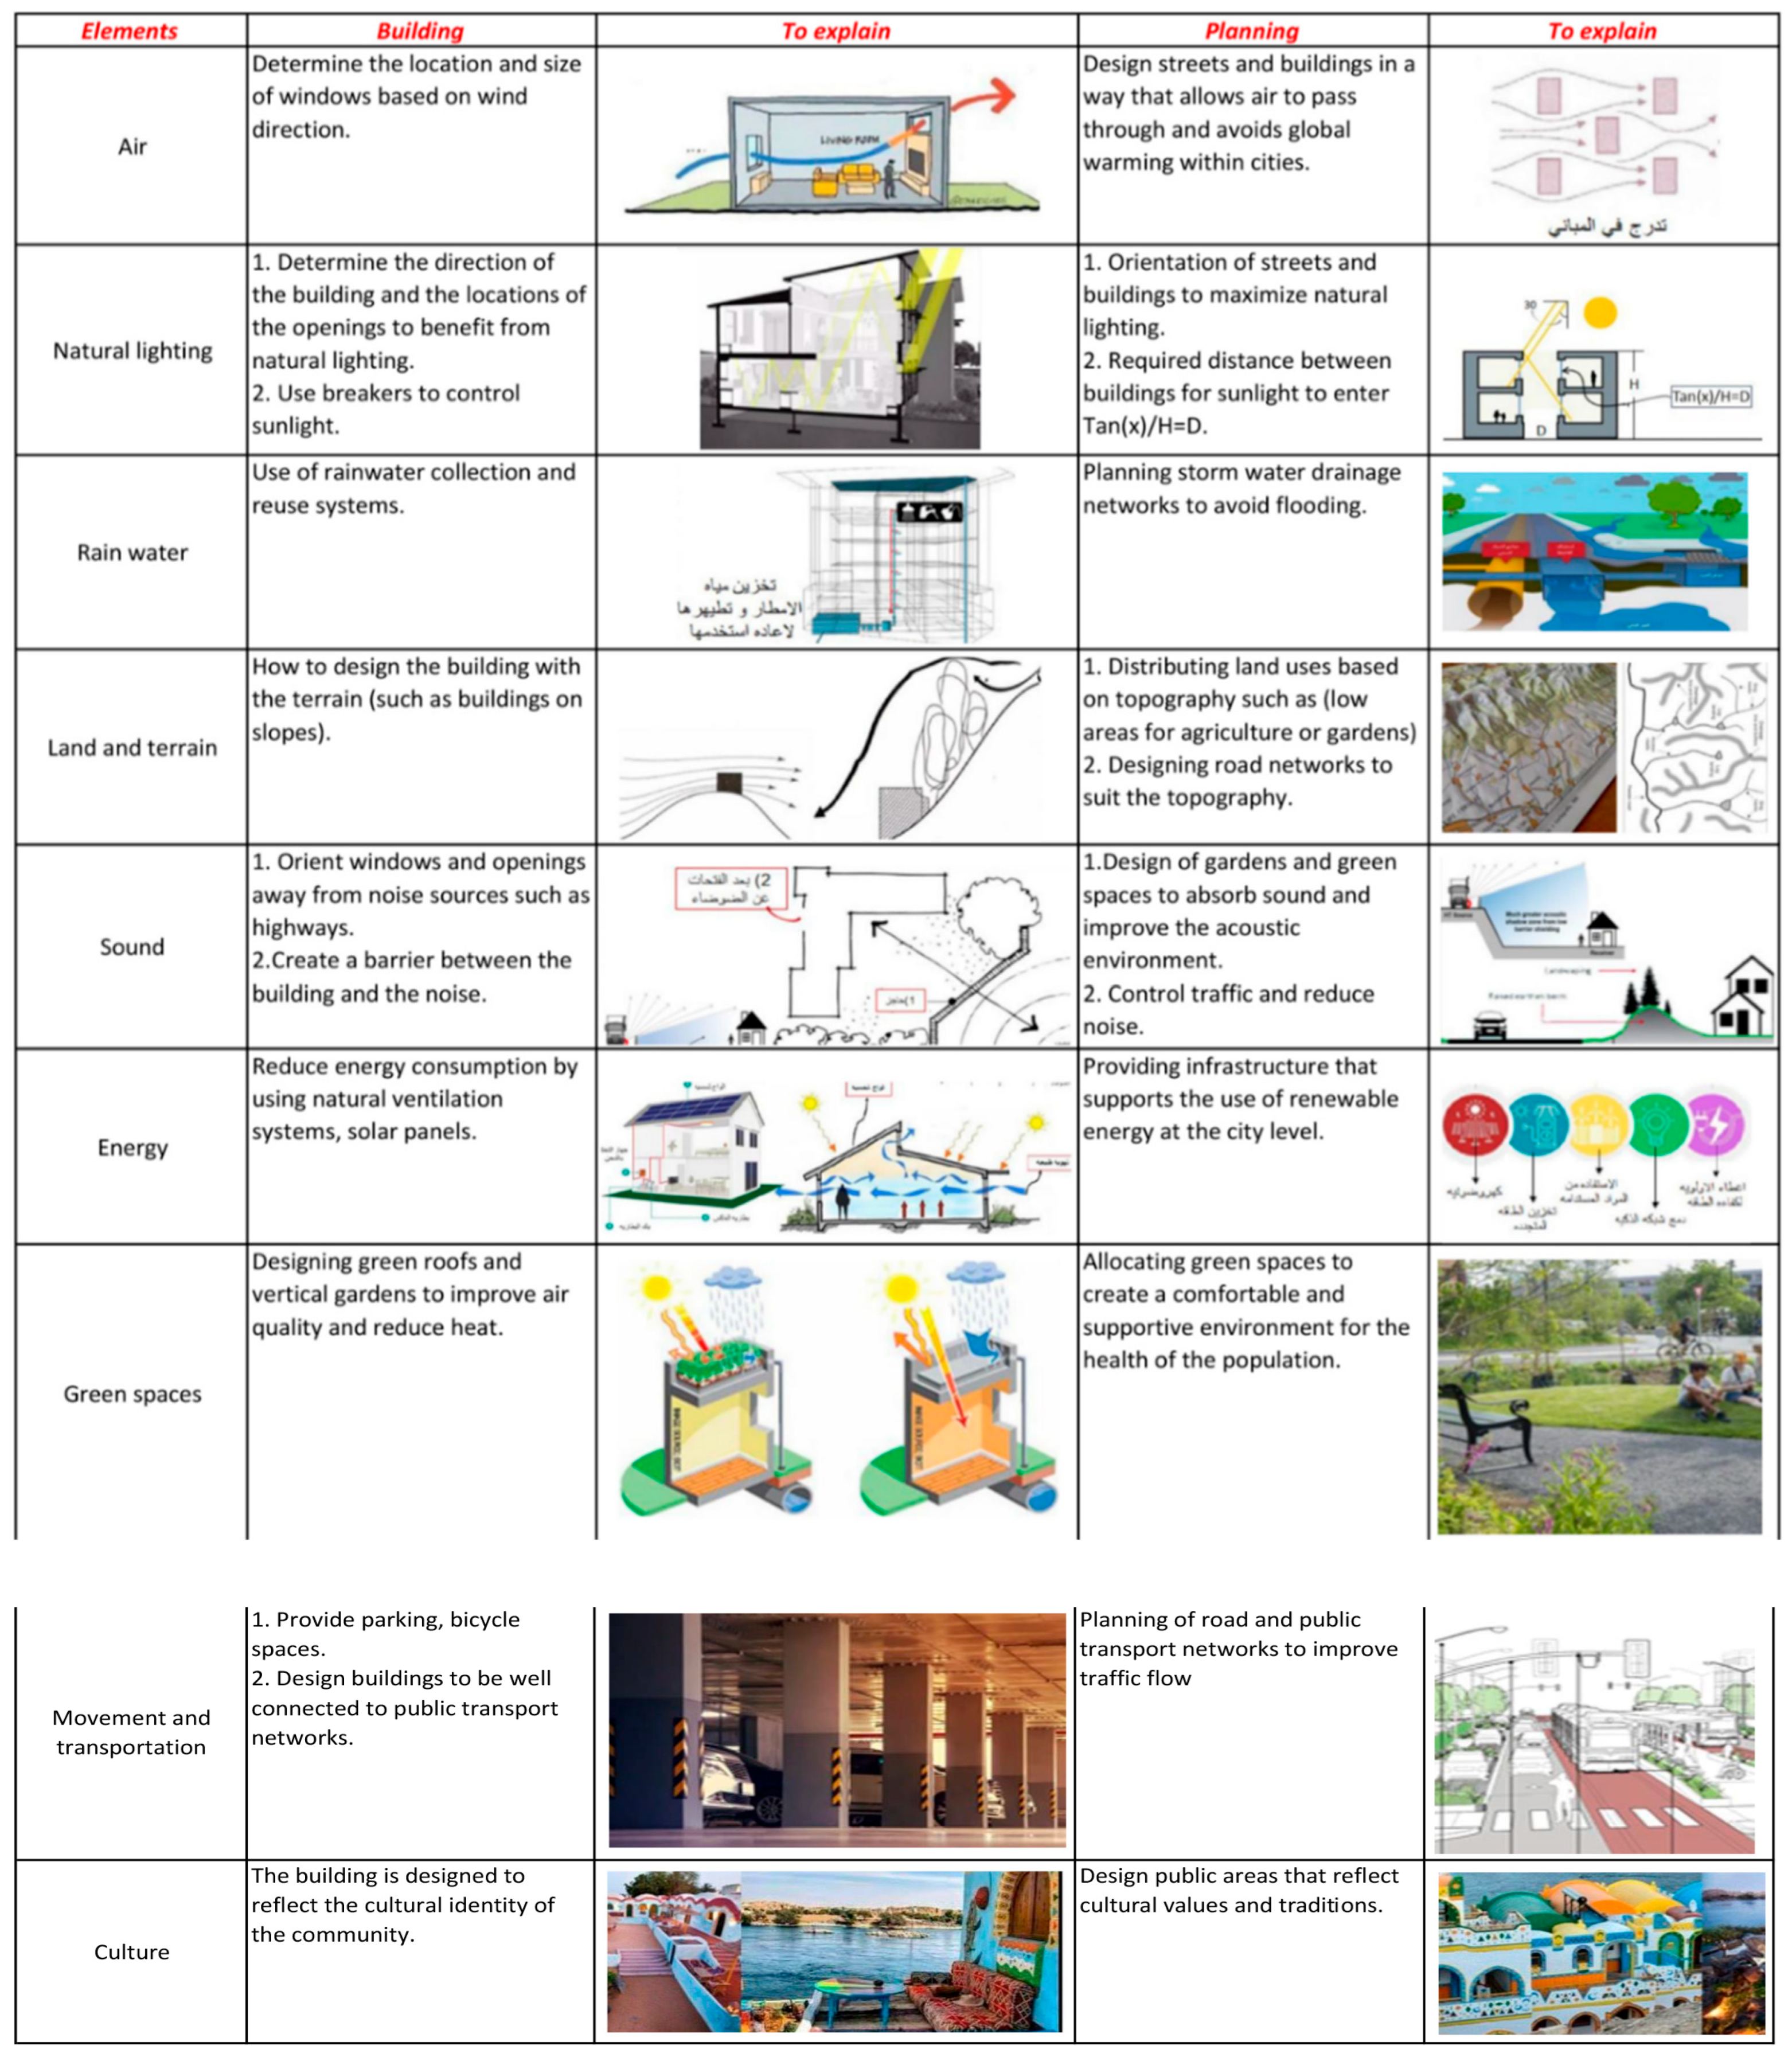
4.7. Environmental Considerations in Building Design and Urban Planning
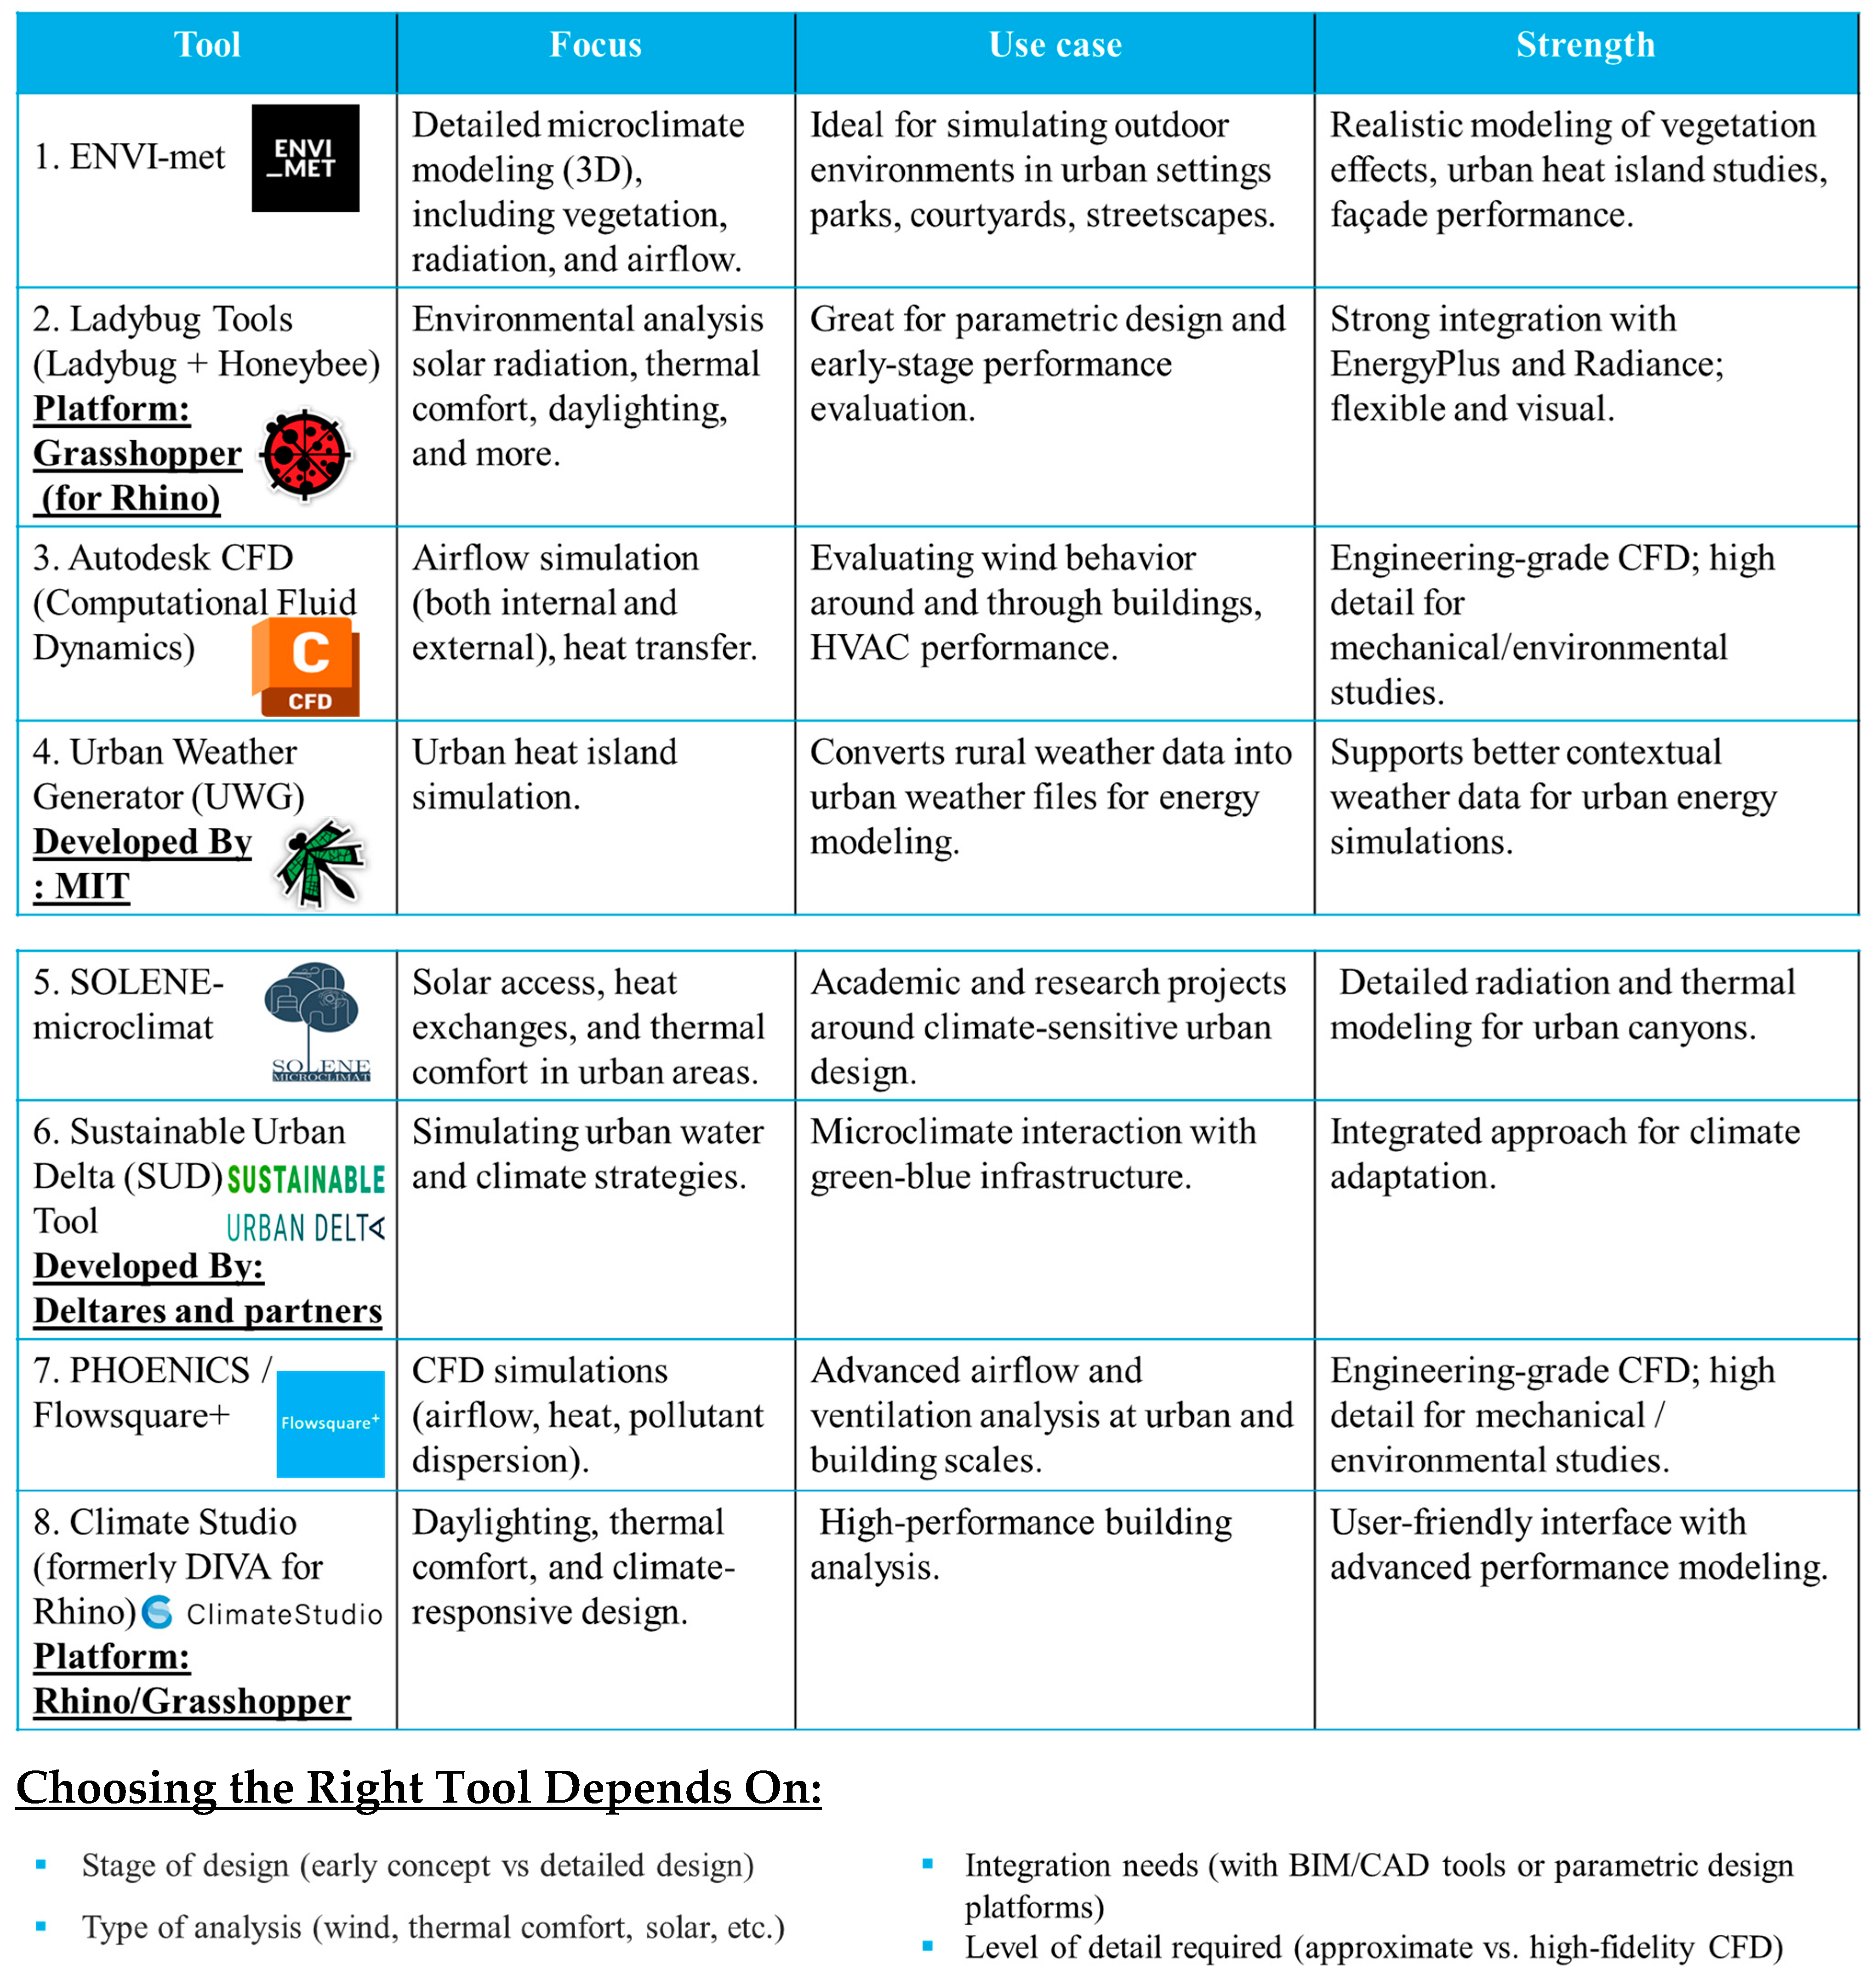
4.8. Microclimate Simulation Tools for Architecture & Urban Design
The abbreviations for simulated variables are Ts: surface temperature, Ta: air temperature, Q: long- and short-wave radiation, Tmrt: mean radiant temperature, Ws: wind speed, and Wd: wind direction. For the bioclimatic indices PT: Perceived Temperature, UTCI: Universal Thermal Climate Index, PET: Physiological Equivalent Temperature, mPET: modified Physiological Equivalent Temperature, SET: Standard Effective Temperature, and PMV: Predicted Mean Vote (Table 6).
Table 6.
Review matrix of user-friendly models adapted from [18].
Table 6.
Review matrix of user-friendly models adapted from [18].
| No. | Name |
Simulated Variables |
Bioclimatic Indices/Variables |
Ventilation Aspects |
Plants |
Supported Data Formats |
Linkage (to GIS/CAD) |
Pay- /Freeware |
| 1 | ADMS Temperature and Humidity model |
Ts, Ta, Q, Tmrt |
- | X | X | .csv, specifc | GIS | Pay |
| 2 | advanced SkyHelios model |
Ws, Wd, Q, Tmrt | PT, UTCI, PET | X | X | grid/vector | GIS/CAD | Free |
| 3 | ANSYS FLUENT | Ta, Ts, Q, Ws, Wd, others |
- | X | X | specific formats |
CAD | Pay |
| 4 | ENVI-met | Ta, Ts, Q, Ws, Wd, others |
PMV, UTCI, PET, SET |
X | X | specific formats, Net-CDF-Output possible |
CAD/GIS | Pay |
| 5 | RayMan | Q, Tmrt, Ts | PET, SET, PMV, mPET, UTCI, PT |
X | X | .txt, specific formats |
GIS | Free |
| 6 | SOLWEIG | Q, Tmrt | - | X | .shp, .txt, .tif | GIS | Free | |
| 7 | TownScope | Q | Sweat rate, sweatevaporation, skin wetness |
X | X | specific formats |
CAD | Pay |
| 8 | Urban Multi-scale Environmental Predictor (UMEP) |
Ta, Q, Tmrt, T | - | X | .shp, .txt, .tif | GIS | Free |
Table 7.
Overview of available support and training material for the user-friendly models. X indicated that the information is available adapted from [18].
Table 7.
Overview of available support and training material for the user-friendly models. X indicated that the information is available adapted from [18].
| No. | Name | Manual | Forum / Support | Tutorials, Videos |
Training Courses |
Website |
| 1 | ADMS Temperature and Humidity model |
x | X | https://www.cerc.co.uk/environmental-software/ADMS-Urban-model.html | ||
| 2 | advanced SkyHelios model |
x | x | https://www.urbanclimate.net/skyhelios/ | ||
| 3 | ANSYS FLUENT | x | x | x | https://www.ansys.com/training-center/ | |
| 4 | ENVI-met | x | x | X | X | https://www.envi-met.com |
| 5 | RayMan | x | x | X | X | https://www.urbanclimate.net/rayman/ |
| 6 | SOLWEIG | x | x | X | X |
https://umep-docs.readthedocs.io/projects/tutorial/en/latest/Tutorials/ IntroductionToSolweig.html |
| 7 | TownScope | x | x | X | X | www.townscope.com |
| 8 | Urban Multi-scale Environmental Predictor (UMEP) |
x | x | x | X | https://umep-docs.readthedocs.io/en/latest/ |
Table 8.
Capability Comparison Chart of Microclimate Prediction Tools (*x indicates the presence of the parameter) adapted from [19].
Table 8.
Capability Comparison Chart of Microclimate Prediction Tools (*x indicates the presence of the parameter) adapted from [19].
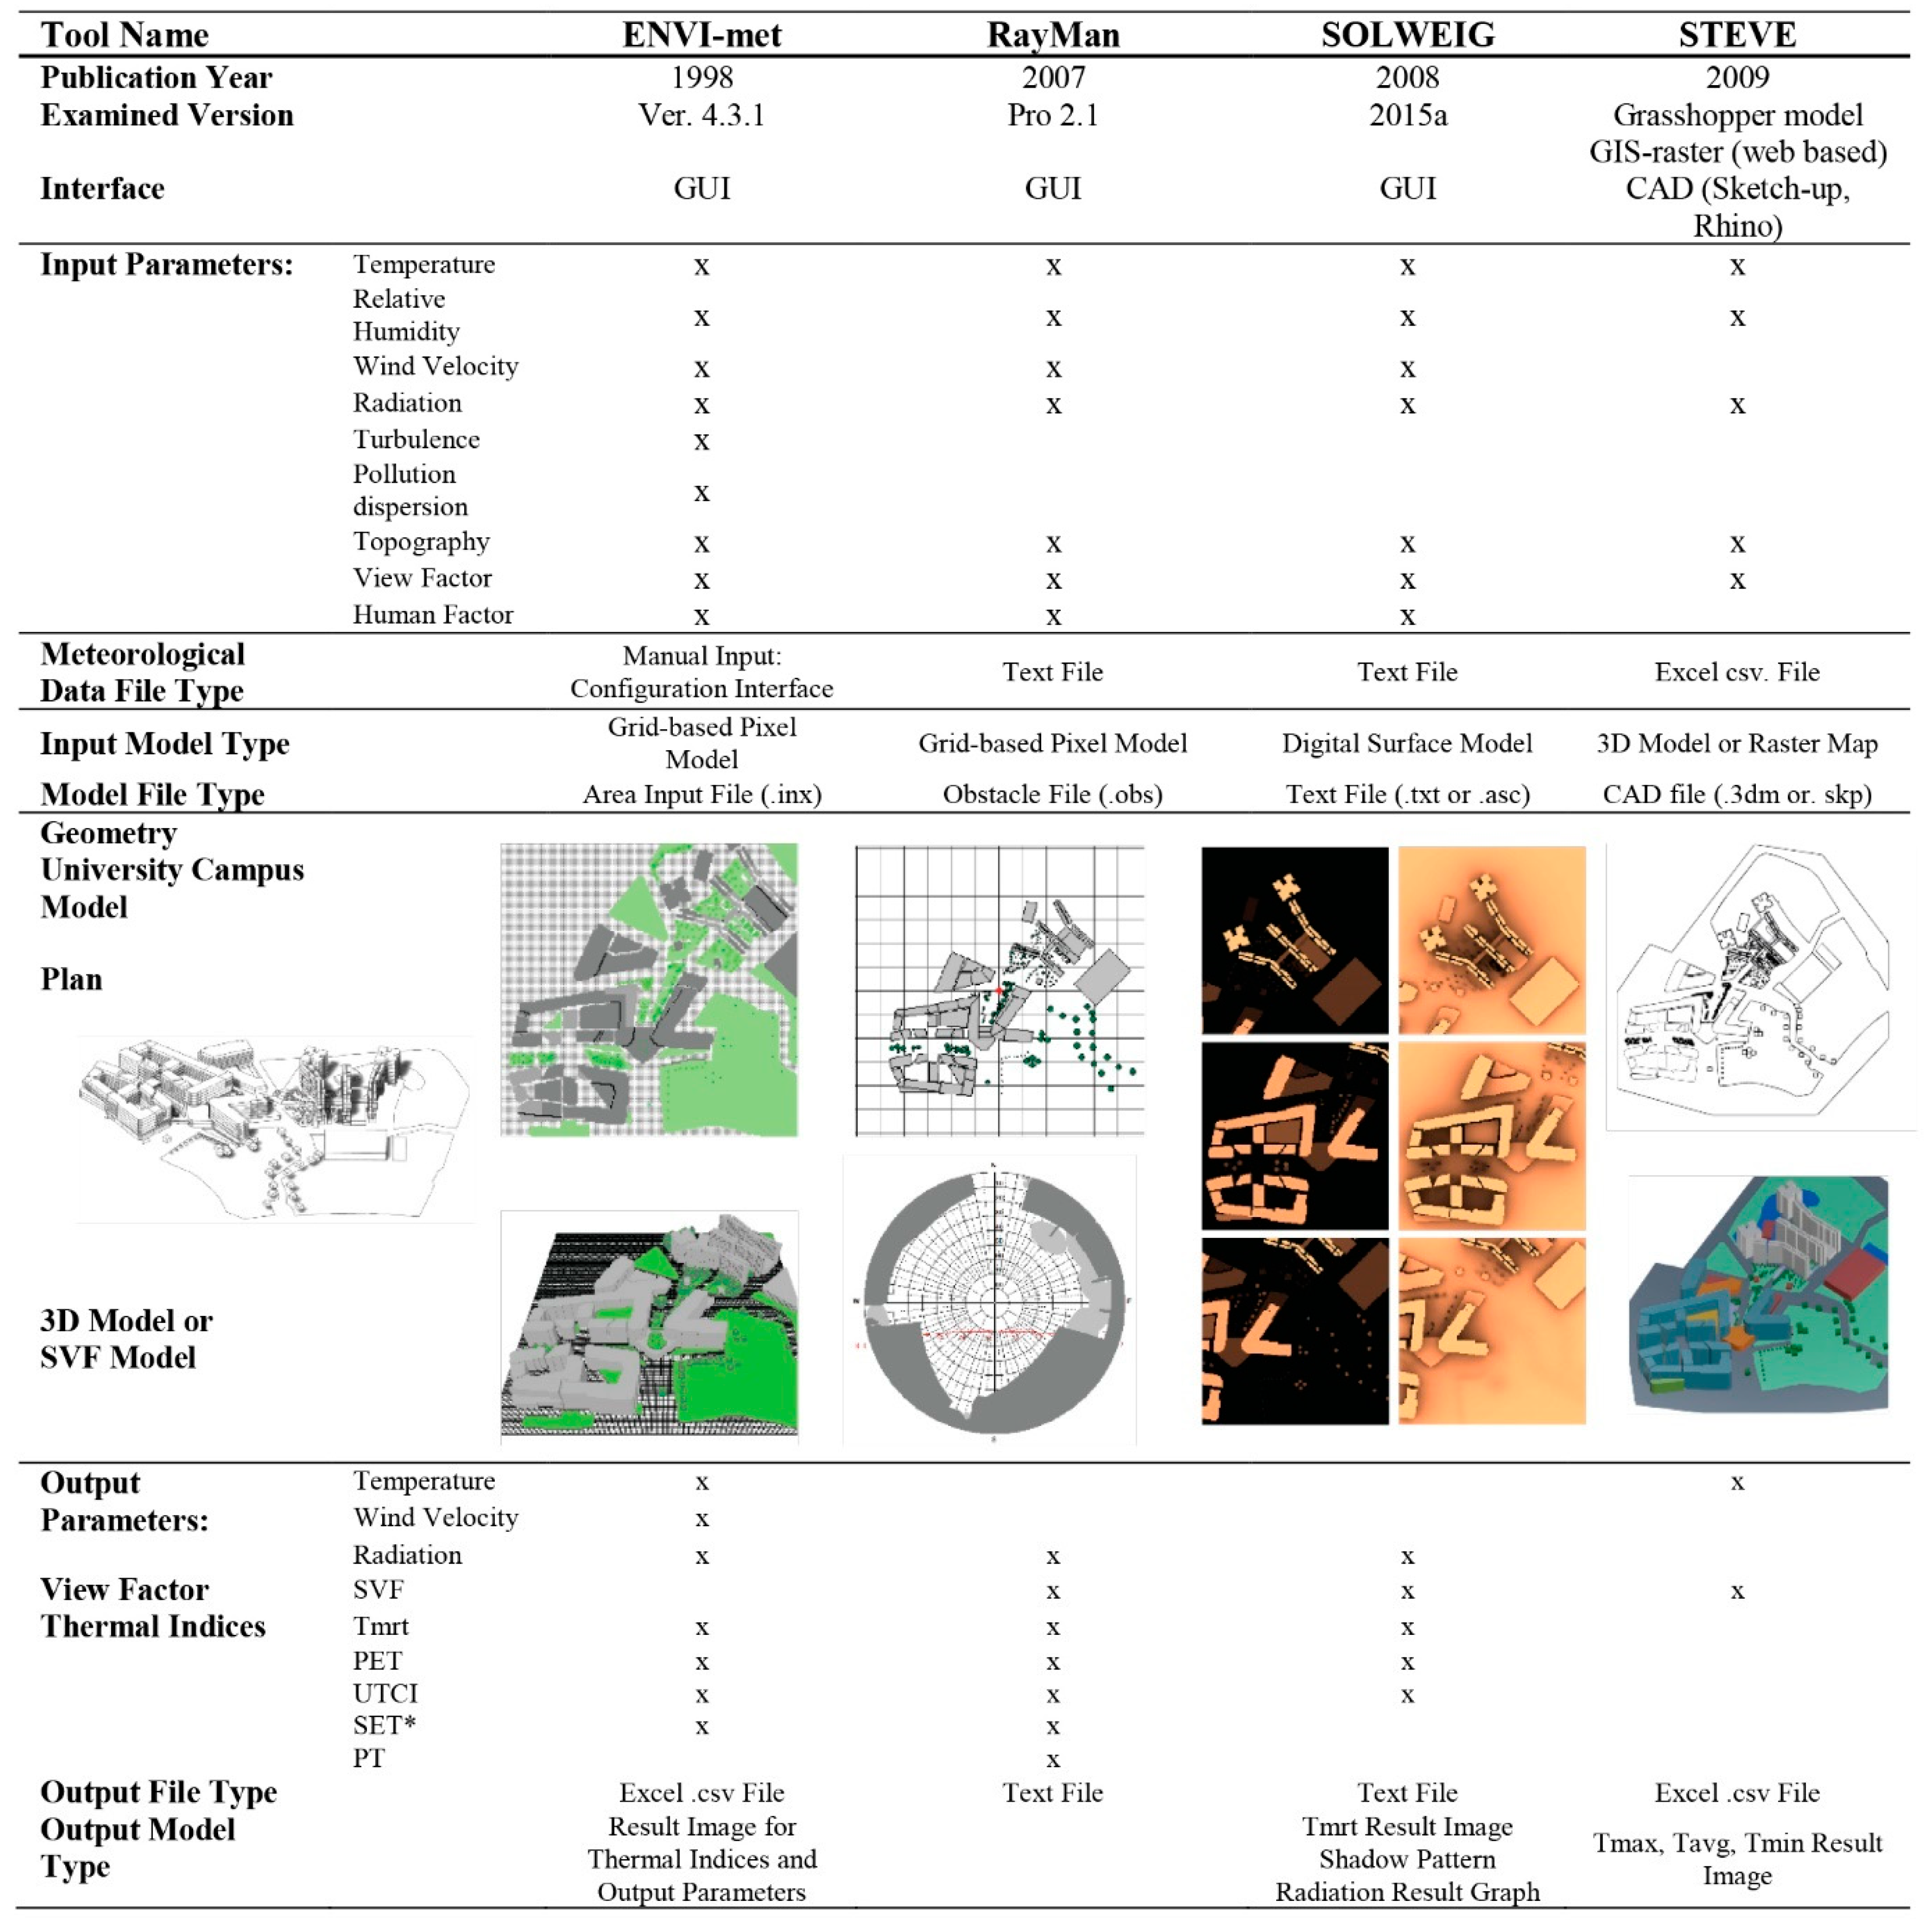 |
Table 9.
shows the Microclimate Simulation Tools for Architecture & Urban Design.
 |
5. Egyptian Building regulations’ changes
Egypt is one of the oldest countries in the world to issue laws regulating urban planning, beginning in 1883 AD, through the establishment of district councils that were responsible for maintaining streets, squares, parks, roads, and zoning, water, lighting, markets, utility works, housing, and assistance for the poor [20].
Building regulations developed from Khedive to Sultan and president, passing by British occupation, and Ottoman rule until the first building organization law No. 51 of 1940 was implemented [21], one of the most prominent laws issued to regulate urban planning in Egypt was Land Division Law No. 28 of 1941, which was later amended several times to be incorporated in Urban Planning Law No. 3 of 1982. This was complemented with Law No. 51 of 1940 regulating buildings, Law No. 106 of 1976 regulating buildings and its amendments, as well as numerous laws related to construction [20] (Figure 6).
However, these laws are defective and contradictory pieces of legislation, thus playing a major role in the creation and growth of deteriorating areas. This has also led to the enactment of legislations to halt the implementation of demolition and acts that violate the Land Division Law and Construction Law [20].
Table 9.
Egyptian laws and legislation regulating urban development, source: author.
| Law No. | Year | Title / Type | Main Objective | Key Provisions |
| 51 | 1940 | Building Regulation Law | First regulation of construction in Egypt | Max height 1.5×road width (up to 35m), lighting & ventilation standards, fire safety. |
| 656 | 1954 | Unified Planning Law | Merged Law 51 and 52 | Max height 36m, rules for corner buildings. |
| 259 | 1956 | Freeze on Violations | Prevent demolition of pre-1956 violations | Allowed infrastructure provision on private land with fees. |
| 55 | 1958 | Industrial Zones Construction Law | Regulate construction in new industrial cities | Foundation for structured urban planning. |
| 45 | 1962 | Building and Ventilation Law | Improve construction quality | Regulated road width, height, lighting, ventilation, stairs. |
| 53 | 1966 | Agricultural Land Protection Law | Preserve agricultural land | Prohibits building/dividing agricultural land. |
| 106 | 1976 | Building Regulation Law | Prevent slums and unlicensed construction | Licensing required, penalties imposed, exemptions allowed. |
| 135 | 1981 | Illegal Subdivision Management | Legalize unplanned settlements | Stop demolition, prepare new housing, connect services. |
| 3 | 1982 | Urban Planning Law | First national urban development policy | Comprehensive and detailed planning, subdivision rules. |
| 10 | 1990 | Expropriation Law | Regulate public interest land acquisition | Compensation, procedures, and appeals processes. |
| 119 | 2008 | Unified Building Law | Comprehensive regulation of planning and construction | Licensing, planning, heritage protection, re-planning. |
| 17 | 2019 | Reconciliation Law | Legalize construction violations | Halts court cases, sets non-legalizable cases, protects farmland. |
| 318 | 2020 | New Licensing System | Temporary construction halt in capitals | Review permits, ensure safety, curb illegal expansion. |
| — | — | Sustainability Strategies | Address climate change and sustainable development | Vision 2030, NCCS 2050, green investments, emission cuts. |
6. Case Study
The necessity to show variation in building form, density, orientation, spatial arrangement, and regulatory system was the point of departure for choosing the four case study areas. Each of the types is geographically dispersed across Alexandria's coastal urban form and consists of a different planning methodology. Some of these were uniform across the four cases: case study area range between 14,000 to 16,000 square meters, northwest orientation range between 28 to 38 degrees, and hot steppe climate (Köppen climate classification: BSh), virtually hot desert climate (Köppen climate classification: BWh) of Alexandria which encompasses the area between latitudes 30° 50′–31° 40′ N and longitudes 29° 40′–32° 35′ E (Figure 7).
6.1. Description of Selected Urban Typologies
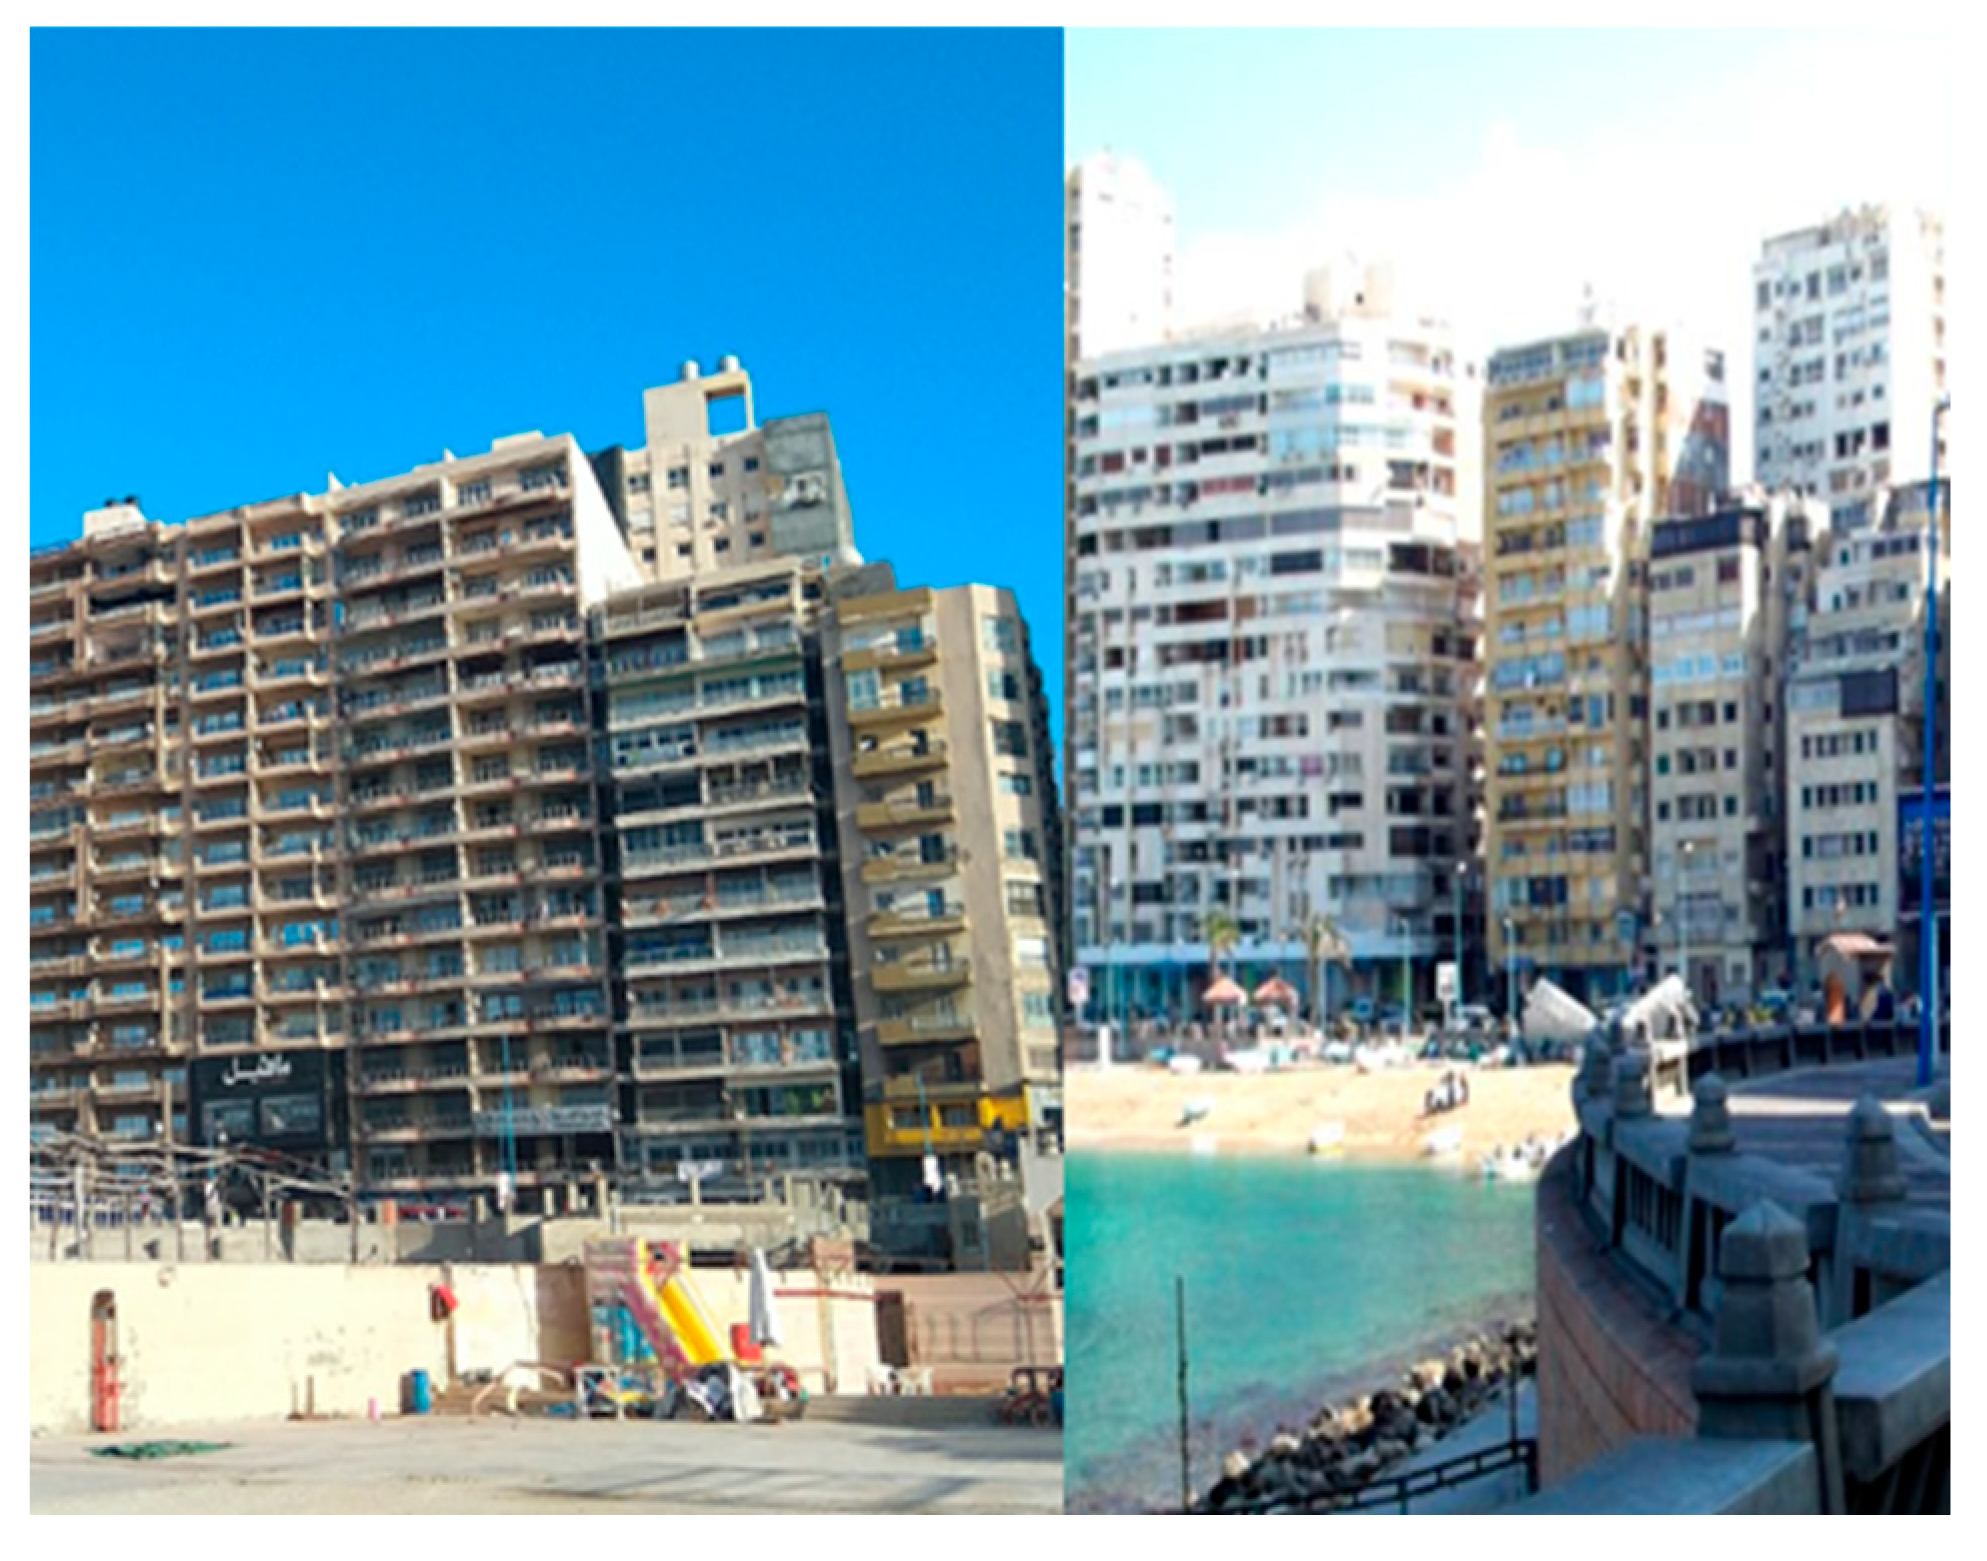
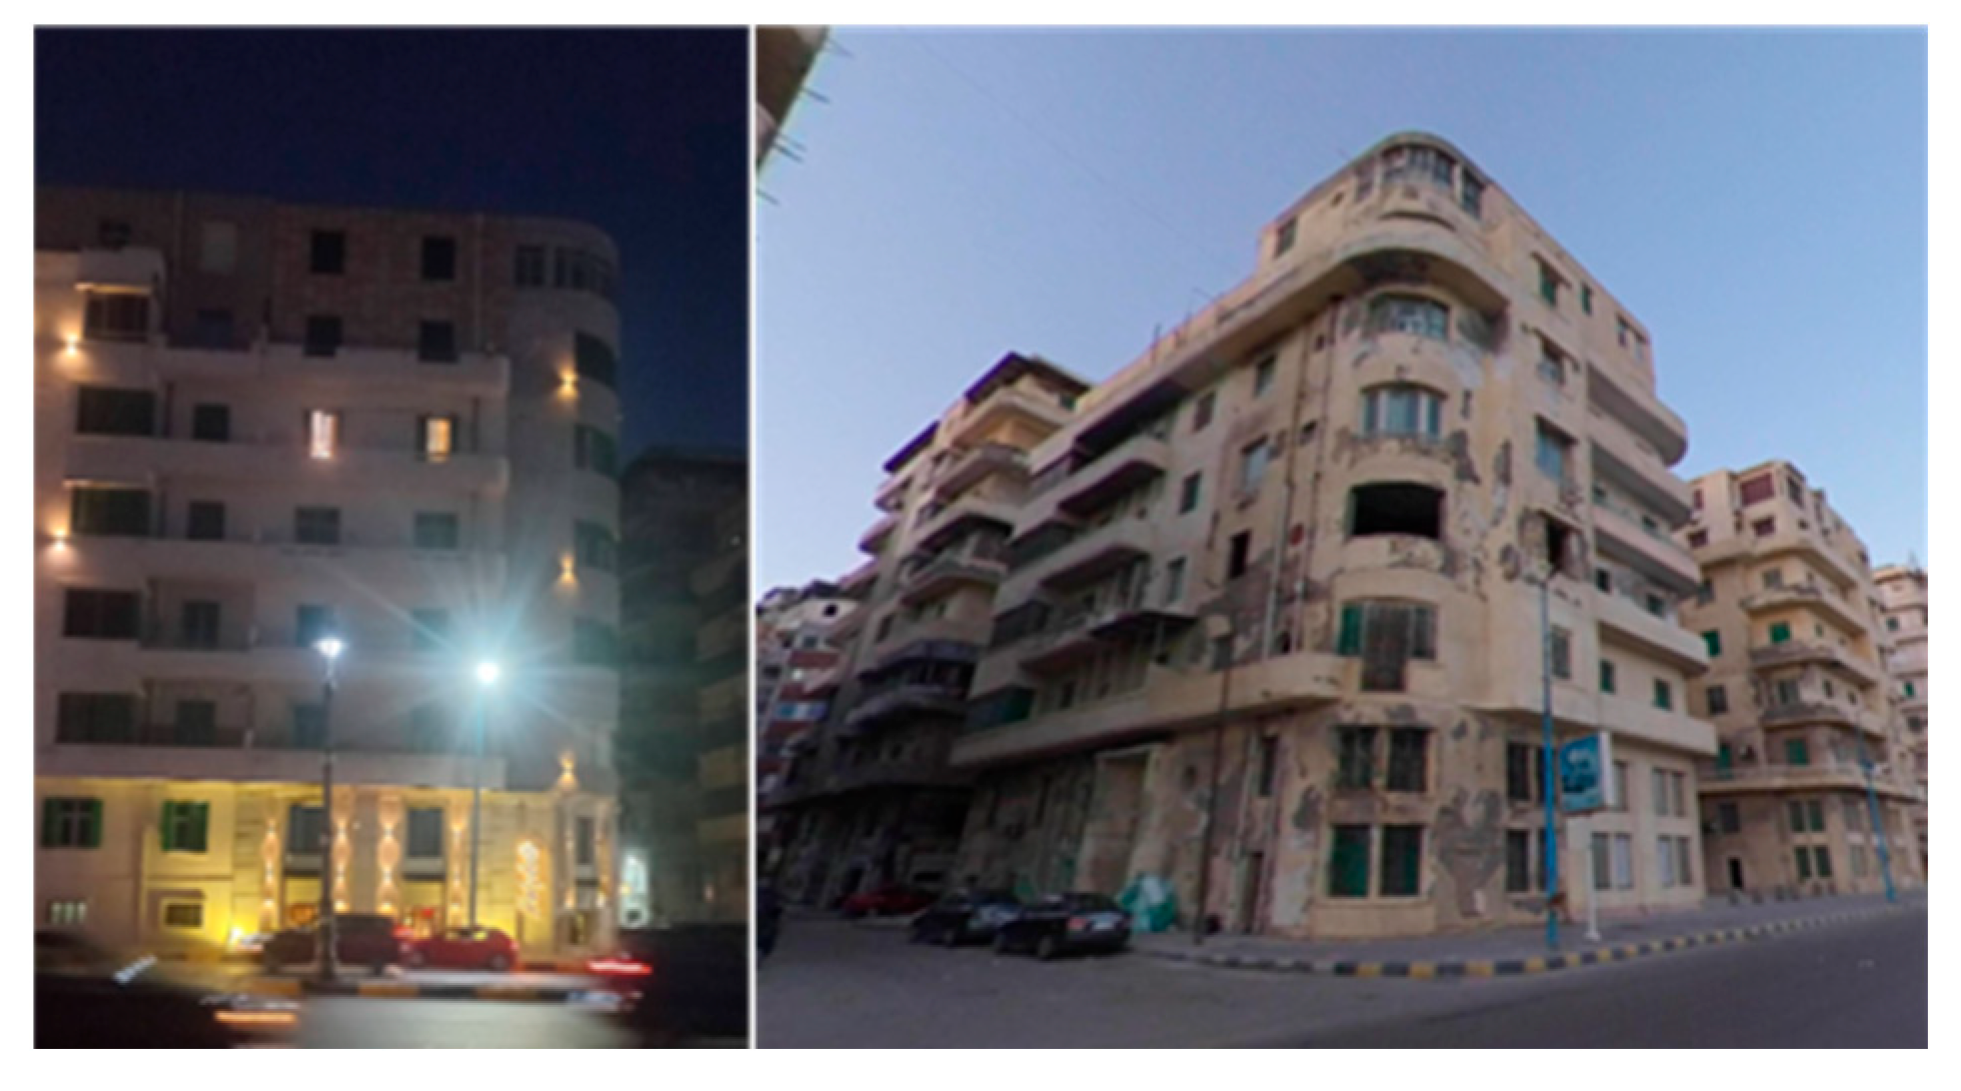
6.1.1. Case study1 (High-Density Type)
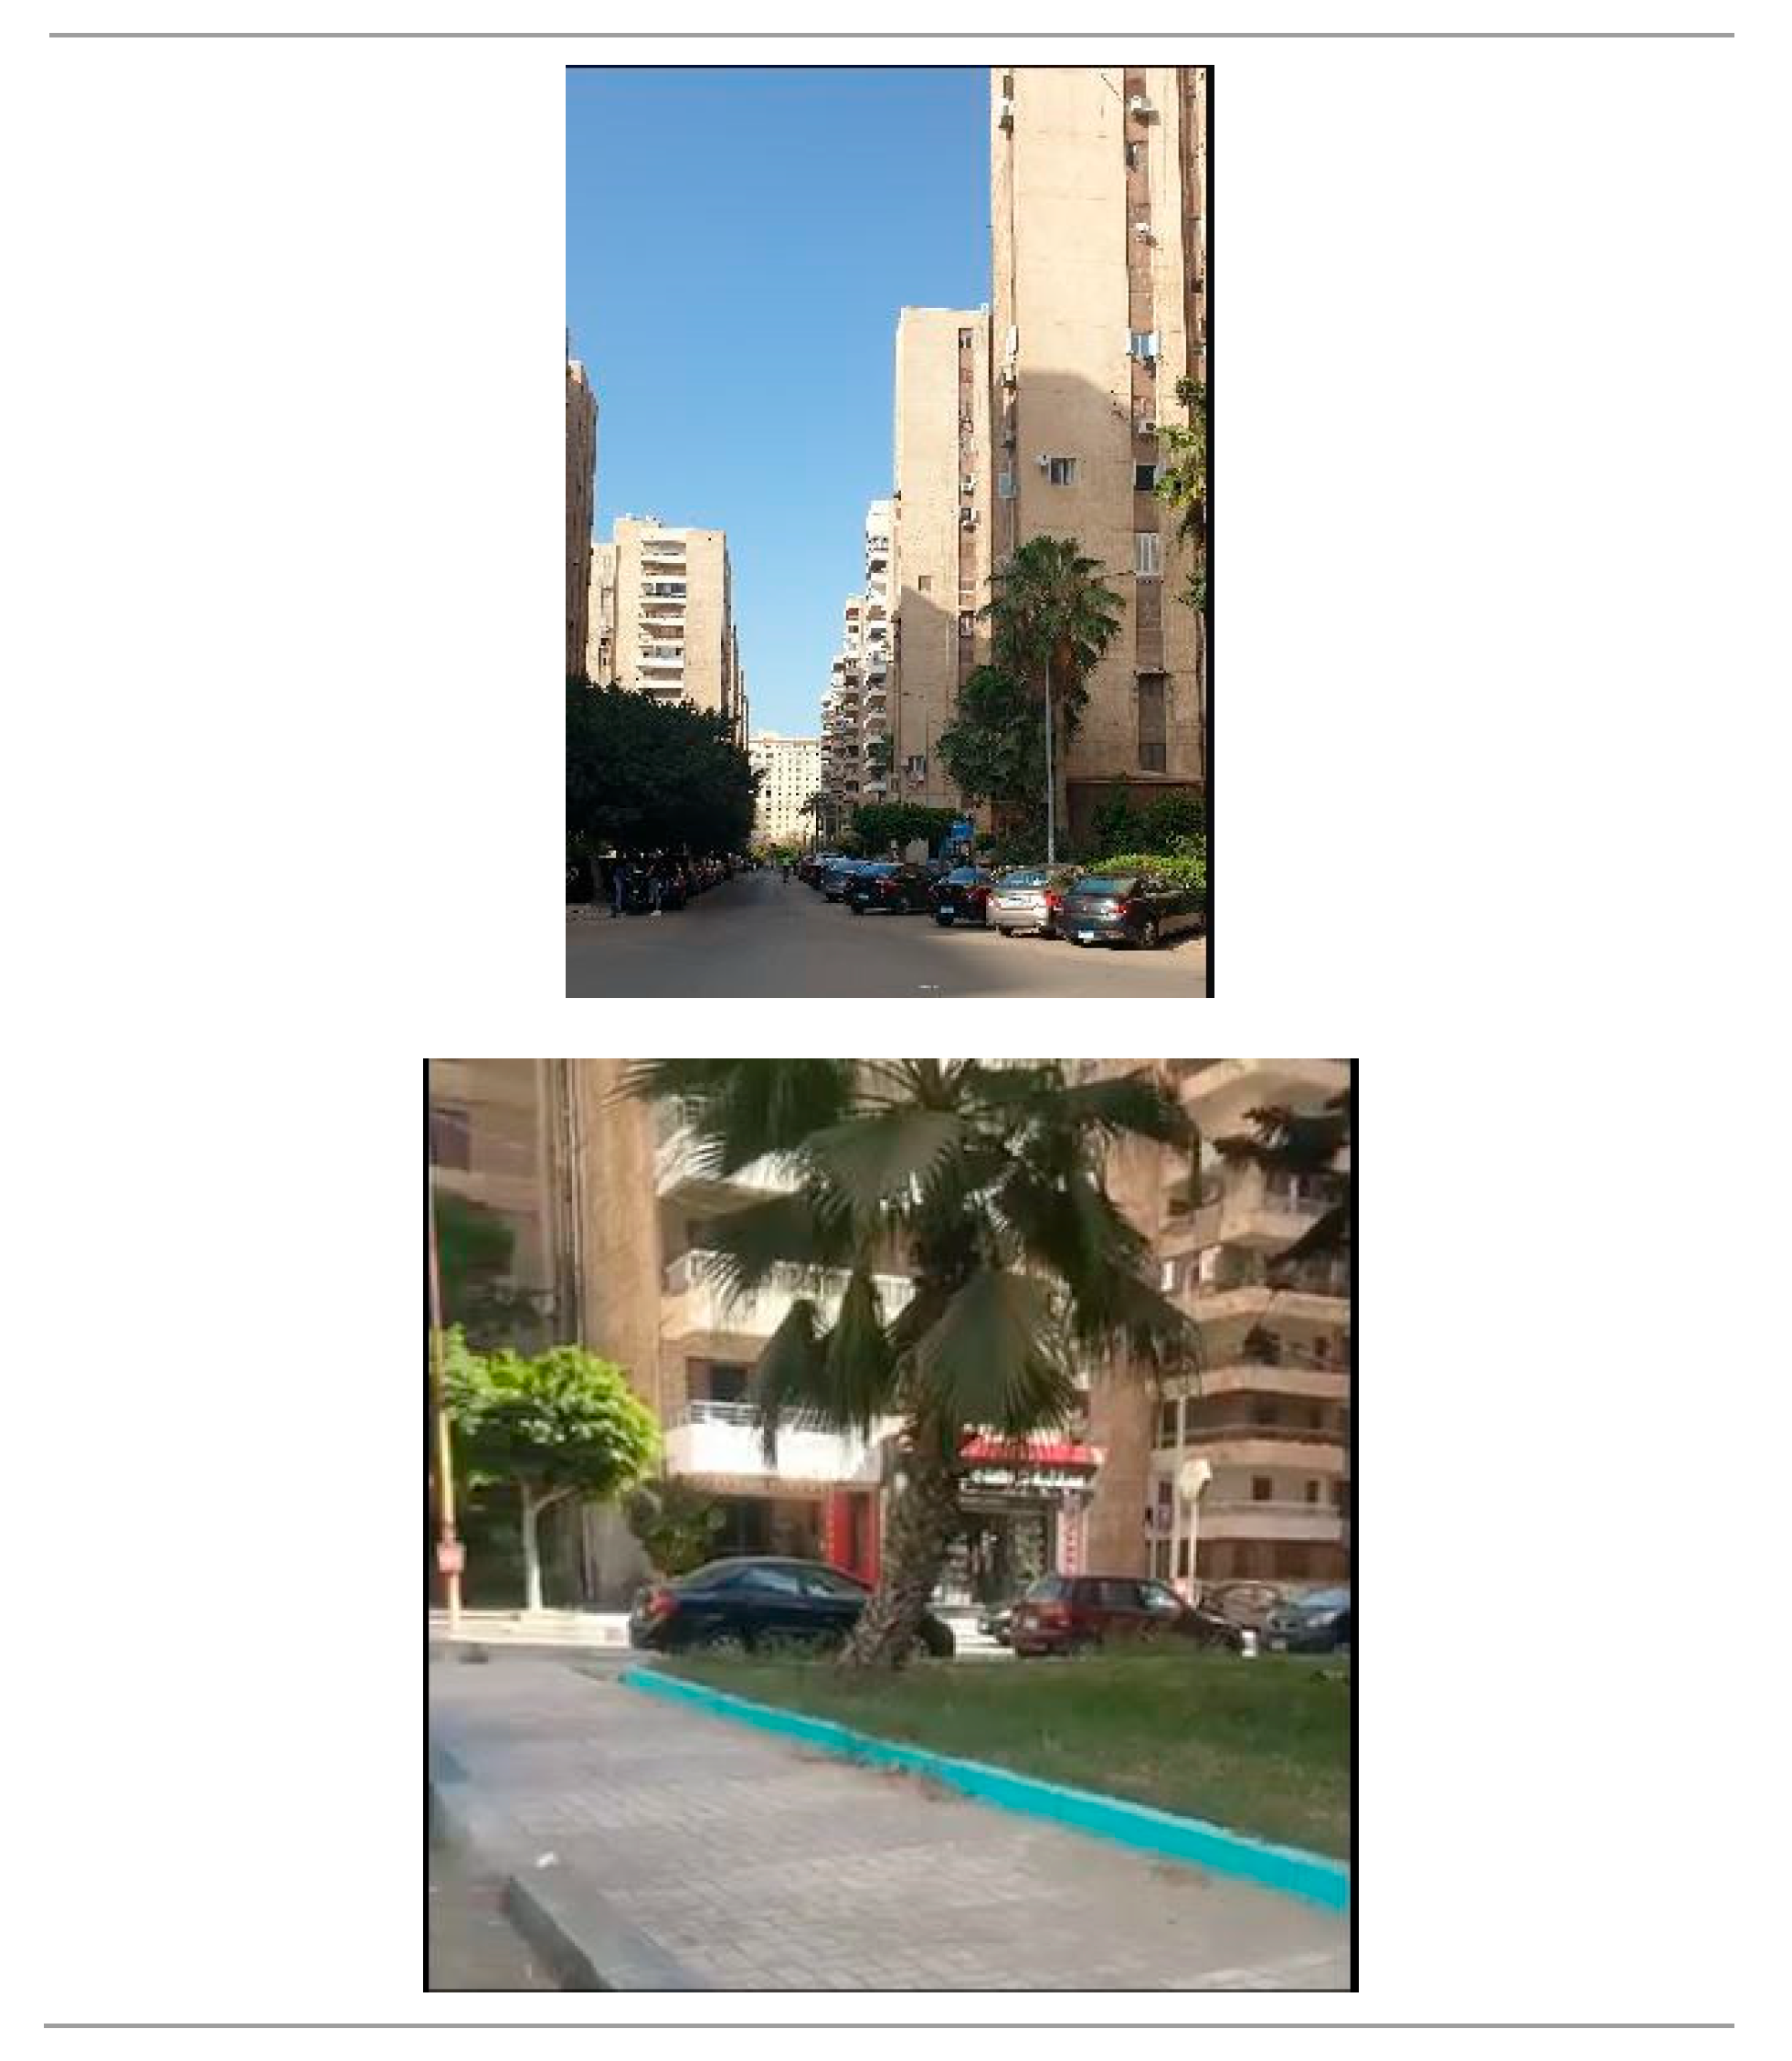
Near El-Mergany Palace, Corniche An area of vertically stacked buildings on small plots with minimal open space. It reflects maximum permissible density under local codes, with tight street grids and high lot coverage. The urban block's floor area ratio is 5.1 and its building coverage ratio is around 36%. With building heights vary between 50, 45m, the building's aspect ratio ranges from 2.8:1 on main roads to 4.3:1 on smaller local roads. Additionally, the Open Space Ratio is 64% and the Green Area Ratio is around 2% (Figure 8).
Figure 8.
Case study1 location adapted from google maps.
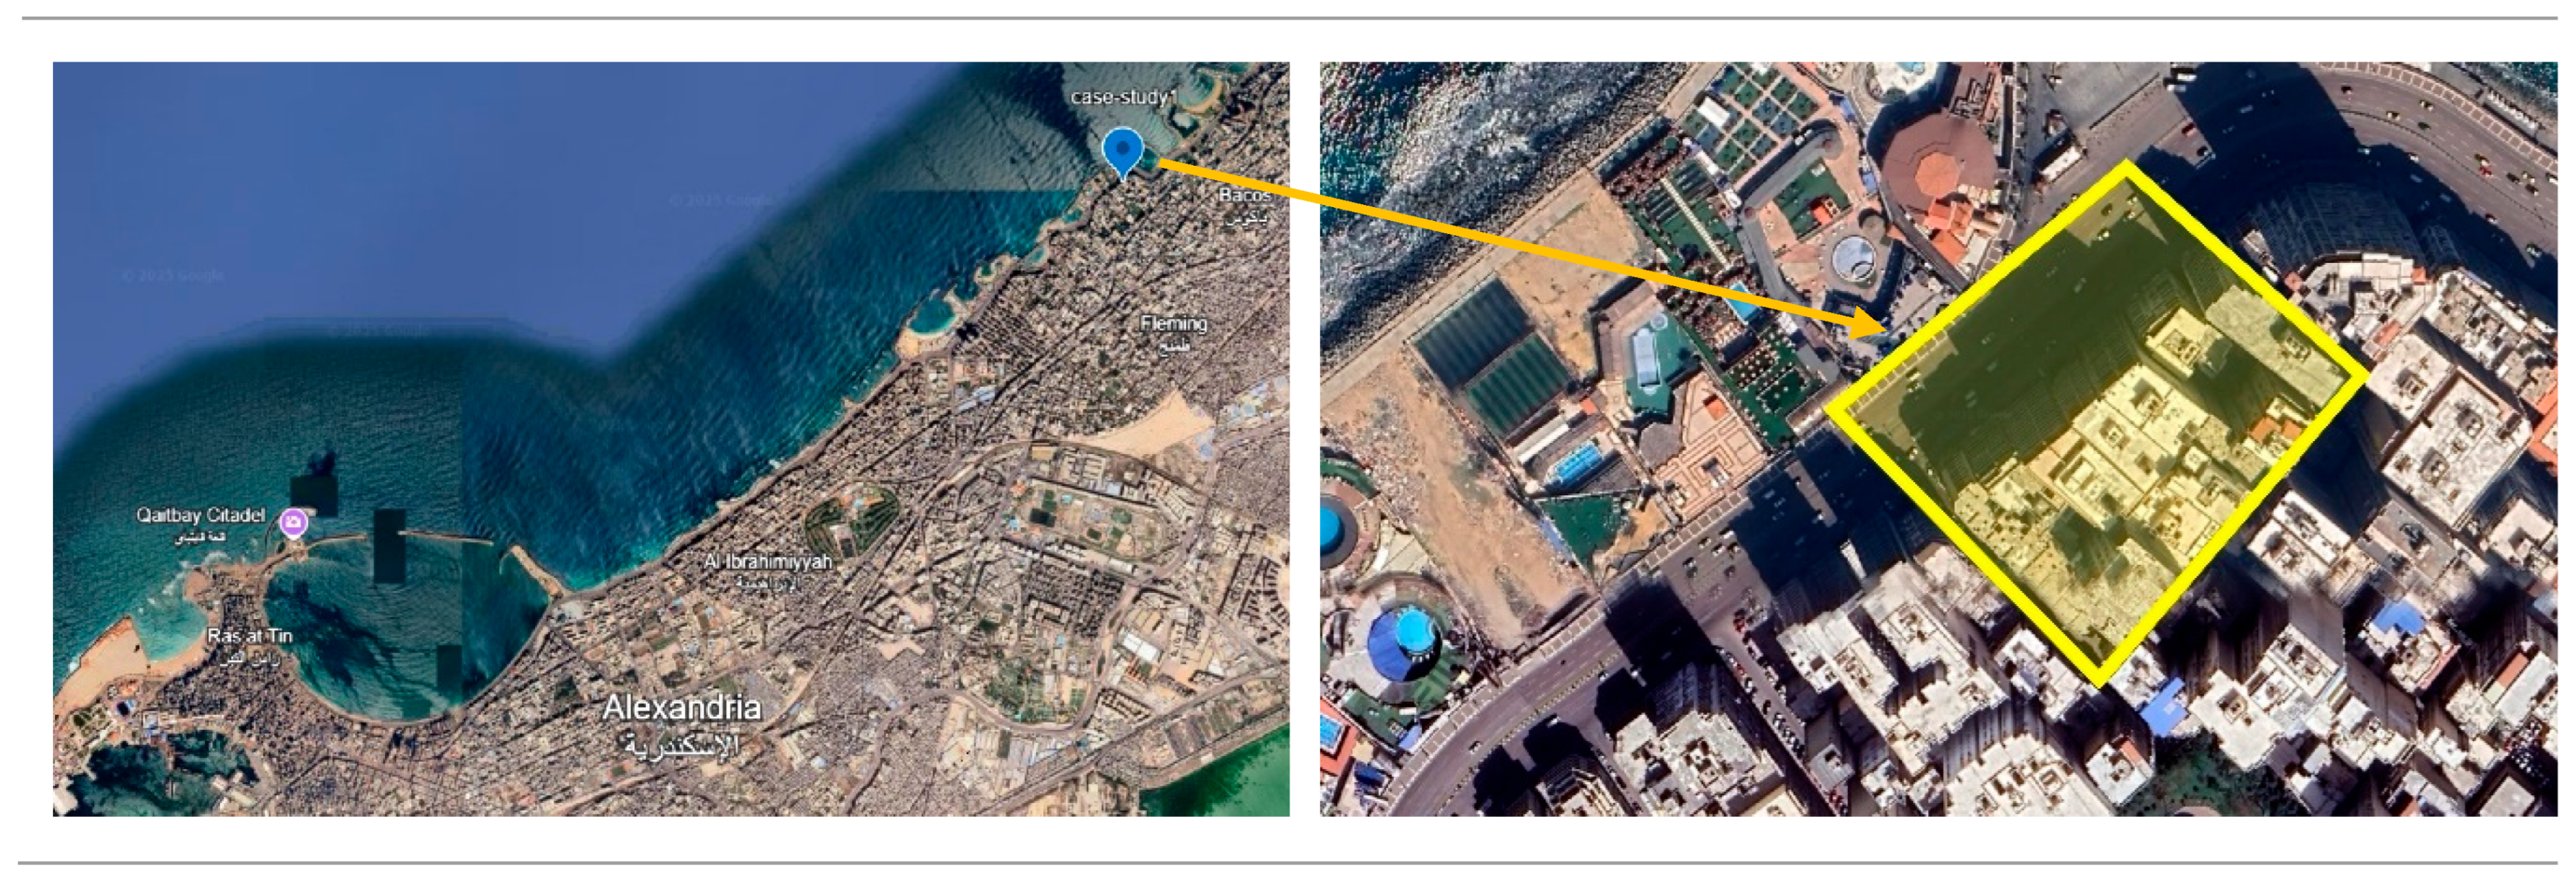
Figure 9.
Case study1 simulation model (plan view).
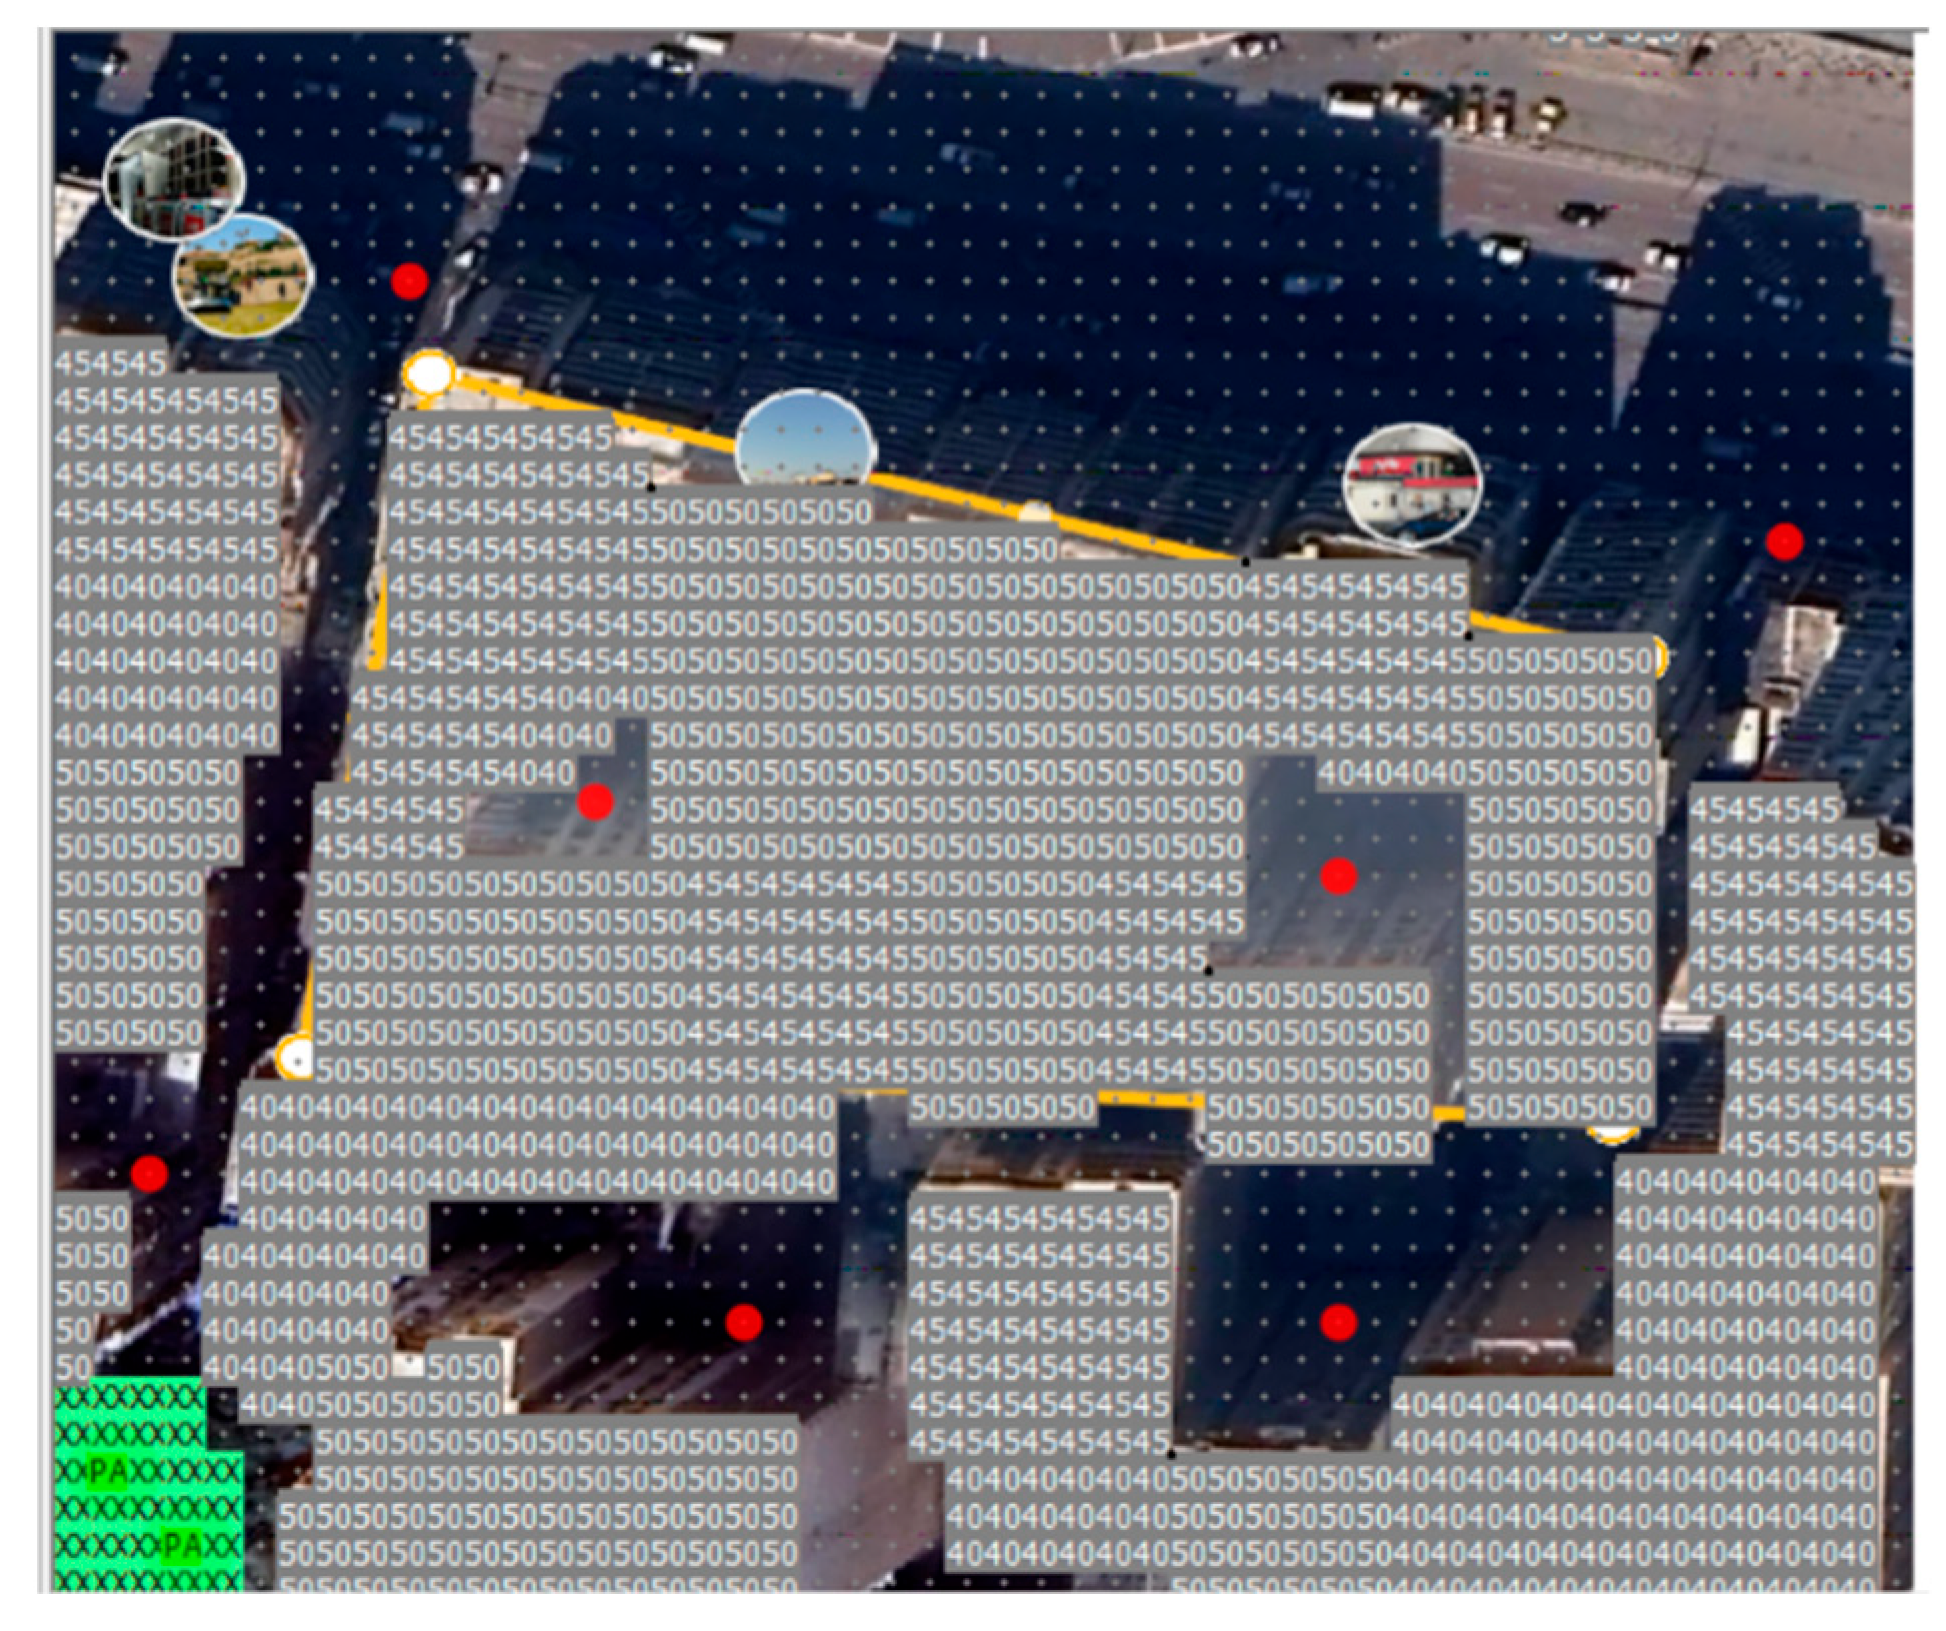
Figure 10.
Case study1 area dimensions.
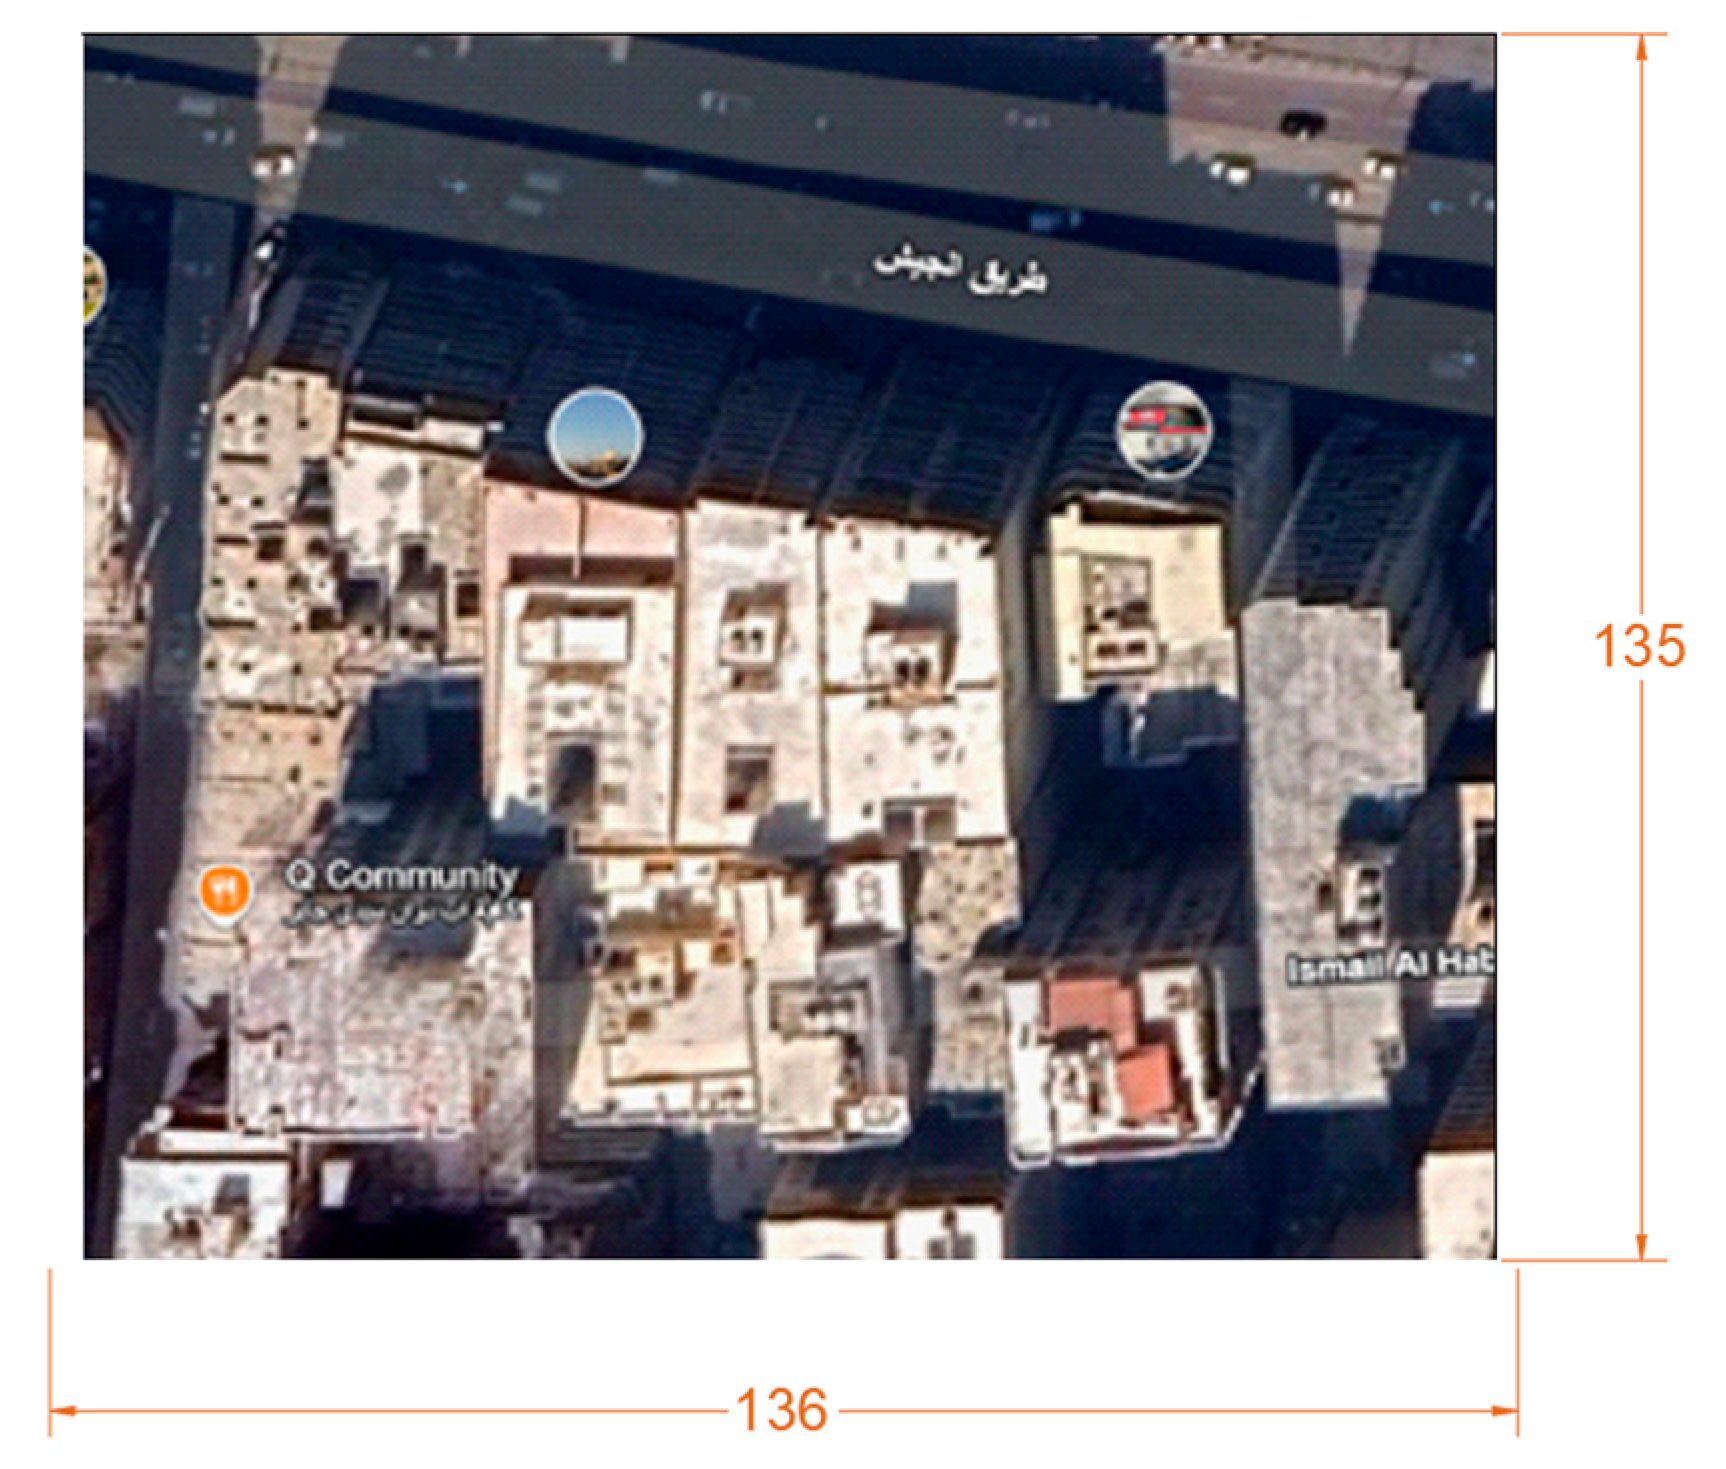
Figure 11.
Case study1 simulation model (3D view).
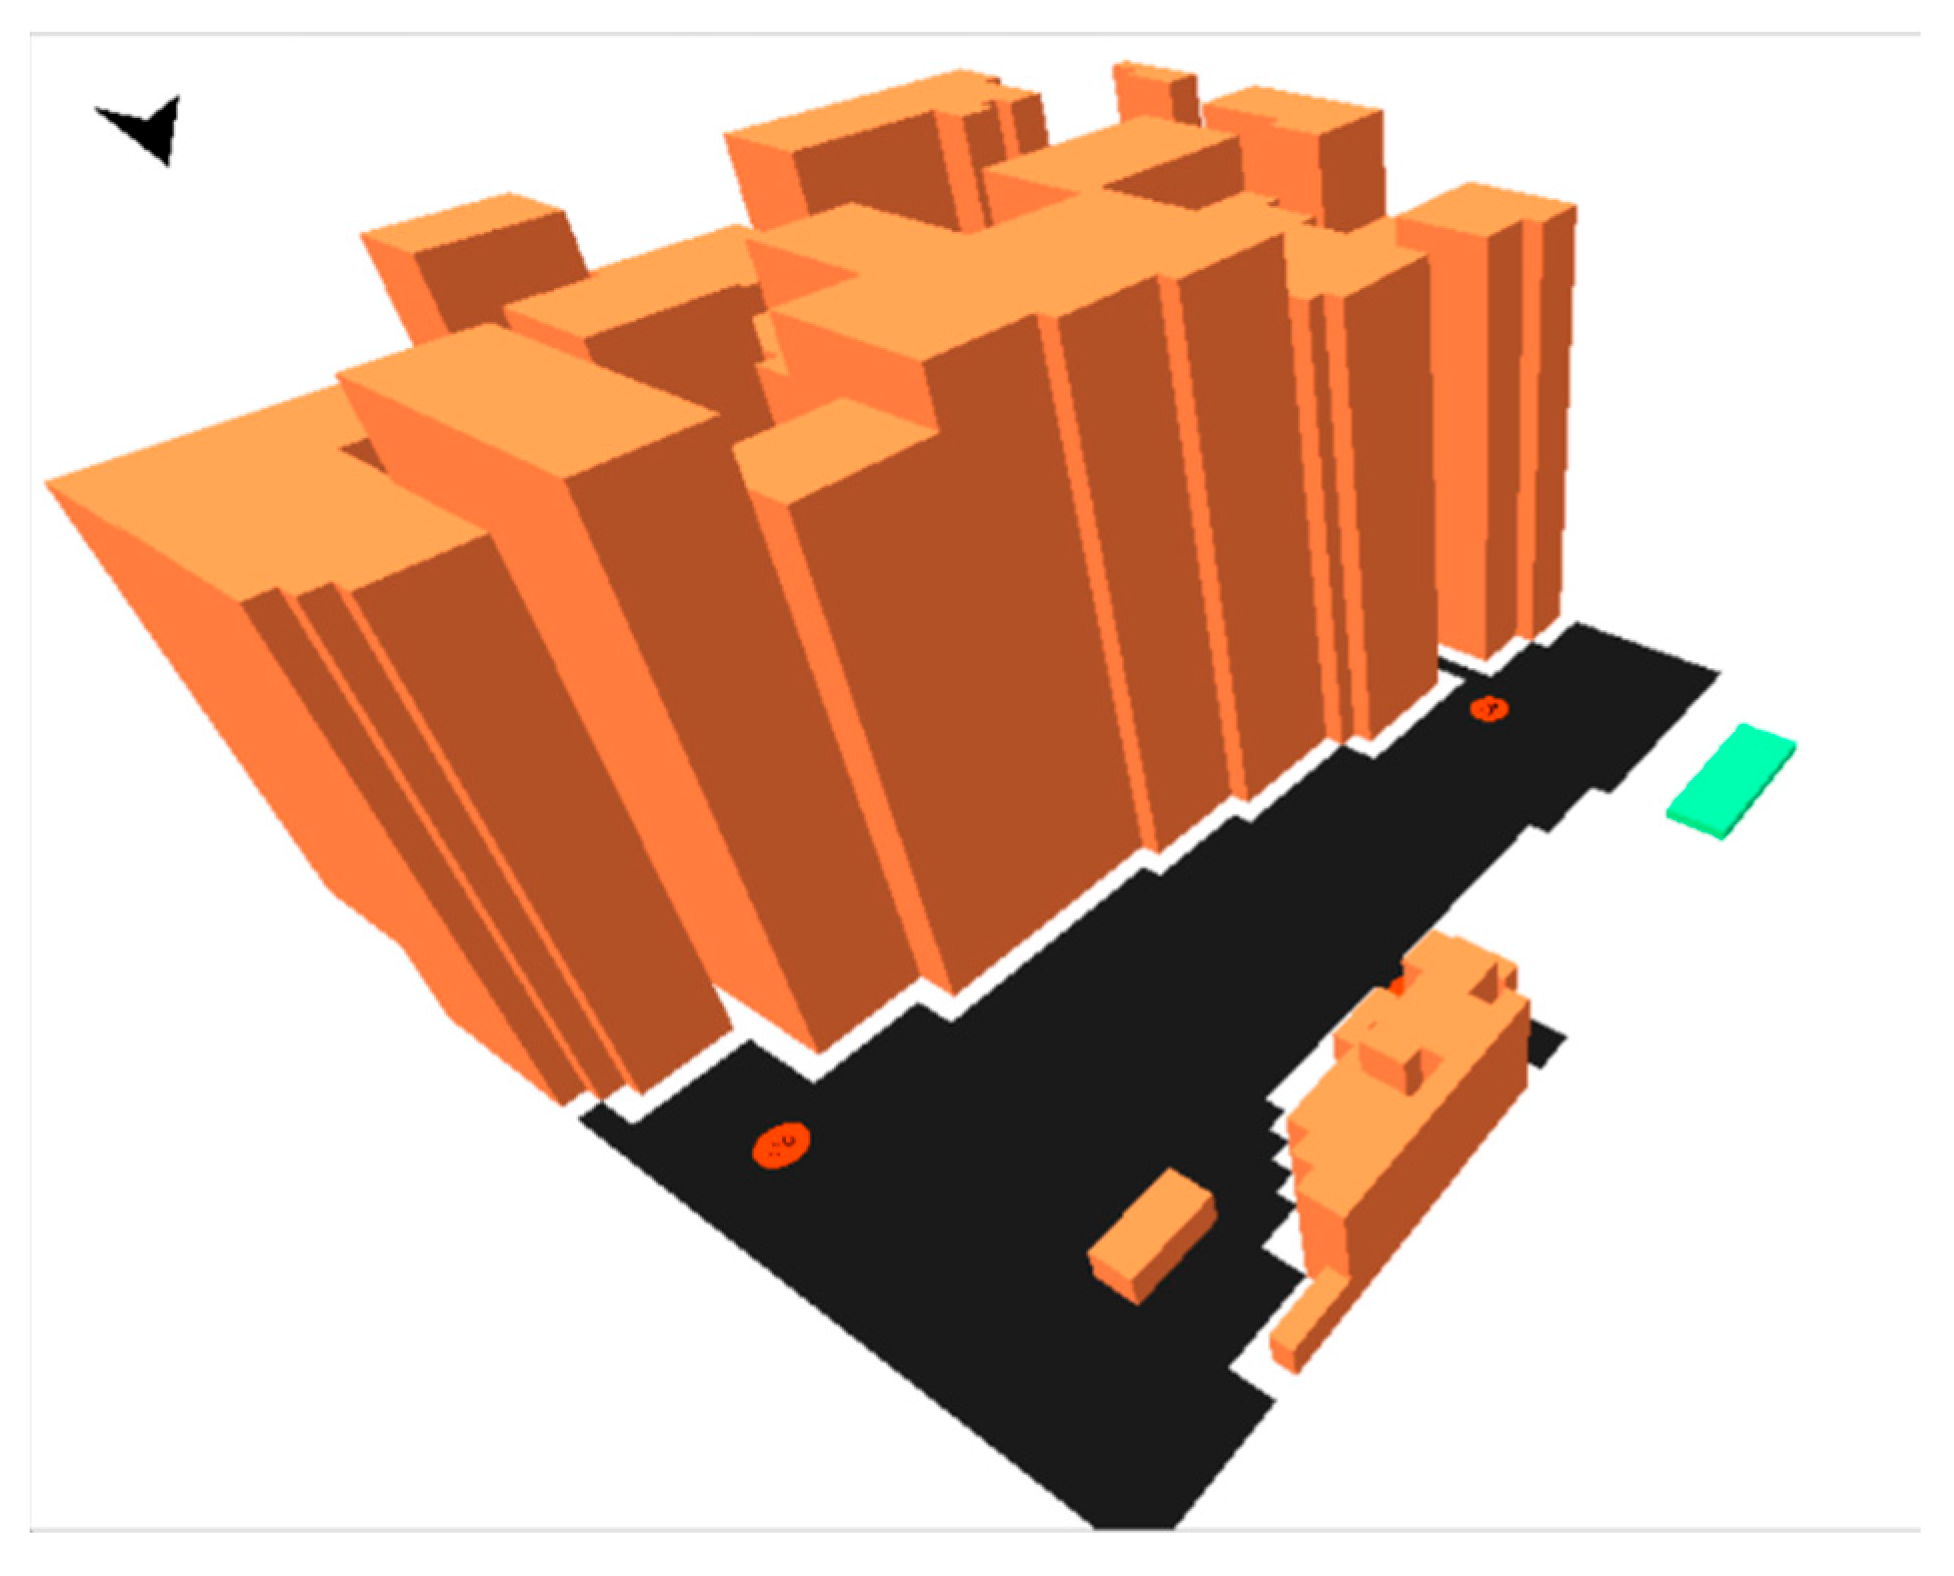
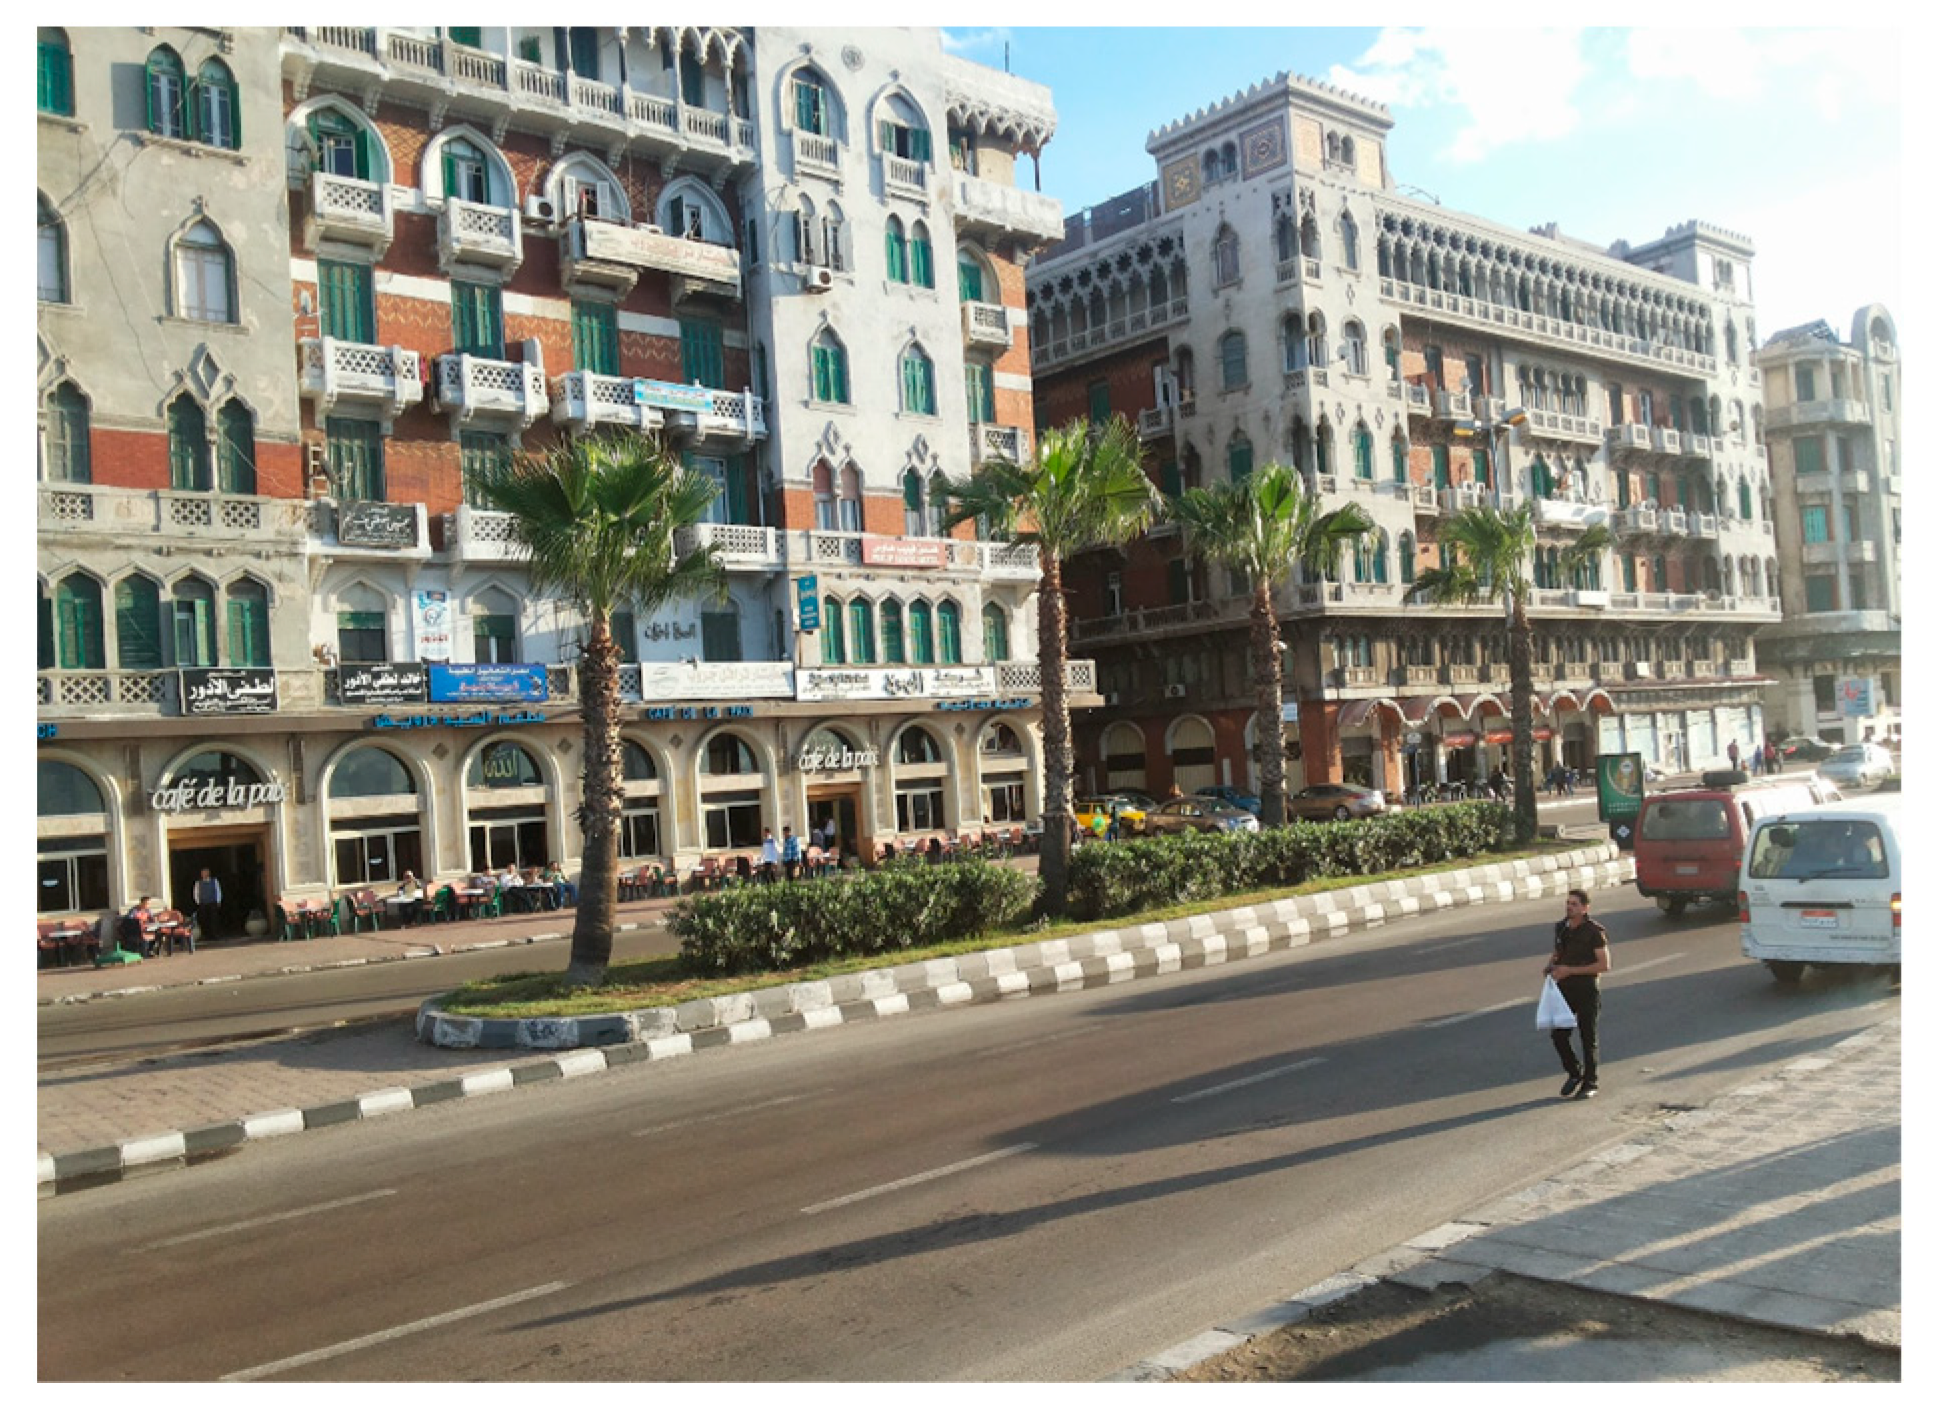
Figure 12.
Case study1 photos.
6.1.2. Case study2 (Strip Type)
El-Naby Daniel Street A linear commercial-residential zone characterized by continuous building façades aligned with the street. The form emphasizes maximum frontage with limited side setbacks. The urban block's floor area ratio is 2.7 and its building coverage ratio is around 39%. With building height 24m, the building's aspect ratio ranges from 2.8:1 on main roads to 4.3:1 on smaller local roads. Additionally, the Open Space Ratio is 61% and the Green Area Ratio is around 0.4% (Figure 13).
Figure 13.
Case study2 location adapted from google maps.
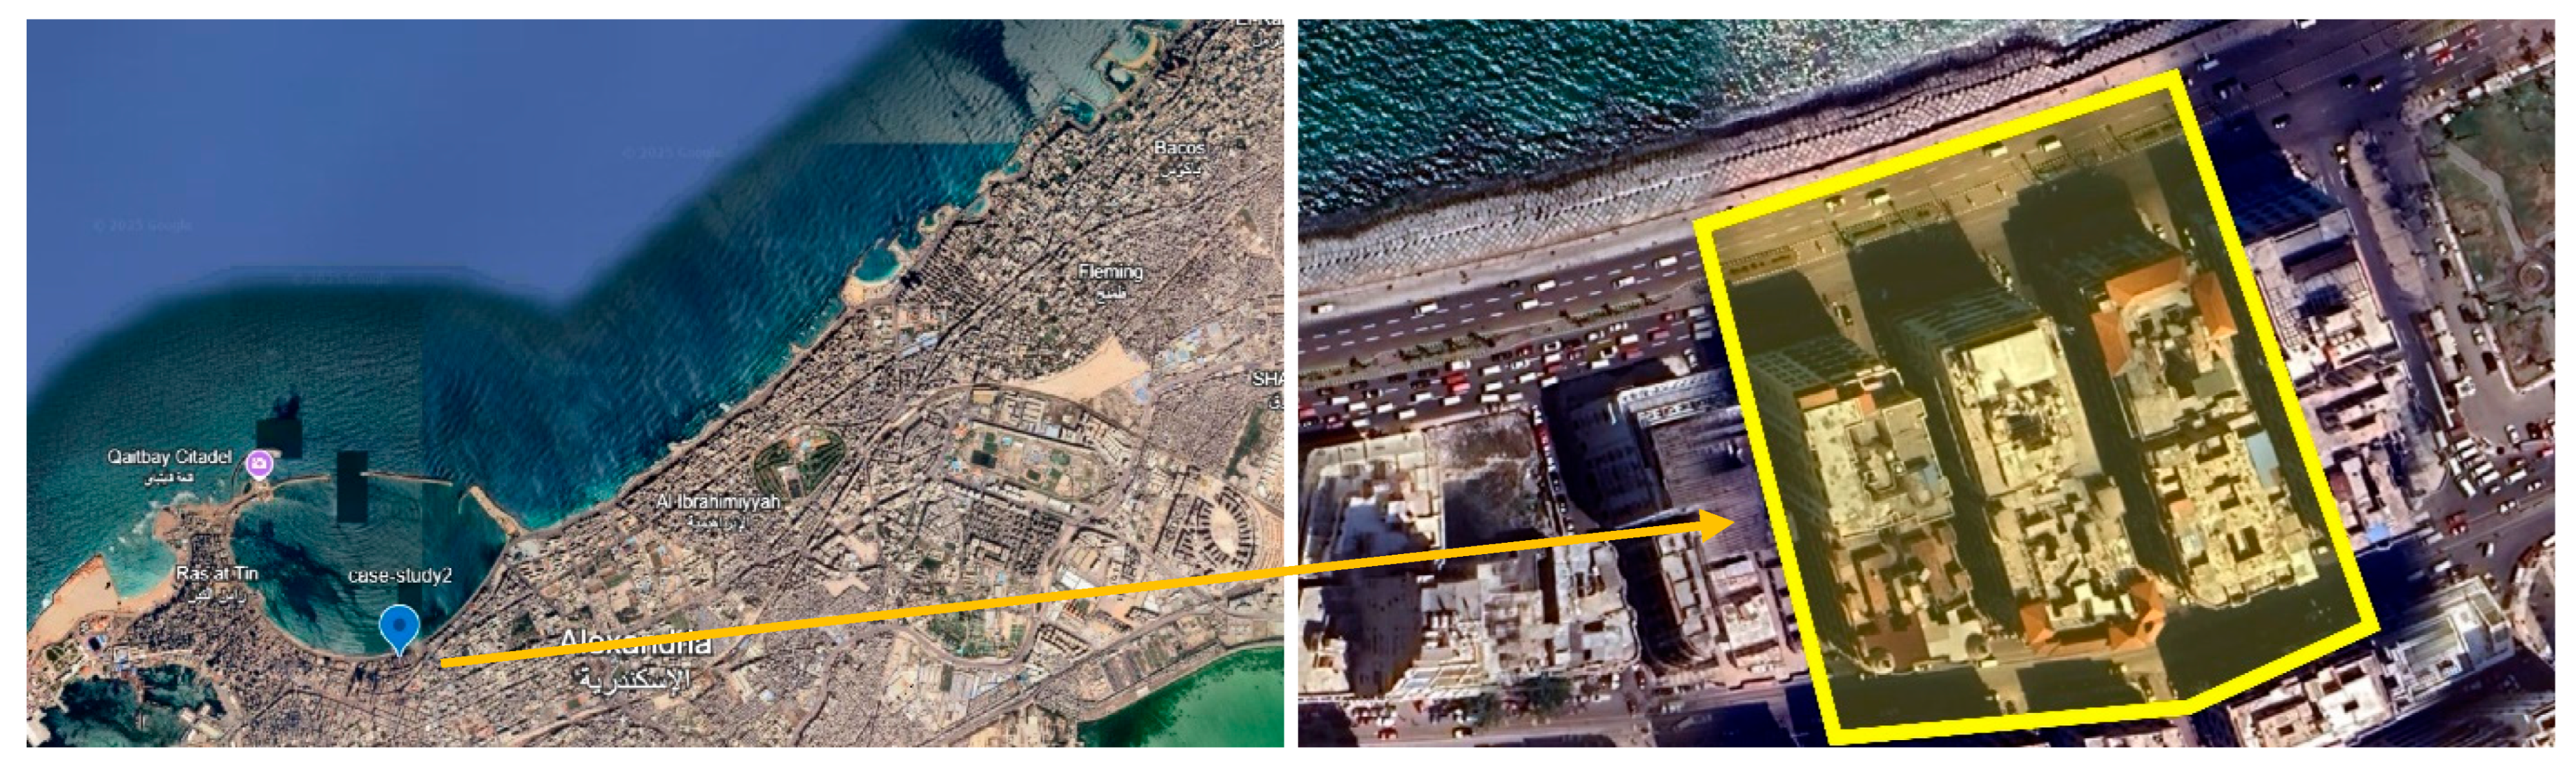
Figure 14.
Case study2 simulation model (plan view).
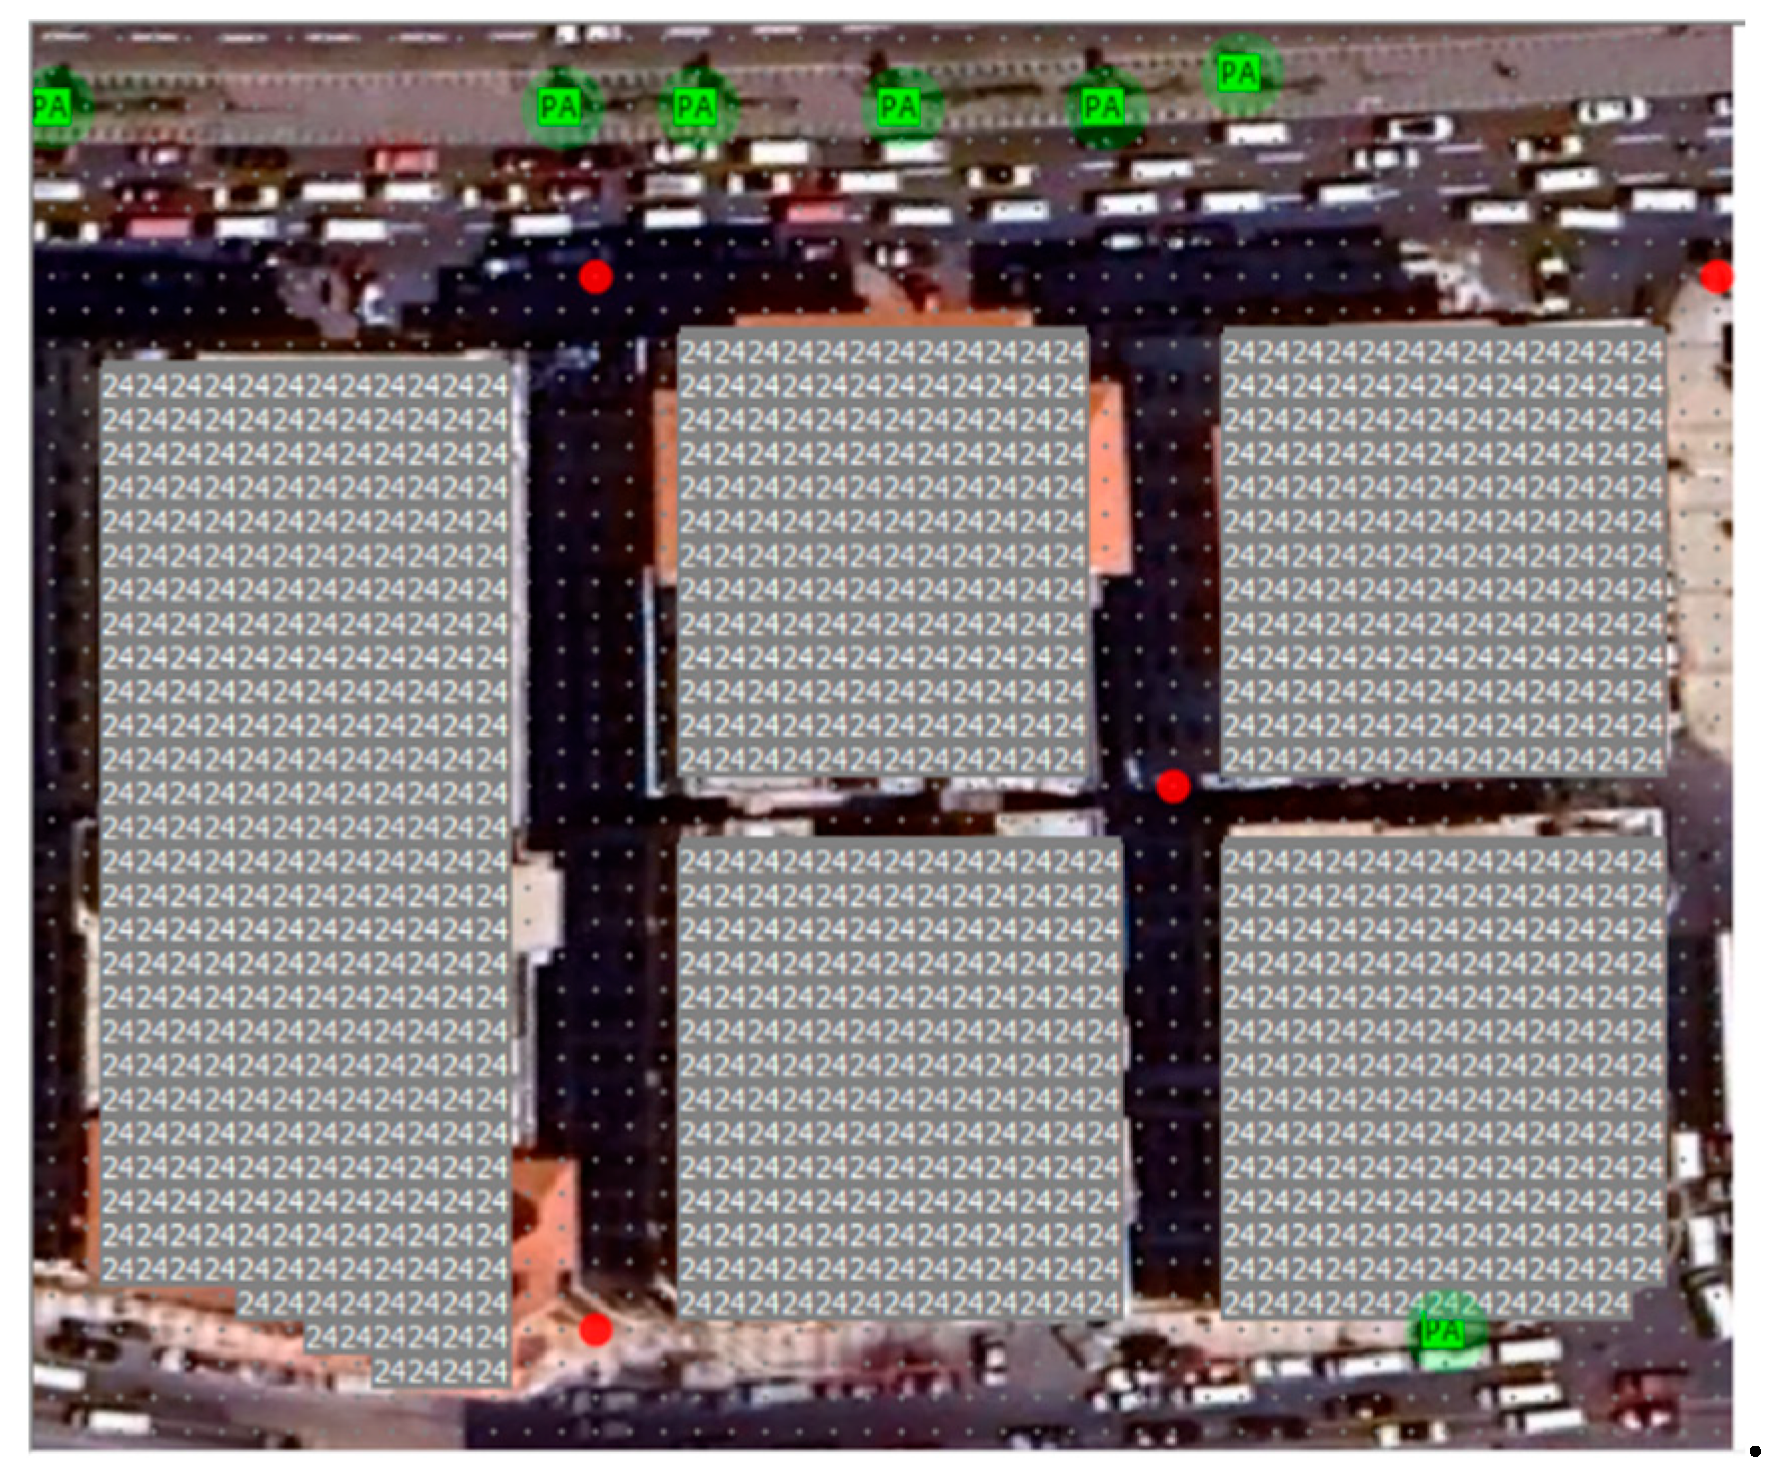
Figure 15.
Case study2 area dimensions.
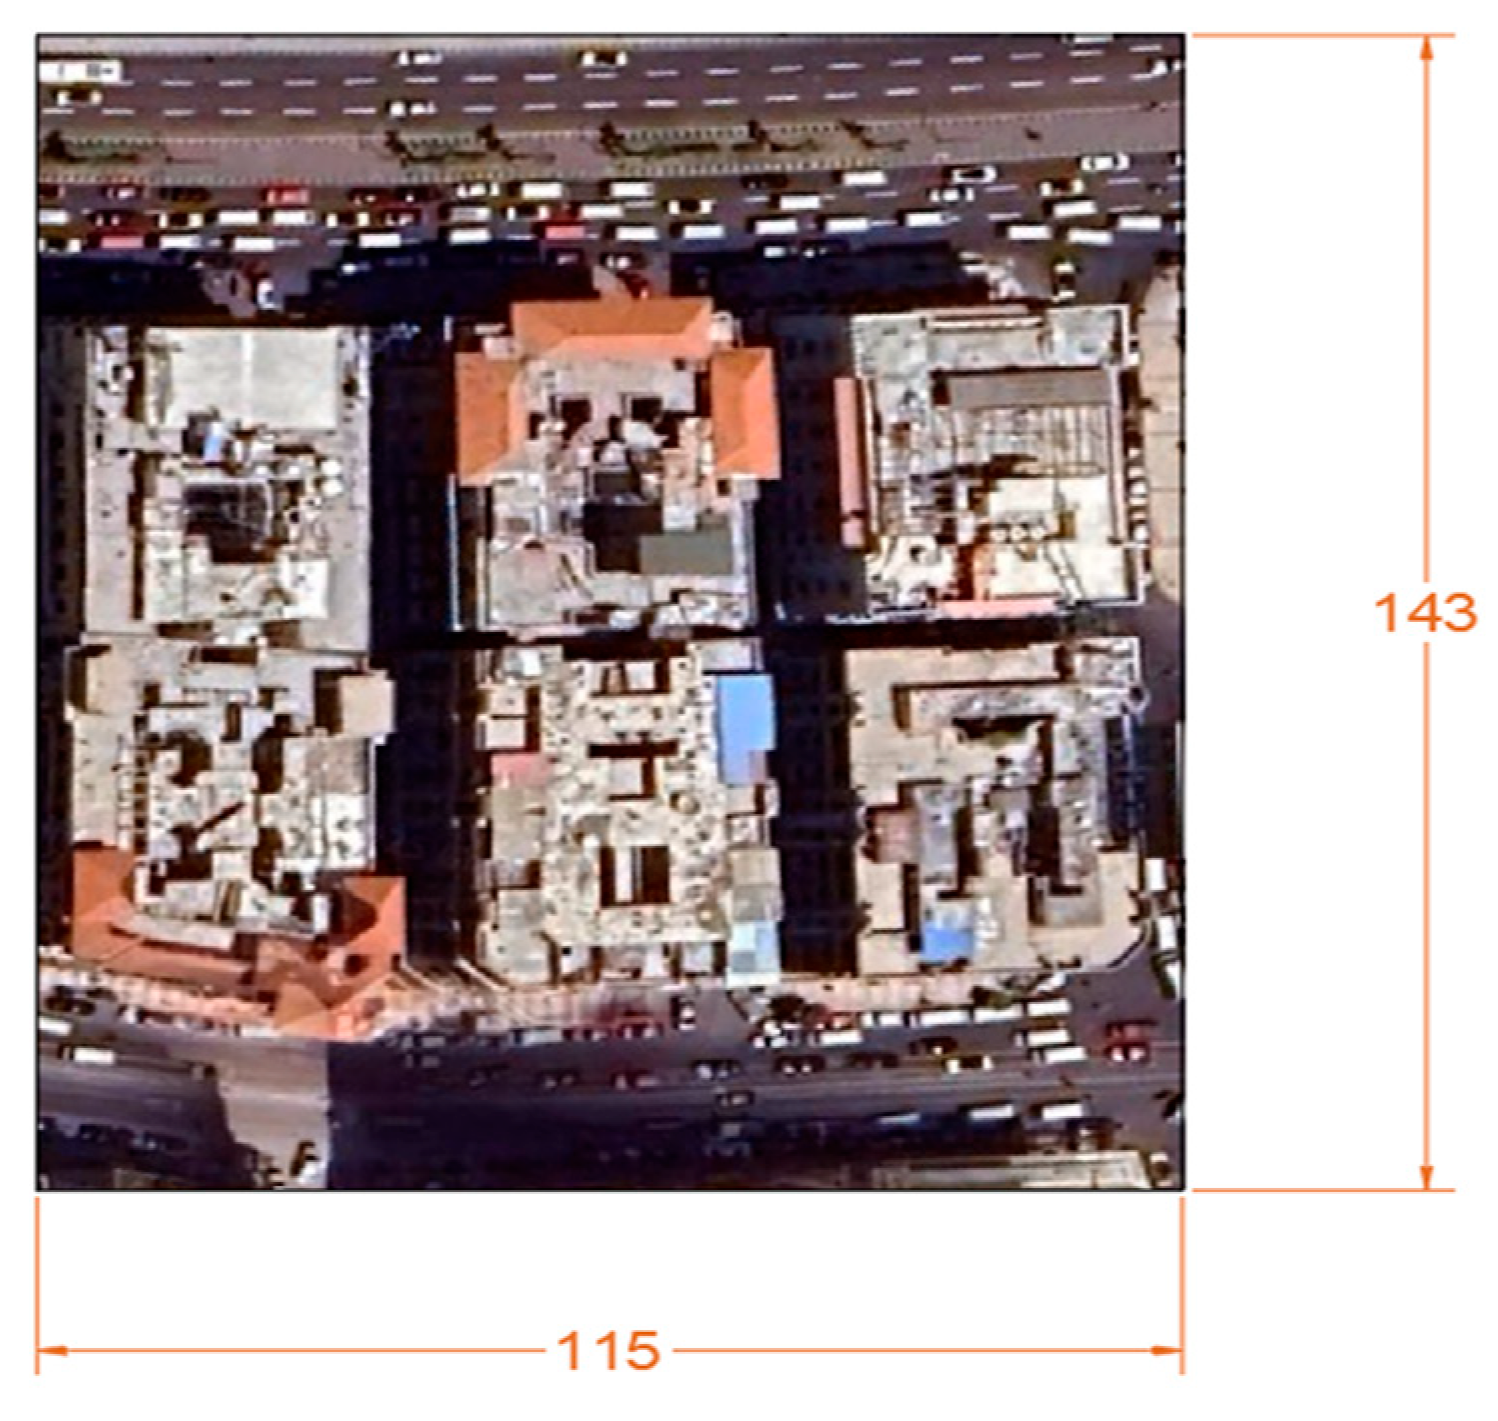
Figure 16.
Case study2 simulation model (3D view).
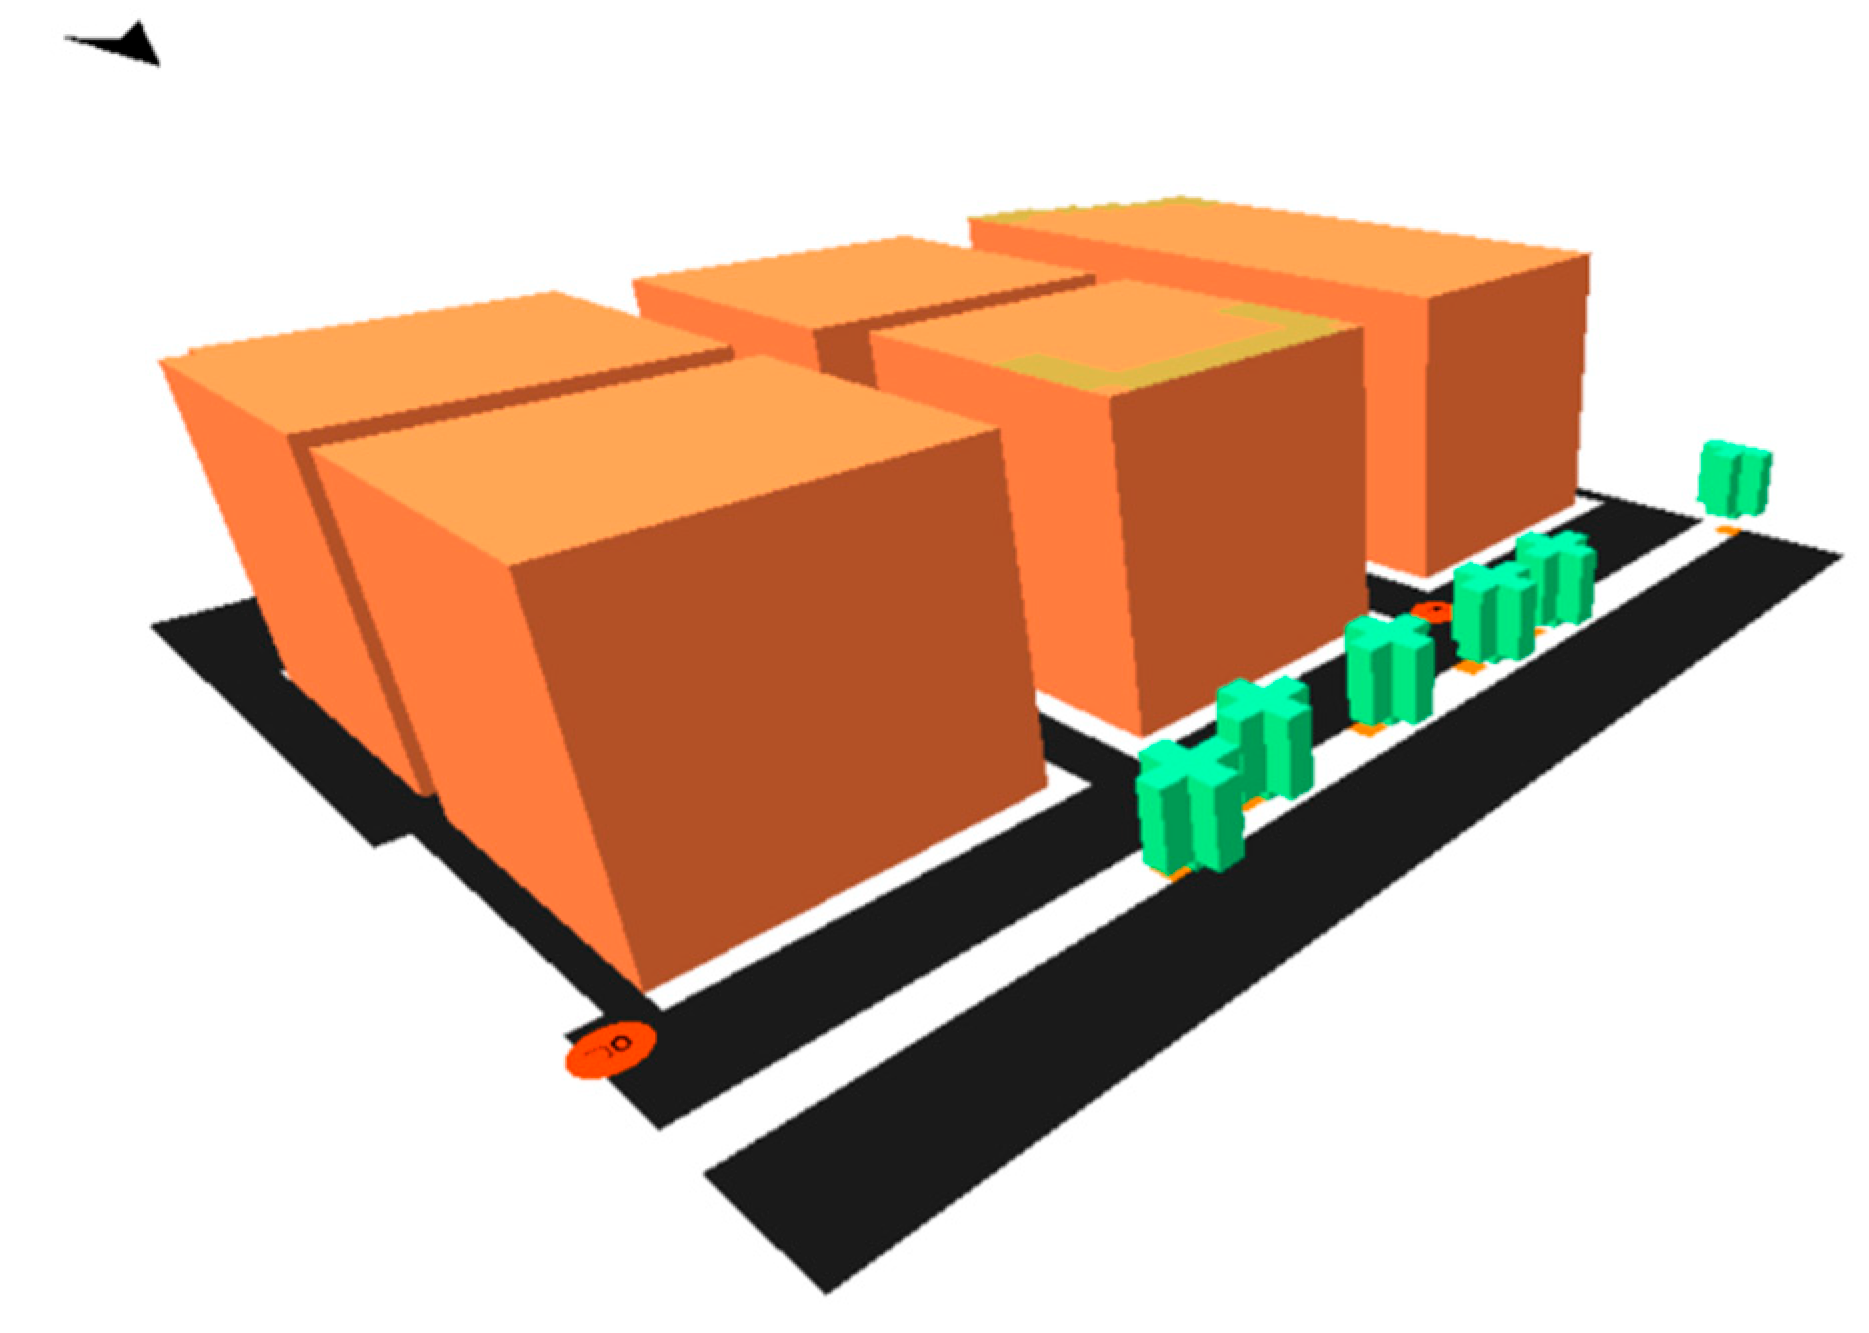
Figure 17.
Case study2 photos.
6.1.3. Case study3 (Courtyard Type)
Opposite Casino El-Shatby Traditional inward-facing blocks organized around internal courtyards. Emphasizes enclosure and privacy with limited external permeability. The urban block's floor area ratio is 1.46 and its building coverage ratio is around 30.33%. With building heights vary between 23 and 32m, the building's aspect ratio ranges from 1:0.70on main roads to 1:2.5on smaller local roads. Additionally, the Open Space Ratio is 69.7% and the Green Area Ratio is 0% (Figure 18).
Figure 18.
Case study3 location adapted from google maps.
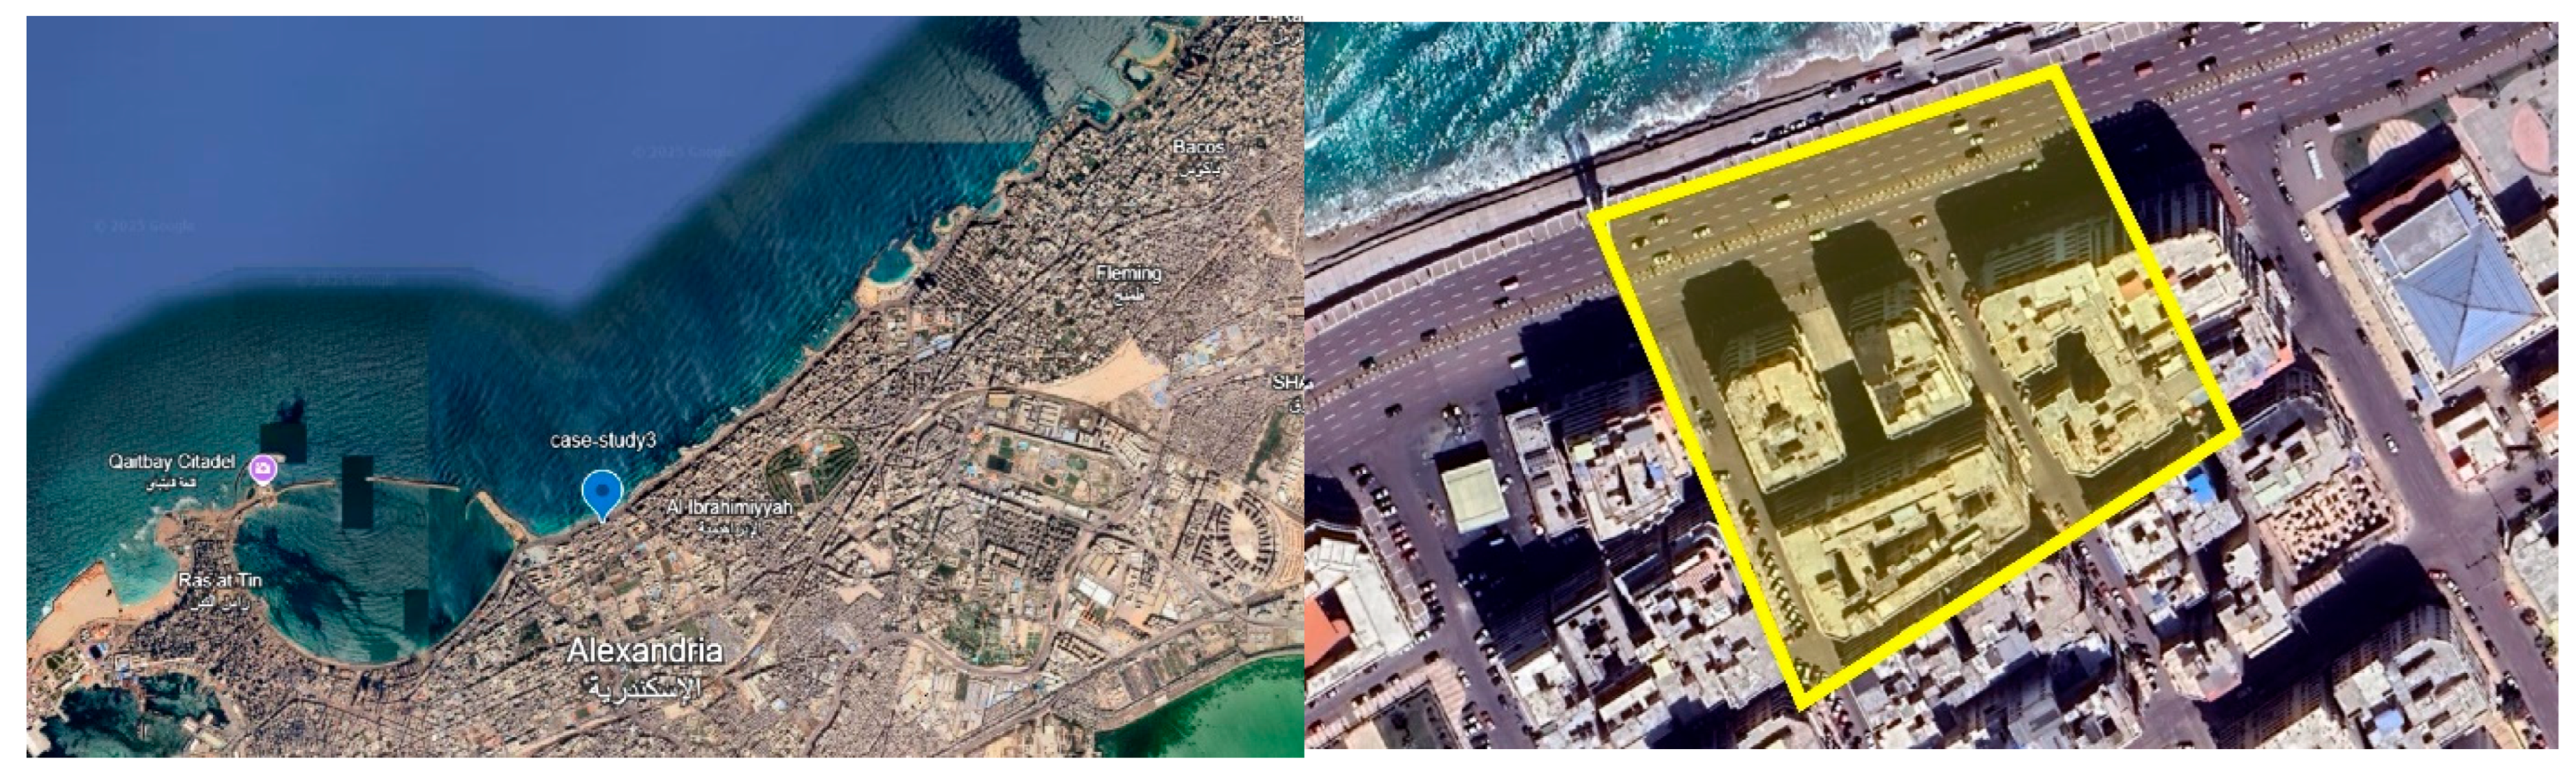
Figure 19.
Case study3 simulation model (plan view).
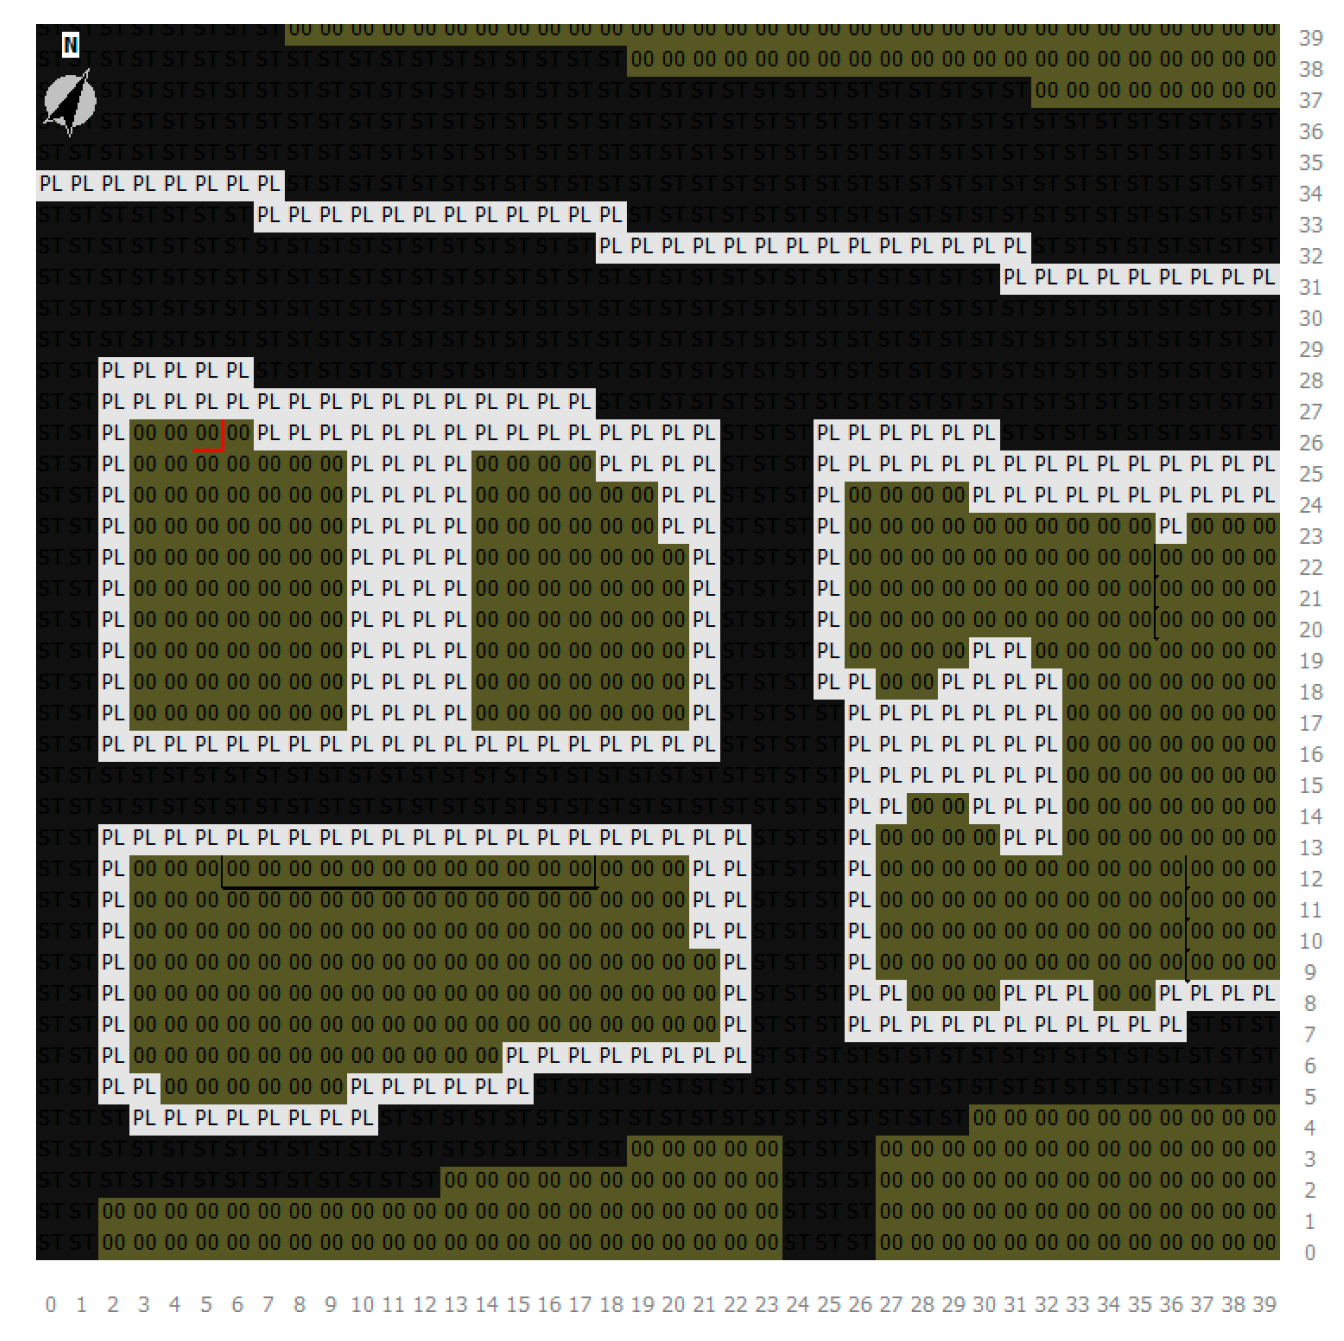
Figure 20.
Case study3 area dimensions.
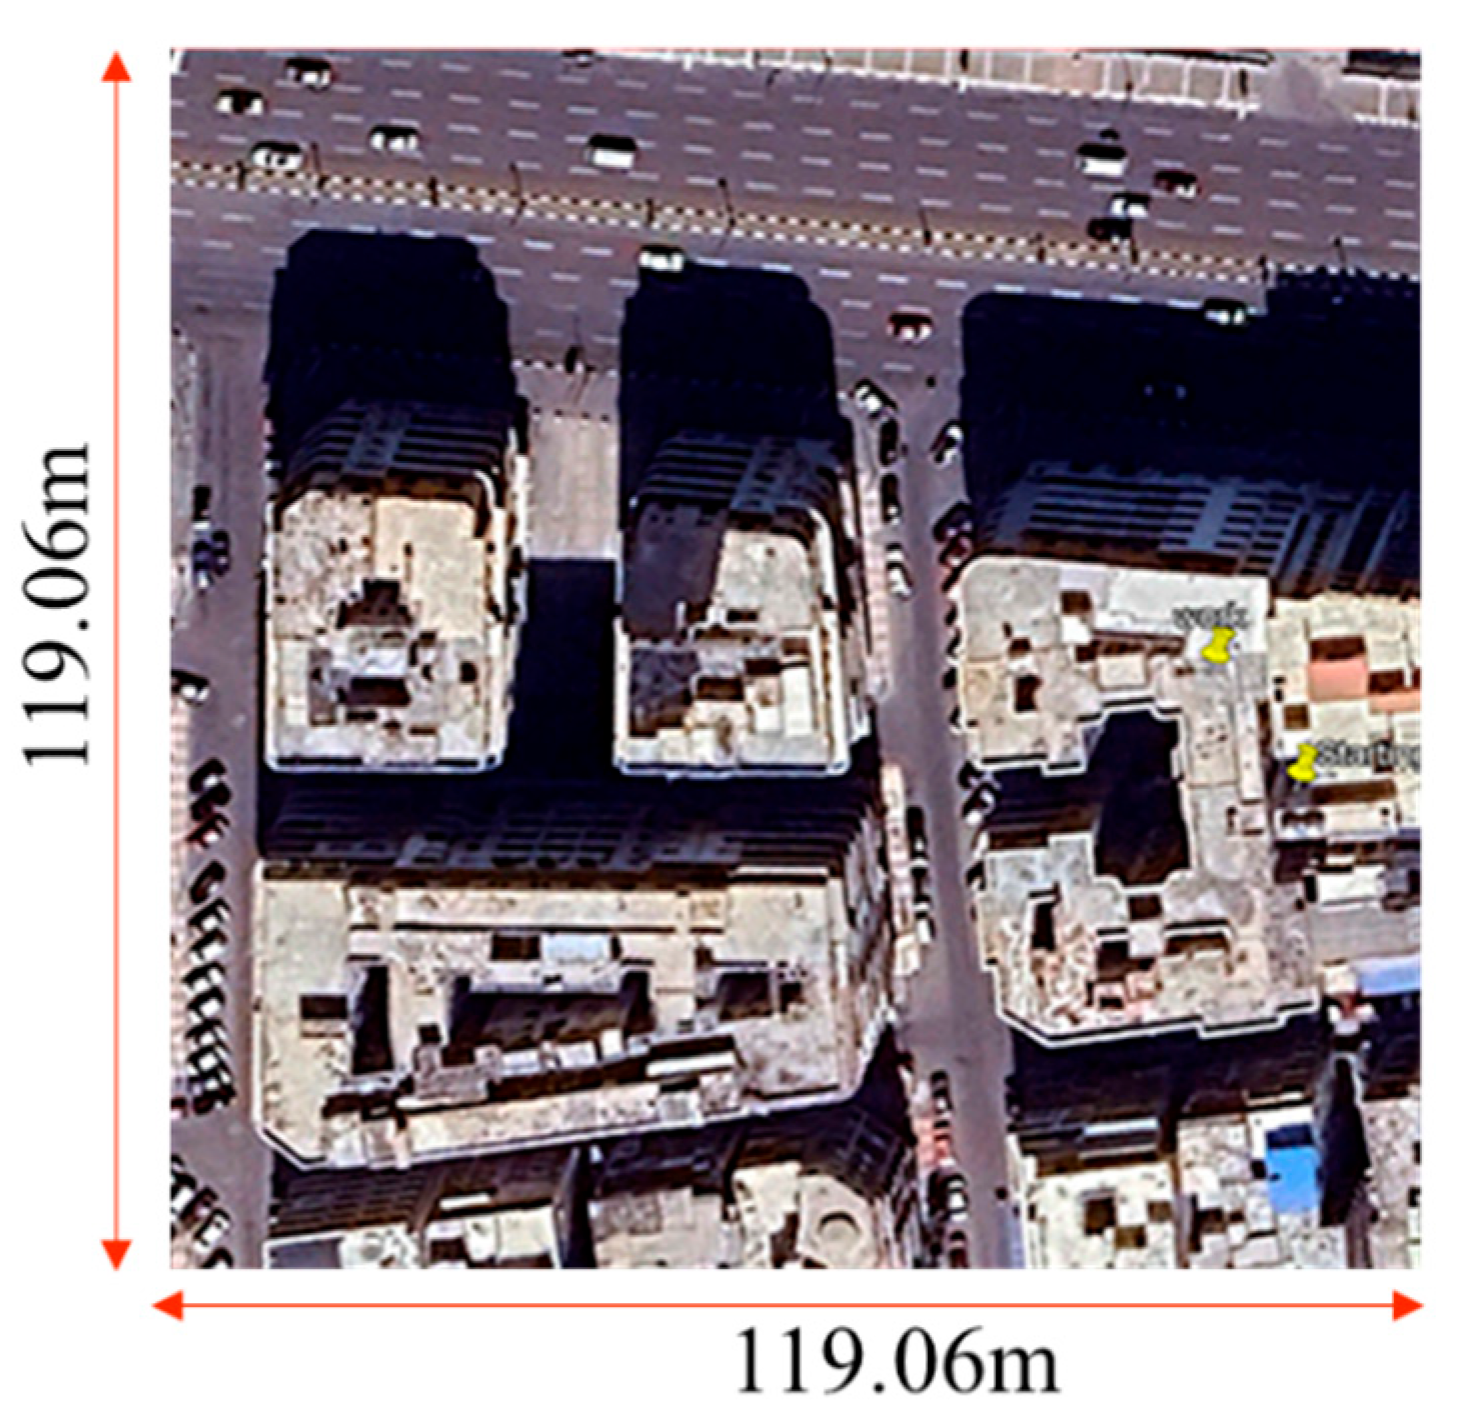
Figure 21.
Case study3 simulation model (3D view).
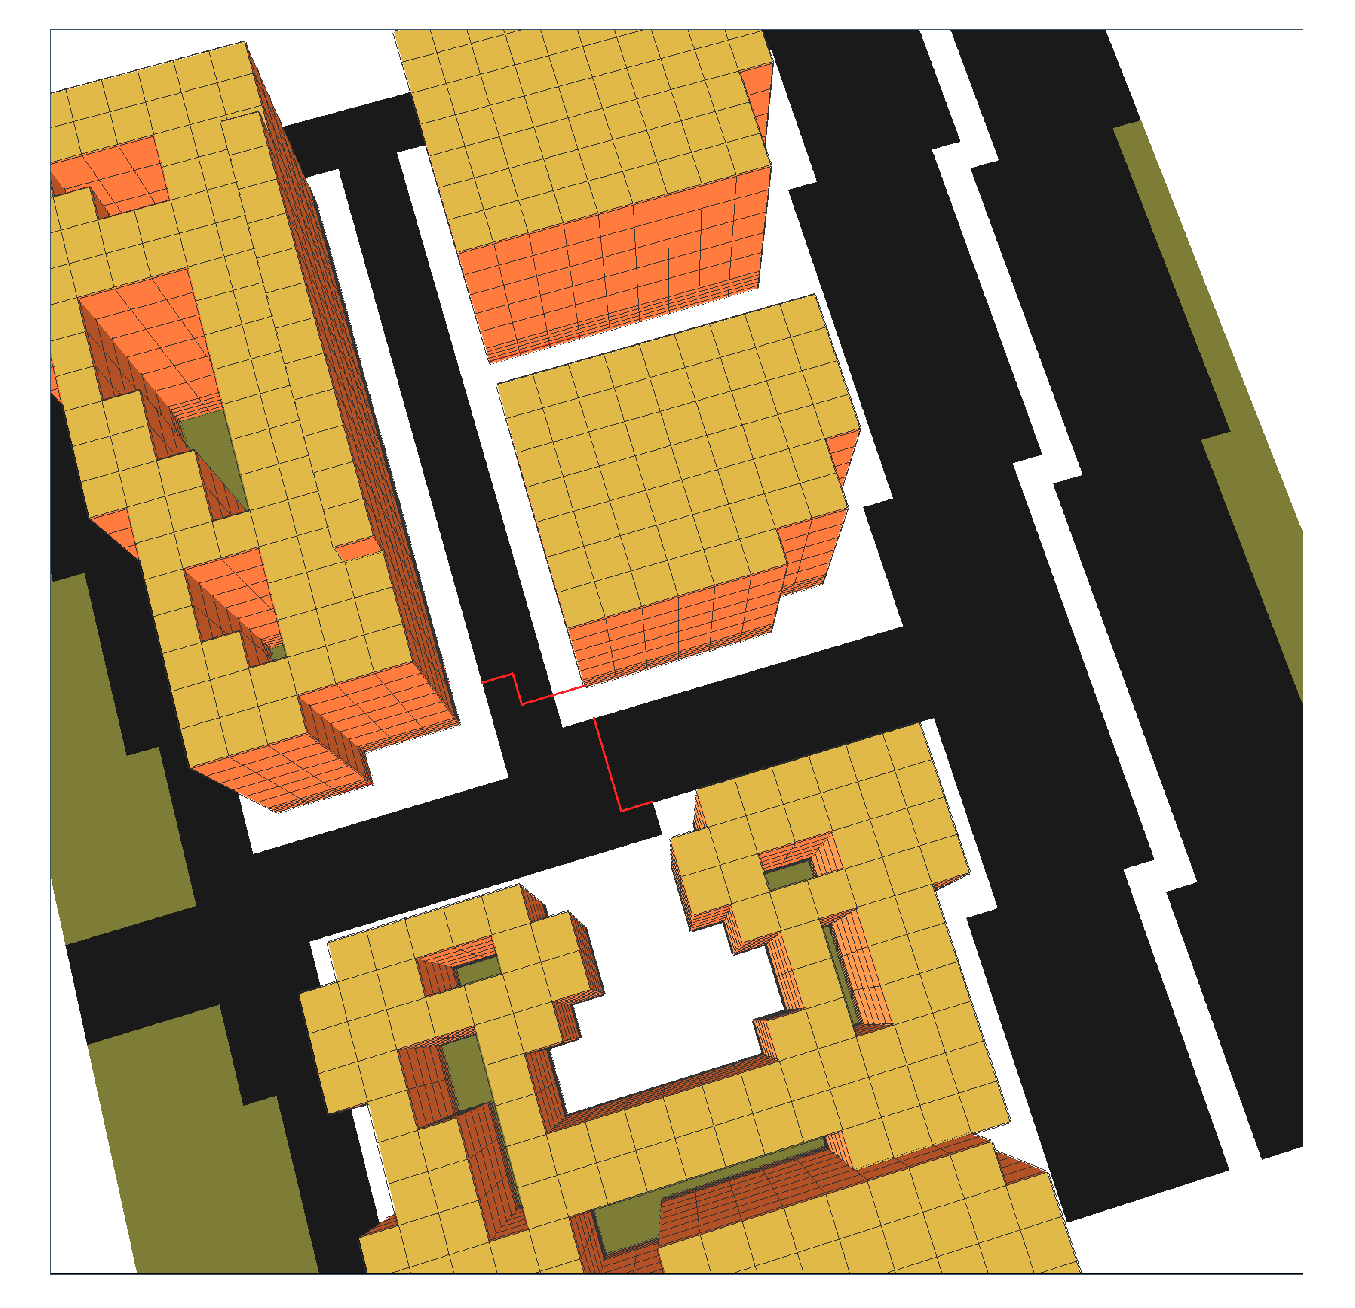
Figure 22.
Case study3 photos.
6.1.4. Case study4 (Dot Type)
Masaaken El-Zobbat A high-rise, low-density housing project featuring detached buildings with substantial open spaces between them. The urban block's floor area ratio is 3.66 and its building coverage ratio is around 21.5%. With 17 stories, the building's aspect ratio ranges from 2.8:1 on main roads to 4.3:1 on smaller local roads. Additionally, the Open Space Ratio is 78.5% and the Green Area Ratio is around 16.7% (Figure 23).
Figure 23.
Case study4 location adapted from google maps.
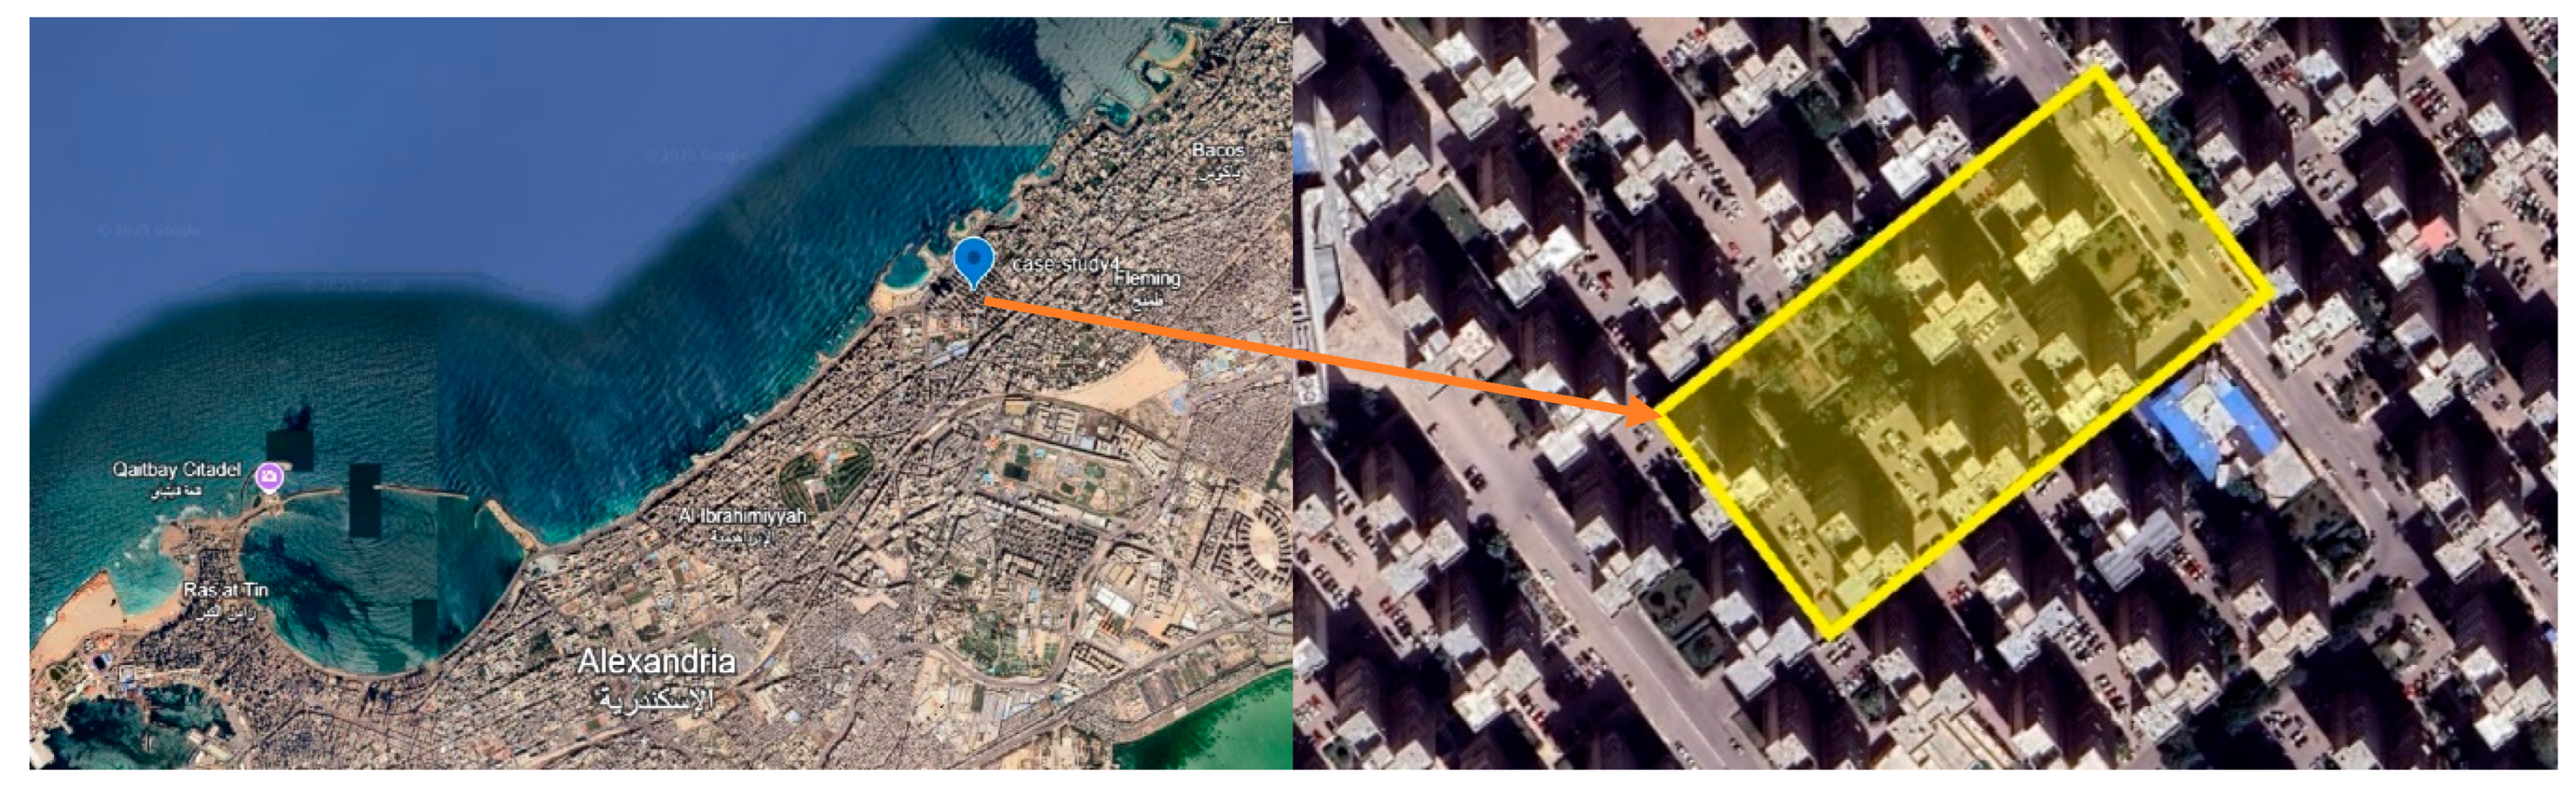
Figure 24.
Case study4 simulation model (plan view).
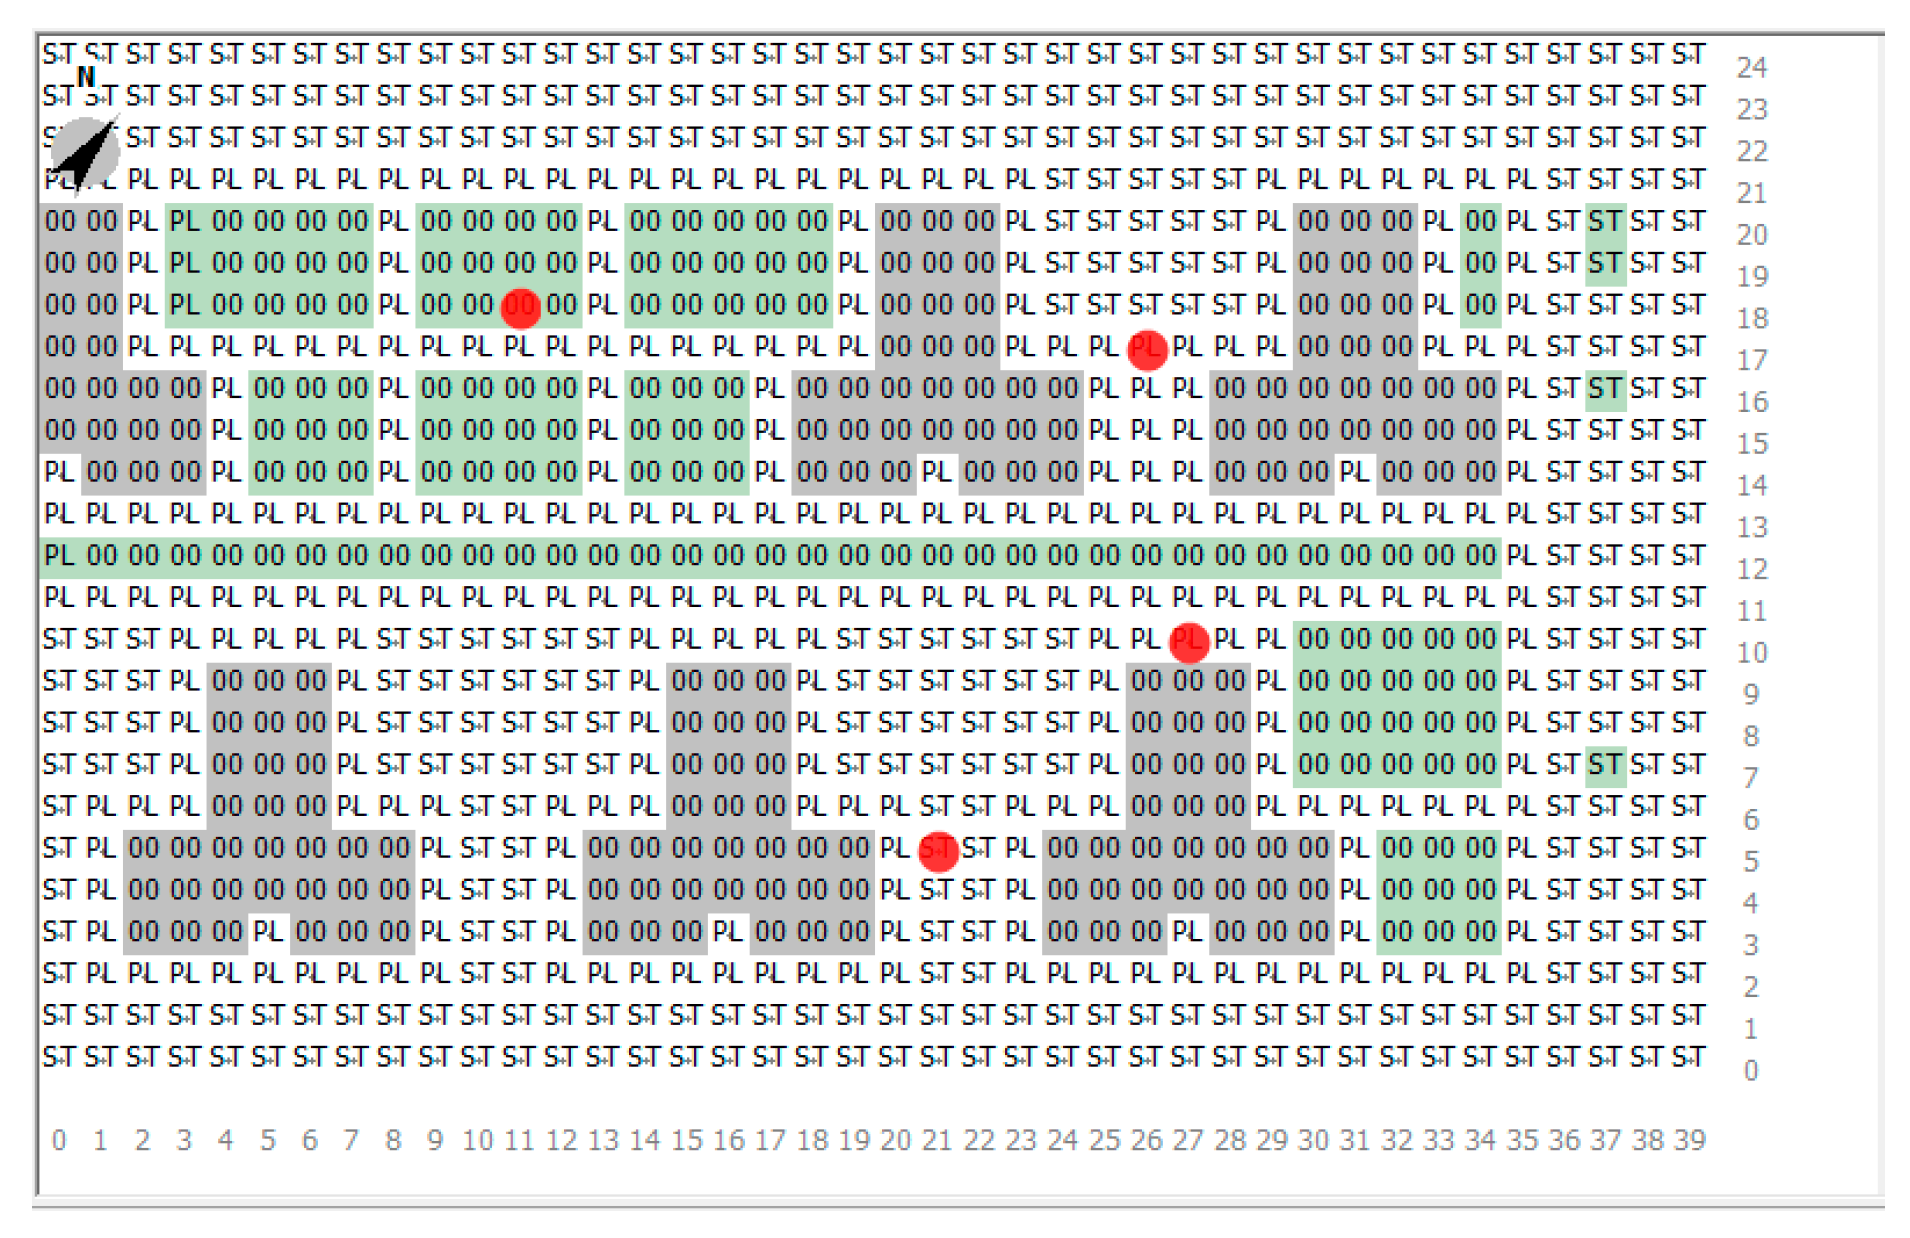
Figure 25.
Case study4 area dimensions.
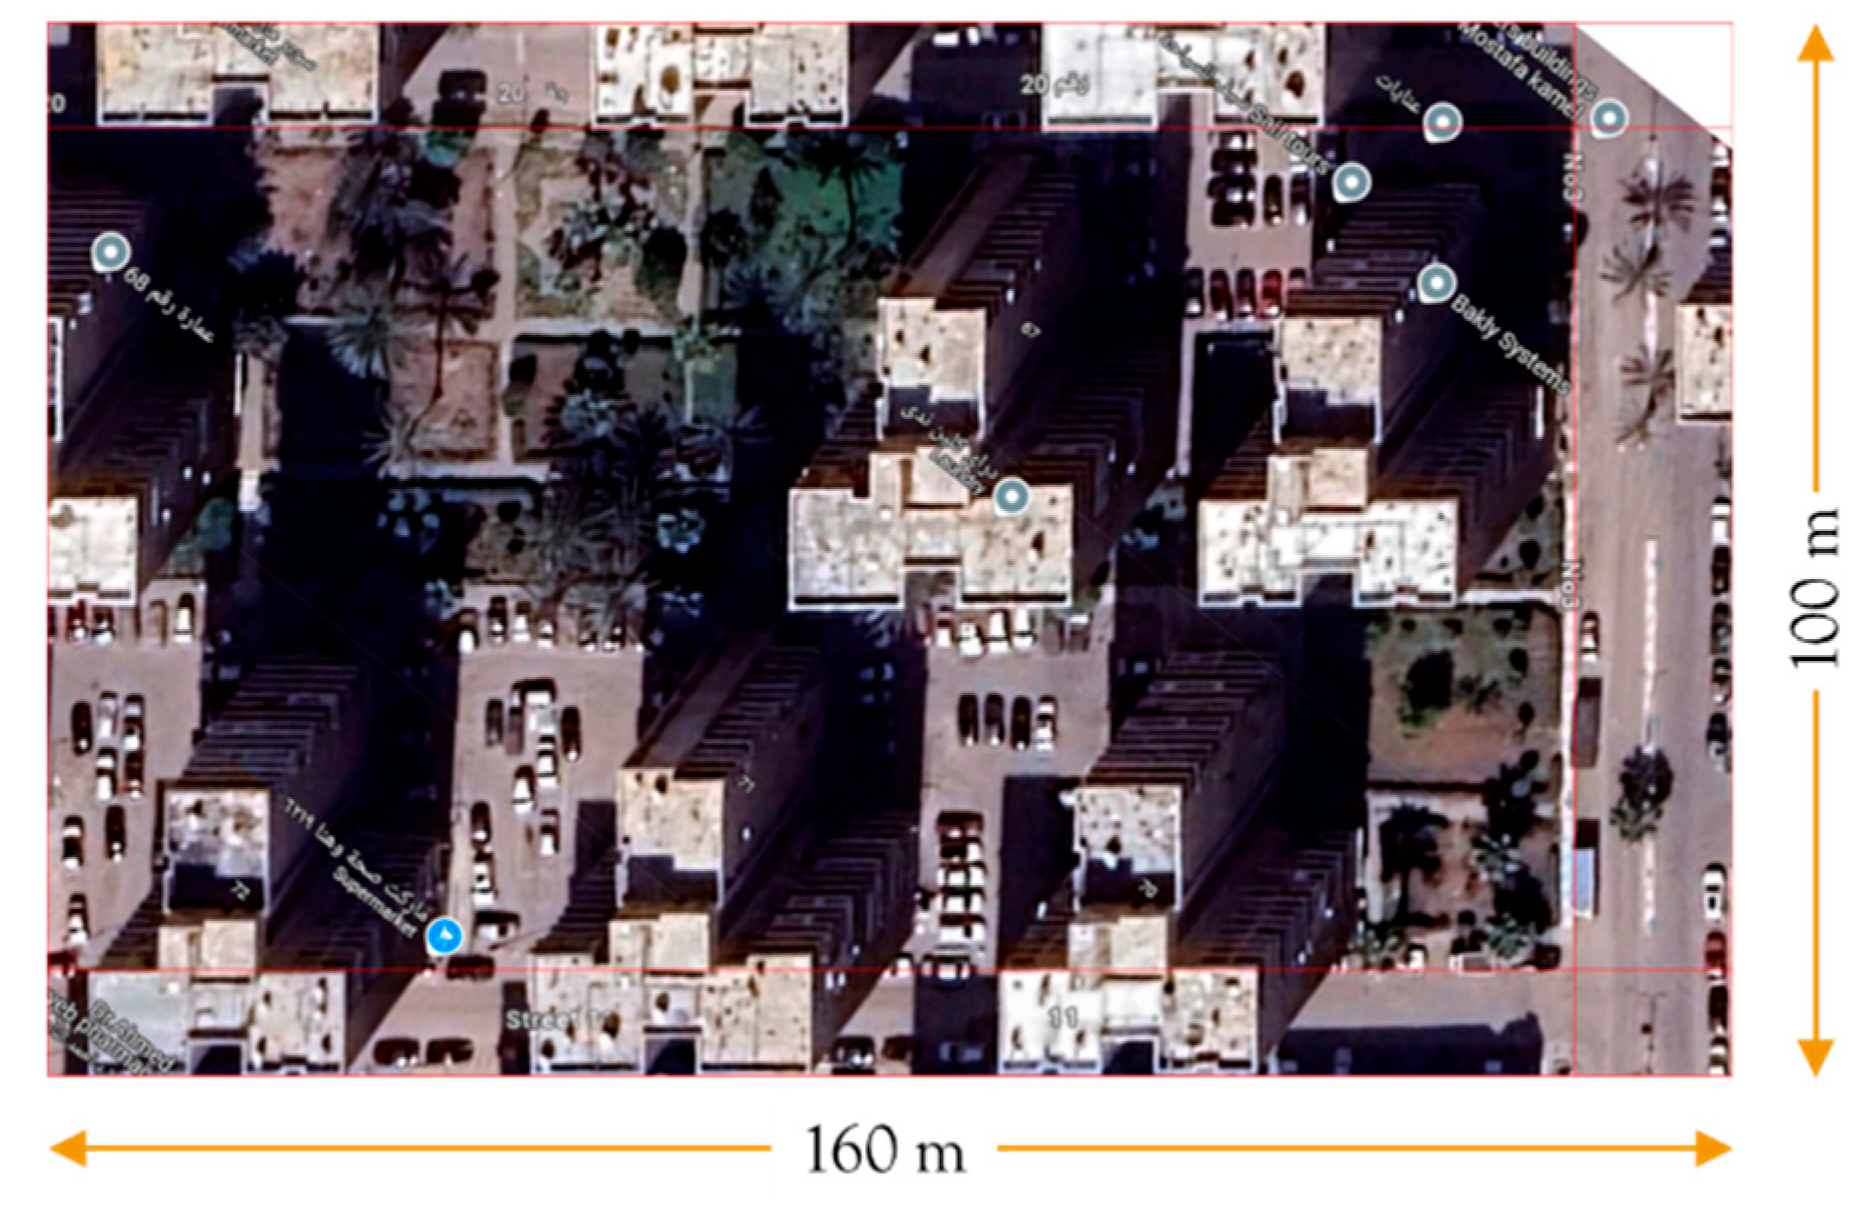
Figure 26.
Case study4 simulation model (3D view).

Figure 27.
Case study4 photos.
The primary spatial morphological characteristics derived from the basic example are displayed in Table 10.
6.2. Parameters Analyzed the Microclimatic Variables Analyzed Include
- Air Temperature (°C): Measures the thermal energy in the air.
- Mean Radiant Temperature (Tmrt): Represents perceived heat from surrounding surfaces and solar radiation.
- Relative Humidity (RH): Indicates the percentage of moisture in the air.
- Wind Speed (m/s): Affects thermal comfort and ventilation.
- Predicted Mean Vote (PMV): A widely used thermal comfort index that predicts the average thermal sensation of a large group of people based on air temperature, radiation, humidity, wind, metabolic rate, and clothing insulation.
6.3. Simulation Settings and Climate Data Inputs
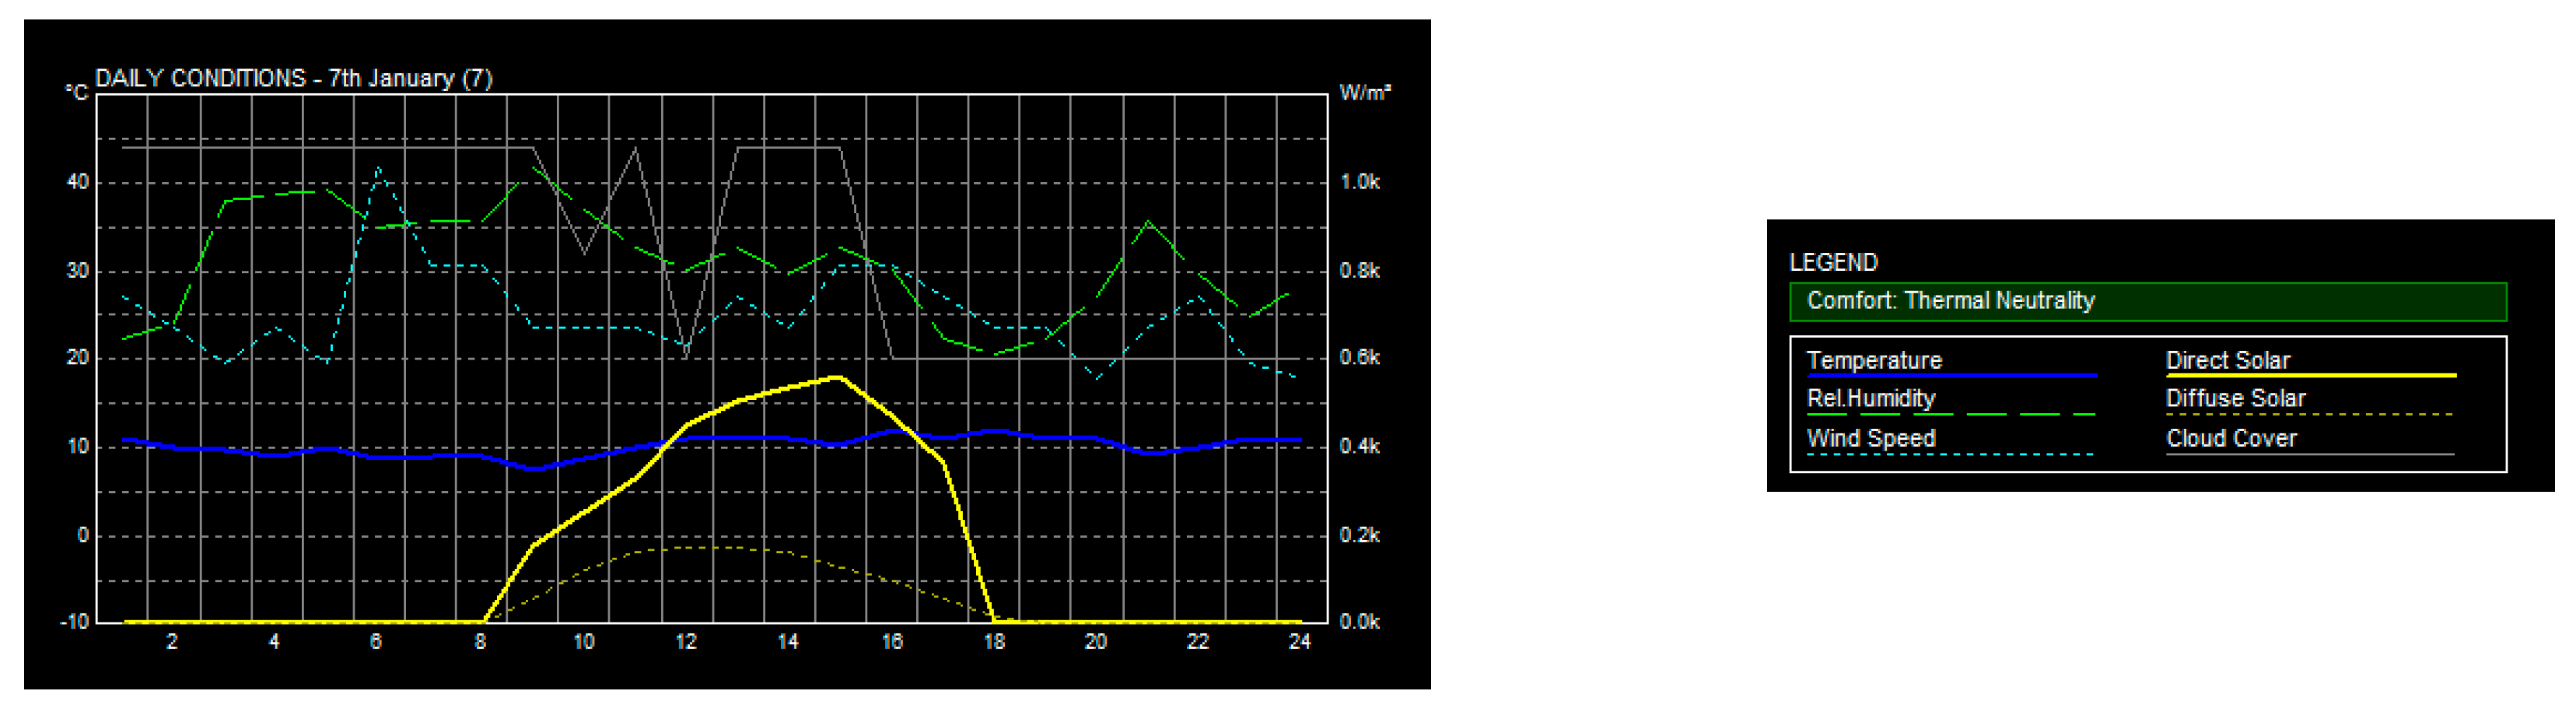
To achieve research aims, the study prioritizes climatic factors when selecting key building characteristics. Meteorological data for Alexandria was utilized to configure the climate parameters for the model. Alexandria-Nozha EPW weather data obtained from the EnergyPlus website. Alexandria situated in a coastal region, experiences a climate typified by hot summers, cold winters, and consistently high humidity levels throughout the year (Figure 29). The annual average air temperature stands at 20.8°C. During the summer months, the average temperature rises to 26.3°C, with peak temperatures reaching 38°C in June (Figure 30). Winter temperatures can drop to as low as 7°C in January. On 4th of June, identified as the hottest day, the average daily temperature reached 28.29°C, with humidity at 49.6% and an average northwest wind speed of 0.12 m/s. Conversely, on 7th of January, noted as the coldest day, the average temperature was 10°C, with a humidity level of 68.46% and a southwest wind speed of 0.58 m/s (Figure 31).
ENVI-met simulations were conducted for a typical summer day in Alexandria, which was 5th of June using Alexandria-Nozha EPW weather data obtained from the EnergyPlus website. Models were built based on real urban dimensions, materials, and vegetation. Each simulation ran for a 24-hour period to assess diurnal microclimate fluctuations. Table 11 details the experimental setup and parameter configurations used in the study.
6.4. Limitations of Methodology
Limitations include potential simplifications in modeling vegetation, building materials, and user behavior. ENVI-met does not account for internal heat gains or mechanical ventilation systems, and thus results focus solely on external climatic effects influenced by urban form and regulation
7. Results and Discussion
This section presents and interprets the simulation results derived from the ENVI-met analyses of the four selected urban typologies. Each case demonstrates a unique microclimatic behavior influenced by its physical form and the underlying regulatory framework. The discussion is organized around key environmental parameters: air temperature, mean radiant temperature (Tmrt), wind speed, relative humidity, and thermal comfort indices.
7.1. Result Discussion for Each Case
7.1.1. Case study1 (High-Density Type)
Case 1 Air Temperature
ENVI-met simulations revealed a clear temporal variation in air temperature within the courtyards between 15-17-story residential buildings. At 2:00 PM, the green space courtyards exhibited lower air temperatures compared to the adjacent built-up areas. This decrease was attributed to isolation from thermal activity, which cooled the surrounding air through latent heat exchange. Additionally, significant shading from surrounding buildings in most directions reduced direct solar gain, further enhancing the cooling effect. By 5:00 PM, the external cooling effect diminished, and the courtyards became significantly cooler than the surrounding built-up areas. This reversal can be explained by several interacting factors. First, temperatures dropped significantly as solar radiation diminished at sunset, increasing the primary cooling mechanism of enclosure and insulation. Second, the surrounding buildings, which had stored significant solar energy throughout the day, began releasing heat via longwave radiation from around 7:00 PM, warming the confined space. Third, the urban canyon effect created by the high-rise buildings likely trapped the re-radiated heat, preventing it from being dissipated efficiently. As a result, the enclosed space transformed from a daytime cooling zone into an evening heat-accumulating pocket (Figure 35).
This observation highlights the importance of assessing local climate performance not only during the midday hours, but also at different times of the day. It also highlights how urban form and material properties interact with enclosed spaces to influence local thermal comfort, with potential implications for the design of climate-responsive enclosed spaces in dense residential areas (Figure 35).
Case 1 Wind Speed
Simulation results showed that wind speeds exhibited slight fluctuations throughout the day, with more pronounced spatial than temporal variation. The lowest wind speeds were consistently recorded around built-up areas, particularly in the narrow spaces adjacent to 15-17-story residential buildings. This decrease is attributed to the obstruction and diversion of airflow caused by building density and building height, which create turbulence, shading, and stagnation zones (Figure 36).
In contrast, open areas located away from tall buildings and with fewer physical barriers also experienced higher wind speeds, confirming the expected relationship between urban openness and breathability. Interestingly, the enclosed space between dense buildings exhibited slightly higher wind speeds: faster than those in open areas and areas surrounded by buildings. This suggests that, despite being isolated from external streets, the density of buildings does not impede wind flow into enclosed areas; rather, it may help reduce the dispersion of airflow rather than completely blocking it. These results underscore the crucial role of urban morphology in shaping wind patterns. High-density areas, both in terms of space and height, can significantly limit natural ventilation, potentially exacerbating problems such as heat buildup and poor air quality. On the other hand, strategically integrated enclosed spaces can act as a conduit for airflow, supporting airflow without excessively blocking the air (Figure 36).
Case 1 Relative Humidity
The ENVI-met simulation revealed a diurnal pattern in relative humidity, characterized by a very noticeable decrease at 5:00 AM, followed by a gradual increase throughout the rest of the day, with a peak in the residential area around 5:00 PM. This pattern is consistent with local climatic behavior, where relative humidity is inversely related to temperature, decreasing with increasing solar radiation and air temperature during the day, and rising again with nighttime cooling (Figure 37).
Spatially, relative humidity levels were observed to be slightly higher around built-up areas from 8:00 AM to 9:00 PM around the built-up area compared to the open area. This could be due to the shading effects of buildings and the reduced air movement near them, which can reduce evaporation and allow more suspended moisture to remain in the air (Figure 37).
However, starting at 2:00 PM, a shift was observed: the relative humidity in the enclosed courtyard area began to rise, eventually exceeding the ambient humidity. This is likely due to a delayed release of moisture from the building to the outdoors, which begins to increase once solar radiation intensity decreases. In contrast, streets and open areas cool rapidly but do not contribute to atmospheric humidity. This shift highlights the role of outdoor surfaces in humidifying the atmosphere in urban environments during the day. While they may initially exhibit a decrease in humidity during peak sun hours due to active evaporation in the surrounding open areas, they tend to retain and gradually release moisture in the early evening and early morning, enhancing nighttime microclimate comfort (Figure 37).
Case 1 Mean Radiant Temperature (Tmrt)
While air temperature across the study area remained relatively moderate throughout the day, ranging between 20 and 27°C, the mean radiant temperature (Tmrt) showed much greater variability and reached extreme values, exceeding 90°C in some outdoor locations in front of residential buildings, particularly during the hours of 6 a.m. to 6 p.m. This striking variability highlights the important role of solar radiation and surface materials in influencing radiant heat exposure, regardless of ambient air conditions (Figure 38).
A marked decrease in Tmrt was observed in shaded areas, particularly in the open courtyards between high-rise residential buildings. The spatial distribution of low radiant temperature areas closely followed the shading patterns of buildings, which shifted with the sun's path and direction. These shaded areas provided localized relief from intense thermal radiation, even when air temperatures remained constant (Figure 38).
In courtyards, Tmrt values were lower than those of the surrounding built-up areas and streets during the middle of the day until approximately 7:00 PM, likely due to the combined effects of shade from tall buildings and active evaporation. However, after this period, the average temperature in courtyards located between high-density buildings began to increase, in some cases exceeding the average temperature in adjacent areas. This reversal is attributed to the decrease in shading with the movement of the sun (Figure 38).
These observations reinforce the idea that the average temperature in enclosed areas is highly sensitive to both surface properties and solar building geometry, and that interior courtyards do not always provide thermal comfort throughout the day unless carefully designed with sun orientation and shading dynamics in mind (Figure 38).
Case 1 Predicted Mean Vote (PMV) Index
The simulation results indicated that the PMV (Predicted Mean Vote) index consistently exceeded the thermal comfort range, which is defined by ASHRAE standards as between –0.5 and +0.5 (Figure 39).
Throughout the day, PMV values in the study area ranged from approximately -0.47 to +8.32, reflecting conditions that ranged from slightly warm to extremely hot and uncomfortable (Figure 39).
This thermal discomfort was closely associated with high Tmrt values, especially in exposed areas during the middle of the day. In contrast, sites that benefited from building shading exhibited significantly lower PMV values, indicating improved thermal comfort. These areas demonstrated the critical role of solar protection in mitigating severe radiative heat stress and enhancing pedestrian comfort (Figure 39).
Thus, building form, height, surrounding density, and sun orientation in the study area proved to be key determinants in shaping the human thermal experience. Despite relatively moderate air temperatures, the combined effect of high Tmrt and low wind speeds in exposed areas contributed to the high PMV values, underscoring the importance of designing urban microclimates that consider both radiation control and ventilation to ensure acceptable outdoor thermal comfort (Figure 39).
7.1.2. Case study2 (Strip Type):
Case 2 Air Temperature
ENVI-met simulations revealed a clear temporal variation in air temperature within the empty strip located between seven-story residential buildings. In the early morning hours, the space exhibited lower air temperatures compared to the adjacent built-up areas. This decrease was attributed to the shade cast by the buildings, which cooled the surrounding air by dissipating latent heat. Partial shading from the surrounding buildings reduced direct solar gain, increasing the cooling effect. The relatively low thermal mass also contributed to the lower daytime temperatures (Figure 40).
However, by 7:00 PM, this cooling effect diminished, and the empty space became significantly warmer. This reversal can be explained by several interacting factors. The surrounding buildings, which had stored significant solar energy throughout the day, began to release heat via longwave radiation, warming the confined space. Third, the urban canyon effect created by the buildings likely trapped the re-radiated heat, preventing it from being dissipated efficiently. As a result, the space transformed from a daytime cooling zone to an evening heat-accumulating pocket, albeit not as hot. This observation highlights the importance of assessing local climate performance not only at midday, but also at different times of the day. It also highlights how urban form, building material properties, and building height interact to affect local thermal comfort, with potential implications for the design of climate-responsive confined spaces in residential strip areas (Figure 40).
Case 2 Wind Speed
Simulation results showed that wind speeds exhibited slight fluctuations throughout the day, with more pronounced spatial than temporal variation. The lowest wind speeds were consistently recorded around built-up areas, particularly in the narrow spaces adjacent to residential buildings approximately seven stories high. This decrease is attributed to the obstruction and diversion of airflow caused by the density and height of buildings, which cause turbulence, shading, stagnation zones, and wind tunnels in the interstitial streets (Figure 41).
In contrast, open areas located farther from buildings and containing fewer physical barriers experienced lower wind speeds, with the highest wind speeds occurring directly next to buildings, confirming the expected relationship between interstitial streets in areas with adequate population density and breathability. Interestingly, the interstitial spaces between buildings sometimes exhibited slightly higher wind speeds, faster than those in open areas. This suggests that, despite the isolation of buildings from external streets, the density of buildings does not impede wind flow into interstitial streets; rather, it may help reduce the dispersion of airflow rather than completely blocking it. These results underscore the crucial role of urban morphology in shaping wind patterns. Areas with adequate population density, both in terms of area and height, such as the buildings in this case, can significantly regulate natural ventilation. Conversely, the interstitial spaces represented by streets between strategically integrated buildings can act as conduits for airflow, supporting it as efficiently as possible (Figure 41).
Case 2 Relative Humidity
The ENVI-met simulation revealed a diurnal pattern in relative humidity, characterized by a very noticeable drop at 7:00 a.m., followed by a gradual increase throughout the rest of the day, with a peak in residential areas in the evening. This pattern is consistent with local climatic behavior, where relative humidity is inversely related to temperature, decreasing with increasing solar radiation and air temperature during the day, and rising again with decreasing nighttime temperatures (Figure 42).
Spatially, slightly higher relative humidity levels were observed around built-up areas from 5:00 p.m. to 6:00 a.m. compared to open areas. This may be due to the shading effects of buildings, which may reduce evaporation and allow more suspended moisture to remain in the air (Figure 42).
However, starting at 5:00 p.m., a shift was observed: relative humidity in the built-up area began to rise, eventually exceeding the ambient humidity. This is likely due to a delayed release of moisture from the building to the outdoors, which begins to increase as solar radiation intensity decreases. In contrast, streets and open areas cool rapidly but do not contribute to atmospheric humidity. This shift highlights the role of outdoor surfaces in humidifying the atmosphere in urban environments during the day. While they may initially exhibit low humidity during peak sun hours due to active evaporation in surrounding open areas, they tend to retain and gradually release moisture in the early evening and early morning, enhancing microclimate comfort at night (Figure 42).
Case 2 Mean Radiant Temperature (Tmrt)
While the air temperature in the study area remained relatively moderate throughout the day, the mean radiant temperature (Tmrt) showed much greater variability and reached extreme values, exceeding 80°C in some outdoor locations in front of residential buildings, particularly during the hours of 6:00 a.m. to 6:00 p.m. This marked variability highlights the important role of solar radiation and surface materials in influencing radiant heat exposure, regardless of ambient air conditions (Figure 43).
A significant decrease in mean radiant temperature (Tmrt) was observed in shaded areas adjacent to buildings, particularly in the streets between residential buildings. The spatial distribution of areas with low mean radiant temperature (Tmrt) closely followed the shading patterns of buildings, which varied with the path and direction of the sun. These shaded areas provided localized relief from intense thermal radiation, even with constant air temperatures (Figure 43).
On interstress, Tmrt values were lower than those on the main surrounding streets and unshaded areas during the afternoon and until approximately 6:00 p.m., likely due to the combined effects of shade from residential buildings and active evaporation. However, after this period, the average temperature on interstreets between residential buildings began to rise, in some cases exceeding the average temperature in the adjacent areas. This reversal is attributed to the decrease in shading as the sun moves (Figure 43).
Case 2 Predicted Mean Vote (PMV) index
Simulation results indicated that the PMV (Mean Volumetric Ventilation) index exceeded the ASHRAE standard set of -0.5 to +0.5 (Figure 44).
Over the course of the day, PMV values in the study area ranged between approximately -0.38 and +8.37, clearly indicating that they ranged from slight to not significantly noticeable (Figure 44).
This discomfort was related to the correlation with Tmrt values, particularly on main streets during the day. In contrast, locations that utilized the shading of adjacent buildings exhibited significantly higher PMV values, indicating improved thermal comfort. These are areas where the role of X-ray protection is critical to the effects of stress and the urgent need for comfort (Figure 44).
Thus, the appearance of the building, the adjacent streets, and the direction of the sun in the area are recorded separately by the human heat profile. Although there is partial air squareness in the region, the effect of increased lung swelling in exposed areas contributes to higher PMV values, which means it is important to design local urban climates that take into account the applicable thermal comfort elements in the region (Figure 44).
7.1.3. Case study3 (Courtyard Type):
Case 3 Air Temperature
The ENVI-met simulation, conducted between 12:00 PM and 6:00 PM, revealed an unexpected yet insightful thermal behavior within the inward-facing block opposite Casino El-Shatby. Among the two observed courtyard types, one fully enclosed and one semi-enclosed, the fully enclosed courtyard consistently exhibited lower air temperatures throughout the afternoon period (Figure 45).
This cooling performance is primarily attributed to the extensive shading provided by the surrounding buildings, which significantly reduced direct solar exposure during peak hours. The courtyard's enclosed geometry limited solar access, especially during the hottest part of the day, creating a microclimate with reduced thermal gain despite the lack of vegetation (0% green area ratio). The dense built form acted as a passive shading system, buffering the interior space from excessive radiation (Figure 45).
Conversely, the semi-enclosed courtyard, which allowed more sky view and exposure, experienced higher air temperatures due to increased solar penetration and limited shading. While its openness offered potential for airflow, the absence of vegetative cooling and the presence of heat-retaining materials allowed solar energy to accumulate more intensively. As a result, this space became a localized heat island within the block (Figure 45).
These findings challenge conventional assumptions about courtyard openness and ventilation. They highlight that strategic shading, when not paired with vegetation, can still significantly enhance thermal comfort, especially in dense residential environments. The results underscore the importance of carefully balancing enclosure, orientation, and surface treatments to optimize microclimatic performance across different courtyard types (Figure 45).
Case 3 Wind Speed
Simulation results revealed that wind speed within the urban block opposite Casino El-Shatby showed limited temporal fluctuation during the daytime period, with spatial differences being more significant. The lowest wind speeds were consistently observed within and around the fully enclosed courtyard, which is surrounded by high-rise buildings (23–32 meters). This reduction in wind flow is primarily attributed to the dense vertical massing, which obstructs prevailing winds, creating zones of stagnation, turbulence, and wind shadowing (Figure 46).
By contrast, the semi-enclosed courtyard and peripheral open spaces exposed to wider streets exhibited higher wind speeds, owing to greater openness and reduced obstruction. These zones allowed more direct penetration of airflow, confirming the link between spatial openness and increased ventilation potential (Figure 46).
Interestingly, transitional areas, those partially open but still influenced by adjacent built forms, experienced moderate wind speeds. These results align with the expectation that urban morphology plays a decisive role in shaping micro-scale airflow. While vegetation was absent in this case (0% green area ratio), the varying degrees of enclosure among the courtyards produced clear differences in wind accessibility (Figure 46).
These findings underscore the need to consider both building geometry and spatial permeability when designing for urban ventilation. High-density blocks with enclosed forms may severely limit natural airflow, potentially compounding thermal discomfort and reducing air quality. Introducing porous edges or integrating controlled green corridors could enhance airflow distribution without exposing spaces to excessive wind (Figure 46).
Case 3 Relative Humidity
The ENVI-met simulation revealed a diurnal pattern in relative humidity, characterized by a gradual decline from the early morning (around 7:00 AM) to the afternoon hours, followed by a modest increase towards the evening. This pattern mirrors typical microclimatic behavior, as relative humidity is inversely related to air temperature, decreasing with rising solar radiation during the day and increasing again as temperatures fall (Figure 47).
Spatially, from morning until early afternoon (up to around 2:00 PM), relative humidity levels were slightly higher within the fully enclosed courtyard, due to deep shading, limited air movement, and lower direct solar exposure. These conditions helped slow down moisture loss from surfaces and air, even in the absence of vegetation. The semi-enclosed courtyard, by contrast, exhibited lower humidity levels due to greater openness and increased heat gain, which accelerated drying and reduced localized moisture (Figure 47).
Unlike vegetated zones, which can gradually release moisture through evapotranspiration, the paved and impervious surfaces in this case did not contribute to atmospheric moisture. As a result, relative humidity remained relatively low across the site in the afternoon, with no significant late-day recovery observed (Figure 47).
These findings illustrate the limitations of hardscaped environments in regulating urban humidity, especially in dense residential blocks lacking vegetation. While shaded built forms may retain moisture better during peak hours, the absence of soil and plant-based moisture buffering results in a consistently dry microclimate, potentially reducing overall thermal comfort and air quality (Figure 47).
Case 3 Mean Radiant Temperature (Tmrt)
While the air temperature across the El-Shatby case remained relatively stable—ranging between 22°C and 28°C during the analyzed period (12:00 PM to 6:00 PM)—the Mean Radiant Temperature (Tmrt) showed considerably higher spatial variability. Simulation results revealed a stark contrast in Tmrt values, ranging from 29.86°C in fully shaded zones to a peak of 51.89°C in semi-exposed courtyard areas during peak afternoon hours. This wide range reflects the critical impact of solar exposure and urban morphology on radiant heat loads, independent of ambient temperature conditions (Figure 48).
The fully enclosed courtyard, surrounded by tall residential blocks, consistently recorded lower Tmrt values, owing to persistent shading and limited sky exposure throughout the afternoon. The combination of high building walls and minimal openings effectively reduced direct solar gain, creating a thermally buffered microclimate despite the absence of vegetation (Figure 48).
In contrast, the semi-enclosed courtyard experienced higher Tmrt, especially between 1:00 PM and 4:00 PM. Its partial openness allowed more direct solar radiation to reach the surface, resulting in elevated radiant heat, particularly in areas without shading from adjacent buildings (Figure 48).
These findings emphasize the importance of urban form, courtyard configuration, and solar orientation in managing radiant heat stress. Even in vegetation-scarce environments, architectural shading, through enclosed courtyards and optimized building massing, can offer passive thermal comfort benefits, particularly during high-radiation periods (Figure 48).
Case 3 Predicted Mean Vote (PMV) index
The ENVI-met simulation revealed that PMV (Predicted Mean Vote) values across the El-Shatby case study consistently exceeded the ASHRAE-defined thermal comfort range of –0.5 to +0.5. PMV readings fluctuated between +1.3 and +4.1 during the analysis period, reflecting a transition from moderate warmth to severe thermal discomfort, particularly in fully exposed areas during the afternoon hours (Figure 49).
This discomfort closely mirrored the spatial distribution of high Tmrt values, with the most extreme PMV conditions occurring in the semi-enclosed courtyard, where exposure to direct solar radiation was prolonged and where limited vertical shading failed to mitigate heat buildup (Figure 49).
Conversely, the fully enclosed courtyard, despite the lack of vegetation, exhibited noticeably lower PMV values, ranging around +1.3 to +2.2. The improved thermal performance in this space is attributed to the substantial shading provided by the surrounding high-rise structures, which effectively reduced solar gain and radiant heat load (Figure 49).
These results underscore the critical influence of urban form and solar orientation in shaping outdoor thermal comfort. Despite relatively moderate air temperatures, the combination of intense radiant exposure (high Tmrt) and low wind speed in semi-exposed zones contributed to elevated PMV values. Therefore, in compact urban settings like El-Shatby, passive shading strategies and microclimatic wind corridors are essential design considerations for mitigating thermal stress and enhancing pedestrian comfort (Figure 49).
7.1.4. Case study4 (Dot Type):
Case 4 Air Temperature
The ENVI-met simulation revealed a distinct temporal variation in air temperature within the planted area located between the 17-story residential buildings. At 2:00 PM, the green space exhibited lower air temperatures compared to adjacent built-up zones. This reduction is attributed to active evapotranspiration, where vegetation released water vapor, cooling the surrounding air through latent heat exchange. Additionally, partial shading from the surrounding buildings reduced direct solar gain, further enhancing the cooling effect. The relatively low thermal mass of vegetation and soil compared to built materials also contributed to the lower daytime temperatures (Figure 50).
However, by 5:00 PM, this cooling effect diminished, and the planted area became warmer than surrounding built-up zones. This reversal can be explained by several interacting factors. First, evapotranspiration significantly decreased as solar radiation waned, eliminating the vegetation’s primary cooling mechanism. Second, the surrounding buildings, having stored significant solar energy throughout the day, began to release heat through longwave radiation, warming the confined space. Third, the urban canyon effect created by the tall buildings likely trapped reradiated heat, preventing efficient dissipation. As a result, the green space shifted from a daytime cooling zone to an evening heat-accumulating pocket (Figure 50).
This observation underscores the importance of evaluating microclimatic performance not only at midday but across different times of day. It also highlights how urban form and material properties interact with vegetative cover to influence local thermal comfort, with potential implications for designing climate-responsive open spaces in dense residential areas (Figure 50).
Case 4 Wind Speed
Simulation results revealed that wind speed exhibited minimal fluctuation throughout the day, with spatial rather than temporal variation being more pronounced. The lowest wind speeds were consistently recorded around the built-up zones, particularly in the immediate surroundings of the 17-story residential buildings. This reduction can be attributed to obstruction and deflection of airflow caused by the dense urban form and building height, which create zones of turbulence, shadowing, and stagnation (Figure 51).
In contrast, open areas, those located farther from tall structures and with fewer physical barriers, experienced significantly higher wind speeds, confirming the expected relationship between urban openness and ventilation potential. Interestingly, the planted area located between the buildings exhibited intermediate wind speeds: lower than those in open zones but higher than in areas closely surrounded by built mass. This suggests that vegetation, while introducing some surface roughness, does not obstruct wind flow as significantly as buildings do, and may even help to guide or diffuse airflow rather than block it entirely (Figure 51).
These findings emphasize the critical role of urban morphology in shaping wind patterns. Areas with dense vertical development can significantly limit natural ventilation, which may exacerbate issues such as heat accumulation and poor air quality. Strategically integrated green spaces, on the other hand, can act as transitional ventilation buffers, supporting airflow without causing excessive wind sheltering (Figure 51).
Case 4 Relative Humidity
The ENVI-met simulation revealed a diurnal pattern in relative humidity, characterized by a steady decrease from 7:00 AM to 3:00 PM, followed by a gradual increase into the evening and night, with a peak occurring around midnight. This pattern aligns with typical microclimatic behavior, as relative humidity is inversely related to temperature, decreasing as solar radiation and air temperature increase during the day, and rising again with nighttime cooling (Figure 52).
Spatially, during the early morning until 1:00 PM, relative humidity levels were observed to be slightly higher around the built-up zones compared to the planted area. This could be attributed to shading effects and lower air movement near the buildings, which can reduce evaporation and allow more moisture to remain in the air (Figure 52).
However, starting from 2:00 PM, a shift was observed: relative humidity in the green area began to rise, eventually surpassing that of the surrounding built environment. This is likely due to the delayed moisture release from the vegetation and soil, which begins to dominate once the intensity of solar radiation declines. In contrast, the impervious surfaces in built-up areas cool quickly but do not contribute to atmospheric moisture (Figure 52).
This transition highlights the role of vegetated surfaces as dynamic moisture regulators in urban environments. While they may initially exhibit lower humidity during peak sun hours due to active evapotranspiration, they tend to retain and gradually release moisture in the later part of the day, enhancing nighttime microclimatic comfort (Figure 52).
Case 4 Mean Radiant Temperature (Tmrt)
While the air temperature across the study area remained relatively moderate throughout the day, ranging between 20°C and 27°C, the Mean Radiant Temperature (Tmrt) showed far greater variability and reached extreme values, exceeding 80°C in certain locations, particularly during midday hours. This stark contrast highlights the significant role of solar radiation and surface materials in influencing radiant heat exposure, independent of ambient air conditions (Figure 53).
A notable decrease in Tmrt was observed in shaded areas, especially around the tall residential buildings. The spatial distribution of low Tmrt zones closely followed the building shadow patterns, which shifted with the sun’s path and orientation. These shaded zones provided localized relief from intense thermal radiation, even when air temperatures remained constant (Figure 53).
In the planted zone, Tmrt values were lower than surrounding built-up areas during the morning until around 2:00 PM, likely due to the combined effects of vegetative shading, lower surface albedo, and active evapotranspiration. However, after this period, Tmrt in the green area began to increase, in some cases surpassing that of nearby built-up zones. This reversal could be due to the reduced shading as the sun shifted, along with increased exposure of open vegetated surfaces to direct solar radiation, especially when no tall structures blocked the afternoon sun (Figure 53).
These observations reinforce the idea that Tmrt is highly sensitive to both surface characteristics and sun–building geometry, and that vegetated spaces do not always provide thermal comfort throughout the day unless carefully designed with solar orientation and shading dynamics in mind (Figure 53).
Case 4 Predicted Mean Vote (PMV) index
The simulation results indicated that the PMV (Predicted Mean Vote) index consistently exceeded the thermal comfort range, which is defined by ASHRAE standards as between –0.5 and +0.5. Throughout the day, PMV values in the study area ranged from approximately +0.6 to as high as +4.68, reflecting conditions that ranged from slightly warm to extremely hot and uncomfortable (Figure 54).
This thermal discomfort was closely correlated with high values of Tmrt, particularly in exposed areas during midday. In contrast, locations that benefited from building shade showed significantly lower PMV values, indicating improved thermal comfort. These zones demonstrated the crucial role of solar protection in mitigating extreme radiant heat stress and enhancing pedestrian comfort (Figure 54).
The built form and solar orientation thus proved to be key determinants in shaping human thermal experience. Despite moderate air temperatures, the combined effect of high Tmrt and low wind speeds in exposed areas contributed to elevated PMV values, underlining the importance of designing urban microclimates that account for both radiation control and ventilation to ensure acceptable outdoor thermal comfort (Figure 54).
7.2. Comparison Between the Four Cases At 12:00 PM
Table 12.
showing Air Temp, Wind Speed, Tmrt, Relative Humidity, and PMV at 12:00 PM in Case study 1, 2, 3, and 4.
Table 12.
showing Air Temp, Wind Speed, Tmrt, Relative Humidity, and PMV at 12:00 PM in Case study 1, 2, 3, and 4.
 |
7.3. Comparison Between the Four Cases
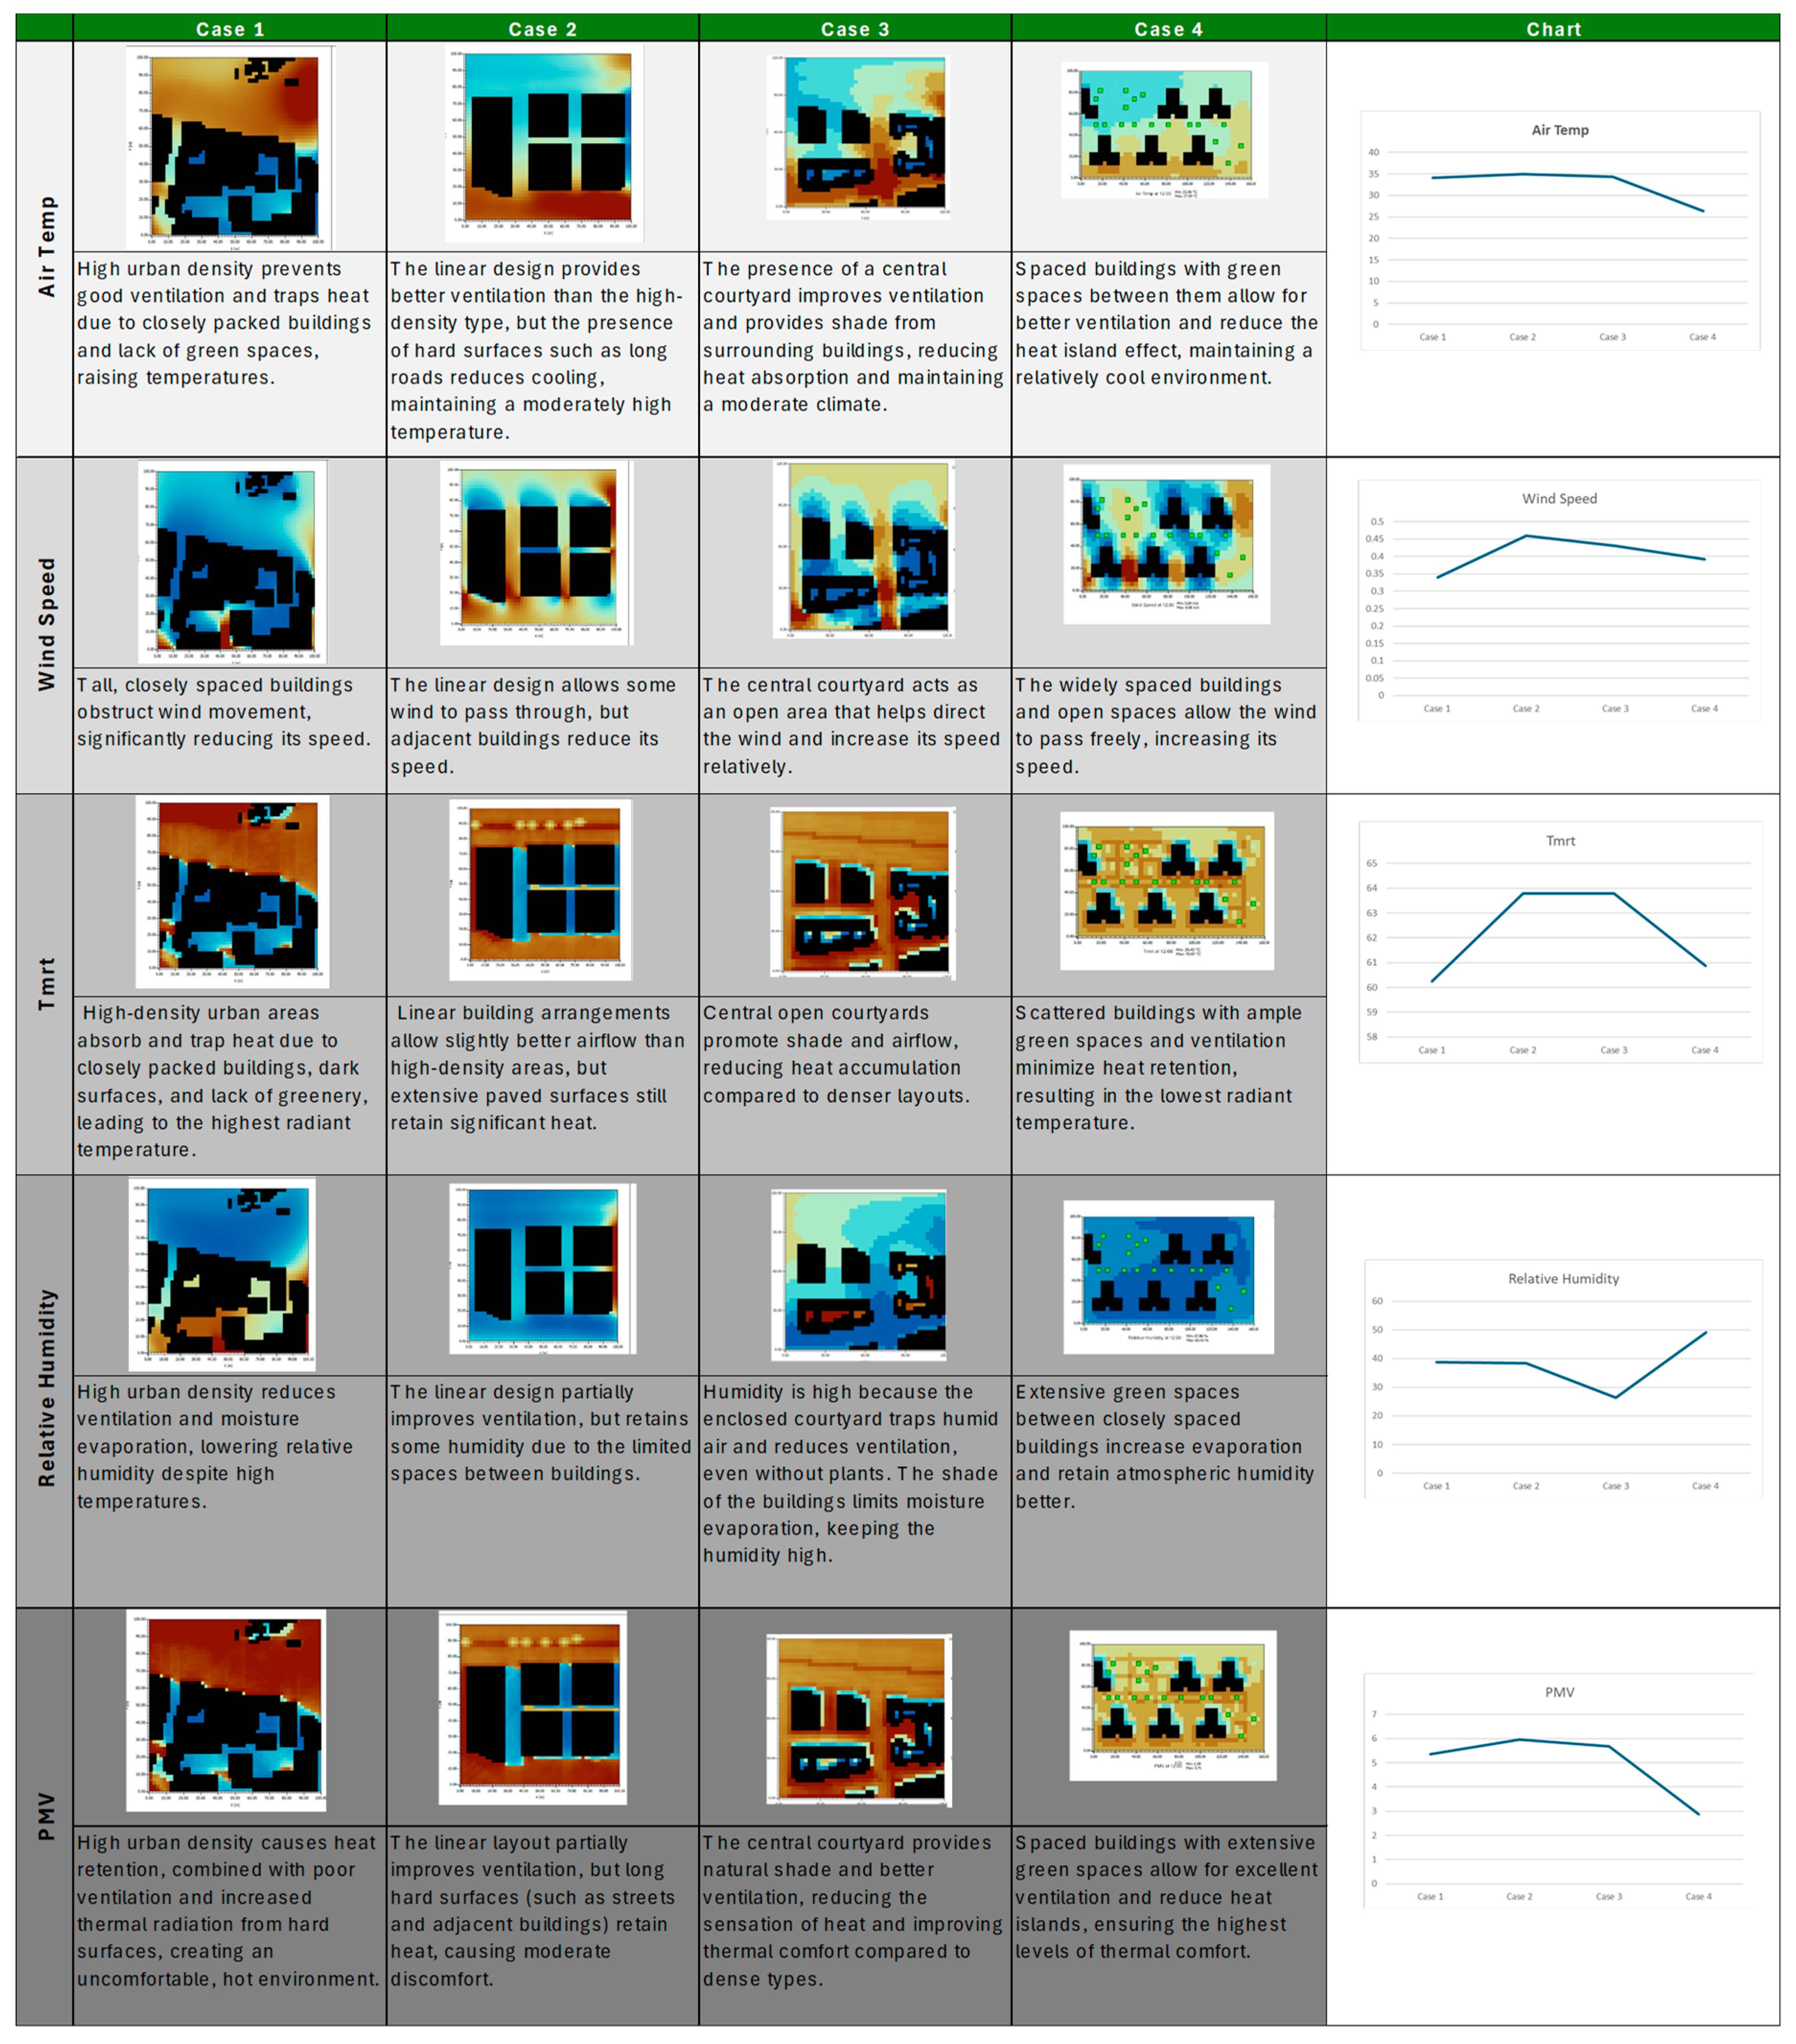
7.3.1. Air Temperature
Air temperature showed significant variations across the four studied urban typologies. The densely built area (Case 1), characterized by high-rise buildings (50 meters) with minimal spacing, recorded consistently higher temperatures during the daytime. This is due to reduced ventilation and high thermal mass, which leads to greater heat absorption and retention. In contrast, Case 4, which contains detached buildings surrounded by 16% green coverage, exhibited lower air temperatures during the morning and early afternoon. The vegetation contributed to evapotranspirative cooling, especially when combined with building shadows (Figure 55).
However, in Case 4, the air temperature in the vegetated zone began to rise in the late afternoon and evening, surpassing temperatures in other cases. This is likely due to reduced evapotranspiration after sunset and radiated heat from surrounding buildings, illustrating a reversal of cooling benefits during the night (Figure 55).
7.3.2. Wind speed
Wind speed was lowest in Case 1, where closely spaced high-rise buildings created a barrier effect that disrupted airflow and caused stagnation in the narrow urban canyons. Case 2, with its strip-shaped, perpendicular building arrangement, allowed for relatively improved wind flow, enhancing the potential for passive cooling (Figure 56).
The vegetated area in Case 4 showed moderate wind speeds, falling between the open zones and obstructed urban fabric. Vegetation does not significantly impede wind flow compared to solid structures and may even channel airflow depending on the planting design. This indicates the importance of considering both building geometry and vegetation in promoting urban ventilation (Figure 56).
7.3.3. Relative Humidity
Relative humidity across all zones followed a diurnal pattern, decreasing from 7 AM until 3 PM and then gradually increasing, peaking at midnight. In the morning to early afternoon, humidity was slightly higher around buildings compared to the vegetated zone, likely due to moisture trapped in shaded, enclosed areas (Figure 57).
Interestingly, from 2 PM onward, relative humidity in the green area began to rise faster than in built zones, eventually surpassing them. This shift may be attributed to reduced solar radiation, less evapotranspiration-driven drying, and increased moisture retention in vegetated soils and plant surfaces during the evening (Figure 57).
7.3.4. Tmrt
Tmrt displayed extreme variations across urban configurations, with values exceeding 80°C in exposed areas during solar noon, despite air temperatures ranging between 20°C and 27°C. This highlights the disproportionate influence of solar radiation on perceived thermal load (Figure 58).
Shaded areas, especially those created by building shadows in Cases 1 and 3, showed significantly lower Tmrt values, improving comfort conditions locally. The vegetated zone in Case 4 exhibited low Tmrt in the morning due to canopy shading and low surface reflectance, but experienced an increase after 2 PM, likely because of reflected radiation from adjacent buildings and reduced shade due to the sun’s changing angle (Figure 58).
7.3.5. PMV
PMV values, which estimate thermal comfort on a scale where 0 represents ideal comfort, were consistently above the comfort range (±0.5) in all cases. Recorded values ranged from +0.6 to +4.68, indicating moderate to extreme thermal discomfort, particularly around noon and in exposed areas (Figure 59).
Areas with dense shading, such as narrow alleys between buildings and the inner courtyards in Case 3, showed slightly lower PMV, demonstrating the effectiveness of architectural shading in mitigating thermal stress. Case 4 also offered moderate thermal comfort during early daytime hours due to vegetation, but the effect diminished in the evening, as the combination of high Tmrt and elevated air temperature pushed PMV values higher (Figure 59).
Table 13.
Comparative Analysis of Microclimatic Indicators Across the Four cases
| Microclimatic Factor | Case 1 | Case 2 | Case 3 | Case 4 |
| Air Temperature | Highest during the day due to density and heat retention | Moderate due to better ventilation | Moderate due to shaded courtyards | Lowest in morning, rises after 5 PM |
| Wind Speed | Very low due to blocked by tall buildings | Improved wind due to corridors | Moderate; obstructed internally | Moderate; better than case 1 but lower than open spaces |
| Relative Humidity | Higher in early day; slower rise at night | Moderate | Moderate | Lower until 2 PM, then increases rapidly in evening |
| Mean Radiant Temp (Tmrt) | Very high at noon (>80°C) due to poor shading | Lower due to spacing | Low in shaded courtyards | Low in morning, rises after 2 PM |
| PMV (Thermal Comfort) | Worst comfort (0.8–4.68) | Slightly better than Case 1 | Better due to shading | Comfortable in morning, worse after afternoon |
8. Conclusion and Recommendations
This study aimed to explore the microclimatic consequences of urban building regulations in Alexandria by analyzing four representative urban typologies through ENVI-met simulations. The findings reinforce the notion that urban form and spatial configuration, shaped directly by planning laws, have significant impacts on outdoor thermal comfort and environmental performance.
The comparative simulation of the four urban configurations highlights the profound impact of urban form, vegetation, and spatial design on microclimatic performance. Densely built environments with tall, closely packed buildings (Case 1) tend to amplify heat retention, suppress air circulation, and elevate thermal stress levels. In contrast, areas with integrated green space and spatial openness (Case 4) demonstrate improved thermal conditions during daytime due to enhanced evapotranspiration and shading. However, such areas may also become unexpectedly warmer in the evening as a result of trapped radiated heat and diminished cooling mechanisms like evapotranspiration.
Strip-planned areas (Case 2) benefit from enhanced airflow, helping to moderate temperatures and reduce discomfort, while courtyard-based layouts (Case 3) offer shaded zones and thermal buffering through enclosure. Overall, shading, vegetative cover, and urban ventilation emerge as critical strategies for mitigating the Urban Heat Island effect and enhancing thermal comfort in hot-climate cities.
This analysis reinforces the need for context-sensitive urban planning that leverages both built and natural elements to create resilient, thermally balanced environments.
8.1. Key Findings
- The High-Density case exhibited the most severe thermal stress, with high air temperatures and limited ventilation due to minimal open space and maximum plot coverage.
- The Dot and Courtyard typologies demonstrated the most favorable microclimatic outcomes, benefiting from spatial openness, vegetative shading, and airflow potential.
- The Strip Type, while less extreme, revealed discomfort during peak hours due to its low permeability and limited greenery.
- Simulation outputs confirmed that setbacks, building orientation, and void ratios are critical parameters in regulating urban heat.
8.2. Implications for Climate-Sensitive Planning
These results highlight the need for greater integration of microclimatic principles within Alexandria’s urban regulatory framework. Urban planners should treat environmental performance as a design priority, embedding thermal comfort into zoning laws, density limits, and building envelope standards.
8.3. Recommendations for Regulatory Reform
Based on the comparative analysis of the four urban morphologies simulated in Alexandria, several recommendations can be proposed to improve the microclimatic performance of urban areas, mitigate the Urban Heat Island (UHI) effect, and enhance outdoor thermal comfort:
- Promote the Integration of Vegetation:
The presence of green spaces, as demonstrated in Case 4, significantly contributes to cooling through evapotranspiration and shading during daytime hours. Urban planning policies should encourage the allocation of at least 15–20% of open green areas, particularly in dense residential developments, to moderate local temperatures and increase humidity during dry periods.
- Optimize Building Layouts for Airflow:
The strip layout of Case 2 allowed for improved wind circulation compared to compact high-rise areas. It is recommended to adopt street and building orientations that align with prevailing wind directions, reducing wind stagnation and enhancing natural ventilation.
- Design with Shading in Mind:
Courtyards in Case 3 and shaded zones in all areas showed lower Mean Radiant Temperatures and improved comfort. Future designs should incorporate passive shading strategies, such as deep recesses, arcades, vegetation, or strategically positioned buildings that cast shadows during peak heat hours.
- Manage Building Heights and Densities:
Areas with excessive building height and density (Case 1) retained heat longer and experienced elevated PMV values. Limiting excessive vertical expansion and allowing for spacing between buildings can reduce heat accumulation and facilitate cooling at night.
- Encourage Use of Reflective and Low-Heat Storage Materials:
Building envelopes should be designed with high-albedo materials and surfaces that store less heat, especially for facades and pavements exposed to direct sunlight. This could help limit the Tmrt values that were found to exceed 80°C in some exposed areas.
- Enhance Microclimatic Modeling in Planning Processes:
The results underline the importance of using simulation tools like ENVI-met at early design stages. Municipalities and planners should institutionalize microclimatic assessments in the approval process of new developments.
- Balance Greenery with Spatial Configuration:
While green areas contribute to daytime cooling, results showed they might retain heat at night when surrounded by massive structures (as in Case 4). Thus, vegetation design should be integrated with open spatial forms and wind accessibility to avoid nighttime heat traps.
8.4. Directions for Future Research
Future research could build upon this study by extending simulations across different seasons and longer timeframes to capture year-round microclimatic variations. Investigating the thermal behavior of diverse building materials in more detail would also offer deeper insight into passive climate-responsive design. Additionally, incorporating human behavioral responses and perception through field surveys can complement quantitative data like PMV. Further studies might explore a wider range of urban typologies and densities across Alexandria, as well as integrate climate change scenarios to assess the long-term performance of urban forms. Finally, examining localized mitigation strategies, such as green roofs, water elements, and reflective surfaces, could help develop more adaptive and resilient urban environments.
References
- Johansson, E., Yahia, M. W., & Thorsson, S. (2021). Microclimate impact of urban design in hot-arid climates: A review. Sustainable Cities and Society, 72, 103058.
- Mueller, M. J., & Zhang, Y. (2020). Urban form and microclimate: A systematic review. Urban Climate, 34, 100680.
- El-Shimy, M., & El-Bastawesy, M. (2023). Thermal comfort mapping along Alexandria’s coastal edge. Journal of Urban Climate Planning, 10(1), 22–39.
- Crank, M., & Masson, V. (2022). Improving the accuracy of ENVI-met for heat stress simulation. Urban Climate, 43, 101142.
- Fabbri, K., & Pretelli, M. (2019). ENVI-met simulation in evaluating thermal comfort in urban public spaces. Energy and Buildings, 198, 130-145.
- Li, Y., Liu, K., & Chen, L. (2021). Revising urban planning codes for climate resilience: A global synthesis. Cities, 119, 103372.
- Gao, S., He, B., & Wang, J. (2020). Coastal urban morphology and its impact on microclimate. Sustainable Cities and Society, 55, 102039.
- Hamed, S., & Elsharkawy, H. (2021). Climate-responsive urban design in Alexandria: Challenges and opportunities. Sustainable Cities and Society, 69, 102827.
- Nikolopoulou, M., & Steemers, K. (2003). Thermal comfort and psychological adaptation as a guide for designing urban spaces. Energy and Buildings, 35(1), 95–101.
- Santamouris, M. (2015). Regulating urban form to mitigate urban heat islands. Urban Climate, 12, 1–6.
- Kemppinen, J., Lembrechts, J. J., Van Meerbeek, K., Carnicer, J., Chardon, N. I., Kardol, P., Lenoir, J., Liu, D., Maclean, I., Pergl, J., Saccone, P., Senior, R. A., Shen, T., Słowińska, S., Vandvik, V., von Oppen, J., Aalto, J., Ayalew, B., Bates, O., … De Frenne, P. (2024). Microclimate, an important part of ecology and biogeography. Global Ecology and Biogeography, 33(6), e13834. [CrossRef]
- Orton, J., Whiting, K., Wilkinson, S., Barratt, D., & Barratt, C. (2021). Revision: Revision no. 09. https://www.climatechoices.act.gov.au/__data/assets/pdf_file/0005/2410358/act-microclimate-assessment-guide-june-2021.pdf.
- MetLink - Royal Meteorological Society Microclimates -. (2024). https://www.metlink.org/fieldwork-resource/microclimates/.
- Loeffler, B. (2021). Micro-climates. https://blog.iceslicer.com/microclimates.
- Ibrahim Abd El - Rahman, S., Alaa Mandour, M., & Mostafa Sobhy, T. (2022). THE EFFECT OF MICROCLIMATE SIMULATION ON URBAN SPACE. Engineering Research Journal, 173(0), 473–487. [CrossRef]
- Doblas-Reyes, F. J., Sorensson, A. A., Almazroui, M., Dosio, A., Gutowski, W. J., Haarsma, R., Hamdi, R., Hewitson, B., Kwon, W.-T., Lamptey, B. L., Maraun, D., Stephenson, T. S., Takayabu, I., Terray, L., Turner, A., & Zuo, Z. (2021). Linking global to regional climate change.
- UNDERSTANDING MICROCLIMATES IN ARCHITECTURE ⋆ Archi-Monarch. (2023). https://archi-monarch.com/understanding-microclimates-in-architecture/.
- Jänicke, B., Milošević, D., & Manavvi, S. (2021). Review of User-Friendly Models to Improve the Urban Micro-Climate. Atmosphere 2021, Vol. 12, Page 1291, 12(10), 1291. [CrossRef]
- Aydin, E., Jakubiec, J., Conference, S. J.-B. S., & 2019, U. (2019). A comparison study of simulation-based prediction tools for air temperature and outdoor thermal comfort in a tropical climate. Researchgate.NetEE Aydin, JA Jakubiec, SK JusufBuilding.
- Riad, M. A. (2018). Laws and regulations governing the Egyptian urban areas and shortcomings. Journal of Environmental Science, Institute of Environmental Studies and Research - Ain Shams University, 105–138.
- Samir, N., El Maksoud, R. A. B. D., & Maarof, I. (2019). Impact of building regulations on the urban fabric of the city: Case study of Alexandria, Egypt. WIT Transactions on Ecology and the Environment, 238, 581–592. [CrossRef]
Figure 1.
Research Methodology by author.
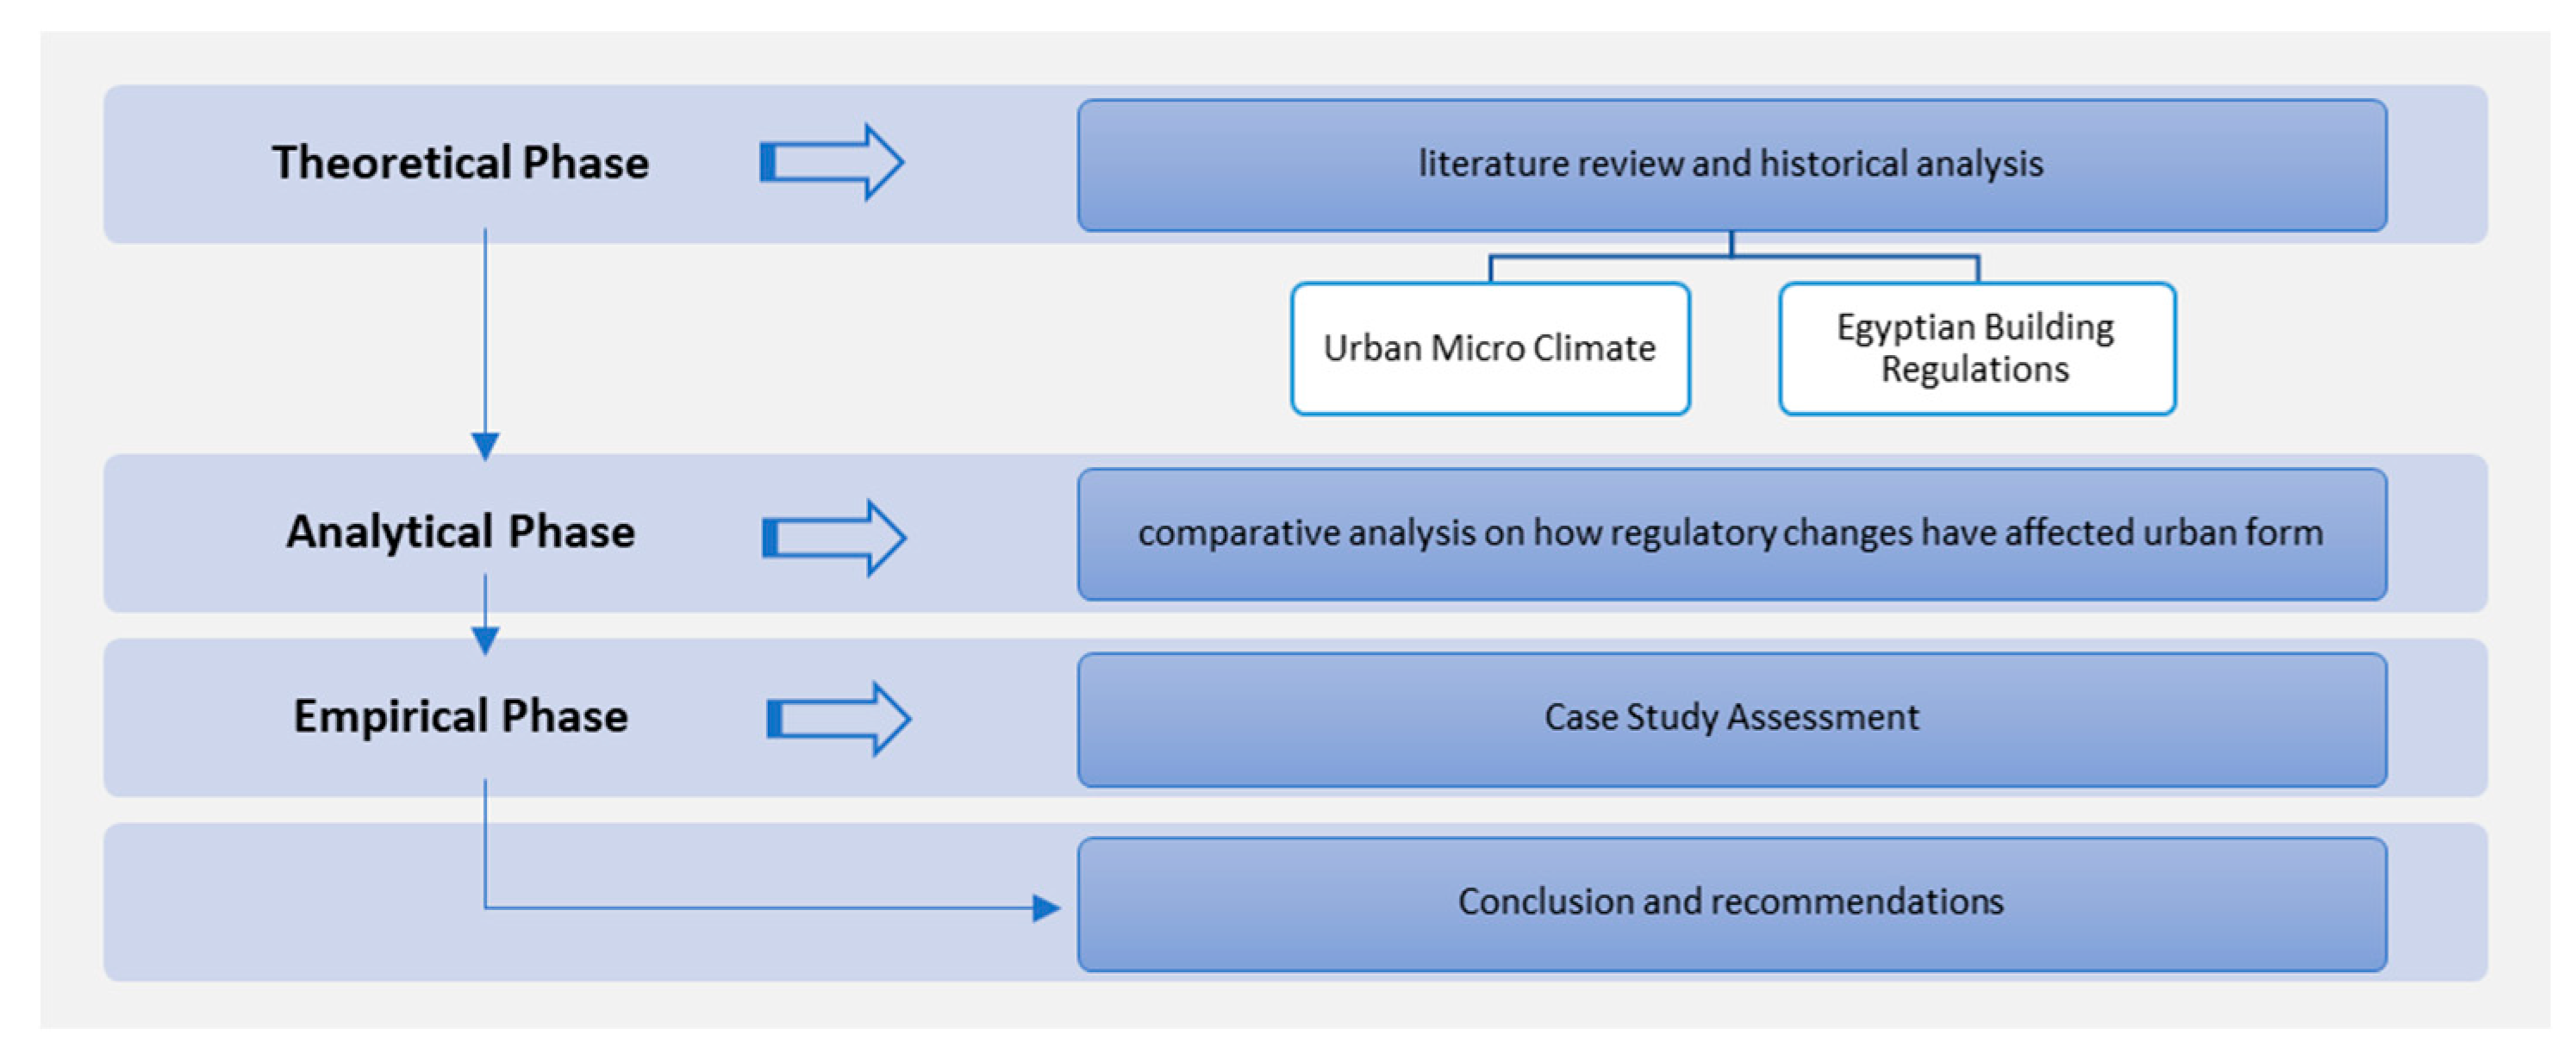
Figure 2.
Shows the Factors that create micro-climates. adapted by [14].
Figure 2.
Shows the Factors that create micro-climates. adapted by [14].
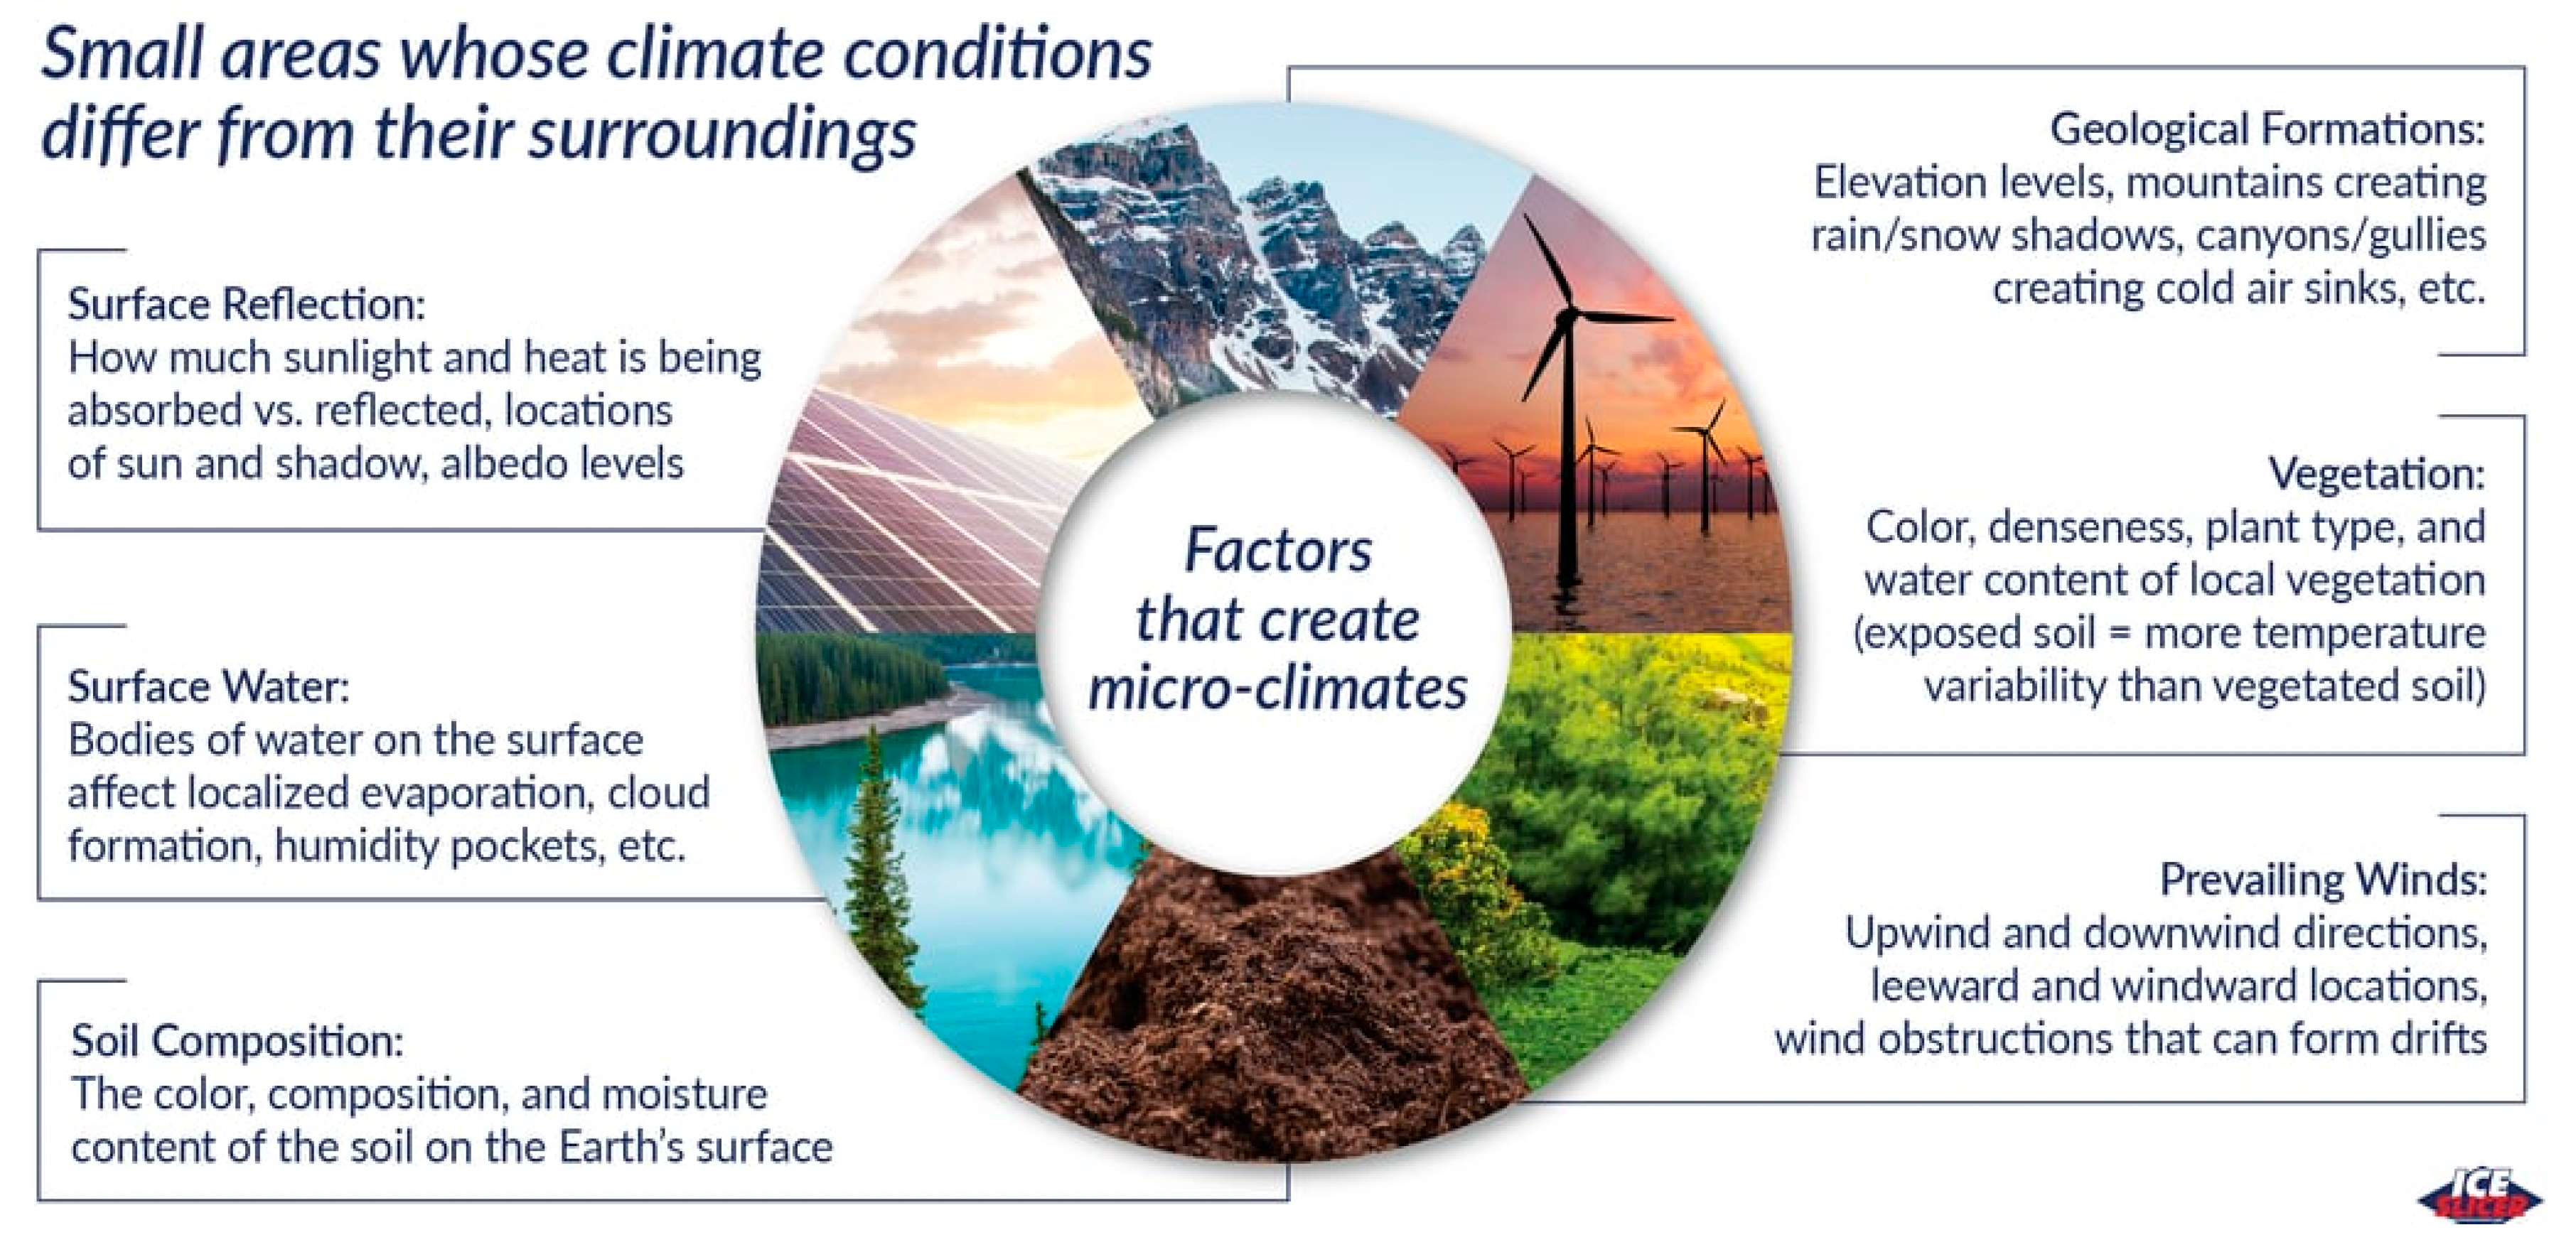
Figure 6.
Egyptian laws and legislation regulating urban development, source: author.
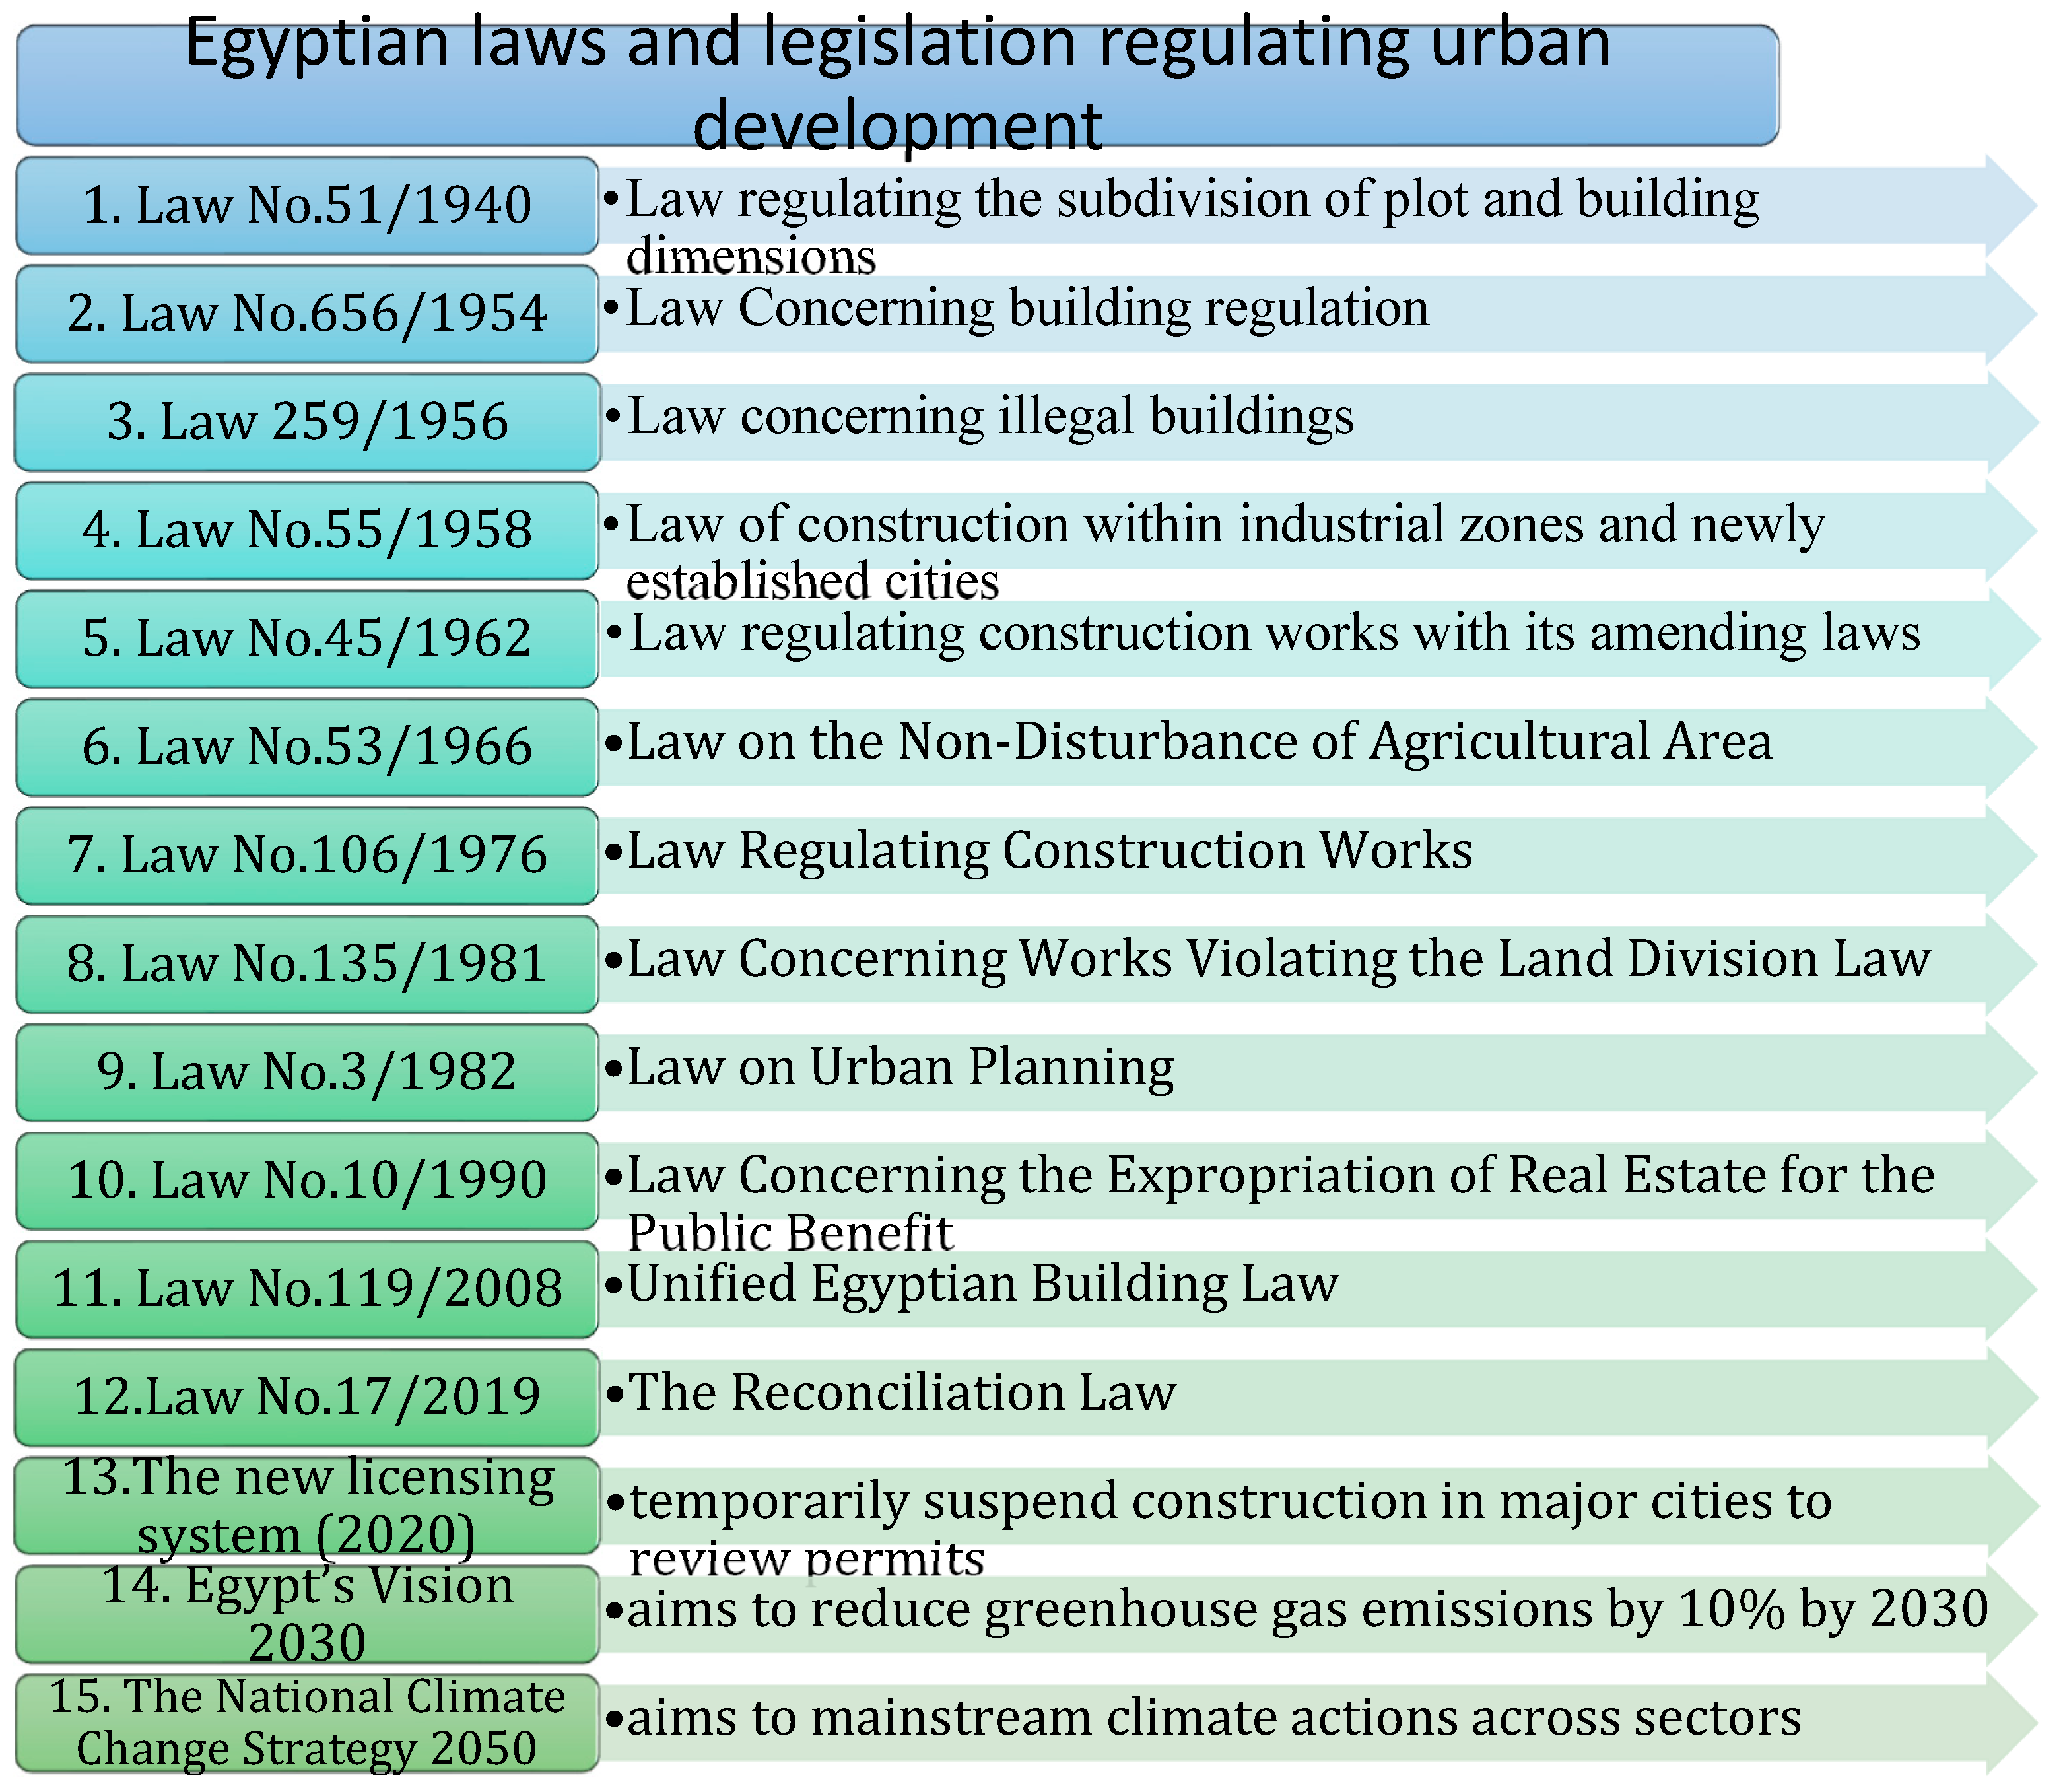
Figure 7.
Case studies location adapted from google maps.
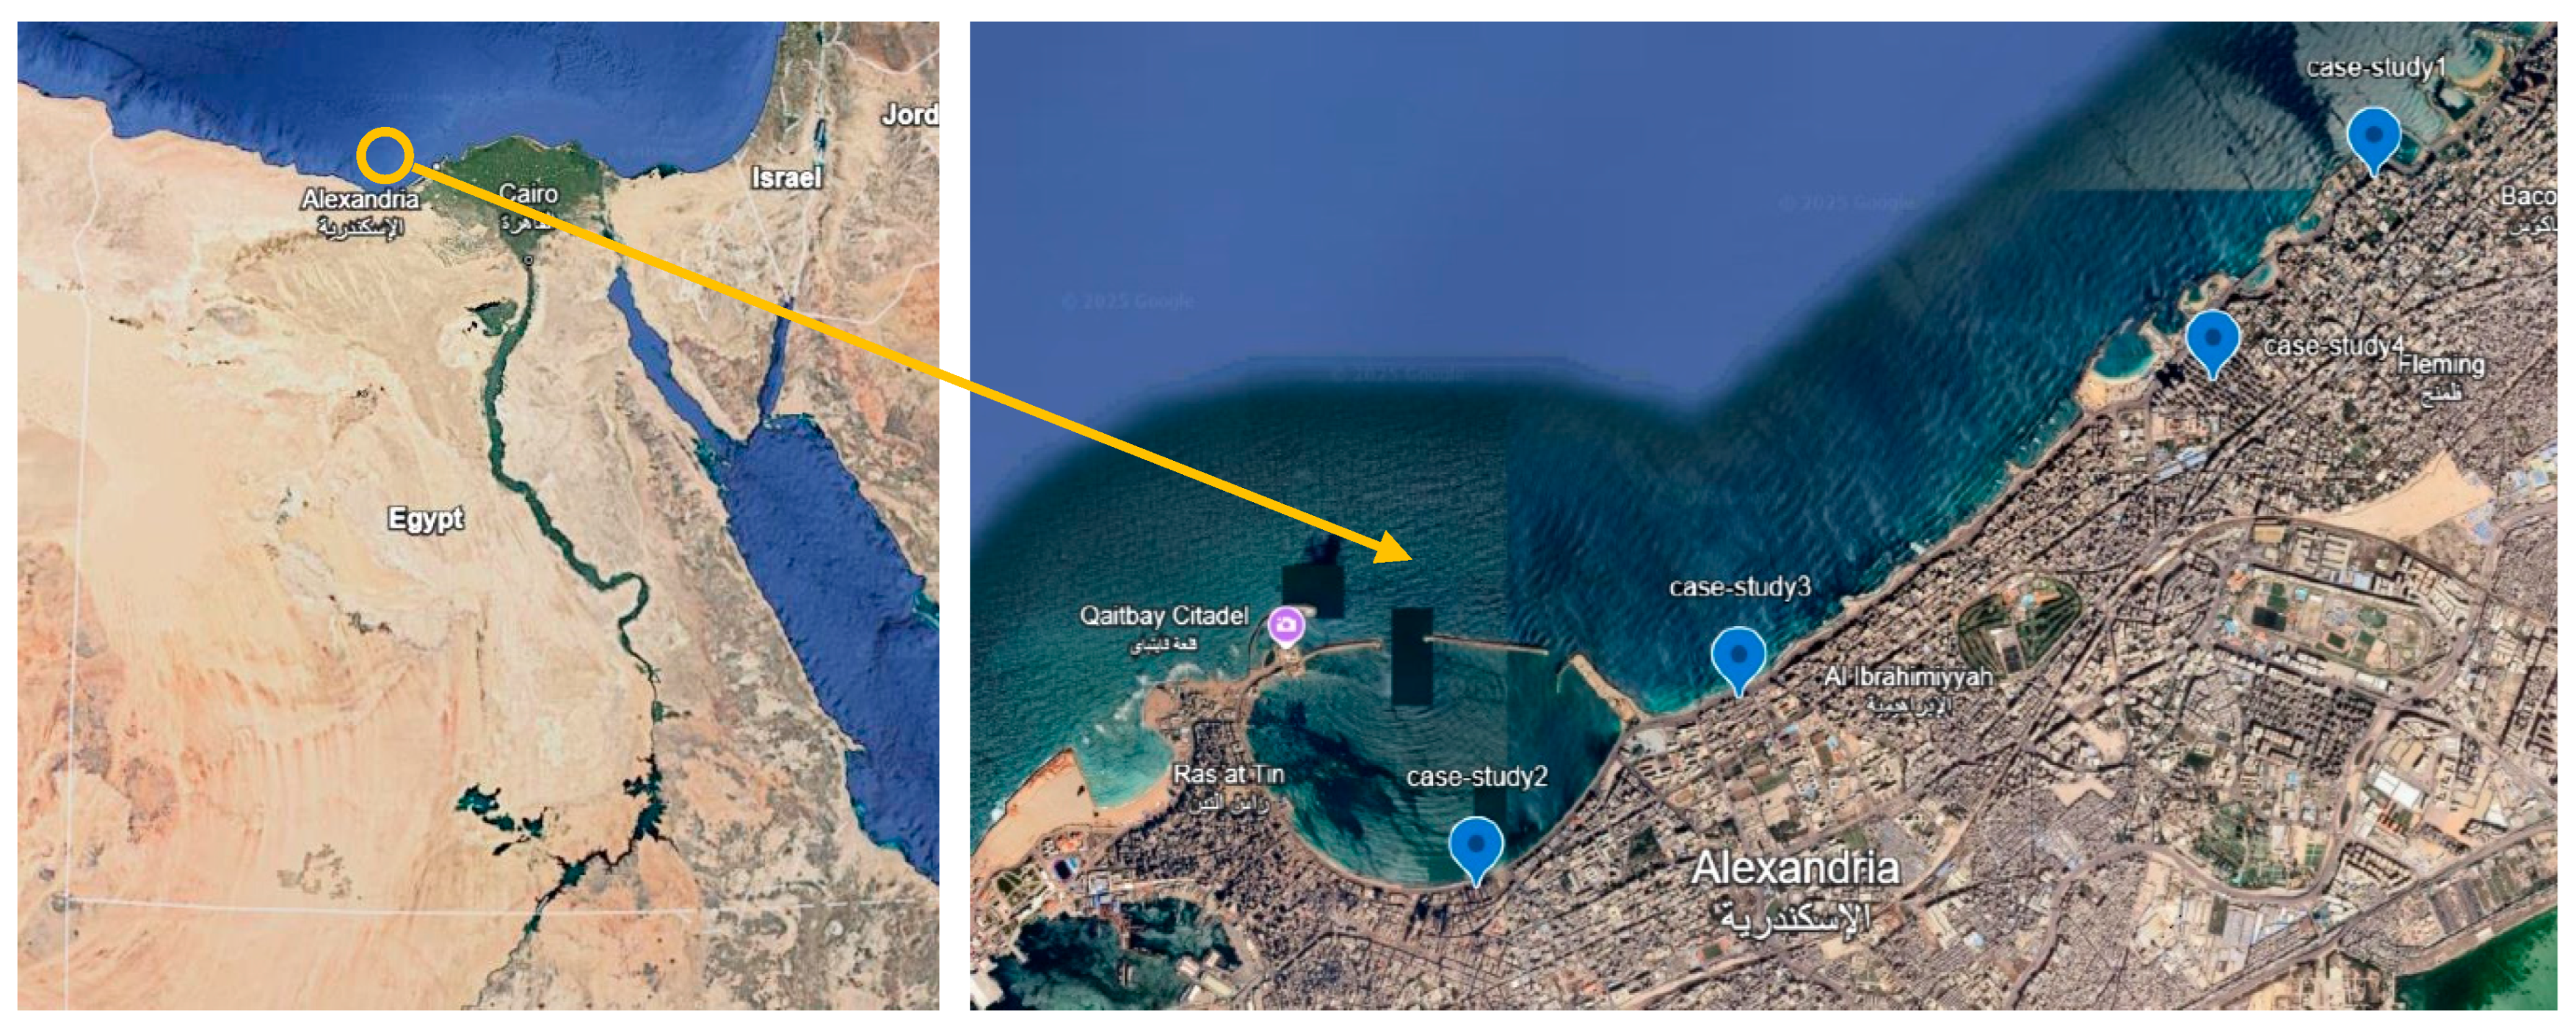
Figure 29.
Monthly Diurnal Averages – Alexandria-Nozha, Egypt Adapted from Autodesk Ecotect Analysis software.
Figure 29.
Monthly Diurnal Averages – Alexandria-Nozha, Egypt Adapted from Autodesk Ecotect Analysis software.
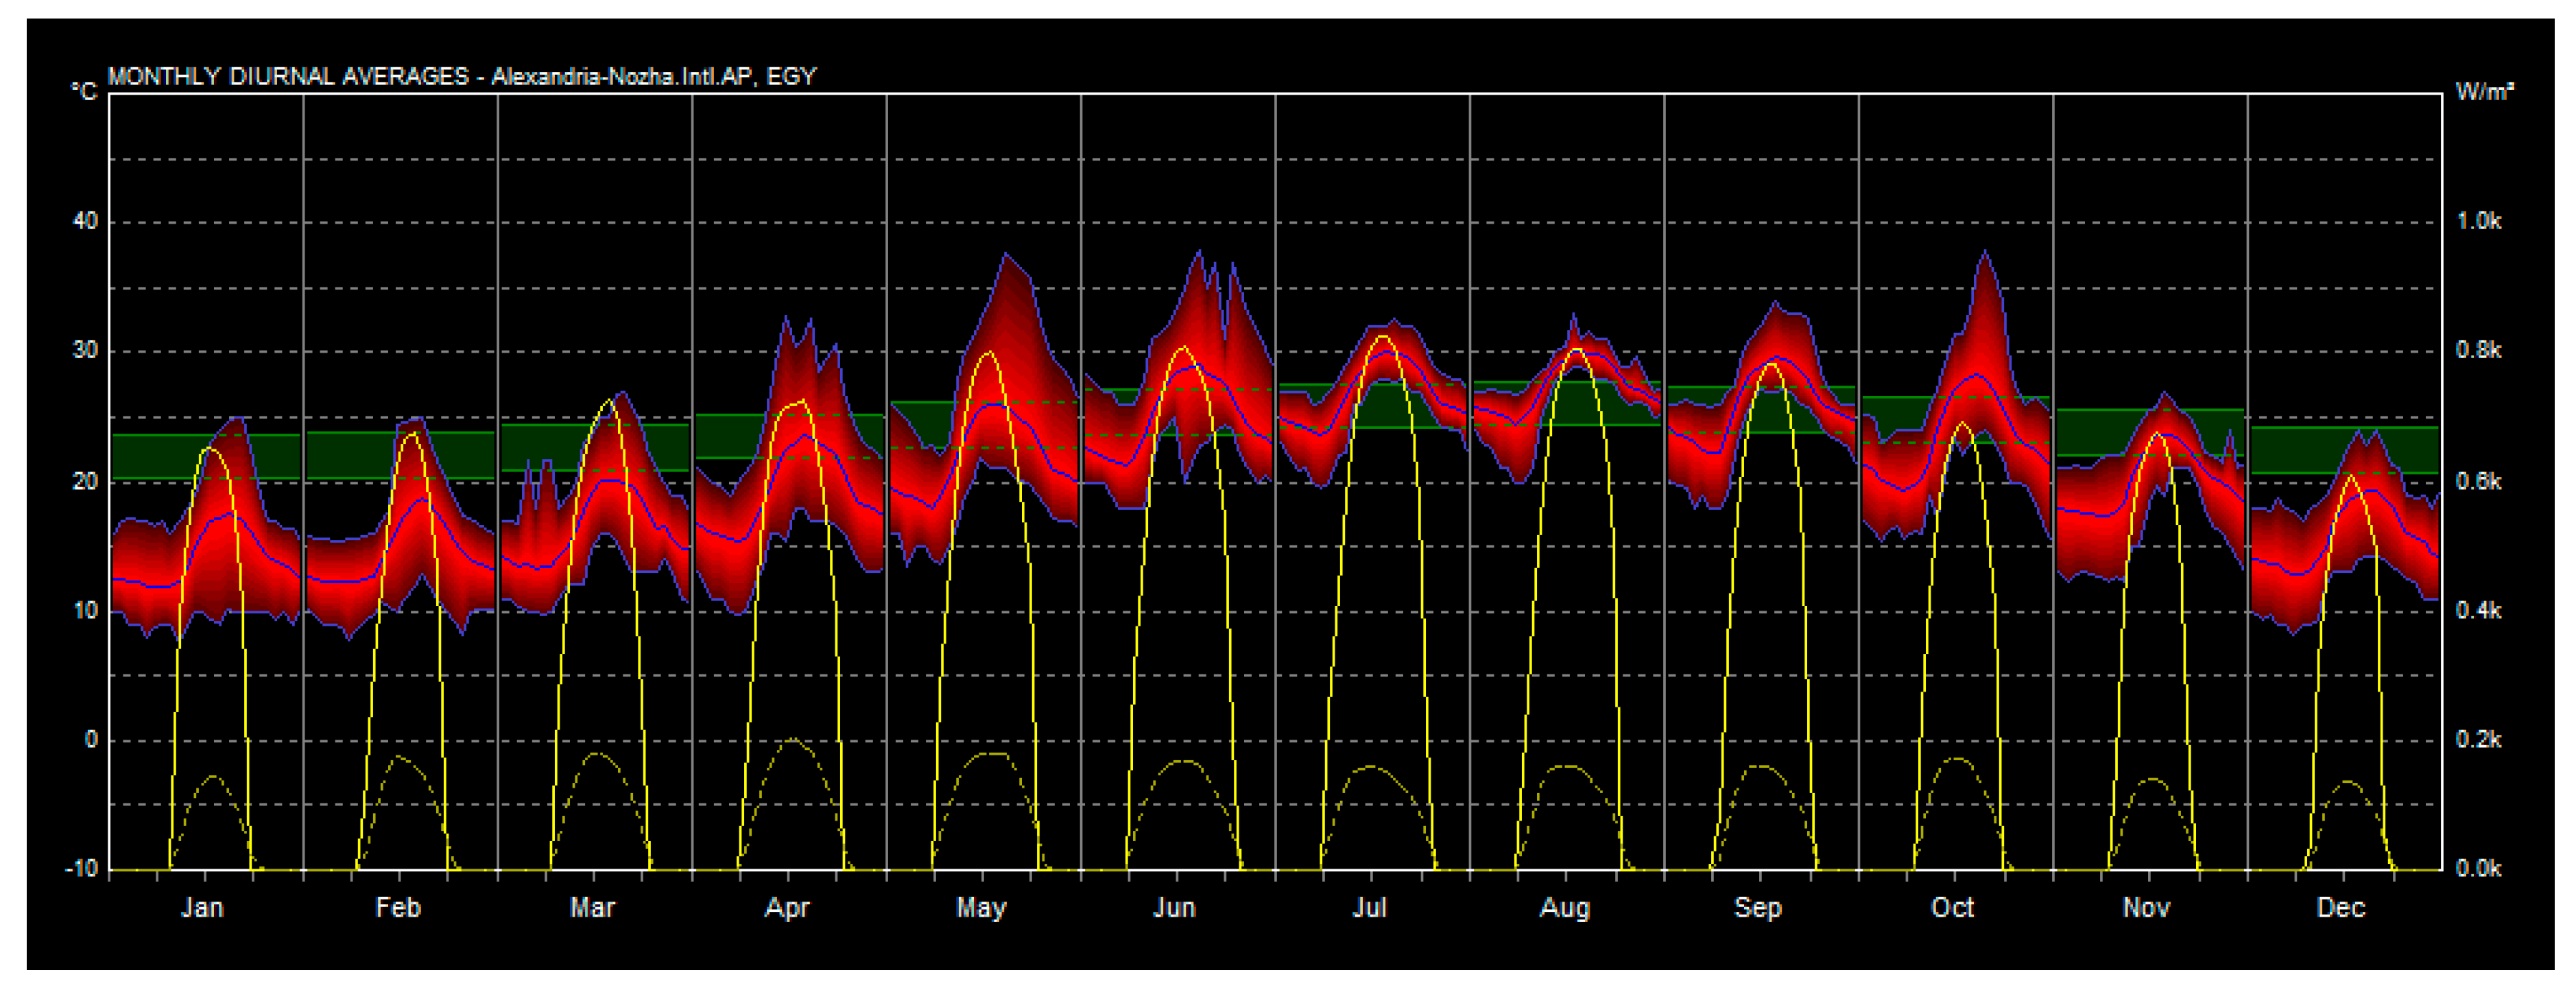
Figure 30.
Daily Conditions of the hotest day Adapted from Autodesk Ecotect Analysis software.
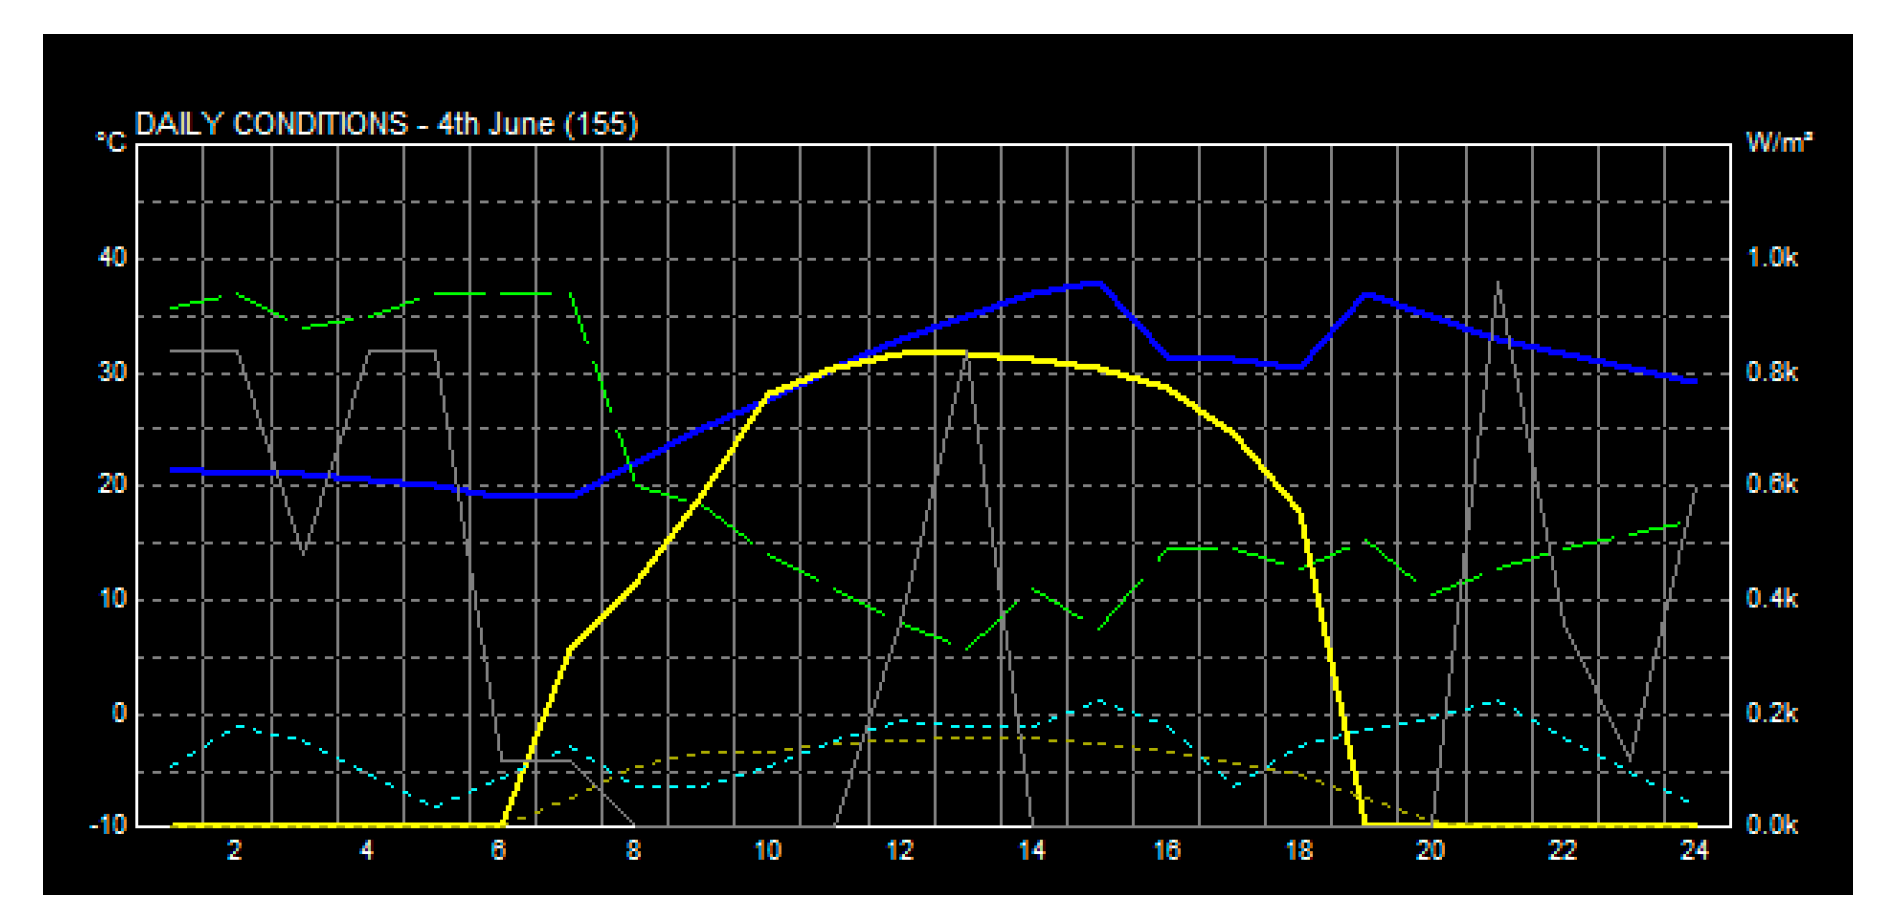
Figure 31.
Daily Conditions of the Coldest day Adapted from Autodesk Ecotect Analysis software.
Figure 35.
Case 1 Air Temperature from 14:00 to 19:00 adapted from Envi-met software.
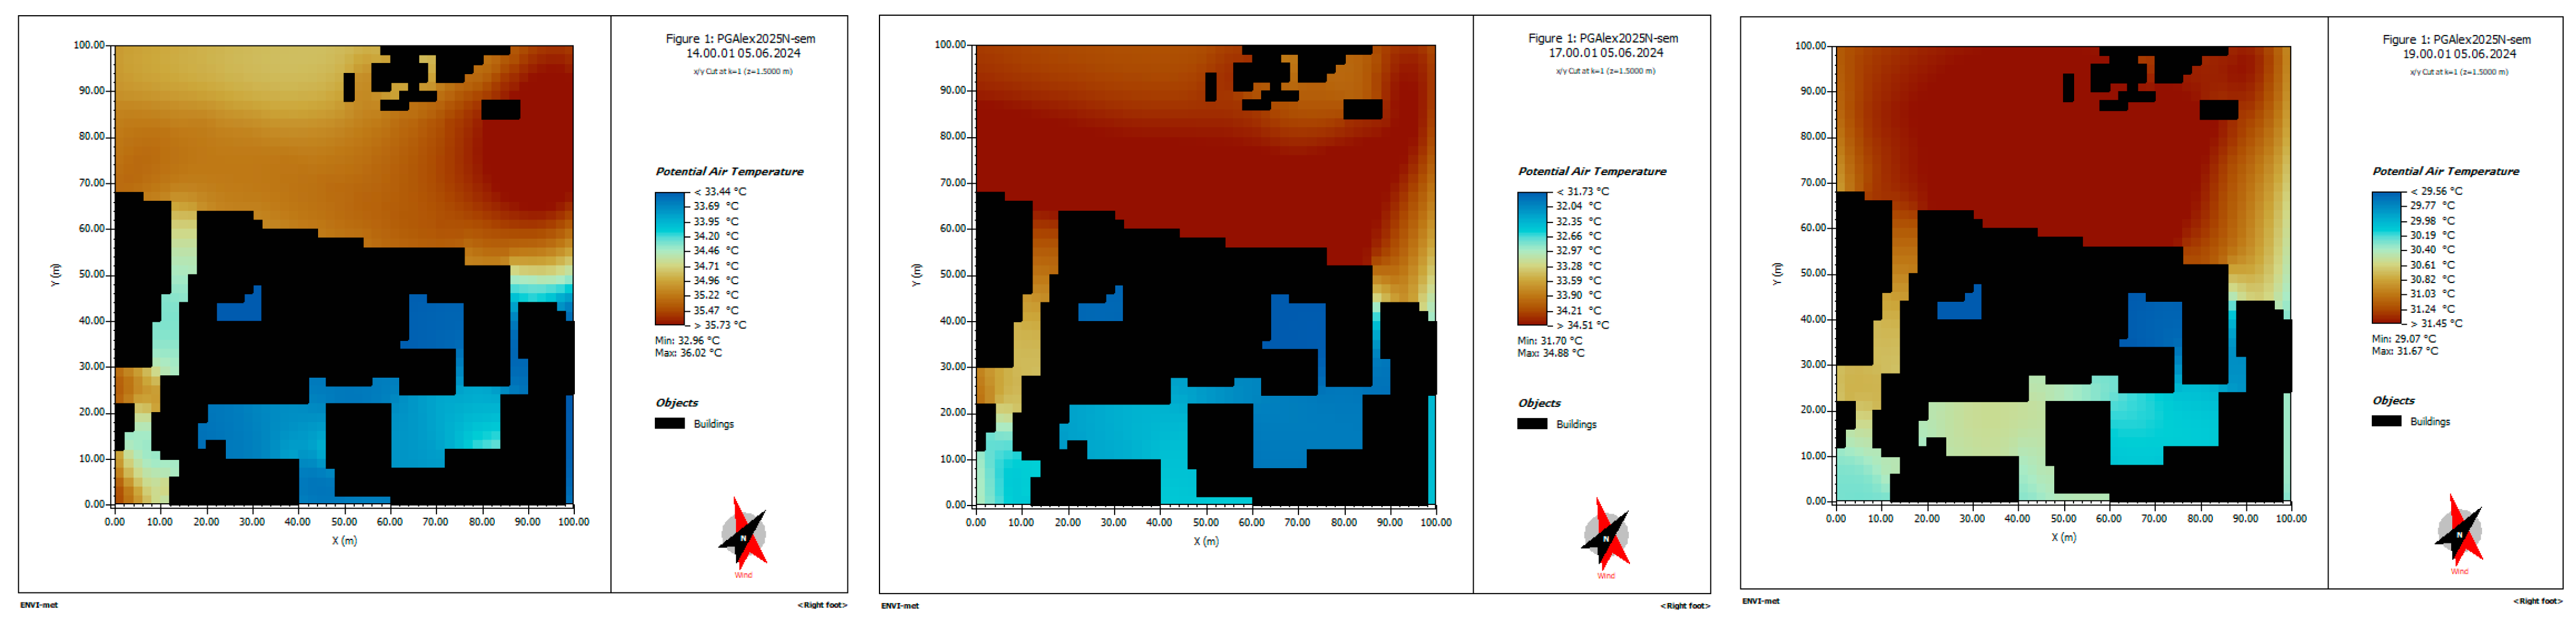
Figure 36.
Case 1 Wind Speed from 14:00 to 19:00 adapted from Envi-met software.
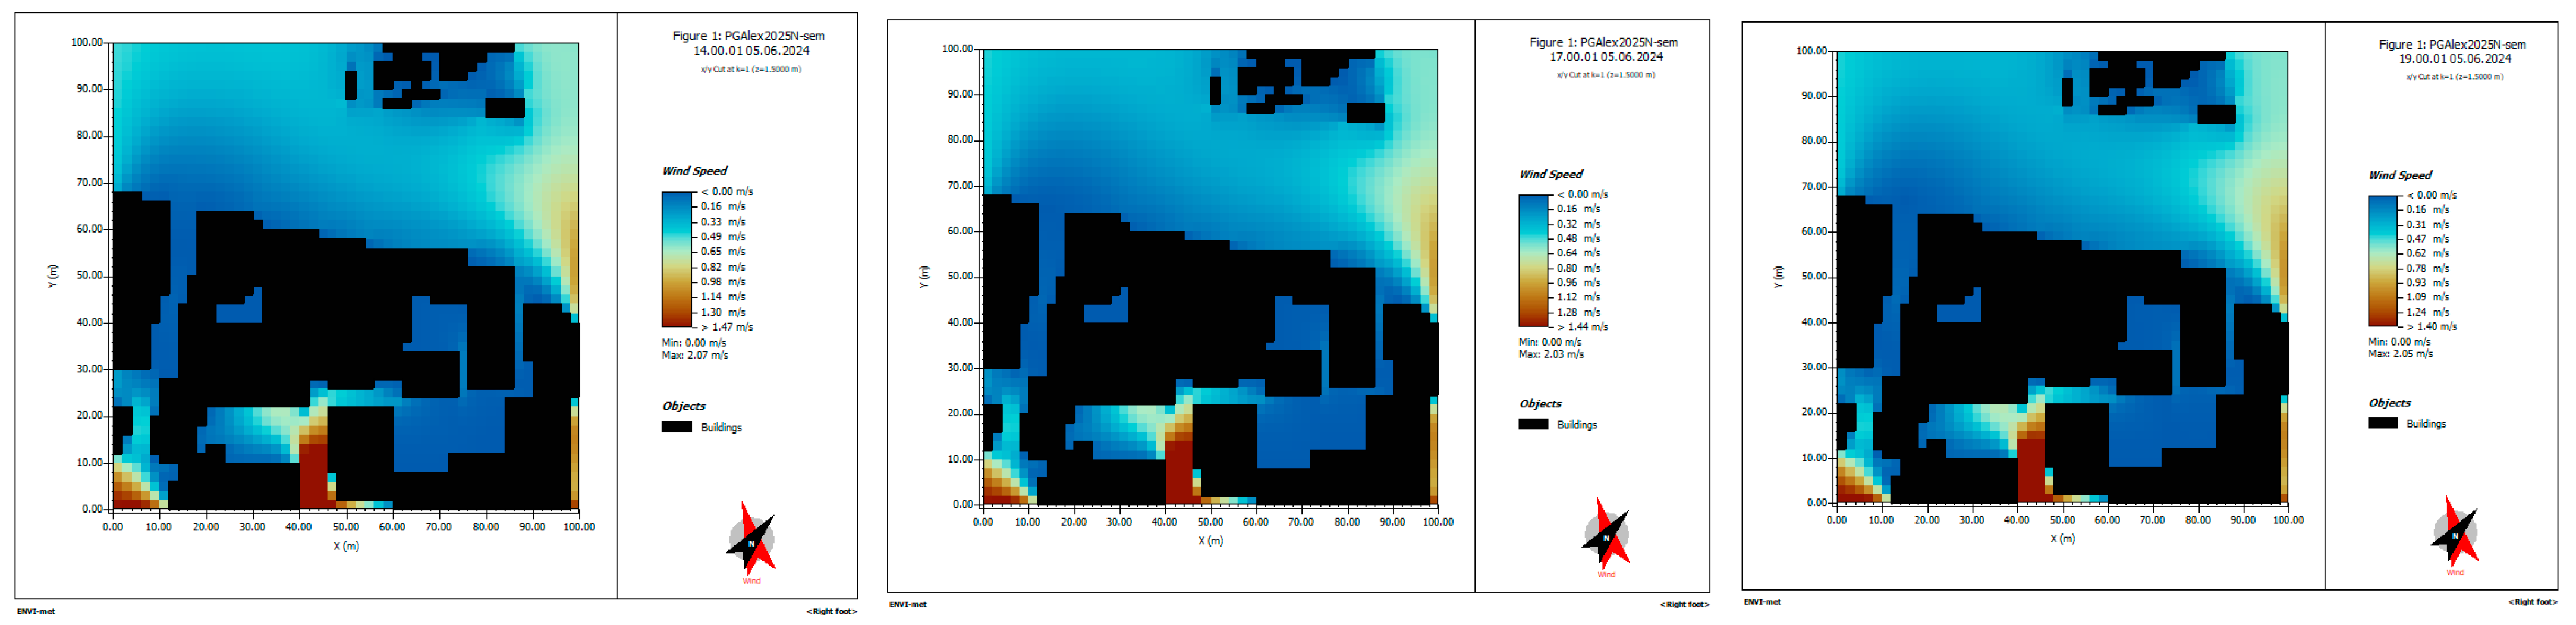
Figure 37.
Case 1 Relative Humidity from 14:00 to 19:00 adapted from Envi-met software.
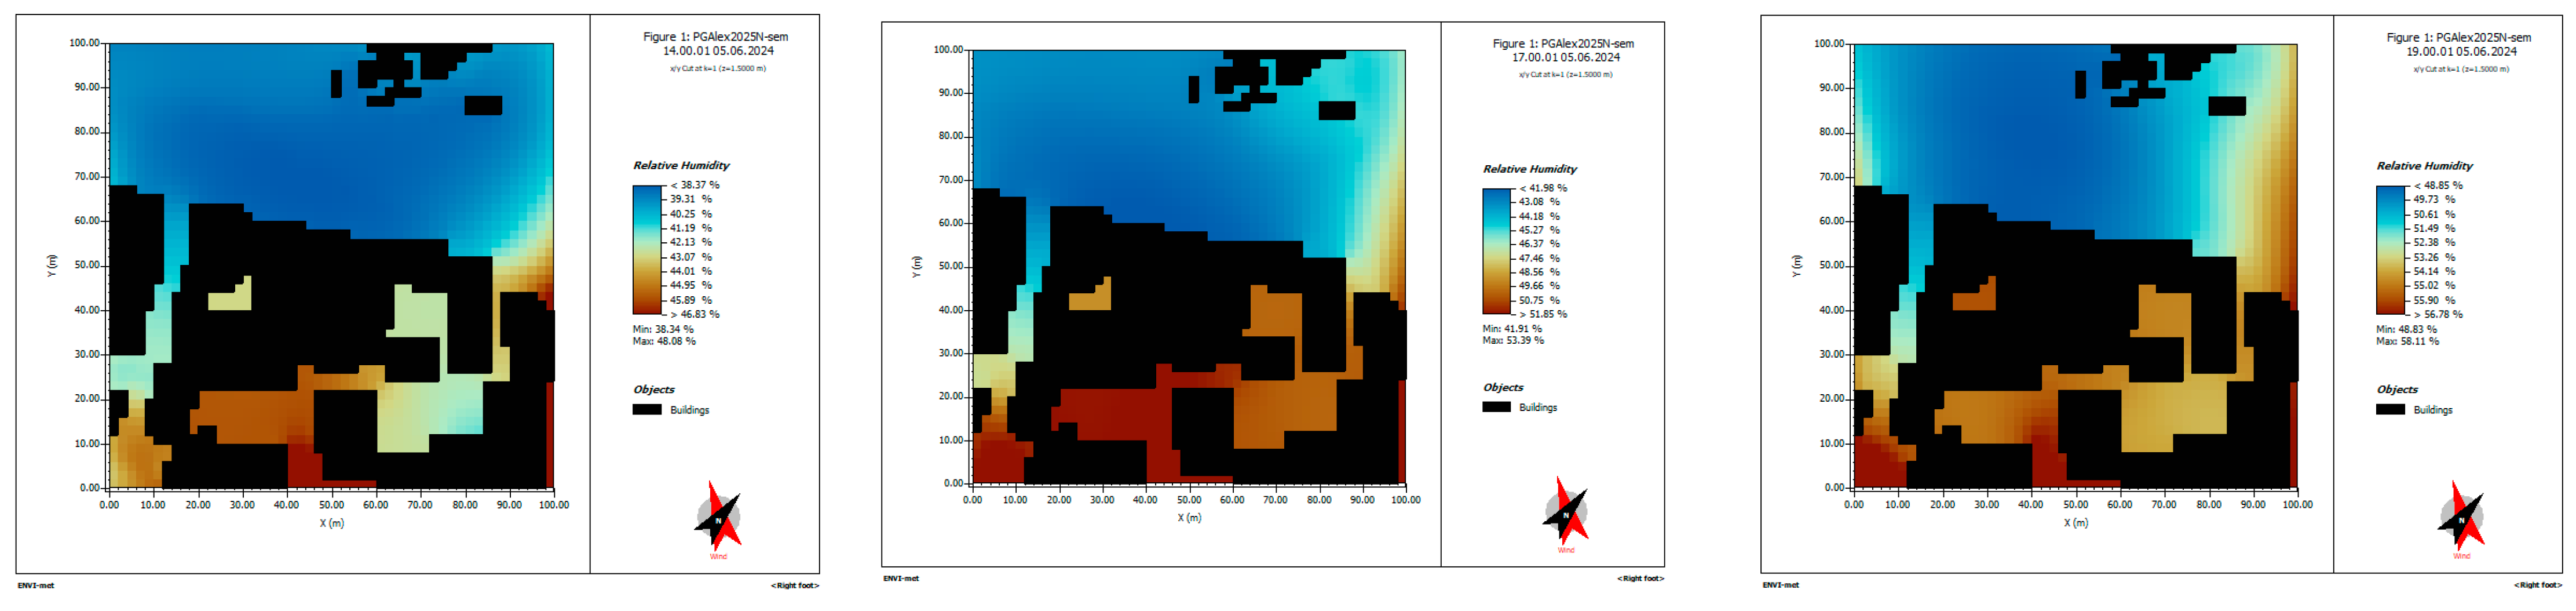
Figure 38.
Case 1 Tmrt from 14:00 to 19:00 adapted from Envi-met software.
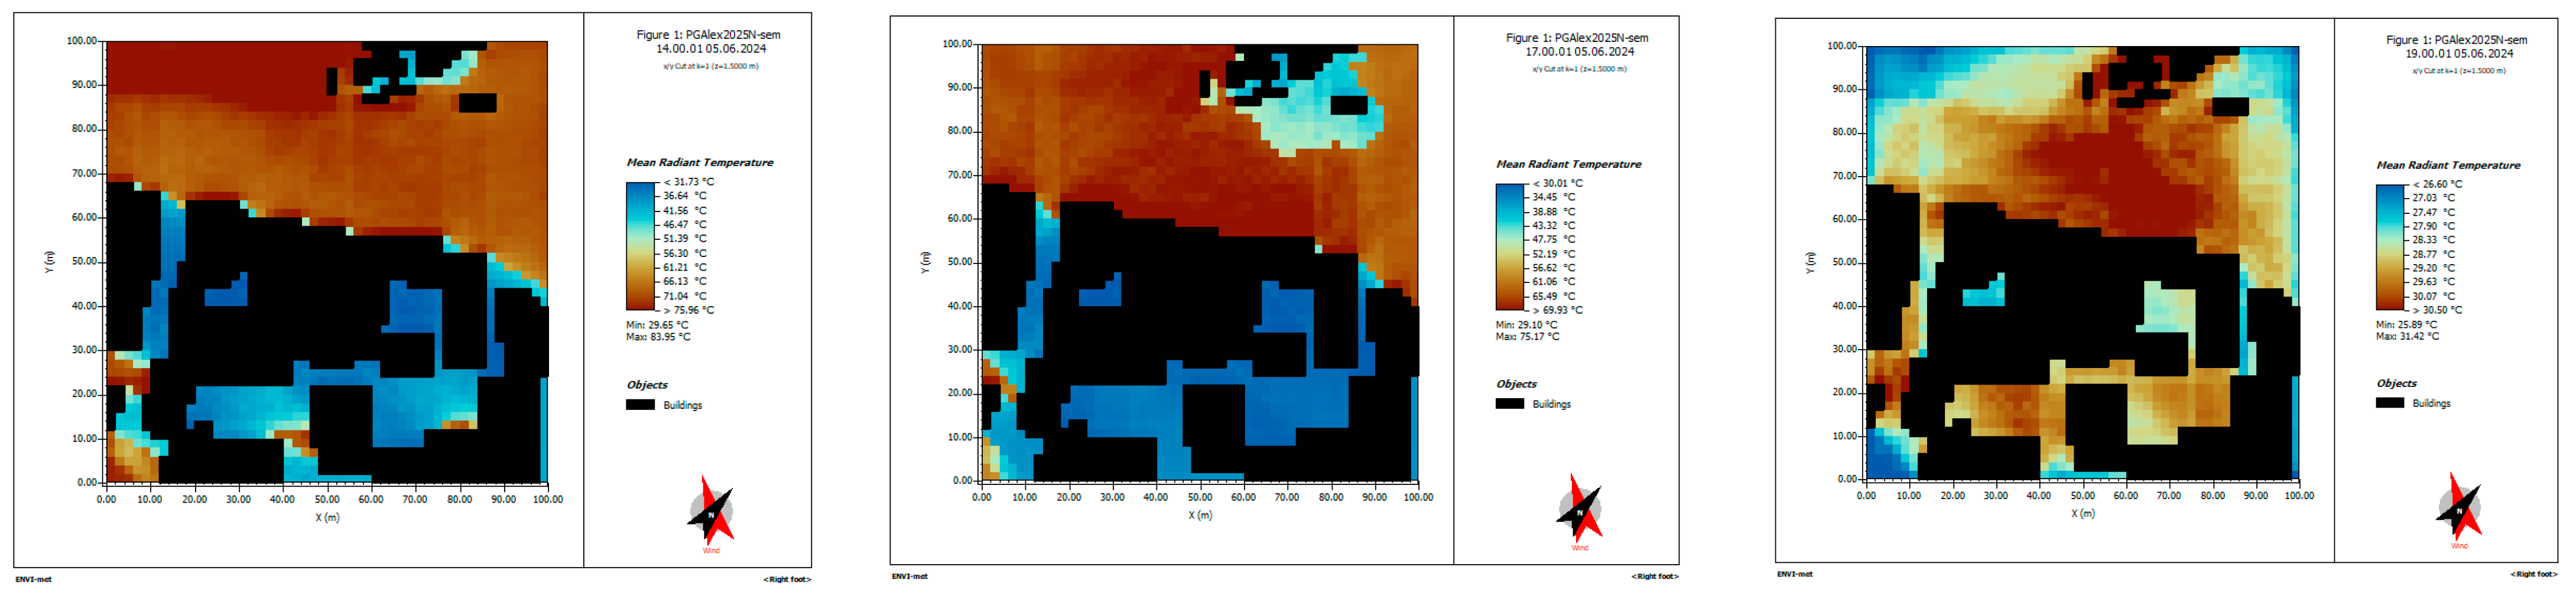
Figure 39.
Case 1 PMV index from 14:00 to 19:00 adapted from Envi-met software.
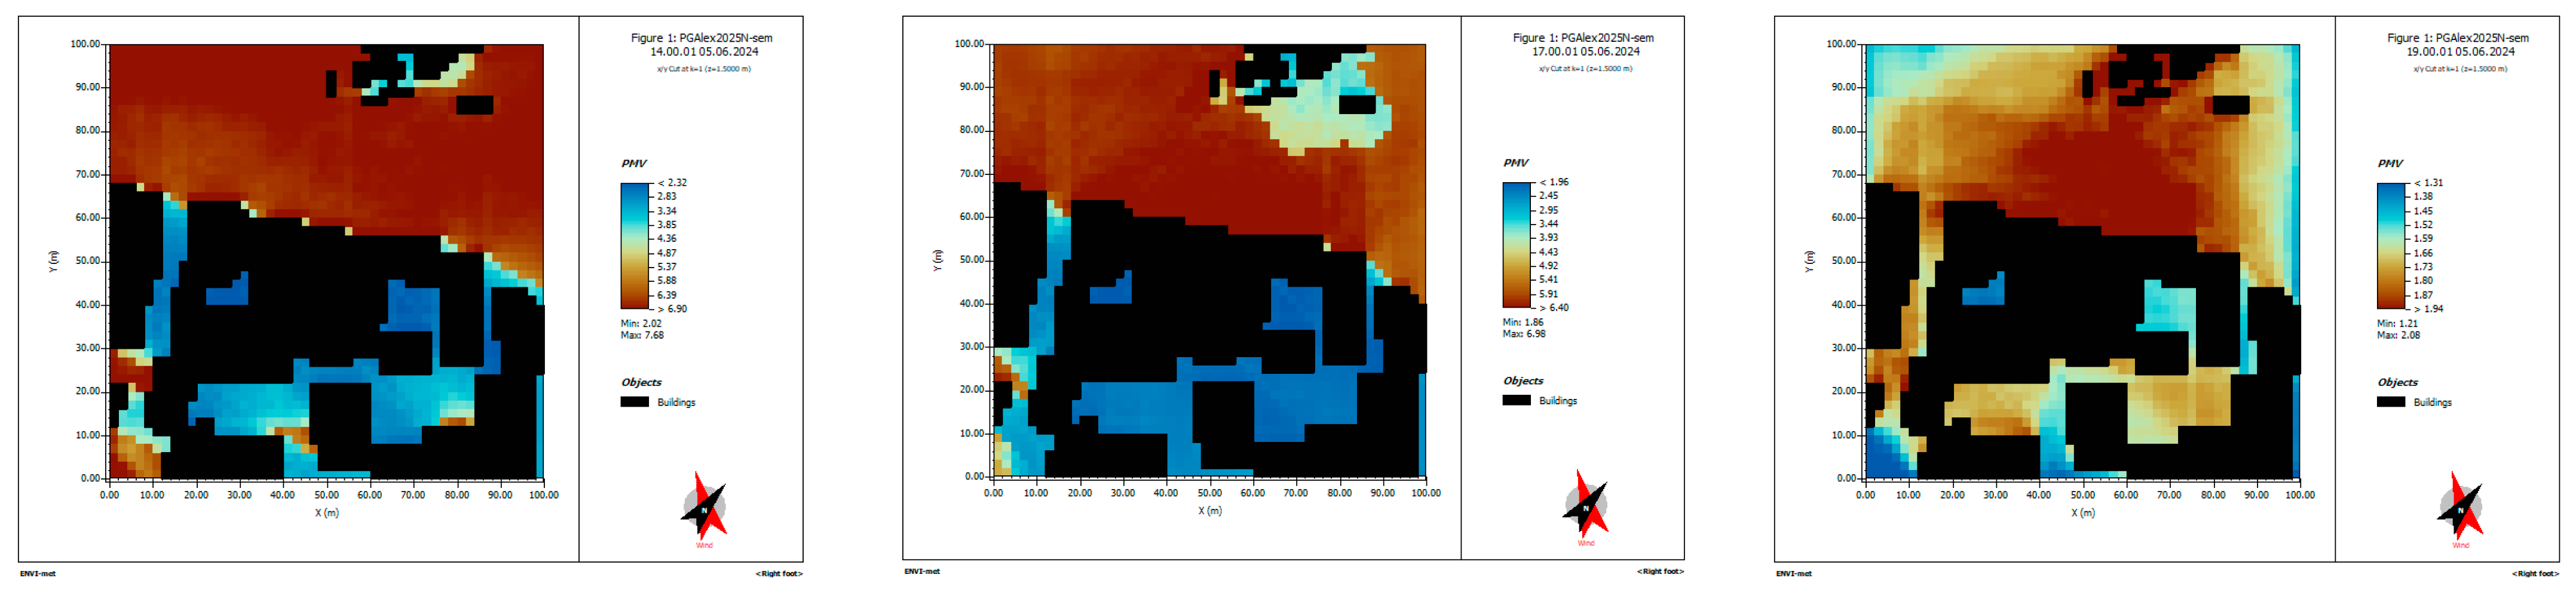
Figure 40.
Case 2 Air Temperature from 14:00 to 19:00 adapted from Envi-met software.
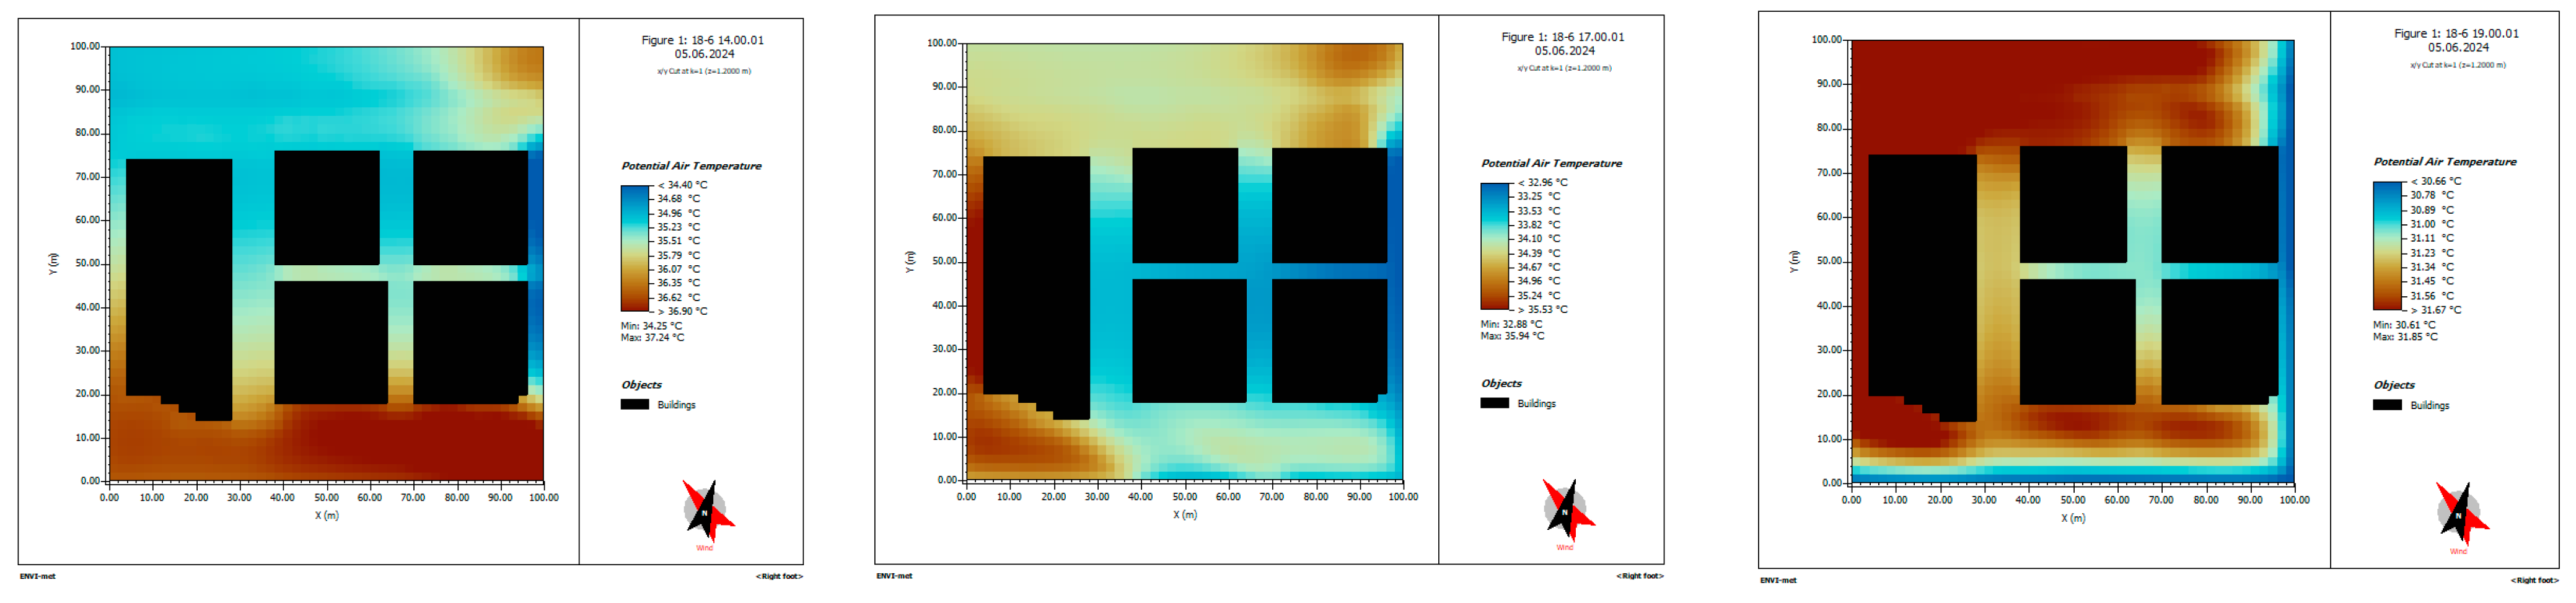
Figure 41.
Case 2 Wind Speed from 14:00 to 19:00 adapted from Envi-met software.
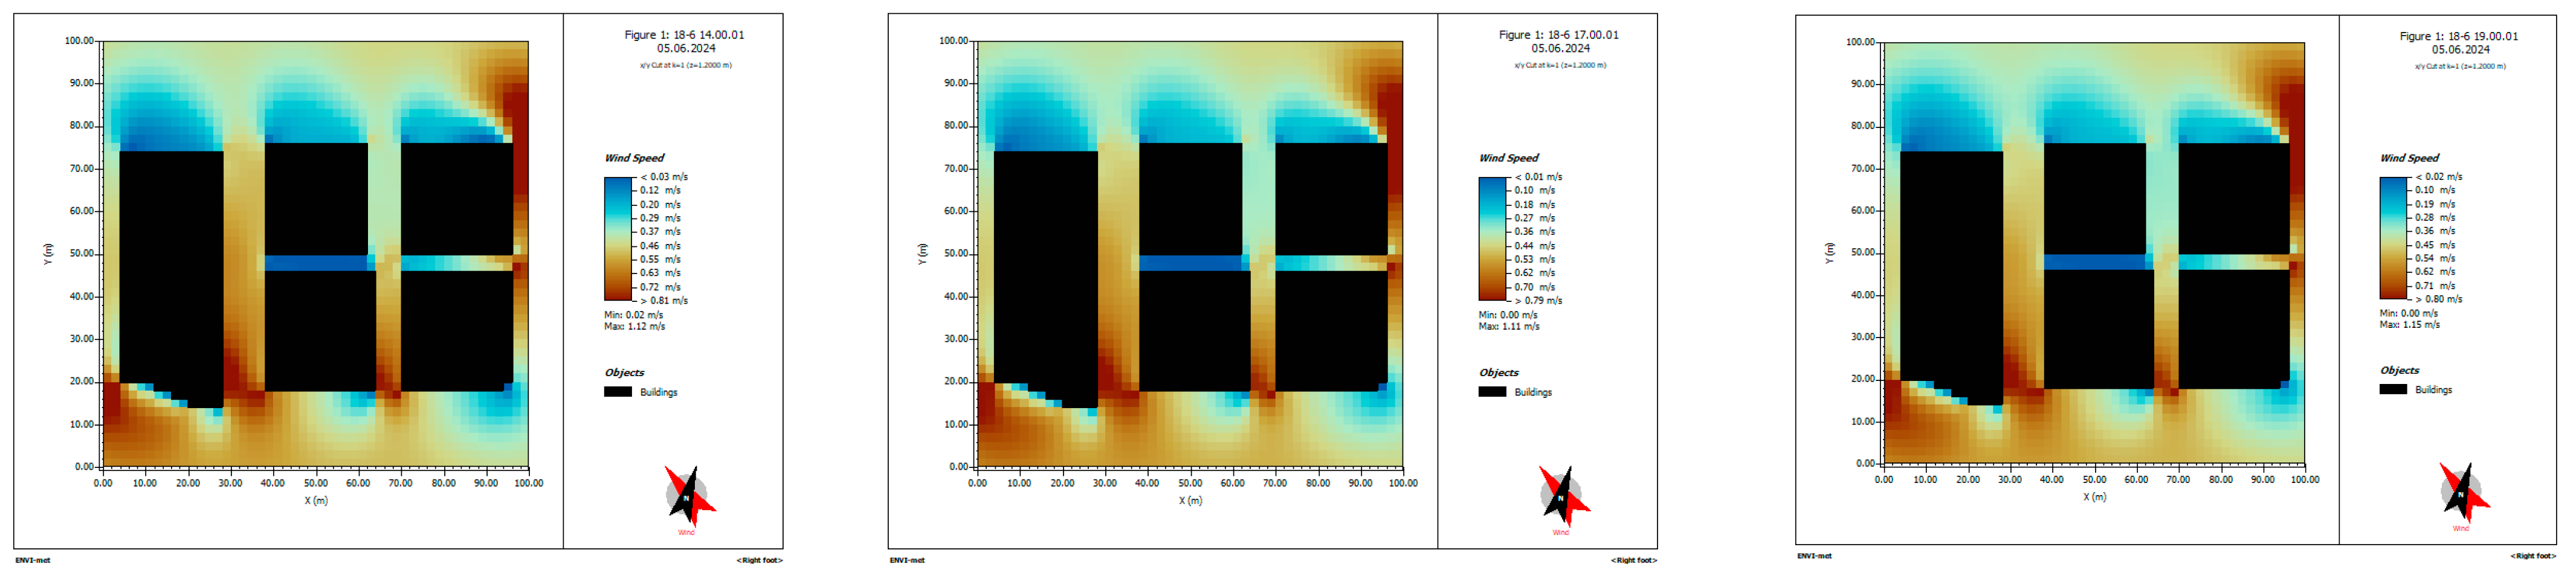
Figure 42.
Case 2 Relative Humidity from 14:00 to 19:00 adapted from Envi-met software.
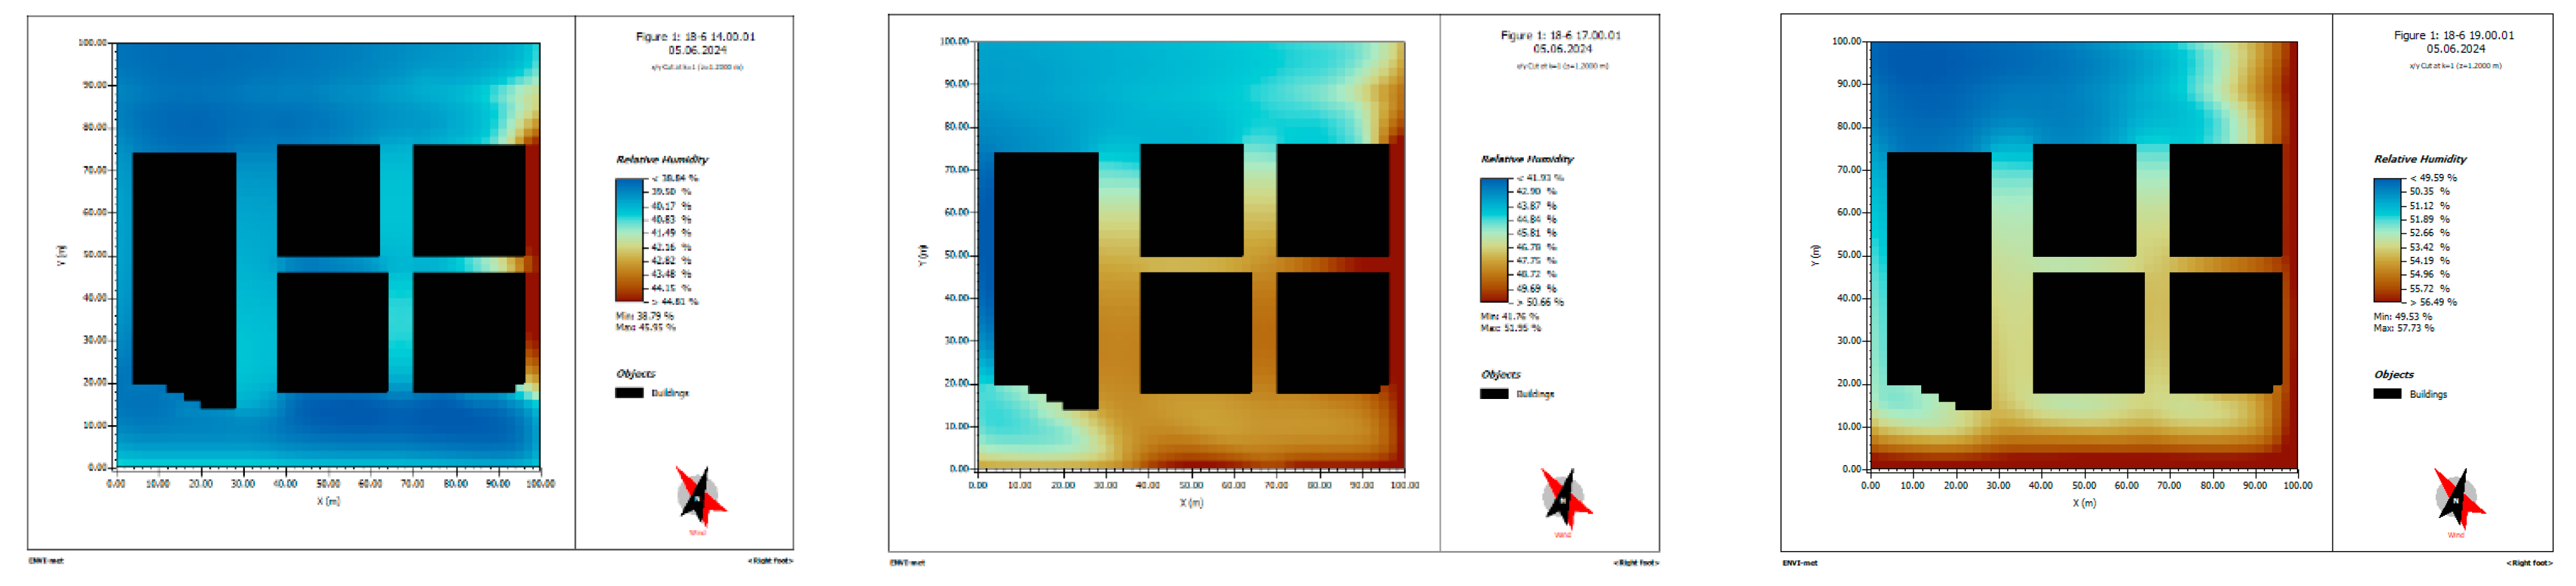
Figure 43.
Case 2 Tmrt from 14:00 to 19:00 adapted from Envi-met softwaree.
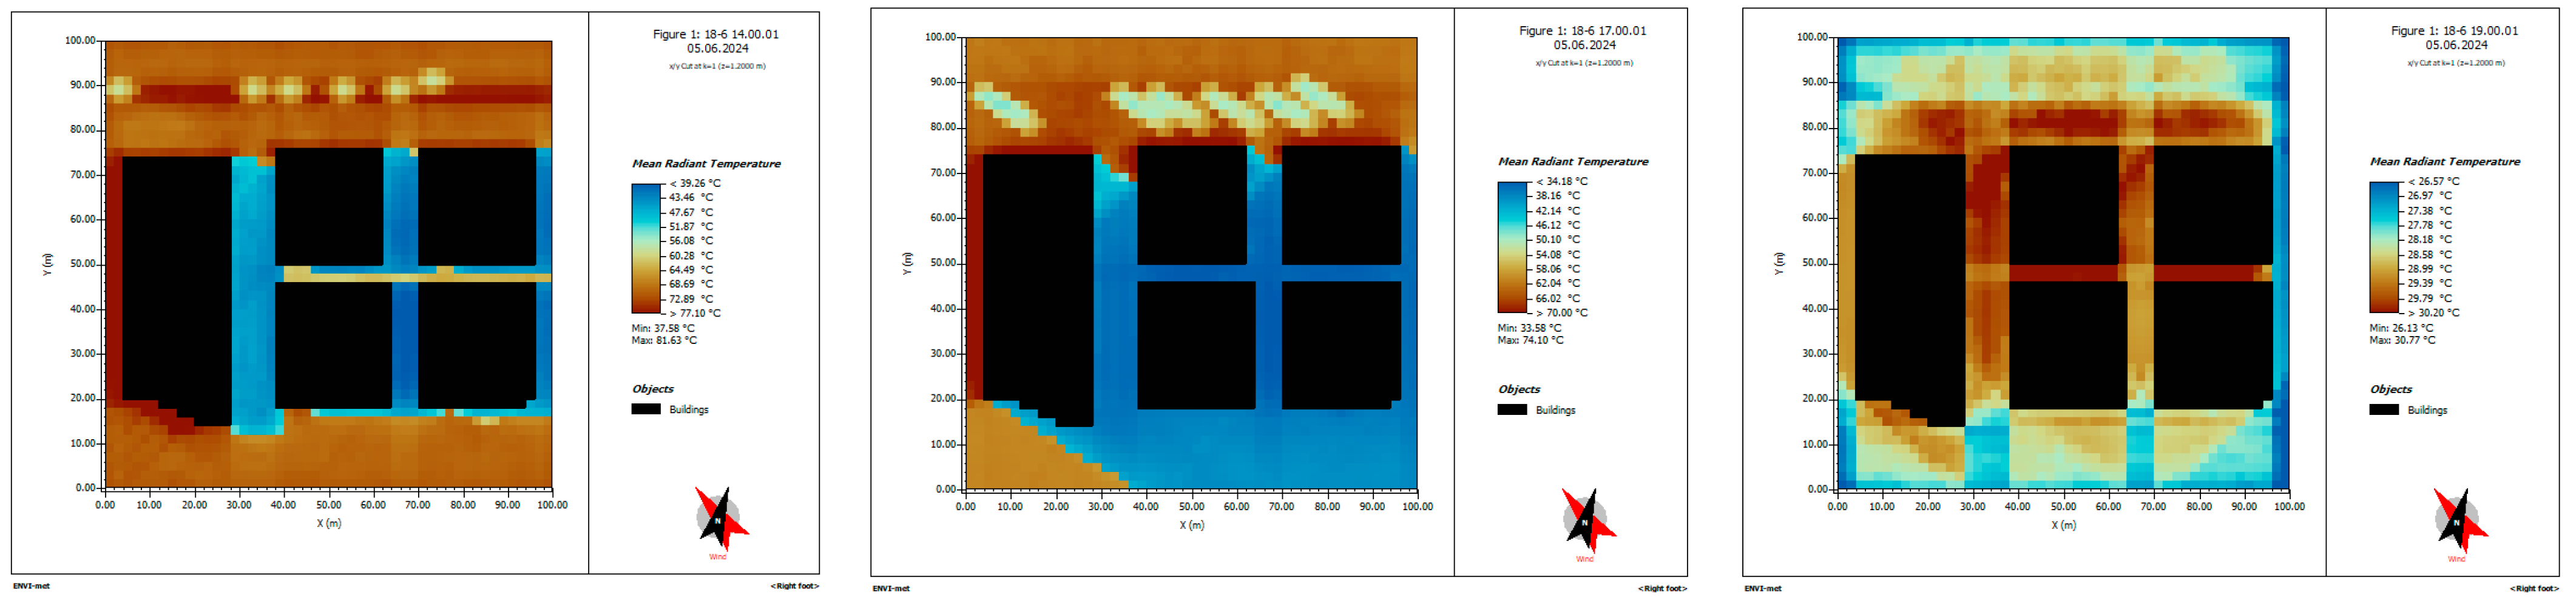
Figure 44.
Case 2 PMV index from 14:00 to 19:00 adapted from Envi-met software.
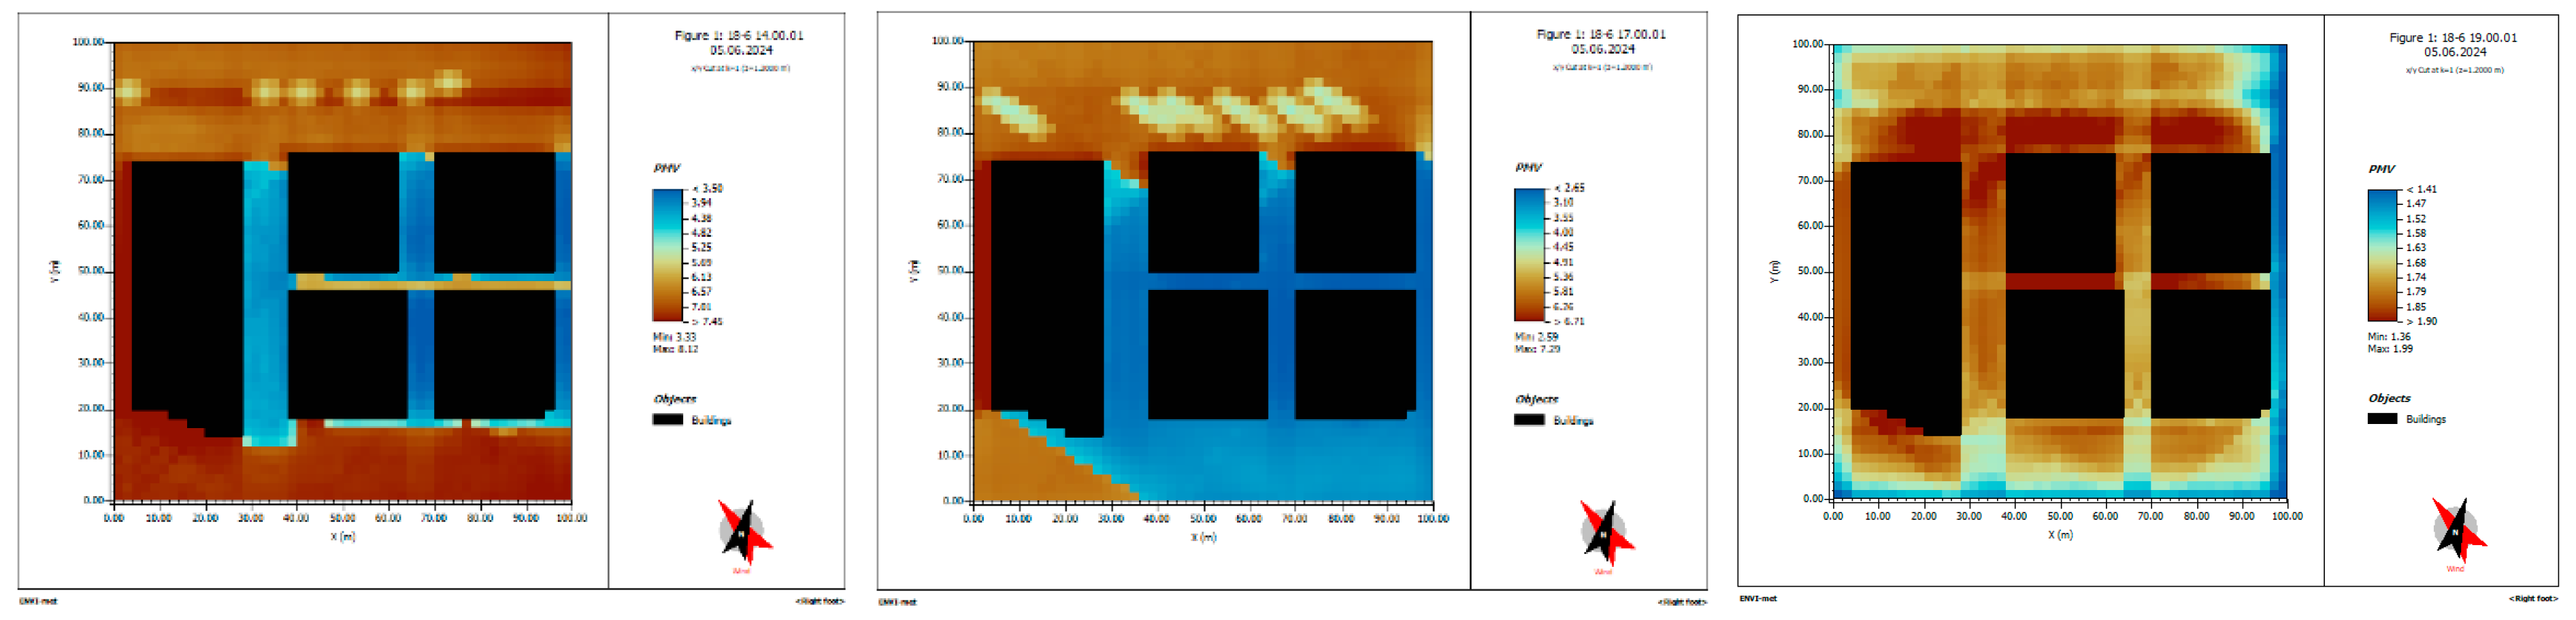
Figure 45.
Case 3 Air Temperature from 11:00 to 18:00 adapted from Envi-met software.
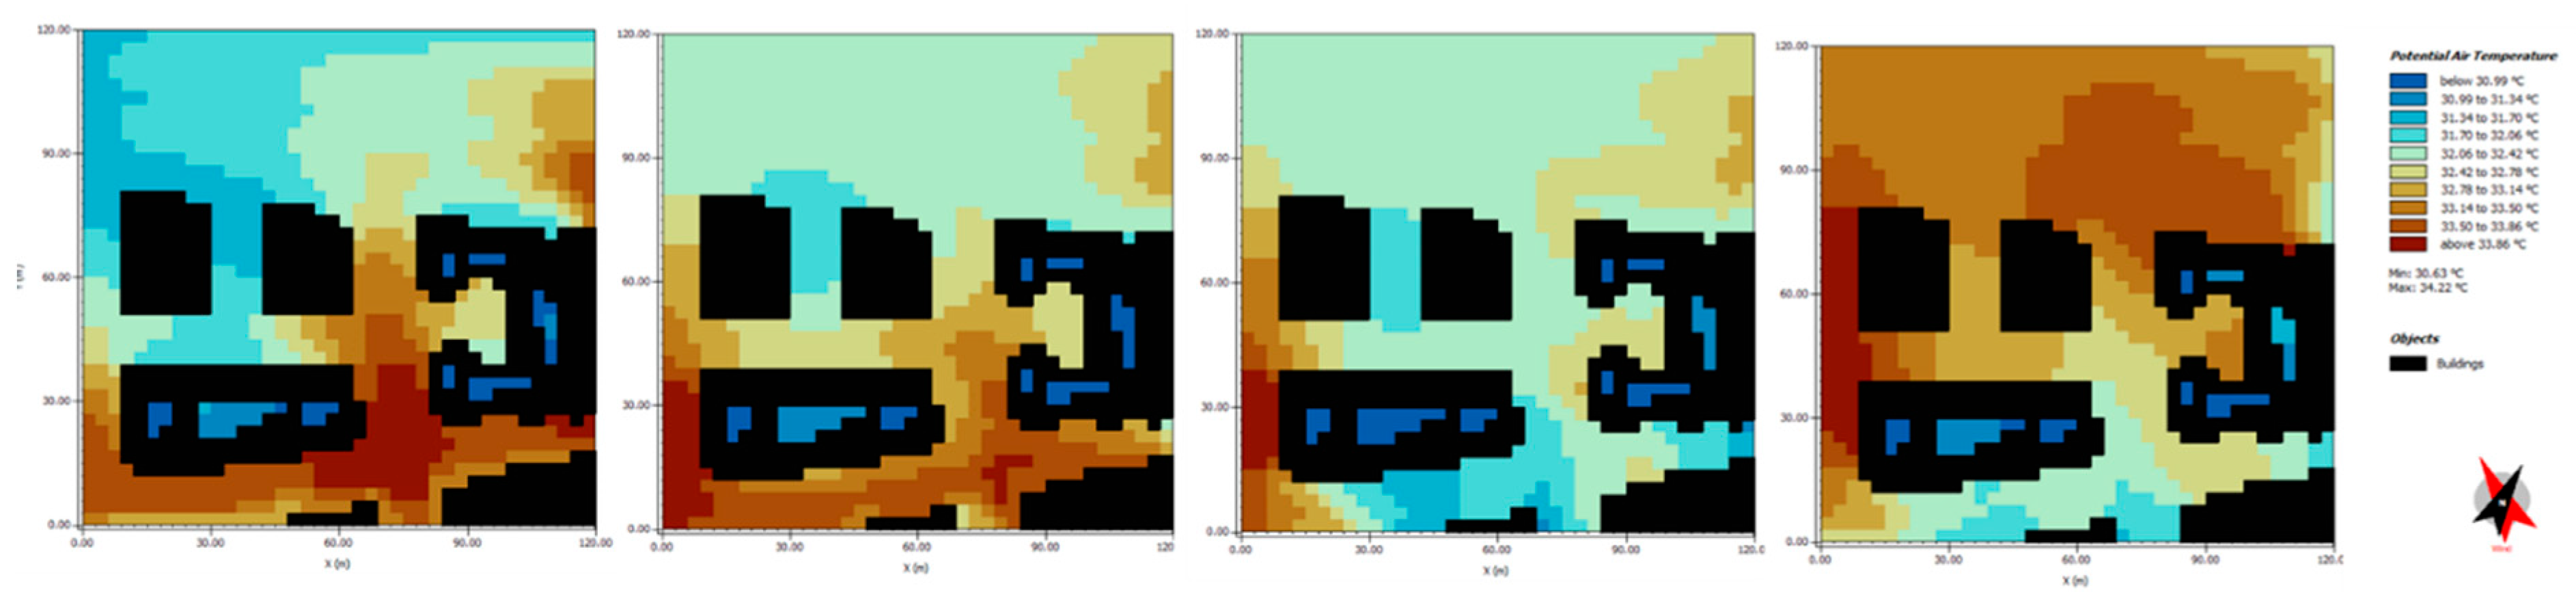
Figure 46.
Case 3 Wind Speed at 12:00, 14:00, 16:00, and 18:00 adapted from Envi-met software.
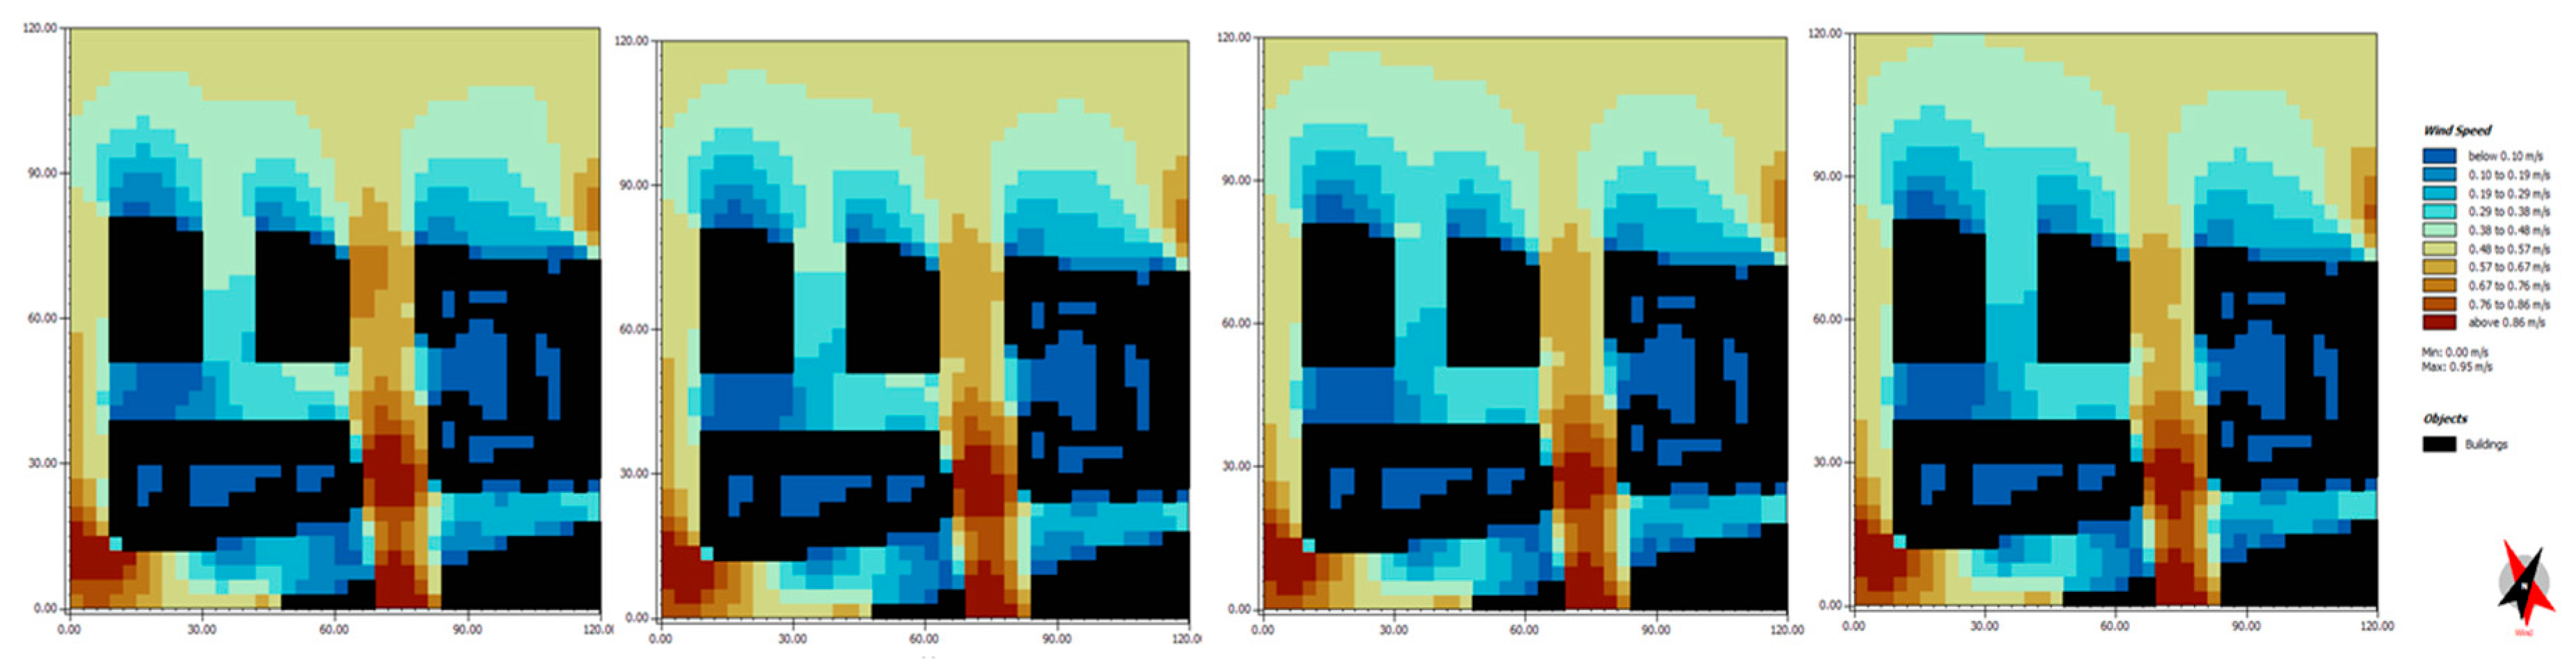
Figure 47.
Case 3 Relative Humidity at 12:00, 14:00, 16:00, and 18:00 adapted from Envi-met software.
Figure 47.
Case 3 Relative Humidity at 12:00, 14:00, 16:00, and 18:00 adapted from Envi-met software.
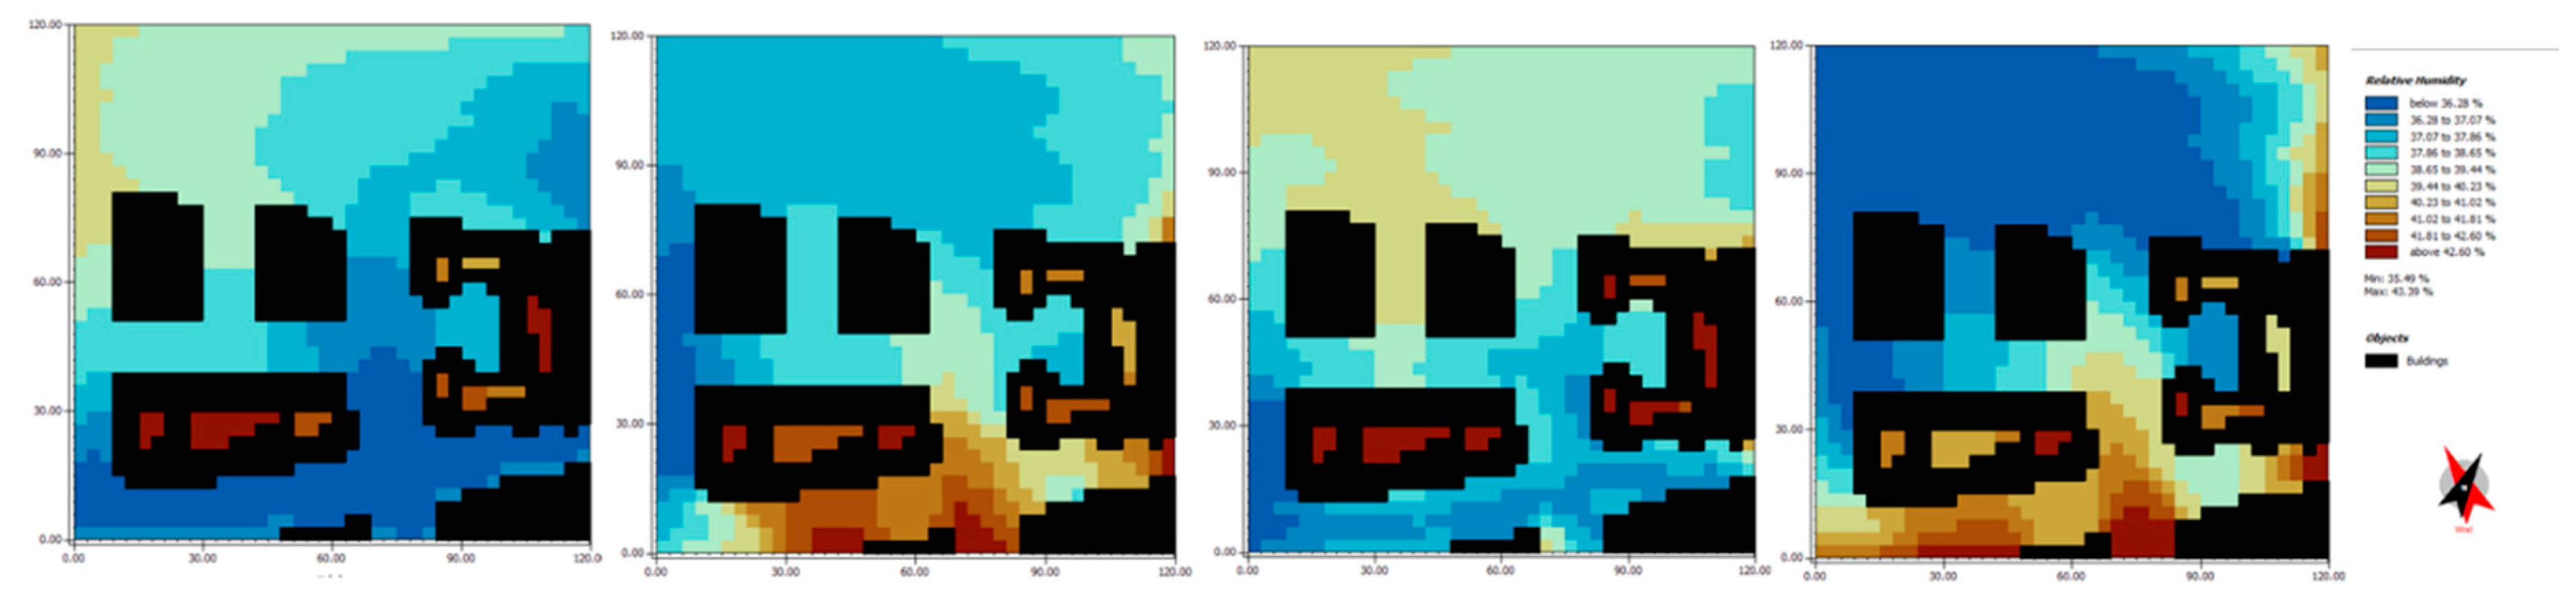
Figure 48.
Case 3 Mean Radiant Temperature (Tmrt) at 12:00, 14:00, 16:00, and 18:00 adapted from Envi-met software.
Figure 48.
Case 3 Mean Radiant Temperature (Tmrt) at 12:00, 14:00, 16:00, and 18:00 adapted from Envi-met software.
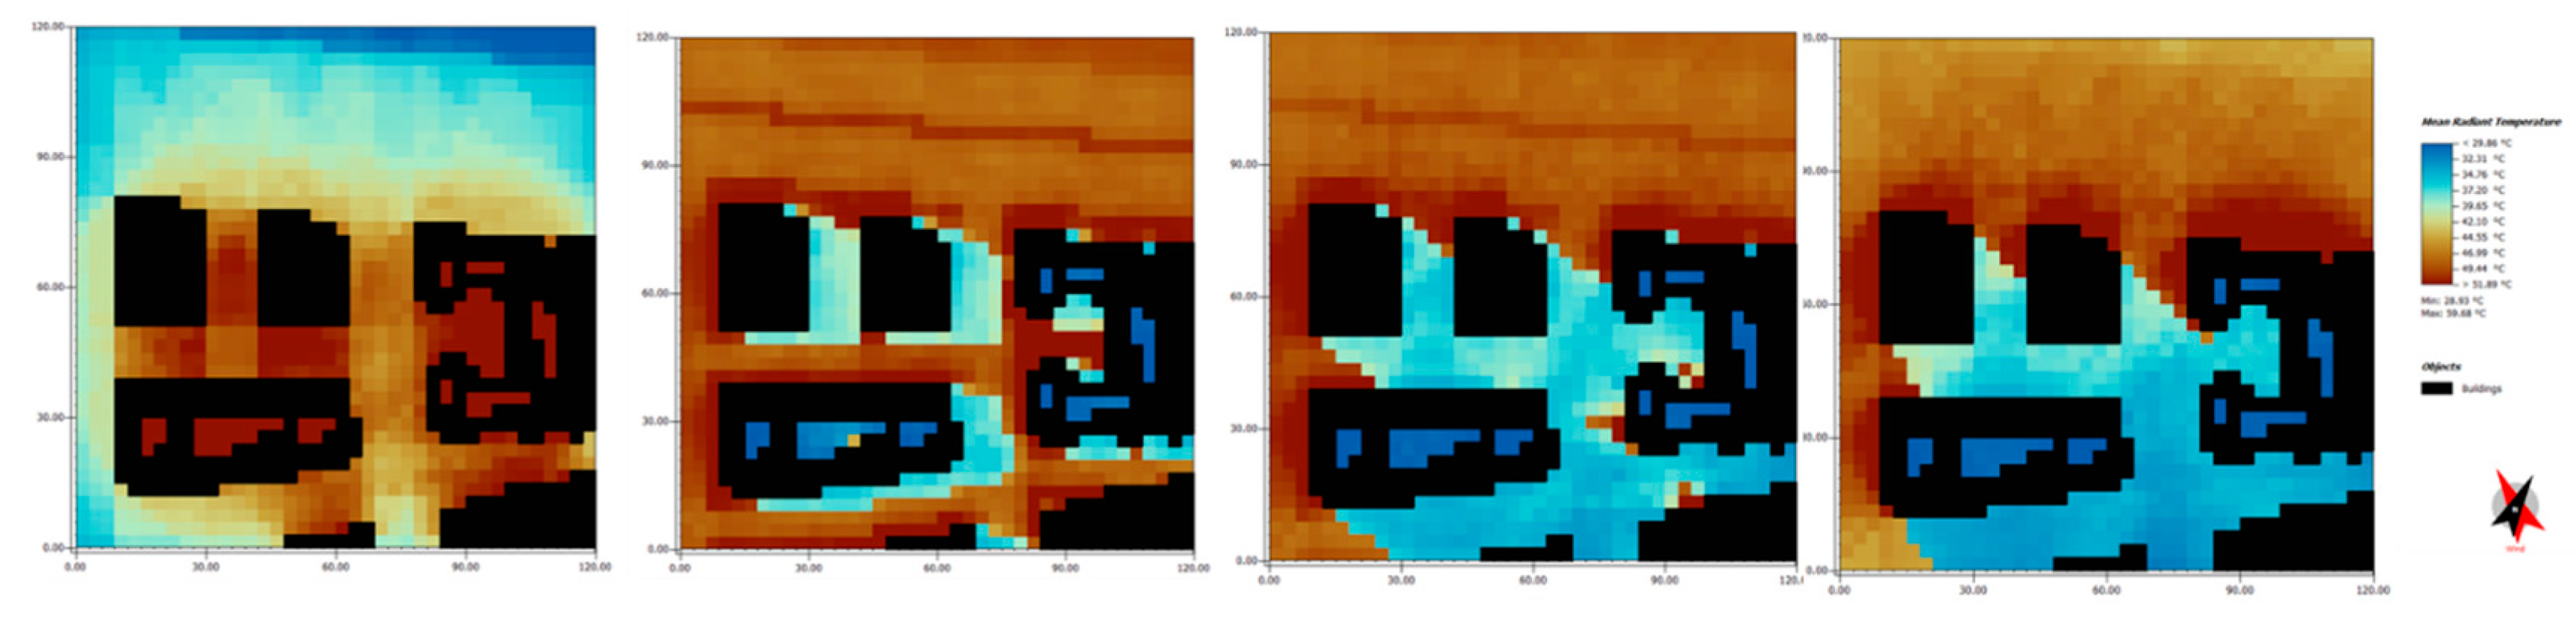
Figure 49.
Case 3 Predicted Mean Vote (PMV) index at 12:00, 14:00, 16:00, and 18:00 adapted from Envi-met software.
Figure 49.
Case 3 Predicted Mean Vote (PMV) index at 12:00, 14:00, 16:00, and 18:00 adapted from Envi-met software.
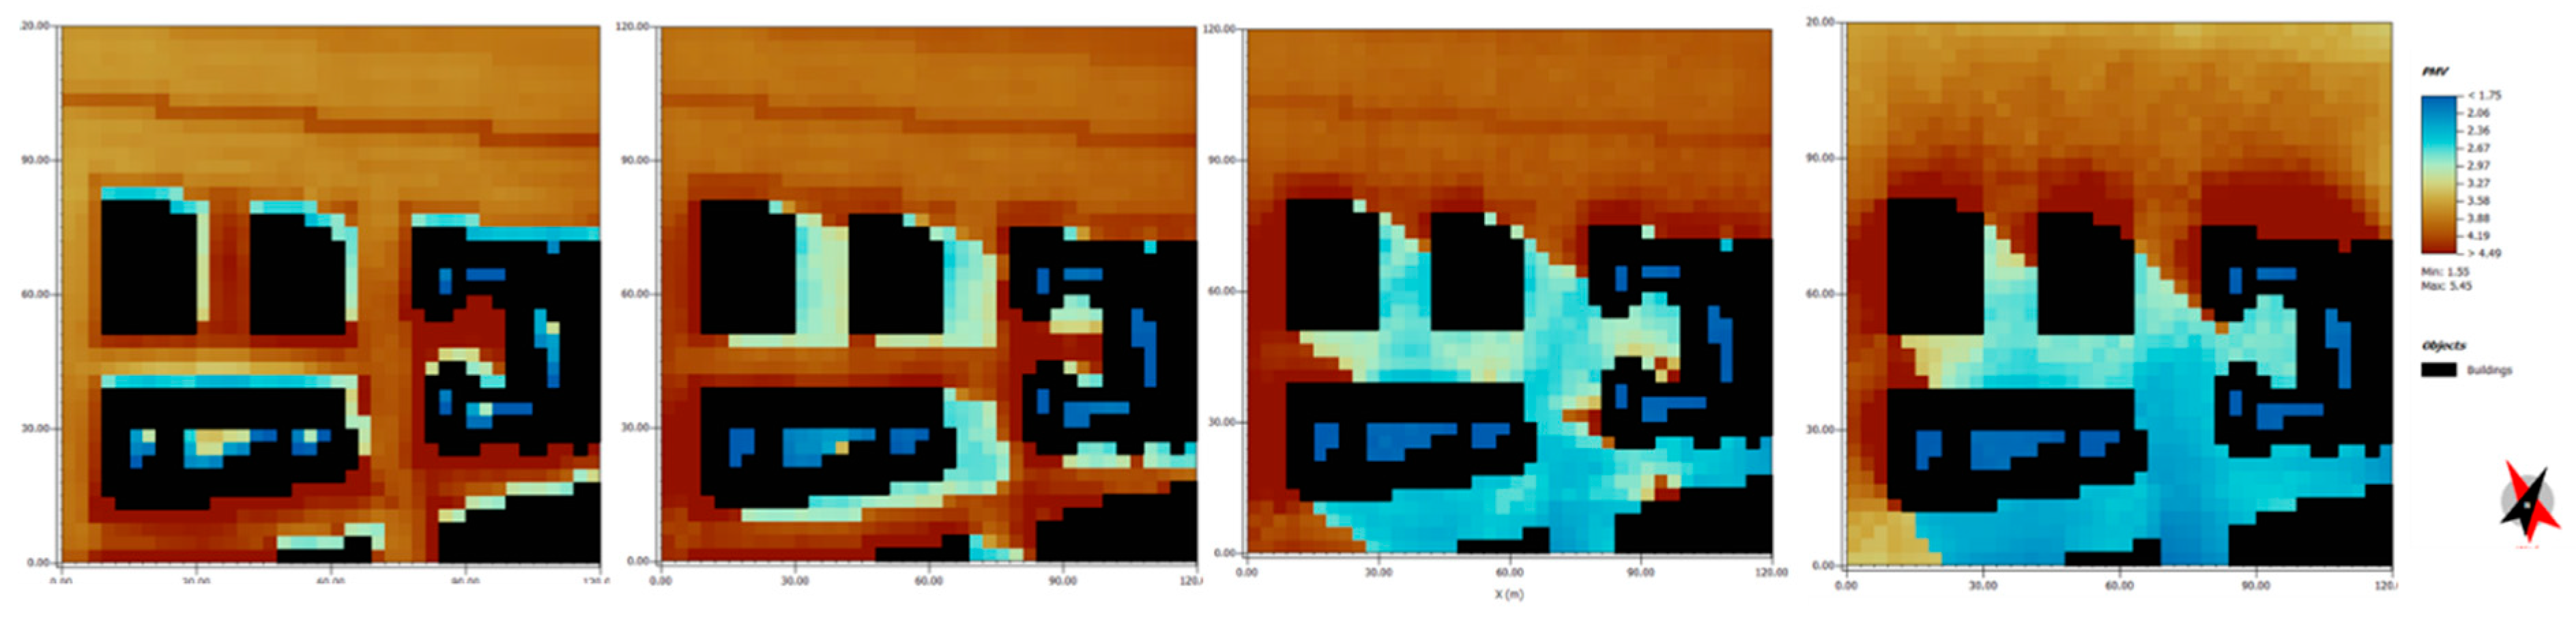
Figure 50.
Case 4 Air Temperature from 11:00 to 18:00 adapted from Envi-met software.
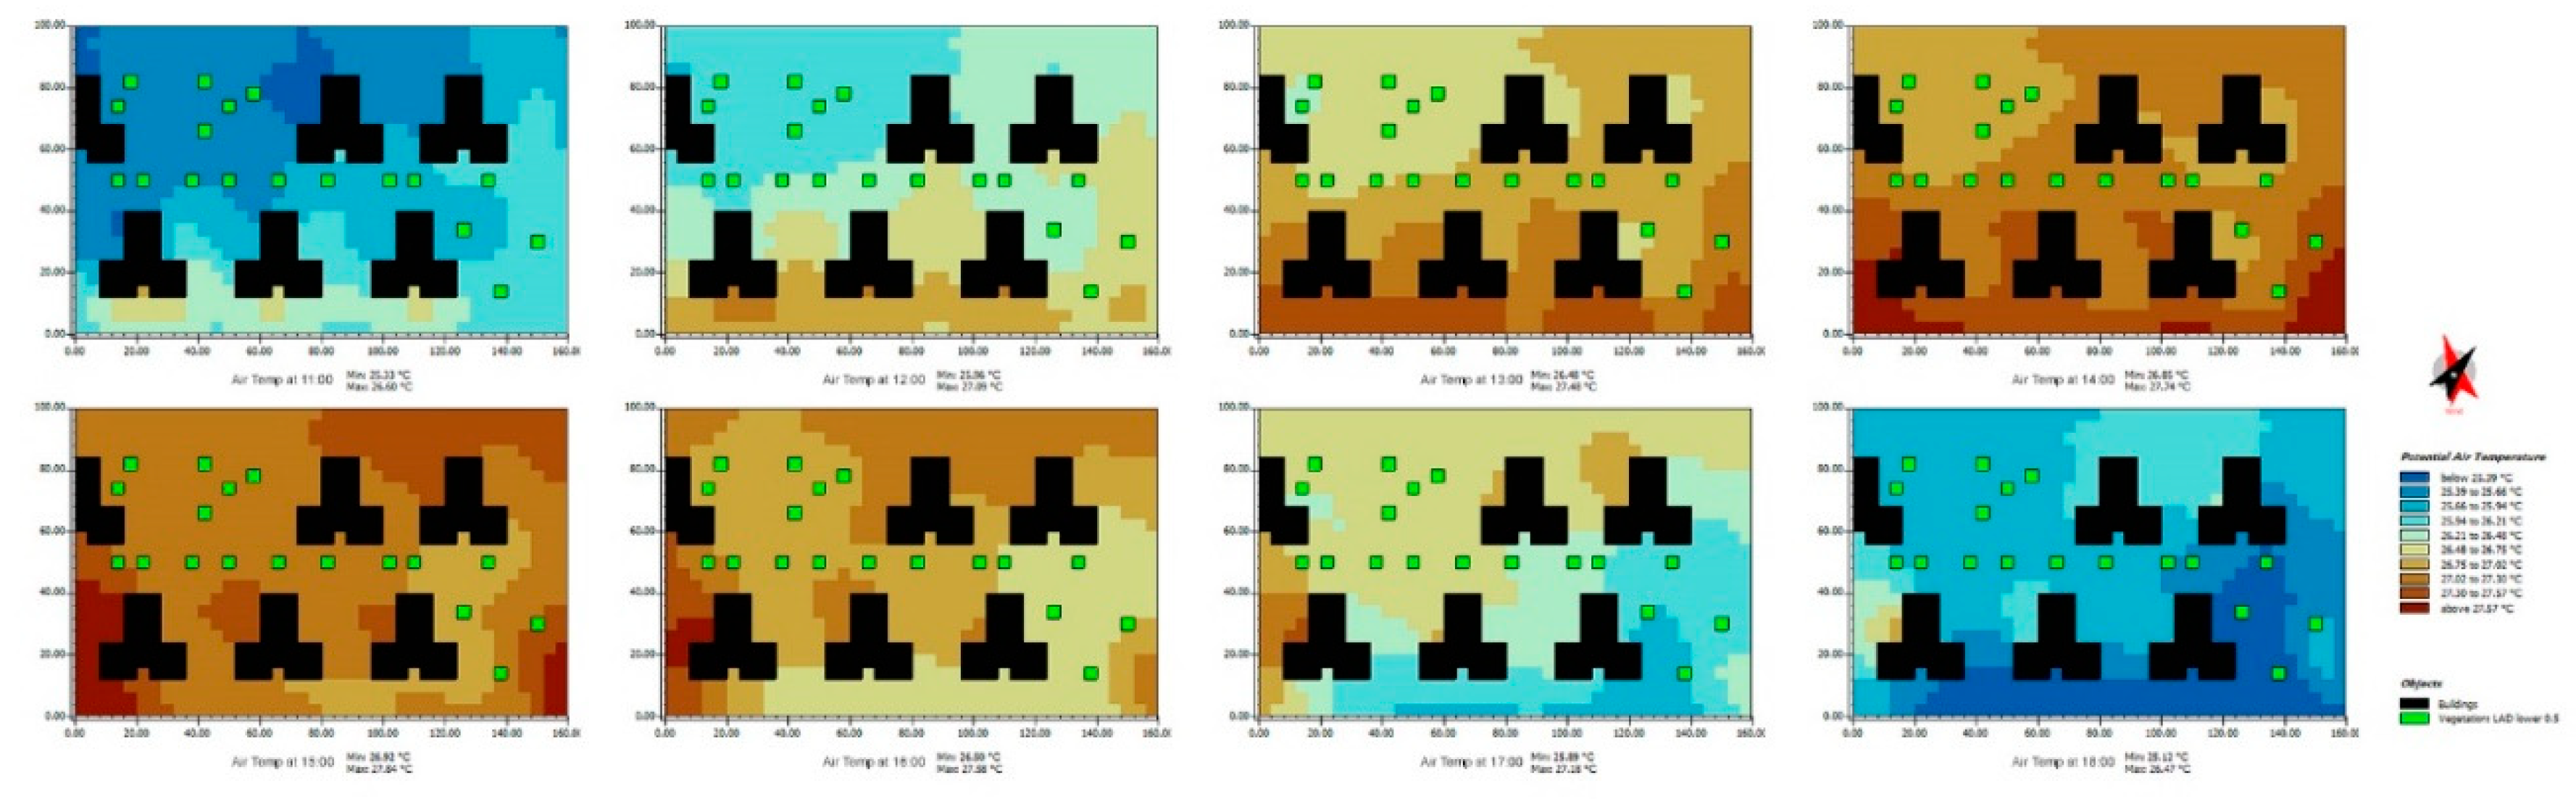
Figure 51.
Case 4 Wind Speed at 12:00, 14:00, 16:00, and 18:00 adapted from Envi-met software.
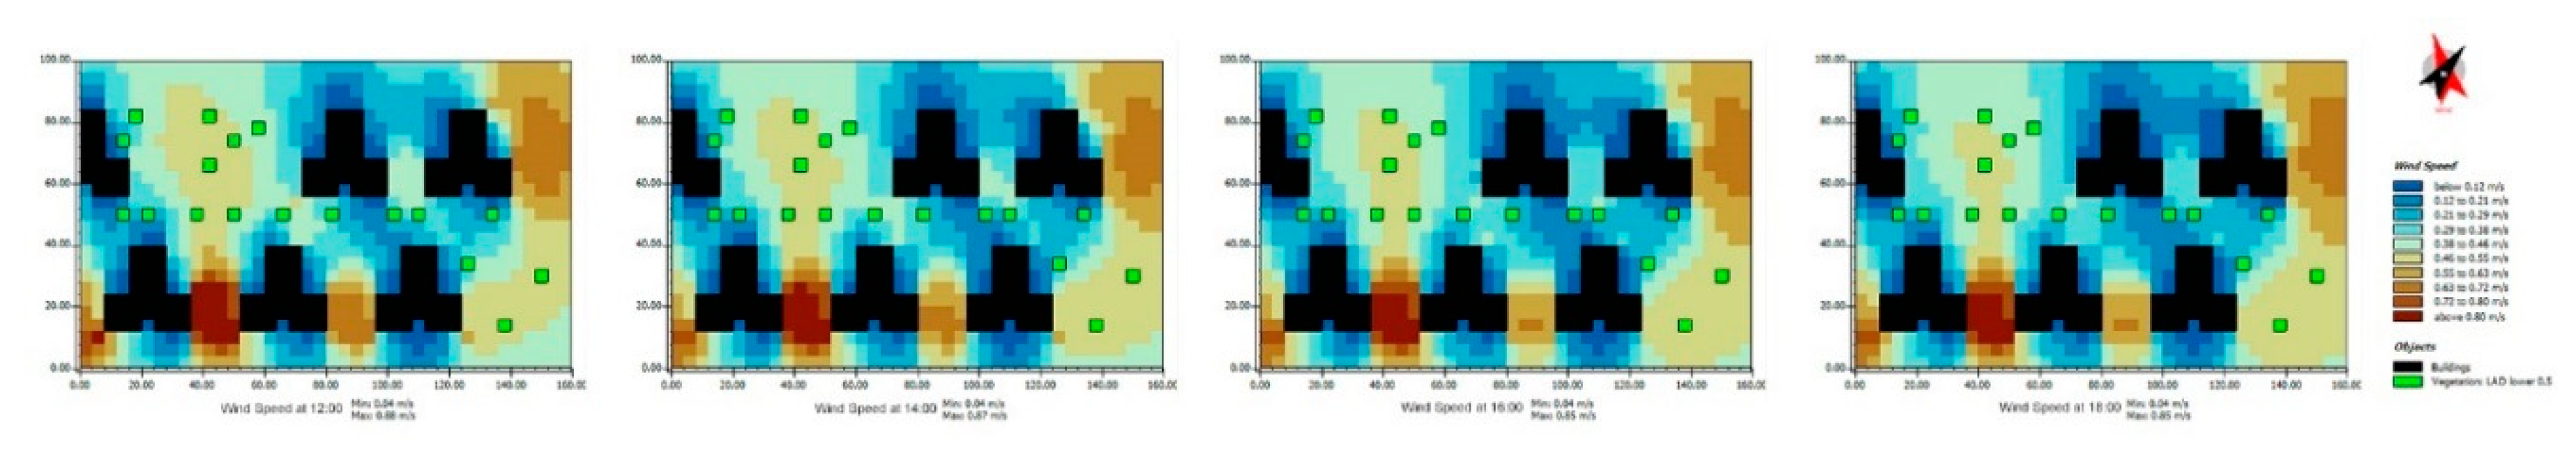
Figure 52.
Case 4 Relative Humidity at 12:00, 14:00, 16:00, and 18:00 adapted from Envi-met software.
Figure 52.
Case 4 Relative Humidity at 12:00, 14:00, 16:00, and 18:00 adapted from Envi-met software.
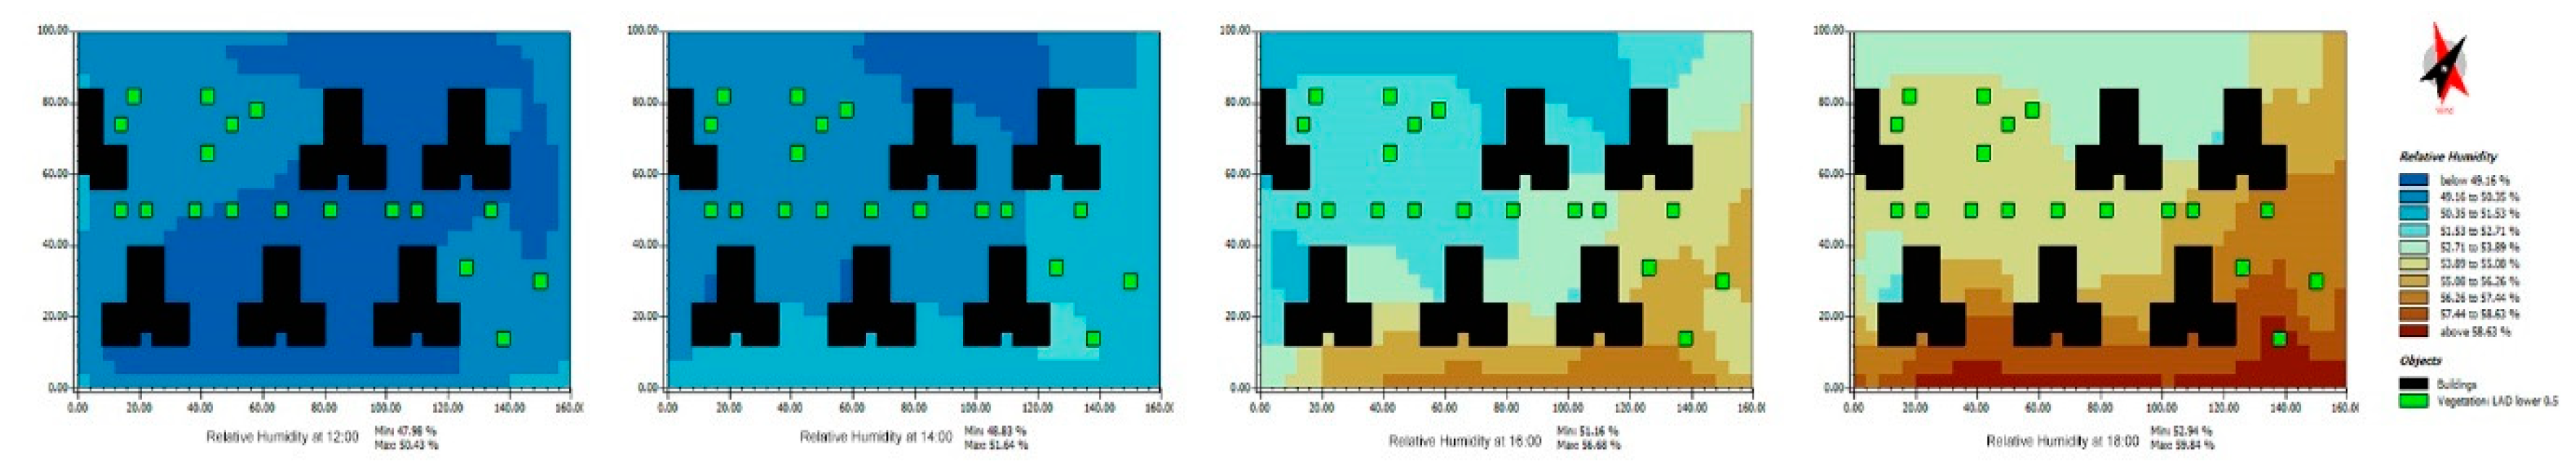
Figure 53.
Case 4 Mean Radiant Temperature (Tmrt) at 12:00, 14:00, 16:00, and 18:00 adapted from Envi-met software.
Figure 53.
Case 4 Mean Radiant Temperature (Tmrt) at 12:00, 14:00, 16:00, and 18:00 adapted from Envi-met software.
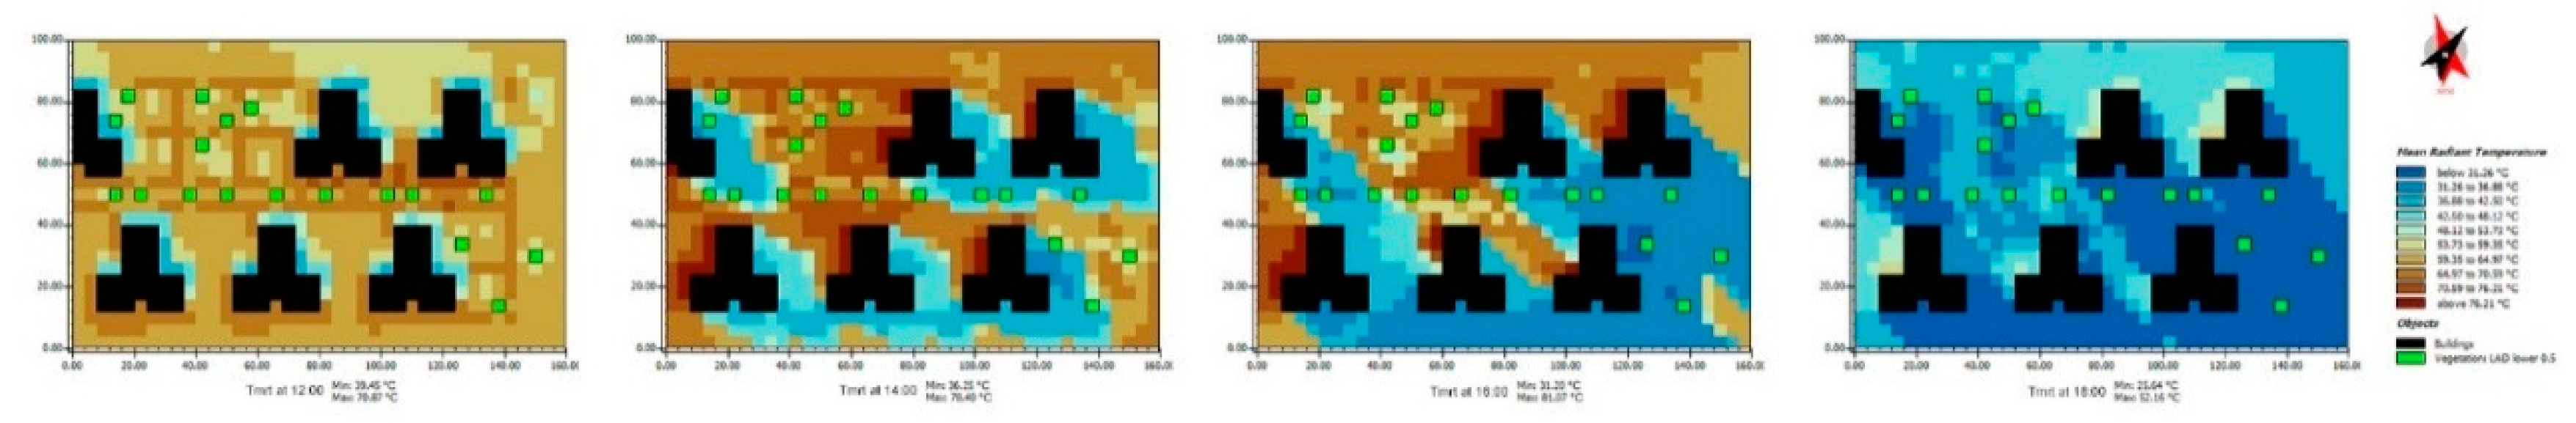
Figure 54.
Case 4 Predicted Mean Vote (PMV) index at 12:00, 14:00, 16:00, and 18:00 adapted from Envi-met software.
Figure 54.
Case 4 Predicted Mean Vote (PMV) index at 12:00, 14:00, 16:00, and 18:00 adapted from Envi-met software.
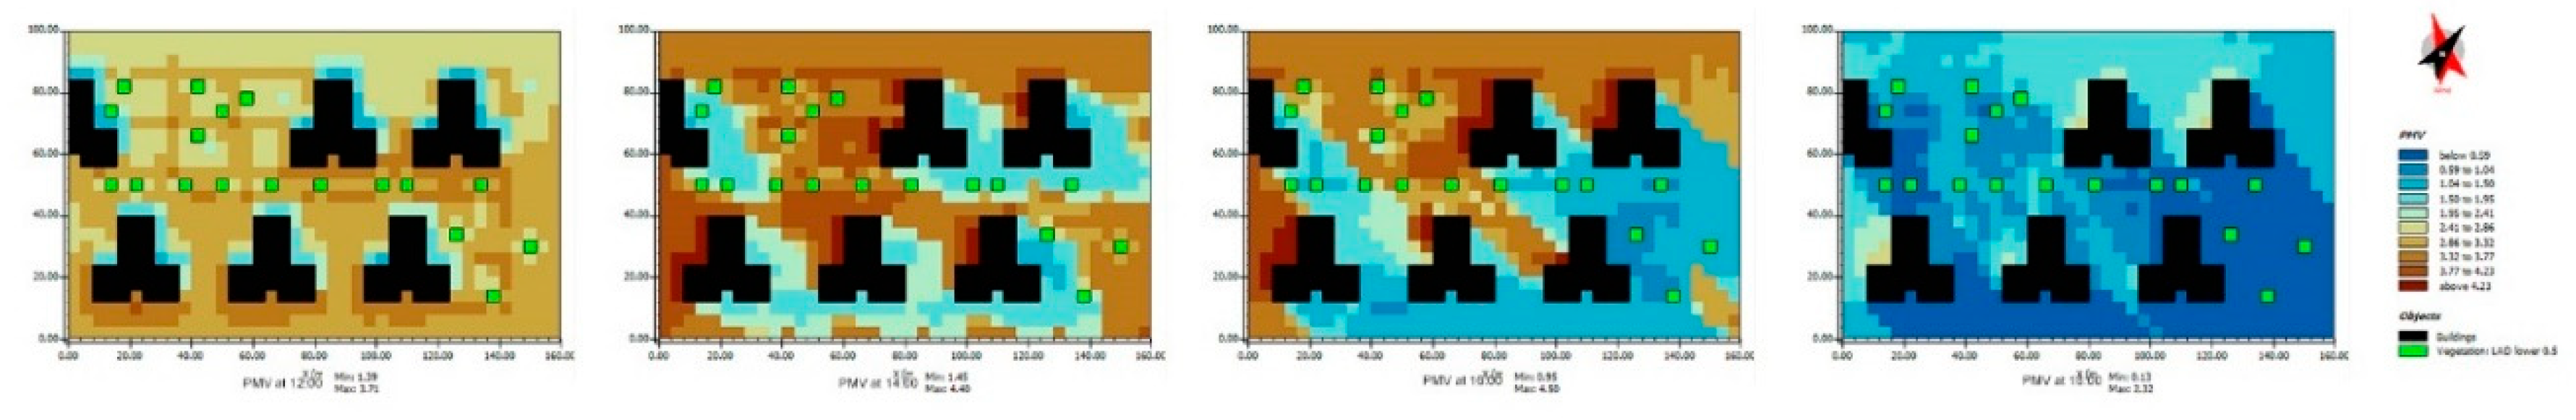
Figure 55.
Average Air Temperature for four cases adapted from Envi-met software.
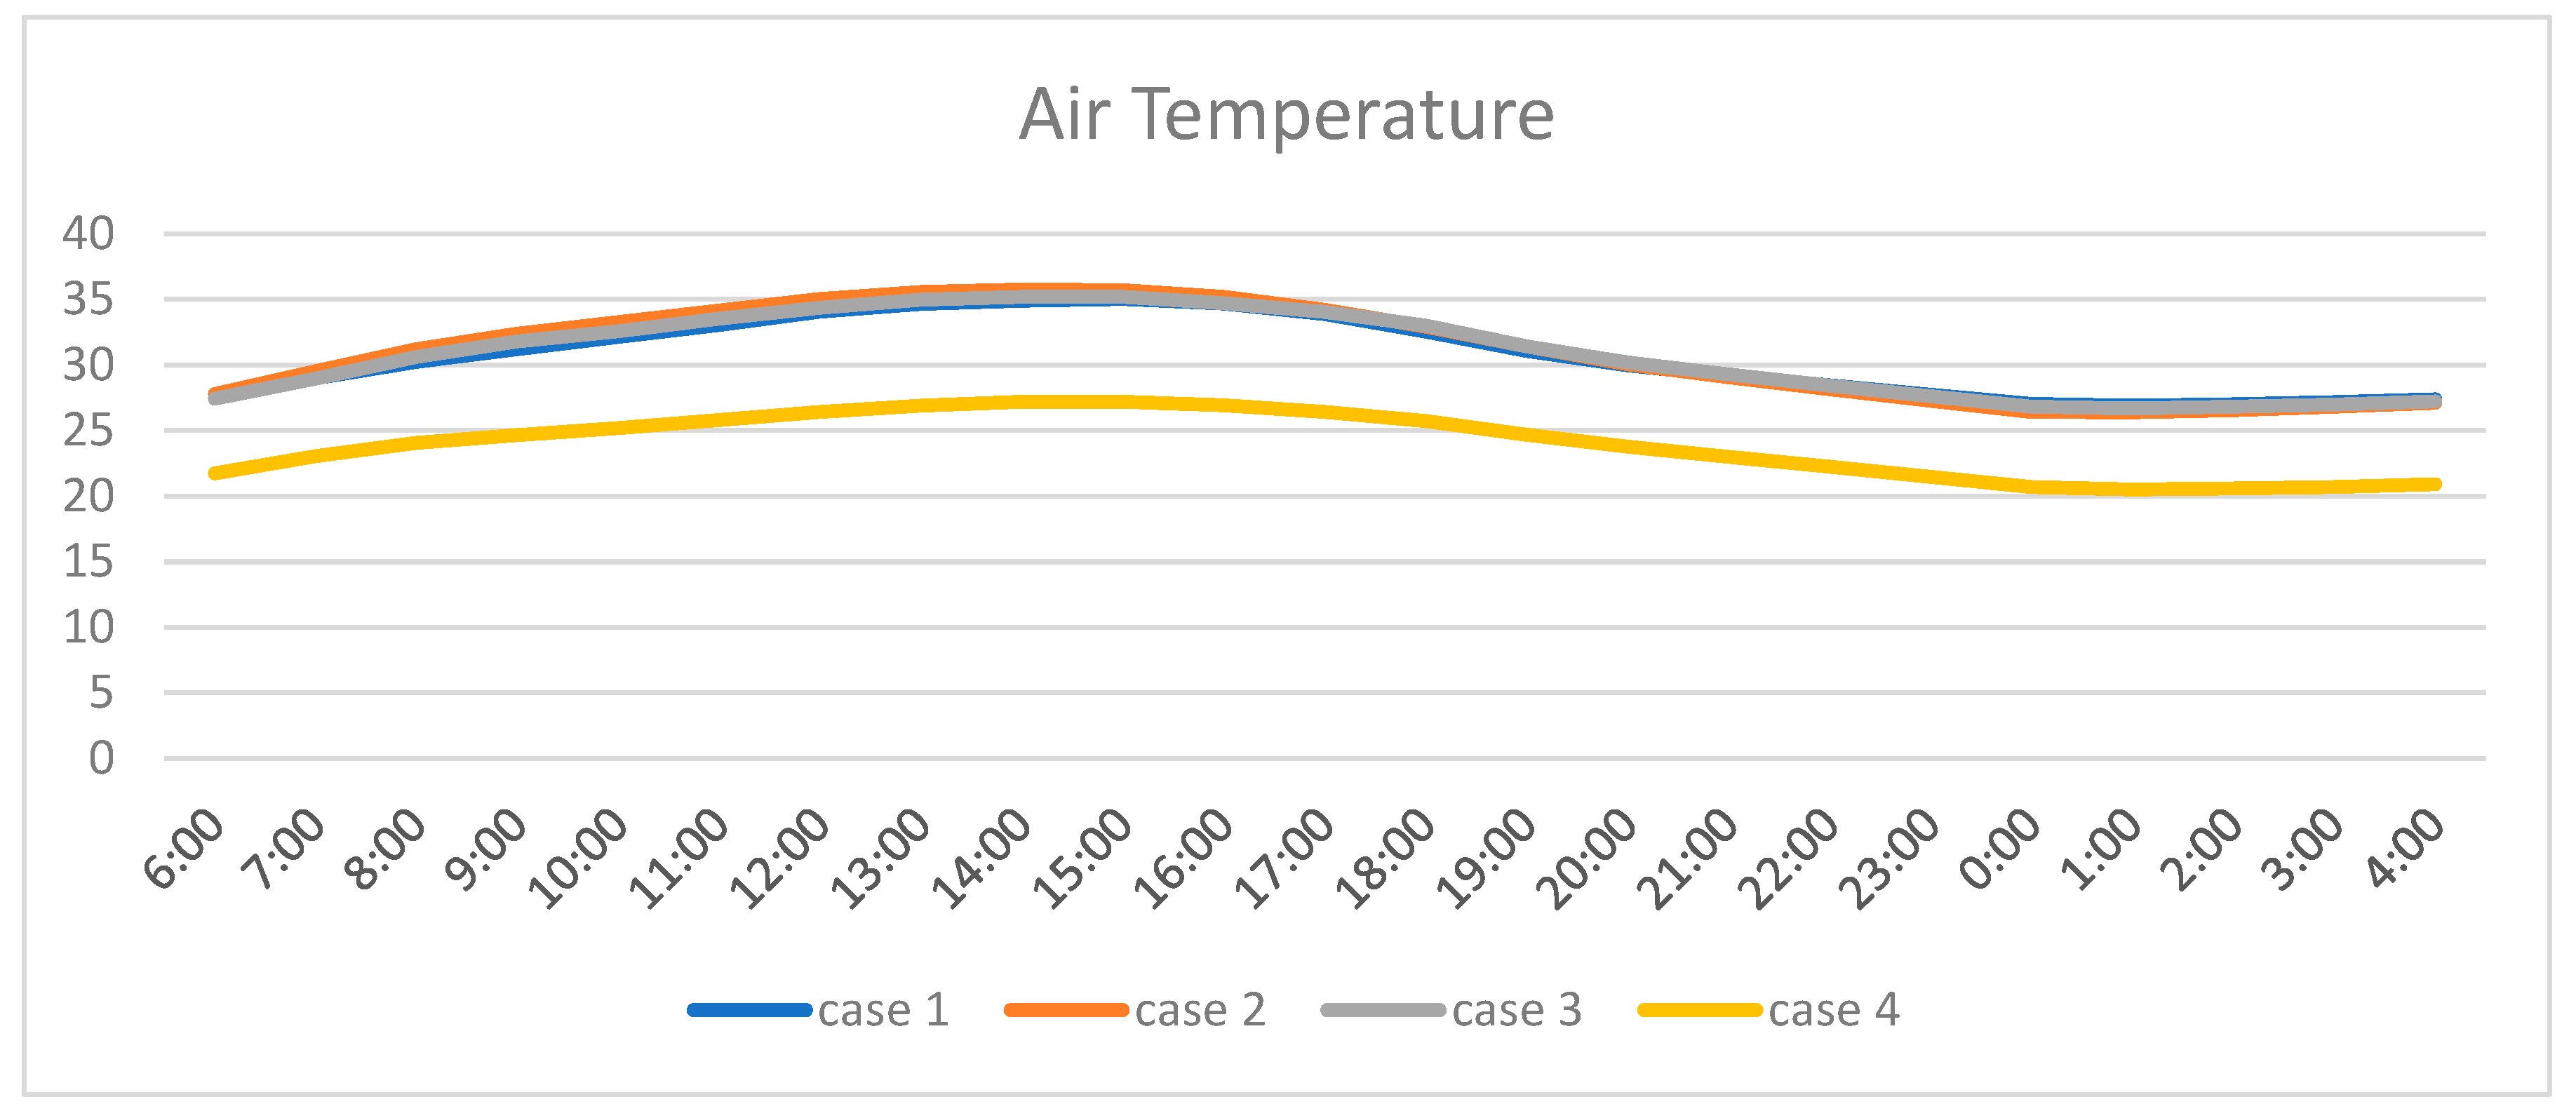
Figure 56.
Average Wind Speed for four cases adapted from Envi-met software.
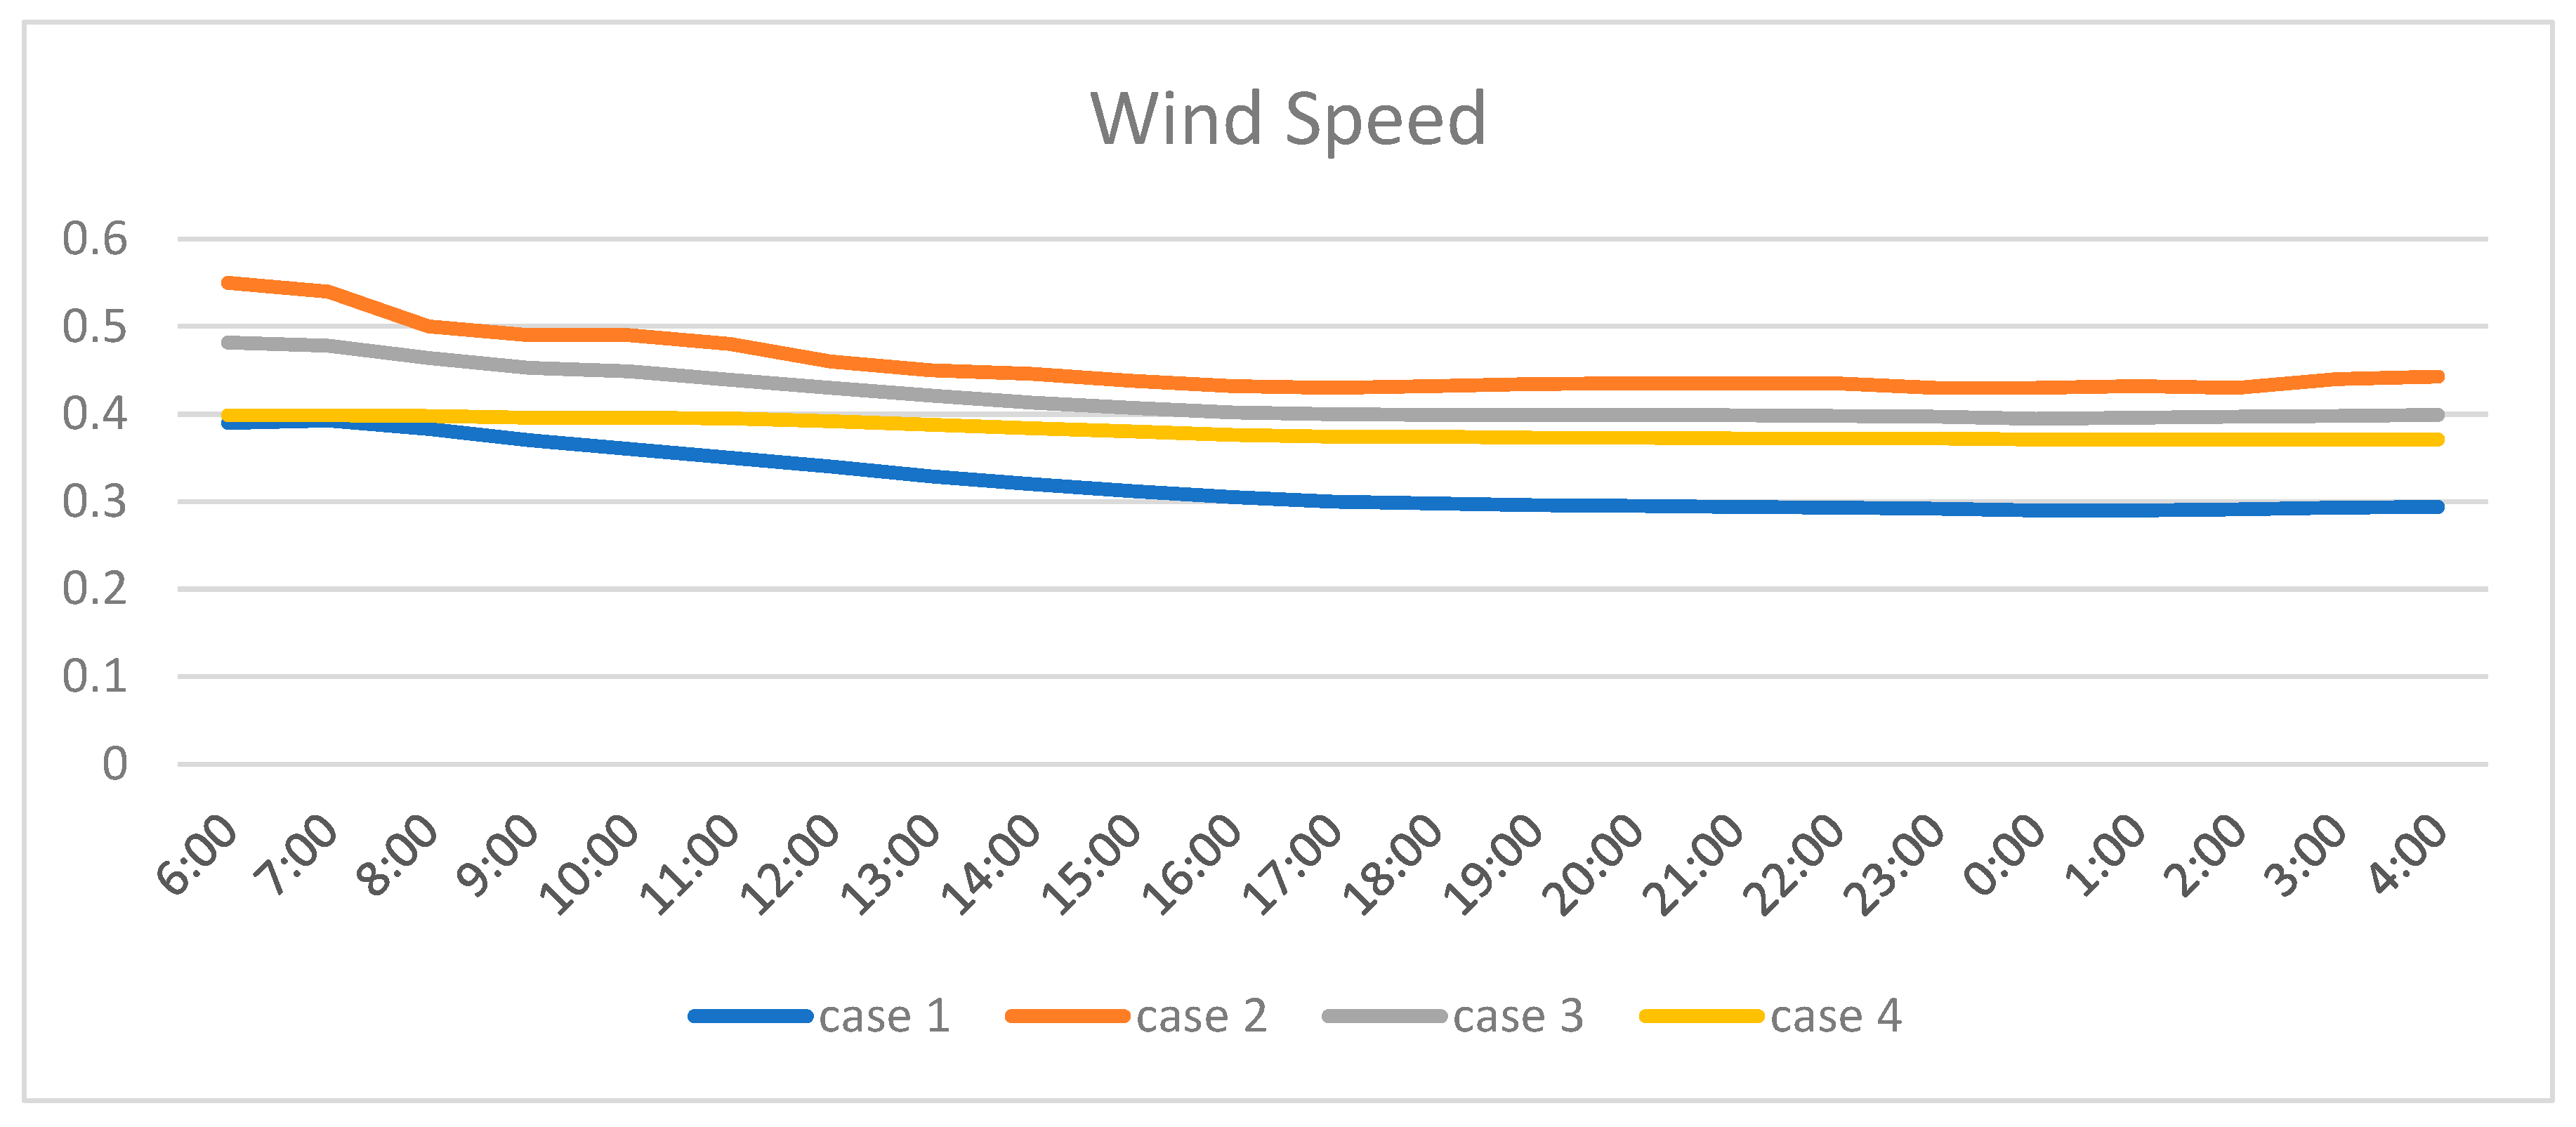
Figure 57.
Average Relative Humidity for four cases adapted from Envi-met software.
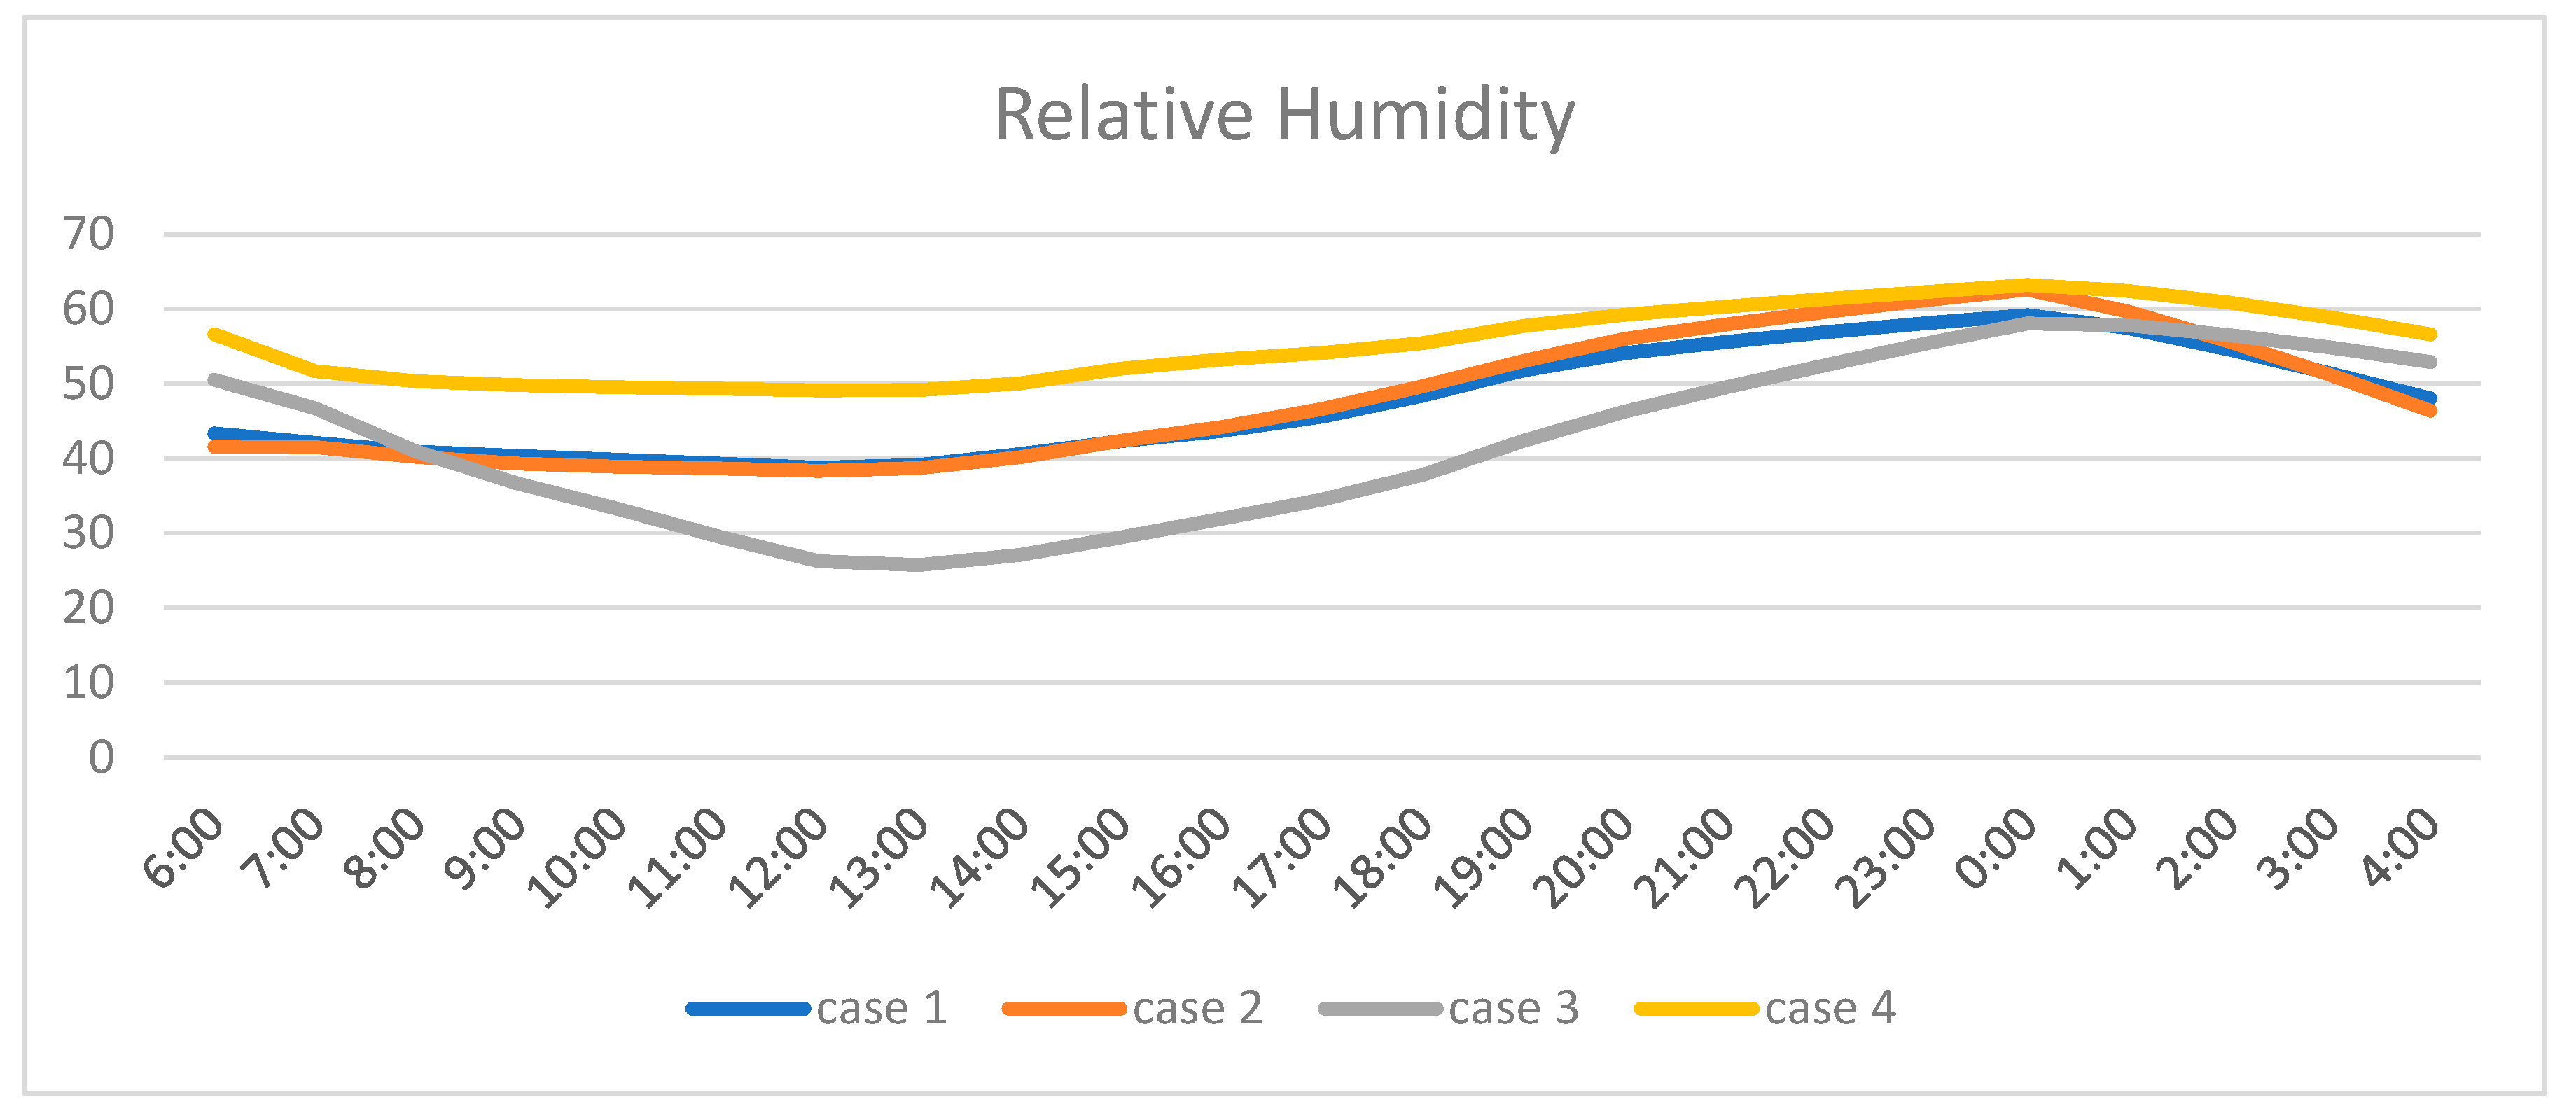
Figure 58.
Average Mean Radiant Temperature (Tmrt) for four cases adapted from Envi-met software.
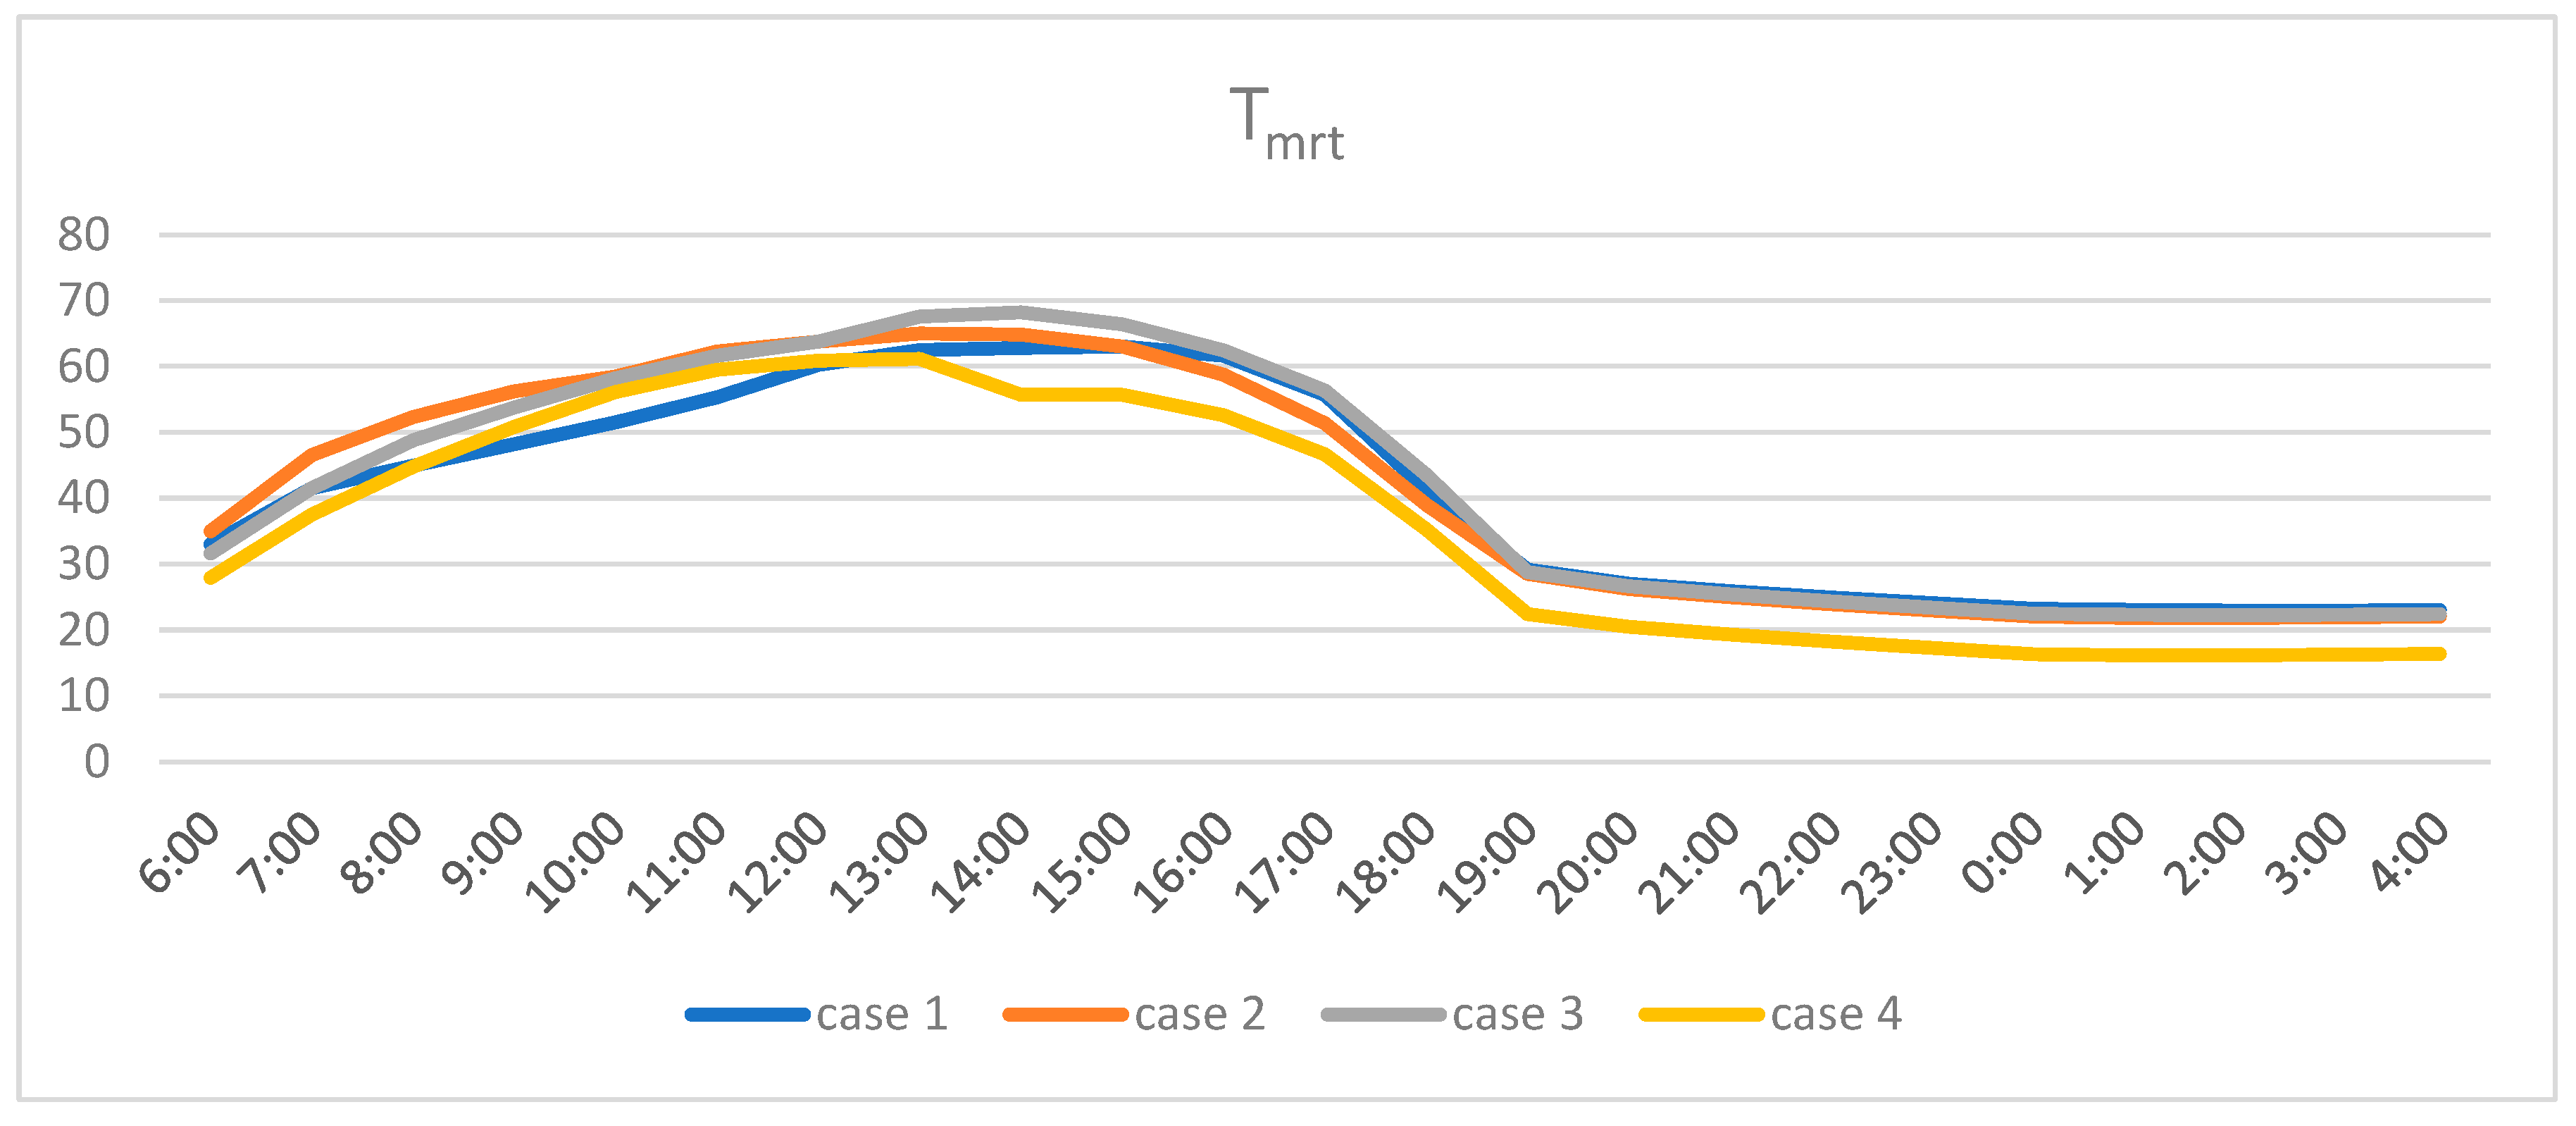
Figure 59.
Average PMV for four cases adapted from Envi-met software.
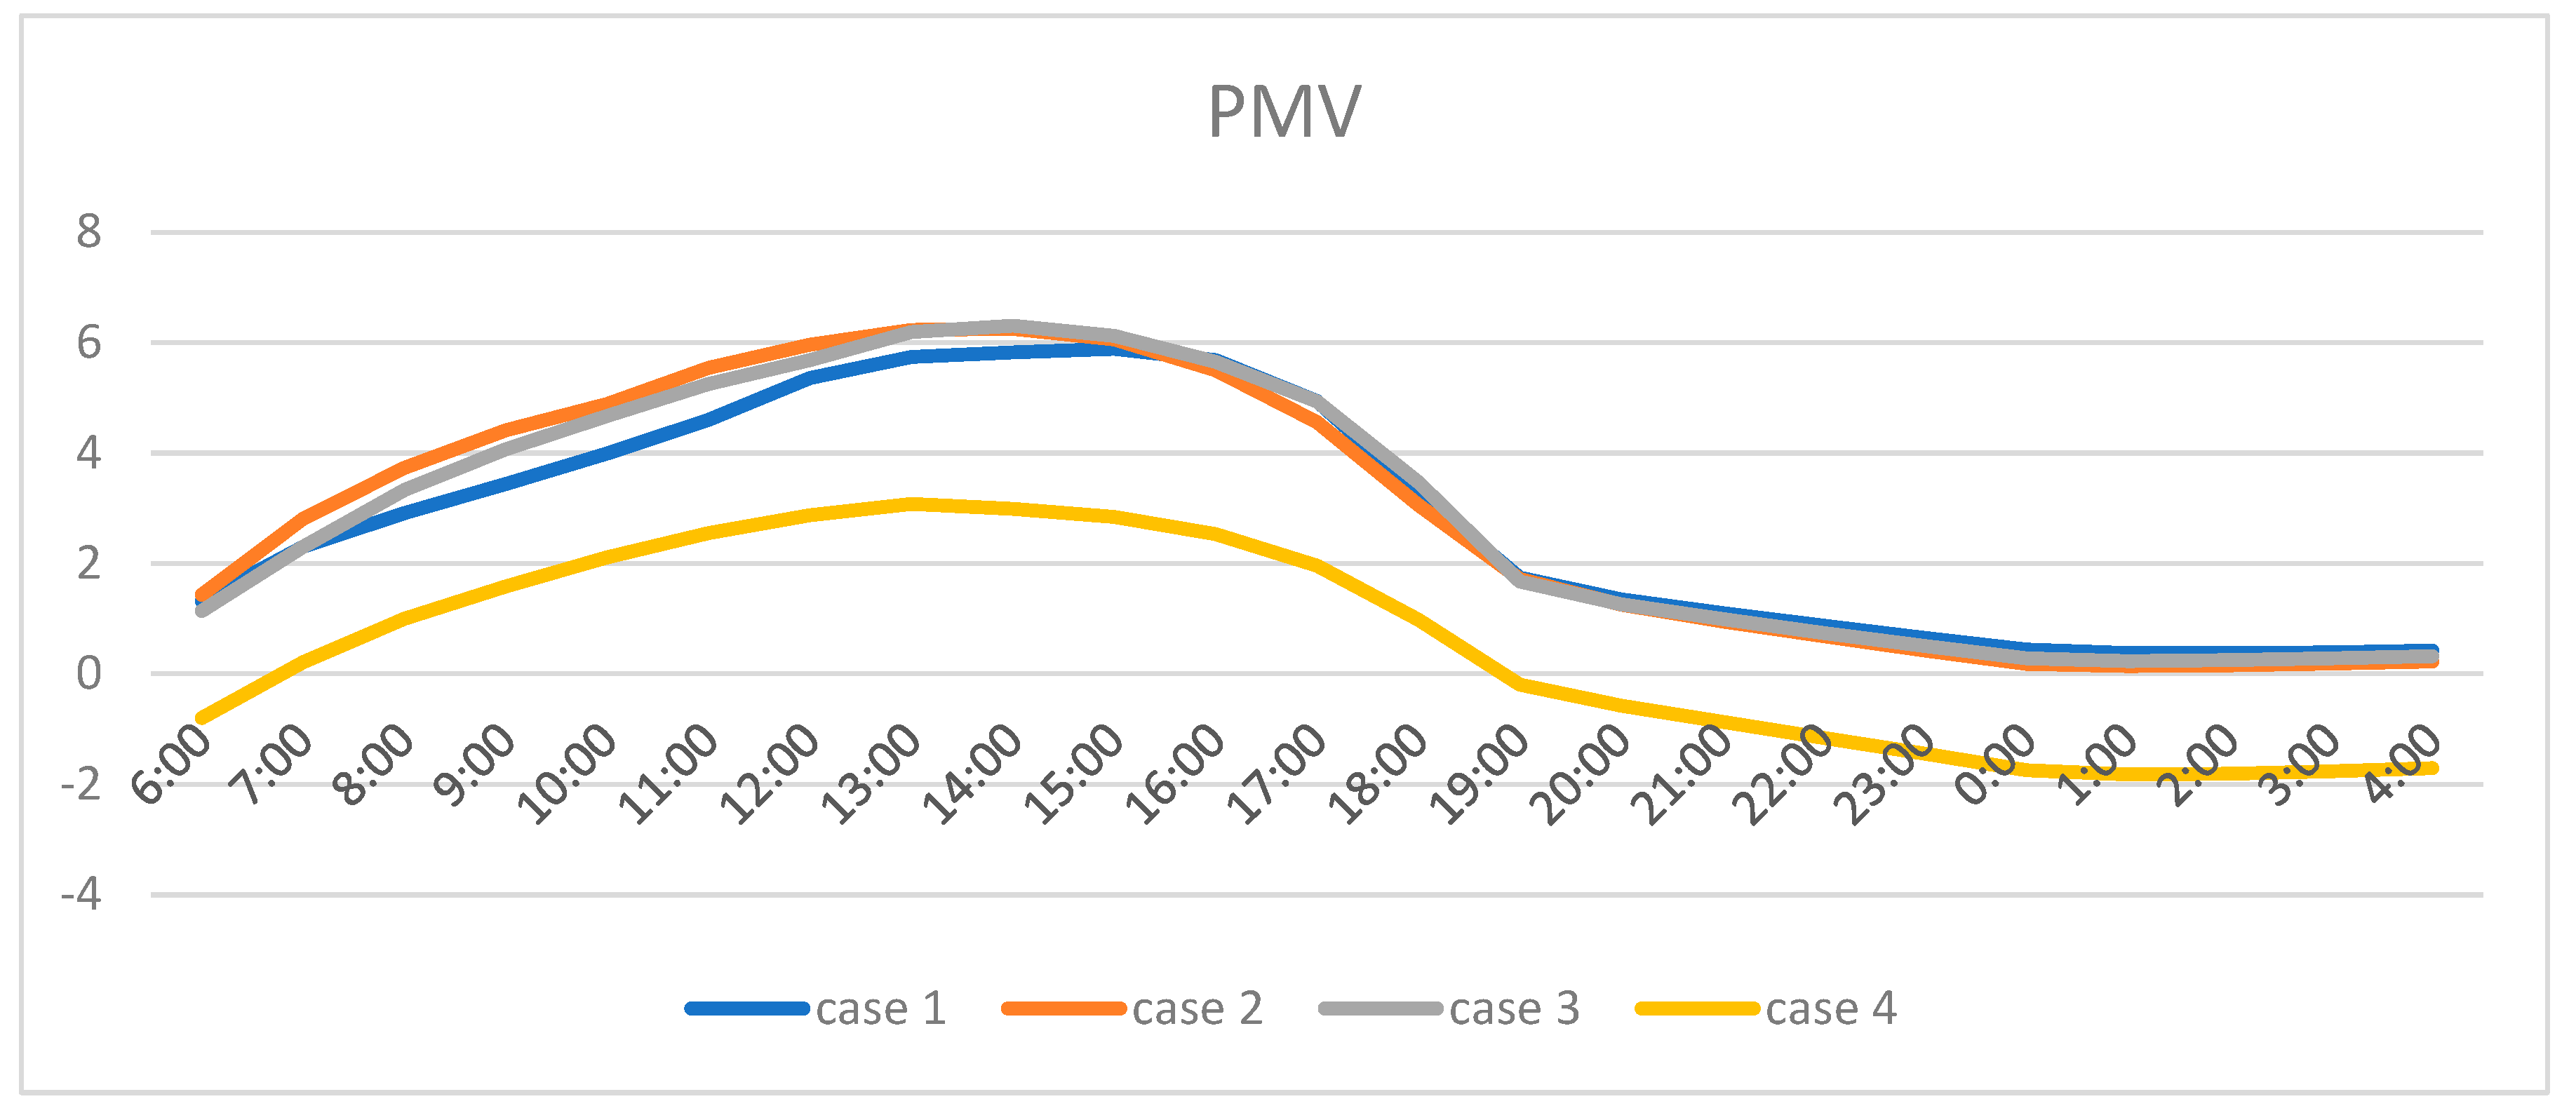
Table 10.
Parametric Morphological Outcomes from the base.
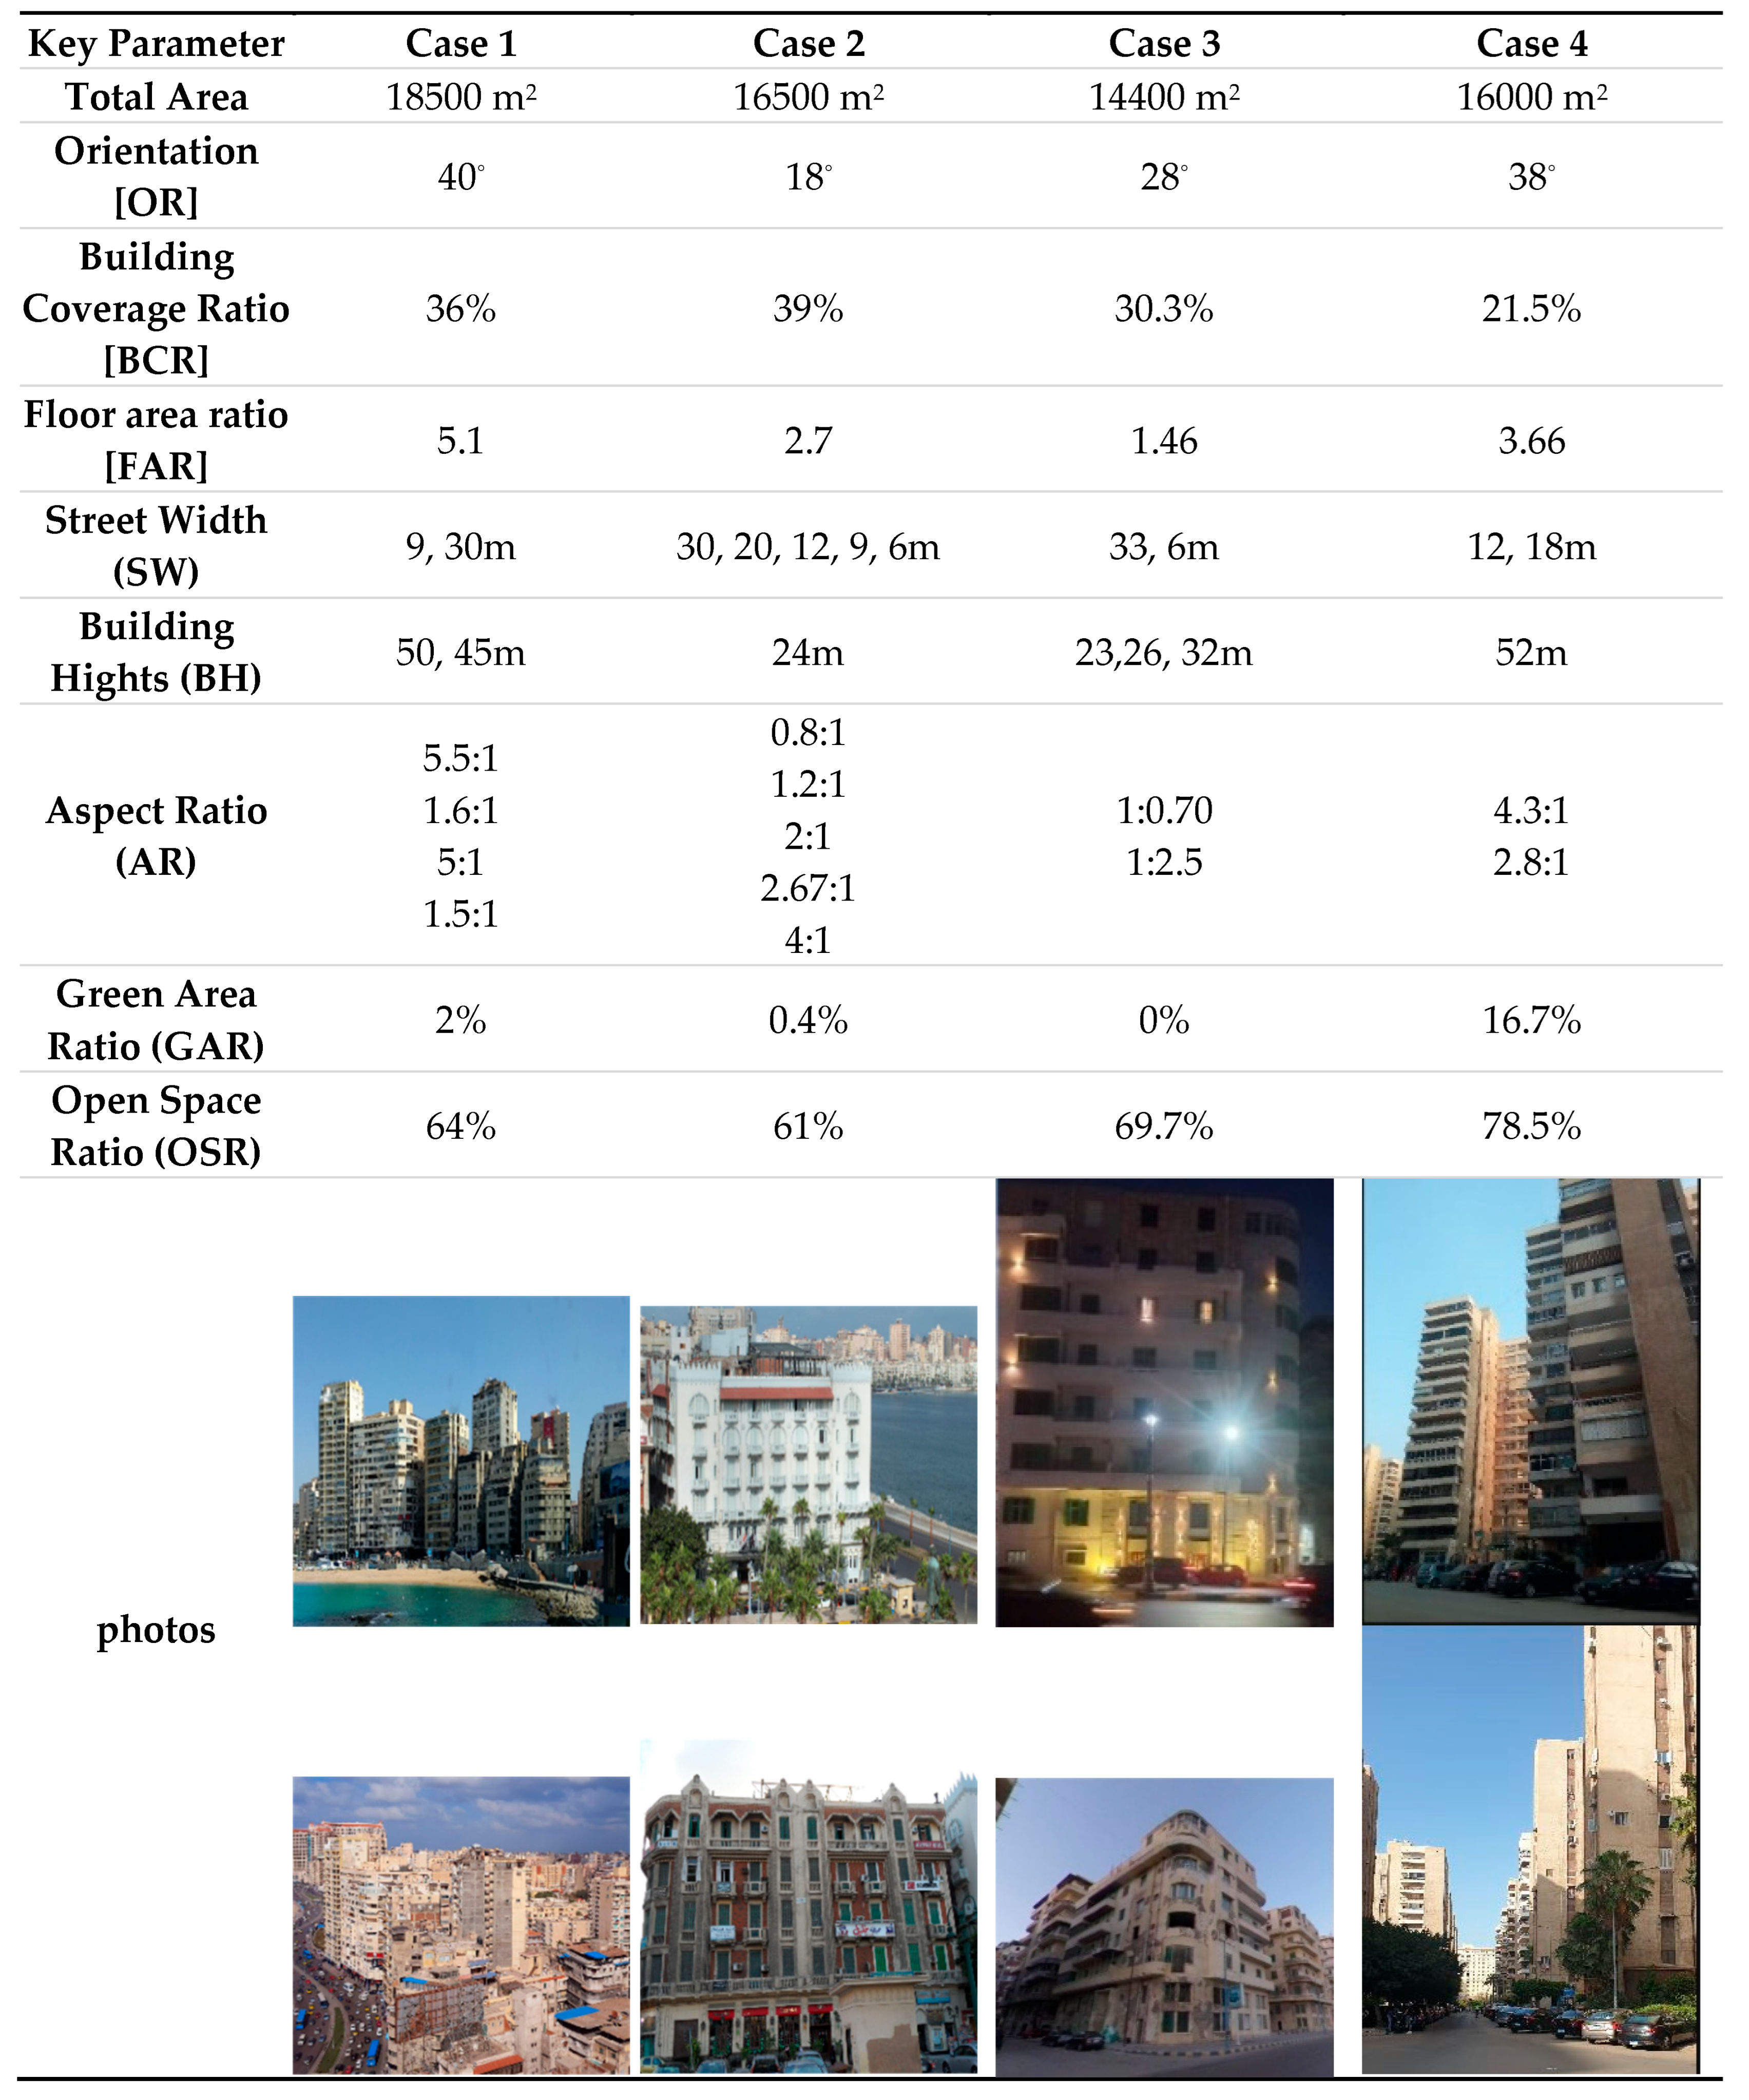 |
Table 11.
Climatic Setting used in this study.
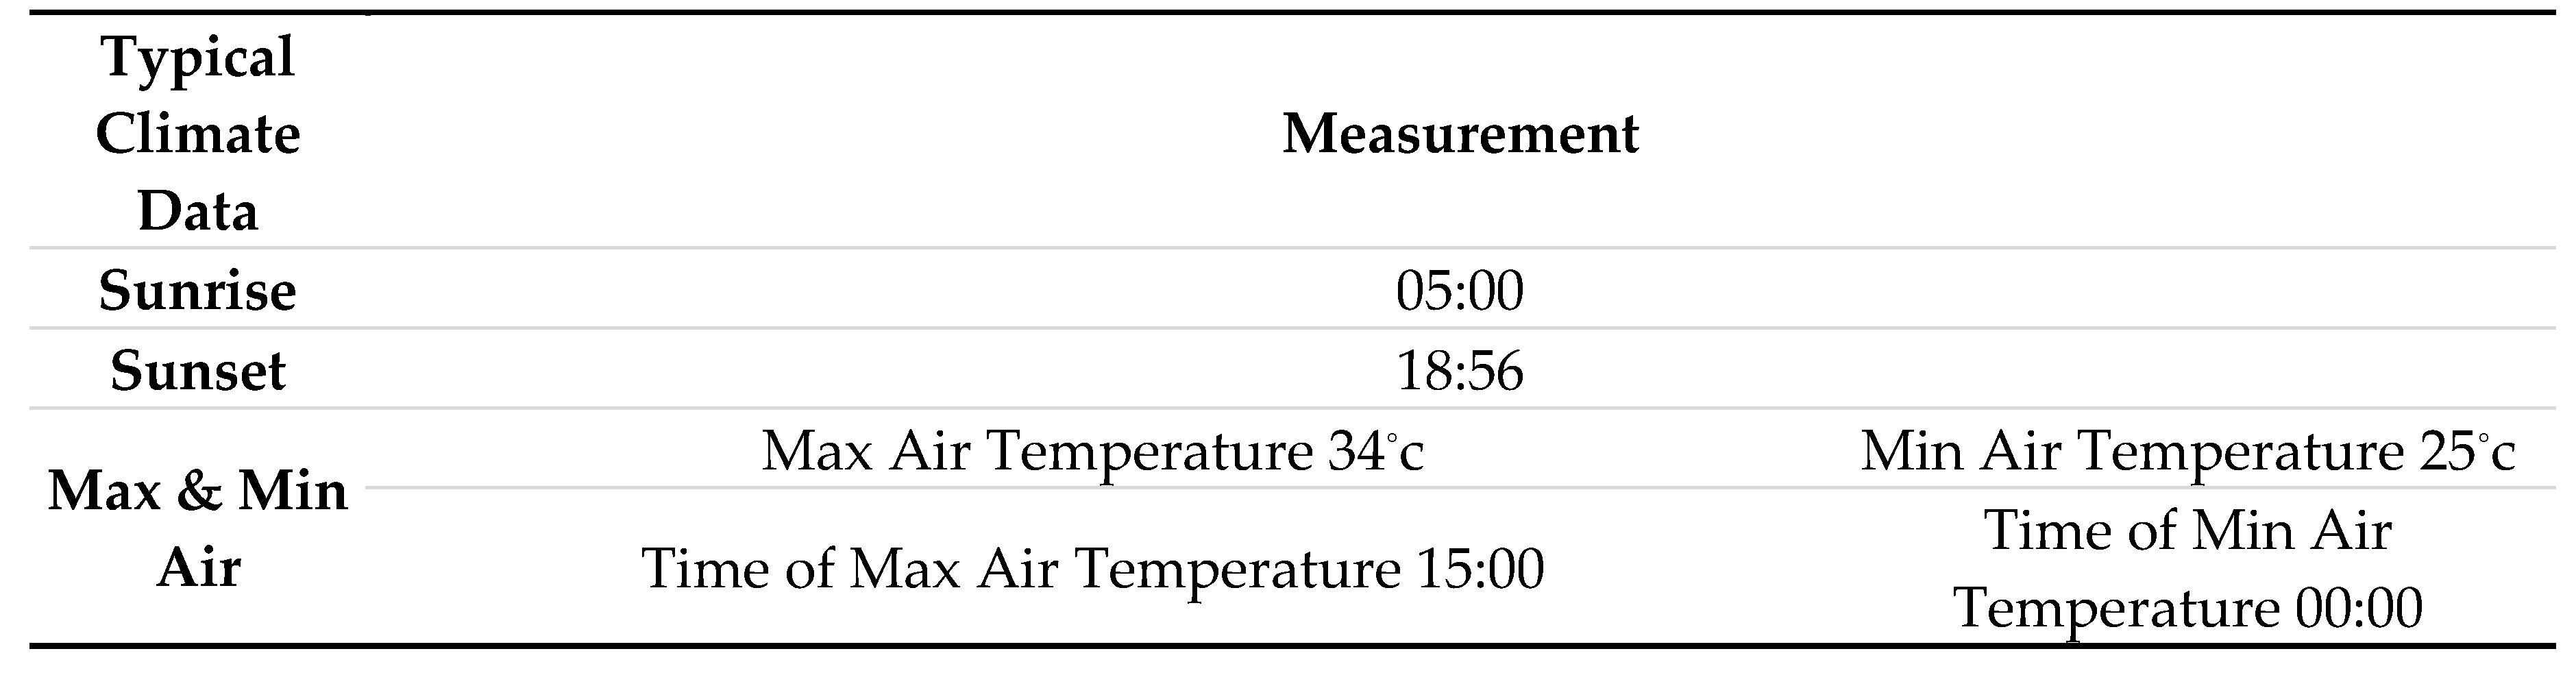 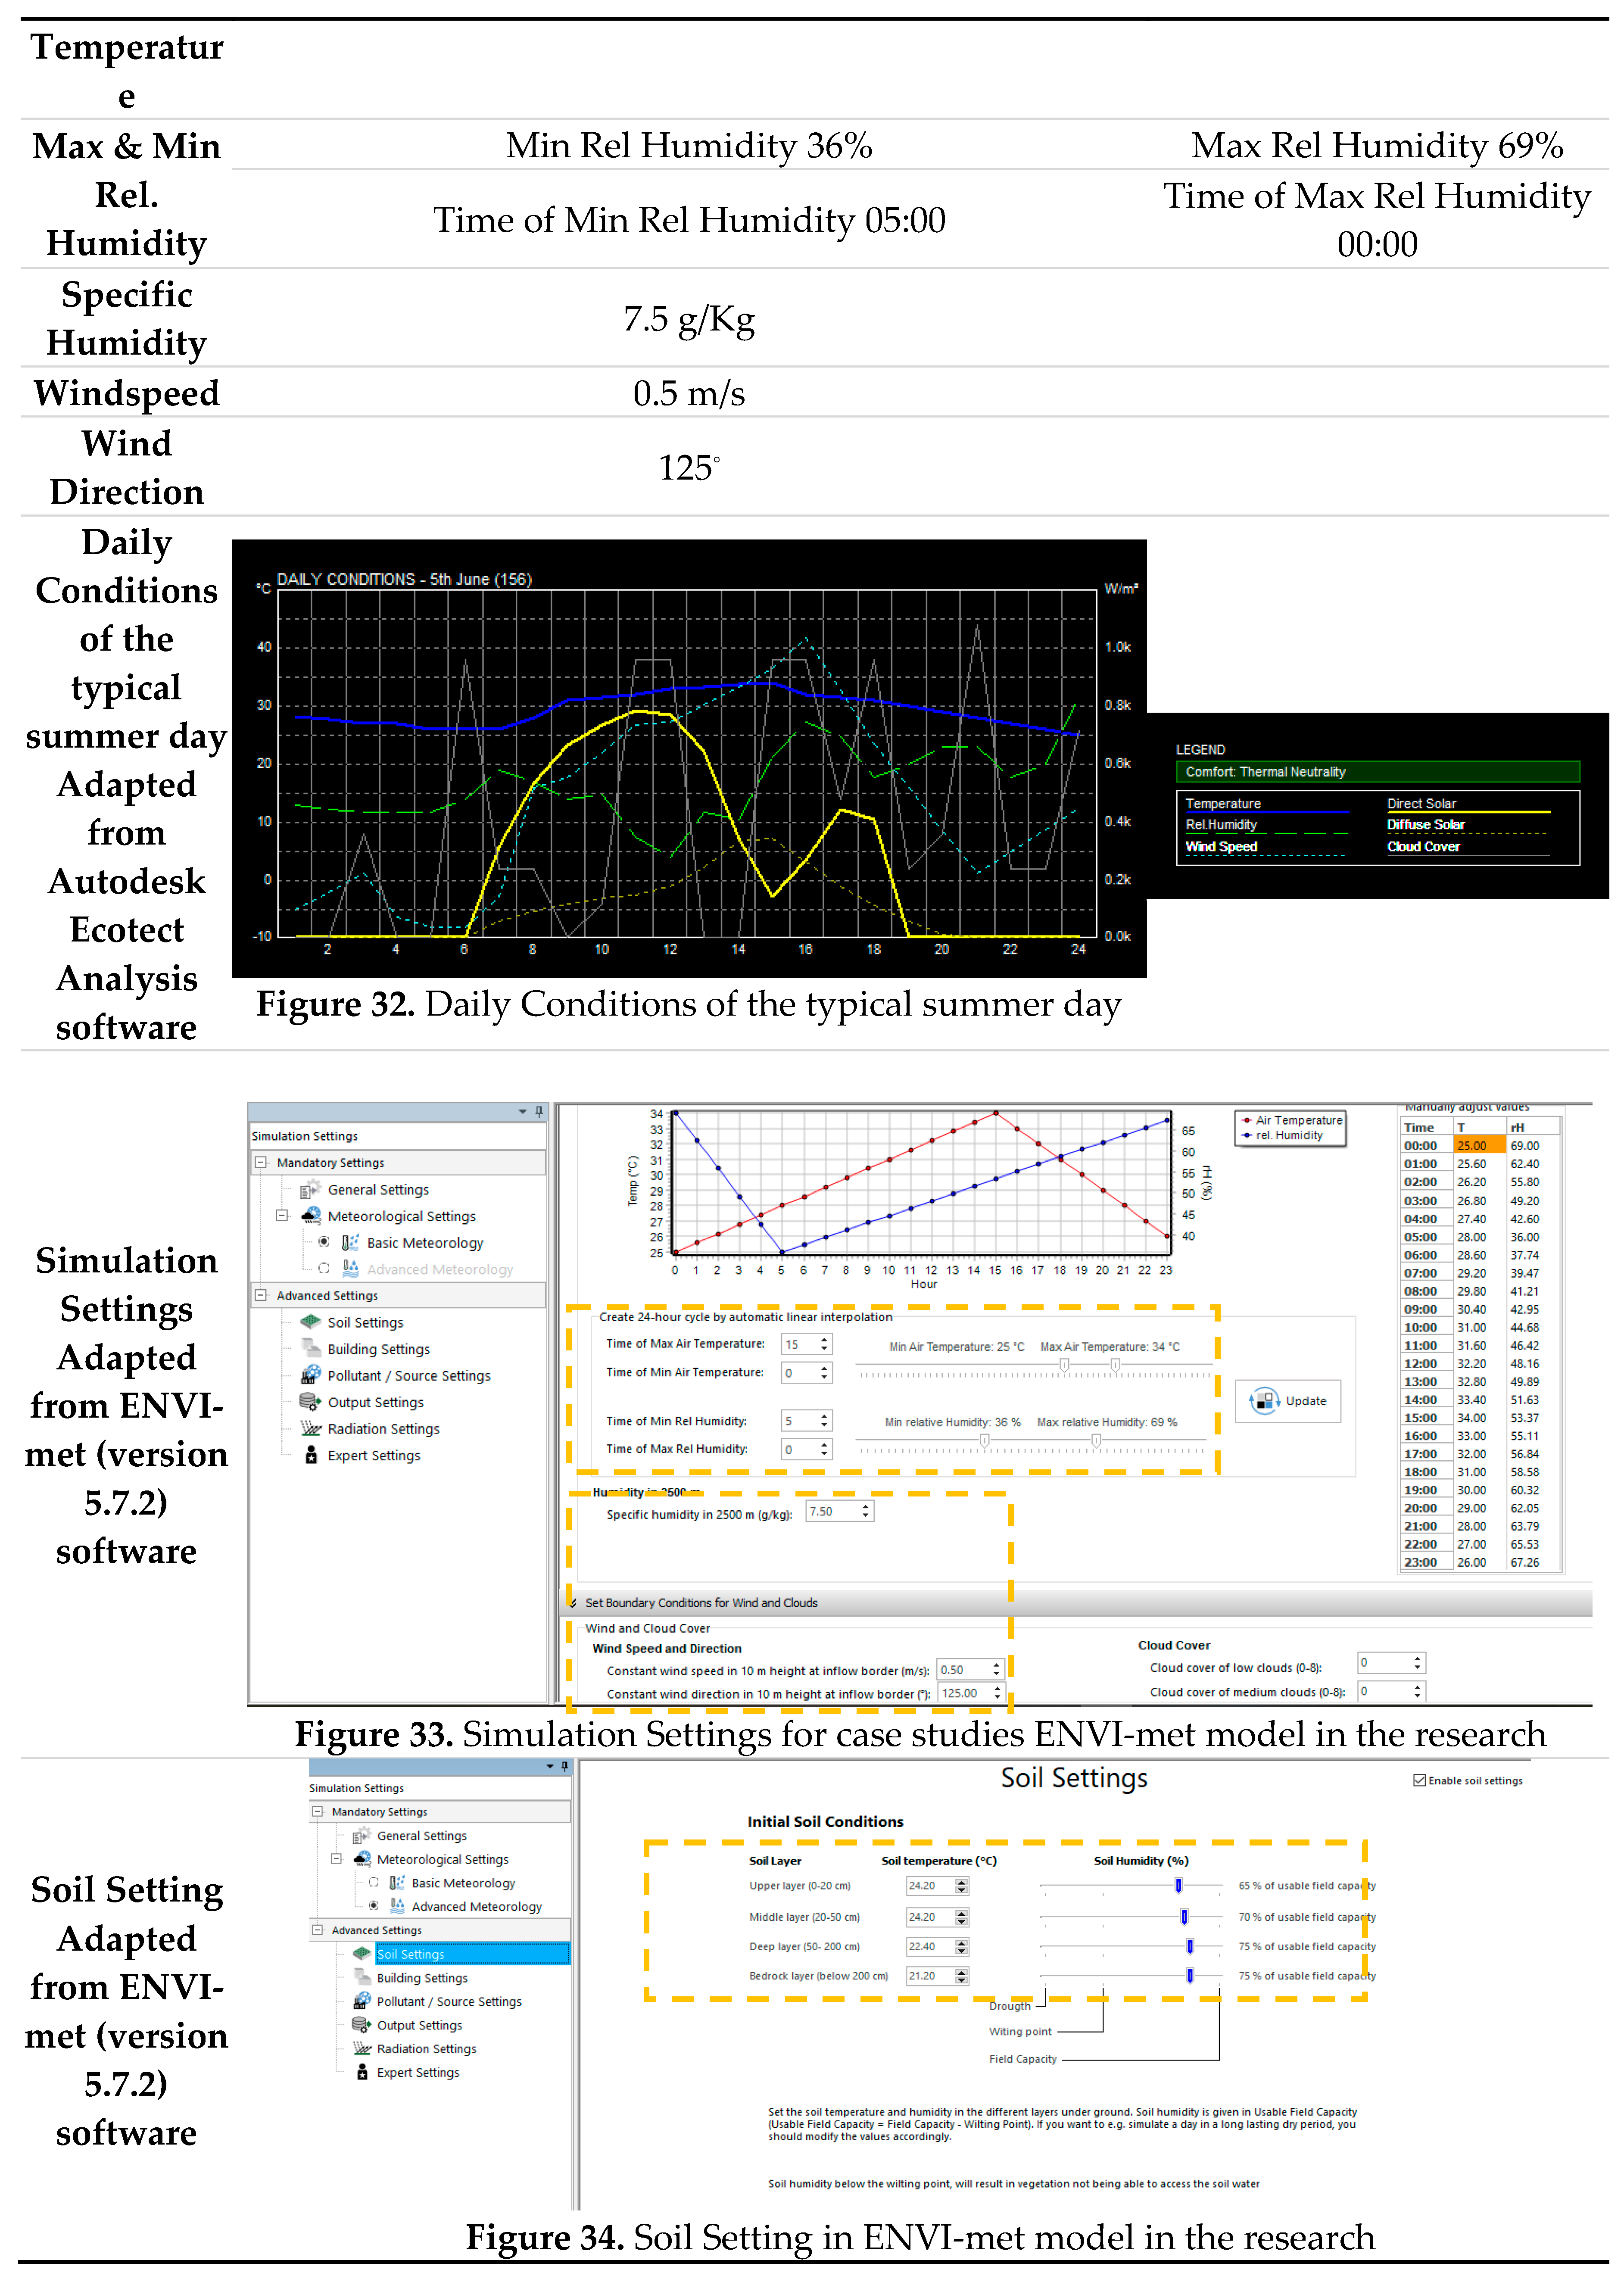
|
Disclaimer/Publisher’s Note: The statements, opinions and data contained in all publications are solely those of the individual author(s) and contributor(s) and not of MDPI and/or the editor(s). MDPI and/or the editor(s) disclaim responsibility for any injury to people or property resulting from any ideas, methods, instructions or products referred to in the content. |
© 2025 by the authors. Licensee MDPI, Basel, Switzerland. This article is an open access article distributed under the terms and conditions of the Creative Commons Attribution (CC BY) license (http://creativecommons.org/licenses/by/4.0/).
Copyright: This open access article is published under a Creative Commons CC BY 4.0 license, which permit the free download, distribution, and reuse, provided that the author and preprint are cited in any reuse.


