
Submitted:
07 June 2025
Posted:
09 June 2025
You are already at the latest version
Abstract
Urban green spaces (UGS) serve as critical mitigators of urban heat islands (UHIs), yet the scale-dependent mechanisms through which UGS morphology regulates thermal effects remain insufficiently understood. This study investigates the multi-scale relationships between UGS spatial patterns and cooling effects in Macao, employing morphological spatial pattern analysis (MSPA) to characterize UGS configurations and geographically weighted regression (GWR) to examine regional-scale thermal interactions, comple-mented by patch-scale buffer analyses of area-perimeter-landscape shape index effects. Results demonstrate that core UGS areas significantly enhance cooling capacity (core area proportion of ≥35% regions showing optimal performance), while fragmented elements (branches, edges) exacerbate UHIs, with patch-scale analyses revealing nonlinear threshold effects in cooling efficiency. A tripartite classification of UGS by cooling ca-pacity identifies strong mitigation types with optimal shape metrics and cooling ex-tents.The findings establish a tripartite UGS classification system based on cooling per-formance and identify optimal morphological parameters, advancing understanding of thermal regulation mechanisms in urban environments. This research provides empirical evidence for UGS planning strategies prioritizing core area conservation, morphological optimization, and seasonal adaptation to improve urban climate resilience, offering practical insights for sustainable development in high-density coastal cities.
Keywords:
urban green space
; MSPA
; LST
; geographically weighted regression
1. Introduction
Urban heat island (UHI) intensification has emerged as one of the most pressing environmental challenges faced by contemporary cities under the backdrop of global climate change [1]. The elevated urban temperatures caused by UHI have been linked to adverse impacts on human health, air quality degradation, and vegetation stress, particularly in densely built environments [2]. Urban green spaces (UGS), comprising both artificial and natural greening (e.g., parks, street trees, forest), play a vital role in regulating the microclimate through evapotranspiration, shading, and photosynthesis, thereby offering natural cooling benefits [3,4,5].
The spatial configuration of UGS has been increasingly recognized as a determinant of its ecological and thermal performance [5,6]. Numerous studies have shown that green space characteristics such as area, shape, connectivity, and spatial distribution significantly influence cooling effects [4,7]. Larger, aggregated, patchy and complex-shaped patches tend to be effective in cooling, while no consensus was reached based on patch-level metrics [8].
Although landscape metrics are widely used to quantify the configuration and composition of UGS, these indices fall short in visualizing spatial morphology and ecological connectivity, especially in complex urban contexts [9,10,11]. Furthermore, with ongoing urbanization, UGS is becoming increasingly fragmented and spatially isolated, leading to reduced cooling potential, particularly at broader spatial scales [6,12,13]. Most studies have focused on high-temperature zones, despite the fact that UHI intensity varies dynamically and that low-intensity areas may evolve into or merge with higher-intensity zones over time [5]. Therefore, while landscape metrics can derive morphological indicators of UGS patches for cooling effect analysis, they provide limited insight into spatial relationships between patches and their cumulative effects on urban thermal environments. This limits their utility for formulating systematic ecological planning strategies to mitigate UHI at the city scale.
Compared to landscape metrics, Morphological Spatial Pattern Analysis (MSPA) offers a more informative alternative, as it not only quantifies the size and shape of patches but also visualizes their spatial layout [14]. As a pixel-based image analysis technique, MSPA identifies explicit landscape elements (e.g., core zones, branches, bridges) using mathematical morphology operations [15], enabling a refined classification of UGS components that are both ecologically functional and spatially coherent [16,17]. Its application across multiple spatial scales, ranging from block-level to regional contexts, has been demonstrated in prior studies [18]. MSPA has also been widely applied in the construction of ecological and thermal networks, helping to extract ecological sources [17] or delineate “cold islands” and “heat islands” in urban settings [6,9,19,20,21,22,23]. Such research illustrates the potential of MSPA-based network perspectives to identify spatial morphologies that enhance or weaken UHI mitigation. Studies recognized that core zones, large, cohesive green patches, deliver the most substantial cooling effects, whereas fragmented units such as branches or islets often lack sufficient ecological function [21,24,25]. However, these approaches often stop short of specifying patch-level design parameters, such as area, shape, or fragmentation, that are necessary to guide practical interventions.
Additionally, a systematic understanding of how different UGS configurations, particularly core zones, contribute to UHI mitigation across seasons remains underdeveloped. Prior studies have shown that seasonal variations in solar radiation, hydrothermal conditions, and vegetation phenology significantly affect the relationship between surface temperature and UGS characteristics [26,27].
Previous research has predominantly focused on either local patch-scale or broader city-wide analyses, rarely integrating both levels. This overlooks potential scale-dependent effects and cross-scale interactions between regional UGS morphology and localized cooling performance. Overall, there are two key knowledge gaps regarding the relationship between UGS morphology and LST: First, there is a lack of research examining how different configurations of UGS, especially core zones, perform in mitigating UHI across distinct seasonal conditions. Second, few studies have jointly analyzed UGS–LST relationships at both city-wide and patch levels, despite the inherent scale sensitivity of thermal processes.
Understanding the thermal dynamics of UGS under varying spatial configurations and seasonal contexts is essential for climate-resilient planning, particularly in compact, high-density cities vulnerable to extreme heat. To address these gaps, this study proposes a dual-scale analytical framework to assess the cooling effects of UGS in Macau, a subtropical island city characterized by intensive development and limited ecological space. Specifically, this study aims to: (1) Investigate the seasonal relationship between distinct MSPA-derived green space components and land surface temperature (LST) at the city scale; (2) Analyze how UGS patch morphology (area, perimeter, and shape) affects cooling performance at the patch level; and (3) Identify and classify UGS patches based on their observed summer cooling performance and extract the key morphological traits associated with high- or low-performing patches. By integrating city-scale spatial decomposition with localized patch-level evaluation, this research contributes to a systematic understanding of UGS cooling dynamics and provides actionable insights for optimizing green infrastructure in subtropical high-density urban environments.
2. Materials and Methods
2.1. Study Area
Macau is a coastal city located at the land–sea interface on the western shore of the Pearl River Estuary, bordering mainland China and facing the South China Sea (Figure 1). As one of the most densely populated urban areas globally, Macau is characterized by a compact urban form, intensive land use, and limited green spaces [28,29], making it a typical high-density Asian cities exposing to extreme heat risk [30]. The city experiences a humid subtropical monsoon climate (Cwa) under the Köppen classification, with pronounced thermal and hydrological seasonality due to strong monsoonal influences. Summers (May–September) are hot, humid, and characterized by frequent rainfall, while winters (December–March) are mild, dry, and generally sunny. This sharp seasonal contrast provides a natural experimental setting for investigating urban heat island dynamics across different climate conditions.
2.2. Data
Land surface temperature (LST) data were derived from Landsat 8 OLI_TIRS imagery with a spatial resolution of 30 meters, acquired on March 11 and September 3, 2022, representing typical spring and summer climatic conditions in Macao, respectively. These two periods were selected to capture seasonal variations in vegetation status and solar radiation, which significantly influence UGS cooling performance. According to the Macao Meteorological and Geophysical Bureau, the city features a warm subtropical climate with short transitional spring and autumn, while summer is typically hot and humid. These periods capture key seasonal contrasts in temperature and vegetation, offering meaningful insights into UGS cooling dynamics. The imagery was sourced from the U.S. Geological Survey (USGS) (https://landsatlook.usgs.gov/), specifically from Landsat Collection 2 Level-2 (LC2L2) products. These products provide surface temperature data retrieved from thermal infrared bands and have been pre-processed with radiometric calibration and atmospheric correction, enabling direct calculation of LST values [31]. As the temperature data are distributed in 16-bit integer format, spectral digital numbers were converted to Kelvin using scale factors and subsequently transformed to Celsius by subtracting 273.15. The selected images were cloud-free, with clear land surface features and high data quality for both dates.
Land use/land cover (LULC) data were obtained from Gaofen-1 imagery with a spatial resolution of 2 meters, captured on September 5, 2022. LULC classification was performed on the ENVI 5.6 platform, using a combination of supervised classification, visual interpretation, and field validation. The classification employed image-based analysis of spectral and spatial characteristics, resulting in seven LULC categories: arbor forest, shrubland, grassland, built-up areas, water bodies, roads, and bare soil. The accuracy of final output was assessed using the Kappa coefficient, which yielded a value of 0.94, indicating high reliability.
UGS patches were extracted manually based on the green facilities published by the Macau Nature (https://nature.iam.gov.mo/e/). Patches were screened based on three criteria: (1) an area larger than 900 m² (30 m × 30 m) to ensure detectability in Landsat-derived LST imagery [32]; (2) dominance of tree, shrub, or grassland vegetation types, as water can generate great impact on cooling performance and cause incorrect estimation [32,33]; and (3) clear and continuous spatial boundaries.
2.3. Methods
This study adopted a dual-scale analytical framework to investigate the relationship between UGS morphology and cooling effects. First, UGS morphological types were extracted citywide using MSPA, based on reclassified land use data. At the city scale, a grid-based approach was implemented to ensure spatial consistency, where LST values and the proportions of MSPA components were calculated for each grid. At the patch scale, geometric attributes of 32 representative UGS patches were quantified. Buffer analysis was then applied to derive four cooling effect indexes from LST data. Finally, statistical methods including Pearson correlation, Geographically Weighted Regression (GWR), and regression analyses were employed to assess the relationships between UGS morphology and LST patterns at both city and patch scales.
2.3.1. Identify UGS Morphology
MSPA was used to quantify UGS spatial morphology at the city scale. The land use map was first converted into a binary raster map using a reclassification tool in ArcGIS to distinguish the UGS (foreground) and another land type (background). Specifically, arbor forest, shrubland, and grassland were defined as foreground and assigned a value of 2, while others were assigned 1. MSPA was conducted using GuidosToolbox (version 3.0), which applies mathematical morphology operations including erosion, dilation, opening, and closing to binary raster data [17]. In this process, the grid pixel size and the edge width was set to 30m×30m and 1 respectively, corresponding to LST spatial resolution. The eight-neighborhood rule was applied. Finally, the foreground was subdivided into seven categories (Figure 2), corresponding to different ecological landscapes (Table 1). Among them, core patches are continuous interior regions with higher ecological integrity, while edge and branch zones indicate fragmentation and potential exposure to thermal stress. These morphological components would be used as independent variables to analyze their association with LST.
Three metrics, area (A), perimeter (P), and the Landscape Shape Index (LSI), were used to measures UGS geometric morphology at the patch scale. These metrics were calculated based on the spatial boundaries of 32 green space patches in ArcGIS. A and P are basic yet fundamental indicators of patch size and edge complexity, commonly employed in landscape ecology, while LSI serves as a proxy for shape complexity with higher value indicating more irregular or fragmented shape [34].
2.3.2. Quantify UGS Cooling Effects
Fishnet analysis was applied at the city scale to obtain spatially consistent LST values and UGS morphology features. After testing multiple grid sizes (300 m to 900 m), a resolution of 600 × 600 m was selected as optimal for capturing thermal variability and landscape heterogeneity at the Macau scale. The study area was thus divided into 157 uniform grid cells, within which the proportion of each MSPA component (e.g., core, edge, branch) and the mean LST for two seasons (spring and summer) were calculated. This approach ensured spatial comparability and enabled localized assessment of UGS morphology–temperature relationships.
Multi-ring buffer analysis was employed at patch scale to extract cooling performance indicators of UGS. For each of the 32 selected green space patches, ten concentric buffers were created at 30-meter intervals, consistent with the resolution of Landsat-derived LST data. Four metrics were computed to characterize the thermal response of each green patch:
- (1)
- Average temperature within UGSs (AT): Defined as the mean temperature within each UGS, directly reflecting the thermal condition.
- (2)
- Immediate Cooling Magnitude (IC): Defined as the temperature difference between the green patch and its immediate surrounding buffer zone. This metric reflects the relative cooling intensity of the green space by comparing mean LST within the patch to the surrounding zone. This metric was developed to adapt to the highly compact and heterogeneous landscape environment of Macao and can accurately characterize the local cooling intensity of UGS.
- (3)
- Maximum Cooling Intensity (MC): Defined as the maximum temperature difference observed between any buffer zone and the patch interior. This metric captures the peak cooling capacity of the UGS, representing its strongest temperature gradient. This metrics is commonly used in patch-based UGS cooling effects analysis, especially for parks [35,36,37].
- (4)
- Cooling Distance (CD): Refers to the farthest buffer ring at which the LST difference between the green patch and its surroundings remains detectable. This indicates the spatial extent of the green space’s cooling effect. It is obtained through visual interpretation method, as this method is the most accurate, reliable and direction-sensitive recommended by recent research [38].
2.3.3. Analyze UGS–LST Relationships
At the city scale, after excluding grid cells with a core UGS proportion of less than 5% to ensure ecological relevance, the analysis was conducted based on 85 uniform grid cells. Pearson correlation analysis was used to assess the linear relationships between the proportions of each MSPA landscape component (core, edge, bridge, branch, loop, perforation, islet) and mean LST values during spring and summer. To further explore how UGS configuration modulates these relationships, the 85 grid cells were stratified into three equal-interval groups based on core green space proportion. Correlation analyses were then repeated within each group. Subsequently, to capture the spatial heterogeneity of UGS–LST interactions, Geographically Weighted Regression (GWR) was employed for variables that showed statistically significant correlations in the last step of the Pearson analysis. GWR allows for localized regression coefficients, thereby revealing spatially varying relationships between MSPA metrics and LST patterns.
At the patch scale, regression analyses were conducted to examine the relationships between geometric metrics (A, P, and LSI) and four cooling effect indexes (AT, IC, MC, and CD). Linear and logarithmic regression were tested to determine the model yielding the best fit. Based on the principle of diminishing marginal utility, the threshold value of efficiency (TVoE) was defined as the most cost-effective patch area, beyond which increases in area no longer produce substantial gains in cooling intensity [7]. In this study, TVoE was calculated as the point at which the slope of the logarithmic regression between area and MC equals 1, following the approach of previous studies [39,40]. Subsequently, the 32 UGS patches were grouped into three clusters based on their cooling performance, and descriptive statistics were used to characterize the morphological features of each cluster.
3. Results
3.1. Classification of Green Space Morphology and Surface Temperature Distribution Characteristics
Analyzing the land use distribution in Macau (Figure 3a) shows that the green spaces in the study area (including trees, shrubs, and grasslands) account for 35.51%. These green spaces are primarily located in the southern region, where they are more concentrated and cover larger areas. In contrast, the green spaces in the northern part are more scattered and cover smaller areas. Comparing the three types of land use, it is clear that the proportions are grasslands (14.6%) > arbor forests (13.03%) > shrublands (7.88%), indicating that grasslands are predominant in Macau's urban development, while arbor forests are more widely distributed in natural green spaces.
Analyzing the overall thermal environment distribution in Macau, including surface temperature and thermal field distribution (Figure 3b-3c), reveals that in spring, high-temperature areas are mainly concentrated in the central part of Taipa. The proportion of sub-high-temperature and sub-low-temperature areas is relatively high, while the high-temperature and low-temperature zones are relatively small. In summer, the proportion of high-temperature areas is larger, appearing in extensive clusters in the southern region and concentrated in the central area, with temperatures spreading outward from the center. On the northern main island, high-temperature areas are scattered and small, but compared to spring, the area of high-temperature zones has significantly increased. Low-temperature areas are mainly concentrated in the southern mountainous regions and northern water bodies, occupying a large proportion, while sub-low-temperature and sub-high-temperature areas occupy a smaller proportion. The proportion of medium-temperature areas has significantly increased. Comparing the land use types in Macau, their spatial distribution generally aligns with urban planning directions, indicating that urban development activities and socio-economic factors play an important regulatory role in LST.
Analyzing the MSPA structure of the study area (Figure 2b) reveals that the spatial distribution of UGS exhibits the characteristic of "large areas with many scattered points," which is somewhat related to the thermal environment. Analyzing the overall scale proportion of the UGS pattern shows that the overall UGS pattern features the size characteristics of core (68.47%) > edge (20.71%) > branch (3.56%) > perforation (2.49%) > islet (2.33%) > bridge (1.69%) > loop (0.75%). Based on the ecological implications of various MSPA indicators, in the Macau region, the core areas are relatively concentrated, with a higher number of large green patches (such as core areas dominated by country parks, parks, and mountains). The proportions of loop and bridge areas are low, indicating a low degree of connectivity between the core areas and surrounding natural patches. Additionally, the relatively high proportions of branch, perforation, and islet areas indicate poor integrity of green patches, presenting a fragmented form.
3.2. The Impact of Different Elements in the Region on Urban Heat Islands.
The average temperature on the study day was analyzed for its correlation with the overall proportion of seven MSPA elements, resulting in 157 research units. After excluding areas within the units with less than 5% green space, 85 research units and two seasonal temperature maps were obtained. A correlation analysis was conducted between the average temperature within the research units and the proportion of each MSPA element, revealing their correlations and changes in strength (Table 2).
In spring, only the proportion of the core area has a certain mitigating effect on urban heat islands. The overall average temperature of the 85 research units and the proportion of the core area show a significant negative correlation at the 0.01 level, while the proportions of the isolated area, edge area, bridge area, and branch area show a significant positive correlation at the 0.01 level. However, the correlation analysis between the proportion of the perforated area, loop area, and average temperature (T) indicates no significance at the 0.01 and 0.05 levels, with P-values close to 0. Therefore, it can be considered that changes in these two MSPA indicators do not affect the average temperature (T) in spring The strength of the correlation between spring MSPA indicators and T is expressed as branch > bridge > core > islet > edge > perforation > loop.
In summer, the UGS core area plays a better role in mitigating urban heat islands. The overall average temperature of the selected 85 research units and the proportion of the core area show a significant negative correlation at the 0.01 level, while the proportions of the branch area, isolated area, and edge area show a significant positive correlation at the 0.01 level. However, the correlation analysis between the proportions of the perforated area, loop area, and bridge area with the average temperature shows no significance at the 0.01 and 0.05 levels. Therefore, it can be considered that changes in these three MSPA indicators do not affect the average temperature. The correlation strength between summer MSPA indicators and average temperature is ranked as core > branch > bridge > islet > edge > loop.> perforation

Table 2.
Correlation between the proportion of each MSPA indicator and average temperature across different seasons (Pearson coefficient).
Table 2.
Correlation between the proportion of each MSPA indicator and average temperature across different seasons (Pearson coefficient).
| MSPA account | T (Spring) | T(Summer) |
|---|---|---|
| Core | -0.340** | -0.537** |
| Islet | 0.303** | 0.352** |
| Loop | 0.006 | -0.111 |
| Bridge | 0.342** | 0.388** |
| Perforation | 0.068 | 0.077 |
| Edge | 0.248** | 0.203 |
| Branch | 0.425** | 0.505** |
1 Note: *p<0.05; **p<0.01.
Different spatial forms of the same type of MSPA elements alleviate urban heat islands to varying degrees. The study combined with the results of Table 1 and the characteristics of uniform data distribution. Following the principle of equal division to reduce error, based on the proportion of the core area with the strongest heat mitigation capability, the 85 study units are divided into three types: Type I, with a core area proportion of ≥35%, totaling 28 units; Type II, with a core area proportion between 12%-35%, totaling 29 units; and Type III, with a core area proportion of ≤12%, totaling 28 units.
Table 2.
Correlation between MSPA indicators with varying core area proportions and T (Pearson coefficient)
Table 2.
Correlation between MSPA indicators with varying core area proportions and T (Pearson coefficient)
| MSPA account | T | ||||||||
| Type I (≤12%) | Type II (12%<35%) | Type III (>35%) | |||||||
| Spring | Summer | Spring | Summer | Spring | Summer | ||||
| Core | -0.020 | -0.181 | -0.463* | -0.429* | -0.120 | -0.491** | |||
| Islet | 0.391* | 0.472* | 0.255 | 0.296 | -0.025 | 0.145 | |||
| Loop | 0.158 | 0.150 | -0.188 | -0.135 | 0.404* | 0.256 | |||
| Bridge | 0.594** | 0.552** | 0.280 | 0.263 | 0.180 | 0.485** | |||
| Perforation | -0.072 | 0.085 | 0.030 | 0.047 | 0.216 | 0.188 | |||
| Edge | 0.445* | 0.210 | 0.069 | 0.018 | 0.177 | 0.251 | |||
| Branch | 0.513** | 0.481** | 0.384* | 0.484** | 0.242 | 0.423* | |||
1 Note: *p<0.05; **p<0.01.
Based on Pearson correlation coefficient analysis, significant MSPA indicators are further extracted and input into ArcGIS 10.8 for geographically weighted regression (GWR), mapping the significant indicators onto spatial locations.
3.2.1. Type I (Core Area Proportion ≥ 35%):
In Type I research areas, the impact of MSPA elements on the urban heat island effect during summer is more pronounced. In the summer Type I research units, the proportion of core areas in UGS spatial patterns shows a significant negative correlation with T at the 0.01 level. The proportion of edge areas shows a significant positive correlation with T at the 0.01 level, and the proportion of branch areas shows a significant positive correlation with T at the 0.05 level, with no correlation to other MSPA indicators. In spring only the proportion of perforated areas shows a significant positive correlation with T at the 0.05 level, with no significant correlation to other MSPA indicators (Table 2). Analyzing the correlation results across the two seasons reveals that in areas with a larger proportion of core areas, when summer temperatures are generally higher, more complex UGS types have a more significant impact on surface temperature.
Further application of ArcGIS 10.8 to conduct GWR model regression analysis verifies how various MSPA elements significantly affect surface temperature. In Type I areas, there are more MSPA indicators significantly correlated with T during summer, and the significance is stronger. To enhance the accuracy of spatial regression analysis, this study selects three indicators for the geographically weighted regression analysis (GWR) model with T: the proportion of core areas, which has a negative correlation, and the proportions of edge and branch areas, which have positive correlations.
In Type I areas (Core Area Proportion ≥ 35%), the GWR model fit (R2) for significant MSPA elements—core, branch, and edge areas—with T is relatively good (Table 3), indicating that the GWR model results are relatively accurate, and the impact of MSPA elements on T is more significant in this type.
Relatively complete green spaces can effectively mitigate urban heat islands. Observing the relationship and distribution of the scale of core areas, edge areas, and branch areas on the thermal environment as shown by the GWR model (Figure 4): If the area of the core area is proportionally increased in the southeastern coastal region and the central mountainous and grassland areas of Type I, the cooling effect near the southeast is more significant compared to the central area. The proportion of edge areas and branch areas is positively correlated with urban heat islands, with the correlation intensity of edge areas decreasing from northwest to southeast toward the center. Therefore, in the study area of Type I, increasing the scale of the core area while reducing the branch area in the southeast and the proportion of the edge area on the west side of the center will be beneficial for overall cooling. In Type I, most land types are forest land, with the southern forest land being larger and more contiguous compared to the northern built-up area, and the cooling effect of the core area in the south is better than that of the northern built-up area. In summary, in regions with larger forest land scales, the integrity of forest land has a significant impact on mitigating urban heat islands.
3.2.2. Type II (Core Area Proportion 12%<35%):
Complex land use types have a certain heat mitigation effect on MSPA elements. Within Type II, there are complex land use types, and the overall proportion of UGS is relatively low. The core area proportion in this region ranges from 12% to 35%, with a total of 29 research units identified. In this area, the correlation analysis between the proportion of MSPA elements and surface temperature T (Table 2) shows that in both spring and summer, the core area proportion has a significant negative correlation with urban heat islands at the 0.05 level. In spring, the proportion of branch areas is significantly correlated with T at the 0.05 level, whereas in summer, the proportion of branch areas shows a significant correlation with T at the 0.01 level. Comparing the correlation results of the two seasons with the land use types within Type II, it is evident that the land use types within Type II are more complex, with a larger scale of construction land. The heat mitigation capability of MSPA elements has certain limitations, but heat mitigation can also be achieved by adjusting some indicators.
Based on the analysis results in Table 2, further GWR model regression analysis was conducted to verify the relationship between the proportion of branch areas and T in summer (Figure 4). The results indicate that in the Type II region, the areas with a significant positive correlation between the proportion of branch areas and urban heat islands are concentrated on both sides of the southern part of the southern island near the sea, showing an increasing trend from north to south. This suggests that in areas with a certain scale of green space construction, reducing the scale of branch areas can effectively enhance the heat mitigation capability of the region.
3.2.3. Type III (Core Area Proportion ≤12%):
The type of MSPA elements has a negligible effect on mitigating urban heat island effects. This area is primarily located along the boundaries of large core zones and within smaller core zones, featuring extensive urban construction areas where the core zone accounts for less than 12%, significantly less than non-natural ecological elements. In this area, 28 research units were identified. Using SPSS 26 to analyze the correlation between the proportion of edge areas and branch areas in two seasons and T, the results showed that both the proportions of edge areas and branch areas exhibited a significant positive correlation at the 0.01 level, with low correlation with other MSPA elements. This indicates that in regions where core areas are significantly fewer, the scale proportion of various MSPA elements cannot explain the changes in surface temperature across different seasons. However, altering the proportion of edge areas and branch areas can help alleviate the thermal environment throughout the year.
Based on the analysis results, the more significant spring indicators were selected for further GWR model regression analysis in GIS 10.8 to verify the relationship between the proportion of spring edge areas and branch areas and T (Figure 4). The results indicate that in type III areas, the positive correlation strength between edge areas, branch areas, and the thermal environment increases from north to south, and their relationship is strongly influenced by spatial heterogeneity. This suggests that in areas with a lower proportion of green space, the size of edge areas and branch areas has a relatively poor effect on the annual temperature influence.
3.3. The Impact of Green Spaces within Patches on the Thermal Environment.
Using the LULC data obtained in section 3.1 (Figure 3a), a composite discrimination model based on the NDVI index and near-infrared band was established to effectively identify various green spaces from the classification results. Once the green spaces were identified, they were divided and extracted. Following the principle of large samples, 32 green spaces were acquired (Figure 5), ensuring they cover all administrative divisions and various functional green spaces, with an area exceeding 30m x 30m in spatial distribution. A systematic quantitative analysis was conducted on the 32 selected samples using the ArcGIS 10.8 platform.
3.3.1. Correlation between Patch Characteristics and Heat Mitigation
Based on the area, perimeter, and shape characteristics of 32 park shape indices, with a focus on the impact of internal and external thermal environments, a regression analysis was conducted between the three park shape indices and two phases of cooling indicators (including AT, IC, MC, and CD).
The study found that in both seasons, park area exhibited a significant logarithmic relationship with all four sets of cooling indicators (p < 0.01), indicating a nonlinear association between park size and thermal environment indicators (Figure 6). Specifically, there was a negative correlation with average surface temperature, and the cooling efficiency decreased as the area expanded. This phenomenon reveals a scale threshold effect in the thermal regulation efficiency of vegetation, where increasing park area beyond a certain point results in diminishing effects on cooling, suggesting that merely expanding the area is not an effective way to continuously enhance cooling benefits. There was a positive correlation with cooling magnitude, maximum temperature difference, and cooling range, indicating that as park area increases, there is a significant upward trend in cooling magnitude and range, suggesting that parks may expand the spatial range of cooling. Park area was negatively correlated with average surface temperature, meaning that as the area increases, there is a significant downward trend in surface temperature, suggesting that green spaces may lower surface temperature through evapotranspiration. Comparing the curves of summer and spring, it can be observed that the R² in summer is significantly higher than in spring, indicating that park area has a stronger explanatory power on cooling effects in summer, with park area being the primary factor influencing cooling indicators in summer, while other factors might be more influential in spring.
Statistical analysis indicates that park perimeter has a significant logarithmic relationship with cooling indicators (cooling magnitude, maximum temperature difference, and cooling distance) (p < 0.01). This suggests that although the cooling effect improves with the increase in edge length, due to diminishing marginal returns, this improvement will gradually stabilize.The negative logarithmic correlation between perimeter and average temperature further confirms this saturation effect, indicating that although increasing the edge contact area aids in heat exchange, the cooling efficiency significantly decreases once the perimeter exceeds a critical value. Notably, the R² value in summer is significantly higher than in spring, suggesting that the park perimeter has a stronger explanatory power for the cooling effect in summer, while in spring, other factors may have more influence.
The shape of the park has a varied relationship with the cooling effect. Compared to area and perimeter, LSI has a less effective cooling impact. Observing Figure 6c, it is evident that there is no strong correlation in either season, with the r-squared value approaching 0. The data indicates that the scatter distribution between LSI and surface temperature is randomly dispersed, the linear regression slope is nearly zero, and there are no significant seasonal differences.
The results indicate that the metrics of area and perimeter, which describe the shape of the park, are more effective than the LSI in determining the relationship between parks and temperature. They play a stronger role and better represent the relationship between parks and the surrounding and internal temperatures. The closer the area is to 0.48ha, the better the cooling effect of the park. Beyond this threshold, the cooling effect is not significant. Compared to parks with more complex shapes, parks with area and perimeter within this threshold have a more pronounced effect on mitigating the heat island effect.
3.3.2. Analysis of Heat Mitigation Capability of Patches
Based on the analysis in section 3.3.1, the heat mitigation capability of parks is stronger in summer than in spring. Therefore, this section focuses on summer heat mitigation data. Through cluster analysis, after normalizing the average values of cooling effect indicators and patch shape indicators, the green spaces are classified into three categories based on cooling effect: Type A (strong mitigation), Type B (weak mitigation), and Type C (no mitigation). Data for each type of green space are shown in Table 5.
In Type A (strong mitigation), 11 green spaces were selected. Spatially, these parks are mainly distributed in the southern natural mountainous areas and some northern mountains. This type of green space has the lowest overall normalized average temperature (<0.4), the largest cooling range, the highest maximum temperature difference, and the longest cooling distance, indicating the strongest cooling capability. Compared to other types of patches, this type of green space has a significant advantage in area, with a notably larger average size (44.75 ha). This indicates a significant positive correlation between the size of green spaces and their cooling effect (Figure 7).
In Type B, 13 weak mitigation green spaces were selected, mainly distributed in the northern built-up areas. As shown in Figure 7, the normalized average temperature value of this type of green space is between 0.5 and 0.8, indicating a certain degree of cooling. However, its maximum temperature difference is relatively high, and the cooling distance is relatively long, suggesting a certain cooling capability, though not significant. The cooling range is relatively low, between 0.2 and 0.4, indicating that the heat mitigation capability of this type is limited.By comparing land use, it can be observed that this type of green space is mainly distributed within built-up areas and is significantly influenced by surrounding buildings and human activities. Compared to other types of patches, this type of green space has a certain scale, with a larger area and perimeter.
Type C has identified a total of 8 non-mitigating green spaces. By examining the distribution in Figure 5, it can be found that the distribution is relatively scattered and mostly located near Type A. Comparing the normalized shape index and the normalized cooling index (Figure 7), it is evident that the normalized average temperature index of green spaces in this type is generally above 0.5, indicating that it is close to or higher than the surrounding built-up areas, failing to form a significant cooling island effect. The normalized cooling range and maximum temperature difference are both below 0.2, indicating that this type of green space not only fails to effectively alleviate heat environmental pressure but may even lead to local temperature increases due to insufficient vegetation cover and anthropogenic heat emissions. This suggests that the surrounding environment has a more significant impact on temperature, and the green space does not perform its cooling function. The normalized cooling distance exhibits considerable volatility, indicating that its cooling capability is unstable, likely influenced by the density of surrounding buildings, surface materials, and the internal structure of the green space. Its area and perimeter are the smallest, with some sample indices approaching 0, indicating that its spatial scale is extremely small. This fragmentation and miniaturization characteristic prevent it from forming an effective cooling core area.
Research shows that the cooling effect of green spaces is closely related to their scale and the degree of urbanization of the surrounding area.Larger, naturally-formed green spaces provide superior cooling effects, whereas small, regular artificial green spaces have limited impact in densely built areas.
4. Discussion
4.1. Impacts of Green Space on the Thermal Environment at the Regional Scale
Among the land cover types in cities, green space is often considered one of the most effective factors in mitigating urban heat island regulation [41]. Due to the complexity of land cover, this study classified green spaces into seven MAPS categories and found significant differences in the effect of different green space morphology types on UHI intensity. Only the core in the MSPA classification reflects mitigation of the heat island. Islet, Edge, Bridge and Branch showed significant positive correlation with UHI. This is in contrast to other studies that have found green space Core, Perforation, and Loop to have an impact on UHI in larger, inland cities [11,42]. The findings of the study differ from others may be one of the green space cooling characteristics of high density island cities.
In this study, the core area was found to have the strongest negative correlation with UHI intensity. As the core area of the green space is larger and has an advantage in size, it is the most effective type of green space form to mitigate the UHI effect. Consistent with the understanding of other scholars [43]. It also shows that the heat island mitigation effect exerted by the core area in a high-density island city exhibits consistent findings with other cities.
This study found that other types of green space did not play a significant role in mitigating the urban heat island, and from the results, some types may even exacerbate the urban heat island. This is consistent with the findings of Lin et al. [16] and Hong et al. [44] In fact, it is not so much that these types exacerbate the urban heat island, but rather that the urban heat island is more influenced by other surrounding land cover. Smaller green spaces are generally surrounded by built-up land, such as street trees and low shrubs alongside or in the middle of traffic roads. Impervious paving, such as concrete or asphalt paving, has an extremely high LST and less perimeter shade, creating a more pronounced heat island environment. Therefore, other types of green space in the MSPA do not demonstrate mitigation for UHI. However, fewer studies have found similar conclusions, which may also be one of the differences between high-density island cities and other cities. The unused heat island mitigation effect caused by the scale or land use configuration of high-density urban green spaces should be of concern.
4.2. Cores Exhibits Greater Cooling Capacity in the Summer Months
We found that the effect of green space morphology type on UHI was more significant in the summer, with the cores showing greater cooling capacity in the summer. It is possible that this is due to the seasonal growth differences of plants [45]. The main vegetation type in Macao is subtropical broad-leaved evergreen forest. Plants, especially trees, grow better in summer and provide better transpiration shade. At the same time, heat island intensity is higher during summer months, providing greater potential for UGS to mitigate the heat island effect. Consequently, UGS generates stronger localized cooling effects in summer compared to March, more effectively reducing UHI. In March, plants are not yet fully foliated, and canopy growth remains limited. Additionally, Macao's relatively cool and comfortable climate during this period results in low heat island intensity, preventing the cooling capacity of UGS from being effectively demonstrated [46]. This difference aligns with the seasonal variation in UHI intensity, demonstrating the intrinsic relationship between heat island intensity, green space characteristics, and seasonal climatic conditions. Therefore, seasonal variations in UHI and seasonal differences in plant-based heat mitigation performance should be considered when configuring vegetation in UGS during urban planning.
4.3. Differences in the Share of Cores will Produce Different Heat Island Mitigation Effects
This study found that only the cores among the MSPA elements in the study area has a better mitigating effect on the urban heat island, and the more fragmented green spaces such as Branch, Edge, and Islet instead exacerbate the urban heat island situation. The correlation coefficients for the "core ratio" are significantly higher than those for the other influencing factors [16]. Scaling up to increase its "cooling source" effect could further enhance the overall cooling effect in urban areas [21,46].
This study examines the classification of core area proportions and finds that among the three region types categorized by core area share, there are significant seasonal differences in how UGS patterns affect the thermal environment.
In Type I regions, the heat mitigation capacity can be improved by adding core areas of the same size or by incorporating mountain-based areas into the study region. This suggests that maintaining intact core areas is more effective for urban heat island mitigation in regions where the core area is already relatively large. In Type II, the effect of the MSPA elements on the urban heat island was insignificant in both seasons, with only the summer spur showing a significant positive correlation with temperature. The significant temperature increase exhibited in this typology and the higher built-up land footprint in the study unit suggests that the negative effects of non-ecological land use are stronger when the scale of ecological elements is smaller than the proportion of ecological land use. In Type III, the share of MSPA elements shows a significant positive correlation for both summer and winter on both the edge and feeder metrics, with no significant relationship with the core. Areas with a lower percentage of UGS cores exhibit higher temperatures. In regions with greater built-up land coverage, particularly in high-density cities where building clusters are more concentrated, urban microclimates are more strongly influenced by dense built-up areas, resulting in higher UHI intensity. Similar results and interpretations were reached by Lin et al. [16].
These findings offer valuable insights for investigating the role of MSPA elements in UHI mitigation. Specifically, this research enables planners to prioritize both the structural characteristics and strategic placement of green spaces to maximize their cooling benefits.
4.4. Non-Linear Threshold Effects between Various Metrics and Cooling Efficiency at the Patch Scale
Prevalent research has found that the cooling intensity of parks increases with park size [35]. In this study, the quantitative analysis of the cooling effect of green space area and perimeter found that it has a positive logarithmic relationship with the cooling amplitude, maximum temperature difference and cooling distance, indicating that with the expansion of the green space scale, the cooling benefit per unit area shows marginal decreasing characteristics. This results in separate TVoEs for summer and winter, which are larger in summer than in winter, indicating that the winter UGS achieves optimal cooling when the area is smaller. The cooling efficiency was significantly better in summer than in winter, mainly due to the higher ambient temperatures and solar radiation intensity in summer, which enhanced the transpirational cooling and shading effects of the vegetation. One study, through a review of the literature, found that the average TVoE for subtropical monsoon climate zones was 0.53 ha, and for temperate monsoon climate zones it was 0.43 ha [47]. The average TVoE for the subtropical monsoon climate zone is similar to that derived from this study, which is about 0.48 ha in summer and 0.3 ha in winter. However, one study found that the TVoE for a city park area in a subtropical climate zone was 1.08 ha [40]. The comparatively small urban extent of our study area may partially explain why the TVoE for UGS in this study differs from findings in other contexts. Our results suggest that UGS TVoE exhibits significant spatial variability across cities and climate zones. Beyond climatic factors, the spatial distribution of UGS and the morphological characteristics of the built environment may substantially influence urban ventilation patterns [47,48,49].
This study further reveals a significant negative logarithmic relationship between the mean internal temperature of green spaces and their area or perimeter metrics. While spatial expansion consistently lowers internal temperatures, the cooling efficiency exhibits a decay trend with increasing scale—a pattern aligned with the law of diminishing marginal utility. Additionally, our findings corroborate prior research [50,51] indicating that UGS perimeter optimization contributes measurably to localized temperature reduction. However, we did not find a significant relationship between LSI and maximum temperature difference and cooling distance. This is inconsistent with the conclusions reached by some studies [52,53]. This may be due to the fact that the shape of the Macao UGS sample is not sufficiently different to reflect the significant impact of the LSI as an indicator. Therefore follow-up studies should be conducted to classify UGS with different shapes.
Our findings establish a critical theoretical foundation for identifying the scale-efficiency threshold in UGS planning. When designing urban parks, it is essential to incorporate cooling-performance thresholds, though UGS serves multiple functions beyond UHI mitigation. Specifically, urban green space planning should prioritize area and perimeter optimization, as increasing these dimensions can significantly enhance cooling efficiency. However, diminishing marginal returns must be evaluated to ensure cost-effectiveness and avoid resource overutilization.
4.5. Different Types of UHI Have Different Mitigating Capacities
Our findings demonstrate that expansive, ecologically-oriented UGS, such as country parks or ecological landscape green spaces, constitute the optimal configuration for UHI mitigation. In contrast, small-scale, geometrically regular, and fragmented urban parks exhibit limited cooling efficacy. Notably, under specific conditions characterized by insufficient vegetation cover and elevated anthropogenic heat emissions, these fragmented green spaces may paradoxically function as localized heat sources.
Nevertheless, urban planning necessitates a multi-scalar approach rather than relying solely on a single green space typology. Consequently, complementary landscape pattern metrics—such as the leaf area index (LAI) [54]—should be incorporated to enhance the thermal regulation capacity of UGS. Future research will focus on elucidating the micro-scale landscape features within parks to quantify their nuanced effects on UHI.
5. Conclusions
This study establishes a multi-scale assessment framework to evaluate the thermal effects of urban green spaces (UGS) using multi-source remote sensing data. We demonstrate that core areas significantly mitigate urban heat islands (UHIs), particularly in summer, while fragmented patches (e.g., edges, branches, and isolated greens) may exacerbate warming. Park size and perimeter strongly influence cooling capacity, with larger UGS exhibiting more consistent cooling effects, whereas shape complexity shows negligible impact. Optimizing UGS layout—prioritizing large, contiguous, and structurally compact core patches—can enhance urban resilience. Our findings provide actionable insights for high-density city planning, though higher-resolution thermal data and mechanistic analyses are needed for further refinement. The proposed framework offers a transferable strategy for sustainable urban development in warming climates.
6. Patents
Author Contributions
Jie Liu proposed and developed the research design, data processing, manuscript writing and results interpretation. Chun-Ming Hsieh supervised all the manuscript work and revised the manuscript extensively. Xueying Wu contributed to the framework design, data processing, conclusion content, and manuscript revisions. Liyu Pan contributed to writing the introduction section and research methods, as well as correcting and revising the manuscript.
Funding
This research was funded by the Science and Technology Development Fund (0057/2022/A) of Macau.
Informed Consent Statement
Informed consent was obtained from all subjects involved in the study
Conflicts of Interest
The authors declare no conflicts of interest.
References
- Zhong, Y.; Li, S.; Liang, X.; Guan, Q. Causal Inference of Urban Heat Island Effect and Its Spatial Heterogeneity: A Case Study of Wuhan, China. Sustain. Cities Soc. 2024, 115, 105850. [Google Scholar] [CrossRef]
- Wan, Y.; Du, H.; Yuan, L.; Xu, X.; Tang, H.; Zhang, J. Exploring the Influence of Block Environmental Characteristics on Land Surface Temperature and Its Spatial Heterogeneity for a High-Density City. Sustain. Cities Soc. 2025, 118, 105973. [Google Scholar] [CrossRef]
- Zhang, H.; Kang, M.; Guan, Z.; Zhou, R.; Zhao, A.; Wu, W.; Yang, H. Assessing the Role of Urban Green Infrastructure in Mitigating Summertime Urban Heat Island (UHI) Effect in Metropolitan Shanghai, China. Sustain. Cities Soc. 2024, 112, 105605. [Google Scholar] [CrossRef]
- Li, Z.; Liu, Q.; Yan, K.; Xiong, D.; Xu, P.; Yan, Y.; Lin, L. Cooling Effects of Urban Parks under Various Ecological Factors. Urban Clim. 2024, 58, 102134. [Google Scholar] [CrossRef]
- Zhong, Q.; Li, Z.; Zhu, J.; Yuan, C. Revealing Multiscale and Nonlinear Effects of Urban Green Spaces on Heat Islands in High-Density Cities: Insights from MSPA and Machine Learning. Sustain. Cities Soc. 2025, 120, 106173. [Google Scholar] [CrossRef]
- Pan, L.; Gan, W.; Chen, J.; Xian, X. Ecological Planning for Mitigating Urban Heat Based on Thermal NetworkSimulation: A Case Study of Guangzhou-Foshan Metropolitan Area. J. Chin. Urban For. 2024, 22, 10–19. [Google Scholar]
- Yu, Z.; Yang, G.; Zuo, S.; Jørgensen, G.; Koga, M.; Vejre, H. Critical Review on the Cooling Effect of Urban Blue-Green Space: A Threshold-Size Perspective. Urban For. Urban Green. 2020, 49, 126630. [Google Scholar] [CrossRef]
- Li, Y.; Ren, C.; Ho, J.Y.; Shi, Y. Landscape Metrics in Assessing How the Configuration of Urban Green Spaces Affects Their Cooling Effect: A Systematic Review of Empirical Studies. Landsc. Urban Plan. 2023, 239, 104842. [Google Scholar] [CrossRef]
- Yu, Z.; Zhang, J.; Yang, G. How to Build a Heat Network to Alleviate Surface Heat Island Effect? Sustain. Cities Soc. 2021, 74, 103135. [Google Scholar] [CrossRef]
- Wu, D.; Sun, H.; Xu, H.; Zhang, T.; Xu, Z.; Wu, L. How Can Ecological Land Be Deployed to Cool the Surface Thermal Environment? A Case Study from the Perspectives of Patch and Network. Remote Sens. 2023, 15, 1061. [Google Scholar] [CrossRef]
- Chen, M.; Sun, Y.; Yang, B.; Jiang, J. MSPA-Based Green Space Morphological Pattern and Its Spatiotemporal Influence on Land Surface Temperature. Heliyon 2024, 10. [Google Scholar] [CrossRef] [PubMed]
- Basu, T.; Das, A. Urbanization Induced Degradation of Urban Green Space and Its Association to the Land Surface Temperature in a Medium-Class City in India. Sustain. Cities Soc. 2023, 90, 104373. [Google Scholar] [CrossRef]
- Zoulia, I.; Santamouris, M.; Dimoudi, A. Monitoring the Effect of Urban Green Areas on the Heat Island in Athens. Environ. Monit. Assess. 2009, 156, 275–292. [Google Scholar] [CrossRef] [PubMed]
- Lin, J.; Wei, K.; Guan, Z. Exploring the Connection between Morphological Characteristic of Built-up Areas and Surface Heat Islands Based on MSPA. Urban Clim. 2024, 53, 101764. [Google Scholar] [CrossRef]
- Soille, P.; Vogt, P. Morphological Segmentation of Binary Patterns. Pattern Recognit. Lett. 2009, 30, 456–459. [Google Scholar] [CrossRef]
- Lin, J.; Wei, K.; Guan, Z. Exploring the Connection between Morphological Characteristic of Built-up Areas and Surface Heat Islands Based on MSPA. Urban Clim. 2024, 53, 101764. [Google Scholar] [CrossRef]
- Pan, L.; Gan, W.; Chen, J.; Ren, K. An Integrated Model for Constructing Urban Ecological Networks and Identifying the Ecological Protection Priority: A Case Study of Wujiang District, Suzhou. Sustainability 2023, 15, 4487. [Google Scholar] [CrossRef]
- Wang, H.; Pei, Z. Urban Green Corridors Analysis for a Rapid Urbanization City Exemplified in Gaoyou City, Jiangsu. Forests 2020, 11, 1374. [Google Scholar] [CrossRef]
- Yue, X.; Liu, W.; Wang, X.; Yang, J.; Lan, Y.; Zhu, Z.; Yao, X. Constructing an Urban Heat Network to Mitigate the Urban Heat Island Effect from a Connectivity Perspective. Sustain. Cities Soc. 2024, 114, 105774. [Google Scholar] [CrossRef]
- Zhao, Z.; Li, W.; Zhang, J.; Zheng, Y. Constructing an Urban Heat Island Network Based on Connectivity Perspective: A Case Study of Harbin, China. Ecol. Indic. 2024, 159, 111665. [Google Scholar] [CrossRef]
- Qian, W.; Li, X. A Cold Island Connectivity and Network Perspective to Mitigate the Urban Heat Island Effect. Sustain. Cities Soc. 2023, 94, 104525. [Google Scholar] [CrossRef]
- Li, Y.; Wang, S.; Zhang, S.; Wei, M.; Chen, Y.; Huang, X.; Zhou, R. The Creation of Multi-Level Urban Ecological Cooling Network to Alleviate the Urban Heat Island Effect. Sustain. Cities Soc. 2024, 114, 105786. [Google Scholar] [CrossRef]
- Rezaei, T.; Shen, X.; Chaiyarat, R.; Pumijumnong, N. Effective Cooling Networks: Optimizing Corridors for Urban Heat Island Mitigation. Remote Sens. Appl. Soc. Environ. 2024, 36, 101372. [Google Scholar] [CrossRef]
- Yue, X.; Liu, W.; Wang, X.; Yang, J.; Lan, Y.; Zhu, Z. Constructing an Urban Heat Network to Mitigate the Urban Heat Island Effect from a Connectivity Perspective. Sustain. Cities Soc. 2024, 114, 105774. [Google Scholar] [CrossRef]
- Xie, M.; Gao, Y.; Cao, Y.; Breuste, J.; Fu, M.; Tong, D. Dynamics and Temperature Regulation Function of Urban Green Connectivity. J. Urban Plan. Dev. 2015, 141, A5014008. [Google Scholar] [CrossRef]
- Chen, J.; Zhan, W.; Du, P.; Li, L.; Li, J.; Liu, Z.; Huang, F.; Lai, J.; Xia, J. Seasonally Disparate Responses of Surface Thermal Environment to 2D/3D Urban Morphology. Build. Environ. 2022, 214, 108928. [Google Scholar] [CrossRef]
- Liu, Y.; Zhang, W.; Liu, W.; Tan, Z.; Hu, S.; Ao, Z.; Li, J.; Xing, H. Exploring the Seasonal Effects of Urban Morphology on Land Surface Temperature in Urban Functional Zones. Sustain. Cities Soc. 2024, 103, 105268. [Google Scholar] [CrossRef]
- Wang, M.; Yan, Y.; Li, M.; Zhou, L. Differences in Emotional Preferences toward Urban Green Spaces among Various Cultural Groups in Macau and Their Influencing Factors. Land 2024, 13, 414. [Google Scholar] [CrossRef]
- Li, J.; Lin, F.; Cui, H.; Chen, Y.; Yang, S. Planning Strategies for Increasing the Occupancy Rate of Green Open Space Based on Urban Geographic Data in Macau: An Investigation of Ultra-High-Density Cities. Buildings 2025, 15, 257. [Google Scholar] [CrossRef]
- Xi, Z.; Li, C.; Zhou, L.; Yang, H.; Burghardt, R. Built Environment Influences on Urban Climate Resilience: Evidence from Extreme Heat Events in Macau. Sci. Total Environ. 2023, 859, 160270. [Google Scholar] [CrossRef]
- Liao, W.; Guldmann, J.-M.; Hu, L.; Cao, Q.; Gan, D.; Li, X. Linking Urban Park Cool Island Effects to the Landscape Patterns inside and Outside the Park: A Simultaneous Equation Modeling Approach. Landsc. Urban Plan. 2023, 232, 104681. [Google Scholar] [CrossRef]
- Li, J.; Stouffs, R. Assessing and Optimizing Cooling Intensity of UGS via Improved Metrics: A Study Based on Machine Learning Simulation Model. Build. Environ. 2025, 112959. [Google Scholar] [CrossRef]
- Sheng, S.; Wang, Y. Configuration Characteristics of Green-Blue Spaces for Efficient Cooling in Urban Environments. Sustain. Cities Soc. 2024, 100, 105040. [Google Scholar] [CrossRef]
- McGarigal, K.; Marks, B.J.; Pacific Northwest Research Station (Portland, Or.) FRAGSTATS: Spatial Pattern Analysis Program for Quantifying Landscape Structure; General technical report PNW; U.S. Department of Agriculture, Forest Service, Pacific Northwest Research Station, 1995;
- Peng, J.; Dan, Y.; Qiao, R.; Liu, Y.; Dong, J.; Wu, J. How to Quantify the Cooling Effect of Urban Parks? Linking Maximum and Accumulation Perspectives. Remote Sens. Environ. 2021, 252, 112135. [Google Scholar] [CrossRef]
- Liu, H.; Huang, B.; Cheng, X.; Yin, M.; Shang, C.; Luo, Y.; He, B.-J. Sensing-Based Park Cooling Performance Observation and Assessment: A Review. Build. Environ. 2023, 245, 110915. [Google Scholar] [CrossRef]
- Liao, W.; Guldmann, J.-M.; Hu, L.; Cao, Q.; Gan, D.; Li, X. Linking Urban Park Cool Island Effects to the Landscape Patterns inside and Outside the Park: A Simultaneous Equation Modeling Approach. Landsc. Urban Plan. 2023, 232, 104681. [Google Scholar] [CrossRef]
- Zhou, W.; Yu, Y.; Zhang, S.; Xu, J.; Wu, T. Methods for Quantifying the Cooling Effect of Urban Green Spaces Using Remote Sensing: A Comparative Study. Landsc. Urban Plan. 2025, 256, 105289. [Google Scholar] [CrossRef]
- Yu, Z.; Guo, X.; Jørgensen, G.; Vejre, H. How Can Urban Green Spaces Be Planned for Climate Adaptation in Subtropical Cities? Ecol. Indic. 2017, 82, 152–162. [Google Scholar] [CrossRef]
- Yao, X.; Yu, K.; Zeng, X.; Lin, Y.; Ye, B.; Shen, X.; Liu, J. How Can Urban Parks Be Planned to Mitigate Urban Heat Island Effect in “Furnace Cities” ? An Accumulation Perspective. J. Clean. Prod. 2022, 330, 129852. [Google Scholar] [CrossRef]
- Lin, P.; Lau, S.S.Y.; Qin, H.; Gou, Z. Effects of Urban Planning Indicators on Urban Heat Island: A Case Study of Pocket Parks in High-Rise High-Density Environment. Landsc. Urban Plan. 2017, 168, 48–60. [Google Scholar] [CrossRef]
- Lin, J.; Qiu, S.; Tan, X.; Zhuang, Y. Measuring the Relationship between Morphological Spatial Pattern of Green Space and Urban Heat Island Using Machine Learning Methods. Build. Environ. 2023, 228, 109910. [Google Scholar] [CrossRef]
- Liu, F.; Liu, J.; Zhang, Y.; Hong, S.; Fu, W.; Wang, M.; Dong, J. Construction of a Cold Island Network for the Urban Heat Island Effect Mitigation. Sci. Total Environ. 2024, 915, 169950. [Google Scholar] [CrossRef]
- Hong Tingting; Huang Xiaohui; Deng Xipeng; Yang Yiwei; Tang Xiang Study on the Relationship between Urban GreenInfrastructure and Thermal Environment Based onMorphological Spatial Pattern Analysis—A CaseStudy of Central Urban Area of Fuzhou City. Chin. Landsc. Archit. 2023, 39, 97.
- Ma, Y.; Kuang, Y.; Huang, N. Coupling Urbanization Analyses for Studying Urban Thermal Environment and Its Interplay with Biophysical Parameters Based on TM/ETM+ Imagery. Int. J. Appl. Earth Obs. Geoinformation 2010, 12, 110–118. [Google Scholar] [CrossRef]
- Xu, J.; Jin, Y.; Ling, Y.; Sun, Y.; Wang, Y. Exploring the Seasonal Impacts of Morphological Spatial Pattern of Green Spaces on the Urban Heat Island. Sustain. Cities Soc. 2025, 125, 106352. [Google Scholar] [CrossRef]
- Lu, Y.; Wu, J.; Liu, M. Decoding the Cooling Potential of Urban Green Spaces: A Cross-City Investigation of Driving Factors in 311 Chinese Cities under Varying Climate Zones. Sustain. Cities Soc. 2025, 126, 106410. [Google Scholar] [CrossRef]
- Gunawardena, K.R.; Wells, M.J.; Kershaw, T. Utilising Green and Bluespace to Mitigate Urban Heat Island Intensity. Sci. Total Environ. 2017, 584–585, 1040–1055. [Google Scholar] [CrossRef]
- Urban Green Space Cooling Effect in Cities: Heliyon. Available online: https://www.cell.com/heliyon/fulltext/S2405-8440(19)30070-2 (accessed on 3 June 2025).
- Zhang, J.; Zhang, H.; Qi, R. A Study of Size Threshold for Cooling Effect in Urban Parks and Their Cooling Accessibility and Equity. Sci. Rep. 2024, 14, 16176. [Google Scholar] [CrossRef] [PubMed]
- Huang, M.; Cui, P.; He, X. Study of the Cooling Effects of Urban Green Space in Harbin in Terms of Reducing the Heat Island Effect. Sustainability 2018, 10, 1101. [Google Scholar] [CrossRef]
- Verma, R.; Zawadzka, J.E.; Garg, P.K.; Corstanje, R. The Relationship between Spatial Configuration of Urban Parks and Neighbourhood Cooling in a Humid Subtropical City. Landsc. Ecol. 2024, 39, 34. [Google Scholar] [CrossRef]
- Bao, T.; Li, X.; Zhang, J.; Zhang, Y.; Tian, S. Assessing the Distribution of Urban Green Spaces and Its Anisotropic Cooling Distance on Urban Heat Island Pattern in Baotou, China. ISPRS Int. J. Geo-Inf. 2016, 5, 12. [Google Scholar] [CrossRef]
- Zhang, J.; Gou, Z.; Cheng, B.; Khoshbakht, M. A Study of Physical Factors Influencing Park Cooling Intensities and Their Effects in Different Time of the Day. J. Therm. Biol. 2022, 109, 103336. [Google Scholar] [CrossRef] [PubMed]
Figure 1.
Location of Macau.
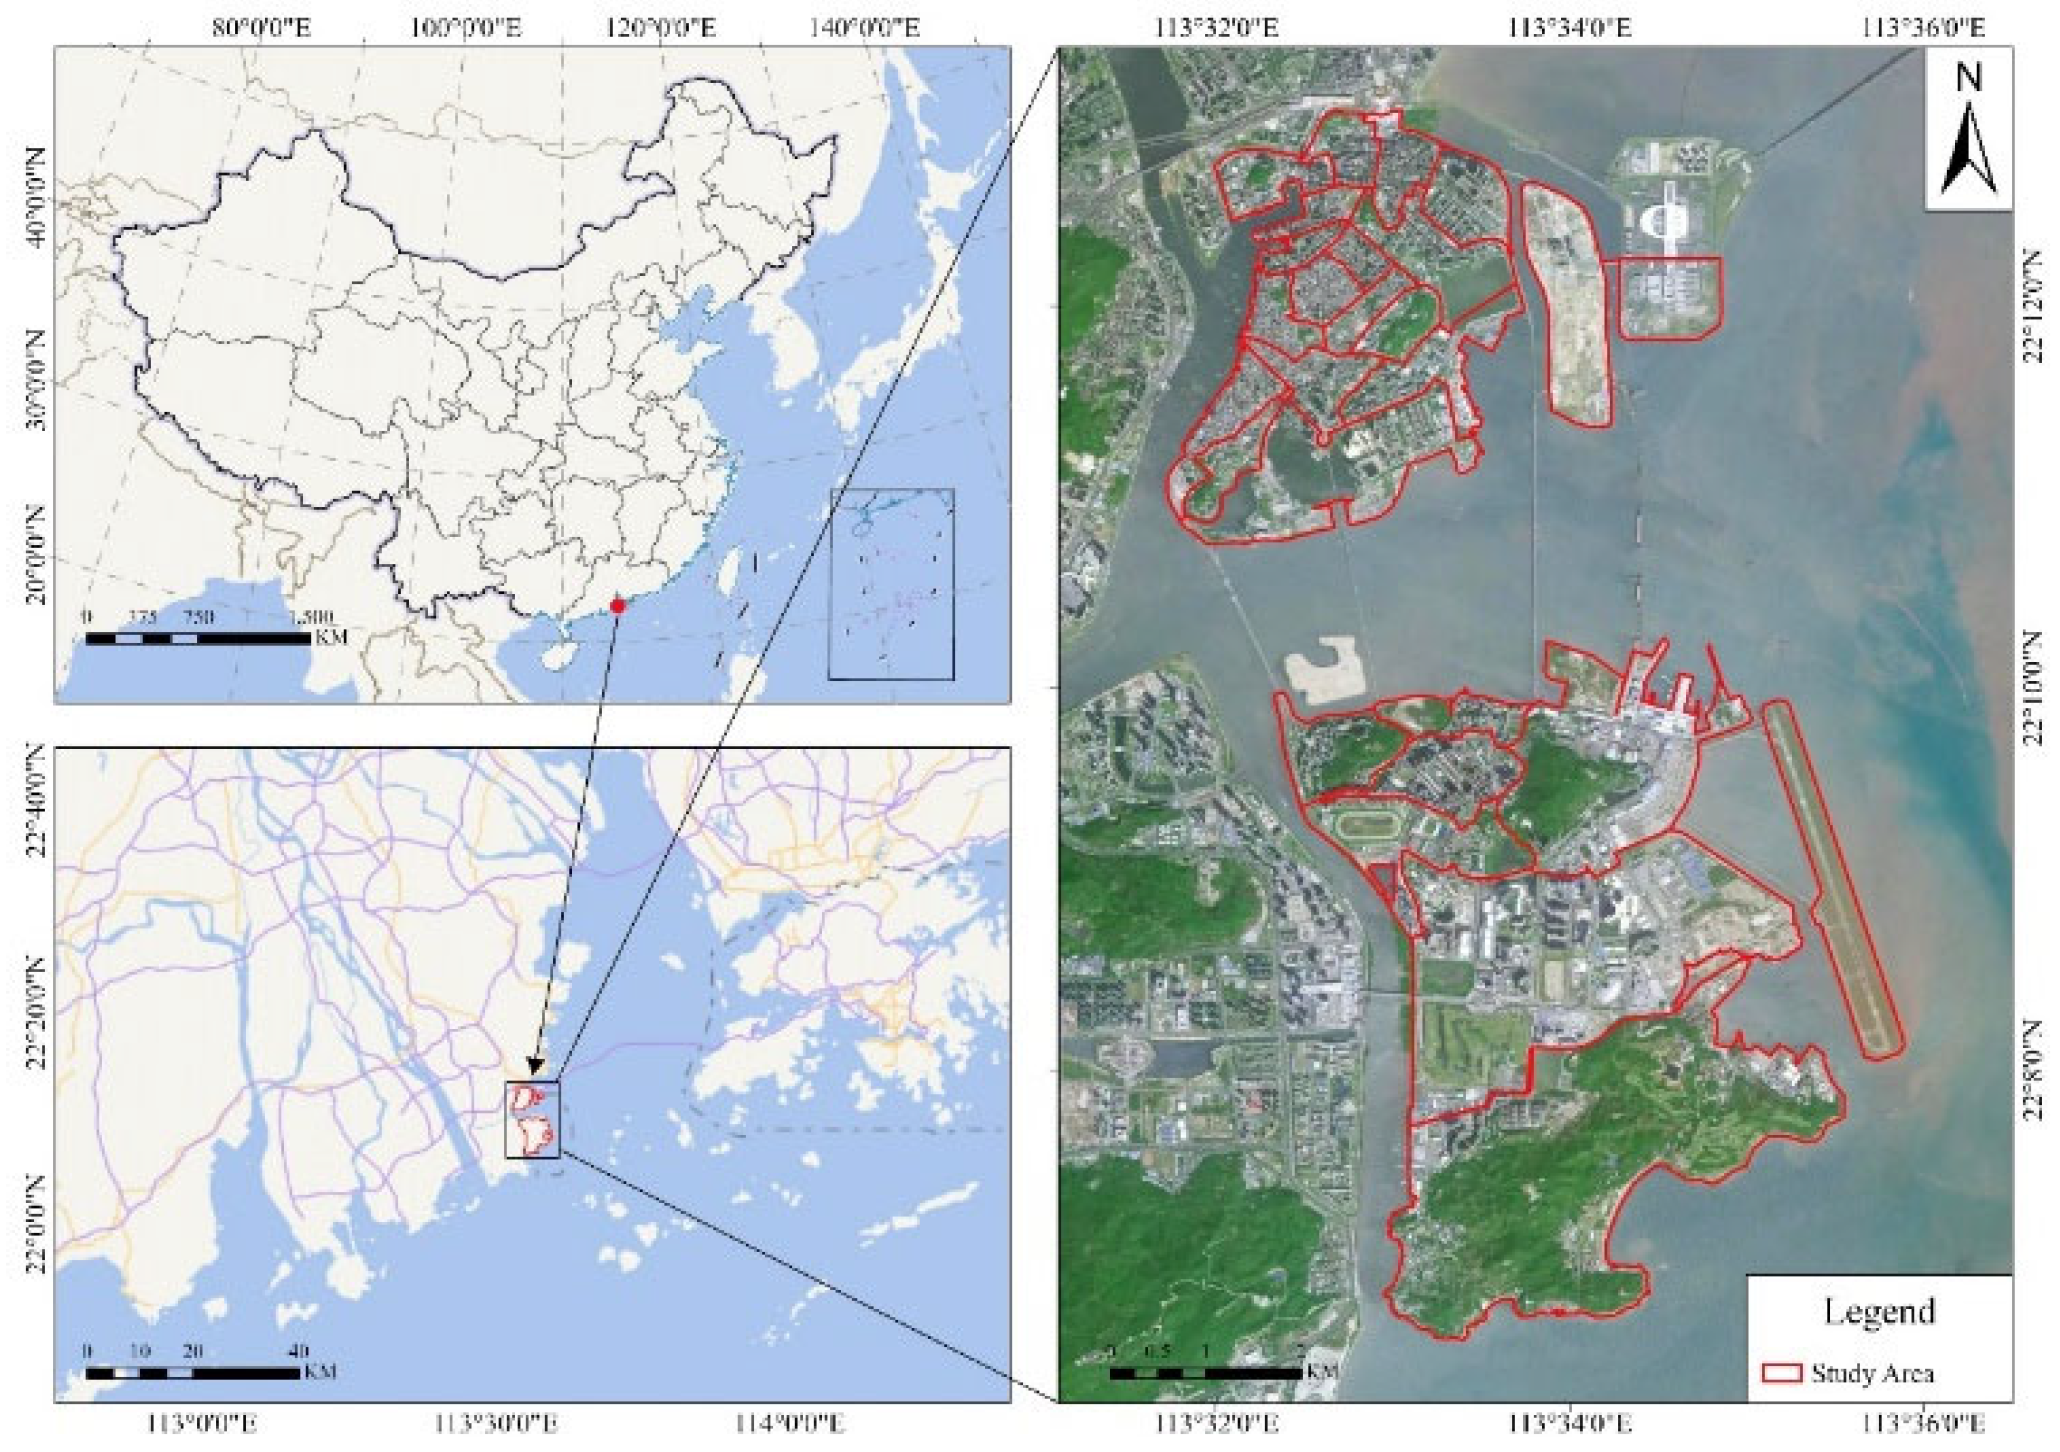
Figure 2.
Illustration of the seven MSPA classes (a) and the MSPA results in Macau (b).
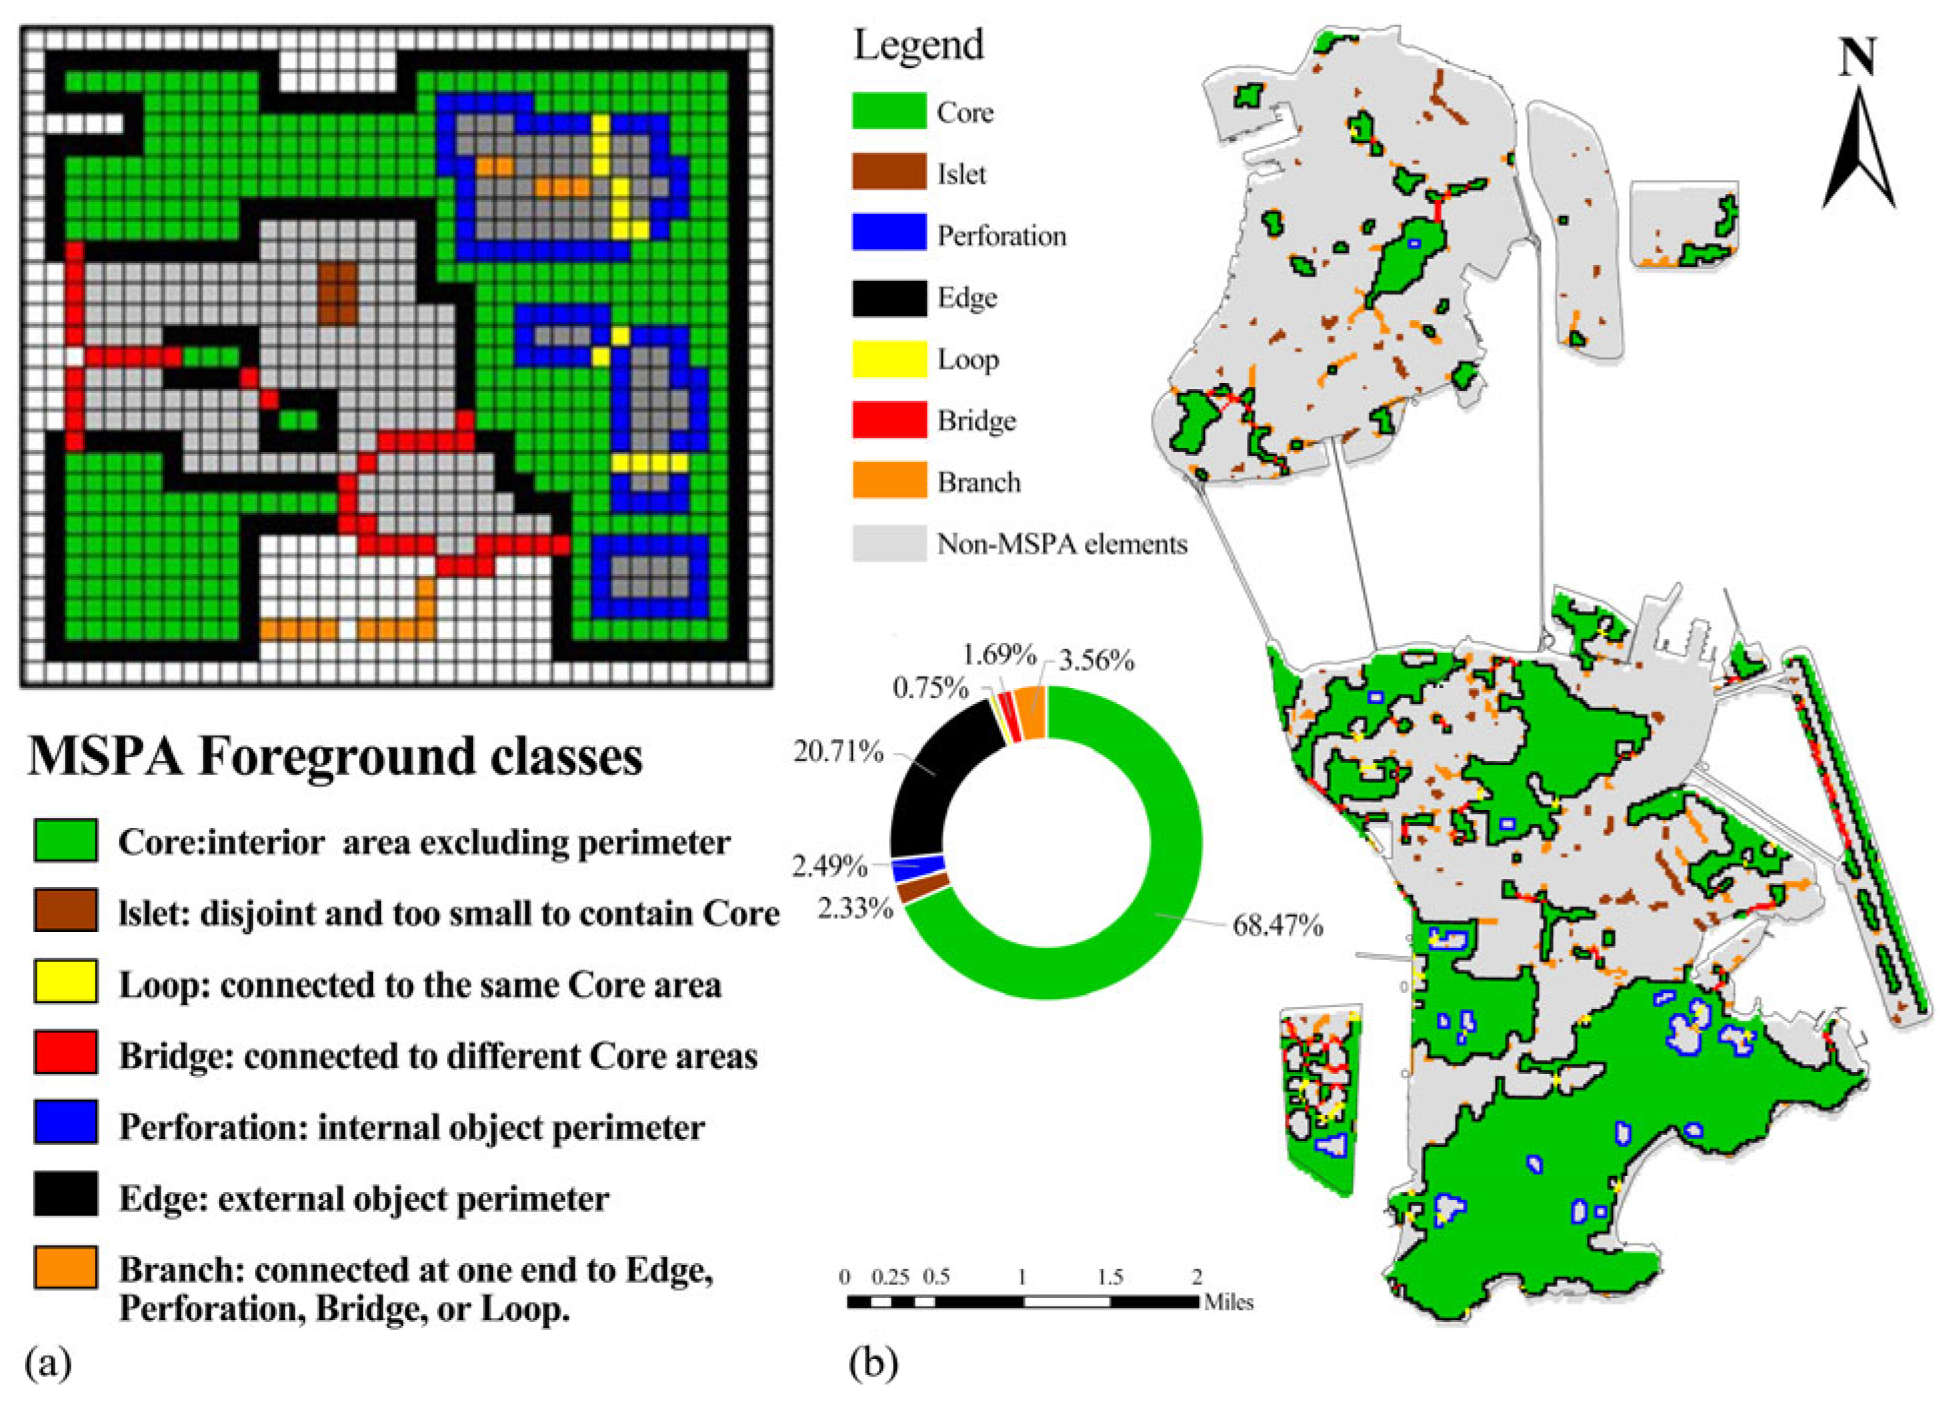
Figure 3.
Study area LULC (a), LST maps in two phases (b) and Distribution of heat fields (c).
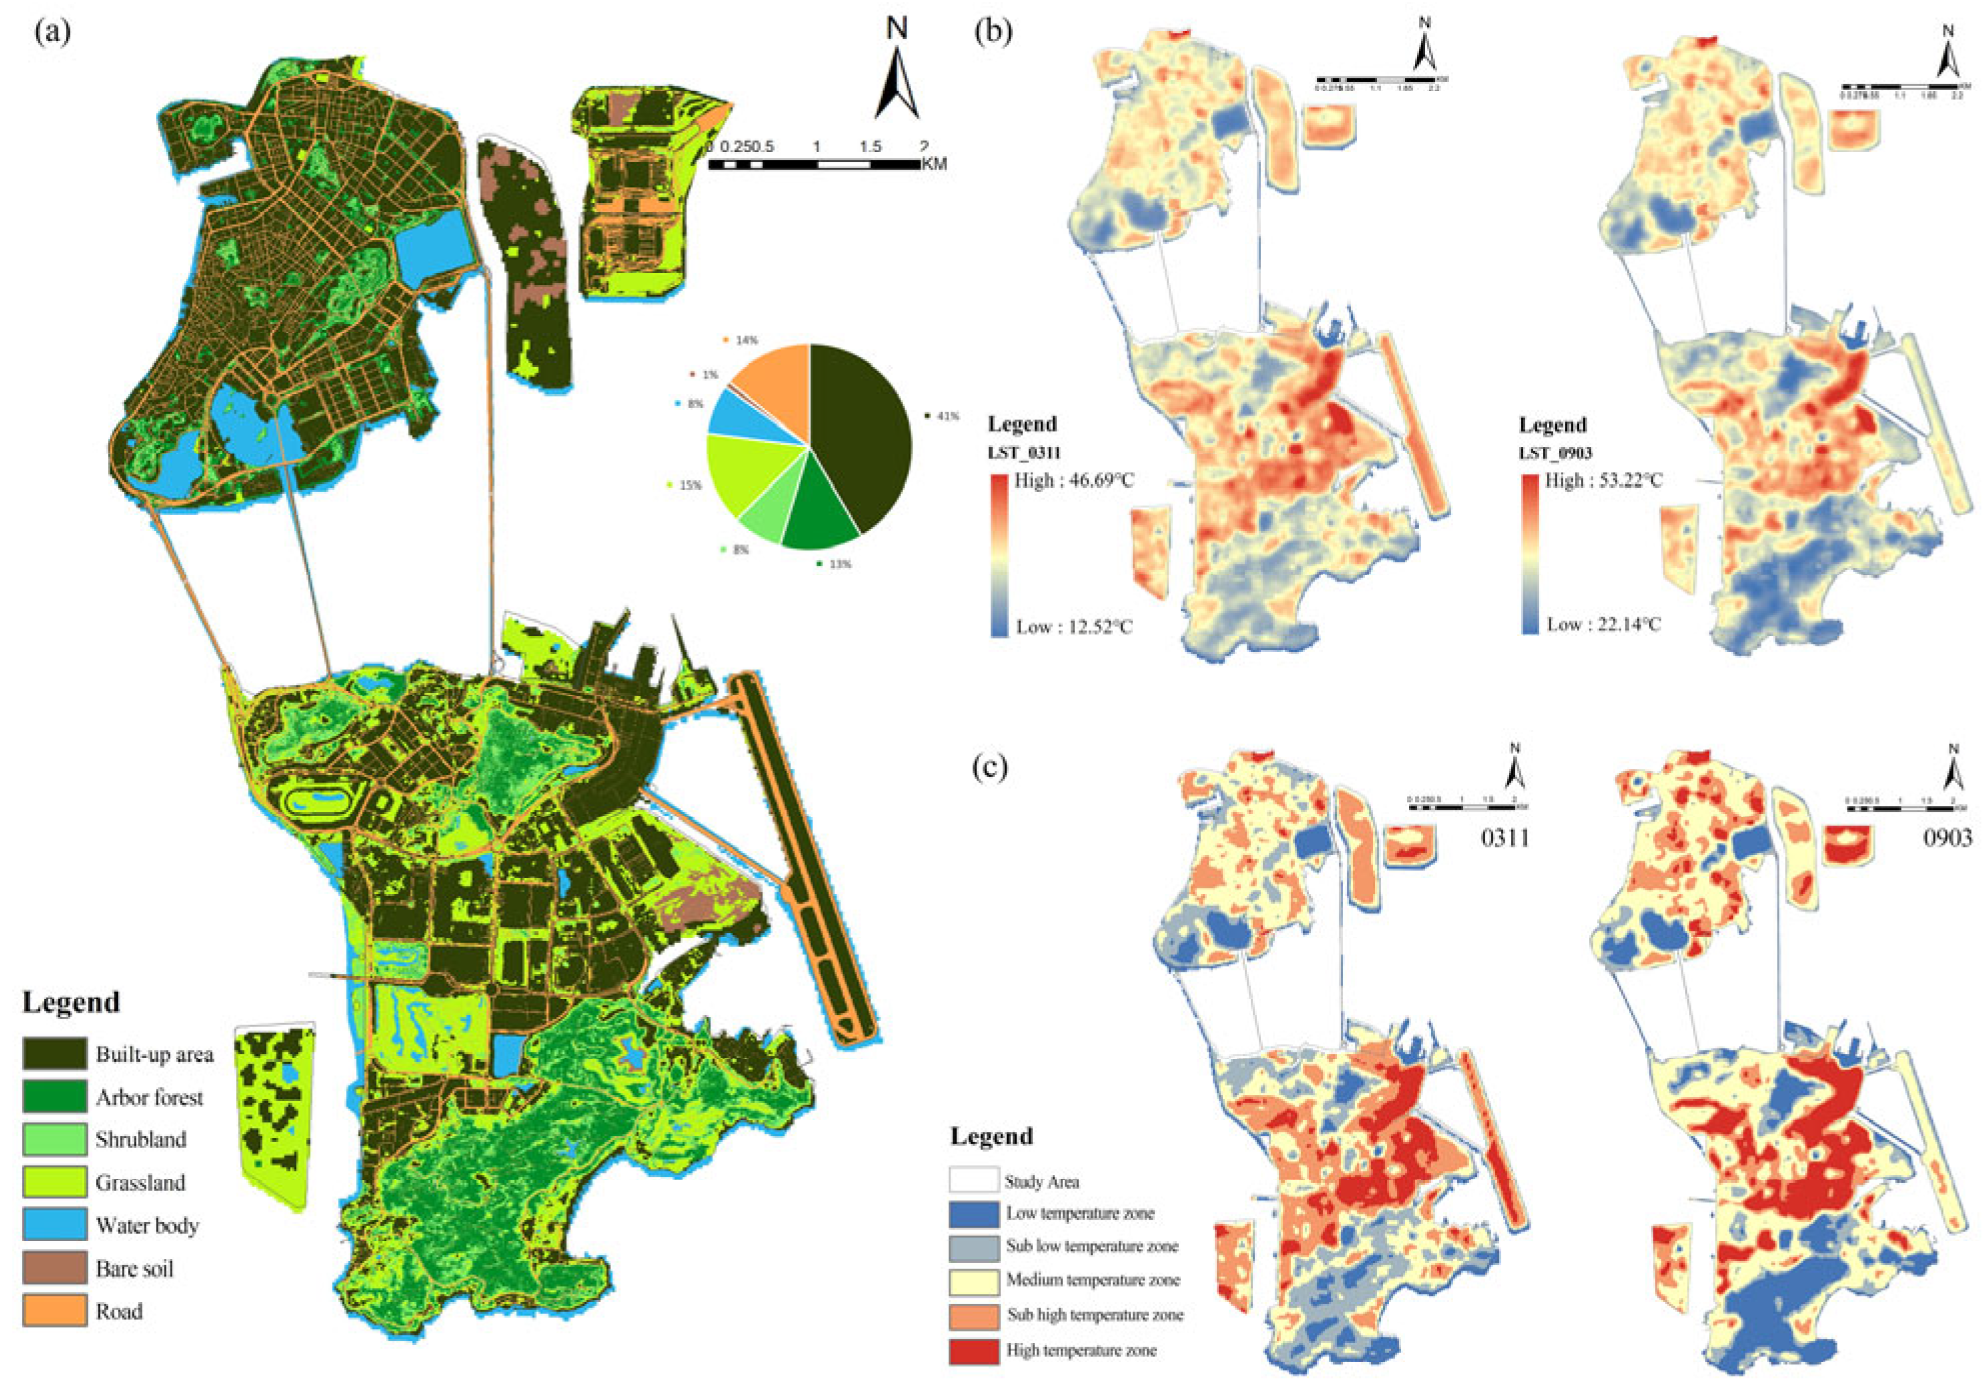
Figure 4.
Proportion of Various Types and GWR Analysis with T (a is Type I Core Area; b is Type I Branch Area; c is Type I Peripheral Area; d is Type I Summer Significance Composite Index; e is Type II Branch Area; f is Spring Significance Index).
Figure 4.
Proportion of Various Types and GWR Analysis with T (a is Type I Core Area; b is Type I Branch Area; c is Type I Peripheral Area; d is Type I Summer Significance Composite Index; e is Type II Branch Area; f is Spring Significance Index).
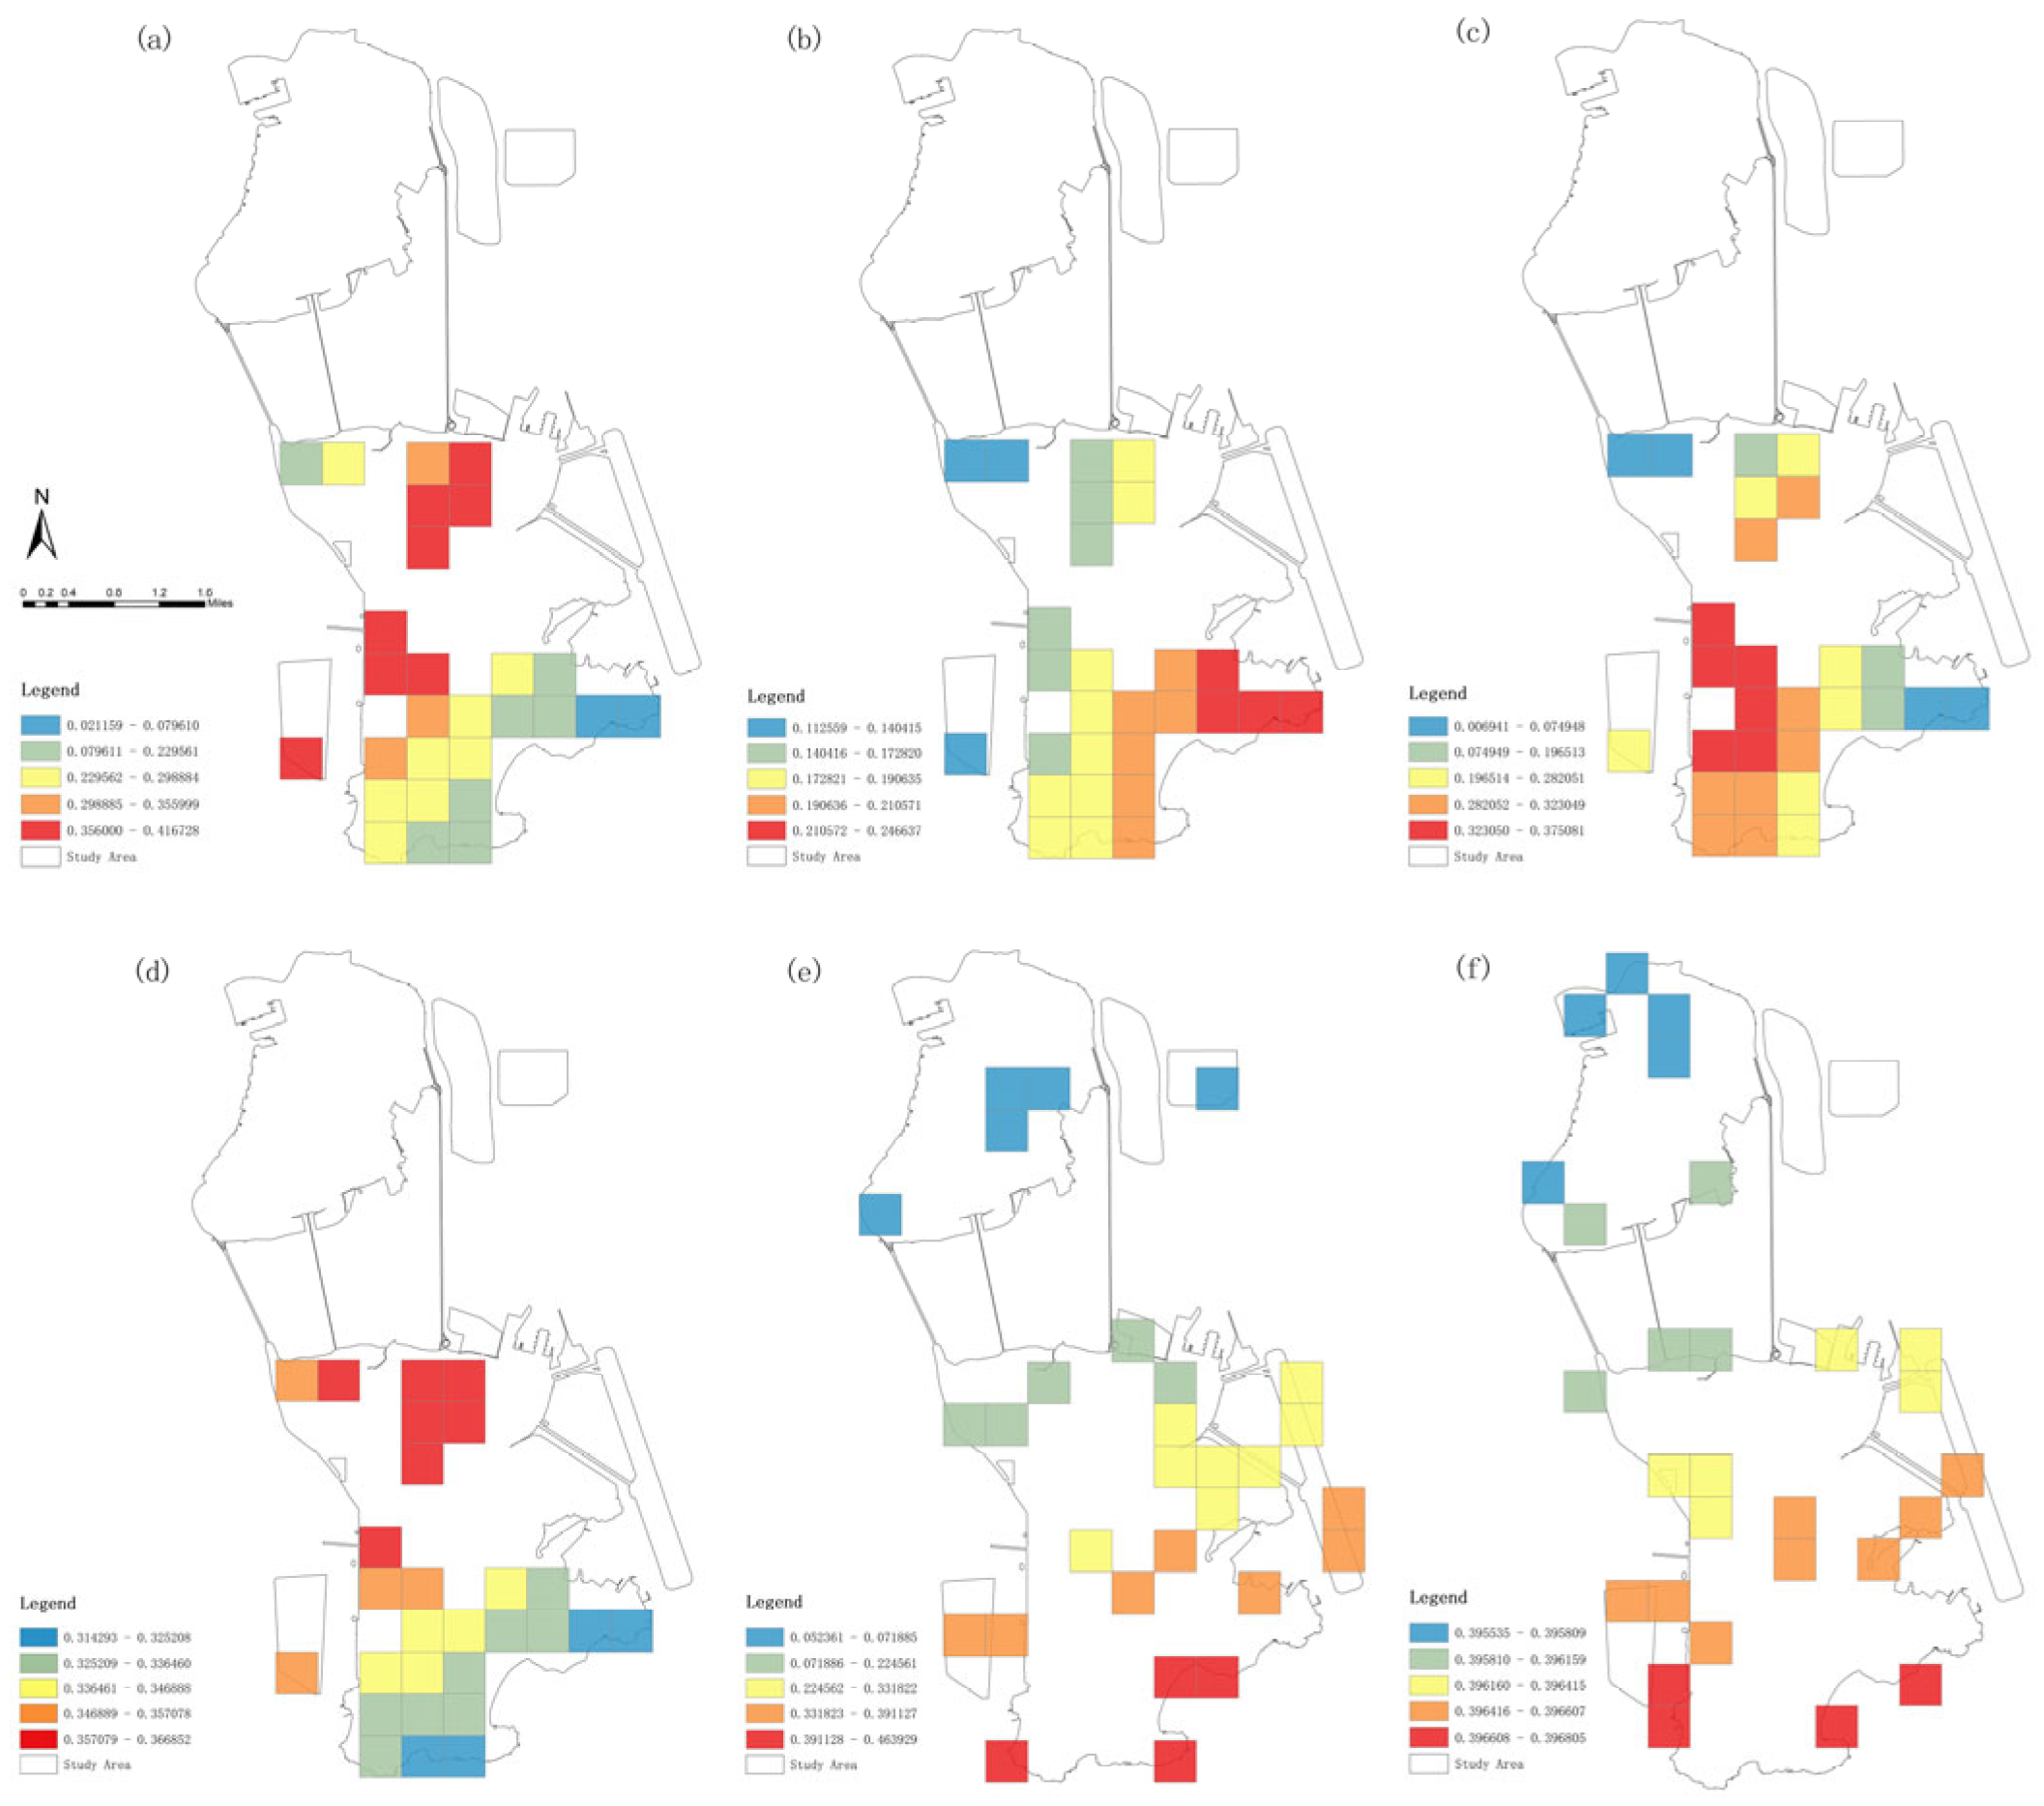
Figure 5.
Distribution of parks
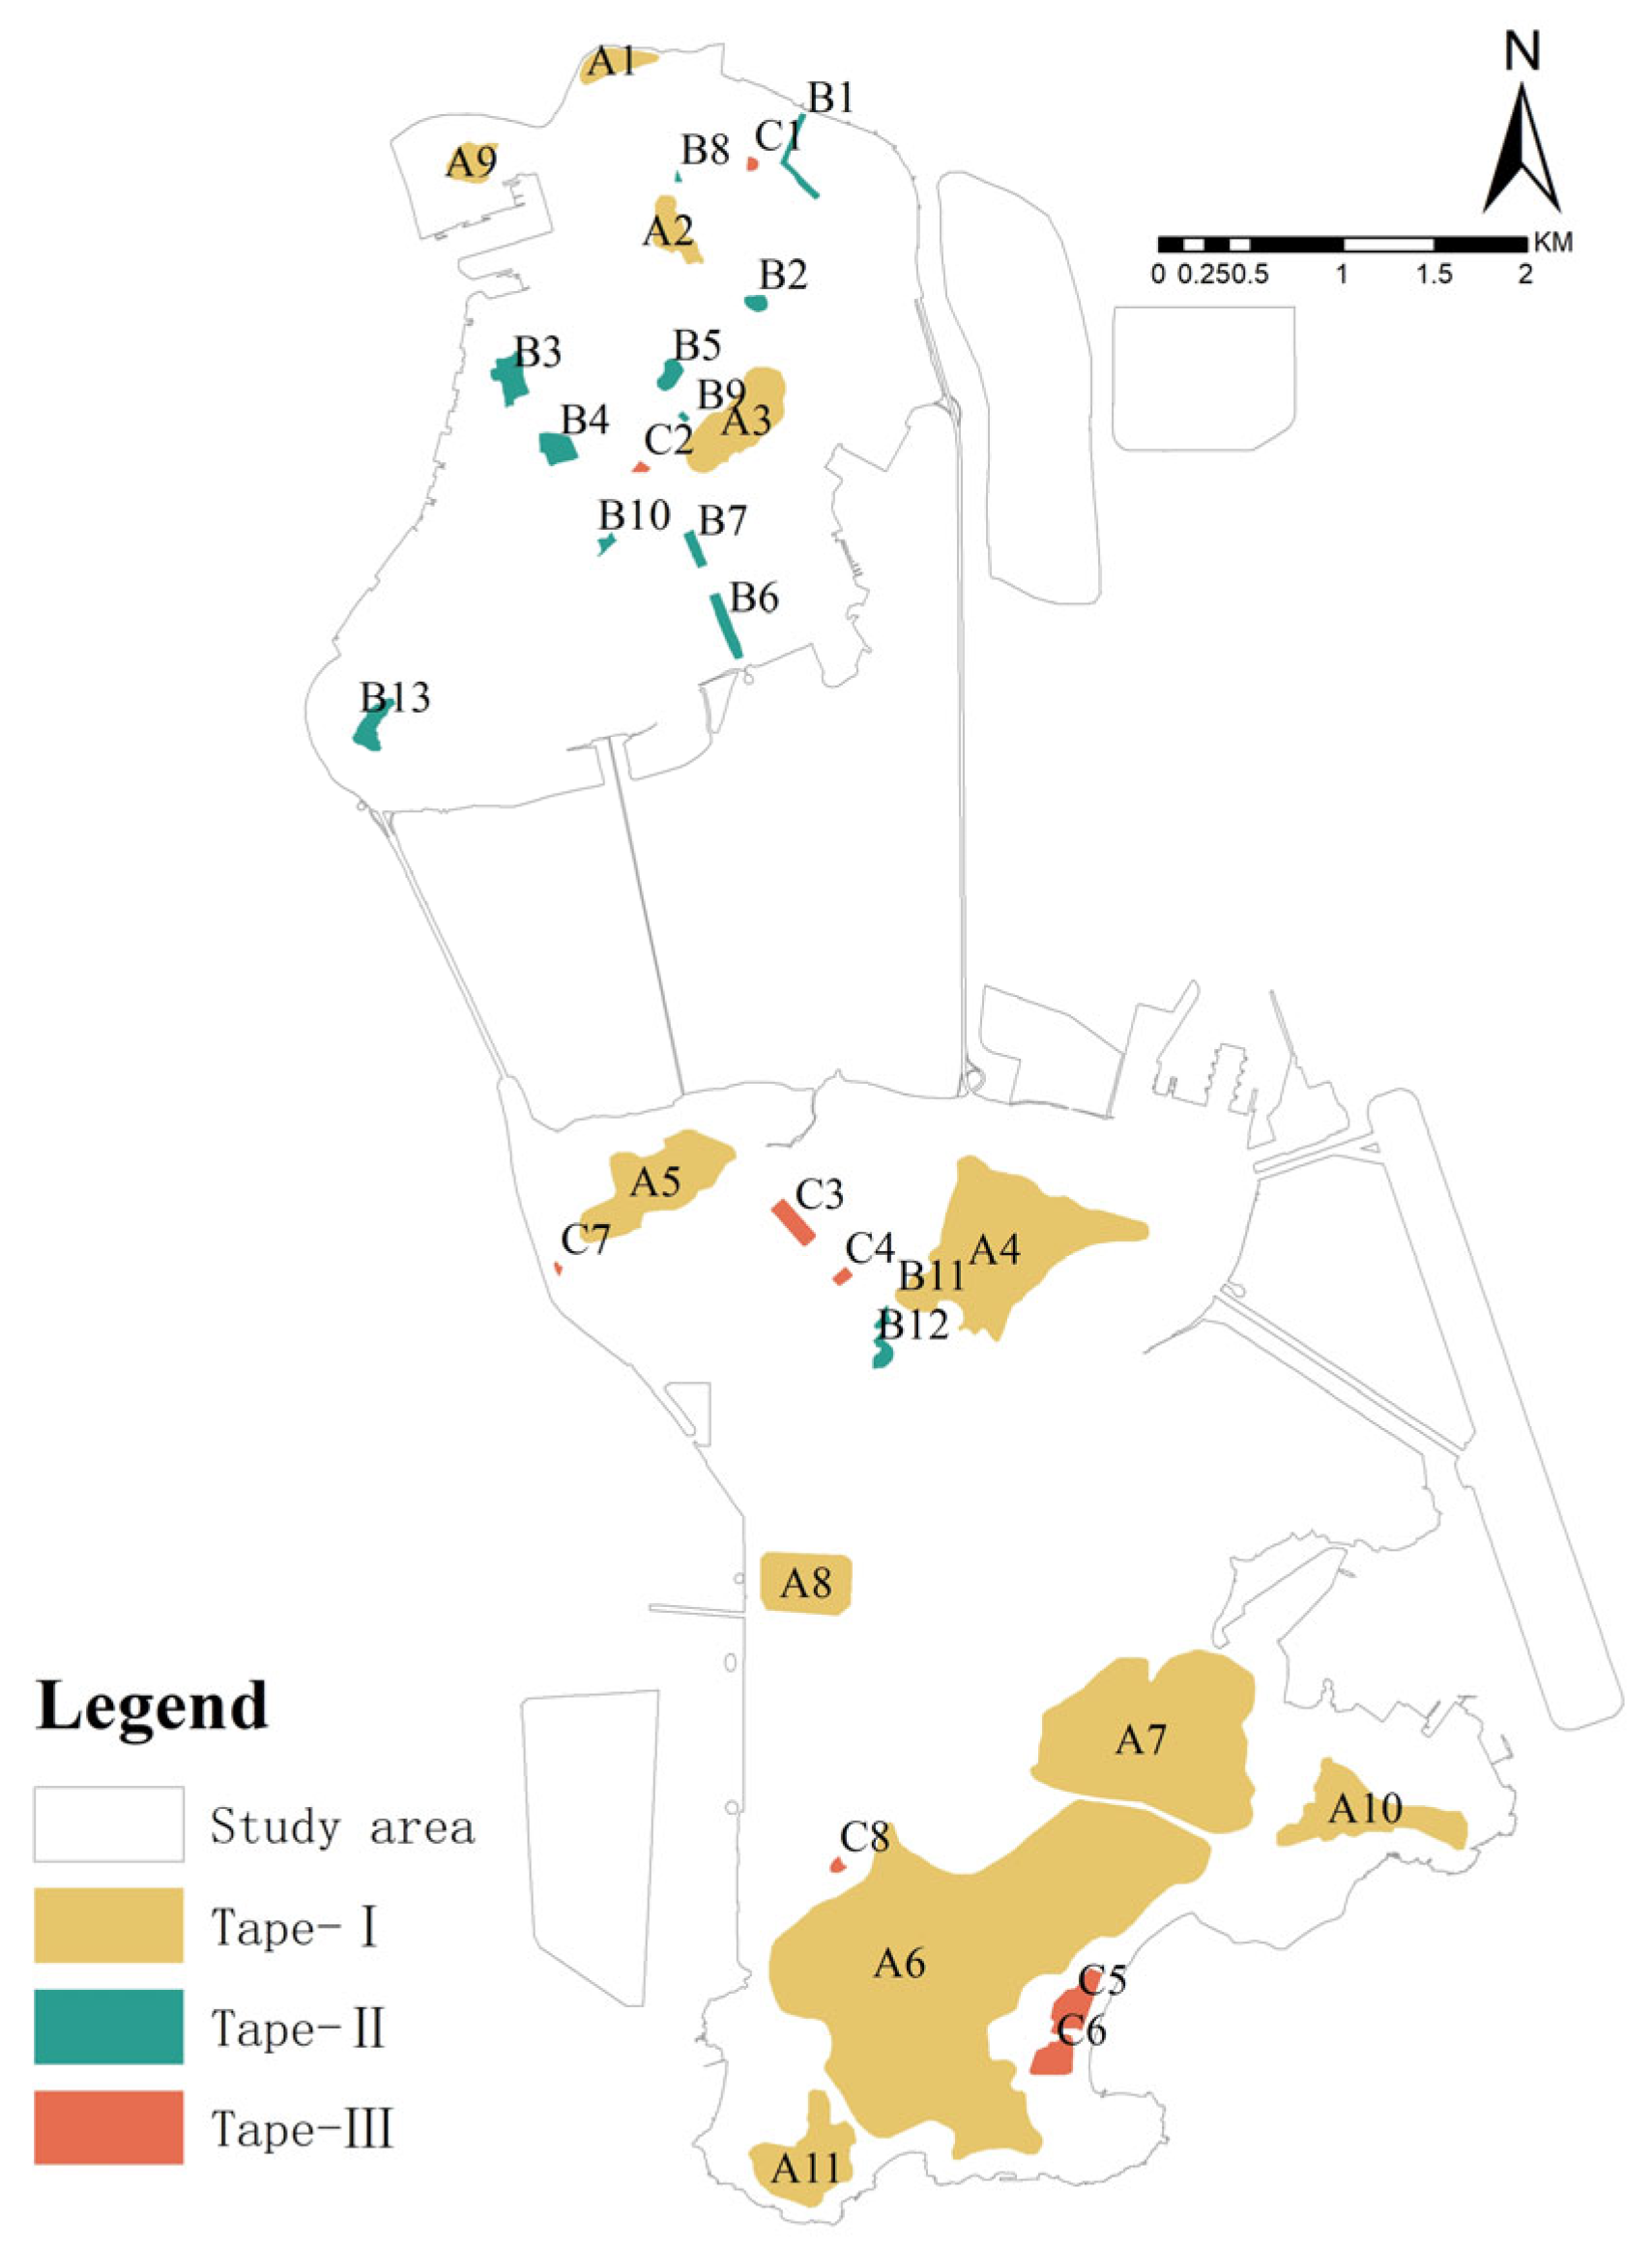
Figure 6.
Analysis of the correlation between park area, perimeter and landscape shape index and cooling indexes
Figure 6.
Analysis of the correlation between park area, perimeter and landscape shape index and cooling indexes
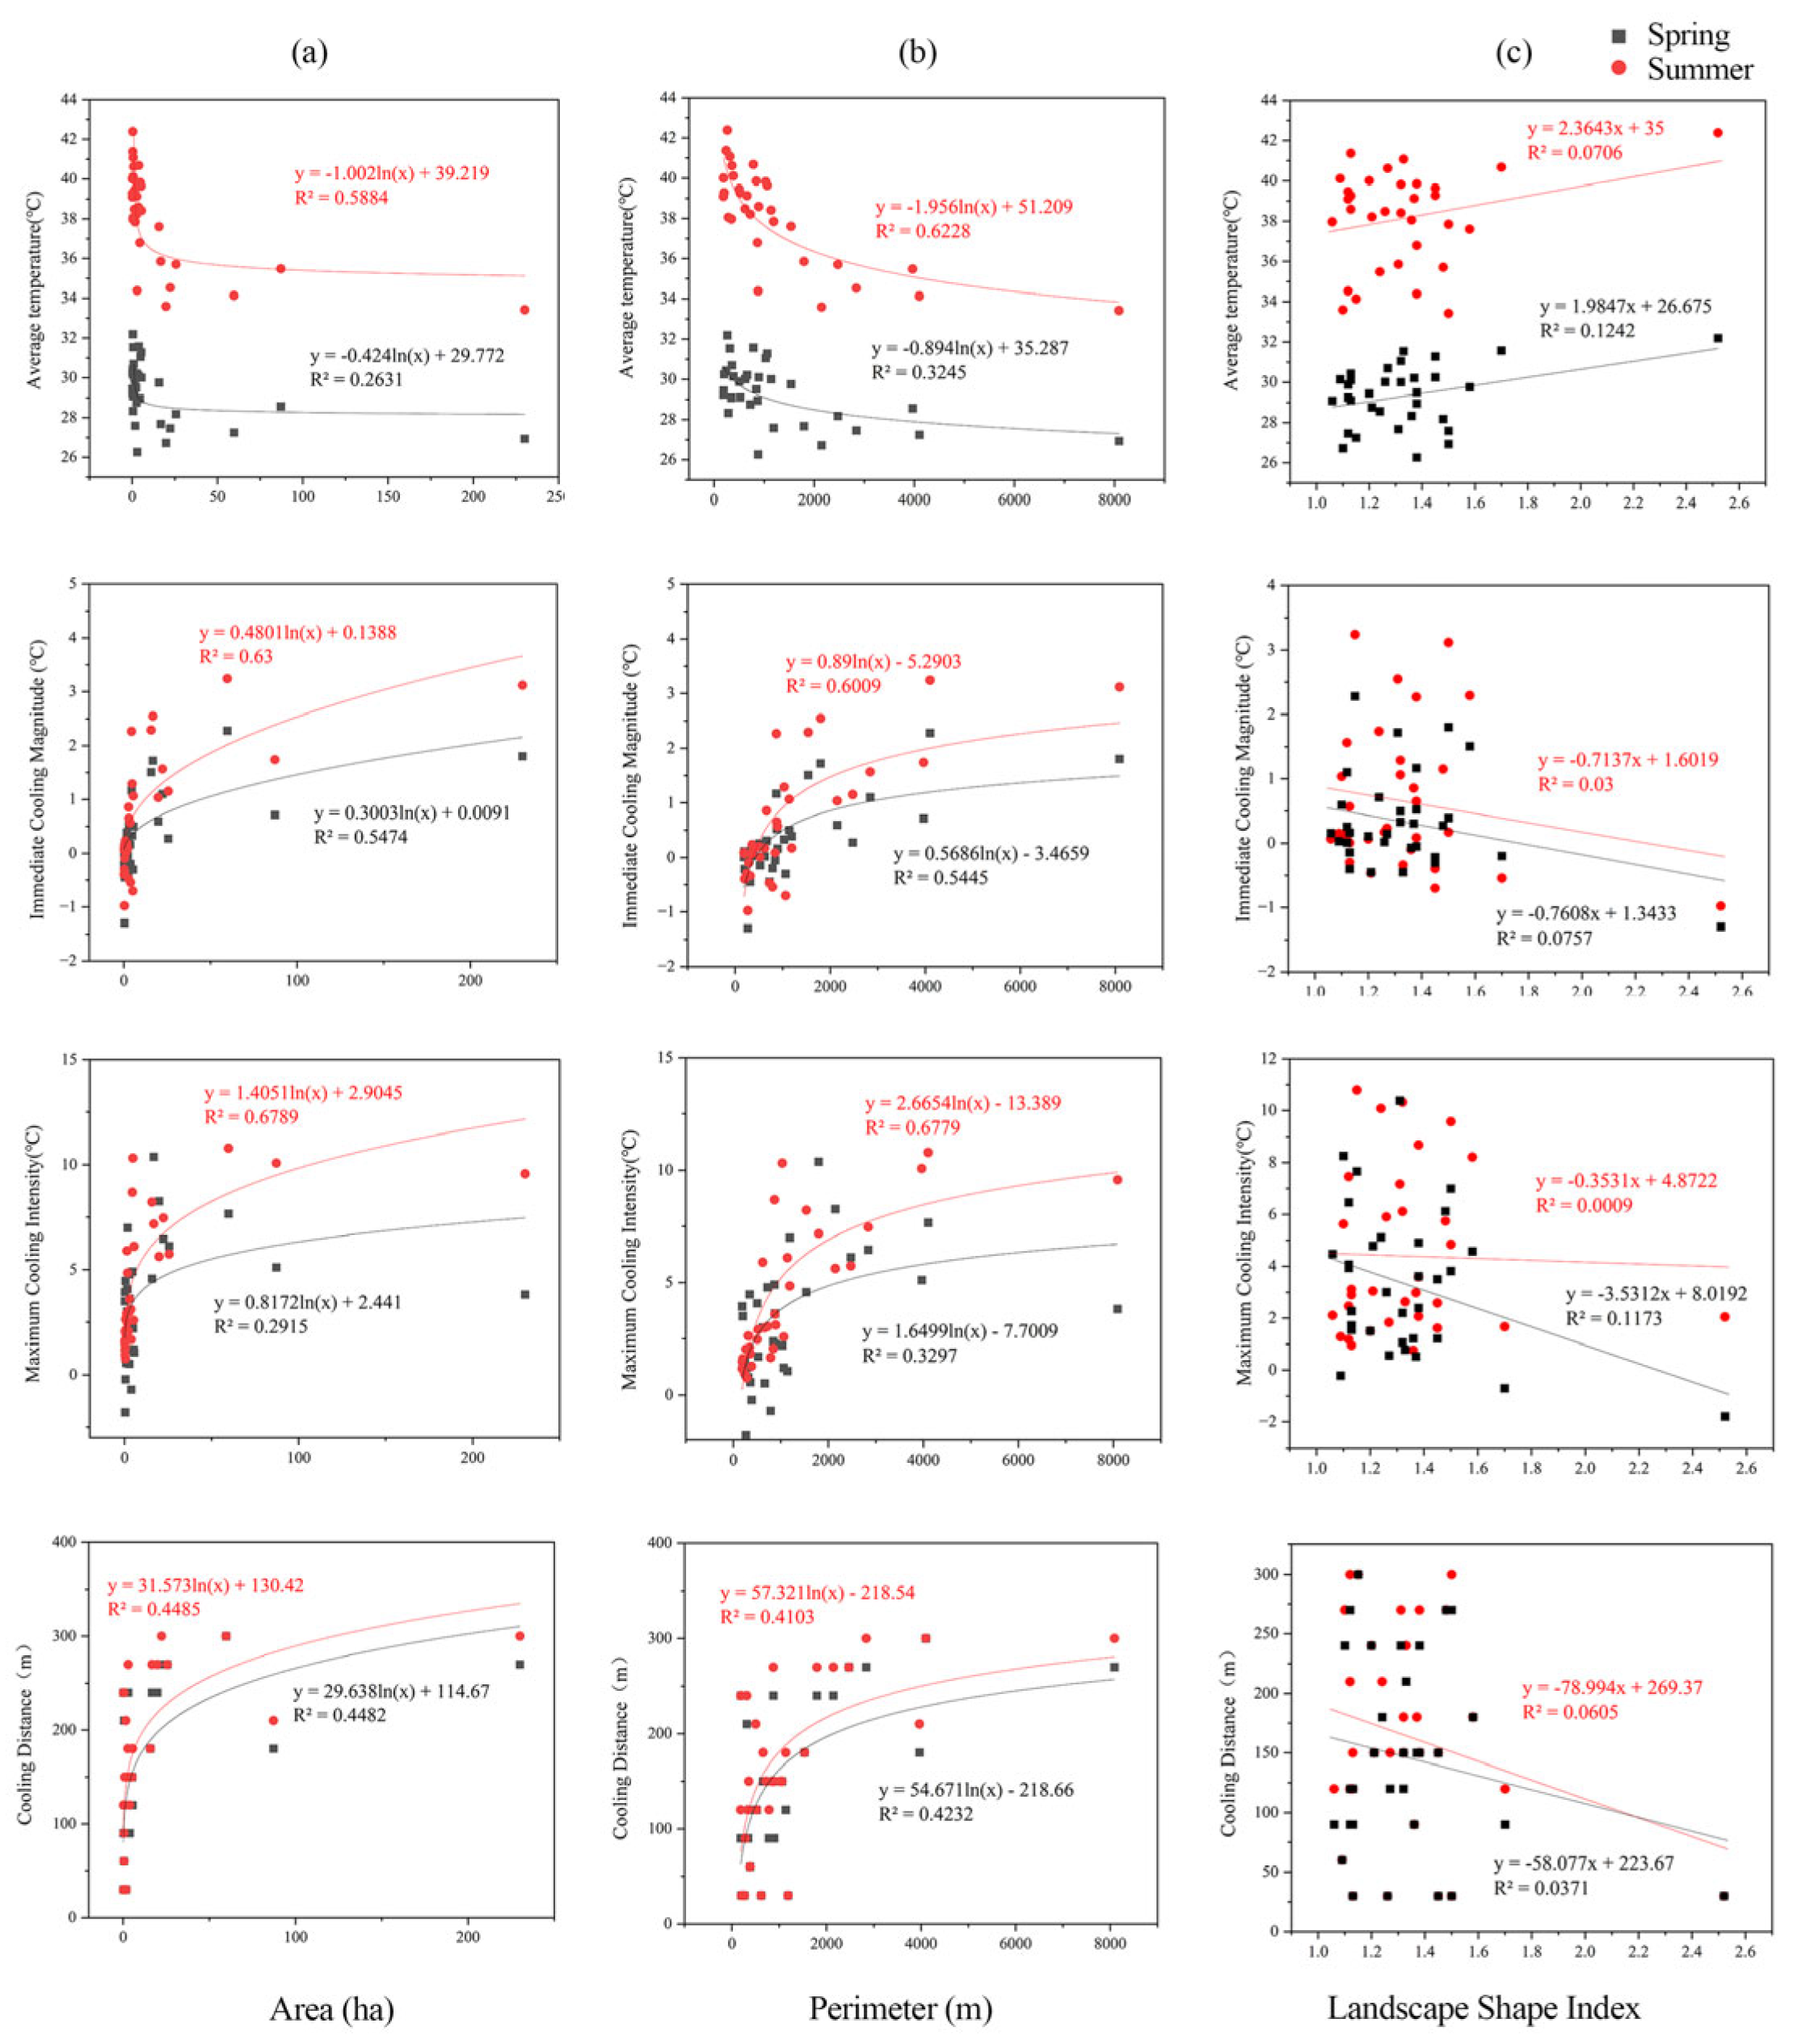
Figure 7.
Normalized Shape Index and Cooling Effect of Different Types of Parks
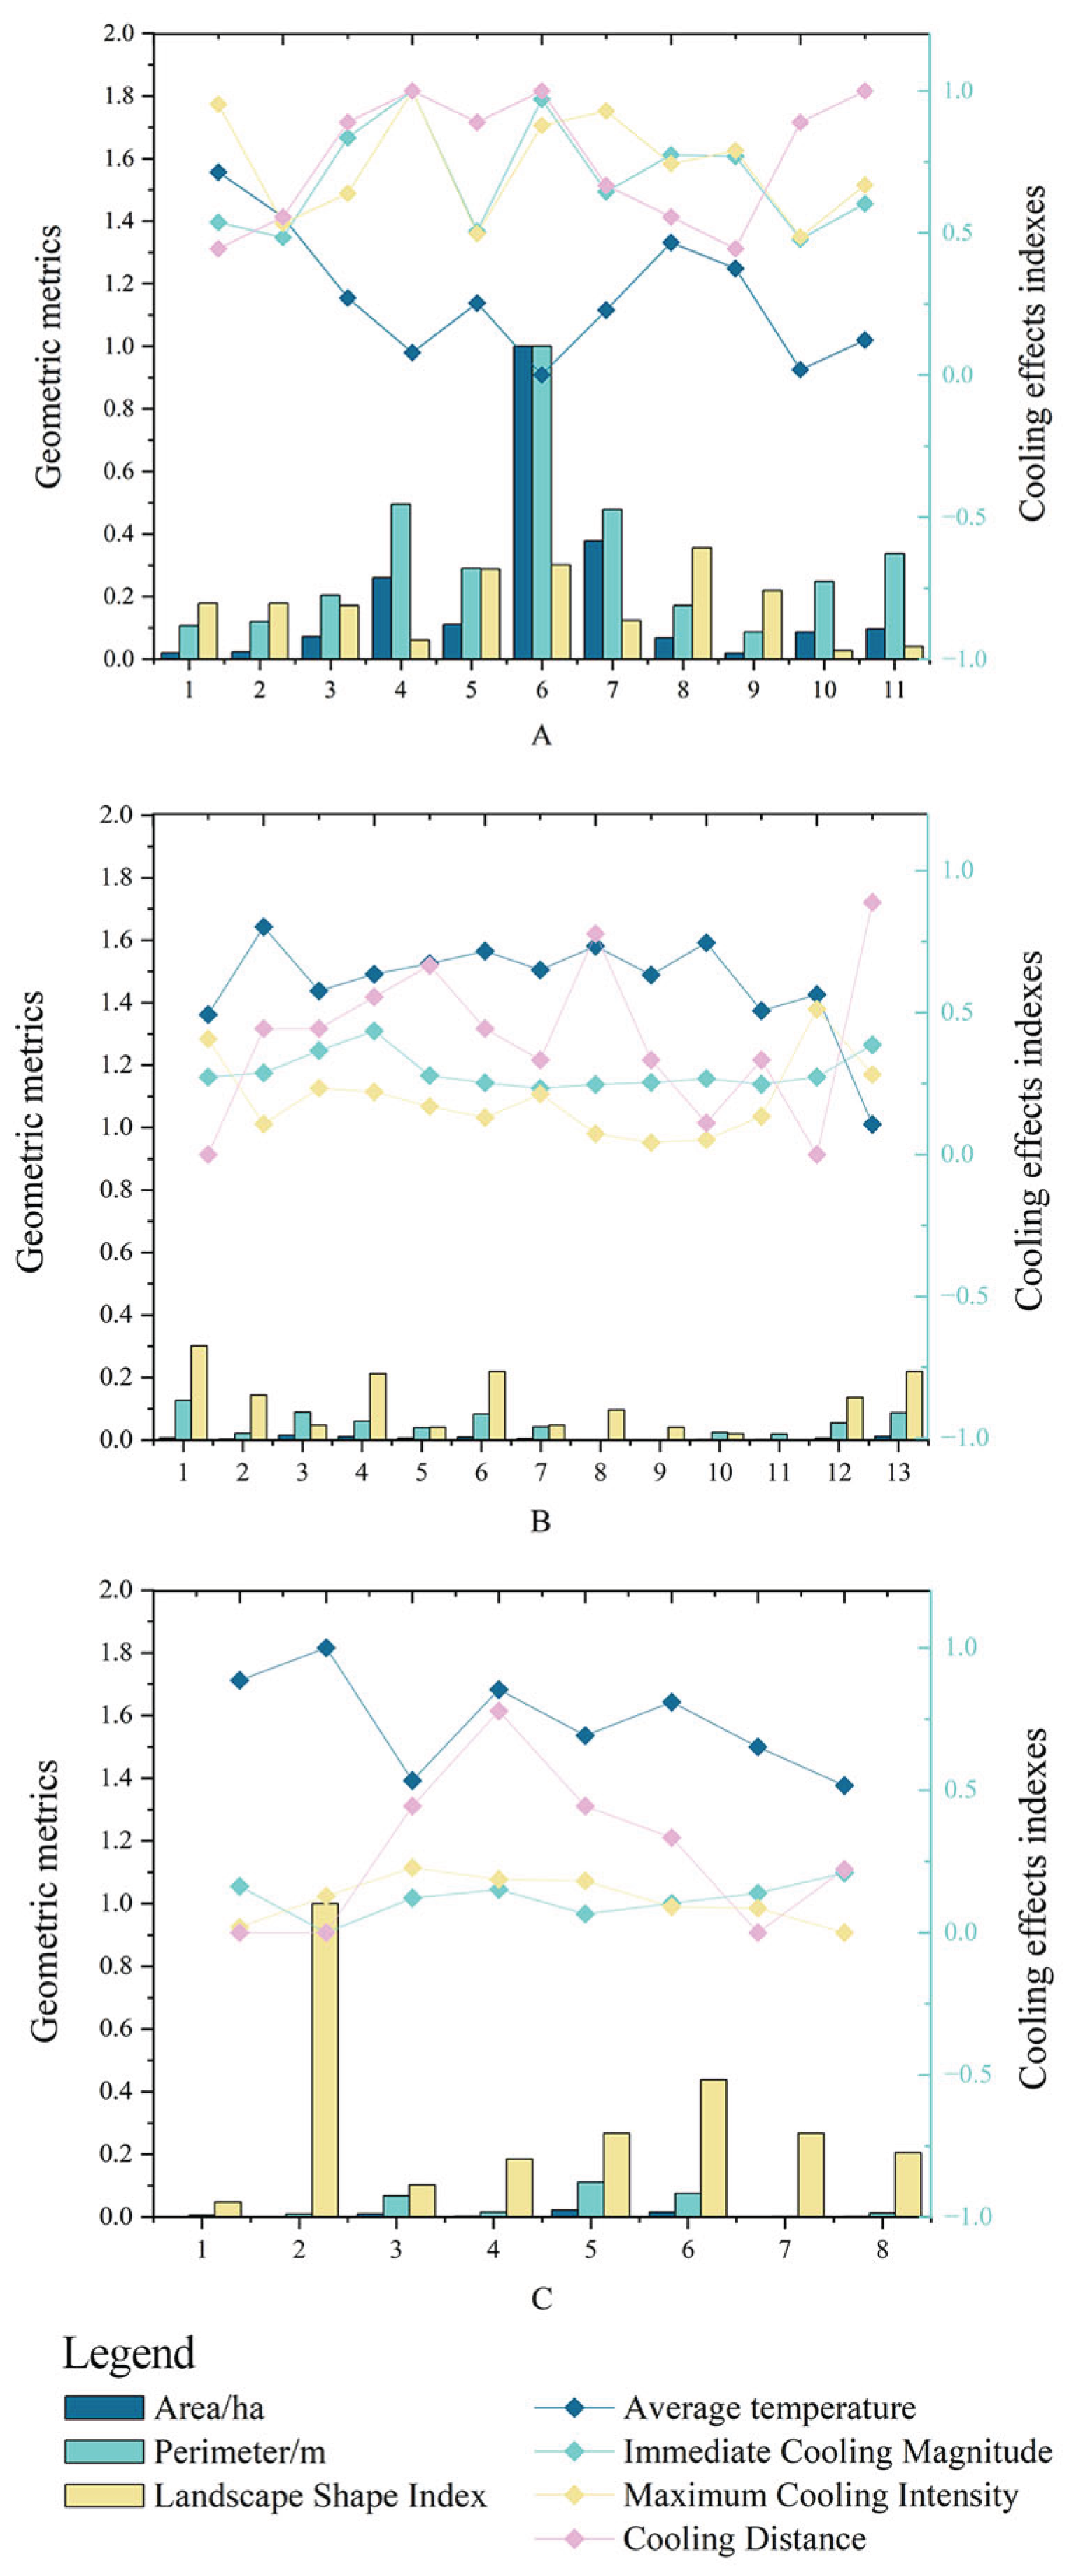
Table 1.
The classification of the MSPA and its definitions.
| Type | Definition | Ecological meaning |
|---|---|---|
| Core | A set of primitives whose foreground primitives are farther away from background primitives than a certain parameter of a specified size | Large natural patches, wildlife habitats, forest reserves, etc. |
| Islet | Patches that are not connected to any foreground area and whose area is smaller than the minimum value of the core area | Small, isolated, fragmented natural patches that are not connected to one another, often including small urban green spaces within built-up areas. |
| Perforation | Holes inside the center area, composed of background | Construction land within the core area that does not have ecological benefits. |
| Edge | Edges outside the foreground | The transition between the core area and the construction land has an edge effect. |
| Bridge | At least 2 points are connected to different core areas | The strips of ecological land connecting the core areas, i.e. the corridors in the regional green space, promote the migration of species, energy flow and network formation within the region. |
| Loop | At least 2 points are connected to the same core area | Ecological corridors connecting the same core area are small in scale and have low connectivity with surrounding natural patches. |
| Branch | Only one side is connected to the edge area, bridge area or loop area | Ecological patches that are only connected to one end of the core area have poor landscape connectivity. |
Table 3.
Significance of MSPA Elements and T's GWR Analysis.
| Classification | R2 | Adjusted R-Square | AICc | SSE |
|---|---|---|---|---|
| Type I | 0.43 | 0.29 | 120.66 | 65.00 |
| Type II | 0.45 | 0.35 | 132.65 | 106.01 |
| Type III | 0.39 | 0.34 | 102.85 | 45.57 |
1 Note: *p<0.05; **p<0.01.
Table 5.
The average value and name of various types of public parks reduce temperatures.
| Types | Amount | Average temperature (℃) | Coolong range (℃) | Maximum temperature difference (℃) | Cooling distance (m) |
|---|---|---|---|---|---|
| A | 11 | 35.94 | 1.94 | 8.16 | 234.55 |
| B | 13 | 38.83 | 0.26 | 2.75 | 140.77 |
| C | 8 | 40.09 | -0.48 | 1.91 | 105.00 |
1 Note: *p<0.05; **p<0.01.
Disclaimer/Publisher’s Note: The statements, opinions and data contained in all publications are solely those of the individual author(s) and contributor(s) and not of MDPI and/or the editor(s). MDPI and/or the editor(s) disclaim responsibility for any injury to people or property resulting from any ideas, methods, instructions or products referred to in the content. |
© 2025 by the authors. Licensee MDPI, Basel, Switzerland. This article is an open access article distributed under the terms and conditions of the Creative Commons Attribution (CC BY) license (http://creativecommons.org/licenses/by/4.0/).
Copyright: This open access article is published under a Creative Commons CC BY 4.0 license, which permit the free download, distribution, and reuse, provided that the author and preprint are cited in any reuse.


