
Submitted:
02 June 2025
Posted:
03 June 2025
You are already at the latest version
Abstract
The increasing urban populace has propelled densification to the forefront of urban development initiatives. It is imperative to establish an urban planning strategy that thoroughly comprehends the effects of densification across environmental, social, and economic dimensions at both the district and city levels. In Switzerland, densification represents a legally binding policy objective aimed at fostering housing and job opportunities within established urban boundaries. Nevertheless, the challenge arises in accommodating population growth while preserving a high quality of life. Zurich exemplifies this situation, necessitating the accommodation of approximately 25% of the anticipated increase in both the resident population and associated workplaces, as of 2016. This study aims to investigate redevelopment approaches for urban densification and transformation within the context of Zurich, specifically examining the Altstetten-Albisrieden district. It produces five densification scenarios grounded in existing urban development initiatives, such as building replacement and extension, and assesses their impacts on urban forms and outdoor thermal comfort within urban areas at the neighbourhood level. Tools, including QGIS, Urban Multi-scale Environmental Predictor (UMEP), and R, facilitated data analysis, visualisation, and evaluation for each densification scenario, thereby aiding in the identification of potential challenges and strategies. The study concludes that appropriate measures for densification can significantly contribute to the development of liveable cities. In this context, the thoughtful design of building geometries is of paramount importance, as these elements play a crucial role in enhancing outdoor thermal comfort at the neighbourhood level and improving overall outdoor thermal comfort.
Keywords:
Densification
; scenario analysis
; outdoor thermal comfort
; building geometry
; Altstet-ten-Albisrieden
; Zurich
1. Introduction
On March 3, 2013, a considerable majority of the Swiss electorate voted in favour of restricting the allocation of building land, thereby concluding the ongoing struggle over limited building areas. Consequently, the preservation of agricultural land and the natural landscapes of Switzerland took precedence over urban sprawl; henceforth, inward development within established city boundaries became a preferred approach in urban planning over the subsequent decades [1]. This shift facilitates the implementation of densification strategies as a legally binding policy, particularly within major cities and agglomerations such as Zurich. Conversely, as a city that has consistently been ranked among the top ten most livable cities in the world over the past five years, Zurich’s appeal in terms of high quality of life, ample job opportunities, and its beautiful natural environment results in a continual increase in population. A medium scenario of population growth conducted by the City of Zurich projected that by the end of 2040, the city will need to accommodate more than 515,000 residents, constituting approximately 25% of the population in 2016, which indicates a substantial increase in buildings and infrastructure necessary to accommodate and serve the additional populace. As urban areas become increasingly congested, it becomes challenging to maintain, if not enhance, the existing high quality of living conditions, which presents a significant concern for future urban planning and design focused on liveability and sustainability.
Urban densification has been identified as one of the primary contributors to the urban heat island (UHI) effect, influencing the microclimate and thermal comfort within urban areas [2,3]. The reduction of natural land surfaces, including green spaces, resulting from the expansion of building footprints and the prevalence of impermeable surfaces is correlated with an increase in land surface temperatures and a decline in thermal comfort [4,5]. The escalation of land-surface roughness due to greater building densities impedes wind flow, reduces overall wind speeds at the pedestrian level, and contributes to the entrapment of heat radiation [6,7,8]. Additionally, anthropogenic emissions from transportation, building mechanical systems, and human metabolic heat exacerbate the accumulation of heat in urban areas [9,10,11,12,13]. In Zurich, the phenomenon of the urban heat island effect has been documented since 1984, when Heinz Wanner and Jacques-André Hertig reported a heat island intensity of 5-7 °C concerning air temperature in the city [14]. The notable disparities when compared to rural regions illustrate the substantial impacts of urban development on the microclimate. This urban-rural differential observed over the past decade differentiates Zurich from other Swiss cities, despite exhibiting a comparable diel variation to other locales [15]. Since the year 2000, there has been a significant increase in the frequency of years with more than 15 tropical nights (defined as minimum temperatures exceeding 20 °C) recorded in Zurich's urban areas [16]. Furthermore, forecasts based on Swiss national climate scenarios CH2011 [17] and CH2018 [18] confirm a trend towards a warmer future, with an anticipated increase in annual mean temperatures ranging from approximately 0.6 to 1.9 °C. In accordance with population growth trends, it is anticipated that an increasing number of individuals will be subjected to more frequent and intensified extreme heat events, resulting in heightened levels of heat stress [19]. This underscores the necessity of considering urban microclimate and thermal comfort in the planning of urban densification and redevelopment initiatives, as well as in the pursuit of effective strategies to mitigate potential urban heat [20].
Recent studies addressing the UHI effect and urban microclimate have illuminated the intricate relationships among urban forms, local climate, and thermal comfort. Factors pertaining to urban development, including impervious surfaces, building footprint ground coverage, building heights, the floor area ratio of buildings, and the street canyon ratio—which compares street width to the height of neighboring structures—have been demonstrated to exert significant influence on urban temperature [2,21,22,23]. However, these factors manifest distinct behaviours, resulting in diverse and multifaceted outcomes [2,3,22,23,24]. A greater fraction of building surface area on the ground, coupled with increased horizontal compactness achieved through the reduction of street canyon widths, can contribute to a pronounced warming effect [22,25]. While tall buildings can create shade over adjacent surfaces and structures, thereby reducing direct solar radiation, an increase in building height can lower temperatures and assist in mitigating the UHI effect [2,3,21,25]. However, this benefit may diminish when the overall building height exceeds 40 meters, and could potentially transition to a negative impact when surpassing 60 meters [22]. Furthermore, variations in the effect may occur between daytime and nighttime periods [26]. The building floor area ratio (FAR), as a parameter regulating building density, in conjunction with the building coverage ratio and the height of buildings, influences outdoor thermal comfort. The research by Widiyannita et al. indicated that, under a constant building coverage ratio, a larger FAR is associated with heightened air temperature and mean radiant temperature, similar to scenarios where the building coverage ratio fluctuates with a fixed FAR [27]. Wang et al. identified a pivotal inflection point at 1.5 within the correlation between FAR and the increase in land surface temperature, wherein the positive correlation becomes negative as the floor area ratio exceeds 1.5 [22]. Additionally, the size and configuration of a city also influence UHI intensity. Zhou et al. emphasised the preeminent effect of city size among various urban factors after analysing over 5,000 European urban agglomerations, with fractality and anisometry exerting comparatively weaker impacts [23]. Despite the intricate and complex interrelations among building geometries and urban factors, their findings suggest the feasibility of employing a judicious combination of these elements to minimise the UHI effect and alleviate heat stress amidst processes of urbanisation and densification.
Indeed, significant efforts have been made over the past decade. Figure 1 above illustrates the changes in the cumulative building floor areas and green spaces at five-year intervals since the last century in the districts of Altstetten and Albisrieden, Zurich. The variation ratio, which is defined as the quotient between the increase in building floor areas and the decrease in green spaces, signifies the average efficiency of augmenting floor areas at the expense of diminishing green spaces. The abrupt increase in total building floor areas, along with the variation ratio from 2.6 to 4.0 since 2011, suggests the emergence of new building typologies and geometries that exhibit significantly higher efficiency compared to conventional building types. These changes have been implemented in response to the spatial demands resulting from population growth, while simultaneously mitigating the loss of green spaces. Can these promising building typologies and geometries also enhance thermal comfort and microclimate conditions within the district?
As part of the research project, Dense and Green Cities at the Future Cities Laboratory Global, which focuses on exploring strategies and approaches for urban densification and transformation in Zurich, this study intends to respond to the challenge posed by population growth, inward spatial intensification within the existing city boundaries, and the need for thermal comfort and microclimate management in urban areas. Through a scenario-based analysis of a real case, specifically the district of Altstetten-Albisrieden in Zurich, the study aims to investigate the potential impacts of densification from the perspectives of urban form and microclimate, applying various redevelopment measures and advantageous building geometries to accommodate the anticipated population increase aligned with projected city growth. This endeavour seeks to contribute strategic suggestions and recommendations for climate-adapted urban densification and transformation.
In the subsequent sections, this paper delineates the methodological framework and specific methods and approaches employed to generate densification scenarios, identify urban redevelopment opportunities, and select building geometries for scenario modelling. By utilising the Urban Multi-scale Environmental Predictor (UMEP) to simulate outdoor thermal comfort in the designated subsite area and the Physiological Equivalent Temperature (PET) at selected Points of Interest (POIs) within each densification scenario, the paper provides insights and recommendations regarding densification within the examined area. Finally, it concludes with an examination of the study's limitations and suggestions for future development.
2. Methods
2.1. Methodologies and Framework
With the primary objective of exploring the influence of various urban densification methodologies on existing urban areas and their impact on outdoor thermal comfort within the urban climate of neighbourhoods in Zurich through designated building geometries, this study comprises two integral components, as illustrated in Figure 2.
The initial component examined urban densification within the selected district by addressing the following inquiries:
- Question 1: To what extent must building floor areas be increased to accommodate the anticipated population growth in the selected district?
- Question 2: In which locations should these building floor areas be expanded?
- Question 3: What methods of densification can be employed to facilitate the enhancement of building floor areas?
Question 1 delineated the overarching demands for densification in response to population growth forecasts provided by the City of Zurich for the year 2040. Question 2 investigated potential land parcels for densification in the district by quantifying permissible building floor areas and their prospective expansion as delineated by the latest Building and Zoning Plan 2016 (BZO2016). Question 3 analysed the prevailing means of densification and sought to identify exemplary building geometries for densification scenarios, which were utilised to generate such scenarios across the entire studied district and to establish scenario models at the neighbourhood scale for conducting microclimate simulation analyses in a selected subsite area.
The second component focused on simulating the microclimate within the specified subsite case under the designated scenarios. The objective of this segment was to address the inquiry of Question 4: How would densification affect the microclimate when employing various densification methods and different exemplary building geometries? This analysis revealed the implications of urban densification on the microclimate through diverse approaches.
By synthesising the responses to the aforementioned inquiries, this study ultimately concludes with an assessment of the potential for densification and the associated challenges within the district, in addition to recommendations for the design of building typologies that can enhance microclimate and outdoor thermal comfort amidst urban densification.
2.2. Study Area
The study selected the Altstetten-Albisrieden district of Zurich as the specific case for investigating strategies and approaches to urban densification and transformation, grounded on two principal factors.
As a highly developed city, Zurich presents a scarcity of extensive areas that can facilitate new development to accommodate population growth within the predefined urban boundaries. The primary challenge pertains to existing quartiers. The most recent city plan emphasises the development of the northern and western regions, particularly the Seebach, Oerlikon, and Schwamendingen quartiers to the north, as well as the Altstetten and Albisrieden quartiers to the west [28]. These districts are well-connected and supported by robust public transportation and infrastructure networks. Their comparatively low building density indicates considerable potential for the creation of new public spaces, the enhancement of public utilities and facilities, and the optimisation of energy consumption through the transformation of the urban fabric towards higher density.
Located to the west of Zurich, Altstetten-Albisrieden spans from the Limmat River in the north to the foothills of Uetliberg in the south, encompassing an area of 12.1 square kilometers (Figure 3). Its topography exhibits a diversity of landscapes and encapsulates a majority of the features typical of the entire city. As one of the earliest incorporated communities, Altstetten-Albisrieden retains various buildings and urban forms from different periods of urbanisation, offering opportunities to explore future densification under varied circumstances. According to the latest community survey conducted by the City of Zurich, the district accommodates approximately 58,517 inhabitants and provides a total of 59,149 employment opportunities [29,30].
2.3. Data
2.3.1. Geographic Data and Building Information
The study acquired zoning plans, geo-information of land parcels, as well as two- and three-dimensional building data from the open-access resources of the City of Zurich in the year 2021. This data concerning buildings and land parcels includes extensive information such as geometric outlines and heights of buildings, the year of initial development and subsequent redevelopment, functional categories, designated land use types, and the permitted intensity of development as stipulated by the zoning plans, in addition to the geometries of the land parcels. Subsequently, this information was updated and merged with supplementary data regarding the number of households and job positions linked to each structure, which was sourced from the City of Zurich in 2023. When combined with zoning plans and land parcel information, buildings that did not correspond with matched land parcels were excluded from the calculations and ensuing scenario analyses and simulations.
2.3.2. Meteorological Information
This study utilised meteorological information formatted in Energy-Plus Weather (EPW) acquired from the Ladybug Tools website [31], which was retrieved from the Repository of Building Simulation Climate Data [32]. This dataset encompasses a year’s worth of hourly measurements, including air temperature, solar radiation, wind speed, humidity, atmospheric pressure, and precipitation. In order to model the urban climate of Altstetten, Zurich, the study selected the meteorological data from the Affoltern Zurich station, situated approximately 4.5 km north of Altstetten, employing the period from July 6th to July 12th to represent the extreme days characterised by the highest temperatures during the summer in Zurich.
2.4. Premises of Densification Calculation and Scenario Analysis
This study was conducted utilising two foundational premises to perform calculations related to densification and to translate population growth into required building density.
The primary premise is to regard the average living area as 45 m² per individual, while the average workplace area is established at 40 m² per position in the assessment of densification scenarios. These parameters have been proposed by the City of Zurich [28]. The Federal Statistical Office has determined that the average residential floor space per inhabitant in Zurich stands at 45 m² as of the conclusion of 2023 [33]. Furthermore, calculations derived from data presented in the Quartier analysis indicate that, within the regions of Altstetten and Albisrieden, the average living space per occupant measures 47 m². Additionally, the utilised floor area per job position varies between 30 and 95 m² across diverse zones.
The second premise involves considering a duration of fifty years as a significant parameter for the categorisation of buildings. This assertion is based on two principal facts. The first fact indicates that the average lifespan of existing buildings in Altstetten and Albisrieden, excluding annexed buildings utilised for storage or other temporary uses, is approximately 46 years, according to a preliminary study of the buildings in the area. The second fact relates to the advisory on building renovation, which suggests that when buildings exceed fifty years of age, it is advisable to consider replacing them with new constructions. This recommendation is based on factors concerning the structural integrity of the buildings, their market potential, and the enhancement of land use [34,35]. Consequently, all buildings have been classified into three distinct categories:
- Recent Buildings: structures that are less than fifty years old;
- Rebuildable Buildings: structures that are over fifty years old but less than one hundred years old, specifically those constructed or redeveloped between the years 1925 and 1975;
- Remarkable Buildings: structures that have been preserved for over one hundred years, possess significant historical value, and have not undergone redevelopment since 1925.
In accordance with these three building categories, the land parcels were also classified into four groups regarding the development year of the majority of the buildings within the parcels.
- Recent Developments: primarily built after 1975;
- Rebuildable Developments: constructed or redeveloped between the years 1925 and 1975;
- Remarkable Developments: primarily featuring buildings constructed before 1925 without any modifications in the last one hundred years; and
- Unbuildable Parcels: Designated as reserved green and open space without development.
2.5. Approaches and Methods For Densification Scenarios
2.5.1. Calculating the Demands of Population Growth
This study conducted an evaluation of the expansion of the resident population using the projected population growth data provided by the City of Zurich. Two demographic groups, which represent the population projection for both the entire city and the specific district being examined, were utilised as benchmarks to calculate the growth within the designated Altstetten-Albisrieden District (Table 1).
Given the lack of existing scenarios for job position development in the City of Zurich, this study utilised the correlations between the number of job positions and the resident population of the entire district during the years 2015, 2020, 2022, and 2024 as references to estimate the future number of job positions in accordance with the projected resident population by 2040 (Table 2, Figure 4). The figures for both job positions and the resident population were obtained from the published Quartierspiegel by the City of Zurich [29,30,36,37,38,39,40,41].

Table 1.
Current inhabitant population and the estimated population in Zurich and Altstetten-Albisrieden, respectively [42].
Table 1.
Current inhabitant population and the estimated population in Zurich and Altstetten-Albisrieden, respectively [42].
| Inhabitant population in 2022 | Estimated population in 2040 | Growth ratio | |
|---|---|---|---|
| Zurich | 443,037 | 515,250 | 16.3% |
| Altstetten-Albisrieden | 58,517 | 68,100 | 16.4% |
| Growth ratio used in this study | 16.4% | ||
By combining the defined average living area per resident, set at 45 m², with the average workplace area per job position, calculated at 40 m², this study illustrates the growth of the resident population alongside the corresponding increase in job positions, translating these factors into an expansion of building floor areas.
2.5.2. Calculating Permitted Building Floor Areas by BZO2016
This study employed QGIS software (version 3. 3.40.1. 1, Bratislava) to calculate the permissible floor areas for buildings based on BZO 2016. It extracted relevant geoinformation and data from the open- source resources of the City of Zurich, which included: 1) Zones of parcels, detailing the allowed utilisation ratio, building height, number of floors, residential ratio, and the coverage of open green spaces at ground level; 2) Land parcels, encompassing geometric dimensions and associated zones; and 3) Existing buildings, comprising the building footprint, heights, number of floors, functional classifications, and years of construction or renovation.
The zoning plans employ the building utilisation ratio (UR) as a parameter for regulating the intensity of land parcel development, measuring the habitable floor areas of a building while excluding auxiliary structures or outbuildings, such as basements, storage areas, and garages. In contrast to the building floor area ratio (FAR), which measures the gross built areas of a structure, this study utilised the utilisation floor area and UR throughout the analysis, focusing solely on the habitable floor areas of buildings above ground level and excluding auxiliary structures and outbuildings. The count of building floors was determined based on the height of each building as provided by the City of Zurich, corroborated through Google Earth and onsite observations. Consequently, 2,2894 land parcels were involved in this study.
Subsequently, categories organised by the year of construction or reconstruction were incorporated into the calculations to exclude parcels that remained in good condition and did not necessitate demolition for redevelopment purposes. The average living area per resident, along with the average workspace allocated per job position, was ultimately utilised to ascertain whether the expansion of permitted built floor areas could sufficiently accommodate the anticipated increase in resident population and job positions.
Due to the absence of precise information concerning the usage of buildings, this study evaluated the comprehensive capacity of BZO2016 from three distinct perspectives, as represented in the flowchart of Figure 5. This evaluation involved analysing land parcels in accordance with their primary development periods and the varying development intensity associated with BZO2016. The first aspect assessed the overall permissible utilisation floor areas for each land parcel within the district, considering zoning classifications, geometric dimensions of the parcels, and the maximum allowable UR. This analysis clarified a scenario in which the entirety of the district, if developed according to the specifications of BZO2016, could theoretically support a predetermined quantity of habitable floor areas. Recognising that numerous structures and developments in the region predate existing city plans or regulations, the second aspect examined the extent to which habitable floor areas could be increased while preserving the integrity of extant buildings. This evaluation contrasted the current habitable floor areas with the allowable limits for each parcel and aggregated the discrepancies to determine the maximum UR outlined in BZO2016, thereby indicating the theoretical potential for densifying the buildings within the district. The third calculation evaluated the scenario in which only the parcels developed between 1925 and 1975 were redeveloped to comply with the UR limits specified by BZO2016.
2.5.3. Identifying Densification and Urban Redevelopment Means
Coordinate the advocacy for the principle of “no net land take in cities and commuting zones in Europe," as proposed by the Europe Committee [43], to safeguard agricultural production, ecosystems, and natural landscapes. Densification has emerged as a viable solution in numerous regions. Two forms of densification have been identified across various scales and locations: soft densification and hard densification [44].
Soft densification refers to the process of intensifying or repurposing existing buildings to accommodate specific needs, such as transforming office buildings into residential apartments or subdividing single-family homes into multiple units [45]. This approach, which does not radically alter the prevailing urban forms while accommodating population growth from a bottom-up perspective, has a limited impact on microclimatic conditions [44,46]. In contrast, hard densification typically involves the expansion of built-up areas through new constructions, including the redevelopment of existing urban structures, land parcels, or previously developed brownfield sites. This may entail the introduction of new buildings within the urban fabric or the addition of further floors to existing structures [44,45,47]. The direct consequences of hard densification on the urban fabric significantly influence both spatial arrangements and environmental conditions.
This study concentrated on the interrelationship between building geometries and the enhancement of outdoor thermal comfort within the context of urban densification. Consequently, only hard densification was considered in the development of scenarios for subsequent simulation.
A preliminary survey of building redevelopment in the Altstetten-Albisrieden district over the past two decades has documented the processes of intensified densification primarily through three approaches: completed land redevelopment, building replacement, and the addition of floors to existing structures. Notable examples include the Sonnengarten Cooperative Residence, which underwent redevelopment from the original three-floor settlement into a cooperative development; the Luggwegstrasse Residence, where portions of the low-rise housing were transformed into a more compact cooperative living program; and the Marktgasse within Freilager Albisrieden, where two three-floor warehouse blocks were preserved and expanded into a six-floor multi-use building, as shown in Figure 6.
In alignment with the three previously mentioned building categories, the respective means of densification can be articulated as follows:
- Recent Buildings and Developments: Considering the addition of floors to the existing structure as the primary measure;
- Rebuildable Buildings and Developments: Considering building replacement as the principal densification strategy;
- Remarkable Buildings: Preserving the building structure without alteration or densification.
2.5.4. Generating Densification Scenarios over Altstetten-Albisrieden
According to the calculated results regarding the permissible building floor areas and their discrepancies with the current conditions in each parcel, in addition to the classifications of buildings and developments along with the means of redevelopment, this study has generated densification scenarios for the analysed district. Parameters such as total floor area, the number of building floors, average UR, building footprint, and ground-level open green space were utilised to illustrate the spatial variation in urban form across the scenarios and to investigate the challenges associated with intensifying land parcel usage.
Given that this study concentrated on an analysis of densification and its implications at both the neighbourhood and district levels, as well as the substantial number of parcels involved, it did not provide detailed design specifications for all parcels in terms of the surface fractions relating to building footprints, green spaces, or paved surfaces at ground level. As a result, the green spaces were estimated based on the minimum green surface coverage requirements outlined in BZO2016, which is mandated for all developments.
2.6. Evaluating densification impacts on microclimate in the urban environment
2.6.1. Subsite area for densification modelling and simulation
This study selected the central area of the district as a subsite case in order to evaluate the influence of densification on outdoor thermal comfort within the context of urban climate. The subsite, as depicted in Figure 7, is bordered by the main streets of the district and encompasses an area of 21 hectares. It includes 176 land parcels and over 250,000 m² of built floor area, the majority of which is designated for residential use (Table 3). Due to its advantageous connections to both the local railway station and the cultural centre of Altstetten, this site hosts several shopping centres along the streets. The table below outlines the current development status and composition of the site. The BZO2016 permits the construction of five-story and six-story residential and commercial buildings on the site.
2.6.2. Determining Potential Building Geometries for Densification Scenarios
Recognising the critical importance of providing substantial green spaces for daily use, which can enhance living conditions by mitigating urban heat islands during urban development and densification processes, as well as acknowledging the inverse relationship between increasing building density and reducing green surface area on the ground, this study incorporated the UR- representing the development intensity of land parcels- with green surface coverage (GsPR), which indicates the availability of green spaces within these parcels, to identify favourable building geometries among existing developments in the district. Three key premises were examined: 1) In light of the objective to increase building floor areas to accommodate a greater number of residents and job positions in the district, future developments must be constructed at a density exceeding the current average; 2) To achieve a balance with the increasing building density, it is essential to allocate more green spaces than the current average in the new developments; and 3) In alignment with the understanding of the urban development trend towards more efficient spatial planning over the last few decades discussed in the preceding section, the building geometries should emerge in the recent developments from the last ten to fifteen years. Consequently, the mean values of the UR per parcel (UR=0.99) and GsPR per parcel (GsPR=0.58) were utilised as thresholds, as depicted in the figure below. Approximately 200 developments were filtered, culminating in the selection of three exemplary building geometries within the existing developments (Figure 8). These selected projects serve functions such as multi-family residences and cooperative residences, incorporating two primary building types: tower blocks and courtyard blocks, which were employed as the main types in the subsequent densification scenario modelling for microclimate analysis.
To enhance the comparability among all scenarios, this study endeavoured to minimise the modification of building geometries within each scenario. Minor adjustments were made to specific buildings to comply with the particular conditions of land parcels and the regulations concerning building volumes and their relationships with surrounding settings, such as the setback distance from streets, the minimum distances between buildings, and the minimum green surfaces, as delineated by the BZO2016.
2.6.3. Urban Multi-Scale Environmental Predictor (UMEP)
This study employed a city-based climate service plug-in, the Urban Multi-scale Environmental Predictor (UMEP, version 4.1.1), within QGIS to analyse the outdoor thermal comfort associated with densification scenarios. UMEP has been developed as a community-driven, open-source, and integrated tool for urban climatology and climate-sensitive planning applications, applicable at micro, local, and city scales [48].
The primary focus of the study was the utilisation of the Solar and Longwave Environmental Irradiance Geometry model (SOLWEIG, version 2022a) to estimate the spatial variations impacting 3D radiation fluxes and the mean radiant temperature across diverse urban configurations in the densification scenarios. The simulation incorporated three categories of data: 1) meteorological data, which included incoming long- and short- wave radiation, wind speed and direction, air temperature, humidity, and barometric pressure; 2) geo-information pertaining to buildings, which encompassed building geometries and heights; and 3) digital models representing ground elevation and land cover schemes in raster format. The outcomes of SOLWEIG, following the post-analysis process, comprised two components. It delineates the variations in mean radiant temperature (Tmrt) during daytime, nighttime, and across the diel period within the subsite area of all scenarios.
To further elucidate the heat stress impacts on the site and its variations in accordance with different densification methods and changes in building geometries within the urban context, this study identified thirteen points of interest (POIs) for estimating the physiological equivalent temperature (PET) over a 24-hour period. Among all POIs, six (OpenSpace 1-6) were located in open spaces of specific land parcels, while the remaining seven (Street 1-7) were situated along the main streets of the area. All POIs were positioned within an area either surrounded by or in proximity to rebuildable developments, where building geometries exhibited the most variability across all densification scenarios (Figure 7).
To underscore the impact of various densification strategies and building geometries on outdoor thermal comfort and urban climate, this study streamlined the model workflows by employing the default environmental parameters provided by the program, including the emissivity and albedo of both walls and ground, while excluding urban vegetation, such as trees, green surfaces, and other urban features.
3. Results
3.1. Upgraded Zoning Plan from BZO99 to BZO2016
In an effort to support the structural development of the city while concurrently addressing the anticipated need for increased residential density that safeguards the quality of living, the City of Zurich revised the Building and Zoning Plan in November 2016, referred to as BZO2016, from its previous version known as BZO99, illustrated in Figure 9. This revision is particularly apparent in the Altstetten-Albisrieden district, where, with the exception of the Two-Floor Residential Zone bII (W2 bII), all other residential zones have been elevated by one level, thereby allowing for an additional full floor. Moreover, the original zoning plan's two industrial zones were subdivided into three distinct zones (i.e., IG I, IG II, and IG III), each characterised by differing utilisation ratios for land development intensity. Additionally, modifications were made to certain green spaces across various open space categories; nevertheless, the primary objective of minimising construction within such areas when necessary remained intact unchanged.
Table 4 provides a summary of the current population and job positions, in addition to the anticipated population growth and the corresponding requirement for expanded floor areas to accommodate this change. Table 5 presents the existing and permissible floor areas across three categories of parcels within the district. The results calculated from the three aspects outlined in Section 2.5.2, as depicted in Table 6, indicate that, when utilising the provided average living area (45 m²) and working area (40 m²), BZO2016 theoretically possesses the capability to sustain the anticipated population increase. Upon the full development of the district, in accordance with BZO2016, the permissible floor area surpassed the total expected floor area by over 100,000 m². In order to achieve the maximum floor area without modifying existing structures, the permissible increase in floor area exceeded the necessary expansion by more than 600,000 m². When translating the permissible floor areas into the number of residents and job positions within each land parcel, the permissible floor areas cited by BZO2016 are adequate for the projected population growth by the year 2040. Nevertheless, when considering the ages of the buildings, simply redeveloping the land parcels constructed between 1925 and 1975 to the maximum floor areas specified by BZO2016 will not meet the demand for increased building space, resulting in an approximate shortfall of 44%.
The results indicated, on average, that an approximate 27% increase in the designated utilisation ratio for BZO2016 is necessary when redeveloping parcels that are over fifty years old. This extension of the utilisation ratio reflects the latest building densification distribution outlined in the Municipal Master Plan for Settlements, Landscape, Public Buildings, and Facilities [28]. Furthermore, an additional solution involves the engagement of land parcels developed post-1975, which, according to BZO2016, have not been utilised intensively enough and still possess the capacity to increase by over 1,000,000 m² of floor area. To satisfy the demands for densification, it is essential that buildings on these parcels incorporate at least one additional floor onto the existing structures.
3.2. Densification Scenarios and Their Impacts on Urban Form
In accordance with the previously mentioned results, this study generated five densification scenarios to examine the impact of urban densification on existing urban forms. This analysis combined existing densification strategies, such as building replacement and the addition of floors to existing structures, as summarised in Table 7.
- Scenario 1 (SN1): This scenario involved the redevelopment of all parcels by replacing all buildings to achieve the maximum utilisation ratios defined by BZO2016. The building typologies specified in Section 2.5.4 were utilised to model the complete redevelopment in compliance with the regulations of BZO 2016.
- Scenario 2 (SN2): This scenario investigated the addition of one floor to all existing buildings to satisfy the demand for increased population density, excluding notable buildings constructed prior to 1925 and those within zones where densification is prohibited (Zone K).
- Scenario 3 (SN3): This scenario modelled the maximisation of building density permitted by BZO 2016. It preserved parcels containing notable buildings while densifying parcels that have not yet reached the limits of BZO2016 within the remaining land parcels. Parcels constructed between 1925 and 1975 were replaced by the designated building typologies, while additional floors were added to existing structures in parcels built after 1975.
- Scenario 4 (SN4): This scenario evaluated the moderate redevelopment of parcels containing buildings constructed after 1925. It redeveloped parcels built between 1927 and 1975 in accordance with the restrictions of BZO2016 and added floors to buildings erected after 1975 to meet the requirements arising from population growth.
- Scenario 5 (SN5): This scenario focused on densification solely within parcels built between 1925 and 1975. Buildings within these parcels were replaced by new developments, resulting in a 27% increase in the utilisation ratio as defined by BZO2016. All other buildings remained unchanged in accordance with the current situation.
The comprehensive calculation results of each scenario, concerning overall floor areas, average UR, maximum building footprints, and minimum open and green surface areas in accordance with the building regulations outlined in BZO2016, are summarised in Table 8. Generally, excluding the changes to supporting facilities attributable to population growth and building densification, such as car parking areas and paved pathways, a complete redevelopment of the district (SN1) exhibited the most significant impact on urban form. This scenario had the potential to increase building footprints while simultaneously decreasing open and green surfaces on the ground; however, its average UR was strictly regulated by BZO2016, resulting in it being the lowest among all scenarios. Scenario SN2, which involves the addition of one additional floor to all existing structures constructed after 1925, indicates the potential for maximising building floor areas without modifying ground footprint coverage, while achieving the highest increase in average UR among all scenarios. In instances where only parcels developed after 1925 are considered for densification, scenario SN4 presents the capacity to offer greater building floor areas with reduced building footprints compared to scenarios SN3 and SN5, ultimately resulting in a comparatively lower average UR.
Figure 10 illustrates the variation in the UR of each parcel across all scenarios. The gradient colours, transitioning from blue to red, denote the development intensity of parcels in each scenario, which shifted from significantly reduced to markedly increased when compared to the current situation. Scenario SN1 emphasises the influence of the BZO2016 in containing and regulating development intensity throughout the district, where the majority of residential areas experienced densification, resulting in an average increase of 0.30 in the UR. Conversely, certain parcels located near infrastructure and within industrial zones were regulated to decrease existing building intensity, approximately 1.20 in the UR. Leveraging the advantage of not expanding the building footprint on the ground, scenario SN2 resulted in an average increase of 0.30 in the UR across the district. Due to the dimensions of the existing buildings, the increase in the UR exceeded 0.65 in some parcels adjacent to infrastructure and industrial regions. Involving parcels that either have not reached the limits defined by the BZO2016 or are older than fifty years in the densification process, scenarios SN3 and SN4 achieved average increases of 0.43 and 0.35 in the UR across all involved parcels, respectively. Scenario SN5 presented a contrasting situation to scenario SN2, focusing on the densification processes solely within parcels over fifty years old, which resulted in a 0.52 increase in the UR for the redeveloped parcels. When balancing the changes in building footprints on the ground, the increase in building floor areas, and the average UR across the district, scenario SN4 distinguished itself among all scenarios due to its second-highest increment in total floor areas, yet with a comparatively lower overall UR.
This study subsequently employed the two exemplary building geometries defined in Section 2.6.2, specifically the tower block and the courtyard block, to delineate the densification scenarios and create building models for evaluating the impacts on outdoor thermal comfort. Consequently, the five densification scenarios were expanded to ten with varied building geometries; the results pertaining to urban factors are presented in Table 9.
Due to the composition of the three types of parcels in the area, the primary urban factors delineate a slightly different situation among the scenarios. In alignment with the overall district situation, scenario SN2 demonstrated its capability of providing the most significant increment of floor areas among all scenarios, accompanied by the highest rise in the average utilisation ratio. Except for scenario SN2, all remaining scenarios exhibited a reduction in building fraction on the ground, particularly in both sub-scenarios of SN1, SN1A and SN1B, which showed an approximate 5-7% decrease in ground coverage. This suggests the potential for the introduction of extensive open green space when undertaking a comprehensive redevelopment of the area with due regard to the BZO2016. However, buildings in both scenarios were taller than those in the other scenarios. Among the sub-scenarios of partial redevelopment, SN3A provided the most floor areas, followed by SN5B; the realisation of both was achieved at the expense of a substantial increase in the utilisation ratio. The advantages of SN4 became less clear in both SN4A and SN4B, where the increase in floor areas was not as substantial as in the other scenarios, despite its lowest utilisation ratio and ground coverage.
3.3. Impacts on the Simulated Outdoor Thermal Comfort
3.3.1. Mean Radiant Temperature Over the Subsite Area
The results from the SOLWEIG simulation underscored the variations in temperatures (Tmrt) observed during both daytime and nighttime, as well as the diurnal average temperature (Figure 11) across the subsite area in all scenarios, as delineated in Table 10. During the daytime, all scenarios generally exhibited slightly lower temperatures than the current situation, with the exceptions of scenarios SN1B and SN4B; the observed discrepancies remained within a range of 0.01°C to 0.6°C. A noteworthy increase in the average temperature was recorded in scenario SN1B, peaking at 37.103°C, wherein the estimated maximum and minimum temperatures also exceeded those of the current situation. Conversely, during nighttime, scenario SN1B demonstrated a marked cooling effect, with an average temperature of approximately 14.026°C, resulting in a decrease of the maximum temperature by approximately 1.06°C. The nighttime average temperatures for scenarios SN1A and SN4B were also marginally lower, while the remaining scenarios reported higher average temperatures, ranging from 14.678°C to 15.030°C. In terms of diurnal average temperature, scenario SN1B achieved the highest temperature at 28.449°C. Furthermore, all scenarios employing the tower block as the redeveloped building geometry (SN1B, SN3B, SN4B, and SN5B) exhibited slightly elevated temperatures compared to those scenarios utilising the courtyard building geometry (SN1A, SN3A, SN4A, and SN5A).
The variations in the simulated average temperatures for daytime, nighttime, and diel across all scenarios are illustrated in the temperature density profiles presented in Figure 12. With the exception of minor discrepancies in the distribution of temperature values, the majority of scenarios exhibited comparable patterns in their temperature density profiles. Notably, scenario SN1B demonstrated distinct profile patterns across all three comparative diagrams: a pronounced increase in value density at elevated temperatures during both diurnal and daytime average temperatures, alongside a marked rise in density at lower temperature values during nighttime. These distinctions suggest that an increased number of areas within the subsite case are projected to experience higher temperatures during the daytime, while a greater number of areas are anticipated to exhibit lower temperatures at night in scenario SN1B.
3.3.2. Physiological Equivalent Temperature at POIs
The impacts of all densification scenarios on outdoor heat stress are depicted in Figure 13. This figure provides an overall mean of the predicted Physiological Equivalent Temperature (PET) throughout the day, summarising the temperature fluctuations at thirteen points of interest (POIs) within the subsite area, in addition to detailed PET variations over a 24-hour period for each POI by scenario. The overall average PET observed throughout the day across all POIs indicated that the majority of discrepancies emerged during daytime hours, while minimal variations in temperature were recorded during the nighttime hours. The highest PET, surpassing 36 °C, was documented at 1:00 PM under both the current conditions and the scenarios SN3A, SN3B, and SN5B. Regarding the disparities in average Tmrt across the area, scenarios SN1A, SN3A, SN4A, and SN5A demonstrated lower PET values from 8:00 AM to 1:00 PM, accompanied by slightly elevated PET values from 4:00 PM to 7:00 PM.
A thorough examination of each POI indicated that the specific variations in PET at each location were distinct from one another. Generally, the effects of densification and the application of building geometries on the PET at each POI emerged as two primary phenomena: variations in the range of PET values and modifications to the duration of high temperatures during the day.
At the various street locations (Streets 1-7), during the nighttime, scenario SN2 produced the highest PET values at Streets 2, 4, and 7; scenario SN5A exhibited the highest temperature at Streets 3, 5, and 6, while the highest temperature at Street 1 was recorded for scenario SN4A. Scenario SN1B demonstrated a cooling effect at nearly all points, with the exception of Street 2, where scenario SN4B performed marginally better. During the daytime, scenario SN5B at Street 2 and scenario SN1B at Street 5 exhibited a notable increase in peak PET, specifically 0.82°C and 0.24°C above the current situation, respectively; conversely, the most significant cooling effect was achieved by scenario SN5A, which resulted in a temperature approximately 1.0°C lower than the current PET at Street 1. Scenarios SN1A and SN5A delayed the onset of high PET by approximately three hours and abbreviated the duration of elevated temperatures at Street 1. At Street 2, scenarios SN4B and SN5B commenced much earlier than other scenarios in producing PET values exceeding 30°C and prolonged the duration of elevated temperatures, whereas scenario SN5A significantly curtailed the duration of the hot period. At Street 5, scenario SN1B exhibited an exceptionally extended duration of high temperatures, commencing from 9:00 AM to 7:00 PM.
In the open spaces of the area, scenario SN1A demonstrated cooling effects during nighttime, specifically at OpenSpace 1 and OpenSpace 2, as well as scenario SN1B at OpenSpace 3. Other scenarios resulted in warmer temperatures relative to the PET compared to the current situation at all nocturnal points. Scenario SN5B contributed the highest PET at OpenSpace 1, 4, and 6 during the night. At OpenSpace 2, 3, and 5, the highest nighttime PETs were recorded in scenarios SN2, SN5A, and SN1B, respectively. During the daytime, the peak PET reached 36.06°C at OpenSpace 3 in scenario SN1B, an increase of 0.48°C above the current situation at that location. Significant reductions in peak PETs were also observed in scenario SN1B at OpenSpace 1 and OpenSpace 5, specifically 0.74°C and 1.79°C, respectively. Scenarios SN1A, SN3A, SN4A, and SN5A demonstrated their capacity to reduce the hot period during daytime; conversely, scenarios SN1B, SN3B, SN4B, and SN5B initiated the hot periods earlier at most locations in the open spaces.
4. Discussion
4.1. Impacts of Densification on Existing Urban Form
Following a comprehensive examination of the current building and zoning regulations in Zurich, BZO2016, particularly concerning the provision of permissible building floor area, this study has developed five scenarios to investigate the impacts of densification on the existing urban form within the Altstetten-Albisrieden district of Zurich. These scenarios theoretically evaluate various means of redevelopment across different building and development types. While addressing the needs stemming from population growth in the region, each scenario elucidates its distinct advantages and disadvantages, accompanied by valuable insights for urban planning and design.
The comprehensive redevelopment scenario, SN1, presented the advantage of regulating building intensity throughout the district while achieving a comparatively lower UR across the area, as emphasised in the assessment of overall district densification and in the specified subsite area, defined by the established building geometries. Simultaneously, the discrepancies between the two calculations estimating the building fraction on the ground in scenarios SN1, SN1A, and SN1B underscored the significance of selecting appropriate building geometries when densifying urban environments, where a judicious design of building geometries can facilitate the allocation of ground surface for open and green spaces, thus enhancing the quality of life in a densely populated city. The adding-floor scenario applied to most buildings in the district, SN2, exhibited its advantageous position in providing additional building floor areas without impacting the ground; however, this advantage was realised at the cost of achieving the highest UR in both assessments across the district and subsite area. Despite its contribution to preserving the overall spatial texture of the existing urban form, scenario SN2 may jeopardise the provision of public facilities and infrastructure, particularly green infrastructure, as it does not present a viable opportunity for increasing open green spaces simultaneously.
Scenario SN4, along with its sub-scenarios SN4A and SN4B, which represent a synthesis of scenarios SN1 and SN2, distinguished itself among the partial densification assessments conducted across the district and within the subsite area, respectively. Given that the majority of the involved densified parcels were assumed to conform to the BZO2016 for regulated development intensity, the overall UR was recorded as the second lowest among all scenarios. Scenarios SN5 and its sub-scenarios, SN5A and SN5B, further concentrated the densification process solely on parcels with structures or developments erected between 1925 and 1975. This resulted in a 27% increase in the designated building UR as determined by the BZO2016. In addition to possessing the second-highest overall utilisation ratio among the scenarios, scenario SN5 may induce significant and inconsistent density changes in certain regions of the district, thereby posing challenges to the equitable use of public facilities and infrastructure networks.
Nevertheless, this study has streamlined the assessment of the impacts of densification on urban form, relying on mathematical relationships among various urban factors. It is capable of offering a broad overview concerning the potential transformation of urban spaces. Authentic urban planning and design are likely to yield more nuanced insights, which could lead to significantly diverse outcomes. The distinctions in the estimated changes in total floor areas, building footprints, and average utilisation ratios following the integration of specific building geometries are presented as an example, underscoring the necessity for multi-scale forecasting for future urban transformations. This approach integrates general considerations of building typologies and geometries into micro- and meso-urban planning and design.
4.2. Impacts of Densification on the Overall Mean Radiant Temperature
One of the prevalent concerns regarding urban densification pertains to its association with the UHI effect as well as its impact on outdoor thermal comfort and public health. This study utilised various scenarios to delineate the effects of different densification methods and diverse building geometries on the subsite area.
Scenario SN2, which represents the condition of augmenting building heights by adding an additional floor to most existing structures, demonstrated a reduction of 0.60°C and 0.23°C in daytime and diurnal average temperatures, respectively; however, there was a corresponding increase of 0.38°C in the average nighttime temperature. This daytime cooling effect corroborates findings from previous studies that attributed it to the expansion of shaded areas [2,3,21,25]; nonetheless, the nighttime warming effect has yet to be thoroughly examined. As forty meters and sixty meters have been identified as two pivotal turning points in the relationships between building height and its influence on urban climate [22], the addition of floors to existing buildings or the moderation of building heights in future developments may constitute a beneficial strategy for the overall urban climate. However, considerable attention must be directed towards understanding the impact of taller buildings on nighttime temperature variations, which could potentially lead to an increase in the prevalence of tropical nights.
Scenarios SN1A and SN1B simulated instances whereby exemplary building geometries, specifically courtyard and tower blocks, were employed across the entire area, thus establishing two contrasting urban morphologies. Owing to the requirement for a minimum distance between structures, scenario SN1B exhibited dispersed tower blocks, culminating in taller buildings with reduced ground-level building fractions compared to those observed in scenario SN1A. Following the simulation, scenario SN1A exhibited minimal temperature variation across all simulated scenarios. In contrast, scenario SN1B displayed substantially warmer daytime and diurnal average temperatures, with increases of 1.42°C and 0.65°C above the present conditions, respectively, alongside a more pronounced cooling effect during nighttime average temperatures, which were approximately 0.63°C lower than current levels. This finding, which contradicts the conclusions drawn by Wang et al. [22] regarding the relationships between building height, FAR, ground-level building fraction, and temperature variation, may be attributable to the fact that scenario SN1B did not produce as extensive a shaded area as scenario SN1A during daytime; however, the open spaces between building blocks facilitated the dissipation of warm air during nighttime. This suggests that an optimal building geometry for densification in Zurich should integrate characteristics of both courtyard and tower blocks to maximise the mitigation effects on UHI.
The partial densification scenarios, with the exception of scenario SN4B, exhibited temperature variation patterns similar to those observed in scenario SN2, wherein simulation results indicated significantly lower average temperatures during the day, yet higher temperatures at night, alongside lower diurnal average temperatures throughout the day compared to the current situation, although the temperature alterations were not as pronounced as those recorded in scenario SN2. Scenario SN4B displayed an inverse temperature alteration pattern, indicating slightly warmer daytime temperatures and cooler nighttime temperatures, accompanied by a diurnal temperature increase of less than 0.01°C, representing the minimal alteration across all scenarios, despite exhibiting a warming effect. Although the majority of scenarios, excluding scenarios SN1B and SN4B, revealed diurnal average temperatures lower than the current conditions, the warmer nighttime temperatures suggest that further efforts are necessary to seek solutions to address the challenge of elevated nighttime temperatures, which constitute one of the primary factors influencing individual health.
4.3. Impacts of Densification on PET
This study utilised thirteen points of interest (POIs) in the area to examine the impact of densification scenarios at the specified locations. The simulated results indicated that the geometries of buildings also influenced outdoor thermal comfort during the densification process, with this influence demonstrating strong correlations with the time of day and the locations associated with the particular POIs.
During nighttime, open spaces in scenarios featuring courtyard blocks were estimated to be cooler than those in scenarios with tower blocks, although the differences were minimal. Conversely, street points within the courtyard scenarios were found to be warmer than those within the tower block scenarios. In the daytime prior to 12:00 PM, the street points in the courtyard scenarios were observed to be cooler than those in the tower block scenarios. From 1:00 PM to 7:00 AM, the PET values at most POIs in the courtyard scenarios were higher than those in the tower scenarios. Notably, OpenSpace 3 exhibited an exceptional situation throughout the time frames and scenarios, indicating the presence of other influential factors in the estimation of PET.
Regarding the locations, the fluctuation of PET values at each site suggests the influence of building placements on outdoor thermal comfort. It indicates that when densification occurred along the eastern and southern sides of the area, such as at points OpenSpace 1, 2, and 4, and Street 1, 3, and 5, PET values began to increase later in the morning. Conversely, when densification transpired along the western side, at points OpenSpace 3, 5, and 6, cooling effects were noticeable after 2:00 PM across all scenarios. In areas surrounded by dense projects, such as Street 6 and 7, lower PET values were recorded in the morning from 8:00 AM to 10:00 AM and around 5:00 PM compared to the current situation. Furthermore, during the day, courtyard blocks along the southern and eastern sides exhibited a more pronounced cooling effect than tower blocks, as illustrated by OpenSpace 2. However, when courtyard blocks were utilised on the western side, such as at OpenSpace 5, higher PET values were observed compared to the tower block situations. This observation underscores the diverse performance of building geometries across different locations, indicating the necessity for a more judicious selection of building designs that are specifically adapted to the unique circumstances of each site in order to enhance outdoor comfort in local environments.
5. Conclusions
In the context of urban sustainable transformation to accommodate population growth in Zurich, the densification of existing city areas within the current urban boundaries has been established as the primary strategy for future development, aimed at preserving agricultural land and natural landscapes. However, the implications of intensifying current urban land use and its subsequent effects on the urban microclimate have emerged as significant concerns regarding the mitigation of urban heat islands (UHI) and the attainment of high living quality. Various urban redevelopment strategies have been executed in individual projects throughout the city; nonetheless, a comprehensive understanding of densification is necessary to aid in planning and design.
This study produced five scenarios to assess the impact of various urban densification methods on existing urban forms within the district of Altstetten-Albisrieden, utilising exemplary building geometries, such as courtyard and tower blocks, to model scenarios for outdoor thermal comfort simulation at the neighbourhood scale. The results indicated that the latest building and planning regulation BZO2016 possesses the capacity to accommodate the additional population and job positions, albeit at the expense of complete redevelopment of the entire district. Considering the building's lifespan of fifty years, partial redevelopment, as represented by scenario SN4, emerged as a more favourable solution, effectively regulating the overall intensity of space use while preserving the existing urban fabric.
The UMEP simulation of outdoor thermal comfort, based on the sub-scenarios models with the two building geometries, suggested that densification does not necessarily lead to a deterioration of the microclimate concerning mean radiant temperature (Tmrt) and physiological equivalent temperature (PET). The temperature variations across all scenarios illustrated the advantages as well as disadvantages of utilising courtyard and tower building geometries in varying situations throughout the scenarios, thereby indicating the interrelationship between urban factors and building geometries; however, this association was manifested in a complex manner, fluctuating between daytime and nighttime. This finding implies a need for a more judicious selection of building geometries within the urban densification process.
Nevertheless, the study did not incorporate additional urban factors into the outdoor thermal comfort simulation, with the intent of concentrating on the implications of building geometries. However, alterations to building geometries would impact other urban factors, particularly green infrastructures, such as ground-level green surfaces and vegetation surrounding buildings, which have been recognised as playing vital roles in enhancing microclimate and alleviating UHI. This underscores the necessity for future studies to integrate green infrastructure for a more precise estimation of urban microclimate effects. Moreover, given that the subsite area is situated in the centre of the district, where building density is comparatively higher than in most other regions, the modelled scenarios and their simulated results may not fully encapsulate the impacts of densification in different parts of the district. Considering this concern, it is prudent to extend this study to other areas for comparative analysis, aiming to understand the influence of densification in varied urban contexts characterised by diverse existing building densities and geometries.
Author Contributions
Conceptualization, Y.J.; Methodology, Y.J.; Software, Y.J.; Validation, Y.J.; Formal Analysis, Y.J.; Investigation, Y.J.; Resources, Y.J.; Data Curation, Y.J.; Writing – Original Draft Preparation, Y.J.; Writing – Review & Editing, Y.J.; Visualization, Y.J.; Supervision, S.M.; Project Administration, Y.J.; Funding Acquisition, S.M.
Funding
This research was conducted at the Future Cities Lab Global at ETH Zurich. Future Cities Lab Global is supported and funded by the National Research Foundation, Prime Minister’s Office, Singapore under its Campus for Research Excellence and Technological Enterprise (CREATE) programme and ETH Zurich (ETHZ), with additional contributions from the National University of Singapore (NUS), Nanyang Technological University (NTU), Singapore and the Singapore University of Technology and Design (SUTD).
Data Availability Statement
The data presented in this study are available on request from the corresponding author.
Acknowledgements
Special thanks to Roderic Günter and Caspar Trüb, who worked as research assistants in the Dense and Green Cities module. Their cooperation, kind support and insightful feedback throughout the research period contributed extraordinarily to the improvement of the paper’s quality.
Conflicts of Interest
The authors declare no conflicts of interest.
Abbreviations
The following abbreviations are used in this manuscript:
| BZO2016 | Building and Zoning Regulation, version 2016 |
| BZO99 | Building and Zoning Regulation, version 1999 |
| EPW | Energy-Plus Weather |
| FAR | Floor Area Ratio |
| GsPR | Green Surface Plot Ratio |
| PET | Physiological Equivalent Temperature |
| POI | Point of Interest |
| SN1 | Densification Scenario 1 |
| SN1A | Sub-Scenario 1 with Courtyard Geometry |
| SN1B | Sub-Scenario 1 with Tower Geometry |
| SN2 | Densification Scenario 2 |
| SN3 | Densification Scenario 3 |
| SN3A | Sub-Scenario 3 with Courtyard Geometry |
| SN3B | Sub-Scenario 3 with Tower Geometry |
| SN4 | Densification Scenario 4 |
| SN4A | Sub-Scenario 4 with Courtyard Geometry |
| SN4B | Sub-Scenario 4 with Tower Geometry |
| SN5 | Densification Scenario 5 |
| SN5A | Sub-Scenario 5 with Courtyard Geometry |
| SN5B | Sub-Scenario 5 with Tower Geometry |
| SOLWEIG | Solar and Longwave Environmental Irradiance Geometry model |
| Tmrt | Mean Radiant Temperature |
| UHI | Urban Heat Island |
| UMEP | Urban Multi-scale Environmental Predictor |
| UR | Utilisation Ratio |
References
- Swiss Federal Council. 2016, January 27. Sustainable Development Strategy 2016-2019. Swiss Federal Council. https://www.are.admin.ch/are/en/home/media/publications/sustainable-development/strategie-nachhaltige-entwicklung-2016---2019.html.
- Li, Y., Schubert, S., Kropp, J. P., & Rybski, D. On the influence of density and morphology on the Urban Heat Island intensity. Nature Communications 2020, 11(1), 2647. [CrossRef]
- Loibl, W., Vuckovic, M., Etminan, G., Ratheiser, M., Tschannett, S., & Österreicher, D. Effects of Densification on Urban Microclimate—A Case Study for the City of Vienna. Atmosphere 2021, 12(4), 511. [CrossRef]
- Chapman, S., Watson, J. E. M., Salazar, A., Thatcher, M., & McAlpine, C. A. The impact of urbanization and climate change on urban temperatures: A systematic review. Landscape Ecology 2017, 32(10), 1921–1935. [CrossRef]
- Nasar-u-Minallah, M., Haase, D., Qureshi, S., Zia, S., & Fatima, M. Ecological monitoring of urban thermal field variance index and determining the surface urban heat island effects in Lahore, Pakistan. Environmental Monitoring and Assessment 2023, 195(10), 1212. [CrossRef]
- Deng, X., Cao, Q., Wang, L., Wang, W., Wang, S., Wang, S., & Wang, L. Characterizing urban densification and quantifying its effects on urban thermal environments and human thermal comfort. Landscape and Urban Planning 2023, 237, 104803. [CrossRef]
- Lan, H., Lau, K. K.-L., Shi, Y., & Ren, C. Improved urban heat island mitigation using bioclimatic redevelopment along an urban waterfront at Victoria Dockside, Hong Kong. Sustainable Cities and Society 2021, 74, 103172. [CrossRef]
- Li, J., Yang, Z., Zhao, X., Li, Y., Huang, X., Chen, Y., & Shi, F. Study of the Correlation between the Urban Wind–Heat Environment and Urban Development Elements in High-Density Urban Areas: A Case Study of Central Shanghai. Buildings 2024, 14(2), 315. [CrossRef]
- Chen, X., Yang, J., Zhu, R., Wong, M. S., & Ren, C. Spatiotemporal impact of vehicle heat on urban thermal environment: A case study in Hong Kong. Building and Environment 2021, 205, 108224. [CrossRef]
- Chow, W. T. L., Salamanca, F., Georgescu, M., Mahalov, A., Milne, J. M., & Ruddell, B. L. A multi-method and multi-scale approach for estimating city-wide anthropogenic heat fluxes. Atmospheric Environment 2014, 99, 64–76. [CrossRef]
- Fung, K. Y., Tam, C., Lee, T. C., & Wang, Z. Comparing the Influence of Global Warming and Urban Anthropogenic Heat on Extreme Precipitation in Urbanized Pearl River Delta Area Based on Dynamical Downscaling. Journal of Geophysical Research: Atmospheres 2021, 126(21), e2021JD035047. [CrossRef]
- Iamarino, M., Beevers, S., & Grimmond, C. S. B. High-resolution (space, time) anthropogenic heat emissions: London 1970–2025. International Journal of Climatology 2012, 32(11), 1754–1767. [CrossRef]
- Singh, V. K., Mughal, M. O., Martilli, A., Acero, J. A., Ivanchev, J., & Norford, L. K. Numerical analysis of the impact of anthropogenic emissions on the urban environment of Singapore. Science of The Total Environment 2022, 806, 150534. [CrossRef]
- Wanner, H., & Hertig, J.-A. Studies of Urban Climates and Air Pollution in Switzerland. Journal of Climate and Applied Meteorology 1984, 23(12), 1614–1625. [CrossRef]
- Canton, J., & Dipankar, A. Climatological analysis of urban heat island effects in Swiss cities. International Journal of Climatology 2024, 44(5), 1549–1565. [CrossRef]
- Federal Office of Meteorology and Climatology MeteoSwiss. (n.d.). Urban heat. The Climate of Switzerland. Retrieved 13 May 2025, from https://www.meteoswiss.admin.ch/climate/the-climate-of-switzerland/urban-heat.html#:~:text=In%20Swiss%20cities%2C%20the%20temperature%20at%20night,higher%20than%20in%20the%20surrounding%20rural%20areas.&text=In%20the%20“No%20climate%20change%20mitigation”%20scenario%2C,year%20by%20the%20end%20of%20this%20century.
- Center for Climate System Modeling, Federal Office of Meteorology and Climatology MeteoSwiss, ETH Zurich, NCCR Climate Swiss Climate Research, & Organe Consultatif sur les changements climatiques. Swiss Climate Change Scenarios CH2011, 2011. (ISBN: 978 3 033 03065 7; p. 88). http://www.ch2011.ch/pdf/CH2011reportHIGH.pdf.
- National Centre for Climate Services NCCS. 2023. CH2018—Climate Scenarios for Switzerland: Technical Report (ISBN: 978-3-9525031-4-0; p. 271). National Centre for Climate Services,. https://www.nccs.admin.ch/nccs/en/home/climate-change-and-impacts/swiss-climate-change-scenarios/technical-report.html.
- Rippstein, V., De Schrijver, E., Eckert, S., & Vicedo-Cabrera, A. M. Trends in tropical nights and their effects on mortality in Switzerland across 50 years. PLOS Climate 2023, 2(4), e0000162. [CrossRef]
- Emmanuel, R., & Steemers, K. Connecting the realms of urban form, density and microclimate. Building Research & Information 2018, 46(8), 804–808. [CrossRef]
- Lan, Y., & Zhan, Q. How do urban buildings impact summer air temperature? The effects of building configurations in space and time. Building and Environment 2017, 125, 88–98. [CrossRef]
- Wang, C., Zhang, H., Ma, Z., Yang, H., & Jia, W. Urban Morphology Influencing the Urban Heat Island in the High-Density City of Xi’an Based on the Local Climate Zone. Sustainability 2024, 16(10), 3946. [CrossRef]
- Zhou, B., Rybski, D., & Kropp, J. P. The role of city size and urban form in the surface urban heat island. Scientific Reports 2017, 7(1). [CrossRef]
- Yang, J., Shi, Q., Menenti, M., Wong, M. S., Wu, Z., Zhao, Q., Abbas, S., & Xu, Y. Observing the impact of urban morphology and building geometry on thermal environment by high spatial resolution thermal images. Urban Climate 2021, 39, 100937. [CrossRef]
- Straka, M., & Sodoudi, S. Evaluating climate change adaptation strategies and scenarios of enhanced vertical and horizontal compactness at urban scale (a case study for Berlin). Landscape and Urban Planning 2019, 183, 68–78. [CrossRef]
- Yang, J., Shi, Q., Menenti, M., Wong, M. S., Wu, Z., Zhao, Q., Abbas, S., & Xu, Y. Observing the impact of urban morphology and building geometry on thermal environment by high spatial resolution thermal images. Urban Climate 2021, 39, 100937. [CrossRef]
- Widiyannita, E. N., Hariyadi, A., & Syafii, N. I. Impact of Urban Density on the Outdoor Thermal Comfort Case Study: Yogyakarta Tugu Station Area, TOD Based Planning. IOP Conference Series: Earth and Environmental Science 2021, 764(1), 012017. [CrossRef]
- Stadt Zürich. 2021, April 10. Kommunaler Richtplan Siedlung, Landschaft, öffentliche Bauten und Anlagen: Richtplantext. Stadt Zürich Hochbaudepartement Amt für Städtebau.
- Stadt Zürich. 2022b. Quartierspiegel: Altstetten 2022.
- Stadt Zürich. 2024b. Quartierspiegel: Altstetten 2024 (1002126 (elektronisch: 1002126); Quartierspiegel). Stadt Zürich Präsidialdepartement, Statistik Stadt Zürich. https://www.stadt-zuerich.ch/de/politik-und-verwaltung/statistik-und-daten/publikationen-und-dienstleistungen/publikationen/quartierspiegel/quartier-092.html.
- Esri, DeLorme, & NAVTEQ. Ladybug Tools: EPW Map [Computer software]. Retrieved 11 April 2025, from https://www.ladybug.tools/epwmap/.
- Climate.OneBuilding.Org. Zurich Affoltern ZH CHE 066640 TMYx [TMYx; EPW]. Repository of Building Simulation Climate Data 2024. https://climate.onebuilding.org/default.html.
- Federal statistical office. 2023. Floor space per occupant. Federal Statistical Office. https://www.bfs.admin.ch/bfs/en/home/statistics/construction-housing/dwellings/housing-conditions/floor-area-person.html.
- Schwehr, P., Fischer, R., & Geier, S. Retrofit Strategies Design Guide: Advanced Retrofit Strategies & 10 Steps to a Prefab Module (IEA ECBCS Annex 50 Prefabricated Systems for Low Energy Renovation of Residential Buildings). 2011. Empa, Building Science and Technology Lab. https://www.ecbcs.org/Data/publications/EBC_Annex_50_Retrofit_Strategies_Design_Guide.pdf.
- Zimmermann, M. 2012. ECBCS Annex 50: Prefabricated Systems for Low Energy Renovation of Residential Buildings: Project Summary Report. http://www.uk.ecbcs.org/Data/publications/EBC_PSR_Annex50.pdf.
- Stadt Zürich. 2015a. Quartierspiegel: Albisrieden 2015 (Quartierspiegel). Stadt Zürich Präsidialdepartement, Statistik Stadt Zürich. https://commons.wikimedia.org/wiki/File:Quartierspiegel_091-Albisrieden_2015.pdf.
- Stadt Zürich. 2015b. Quartierspiegel: Altstetten 2015 (Quartierspiegel). Stadt Zürich Präsidialdepartement, Statistik Stadt Zürich. https://upload.wikimedia.org/wikipedia/commons/5/50/Quartierspiegel_092-Altstetten_2015.pdf.
- Stadt Zürich. 2020a. Quartierspiegel: Albisrieden 2020 (Quartierspiegel). https://zop.zb.uzh.ch/server/api/core/bitstreams/f6bbf6b1-6a56-4de2-b772-180bd8981e41/content.
- Stadt Zürich. (2020b). Quartierspiegel: Altstetten 2020 (Quartierspiegel). Stadt Zürich Präsidialdepartement, Statistik Stadt Zürich. https://zop.zb.uzh.ch/server/api/core/bitstreams/604c19d0-8f89-440a-b5c6-c84d71169b72/content.
- Stadt Zürich. 2022a. Quartierspiegel: Albisrieden 2022.
- Stadt Zürich. 2024a. Quartierspiegel: Albisrieden 2024 (1002125 (elektronisch: 1002125); Quartierspiegel). Stadt Zürich Präsidialdepartement, Statistik Stadt Zürich. https://www.stadt-zuerich.ch/de/politik-und-verwaltung/statistik-und-daten/publikationen-und-dienstleistungen/publikationen/quartierspiegel/quartier-091.html.
- stadt-zuerich.ch/statistik. 2024. Altstetten_BEV341QM1000_Zukuenftige_Bevoelkerung [Excel].
- European Environment Agency (Ed.). Land take and land degradation in functional urban areas. 2022. Publications Office of the European Union. [CrossRef]
- Teller, J. 2021. Regulating Urban Densification: What Factors Should Be Used? 2(1), 302–317. https://doi. org/10.5334/bc.123.
- Hartmann, T., Dembski, S., Hengstermann, A., & Dunning, R. Viewpoint—Land for Densification: How Land Policy and Property Matter. Town Planning Review 2022, 94(5), 465–473. [CrossRef]
- Touati-Morel, A. Hard and Soft Densification Policies in the Paris City-Region. International Journal of Urban and Regional Research 2015, 39(3), 603–612. [CrossRef]
- Angel, S., Lamson-Hall, P., Blei, A., Shingade, S., & Kumar, S. Densify and Expand: A Global Analysis of Recent Urban Growth. Sustainability 2021, 13(7), 3835. [CrossRef]
- Lindberg, F., Grimmond, C. S. B., Gabey, A., Huang, B., Kent, C. W., Sun, T., Theeuwes, N. E., Järvi, L., Ward, H. C., Capel-Timms, I., Chang, Y., Jonsson, P., Krave, N., Liu, D., Meyer, D., Olofson, K. F. G., Tan, J., Wästberg, D., Xue, L., & Zhang, Z. Urban Multi-scale Environmental Predictor (UMEP): An integrated tool for city-based climate services. Environmental Modelling & Software 2018, 99, 70–87. [CrossRef]
Figure 1.
Cumulated building floor areas and the reduction of green spaces in Altstetten-Albisrieden, Zurich.
Figure 1.
Cumulated building floor areas and the reduction of green spaces in Altstetten-Albisrieden, Zurich.
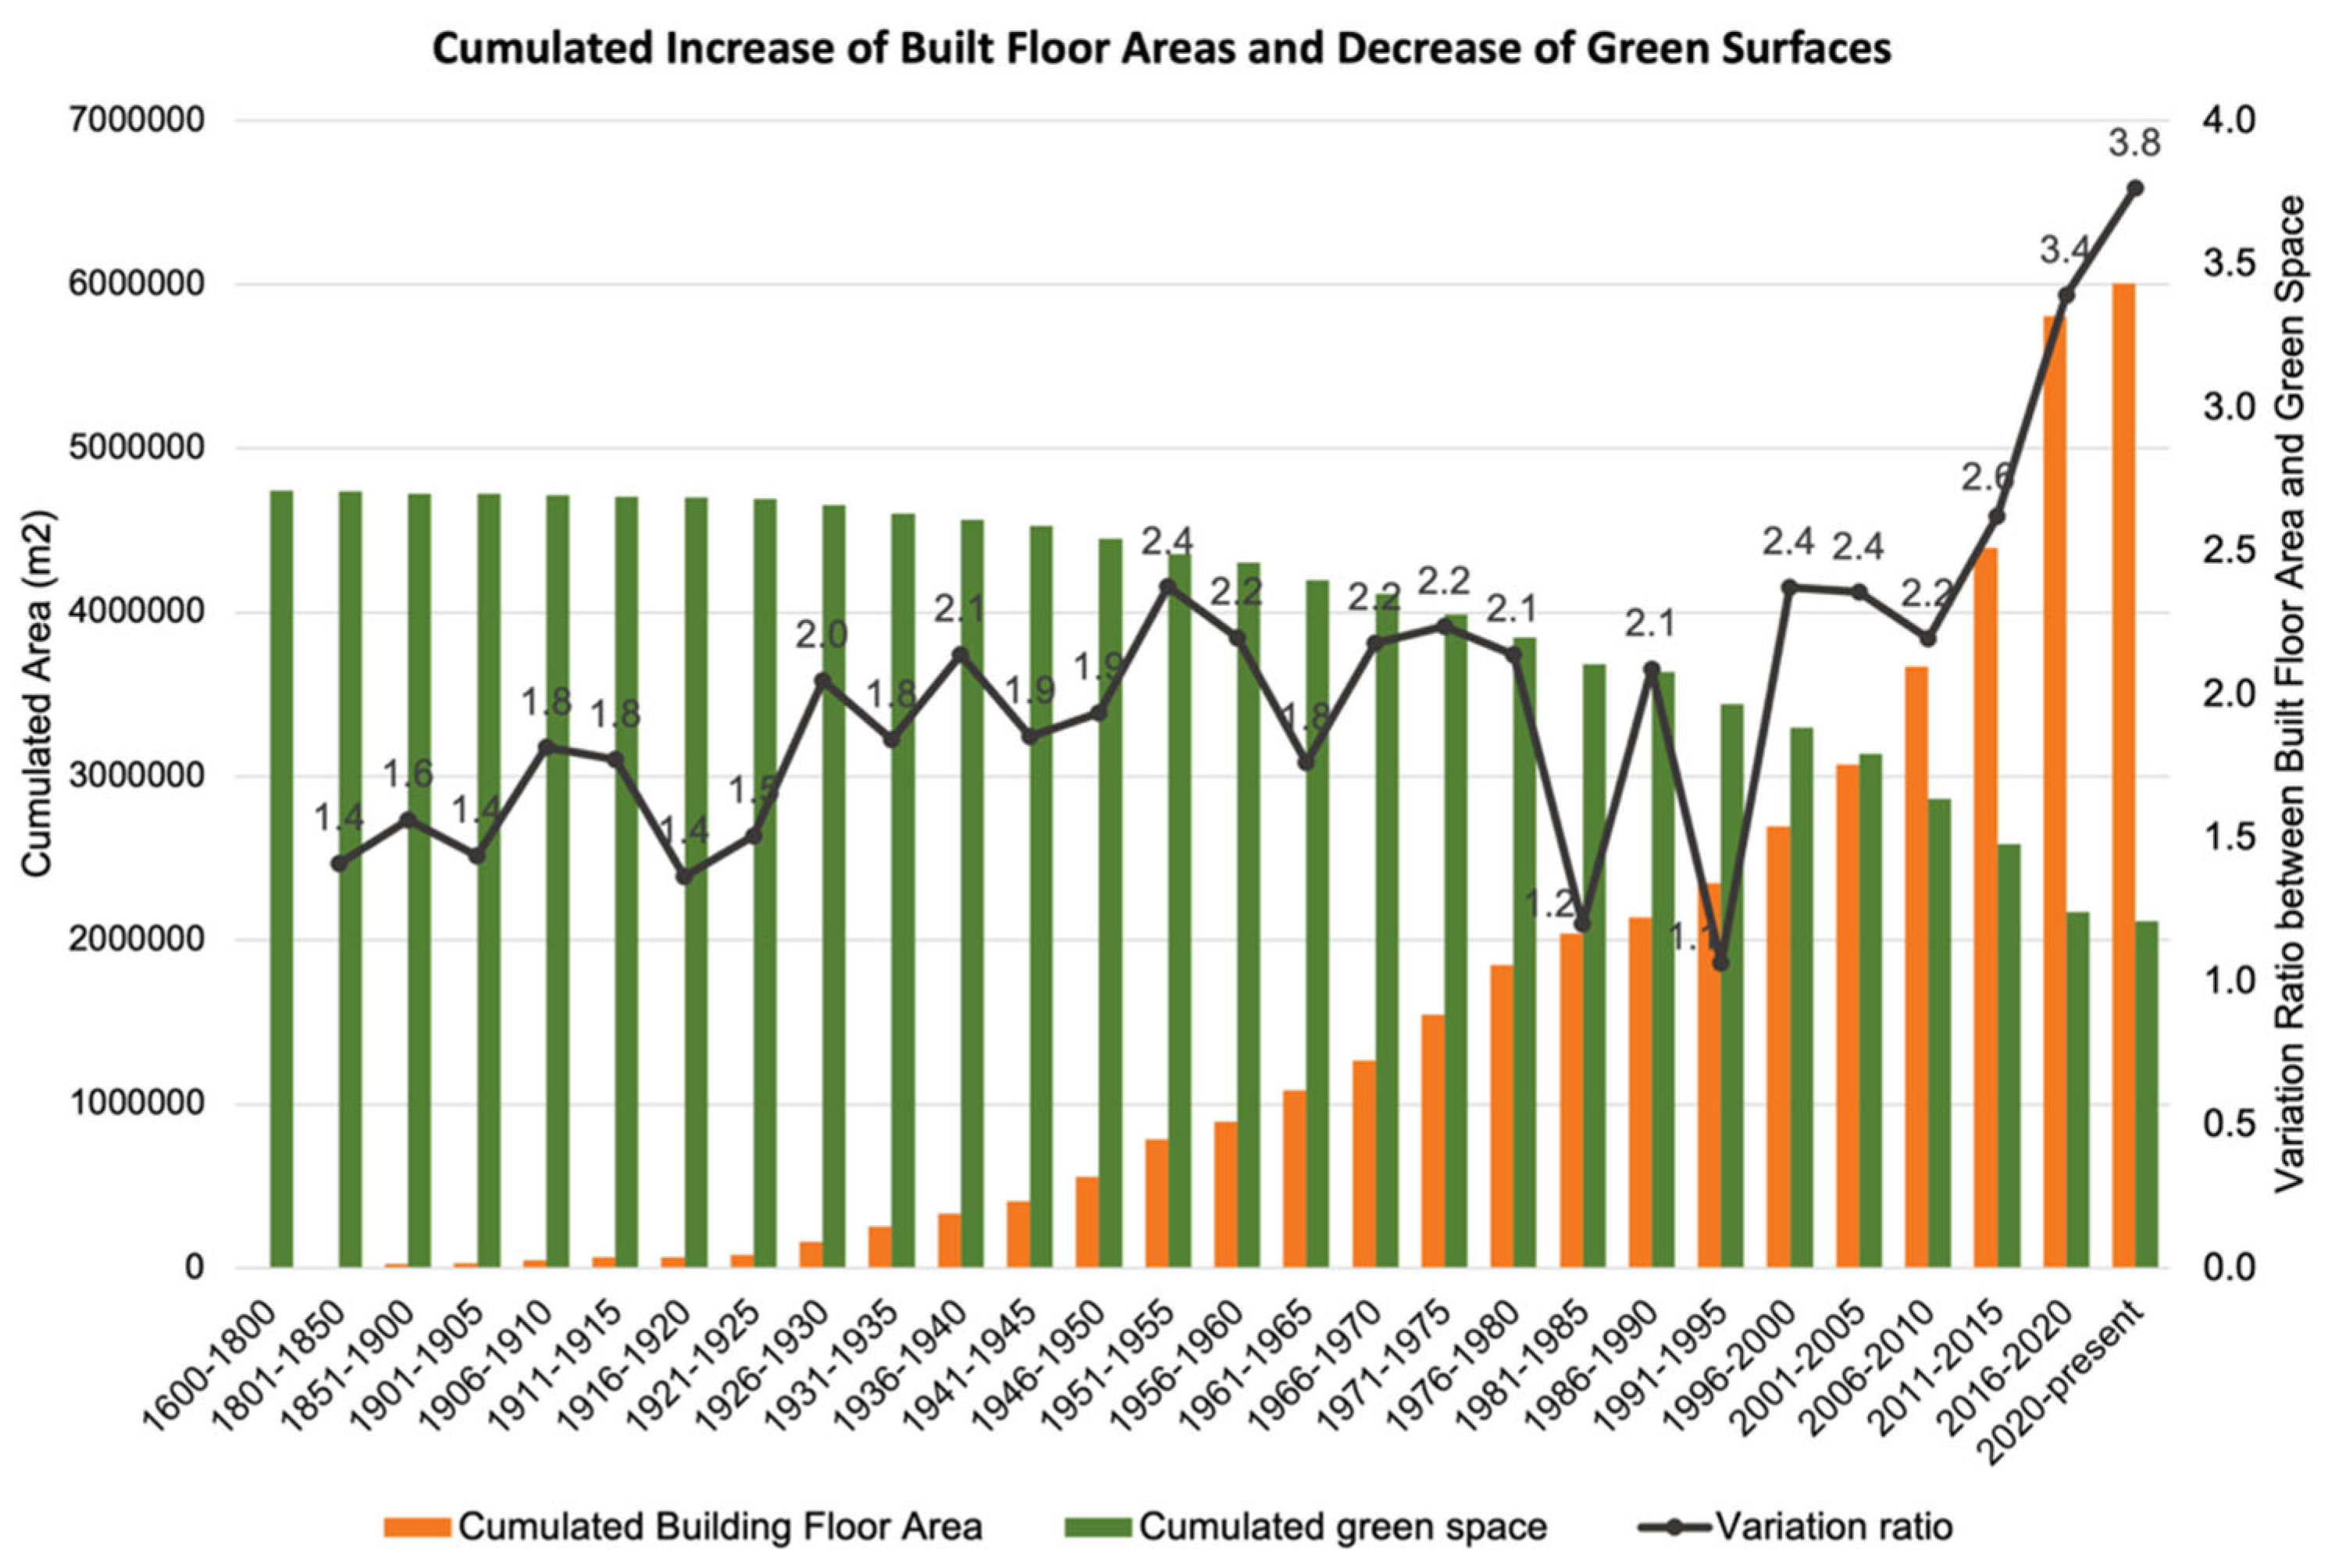
Figure 2.
Methodological framework for this study.
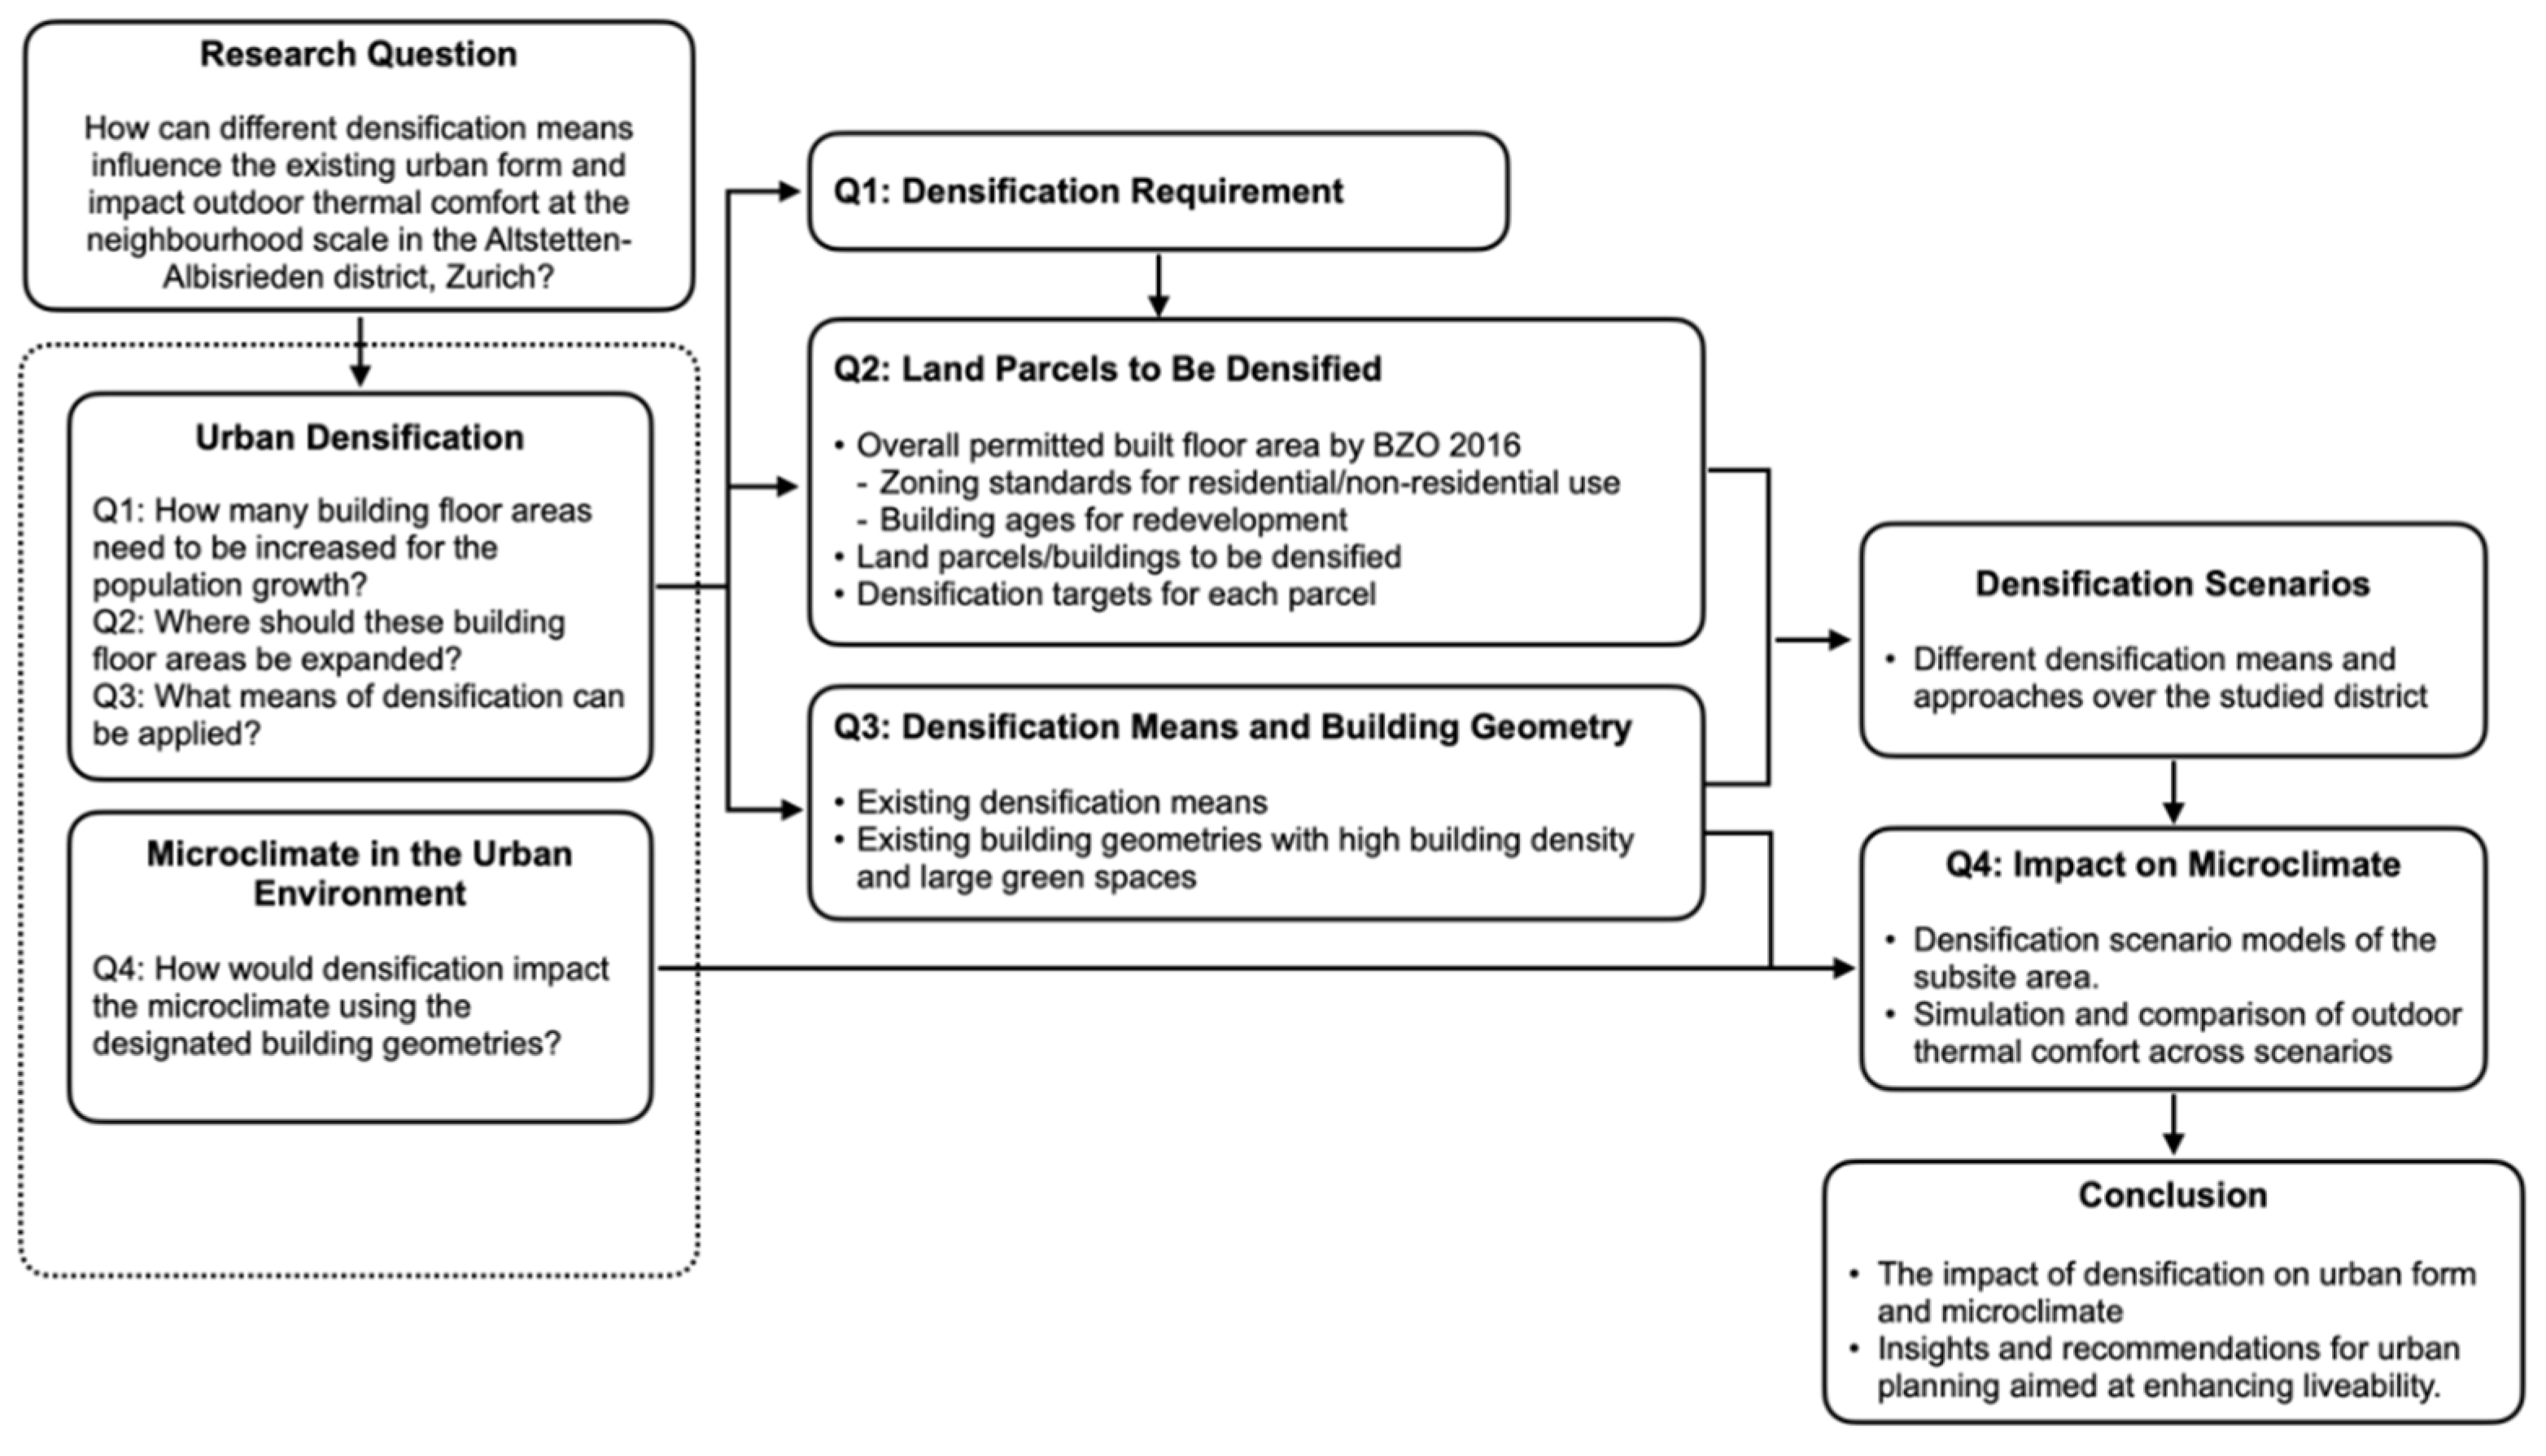
Figure 3.
Location of the studied district, Altstetten-Albisrieden, Zurich.
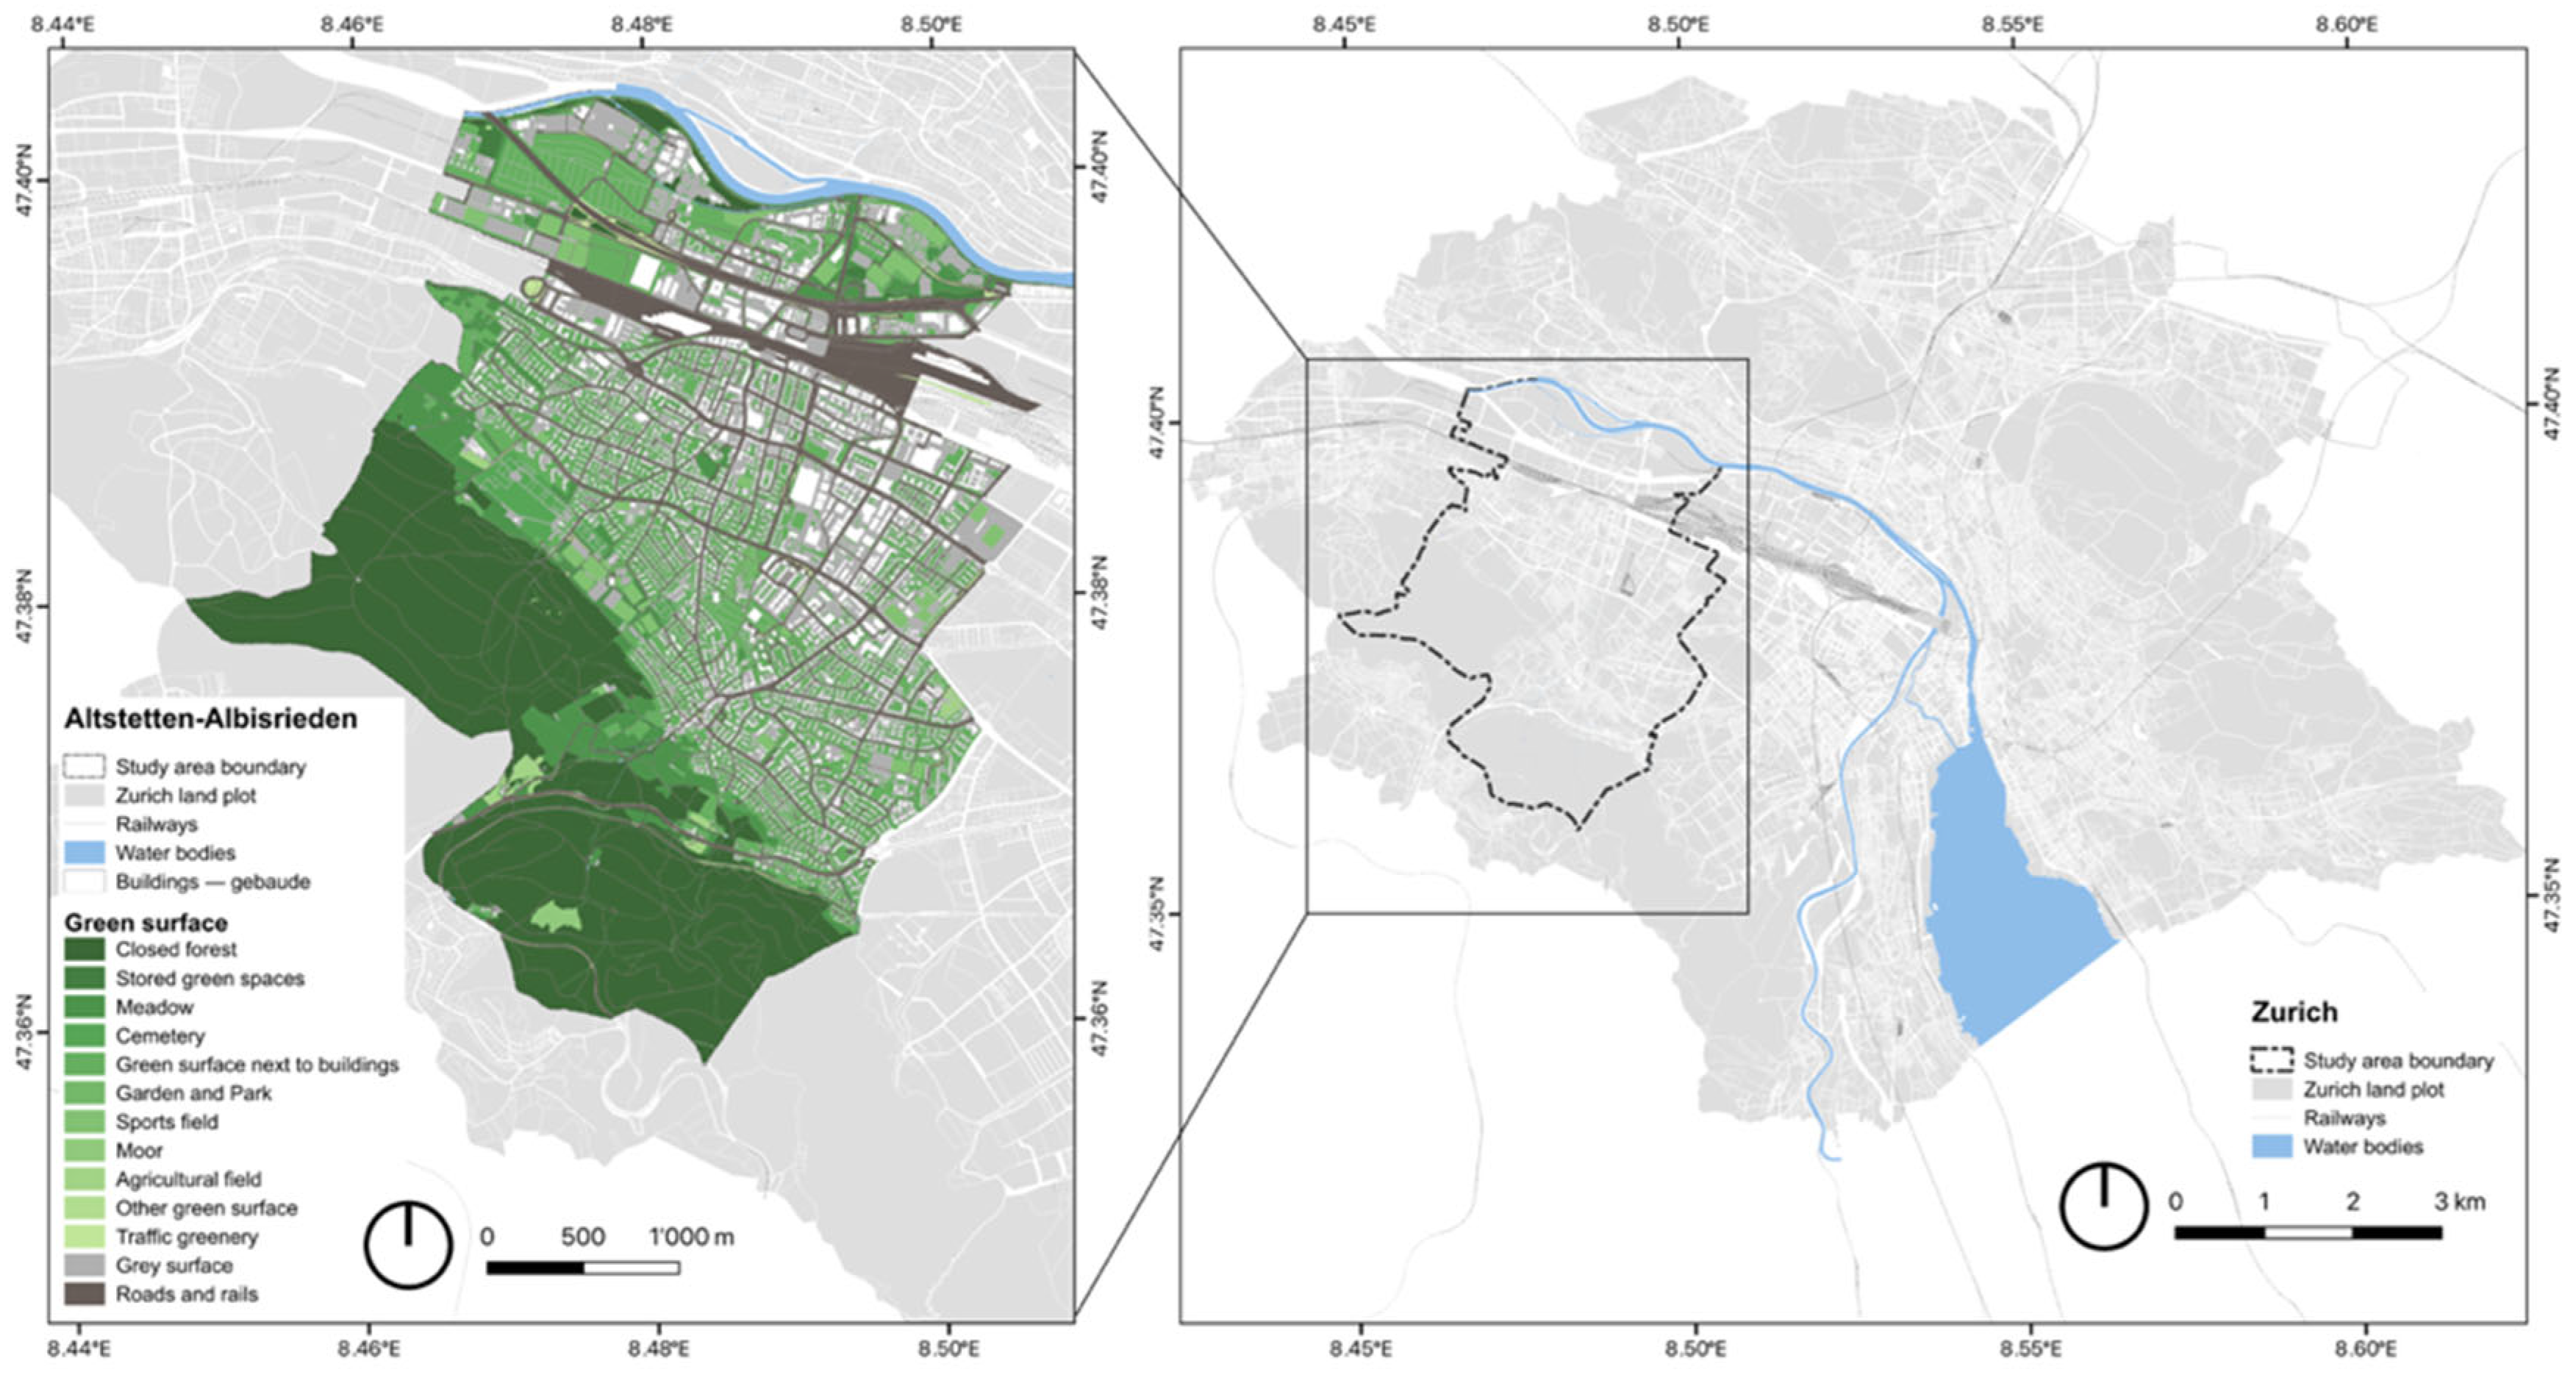
Figure 4.
Correlation between resident population and job positions in Altstetten-Albisrieden.
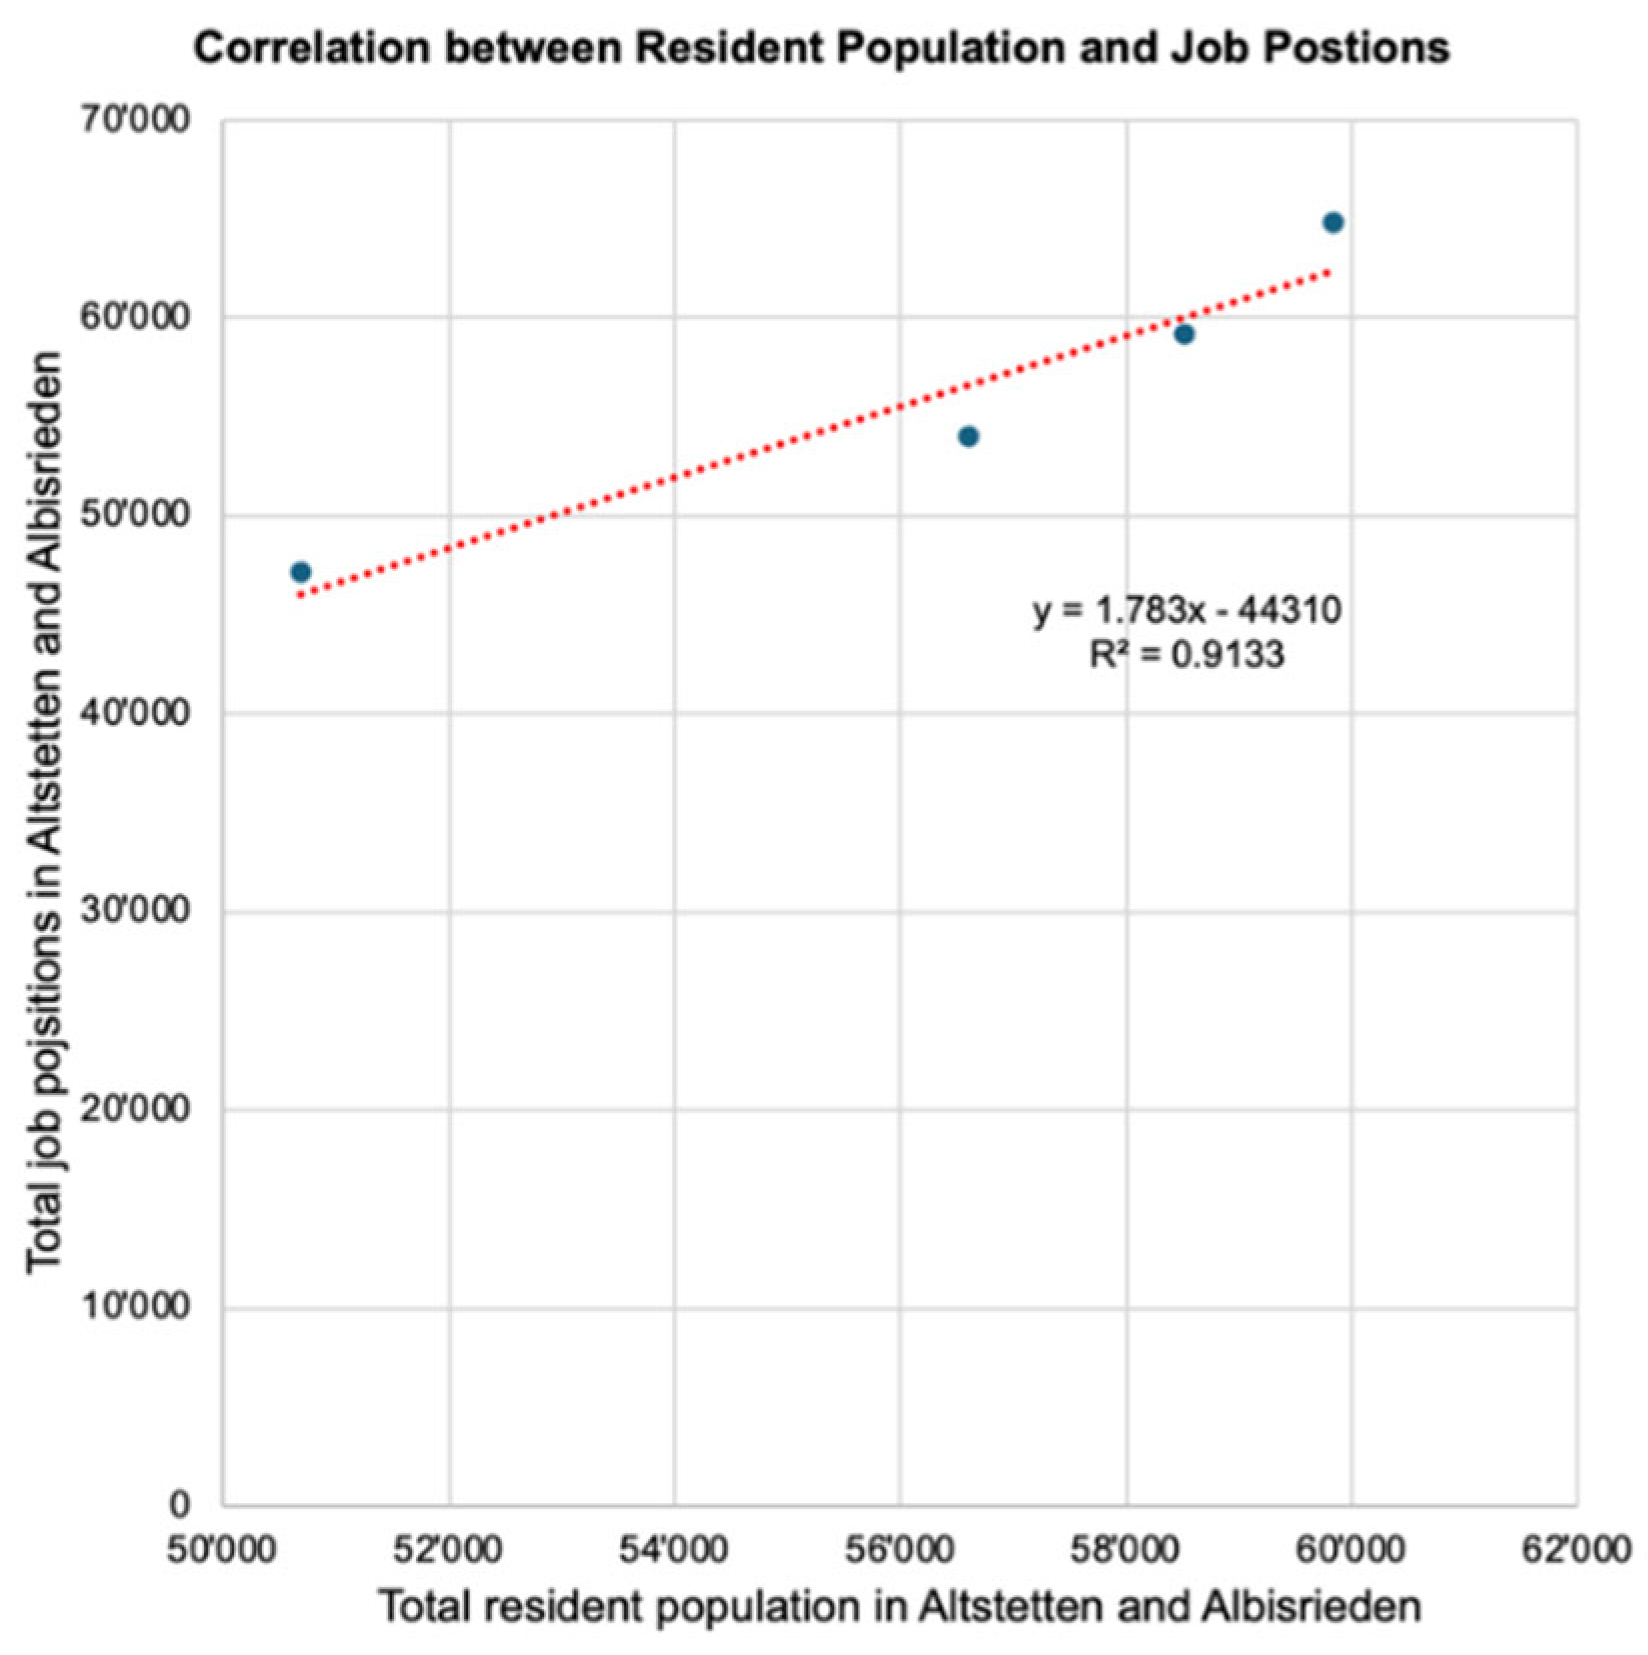
Figure 5.
Workflow of calculating the permitted increment of building floor areas according to the BZO2016 regulations and particular situations of land parcels in Altstetten-Albisrieden.
Figure 5.
Workflow of calculating the permitted increment of building floor areas according to the BZO2016 regulations and particular situations of land parcels in Altstetten-Albisrieden.
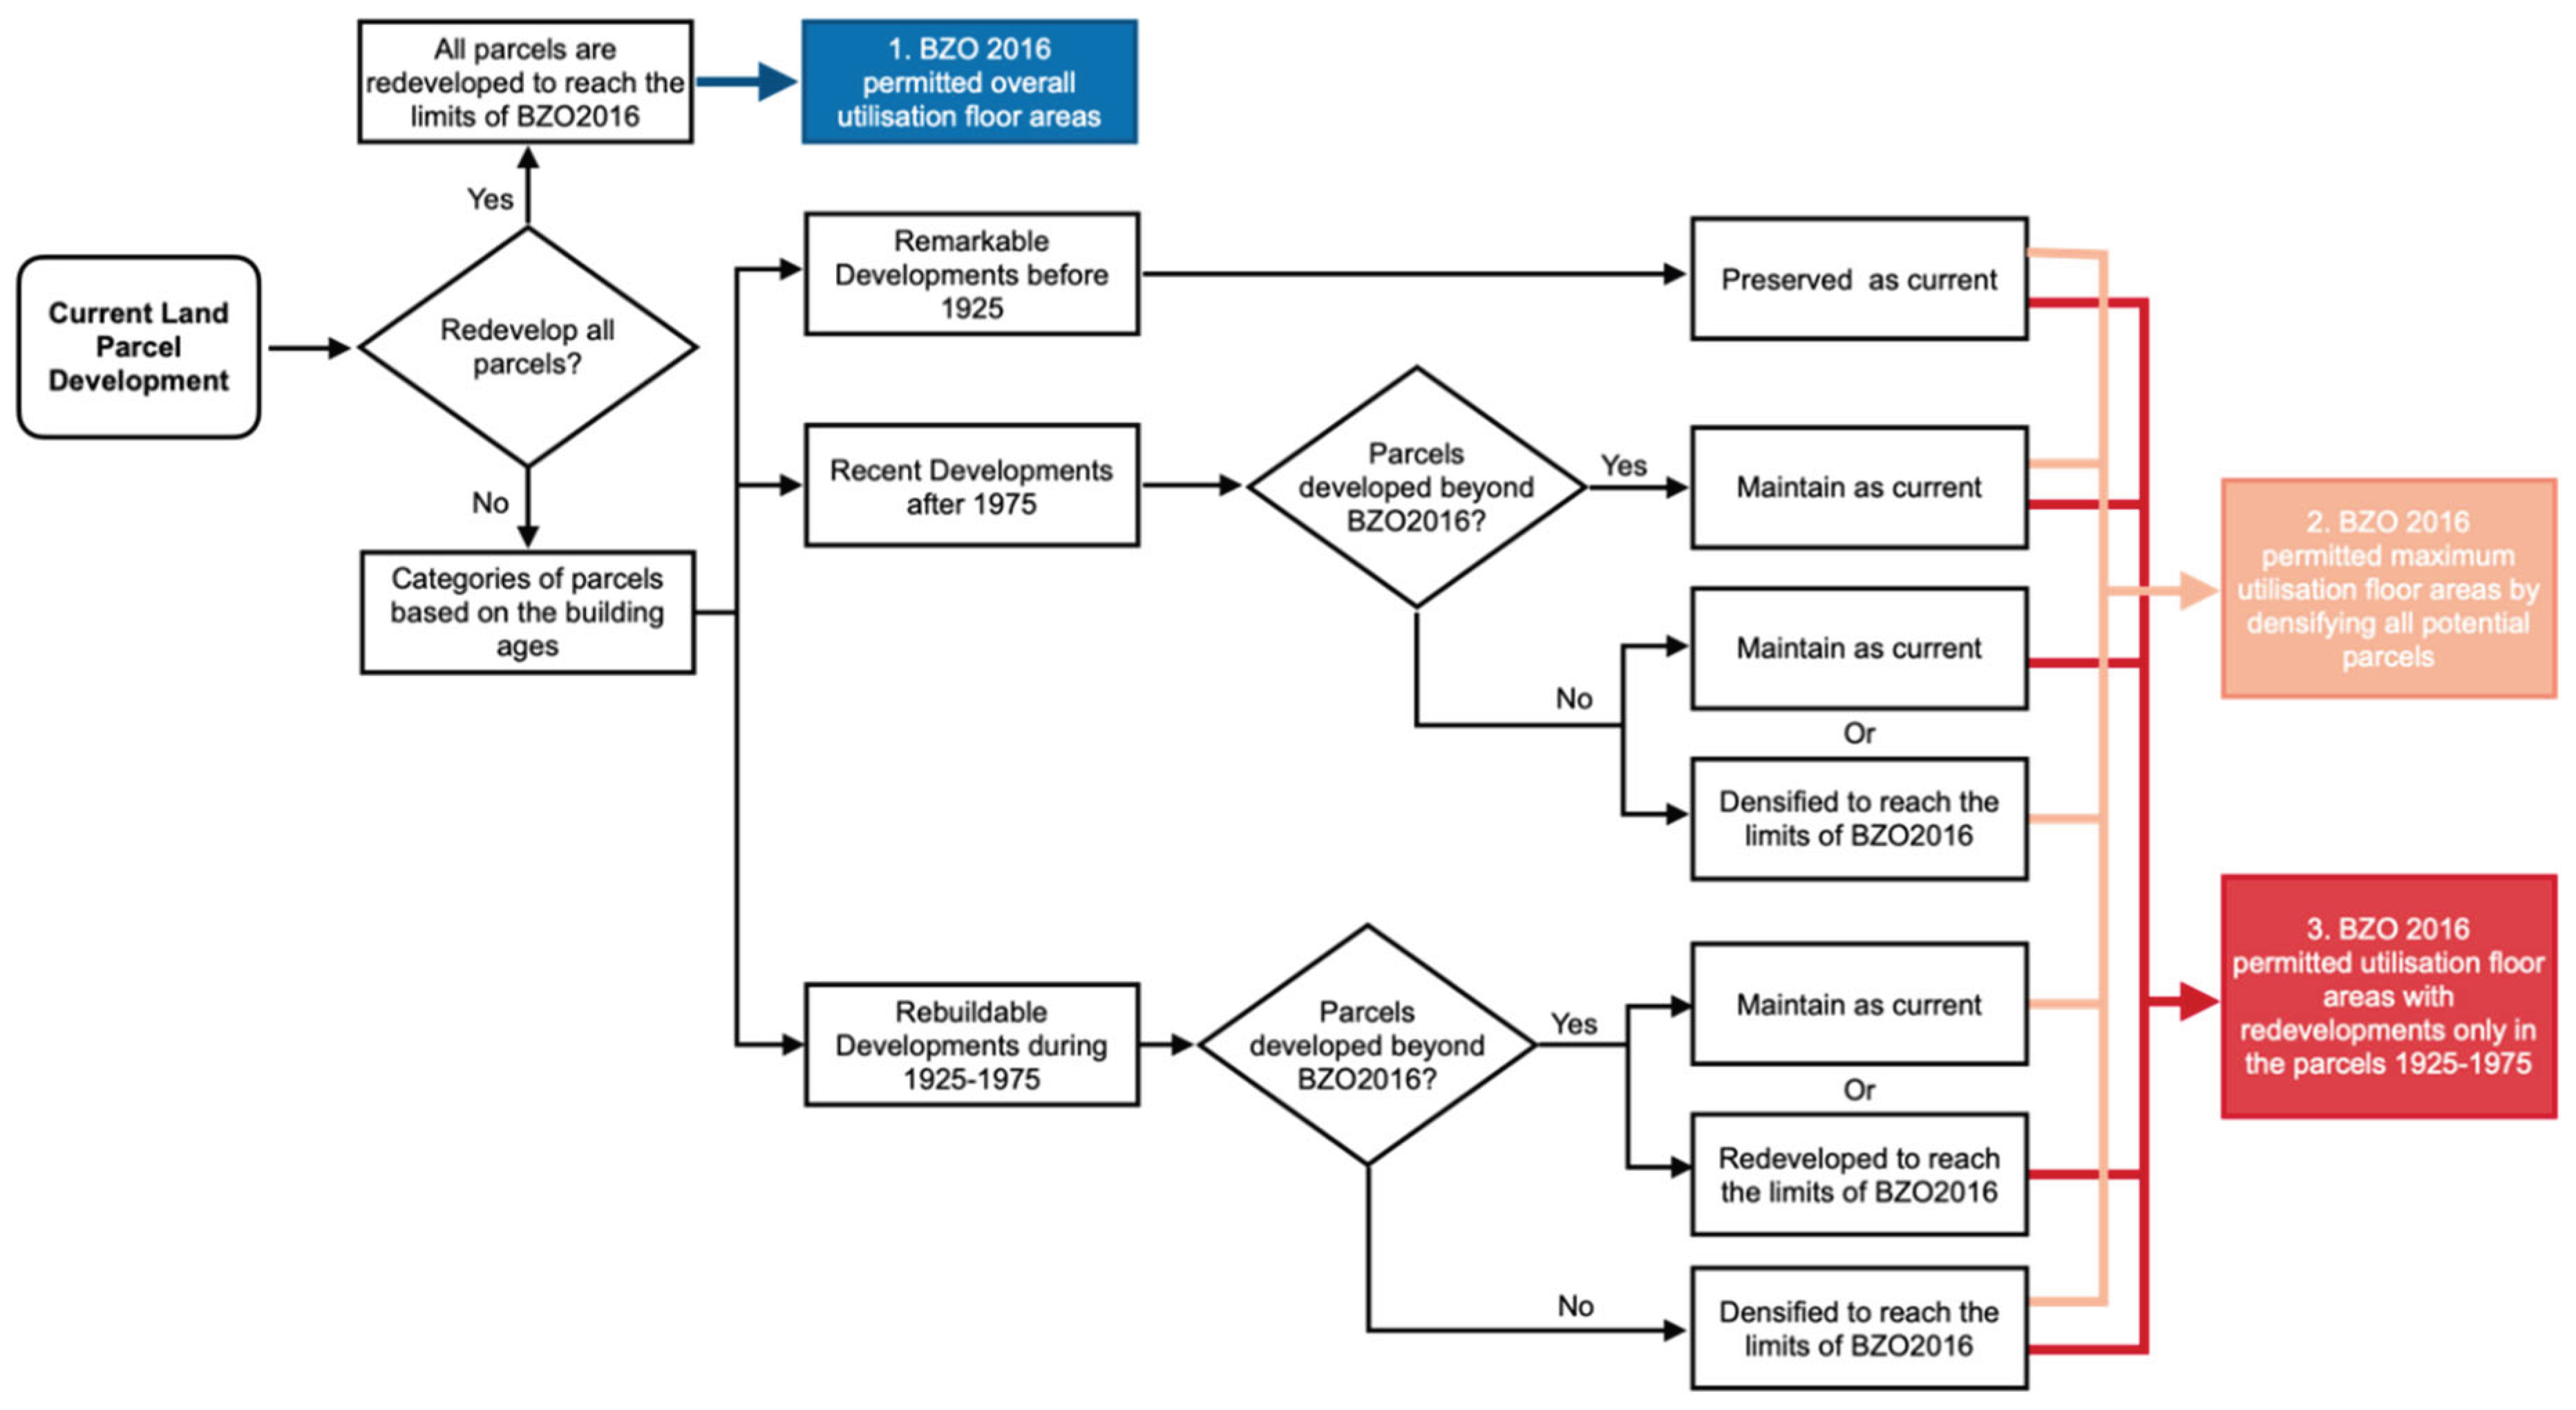
Figure 6.
Exemplary projects and developments representing different densification and urban redevelopment means which have been applied in Altstetten-Albisrieden.
Figure 6.
Exemplary projects and developments representing different densification and urban redevelopment means which have been applied in Altstetten-Albisrieden.
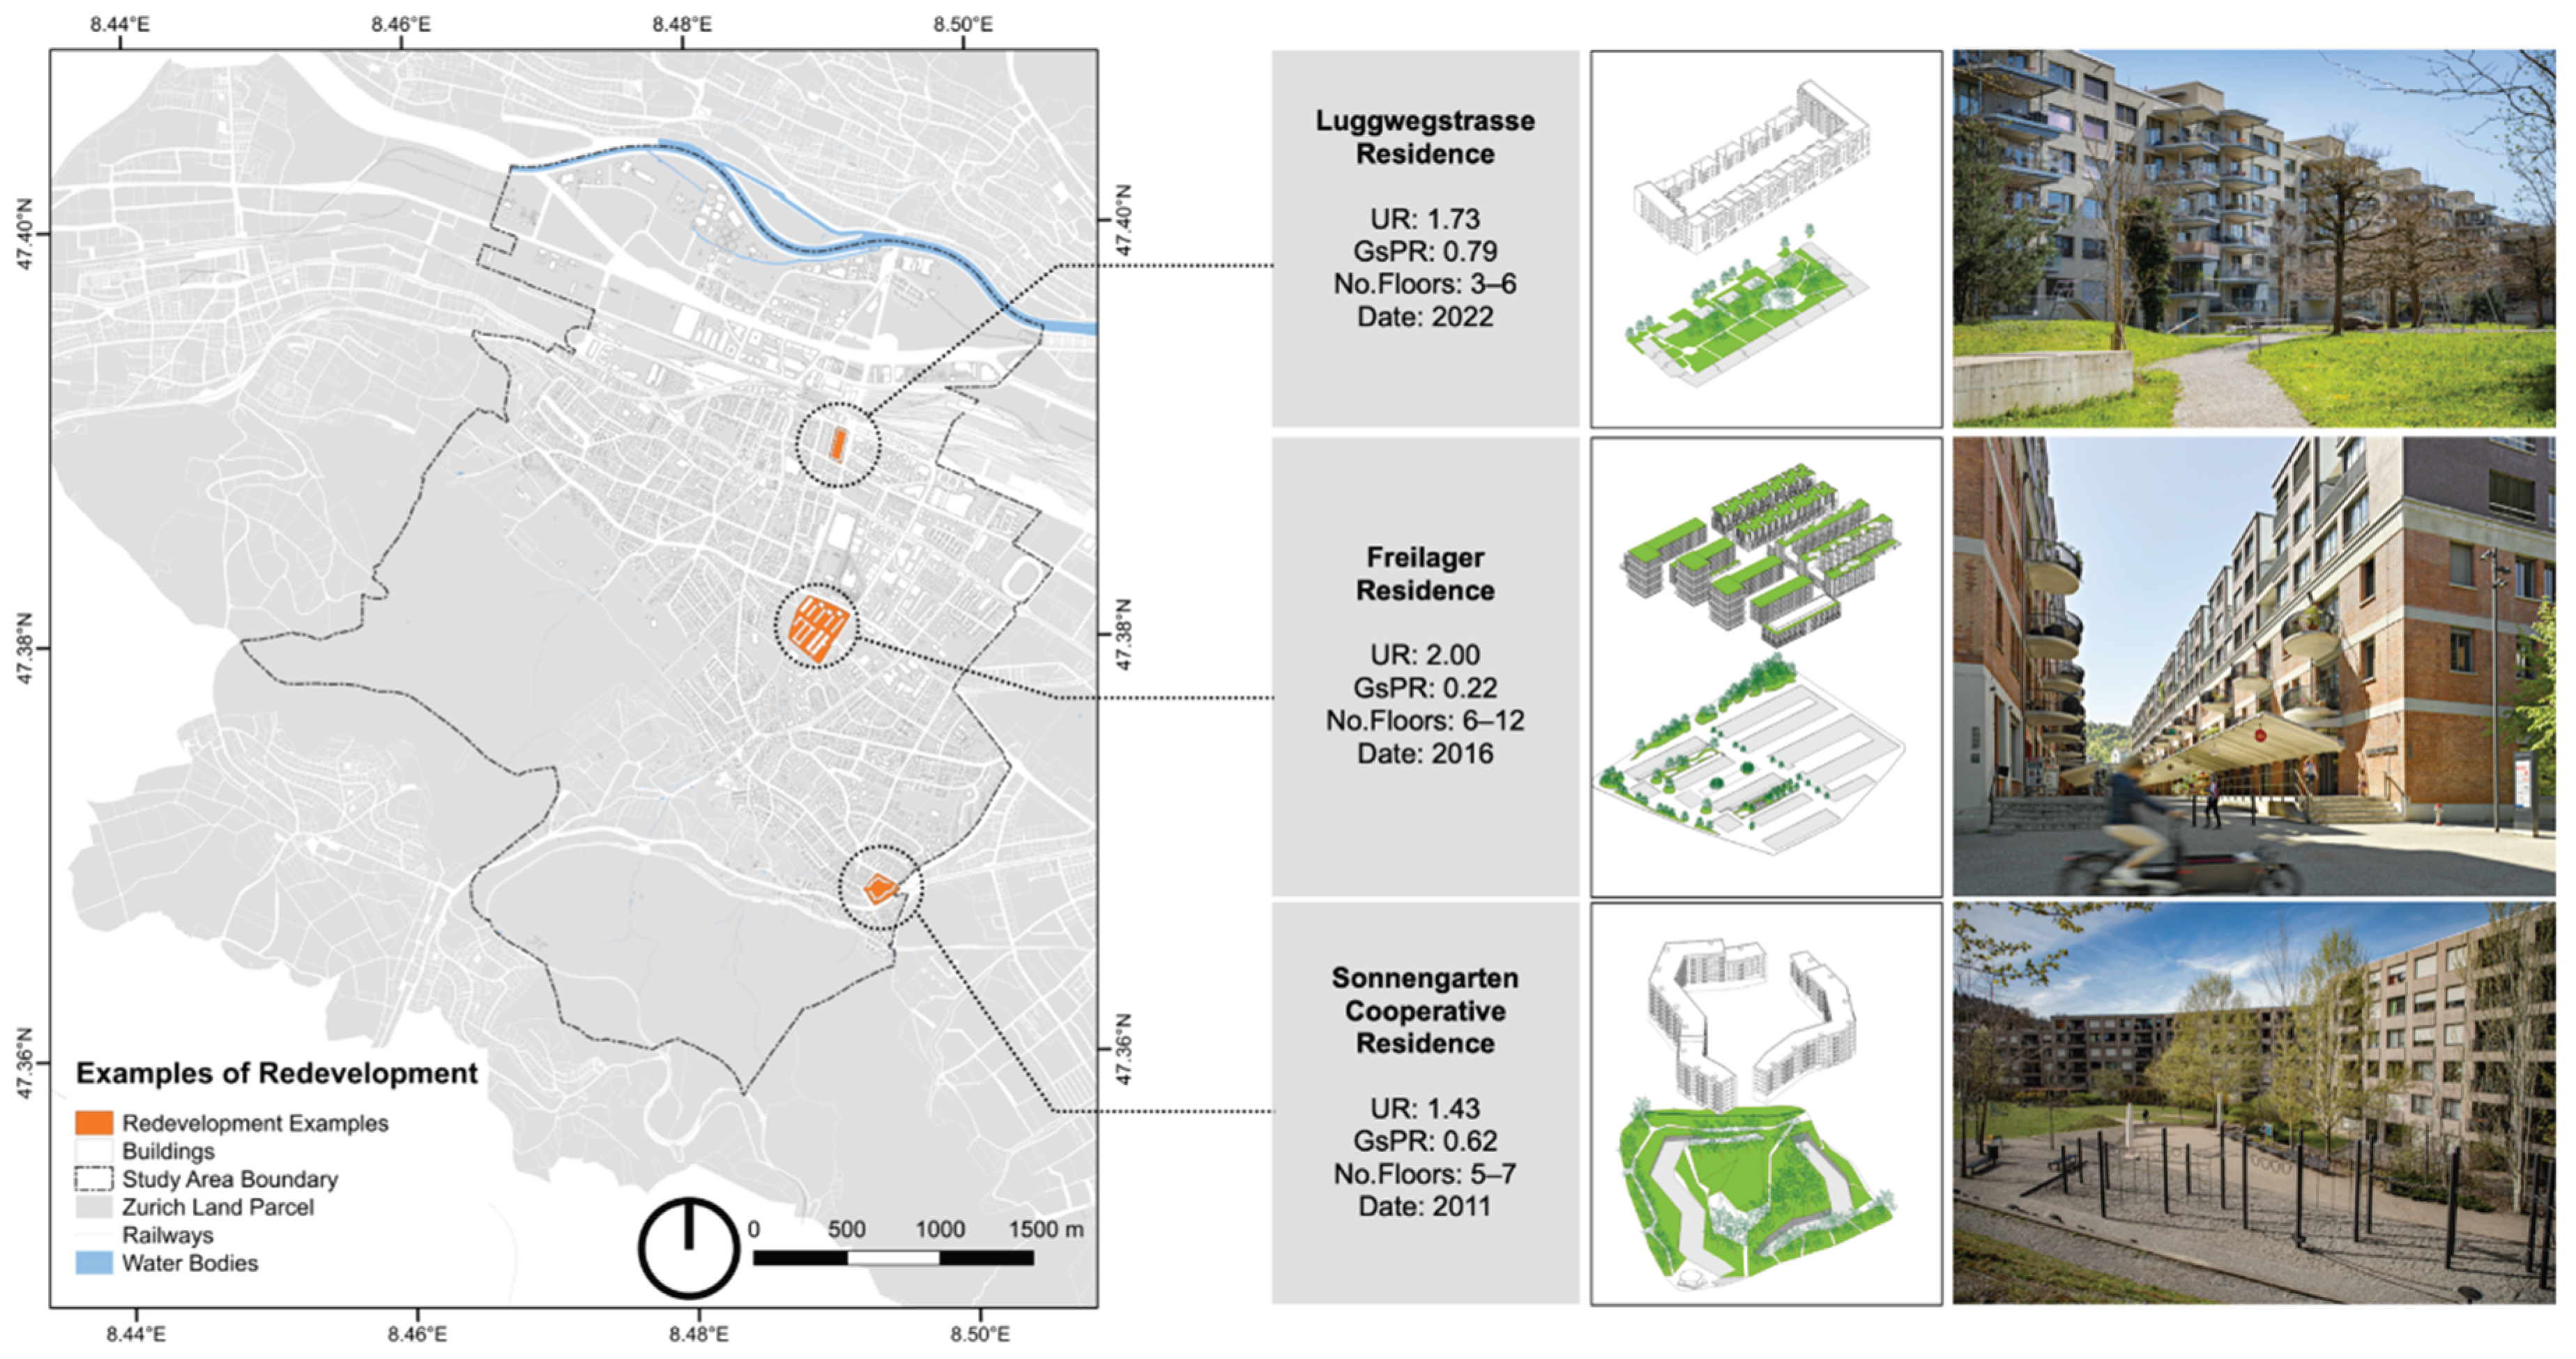
Figure 7.
Subsite area in Altstetten-Albisrieden, its existing situation of buildings and land parcels.
Figure 7.
Subsite area in Altstetten-Albisrieden, its existing situation of buildings and land parcels.
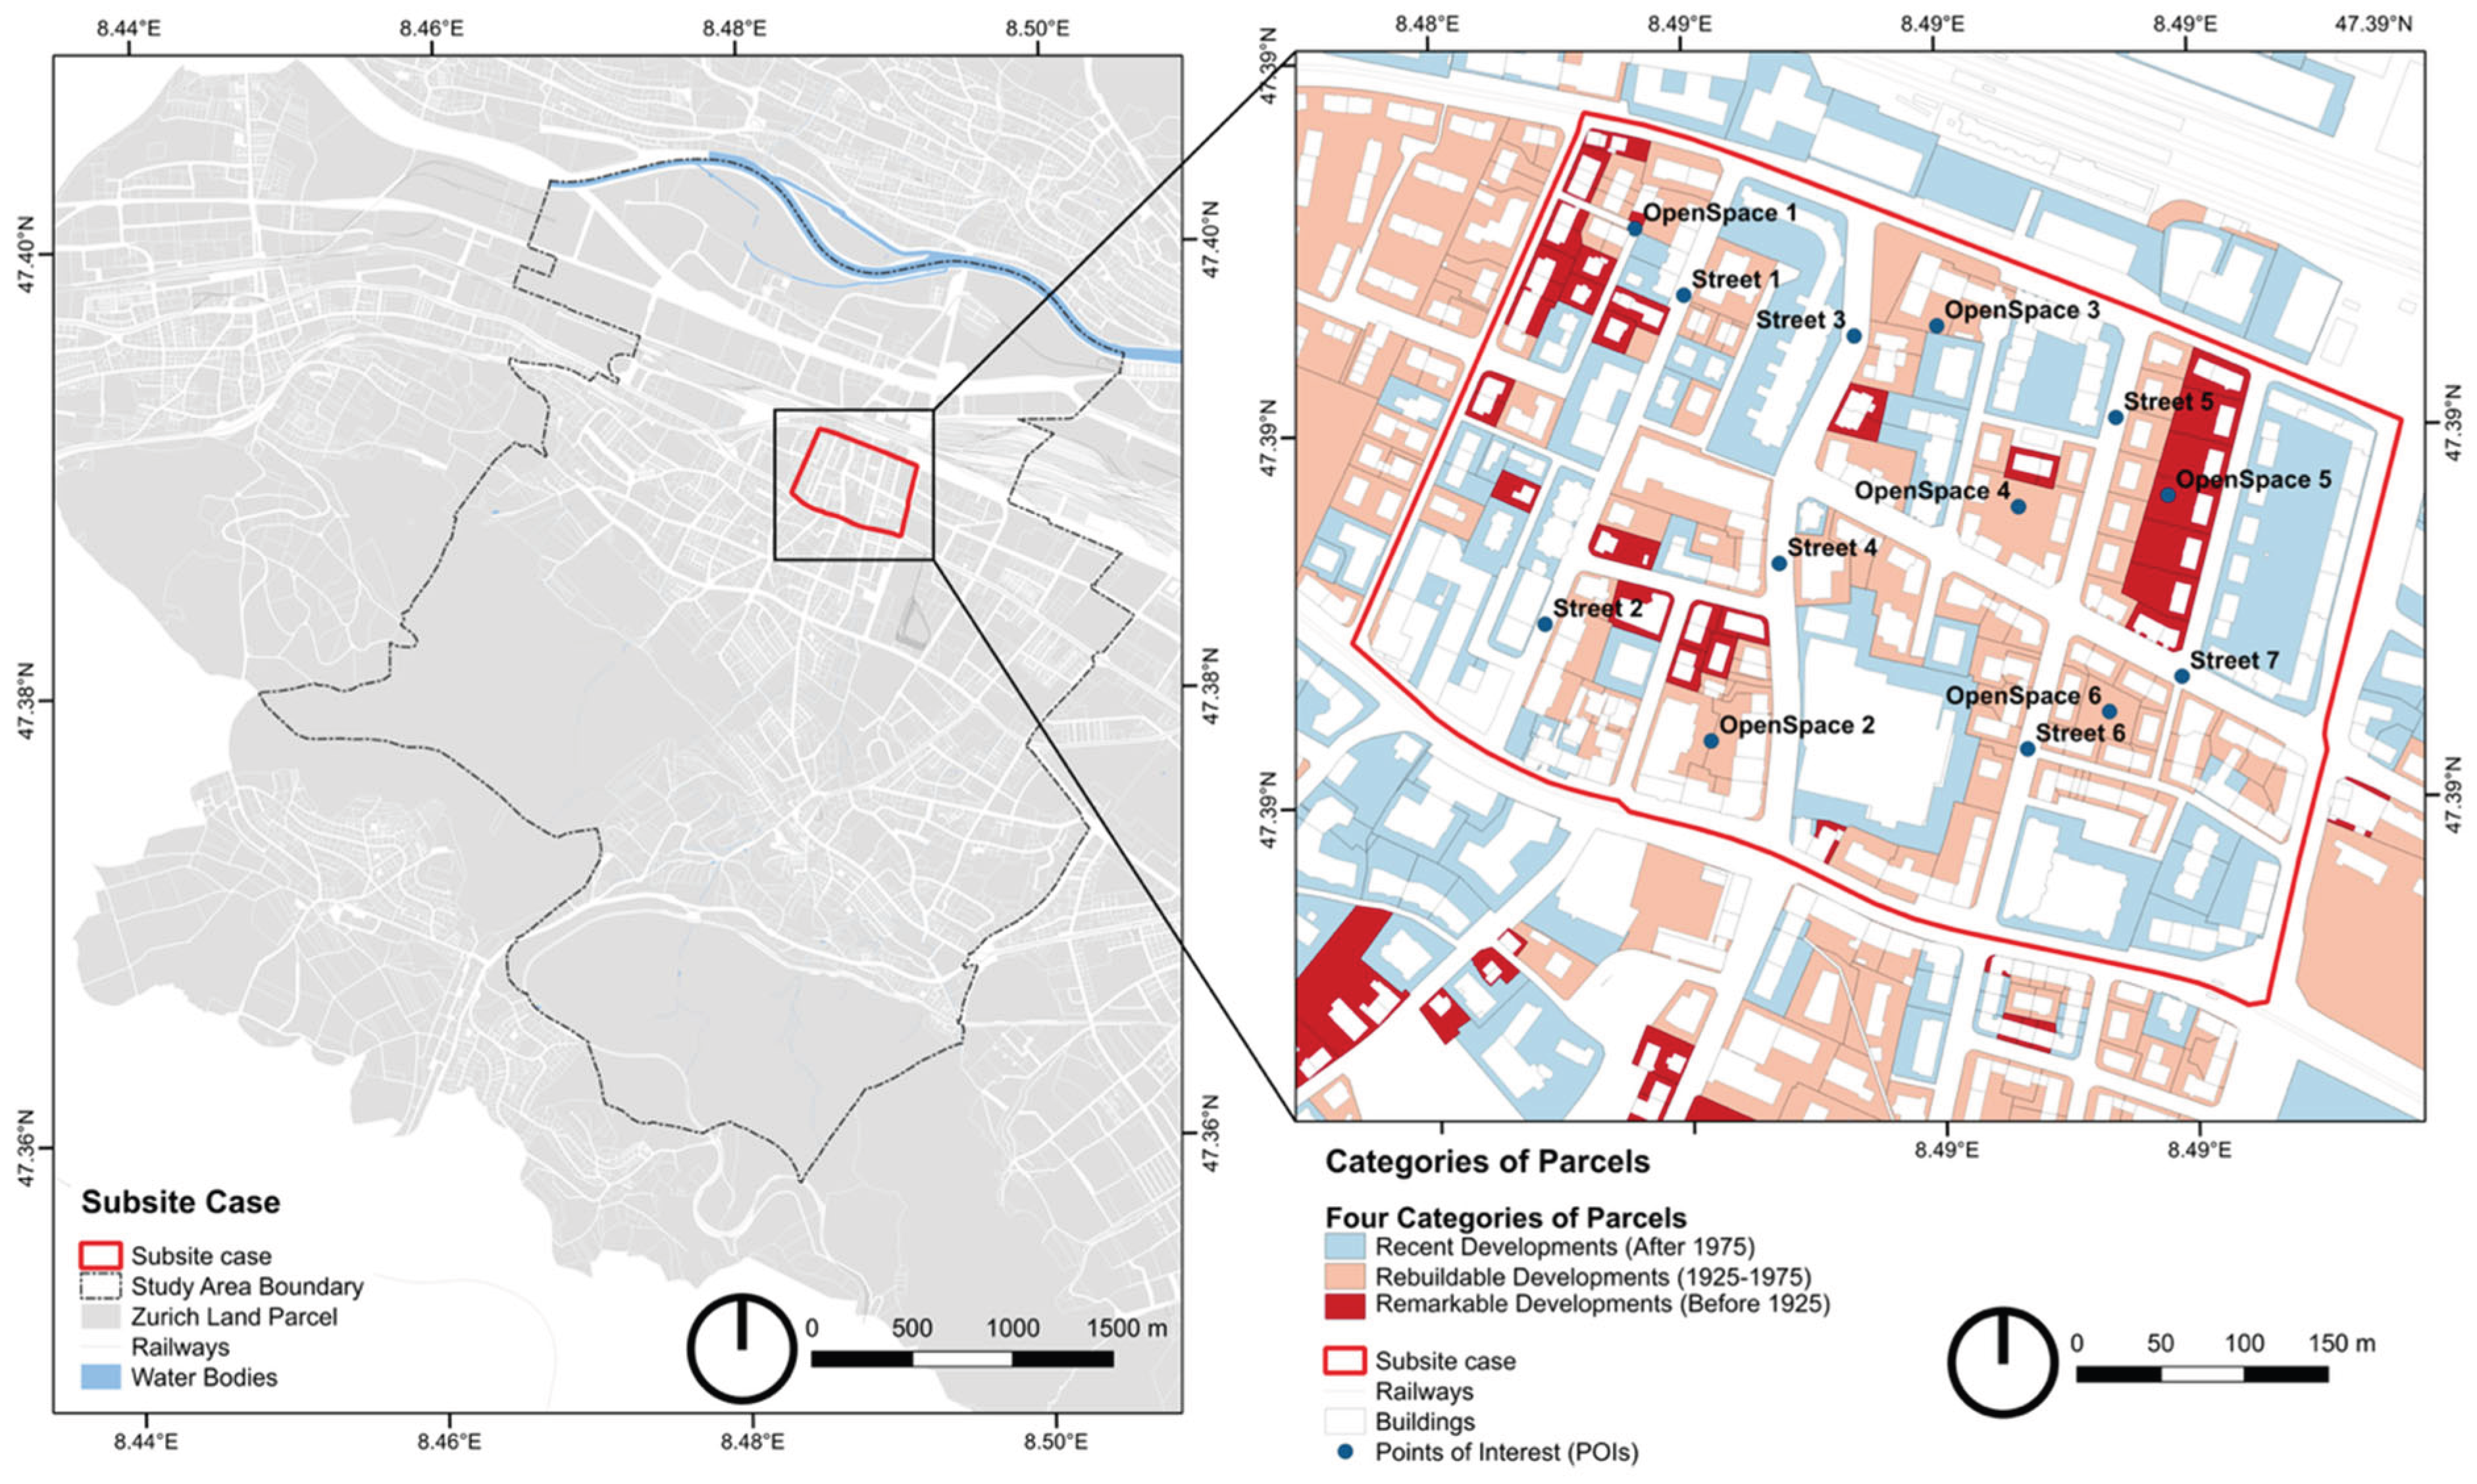
Figure 8.
Exemplary building geometries in the recent developments in Altstetten-Albisrieden.
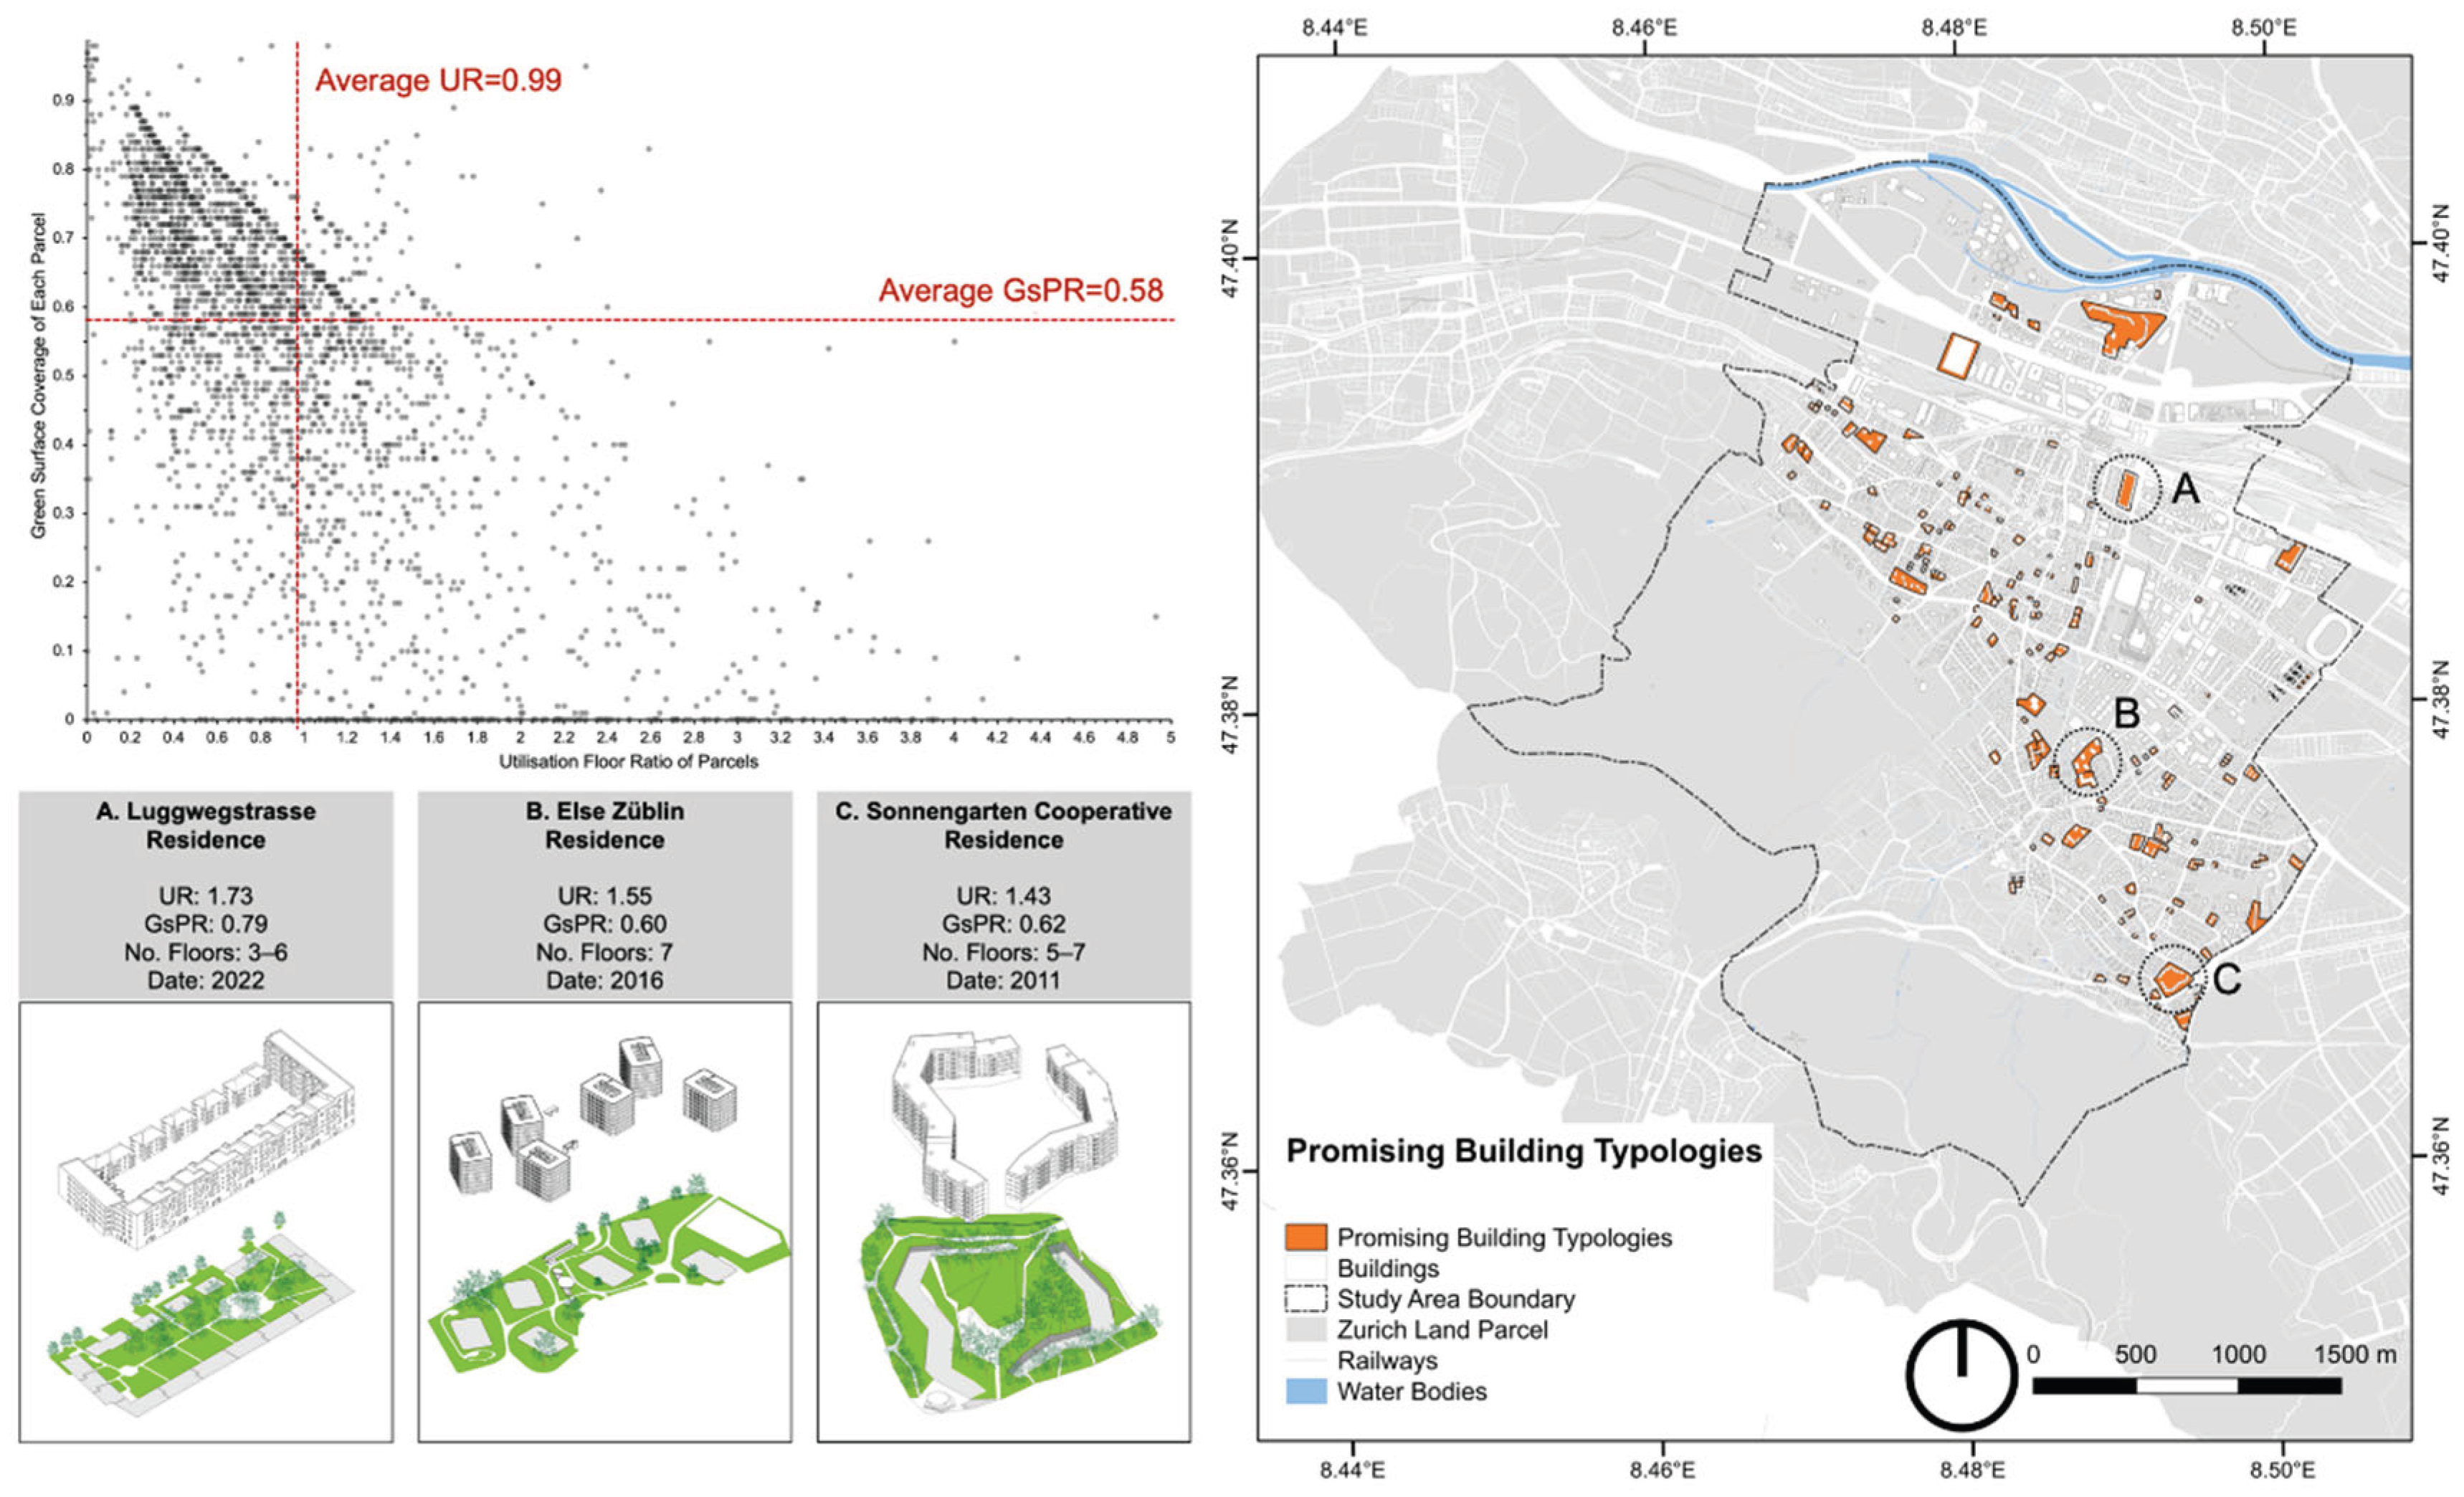
Figure 9.
Upgrade of building and zoning plan from BZO 99 (A) to BZO 2016 (B), taking the Altstetten-Albisrieden district as an example.
Figure 9.
Upgrade of building and zoning plan from BZO 99 (A) to BZO 2016 (B), taking the Altstetten-Albisrieden district as an example.
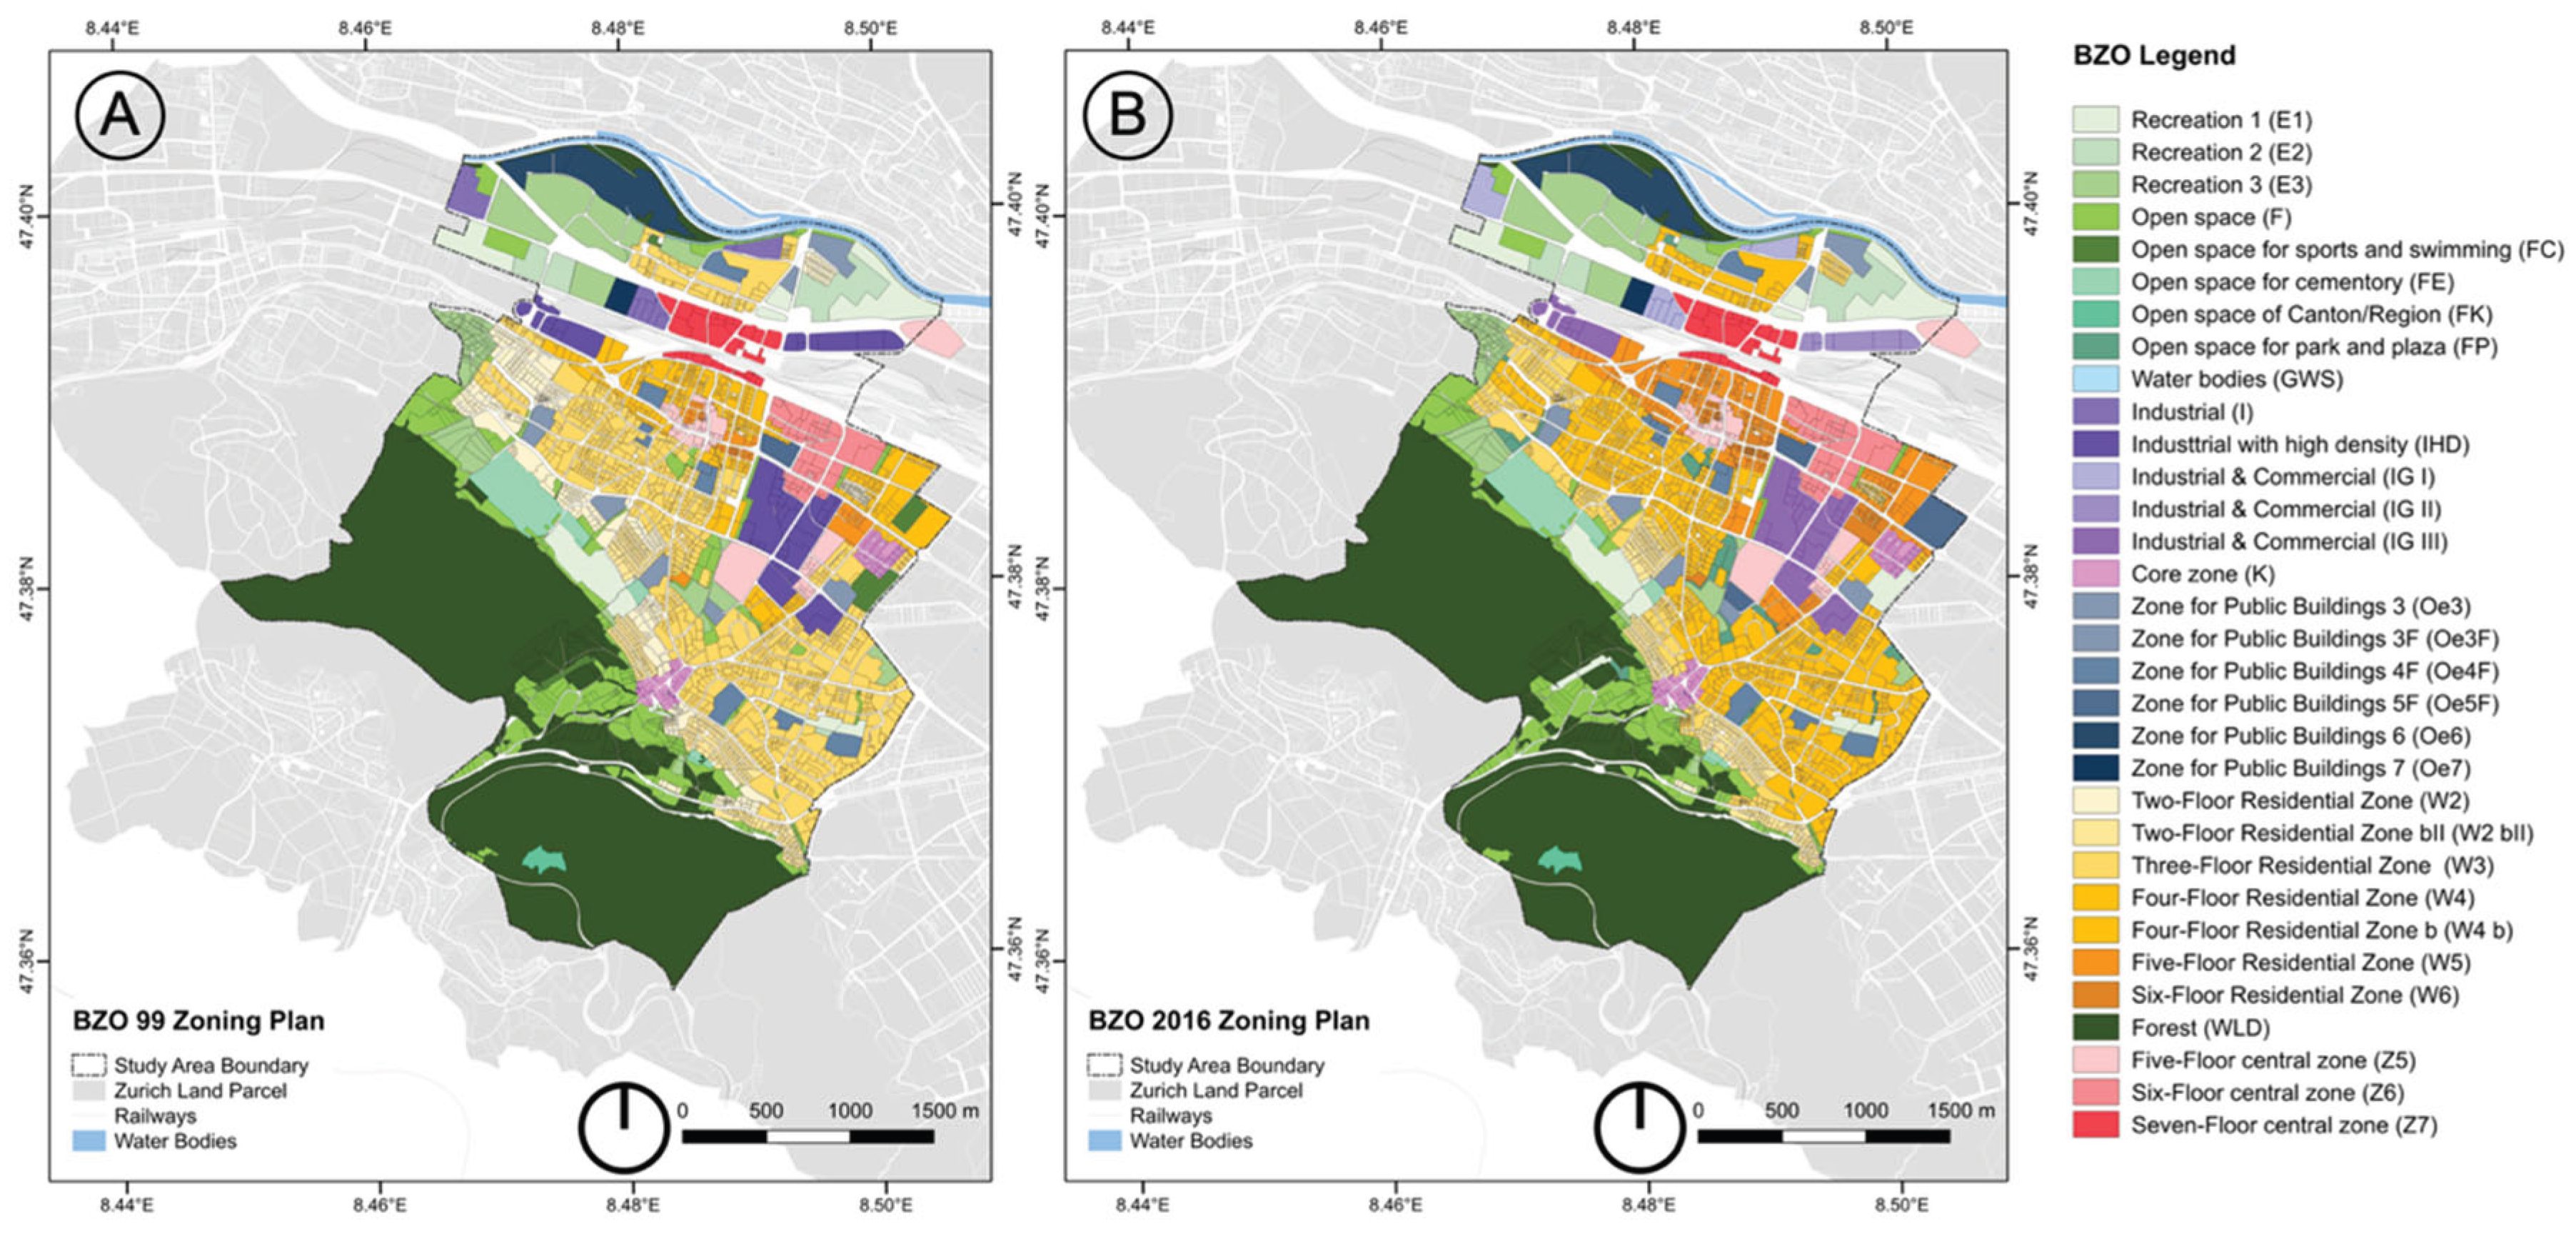
Figure 10.
Variation of utilisation ratio of parcels in five densification scenarios, compared to the current situation.
Figure 10.
Variation of utilisation ratio of parcels in five densification scenarios, compared to the current situation.
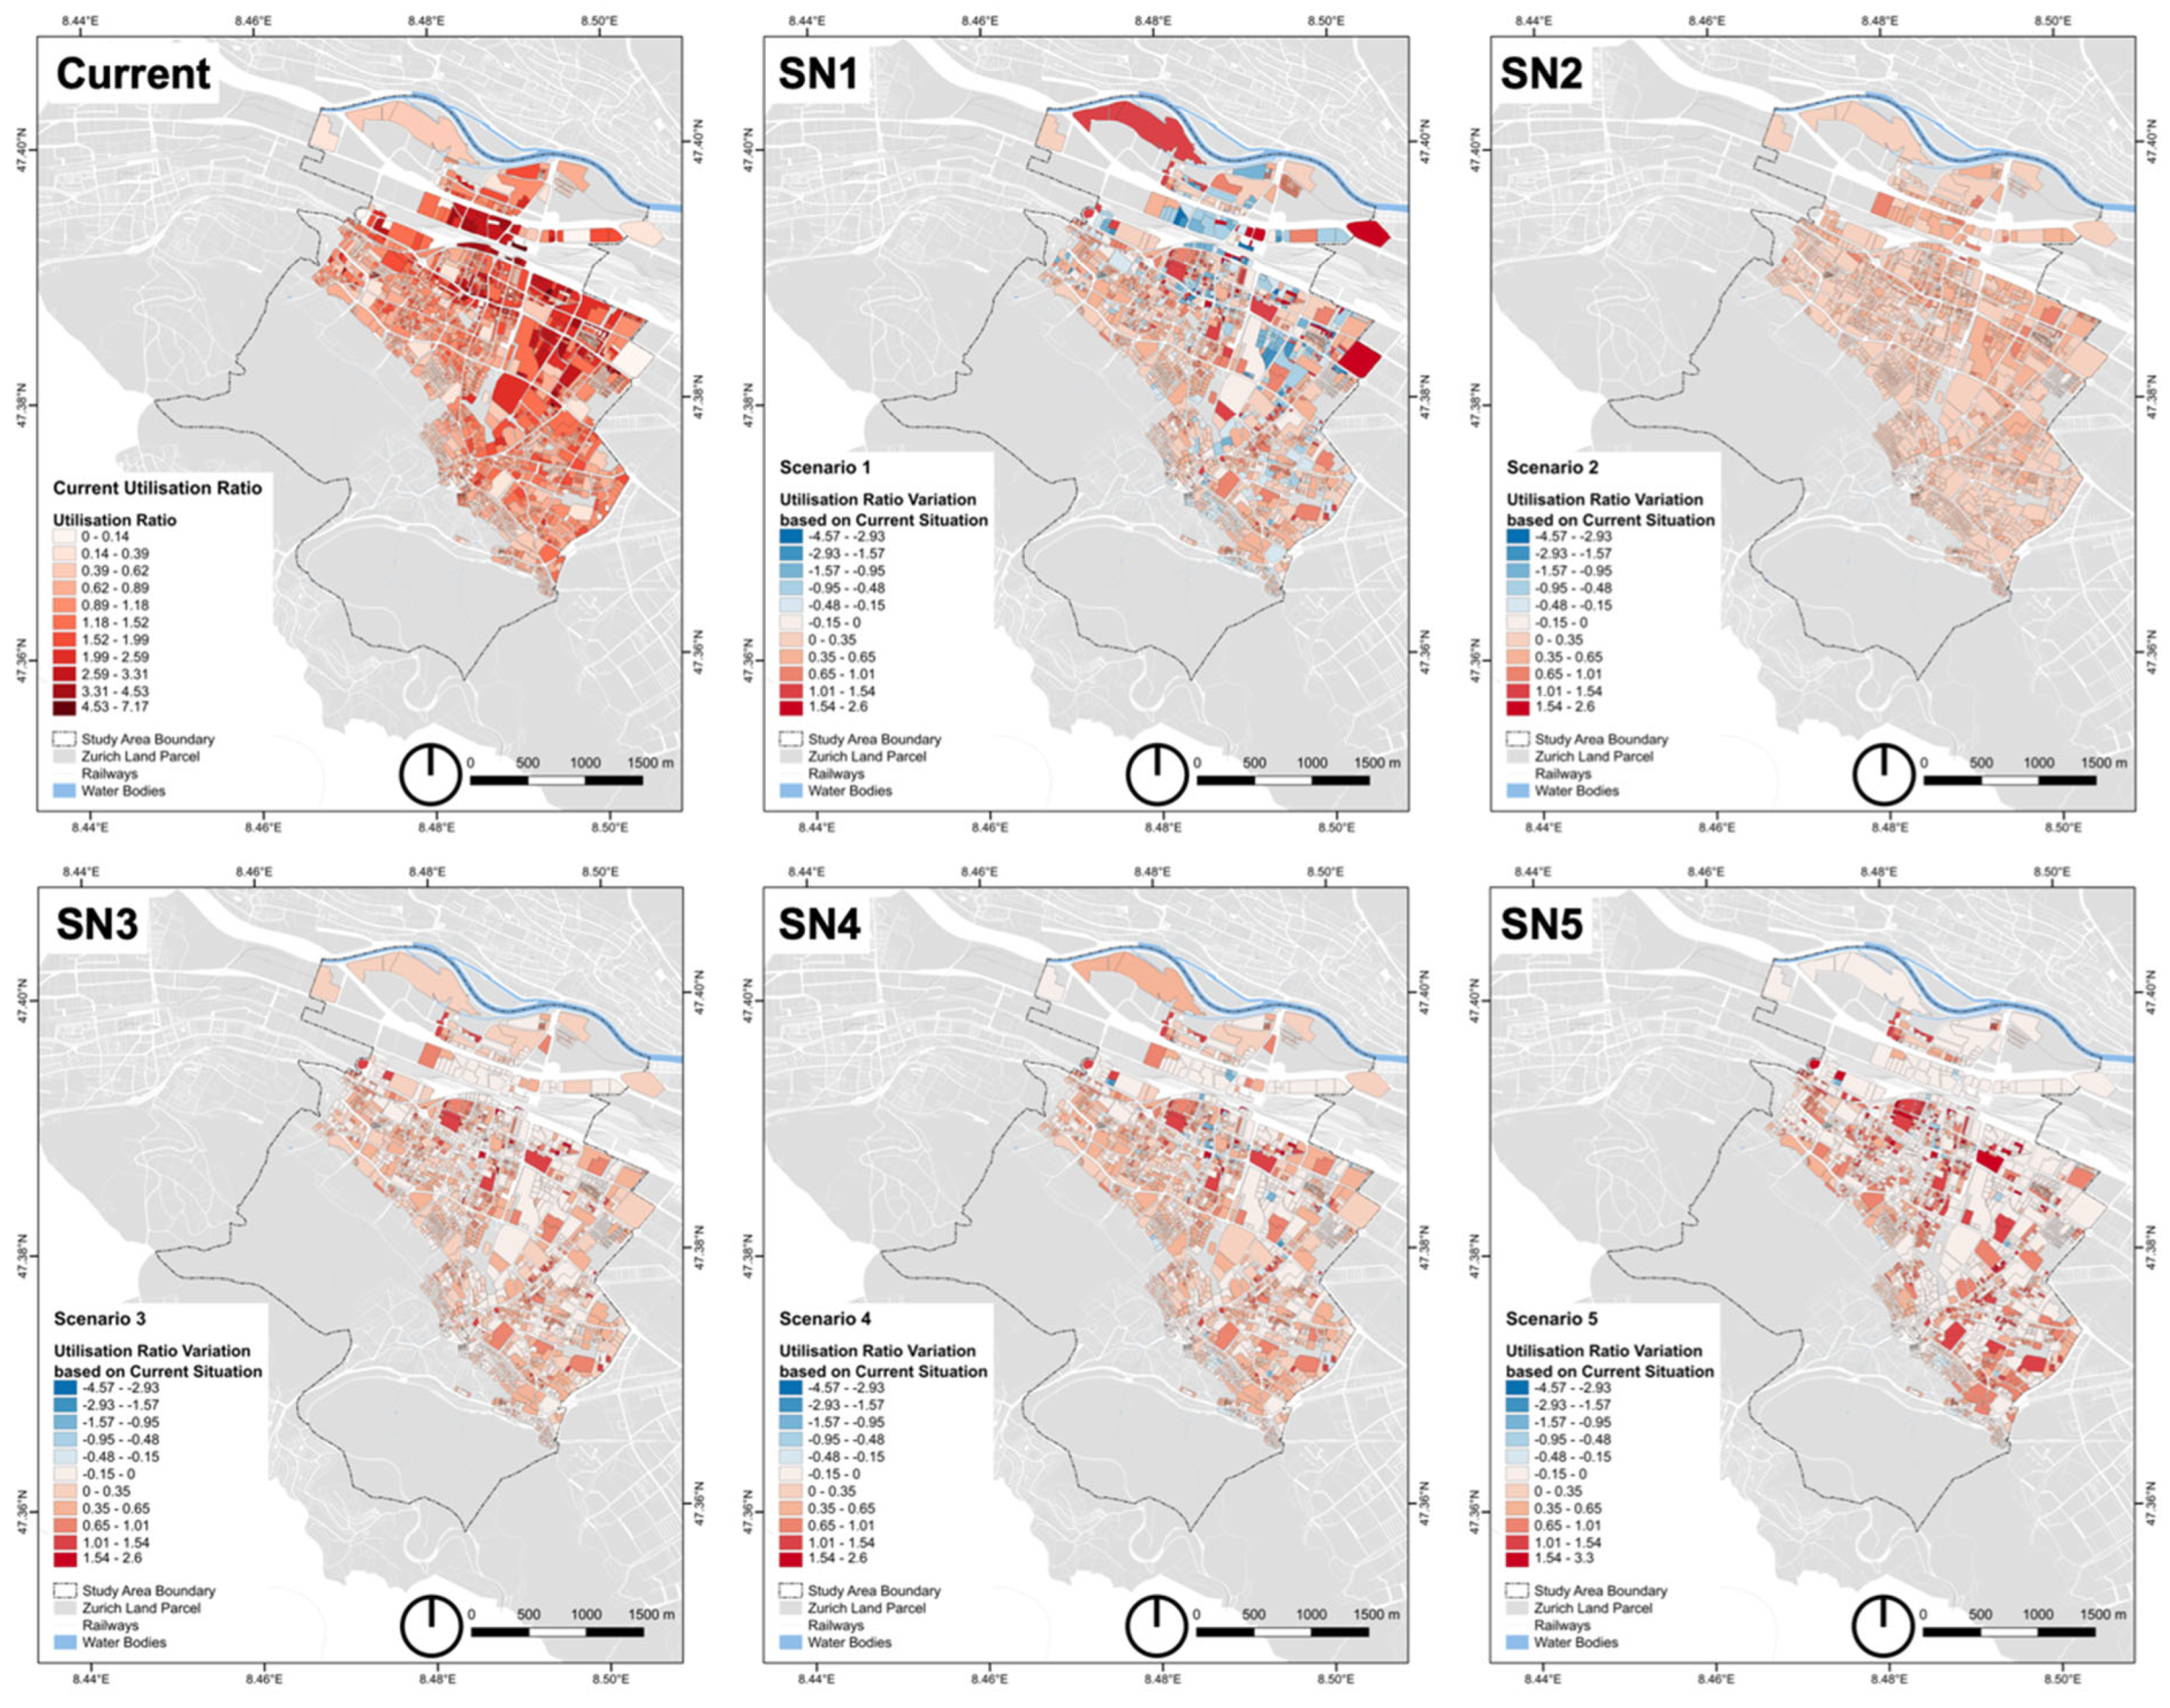
Figure 11.
Diurnal average temperature (Tmrt) in the subsite area by scenarios.
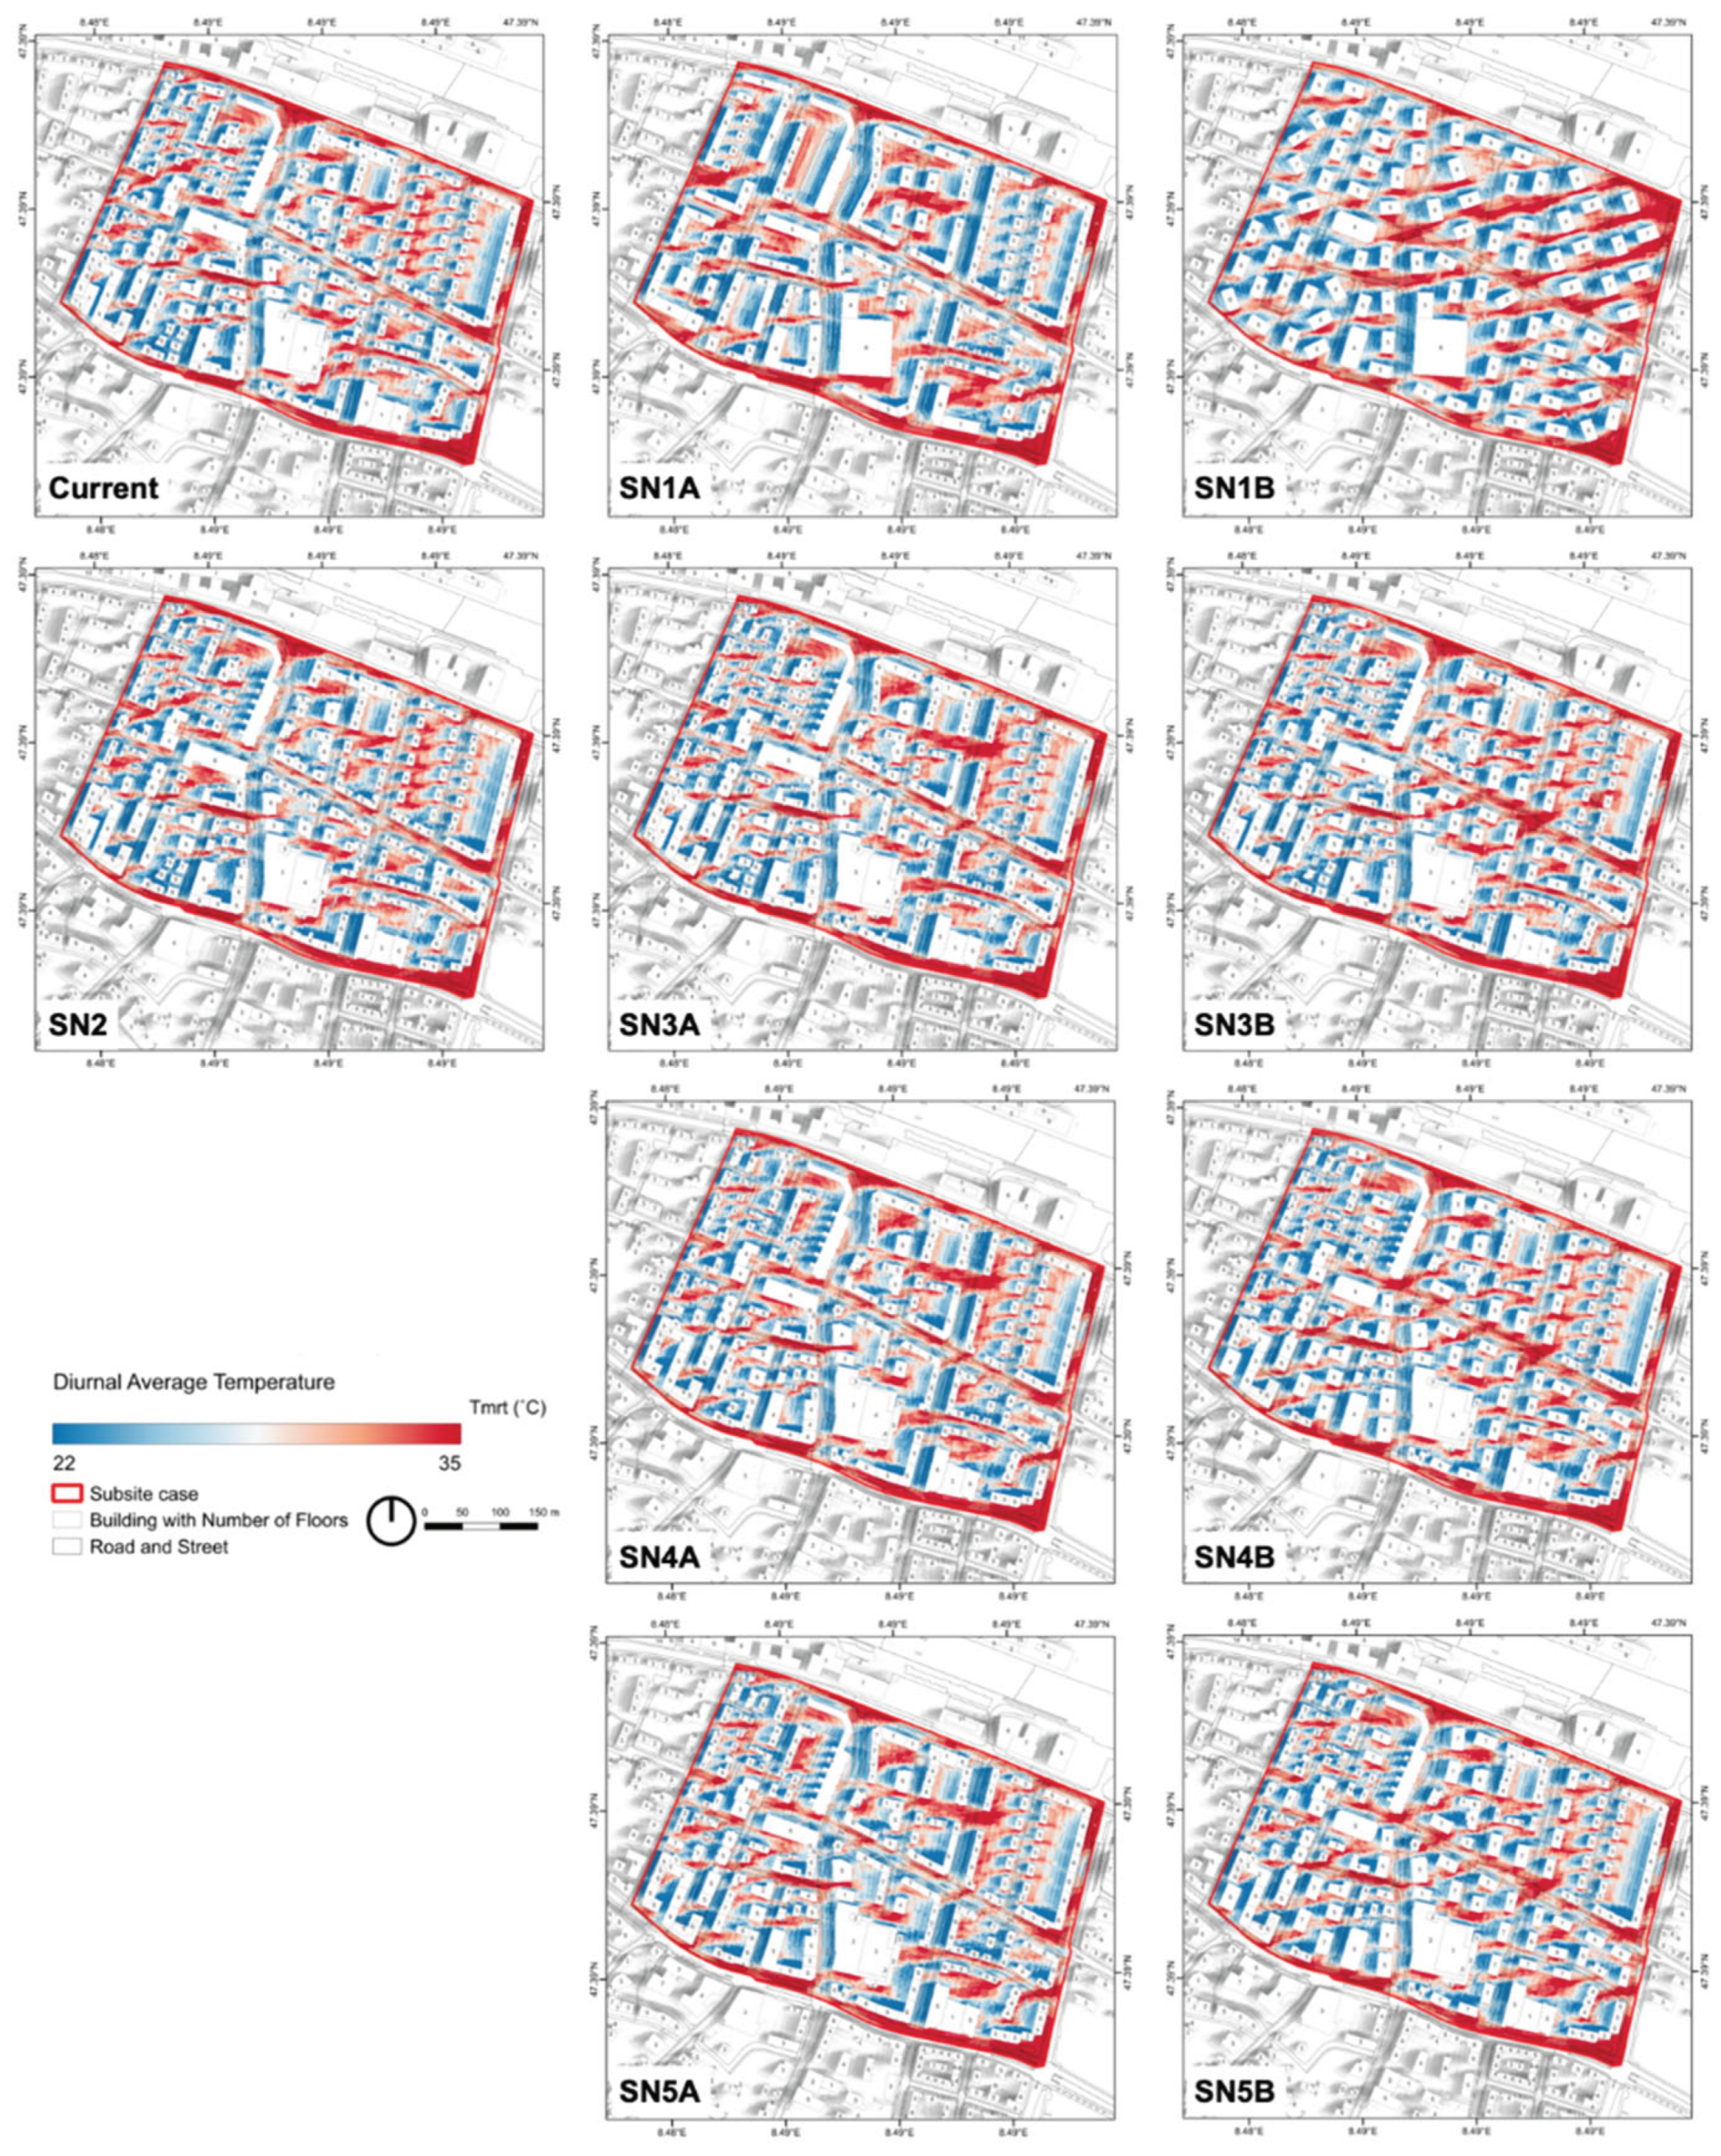
Figure 12.
Simulated average temperature (Tmrt) density profiles by scenarios.
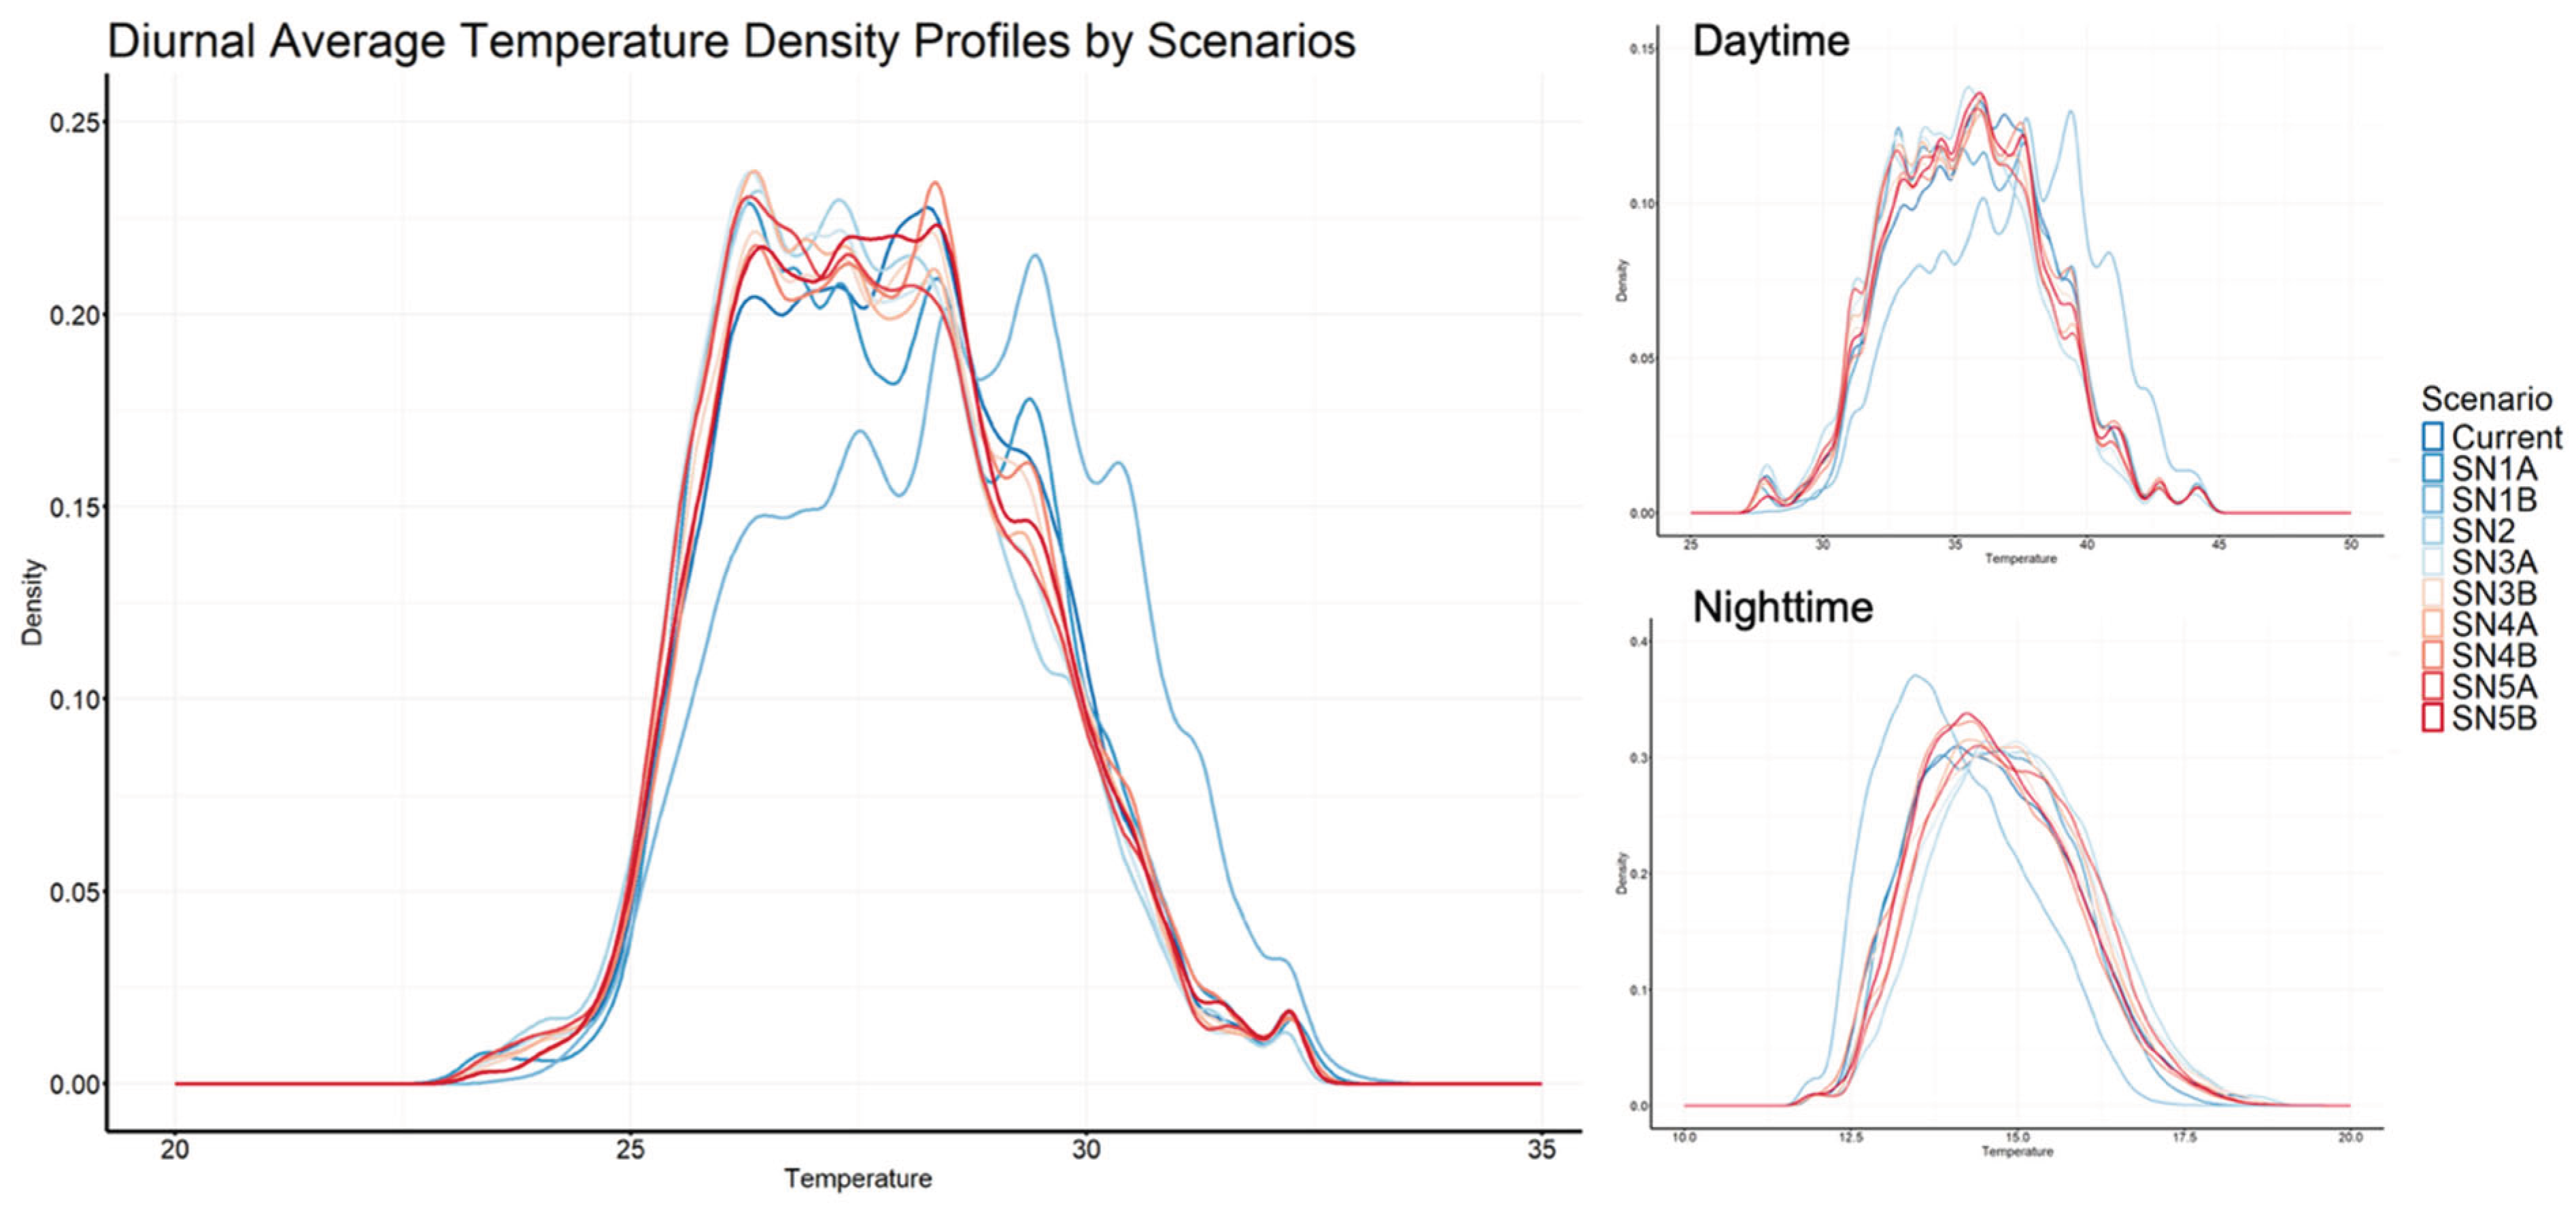
Figure 13.
Average physiological equivalent temperature (PET) of a day at selected points of interest (POIs)by scenarios in the subsite area.
Figure 13.
Average physiological equivalent temperature (PET) of a day at selected points of interest (POIs)by scenarios in the subsite area.
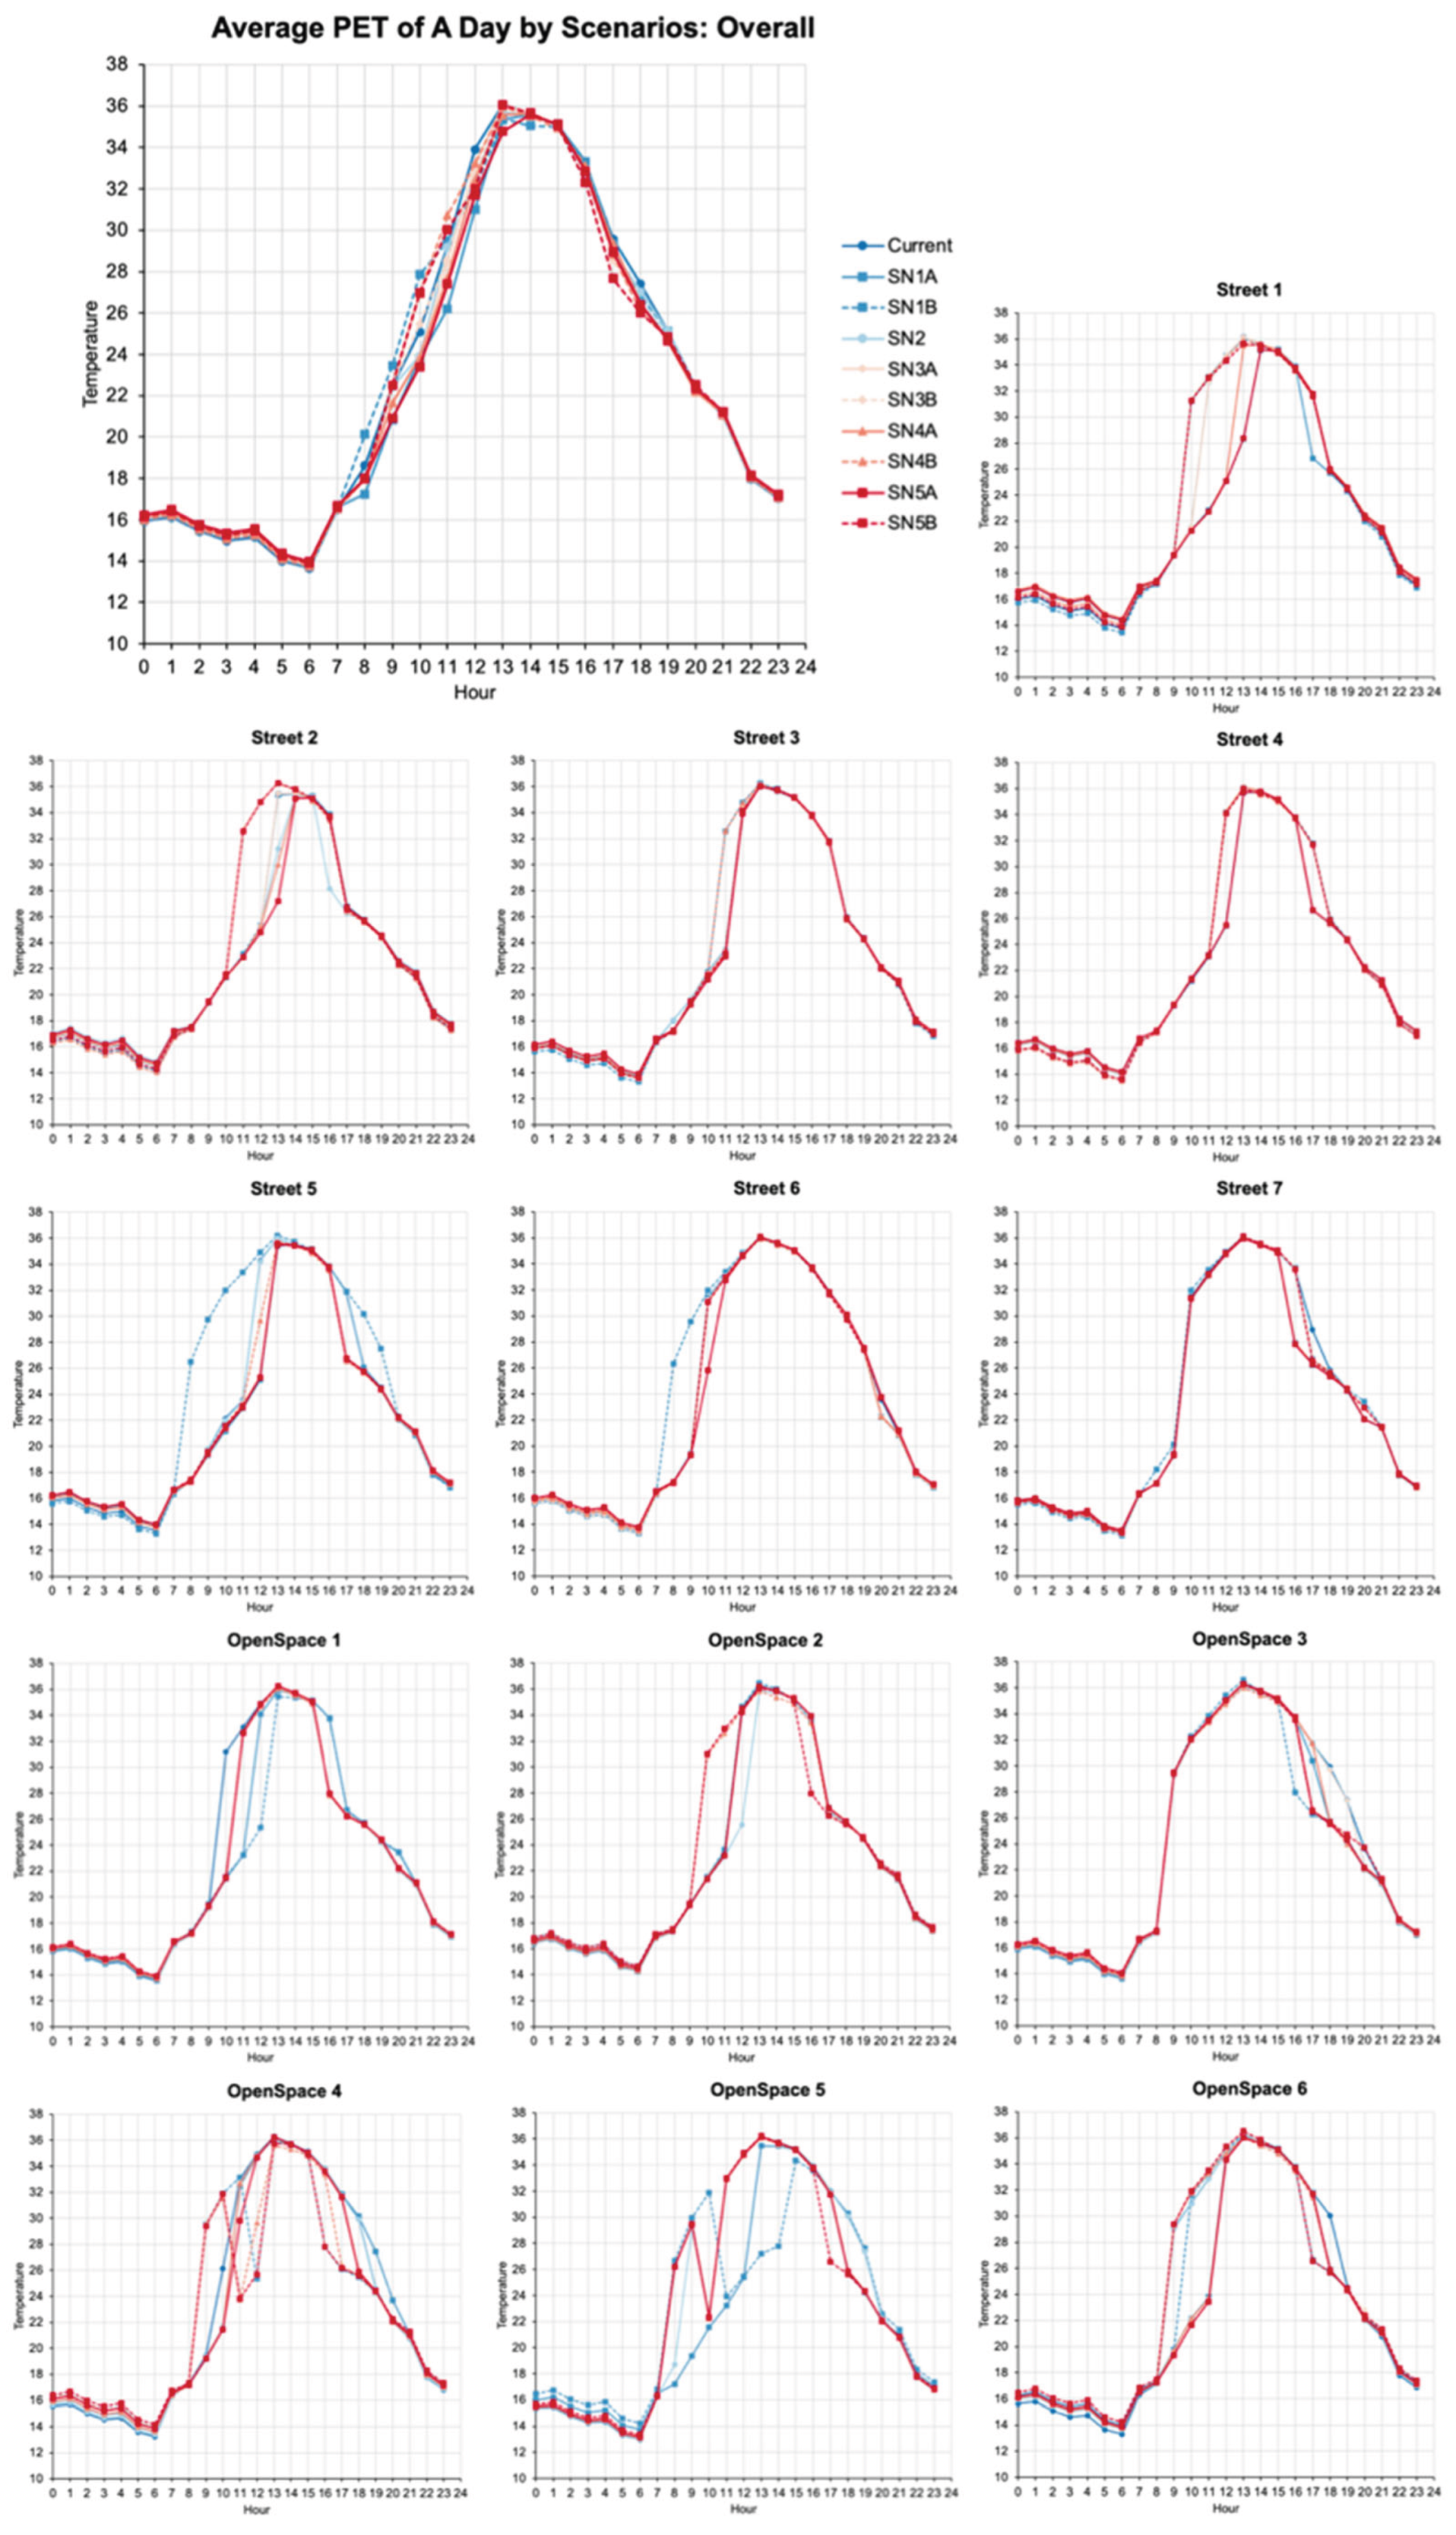
Table 2.
Projection of job positions in Altstetten-Albisrieden based on the rate between jobs and resident populations listed in the last four Quatierspiegel reports.
Table 2.
Projection of job positions in Altstetten-Albisrieden based on the rate between jobs and resident populations listed in the last four Quatierspiegel reports.
| Resident population | Job positions | Rate job/resident | |
|---|---|---|---|
| Altstetten-Albisrieden 2014 | 50,685 | 47,117 | 0.93 |
| Altstetten-Albisrieden 2020 | 56,610 | 54,001 | 0.954 |
| Altstetten-Albisrieden 2022 | 58,517 | 59,149 | 1.011 |
| Altstetten-Albisrieden 2024 | 59,841 | 64,840 | 1.084 |
| Projection of 2040 for this study | 68,100 | 77,112 | 1.132 |
Table 3.
Current development situation of the subsite area.
| Total | Recent development after 1975 | Development 1925-1975 | Remarkable development before 1925 | |
|---|---|---|---|---|
| Number of parcels | 176 | 39 | 100 | 37 |
| Parcel area (m2) | 157,522 | 74,051 | 65,090 | 18,381 |
| Current Floor Area (m2) | 258,450 | 126,555 | 113,113 | 18,782 |
Table 4.
Demands of building floor areas based on the projected population growth and job position increase in Altstetten-Albisrieden.
Table 4.
Demands of building floor areas based on the projected population growth and job position increase in Altstetten-Albisrieden.
| Resident | Job position | |
|---|---|---|
| Altstetten-Albisrieden in 2022 | 58,517 | 59,149 |
| Expected to increase by 2040 | 9,583 | 17,963 |
| Total in 2040 | 68,100 | 77,112 |
| Average area per resident or position (m2) | 45 | 40 |
| Expected to increase floor area (m2) | 431,235 | 718,520 |
| Expected total floor area after an overall redevelopment (m2) | 3,064,500 | 3,084,480 |
| Total expected to increase floor area (m2) | 1,149,755 | |
| Expected total floor area after an overall redevelopment (m2) | 6,148,980 | |
Table 5.
Existing utilisation floor areas and permissible floor areas in the land parcels of three categories in Altstetten-Albisrieden.
Table 5.
Existing utilisation floor areas and permissible floor areas in the land parcels of three categories in Altstetten-Albisrieden.
| All Parcels for development(n= 2894) | Parcels with rebuildable developments 1925-1975(n=1545) | Parcels with recent developments after 1975 (n=1129) | Parcels with remarkable developments before 1925(n=220) | |
|---|---|---|---|---|
| Current floor areas (m2) | 5,150,971 | 1,403,751 | 3,664,680 | 82,540 |
| In the parcels already beyond BZO2016 | 2,574,985 | 423,091 | 2,114,720 | 22,394 |
| In the parcels lower than BZO2016 | 2,588,556 | 980,660 | 1,549,960 | 60,146 |
| BZO-permitted floor areas (m2) | 6,255,359 | 2,042,820 | 4,065,850 | 146,689 |
| In the parcels already beyond BZO2016 | 1,846,436 | 328,830 | 1,499,000 | 16,396 |
| In the parcels lower than BZO2016 | 4,408,923 | 1,713,990 | 2,566,850 | 130,293 |
Table 6.
The estimated overall increment of floor areas in Altstetten-Albisrieden permitted by BZO 2016, calculated from three aspects described in Section 2.5.2.
Table 6.
The estimated overall increment of floor areas in Altstetten-Albisrieden permitted by BZO 2016, calculated from three aspects described in Section 2.5.2.
| Total | Demand for population growth | Difference | |
|---|---|---|---|
| BZO 2016-permitted floor areas (m2) | 6,255,359 | 6,148,980 | 106,367 (+1.7%) |
| Maximum increase permitted by BZO 2016 (m2) | 1,750,220 | 1,149,755 | 600,453 (+52.2%) |
| Only redeveloping those older than 50 years to reach the limits of BZO2016 (m2) | 639,069 | 1,149,755 | -510,698 (-44.4%) |
Table 7.
Five densification scenarios and specific redevelopment means for the parcels of different categories and development intensity.
Table 7.
Five densification scenarios and specific redevelopment means for the parcels of different categories and development intensity.
| Parcels with remarkable building before 1925 | Parcels with buildings constructed 1925-1975 | Parcels with recent building after 1975 | ||||
|---|---|---|---|---|---|---|
| Beyond BZO 2016 | Lower than BZO 2016 | Beyond BZO 2016 | Lower than BZO 2016 | Beyond BZO 2016 | Lower than BZO 2016 | |
| Scenario 1(SN1) | Replacing all buildings of parcels to reach the limits of the BZO 2016 | |||||
| Scenario 2(SN2) | Maintain | Adding one floor to existing buildings | ||||
| Scenario 3(SN3) | Maintain | Maintain | Redevelop as BZO2016 | Maintain | Add floors | |
| Scenario 4(SN4) | Maintain | Redevelop to meet the limits of the BZO 2016 | Maintain | Add floors | ||
| Scenario 5(SN5) | Maintain | Utilisation ratio +27% upon BZO2016 | Maintain | |||
Table 8.
Results of five scenarios.
| Total floor area (m2) | Average UR |
Max. Building footprint (m2) | Min. Open/Green Surface (m2) | |
|---|---|---|---|---|
| Current | 5,150,971 | 0.99 | 1,337,030 | 3,326,100 |
| Scenario 1 (SN1) | 6,255,359 | 1.14 | 2,141,980 | 2,521,150 |
| Scenario 2 (SN2) | 6,433,550 | 1.29 | 1,337,030 | 3,326,100 |
| Scenario 3 (SN3) | 6,313,150 | 1.21 | 1,571,180 | 3,091,950 |
| Scenario 4 (SN4) | 6,345,680 | 1.20 | 1,546,940 | 3,116,190 |
| Scenario 5 (SN5) | 6,327,040 | 1.25 | 1,546,940 | 3,116,190 |
Table 9.
Results of densification in the subsite area, after introducing the exemplary building geometries to specify urban form.
Table 9.
Results of densification in the subsite area, after introducing the exemplary building geometries to specify urban form.
| Total floor area (m2) |
Building footprint (m2) |
Average Floor number |
Average Utilisation ratio |
Ground coverage | |
|---|---|---|---|---|---|
| Current | 258,449 | 67,277 | 3.6 | 1.64 | 32.11% |
| Scenario 1 (SN1) | |||||
| SN1A (Courtyard) | 281,138 | 57,461 | 5.0 | 1.78 | 27.43% |
| SN1B (Tower) | 283,505 | 52,493 | 5.6 | 1.80 | 25.05% |
| Scenario 2 (SN2) | 320,797 | 67,277 | 4.4 | 2.00 | 32.11% |
| Scenario 3 (SN3) | |||||
| SN3A (Courtyard) | 294,987 | 67,124 | 4.3 | 1.87 | 32.04% |
| SN3B (Tower) | 289,730 | 66,038 | 4.2 | 1.84 | 31.52% |
| Scenario 4 (SN4) | |||||
| SN4A (Courtyard) | 285,656 | 64'267 | 4.3 | 1.81 | 30.67% |
| SN4B (Tower) | 283,611 | 63'399 | 4.3 | 1.80 | 30.26% |
| Scenario 5 (SN5) | |||||
| SN5A (Courtyard) | 292,881 | 64,391 | 4.6 | 1.86 | 30.73% |
| SN5B (Tower) | 293,906 | 63,465 | 4.3 | 1.87 | 30.29% |
Table 10.
Simulated mean radiant temperature (Tmrt) at different periods by scenarios.
| Daytime Tmrt (°C) | Nighttime Tmrt (°C) | Diurnal Tmrt (°C) | |||||
|---|---|---|---|---|---|---|---|
| Max. | Min. | Average | Max | Min | Average | Average | |
| Current | 44.616 | 27.393 | 35.684 | 19.515 | 11.668 | 14.652 | 27.797 |
| SN1A | 44.576 | 27.370 | 35.675 | 19.538 | 11.752 | 14.625 | 27.781 |
| SN1B | 44.739 | 27.749 | 37.103 | 18.449 | 11.643 | 14.026 | 28.449 |
| SN2 | 44.533 | 27.310 | 35.083 | 19.538 | 11.746 | 15.030 | 27.563 |
| SN3A | 44.614 | 27.353 | 35.236 | 19.538 | 11.668 | 14.889 | 27.606 |
| SN3B | 44.614 | 27.354 | 35.512 | 19.538 | 11.668 | 14.737 | 27.721 |
| SN4A | 44.590 | 27.349 | 35.348 | 19.538 | 11.726 | 14.802 | 27.643 |
| SN4B | 44.590 | 27.354 | 35.734 | 19.538 | 11.726 | 14.583 | 27.803 |
| SN5A | 44.616 | 27.315 | 35.274 | 19.538 | 11.668 | 14.868 | 27.622 |
| SN5B | 44.616 | 27.354 | 35.592 | 19.515 | 11.668 | 14.678 | 27.749 |
Disclaimer/Publisher’s Note: The statements, opinions and data contained in all publications are solely those of the individual author(s) and contributor(s) and not of MDPI and/or the editor(s). MDPI and/or the editor(s) disclaim responsibility for any injury to people or property resulting from any ideas, methods, instructions or products referred to in the content. |
© 2025 by the authors. Licensee MDPI, Basel, Switzerland. This article is an open access article distributed under the terms and conditions of the Creative Commons Attribution (CC BY) license (http://creativecommons.org/licenses/by/4.0/).
Copyright: This open access article is published under a Creative Commons CC BY 4.0 license, which permit the free download, distribution, and reuse, provided that the author and preprint are cited in any reuse.


