
Submitted:
09 September 2025
Posted:
10 September 2025
You are already at the latest version
Abstract
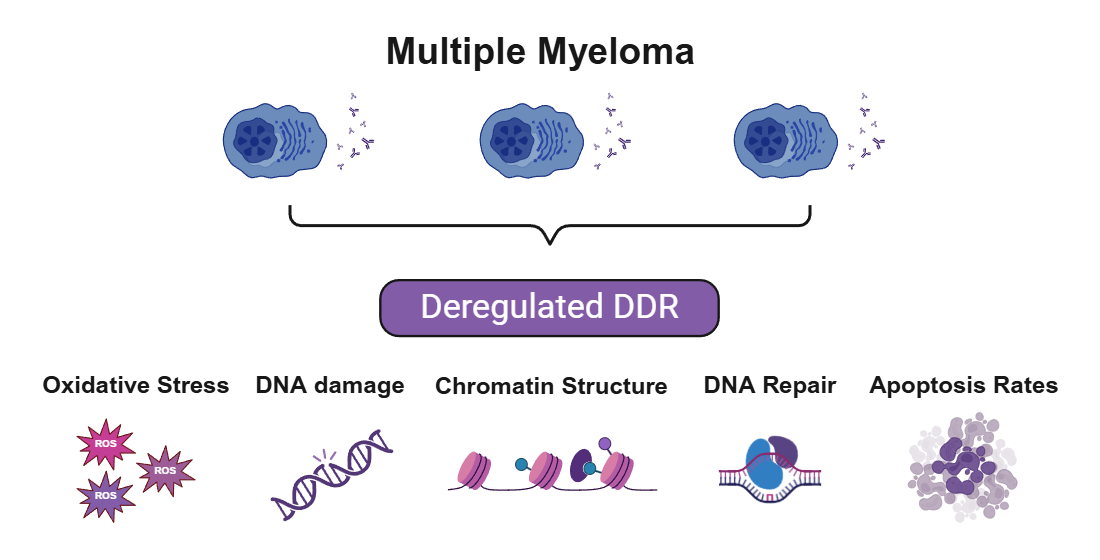
The DNA Damage Response (DDR) network is an essential machinery for maintaining genomic integrity, with DDR defects being implicated in cancer initiation, progression and treatment resistance. Moreover, oxidative stress, an imbalance between reactive oxygen species production and antioxidant defence, can significantly impact cell viability, leading to cell death or survival. Herein, we tested the hypothesis that DDR-related signals and oxidative stress status measured in multiple myeloma (MM) cell lines correlate with the sensitivity to genotoxic insults. In a panel of eleven human MM cell lines and one healthy B lymphoblastoid cell line, oxidative stress, apurinic/apyrimidinic sites and DDR-related parameters, including endogenous/baseline DNA damage, critical DNA repair mechanisms, chromatin condensation and apoptosis rates were evaluated. We found that MM cell lines with increased apoptosis rates displayed significantly higher levels of endogenous/baseline DNA damage, increased oxidative stress and apurinic/apyrimidinic lesions, decreased nucleotide excision repair and interstrand crosslinks repair capacities and highly condensed chromatin structure. Taken together, these findings demonstrate that DDR-related parameters and redox status correlate with the sensitivity of MM cells to DNA damaging agents and, if further validated, may be exploited as novel therapeutic targets and sensitive/effective biomarkers.
Keywords:
multiple myeloma (MM)
; DNA damage response (DDR)
; oxidative stress
; chromatin condensation
; resistance to genotoxic treatment
; nucleotide excision repair (NER)
; apurinic/apyrimidinic sites
; interstrand crosslinks (ICL)
; apoptosis rates
; melphalan
1. Introduction
Multiple Myeloma (MM) is a hematological malignancy characterised by the clonal expansion of malignant plasma cells. The disease is usually preceded by asymptomatic precursor conditions, namely monoclonal gammopathy of undetermined significance (MGUS) and smoldering multiple myeloma (sMM) [1]. MGUS has an annual risk of progression ranging at 1%, while sMM represents an intermediate state with increased progression rates up to 10% per year for the first five years after diagnosis [2,3]. MM accounts for 10% of all hematologic malignancies and is slightly more common in men, with age ranging at 66-70 years at diagnosis [4,5,6]. In many patients, genetic heterogeneity, chromosomal instability and replication stress are present. These events accumulate during the transformation process of myelomagenesis and progressively complicate the disease landscape [7,8]. Today, treatment approaches vary based on disease stage, patient health, and individual needs, often involving a combination of therapies. Key treatments include chemotherapy, targeted therapy, immunotherapy and stem cell transplant [9]. A common starting point in ΜΜ treatment involves chemotherapy, with the primary goal of reducing the number of abnormal plasma cells. Melphalan-based treatments have long served as a gold-standard therapy, exploiting the vulnerability of cancer cells to DNA damage. However, treatment often fails due to pre-existing and therapy-induced resistance, as cancer cells escape its effects [10,11,12]. Drugs like proteasome inhibitors (bortezomib, carfilzomib, ixazomib), immunomodulatory drugs (ImiDs; thalidomide, lenalidomide, pomalidomide), and B-cell maturation antigen (BCMA)-targeted therapies are also used to target specific proteins on myeloma cells [13,14,15]. Interestingly, Chimeric antigen receptor (CAR) T-cell therapy, a type of immunotherapy that modifies patient’s own T-cells to target and destroy cancer cells, has shown promise in treating MM, particularly in relapsed or refractory cases [16]. Autologous stem cell transplant (using the patient’s own cells) is often used, especially for eligible patients, to replace damaged bone marrow cells with healthy ones [17].
MM is characterized by increased oxidative stress, partly due to the augmented production of immunoglobulins by plasma cells, which leads to endoplasmic reticulum stress and the generation of reactive oxygen species (ROS) [18]. A growing number of studies have shown that oxidative stress contributes to the development and progression of MM, as well as influences the response to treatment and the development of drug resistance [19,20]. Indeed, the redox status of MM cells plays a crucial role in their response to therapies like proteasome inhibitors, with recent studies showing that the increase in oxidative stress can be a strategy to induce cell death in MM cells [19]. On the other hand, MM cells adapt to the increased oxidative stress by developing antioxidant defense mechanisms. This adaptation can lead to chemoresistance, as the cells become more capable of neutralizing the effects of drugs that induce oxidative stress [21]. The intimate relationship between redox status, MM progression and treatment response has made it a target for potential therapeutic interventions. Several markers are used to assess oxidative stress in MM, including malondialdehyde and advanced oxidation protein products, which are found at higher levels in MM patients compared to healthy individuals [22]. MM cells also exhibit altered levels of glutathione, a key antioxidant tripeptide, as well as antioxidant enzymes, like superoxide dismutase, glutathione peroxidase and catalase [19]. The ratio of reduced (GSH) to oxidized (GSSG) glutathione can serve as a critical indicator of cellular redox status.
The genome of all organisms is under continuous threat by both endogenous factors such as oxidation, DNA alkylation, hydrolysis, mismatching of DNA bases and replication fork collapse, as well as by external insults like chemotherapeutic agents and radiation, including ultraviolet (UV) and ionizing radiation. To maintain their genomic integrity, cells have evolved a complex machinery of sensors and effectors known as the DNA Damage Response (DDR) network [23]. This network can detect DNA lesions and orchestrate their repair through the coordinated action of DDR pathways. Several deficiencies in core molecules of DDR influence the cells fate for the detection and repair of DNA lesions and lead to genomic instability, which is a hallmark of cancer [24]. In MM, an increasing body of evidence highlights the critical role that DDR aberrations play in the pathogenesis and progression of the disease as well as in the resistance to therapy [12,25,26]. These aberrations might be the result of a fundamental defect in the malignant plasma cells’ capacity to recognize and remove errors, leading to a mutator phenotype [27]. A variety of genetic alterations and abnormalities are acquired by malignant plasma cells throughout the onset and progression of MM. In fact, loss-of-function mutations in critical DDR components, such as ATM, TP53, and TP73 are common in MM and hinder the apoptotic response to DNA damage [12]. Interestingly, more severe disease and treatment resistance are correlated with the activation of DNA repair mechanisms to correct these DNA errors [12].
In this study, we tested the hypothesis that DDR-associated parameters and oxidative stress status correlate with the sensitivity to genotoxic insults. Therefore, in a panel of human myeloma cell lines we measured apoptosis rates, endogenous/baseline DNA damage, critical DNA repair mechanisms, namely nucleotide excision repair (NER), interstrand crosslinks (ICL) repair and double-strand breaks (DSBs) repair, the degree of chromatin condensation, the oxidative stress status and apurinic/apyrimidinic lesions. Our findings revealed a substantial heterogeneity in redox status and DDR function across the MM cell lines analysed, identifying specific subgroups that may be more vulnerable to genotoxic treatment.
2. Results
2.1. MM Cell Lines Showed Differential Sensitivity to Genotoxic Insults
Firstly, in eleven human MM cell lines (HMCLs) and one healthy B lymphoblastoid cell line the apoptosis rates as a marker of cells’ sensitivity to genotoxic insults were measured. To trigger apoptosis, cell lines were treated in vitro with melphalan, a model genotoxic compound, and apoptosis rates were measured 24h after treatment. We found that HMCLs exhibited varying rates of apoptosis (Figure 1A). Interestingly, the highest doses of melphalan required to trigger apoptosis were observed in AMO1 and XG-6 cell lines, indicating that these cell lines are characterized by the lowest apoptosis rates. On the other hand, MM1S and OPM2 showed the highest apoptosis rates.
2.2. DDR-Related Parameters in MM Cell Lines at Baseline
To investigate the basis of this differential sensitivity to genotoxic insults, we evaluated several DDR-related factors at baseline. The presence of the endogenous/baseline DNA damage (SSBs and DSBs) was measured using comet assay under alkaline conditions (Figure 1B). HMCLs showed differential DNA damage burden with MM1S and OPM2 showing the highest values while AMO1, XG-6 the lowest ones. Moreover, we assessed crucial factors, namely oxidative stress and apurinic/apyrimidinic sites that contribute to the intracellular production of SSBs and DSBs. MM cell lines also showed differential levels of these factors examined. Particularly, MM1S and OPM2 cell lines showed the lowest GSH/GSSG ratio, indicating the highest levels of oxidative stress (Figure 1C) and the highest apurinic/apyrimidinic sites (Figure 1D). Moreover, AMO1 and XG-6 cells exhibited relatively low levels of oxidative stress and apurinic/apyrimidinic sites.
2.3. NER Capacity of MM Cell Lines
For NER studies, HMCLs were irradiated by increasing UVC doses (0-100 J/m2), which lead to the formation of 6-4 photoproducts (6-4PPs) and cyclobutane pyrimidine dimers (CPDs), i.e., DNA adducts that are repaired almost exclusively by the NER mechanism. Viability assay [3-(4,5-dimethylthiazol-2-yl)-2,5 diphenyl tetrazolium bromide; MTT] showed the appropriate UVC dose, with viability threshold of greater than 70% (Supplementary Figure S1). The optimum dose in this experimental procedure was adjusted at 50 J/m2 and alkaline comet assay was then performed upon the desired timepoint of 0, 1, 2, 4 and 6h. In all cell lines, maximal levels of DNA damage were observed at 2h following UVC irradiation, decreasing thereafter (Figure 2A, B and Supplementary Figure S2A). Significant differences in the efficiencies of NER [expressed as the Area Under the Curve (AUC) for DNA adducts during the experiment (0–6h)] were observed between the HMCLs analyzed (Figure 2C). Interestingly, MM1S and OPM2 that are characterized by the highest levels of apoptosis, endogenous/baseline DNA damage, oxidative stress and AP-sites, also showed the highest AUC values, indicating the worst capacity for NER. On the other hand, AMO1 and XG-6 (cell lines with the lowest levels of apoptosis, endogenous/baseline DNA damage, oxidative stress and AP-sites) showed the best NER capacity.
Furthermore, UVC-induced increase in oxidative stress (Figure 3A, B and Supplementary Figure S2B) and AP-sites (Figure 3C, D and Supplementary Figure S2C) were observed in all treated samples, with MM1S and OPM2 showing the highest levels, while AMO1 and XG-6 the lowest ones.
Previous studies have shown that nucleotide excision repair is greatly affected by the local chromatin structure [28], and that the NER efficiency of the N-ras gene correlates with melphalan-induced apoptosis [29,30]. Therefore, herein, we analyzed chromatin condensation in the N-ras gene, using micrococcal nuclease digestion of HMCLs at baseline. As shown in Figure 3E, MM cell lines showed varying degrees of chromosomal condensation. That is, AMO1 and XG-6 cell lines, which are characterized by high DNA repair capacities, showed greater looseness of chromatin structure, since the N-ras gene gave rise mostly to mono- and di-nucleosome structures, with a significant portion in mono-nucleosomes. On the other hand, the same gene in cell lines that showed low DNA repair capacity (MM1S and OPM2), showed condensed chromatin, since it gave rise to di-, tri-nucleosomes and higher structures.
2.4. ICL Formation and Repair Capabilities in MM Cell Lines
To measure the efficiency of the ICL repair, HMCLs were treated with 100μg/ml melphalan for 5min, and the ICL formation/repair was followed for 0, 2, 8, 24 and 48 hours (Figure 4A, B and Supplementary Figure S3A). In all cell lines examined, maximal ICL levels were obtained at 8h following melphalan treatment. In addition, a melphalan-induced increase in oxidative stress (Figure 4C, D and Supplementary Figure S3B) and AP-sites (Figure 4E, F and Supplementary Figure S3C) was found in all HMCLs analyzed. In line with the NER results, MM1S and OPM2 showed the worst ICL repair capacity and the highest melphalan-induced oxidative stress and AP-sites.
2.5. DSB Repair Capacity of MM Cell Lines
To evaluate DSB repair efficiency, we monitored γH2AX and RAD51 foci kinetics across HMCLs following melphalan treatment (Figure 5A). Formation of γH2AX foci was rapidly induced in all cell lines, with peak levels typically observed between 16 to 24 hours post-treatment (Figure 5B). However, the pattern of γH2AX accumulation in the cell lines examined was different from that found in the other DDR-associated parameters mentioned above. Indeed, XG-6 cell line showed maximal levels of γH2AX accumulation with the MM1S, OPM2, SKMM2, RPMI-8226, XG-7, XG-1 and AMO1 exhibiting similar AUC values (Figure 5A-C). In parallel, HMCLs showed differential RAD51 foci kinetics, with LP1, OPM2 and XG-6 displaying robust RAD51 induction and high RAD51 AUC values, whereas MM1S, SKMM2, RPMI-8226, U266 and AMO1 showed significantly lower RAD51 responses (Figure 5D, E).
2.6. Statistical Analysis of DDR Parameters Across MM Cell Lines
In the same eleven HMCLs and one healthy B lymphoblastoid cell lines, eight molecular markers were analyzed (Apoptosis rates, endogenous/baseline DNA damage levels, GSH/GSSG ratio and AP-sites as well as repair mechanisms; NER, ICL/R and DSB repair involvement with foci such as γH2AX and RAD51). The results of the correlation analysis between the markers of the cell lines are presented in Table 1. Apoptosis rates were negatively correlated with all the markers (DNA damage: Rho = -0.918, p = 0.01; AP-sites: Rho = -0.864, p = 0.01; NER Capacity: Rho = -0.792, p = 0.01; ICL/R Capacity: Rho = -0.617, p = 0.05) except GSH/GSSG ratio (Rho = 0.792, p = 0.01) which was positively correlated. DNA damage was negatively correlated with GSH/GSSG ratio (Rho = -0.804, p = 0.01) and positively with AP-sites (Rho = 0.864, p = 0.01) and NER Capacity (Rho = 0.762, p = 0.01). Finally, AP-sites were positively correlated with NER Capacity (Rho = 0.892, p = 0.01) and ICL/R Capacity (Rho = 0.592, p = 0.05), as well as NER Capacity with ICL/R Capacity (Rho = 0.707, p = 0.05). No correlation was found between foci and the rest of the markers. PCA is illustrated in Figure 6A. KMO test was calculated at 0.546 and Bartlett’s test of sphericity was < 0.001. The analysis revealed a distinct pattern of two factors. The first factor consisted of Apoptosis rate and GSH/GSSG ratio while the second of NER Capacity, AP-sites and DNA Damage. Additionally, dendrogram is depicted in Figure 6B representing a further hierarchic analysis of the markers in terms of the cell lines. For this analysis, foci and ICL/R Capacity markers were excluded as no statistical significance was shown after Pearson correlation or factor analysis through PCA. Hierarchic analysis compromised a pattern of three clusters solution for the cell lines, with the first consisting of RPMI-1788, XG-6, XG-1, XG-7, U266, NCI-H929 and AMO1, the second of LP1, RPMI-8226 and SKMM2 and the third of MM1S and OPM2.
3. Discussion
DDR is a network of molecular pathways that is responsible for the removal of DNA damage and maintenance of genomic stability. Dysregulation of this system plays a central role in oncogenesis and therapy outcome in cancer. Herein, to understand the molecular basis of the link between DNA damage formation/repair and the response to genotoxic therapy, we assessed critical DDR-related signals, chromatin condensation and oxidative stress status in a panel of HMCLs with different sensitivity to DNA damaging insults.
Firstly, cell lines were classified according to their sensitivity to genotoxic agent, with apoptosis being used as a marker of cell’s sensitivity. Indeed, apoptosis can indicate the cell’s responsiveness to different stimuli, especially regarding disease or therapy [31]. The degree to which cells experience apoptosis when exposed to a specific trigger can reveal their susceptibility or resilience to this factor. In this study, to trigger apoptosis, cell lines were treated with melphalan, a bifunctional alkylating agent that binds to DNA and forms several DNA lesions, including monoadducts and ICLs [32]. Prior research has shown that monoadducts are repaired almost exclusively by NER, while ICLs are repaired by a complex process that requires the involvement of NER, Fanconi anemia pathway, translesion synthesis, homologous recombination (HR) and nonhomologous end-joining (NHEJ) [33].
Variations in the apoptosis rates between different HMCLs were observed. To understand the origin of these variations, we investigated DDR-associated parameters and oxidative stress that play significant roles in determining the cell’s fate, influencing whether the cell repairs the lesion and survives, or undergoes apoptosis if the damage is extensive or cannot be fixed. We found that HMCLs with increased apoptosis rates are characterized by higher levels of endogenous/baseline DNA damage, reduced NER and ICL repair capacities, condensed chromatin structure, as well as by increased oxidative stress and augmented apurinic/apyrimidinic lesions.
Differential endogenous/baseline DNA damage burden was found in the HMCLs analyzed, with MM1S and OPM2 exhibiting the highest and AMO1, XG-6 the lowest levels. Endogenous/baseline DNA damage is a danger to cellular health and survival, since it can cause mutations, genomic instability and cell death, including apoptosis. In line with our data, a previous study demonstrated increased levels of damage in several HMCLs, apart from U266 [34]. Moreover, the authors reported that HMCLs with persistent endogenous DNA damage rely on HR over NHEJ and ATR over ATM, indicating the presence of replication stress in these cells. Another study demonstrated increased endogenous DNA damage in HMCLs, as well as in peripheral blood mononuclear cells (PBMCs) and bone marrow plasma cells (BMPCs) from patients with MGUS, sMM and MM, suggesting that this ongoing DNA damage is not merely a consequence of myeloma but also is involved in its progression and development of the disease [35]. In a different investigation, the authors reported that myeloma cells, unlike normal plasma cells, exhibit high levels of endogenous DNA damage, evidenced by the presence of γH2AX foci [36].
Increased endogenous formation of DNA damage and/or decreased DNA repair effectiveness are two possible, though not exclusive, processes that can contribute to the accumulation of DNA damage. In this study, we assessed oxidative stress and apurinic/apyrimidinic sites at baseline, two important endogenous factors that result in the intracellular generation of SSBs and DSBs. Our results demonstrated that MM1S and OPM2 cell lines showed the highest levels of both factors analyzed, while AMO1 and XG-6 the lowest ones. Accumulating evidence indicates that, because of oncogene activation and/or increased metabolic activity, cancer cells generate more ROS than healthy cells [37,38]. It has been demonstrated that the increased ROS levels in these cells augment invasion, motility and proliferation [37]. MM cells generate ROS from several sources, such as mitochondria, the NADPH oxidases and endoplasmic reticulum [18,20]. Interestingly, since in these cells elevated immunoglobulin synthesis is an additional process that exacerbates ROS overproduction [39], further enhancement of oxidative stress may serve as an effective approach to address this disease. Moreover, in MM progression there is a notable imbalance in the patient’s serum, characterized by a depletion of antioxidants and an increase in pro-oxidant molecules. This shift towards a more pro-oxidative environment is linked to the disease’s advancement and severity [19,22]. Indeed, in MM patients, serum levels of antioxidants like vitamins C and E, glutathione peroxidase, catalase and superoxide dismutase were reduced, while oxidative stress markers were elevated compared to healthy individuals [22]. Another key source of endogenous/baseline DNA damage is the presence of apurinic/apyrimidinic sites. Previous studies have shown that oxidative stress can result in the generation of apurinic/apyrimidinic sites [40]. Cleavage of apurinic/apyrimidinic lesions by AP endonucleases or DNA N-glycosylases/AP lyases, results in the induction of DNA SSBs and DSBs [41]. Notably, the correlation between basal DNA damage, oxidative stress and AP-sites has also been reported in several other pathological conditions like lung cancer [42], head and neck carcinoma [43], as well as in autoimmune diseases such as rheumatoid arthritis [44] and systemic sclerosis [45].
Next, the efficiencies of critical DNA repair mechanisms, namely NER, ICL repair and DSB repair were also analyzed. In line with the results presented above, MM1S and OPM2 exhibited the lowest NER and ICL repair capacities, while AMO1, XG-6 the highest ones. NER is an important mechanism, that removes a wide range of bulky DNA lesions, such as those produced by UV light, ROS, endogenous lipid peroxidation products, environmental mutagens, smoking-associated carcinogens and chemotherapeutic agents, such as melphalan [46]. The genes XPC (xeroderma pigmentosum, complementation group C) and ERCC3 (XPB) are particularly relevant to NER in MM. In fact, studies have shown that knocking down these genes increases the sensitivity of myeloma cells to melphalan [46]. Notably, it is demonstrated that the inhibition of NER pathway can overcome resistance to alkylating agents in myeloma cells. Specifically, inhibiting the XPB protein can simultaneously inhibit both NER and transcription, making it a potentially effective therapeutic strategy. The efficiency of ICL repair was also evaluated. ICLs are covalent bonds that are formed between two complementary strands of DNA, effectively preventing DNA replication and transcription [47]. These toxic DNA lesions can be caused by certain chemotherapeutic drugs like melphalan and by endogenous sources like lipid peroxidation and are involved in the treatment of MM [48]. The repair of these crosslinks is crucial for cell survival, and in cancer cells it can contribute to drug resistance. DSB repair dynamics were assessed via quantification of γH2AX and RAD51 foci formation following melphalan treatment. No significant differences in the accumulation of γH2AX between the HMCLs was observed, with most cell lines showing a DSB repair deficient phenotype and impaired or delayed RAD51 foci induction, suggesting a deregulated HR pathway. In line with these data, previous studies have shown that in MM, DSB repair pathways are frequently deregulated, thus contributing to the disease’s genomic instability [49,50]. Notably, the two main pathways for repairing DSBs, namely NHEJ and HR often exhibit altered activities in MM [49,51].
Chromatin condensation was also analysed. In line with the NER capacity, MM1S and OPM2 showed the lowest chromatin looseness, while AMO1, XG-6 the highest ones. Chromatin structure plays a significant role in MM by influencing gene expression, drug sensitivity, and disease progression [30,52]. Alterations in histone modifications and DNA methylation can lead to aberrant gene expression patterns that promote myeloma cell growth and survival. Furthermore, chromatin structure can affect the efficiency of DNA repair mechanisms, which in turn impacts how myeloma cells respond to chemotherapy. Chromatin remodeling complexes, like the SWI/SNF complex, are frequently mutated in MM, indicating their importance in disease progression. These mutations can disrupt normal gene expression patterns and contribute to uncontrolled cell growth [52]. Also, aberrant histone modifications in myeloma cells can lead to the upregulation of oncogenes or the downregulation of tumor suppressor genes, contributing to disease development and progression [53,54]. Moreover, changes in chromatin structure can affect the accessibility of DNA to antimyeloma drugs, influencing their effectiveness [30]. Notably, changes in chromatin structure have been observed in both PBMCs and BMPCs during myelomagenesis.
Together, the results presented herein showed the interplay between oxidative stress, DDR-associated signals and cell sensitivity. These findings support the concept of redox status/DDR profiling as a basis for identifying therapeutic vulnerabilities and refining the treatment strategies in MM. Limitations of our study include the measurement of these parameters only in cell lines and the lack of genomic/mutational data to correlate with the observed redox status/DDR phenotypes.
4. Materials and Methods
4.1. Cell Lines
Human MM cell lines U266 and NCI-H929 were purchased from the American Type Culture Collection (ATCC; Virginia, USA); RPMI-8226, OPM2, LP1, MM1S, AMO1, SKMM2, XG-1, XG-6 and XG-7 were kindly provided by Prof. J. Moreaux (University of Montpellier, France). All HMCLs were cultured in RPMI1640 medium, supplemented with 20% Fetal bovine serum (FBS) and 1% penicillin/streptomycin. For the IL-6 dependent cell lines (XG-1, XG-6 and XG-7) 2ng/ml of IL-6 was added. The immortalized healthy B lymphoblastoid cell line RPMI-1788 was purchased by Cytion (#300318) and cultured in RPMI1640 medium, supplemented with 20% FBS and 1% penicillin/streptomycin.
4.2. MTT Viability Assay
Cell viability was examined using MTT assay at 6h and 24h following treatment [55]. Briefly, cells were seeded on 96-well plates and incubated with 0.5mg/ml MTT (Thermo Fisher Scientific, Waltham, MA, USA, #M6494) for 3,5h. Solubilization step then followed with Dimethyl Sulfoxide (DMSO) as solvent (AppliChem, Italy, #A3672) for 15min and dye’s absorbance was measured at 570nm with a reference wavelength of 690nm on a Tecan Safire2 microplate reader (Männedorf, Switzerland).
4.3. Measurement of NER
To assess the efficiency of NER, cell lines were irradiated with UVC (50 J/m2), incubated in the appropriate medium for 0-6h at 37°C, harvested and analyzed using alkaline comet assay [43]. Briefly, 1x10⁴ cells in 1% low-melting-point agarose were spread onto microscope slides and lysed for 2h at 4°C in alkaline solution (2.5 M NaCl, 0.1 M EDTA, 0.01 M Tris; pH 10, 1% Triton X-100). Electrophoresis was performed for 30min (25V, 225mA). Samples were stained with SYBRTM Gold Nucleic Acid Gel Stain (Thermo Fischer Scientific; #S11494) and imaged with a fluorescence microscope using 10x lens (Zeiss Axiophot). Comet parameters were analysed by the ImageJ Analysis module, Open Comet v1.3.1. (https://cometbio.org/). Olive Tail Moment (OTM) for each sample was calculated by a total average of >200 cells.
4.4. Measurement of ICL Repair
Cell lines were treated with melphalan (100μg/ml for 5min) in their appropriate medium, changed to drug-free medium for 0-48h, harvested, and the gene-specific repair of the ICLs was evaluated using Southern blot [42]. Briefly, genomic DNA was isolated, digested with the restriction enzyme EcoRI and denatured in 50mM NaOH for 15min at 37oC. Denaturation step was then stopped on ice and samples were mixed with loading buffer (0.2% Ficoll, 0.1mM EDTA, 0.01% bromocresol green). Electrophoresis and hybridization were performed for 16h at 30V in 0.6% agarose gel with 40mM Tris-acetate and 2mM EDTA. The number of ICLs per restriction fragment was calculated using the Poisson distribution formula: [Crosslinks per fragment = −loge(fraction of fragments free of crosslinks)].
4.5. Measurement of DSB Repair
Aliquots containing 5x10⁵ cells were adhered to coverslips and fixed with ice cold 4% paraformaldehyde for 15min. Permeabilization step followed for 10min [0.25% Triton-X in Phosphate-buffered saline (PBS)] and then nonspecific binding was eliminated with a 30min incubation in blocking buffer [1% Bovine serum albumin (BSA), 0.25% Triton in PBS]. Cells were incubated with primary antibody against γH2AX (Cell signaling, #80312; 1:400 for 1h) and RAD51 (Cell signaling, #65653; 1:400 for 1h) followed by fluorescent secondary antibody incubation with Alexa Fluor 488 (Invitrogen, #481679) and Alexa Fluor 568 (Invitrogen, #453569) at 1:1000 for 1h. Imaging was performed on a confocal scanning microscope (Leica TCS SP-1, Leica Microsystems CMS GmbH, Mannheim, Germany). The γH2AX and RAD51 foci were analyzed using open access software (FoCo, MATLAB) [56]. At least 100 cells per treatment were analyzed and each experiment was performed in triplicate.
4.6. Oxidative Stress and Apurinic/Apyrimidinic Sites Assessment
To measure oxidative stress, the use of GSH/GSSG ratio was assessed via a luminescence-based assay following the manufacturer’s protocol (GSH/GSSG-Glo Assay, Promega, USA, #V6612). For the quantification of apurinic/apyrimidinic (AP, abasic) sites, samples were analyzed with the OxiSelect Oxidative DNA Damage Quantification Kit (Cell Biolabs, San Diego, CA, USA; #STA-324) according to the manufacturer’s protocol.
4.7. Apoptosis Rates
Cell lines were treated with increasing doses of melphalan (0-100μg/ml, 5min, 37°C) in the appropriate medium. Then, cells were incubated for 24h in melphalan-free medium and apoptosis was assessed using the Cell Death Detection ELISA PLUS kit (Roche Diagnostics Corp., #11774425001, Germany) following the manufacturer’s protocol.
4.8. Measurement of Chromatin Condensation
Nuclear isolation and micrococcal nuclease digestion were carried out using standard procedures [57]. In brief, hypotonic buffer (10mM Tris–HCl, pH 8.0, 10mM NaCl, 5mM MgCl2) was used to swell 5x10⁶ cells for 30min at 4°C. The cells were homogenized in hypotonic buffer containing 0.3% Nonidet P-40, the nuclei were purified by centrifugation (1500xg for 10min) through hypotonic buffer containing 8.5% sucrose (w/v) and then resuspended in digestion buffer (100 mM Tris–HCl, pH 8.0, 50 mM NaCl, 3 mM MgCl2, 1 mM CaCl2). Micrococcal nuclease (1U) was used to immediately digest the isolated nuclei at 37°C for 5min. An equal volume of stop solution (200 mM Tris–HCl, pH 8.0, 200 mM NaCl, 20 mM EDTA, 2% SDS, 200 μg/ml proteinase K) was added to terminate the digestion. Genomic DNA was purified and then electrophoretically separated in 1.5% agarose gels. DNA was transferred to nitrocellulose (Amersham Hybond-N+, Cytiva, Marlborough MA 01752, USA; RPN303B) and was later hybridized to probes specific for the N-ras gene [57].
4.9. Statistical Analysis
Analyses were performed using SPSS software (SPSS for Windows, version 30.0, SPSS Inc., Chicago, IL, USA). The relationship between markers of the cell lines was explored by using Pearson correlation matrix. Clustering of the markers was assigned by two step analysis. Principal Component Analysis (PCA) was conducted to generate a pattern of measured markers for the cell lines. For further investigation, hierarchical cluster analysis was carried out by using Z scores of the markers and Ward method to equalize the size of the clusters between the cell lines.
5. Conclusions
In this study, we performed a comprehensive analysis of functional DDR-associated aberrations across a panel of human MM cell lines with different sensitivities to genotoxic insults. By integrating assays for basal DNA damage, oxidative stress, accumulation of apurinic/apyrimidinic lesions, DNA repair efficiencies, chromatin structure and apoptosis rates, we uncovered distinct DDR competency amongst the cell lines under study. We found that HMCLs with increased susceptibility to genotoxic agents exhibited elevated basal DNA damage and oxidative stress status, deficient DNA repair capacity and more condensed chromatin structure. These results highlight the interplay between oxidative stress and DNA repair efficiency, underscoring the DDR dysfunction as both an important factor of MM pathophysiology and a determinant of therapeutic vulnerability. Incorporating functional redox status/DDR profiling in MM research may contribute to the discovery of novel therapeutic targets and the development of new effective biomarkers.
Supplementary Materials
The following supporting information can be downloaded at the website of this paper posted on Preprints.org. Supplementary Figure S1. UVC-induced sensitivity; Supplementary Figure S2. UVC-induced DDR signals in MM cell lines; Supplementary Figure S3. DDR-related signals in MM cells following melphalan treatment.
Author Contributions
Conceptualization, Panagiotis Malamos, Evangelos Terpos and Vassilis Souliotis; Data curation, Panagiotis Malamos and Konstantinos Koutoulogenis; Formal analysis, Panagiotis Malamos and Konstantinos Koutoulogenis; Funding acquisition, Panagiotis Malamos, Evangelos Terpos and Vassilis Souliotis; Investigation, Panagiotis Malamos, Christina Papanikolaou, Elisavet Deligianni, Dimitra Mavroeidi and Konstantinos Koutoulogenis; Project administration, Vassilis Souliotis; Resources, Vassilis Souliotis; Supervision, Evangelos Terpos and Vassilis Souliotis; Validation, Panagiotis Malamos, Maria Gavriatopoulou, Evangelos Terpos and Vassilis Souliotis; Visualization, Panagiotis Malamos, Christina Papanikolaou, Elisavet Deligianni, Dimitra Mavroeidi, Konstantinos Koutoulogenis and Vassilis Souliotis; Writing – original draft, Panagiotis Malamos and Vassilis Souliotis; Writing – review & editing, Panagiotis Malamos, Christina Papanikolaou, Elisavet Deligianni, Dimitra Mavroeidi, Konstantinos Koutoulogenis, Maria Gavriatopoulou, Evangelos Terpos and Vassilis Souliotis.
Funding
Funded by the European Union (Project 101097094-ELMUMY). Views and opinions expressed are however those of the author(s) only and do not necessarily reflect those of the European Union or HADEA. Neither the European Union nor the granting authority can be held responsible for them.
Data Availability Statement
The original contributions presented in this study are included in the article/supplementary material. Further inquiries can be directed to the corresponding author.
Conflicts of Interest
The authors declare no conflict of interest.
References
- Saade, C.; Ghobrial, I.M. Updates on Mechanisms of Disease Progression in Precursor Myeloma: Monoclonal Gammopathy of Undermined Significance and Smoldering Myeloma. Presse Méd. 2025, 54, 104268. [CrossRef]
- Kyle, R.A.; Larson, D.R.; Therneau, T.M.; Dispenzieri, A.; Kumar, S.; Cerhan, J.R.; Rajkumar, S.V. Long-Term Follow-up of Monoclonal Gammopathy of Undetermined Significance. N. Engl. J. Med. 2018, 378, 241–249. [CrossRef]
- Rajkumar, S.V. Multiple Myeloma: 2022 Update on Diagnosis, Risk Stratification, and Management. Am. J. Hematol. 2022, 97, 1086–1107. [CrossRef]
- Kazandjian, D. Multiple Myeloma Epidemiology and Survival: A Unique Malignancy. Semin. Oncol. 2016, 43, 676–681. [CrossRef]
- Ludwig, H.; Novis Durie, S.; Meckl, A.; Hinke, A.; Durie, B. Multiple Myeloma Incidence and Mortality Around the Globe; Interrelations Between Health Access and Quality, Economic Resources, and Patient Empowerment. Oncologist 2020, 25, e1406–e1413. [CrossRef]
- Fonseca, R.; Abouzaid, S.; Bonafede, M.; Cai, Q.; Parikh, K.; Cosler, L.; Richardson, P. Trends in Overall Survival and Costs of Multiple Myeloma, 2000–2014. Leukemia 2017, 31, 1915–1921. [CrossRef]
- Morgan, G.J.; Walker, B.A.; Davies, F.E. The Genetic Architecture of Multiple Myeloma. Nat. Rev. Cancer 2012, 12, 335–348. [CrossRef]
- Malamos, P.; Papanikolaou, C.; Gavriatopoulou, M.; Dimopoulos, M.A.; Terpos, E.; Souliotis, V.L. The Interplay between the DNA Damage Response (DDR) Network and the Mitogen-Activated Protein Kinase (MAPK) Signaling Pathway in Multiple Myeloma. Int. J. Mol. Sci. 2024, 25, 6991. [CrossRef]
- Elbezanti, W.O.; Challagundla, K.B.; Jonnalagadda, S.C.; Budak-Alpdogan, T.; Pandey, M.K. Past, Present, and a Glance into the Future of Multiple Myeloma Treatment. Pharmaceuticals 2023, 16, 415. [CrossRef]
- Sousa, M.M.L.; Zub, K.A.; Aas, P.A.; Hanssen-Bauer, A.; Demirovic, A.; Sarno, A.; Tian, E.; Liabakk, N.B.; Slupphaug, G. An Inverse Switch in DNA Base Excision and Strand Break Repair Contributes to Melphalan Resistance in Multiple Myeloma Cells. PLoS One 2013, 8, e55493. [CrossRef]
- Zub, K.A.; Sousa, M.M.L. de; Sarno, A.; Sharma, A.; Demirovic, A.; Rao, S.; Young, C.; Aas, P.A.; Ericsson, I.; Sundan, A.; et al. Modulation of Cell Metabolic Pathways and Oxidative Stress Signaling Contribute to Acquired Melphalan Resistance in Multiple Myeloma Cells. PLoS One 2015, 10, e0119857. [CrossRef]
- Petrilla, C.; Galloway, J.; Kudalkar, R.; Ismael, A.; Cottini, F. Understanding DNA Damage Response and DNA Repair in Multiple Myeloma. Cancers (Basel) 2023, 15, 4155. [CrossRef]
- Besse, A.; Besse, L.; Kraus, M.; Mendez-Lopez, M.; Bader, J.; Xin, B.-T.; Bruin, G. de; Maurits, E.; Overkleeft, H.S.; Driessen, C. Proteasome Inhibition in Multiple Myeloma: Head-to-Head Comparison of Currently Available Proteasome Inhibitors. Cell Chem. Biol. 2019, 26, 340-351.e3. [CrossRef]
- Holstein, S.A.; McCarthy, P.L. Immunomodulatory Drugs in Multiple Myeloma: Mechanisms of Action and Clinical Experience. Drugs 2017, 77, 505–520. [CrossRef]
- Sammartano, V.; Franceschini, M.; Fredducci, S.; Caroni, F.; Ciofini, S.; Pacelli, P.; Bocchia, M.; Gozzetti, A. Anti-BCMA Novel Therapies for Multiple Myeloma. Cancer Drug Resist. 2023, 6, 169–181. [CrossRef]
- Parikh, R.H.; Lonial, S. Chimeric Antigen Receptor T-Cell Therapy in Multiple Myeloma: A Comprehensive Review of Current Data and Implications for Clinical Practice. CA Cancer J. Clin. 2023, 73, 275–285. [CrossRef]
- Devarakonda, S.; Efebera, Y.; Sharma, N. Role of Stem Cell Transplantation in Multiple Myeloma. Cancers 2021, 13, 863. [CrossRef]
- Lipchick, B.C.; Fink, E.E.; Nikiforov, M.A. Oxidative Stress and Proteasome Inhibitors in Multiple Myeloma. Pharmacol. Res. 2016, 105, 210–215. [CrossRef]
- Athanasopoulou, S.; Kapetanou, M.; Magouritsas, M.G.; Mougkolia, N.; Taouxidou, P.; Papacharalambous, M.; Sakellaridis, F.; Gonos, E. Antioxidant and Antiaging Properties of a Novel Synergistic Nutraceutical Complex: Readouts from an In Cellulo Study and an In Vivo Prospective, Randomized Trial. Antioxidants 2022, 11, 468. [CrossRef]
- Caillot, M.; Dakik, H.; Mazurier, F.; Sola, B. Targeting Reactive Oxygen Species Metabolism to Induce Myeloma Cell Death. Cancers 2021, 13, 2411. [CrossRef]
- Xiong, S.; Chng, W.-J.; Zhou, J. Crosstalk between Endoplasmic Reticulum Stress and Oxidative Stress: A Dynamic Duo in Multiple Myeloma. Cell. Mol. Life Sci. 2021, 78, 3883–3906. [CrossRef]
- Kul, A.N.; Ozturk Kurt, B. Multiple Myeloma from the Perspective of Pro- and Anti-Oxidative Parameters: Potential for Diagnostic and/or Follow-Up Purposes? J. Pers. Med. 2024, 14, 221. [CrossRef]
- Chatterjee, N.; Walker, G.C. Mechanisms of DNA Damage, Repair, and Mutagenesis. Environ. Mol. Mutagen. 2017, 58, 235–263. [CrossRef]
- O’Connor, M.J. Targeting the DNA Damage Response in Cancer. Mol. Cell 2015, 60, 547–560. [CrossRef]
- Saitoh, T.; Oda, T. DNA Damage Response in Multiple Myeloma: The Role of the Tumor Microenvironment. Cancers 2021, 13, 504. [CrossRef]
- Alagpulinsa, D.A.; Szalat, R.E.; Poznansky, M.C.; Reis, R.J.S. Genomic Instability in Multiple Myeloma. Trends Cancer 2020, 6, 858–873. [CrossRef]
- Sharma, A.; Heuck, C.J.; Fazzari, M.J.; Mehta, J.; Singhal, S.; Greally, J.M.; Verma, A. DNA Methylation Alterations in Multiple Myeloma as a Model for Epigenetic Changes in Cancer. Wiley Interdiscip. Rev. Syst. Biol. Med. 2010, 2, 654–669. [CrossRef]
- Feng, Z.; Hu, W.; Chasin, L.A.; Tang, M. Effects of Genomic Context and Chromatin Structure on Transcription-coupled and Global Genomic Repair in Mammalian Cells. Nucleic Acids Res. 2003, 31, 5897–5906. [CrossRef]
- Papanikolaou, C.; Economopoulou, P.; Spathis, A.; Kotsantis, I.; Gavrielatou, N.; Anastasiou, M.; Moutafi, M.; Kyriazoglou, A.; Foukas, G.-R.P.; Lelegiannis, I.M.; et al. Association of DNA Damage Response Signals and Oxidative Stress Status with Nivolumab Efficacy in Patients with Head and Neck Squamous Cell Carcinoma. Br. J. Cancer 2025, 133, 353-364. [CrossRef]
- Gkotzamanidou, M.; Terpos, E.; Bamia, C.; Kyrtopoulos, S.A.; Sfikakis, P.P.; Dimopoulos, M.A.; Souliotis, V.L. Progressive Changes in Chromatin Structure and DNA Damage Response Signals in Bone Marrow and Peripheral Blood during Myelomagenesis. Leukemia 2014, 28, 1113–1121. [CrossRef]
- Xu, X.; Lai, Y.; Hua, Z.-C. Apoptosis and Apoptotic Body: Disease Message and Therapeutic Target Potentials. Biosci. Rep. 2019, 39, BSR20180992. [CrossRef]
- Enoiu, M.; Jiricny, J.; Schärer, O.D. Repair of Cisplatin-Induced DNA Interstrand Crosslinks by a Replication-Independent Pathway Involving Transcription-Coupled Repair and Translesion Synthesis. Nucleic Acids Res. 2012, 40, 8953–8964. [CrossRef]
- Souliotis, V.L.; Dimopoulos, M.A.; Sfikakis, P.P. Gene-Specific Formation and Repair of DNA Monoadducts and Interstrand Cross-Links after Therapeutic Exposure to Nitrogen Mustards. Clin. Cancer Res. 2003, 9, 4465–4474.
- Herrero, A.B.; Gutiérrez, N.C. Targeting Ongoing DNA Damage in Multiple Myeloma: Effects of DNA Damage Response Inhibitors on Plasma Cell Survival. Front. Oncol. 2017, 7, 98. [CrossRef]
- Kumar, S.; Gkotzamanidou, M.; Talluri, S.; Day, M.; Neptune, M.; Potluri, L.B.; Chakraborty, C.; Mills, K.; Shammas, M.A.; Munshi, N.C. Ongoing Spontaneous DNA Damage Creates Synthetic Lethality Targeted By Novel RAD51 Inhibitors in Multiple Myeloma. Blood 2019, 134, 4378. [CrossRef]
- Walters, D.K.; Wu, X.; Tschumper, R.C.; Arendt, B.K.; Huddleston, P.M.; Henderson, K.J.; Dispenzieri, A.; Jelinek, D.F. Evidence for Ongoing DNA Damage in Multiple Myeloma Cells as Revealed by Constitutive Phosphorylation of H2AX. Leukemia 2011, 25, 1344–1353. [CrossRef]
- Nakamura, H.; Takada, K. Reactive Oxygen Species in Cancer: Current Findings and Future Directions. Cancer Sci. 2021, 112, 3945–3952. [CrossRef]
- Attique, I.; Haider, Z.; Khan, M.; Hassan, S.; Soliman, M.M.; Ibrahim, W.N.; Anjum, S. Reactive Oxygen Species: From Tumorigenesis to Therapeutic Strategies in Cancer. Cancer Med. 2025, 14, e70947. [CrossRef]
- Wang, J.; Lin, D.; Peng, H.; Huang, Y.; Huang, J.; Gu, J. Cancer-Derived Immunoglobulin G Promotes Tumor Cell Growth and Proliferation through Inducing Production of Reactive Oxygen Species. Cell Death Dis. 2013, 4, e945–e945. [CrossRef]
- Yuan, H.-H.; Yin, H.; Marincas, M.; Xie, L.-L.; Bu, L.-L.; Guo, M.-H.; Zheng, X.-L. From DNA Repair to Redox Signaling: The Multifaceted Role of APEX1 (Apurinic/Apyrimidinic Endonuclease 1) in Cardiovascular Health and Disease. Int. J. Mol. Sci. 2025, 26, 3034. [CrossRef]
- Thompson, P.S.; Cortez, D. New Insights into Abasic Site Repair and Tolerance. DNA Repair (Amst) 2020, 90, 102866. [CrossRef]
- Mavroeidi, D.; Georganta, A.; Stefanou, D.T.; Papanikolaou, C.; Syrigos, K.N.; Souliotis, V.L. DNA Damage Response Network and Intracellular Redox Status in the Clinical Outcome of Patients with Lung Cancer. Cancers 2024, 16, 4218. [CrossRef]
- Papanikolaou, C.; Economopoulou, P.; Gavrielatou, N.; Mavroeidi, D.; Psyrri, A.; Souliotis, V.L. UVC-Induced Oxidative Stress and DNA Damage Repair Status in Head and Neck Squamous Cell Carcinoma Patients with Different Responses to Nivolumab Therapy. Biology 2025, 14, 195. [CrossRef]
- Souliotis, V.L.; Vlachogiannis, N.I.; Pappa, M.; Argyriou, A.; Ntouros, P.A.; Sfikakis, P.P. DNA Damage Response and Oxidative Stress in Systemic Autoimmunity. Int. J. Mol. Sci. 2020, 21, 55. [CrossRef]
- Vlachogiannis, N.I.; Pappa, M.; Ntouros, P.A.; Nezos, A.; Mavragani, C.P.; Souliotis, V.L.; Sfikakis, P.P. Association Between DNA Damage Response, Fibrosis and Type I Interferon Signature in Systemic Sclerosis. Front. Immunol. 2020, 11, 582401. [CrossRef]
- Szalat, R.; Samur, M.K.; Fulciniti, M.; Lopez, M.; Nanjappa, P.; Cleynen, A.; Wen, K.; Kumar, S.; Perini, T.; Calkins, A.S.; et al. Nucleotide Excision Repair Is a Potential Therapeutic Target in Multiple Myeloma. Leukemia 2018, 32, 111–119. [CrossRef]
- Deans, A.J.; West, S.C. DNA Interstrand Crosslink Repair and Cancer. Nat. Rev. Cancer 2011, 11, 467–480. [CrossRef]
- Shukla, P.; Solanki, A.; Ghosh, K.; Vundinti, B.R. DNA Interstrand Cross-Link Repair: Understanding Role of Fanconi Anemia Pathway and Therapeutic Implications. Eur. J. Haematol. 2013, 91, 381–393. [CrossRef]
- Herrero, A.B.; Miguel, J.S.; Gutierrez, N.C. Deregulation of DNA Double-Strand Break Repair in Multiple Myeloma: Implications for Genome Stability. PLoS One 2015, 10, e0121581. [CrossRef]
- Gourzones-Dmitriev, C.; Kassambara, A.; Sahota, S.; Rème, T.; Moreaux, J.; Bourquard, P.; Hose, D.; Pasero, P.; Constantinou, A.; Klein, B. DNA Repair Pathways in Human Multiple Myeloma. Cell Cycle 2013, 12, 2760–2773. [CrossRef]
- Gillyard, T.; Davis, J. Chapter Two - DNA Double-Strand Break Repair in Cancer: A Path to Achieving Precision Medicine. In International Review of Cell and Molecular Biology; Weyemi, U., Galluzzi, L., Eds.; Chromatin and Genomic Instability in Cancer; Academic Press, 2021; Volume 364, pp. 111–137.
- Chakraborty, C.; Mukherjee, S. Molecular Crosstalk between Chromatin Remodeling and Tumor Microenvironment in Multiple Myeloma. Curr. Oncol. 2022, 29, 9535–9549. [CrossRef]
- Ohguchi, H.; Hideshima, T.; Anderson, K.C. The Biological Significance of Histone Modifiers in Multiple Myeloma: Clinical Applications. Blood Cancer J. 2018, 8, 83. [CrossRef]
- Tigu, A.B.; Ivancuta, A.; Uhl, A.; Sabo, A.C.; Nistor, M.; Mureșan, X.-M.; Cenariu, D.; Timis, T.; Diculescu, D.; Gulei, D. Epigenetic Therapies in Melanoma—Targeting DNA Methylation and Histone Modification. Biomedicines 2025, 13, 1188. [CrossRef]
- Avramis, I.A.; Christodoulopoulos, G.; Suzuki, A.; Laug, W.E.; Gonzalez-Gomez, I.; McNamara, G.; Sausville, E.A.; Avramis, V.I. In Vitro and in Vivo Evaluations of the Tyrosine Kinase Inhibitor NSC 680410 against Human Leukemia and Glioblastoma Cell Lines. Cancer Chemother. Pharmacol. 2002, 50, 479–489. [CrossRef]
- Lapytsko, A.; Kollarovic, G.; Ivanova, L.; Studencka, M.; Schaber, J. FoCo: A Simple and Robust Quantification Algorithm of Nuclear Foci. BMC Bioinformatics 2015, 16, 392. [CrossRef]
- Souliotis, V.L.; Dimopoulos, M.A.; Episkopou, H.G.; Kyrtopoulos, S.A.; Sfikakis, P.P. Preferential in Vivo DNA Repair of Melphalan-Induced Damage in Human Genes Is Greatly Affected by the Local Chromatin Structure. DNA Repair (Amst) 2006, 5, 972–985. [CrossRef]
Figure 1.
MM cell lines’ sensitivity to genotoxic insult and DDR related parameters at baseline. (A) Bar charts showing the apoptosis rates 24h following melphalan treatment. (B) Baseline DNA damage assessed by alkaline comet assay. (C) Oxidative stress at baseline, expressed as GSH/GSSG ratio. (D) Endogenous AP-sites. The data represent the mean of at least three independent experiments. Error bars indicate standard deviation (SD).
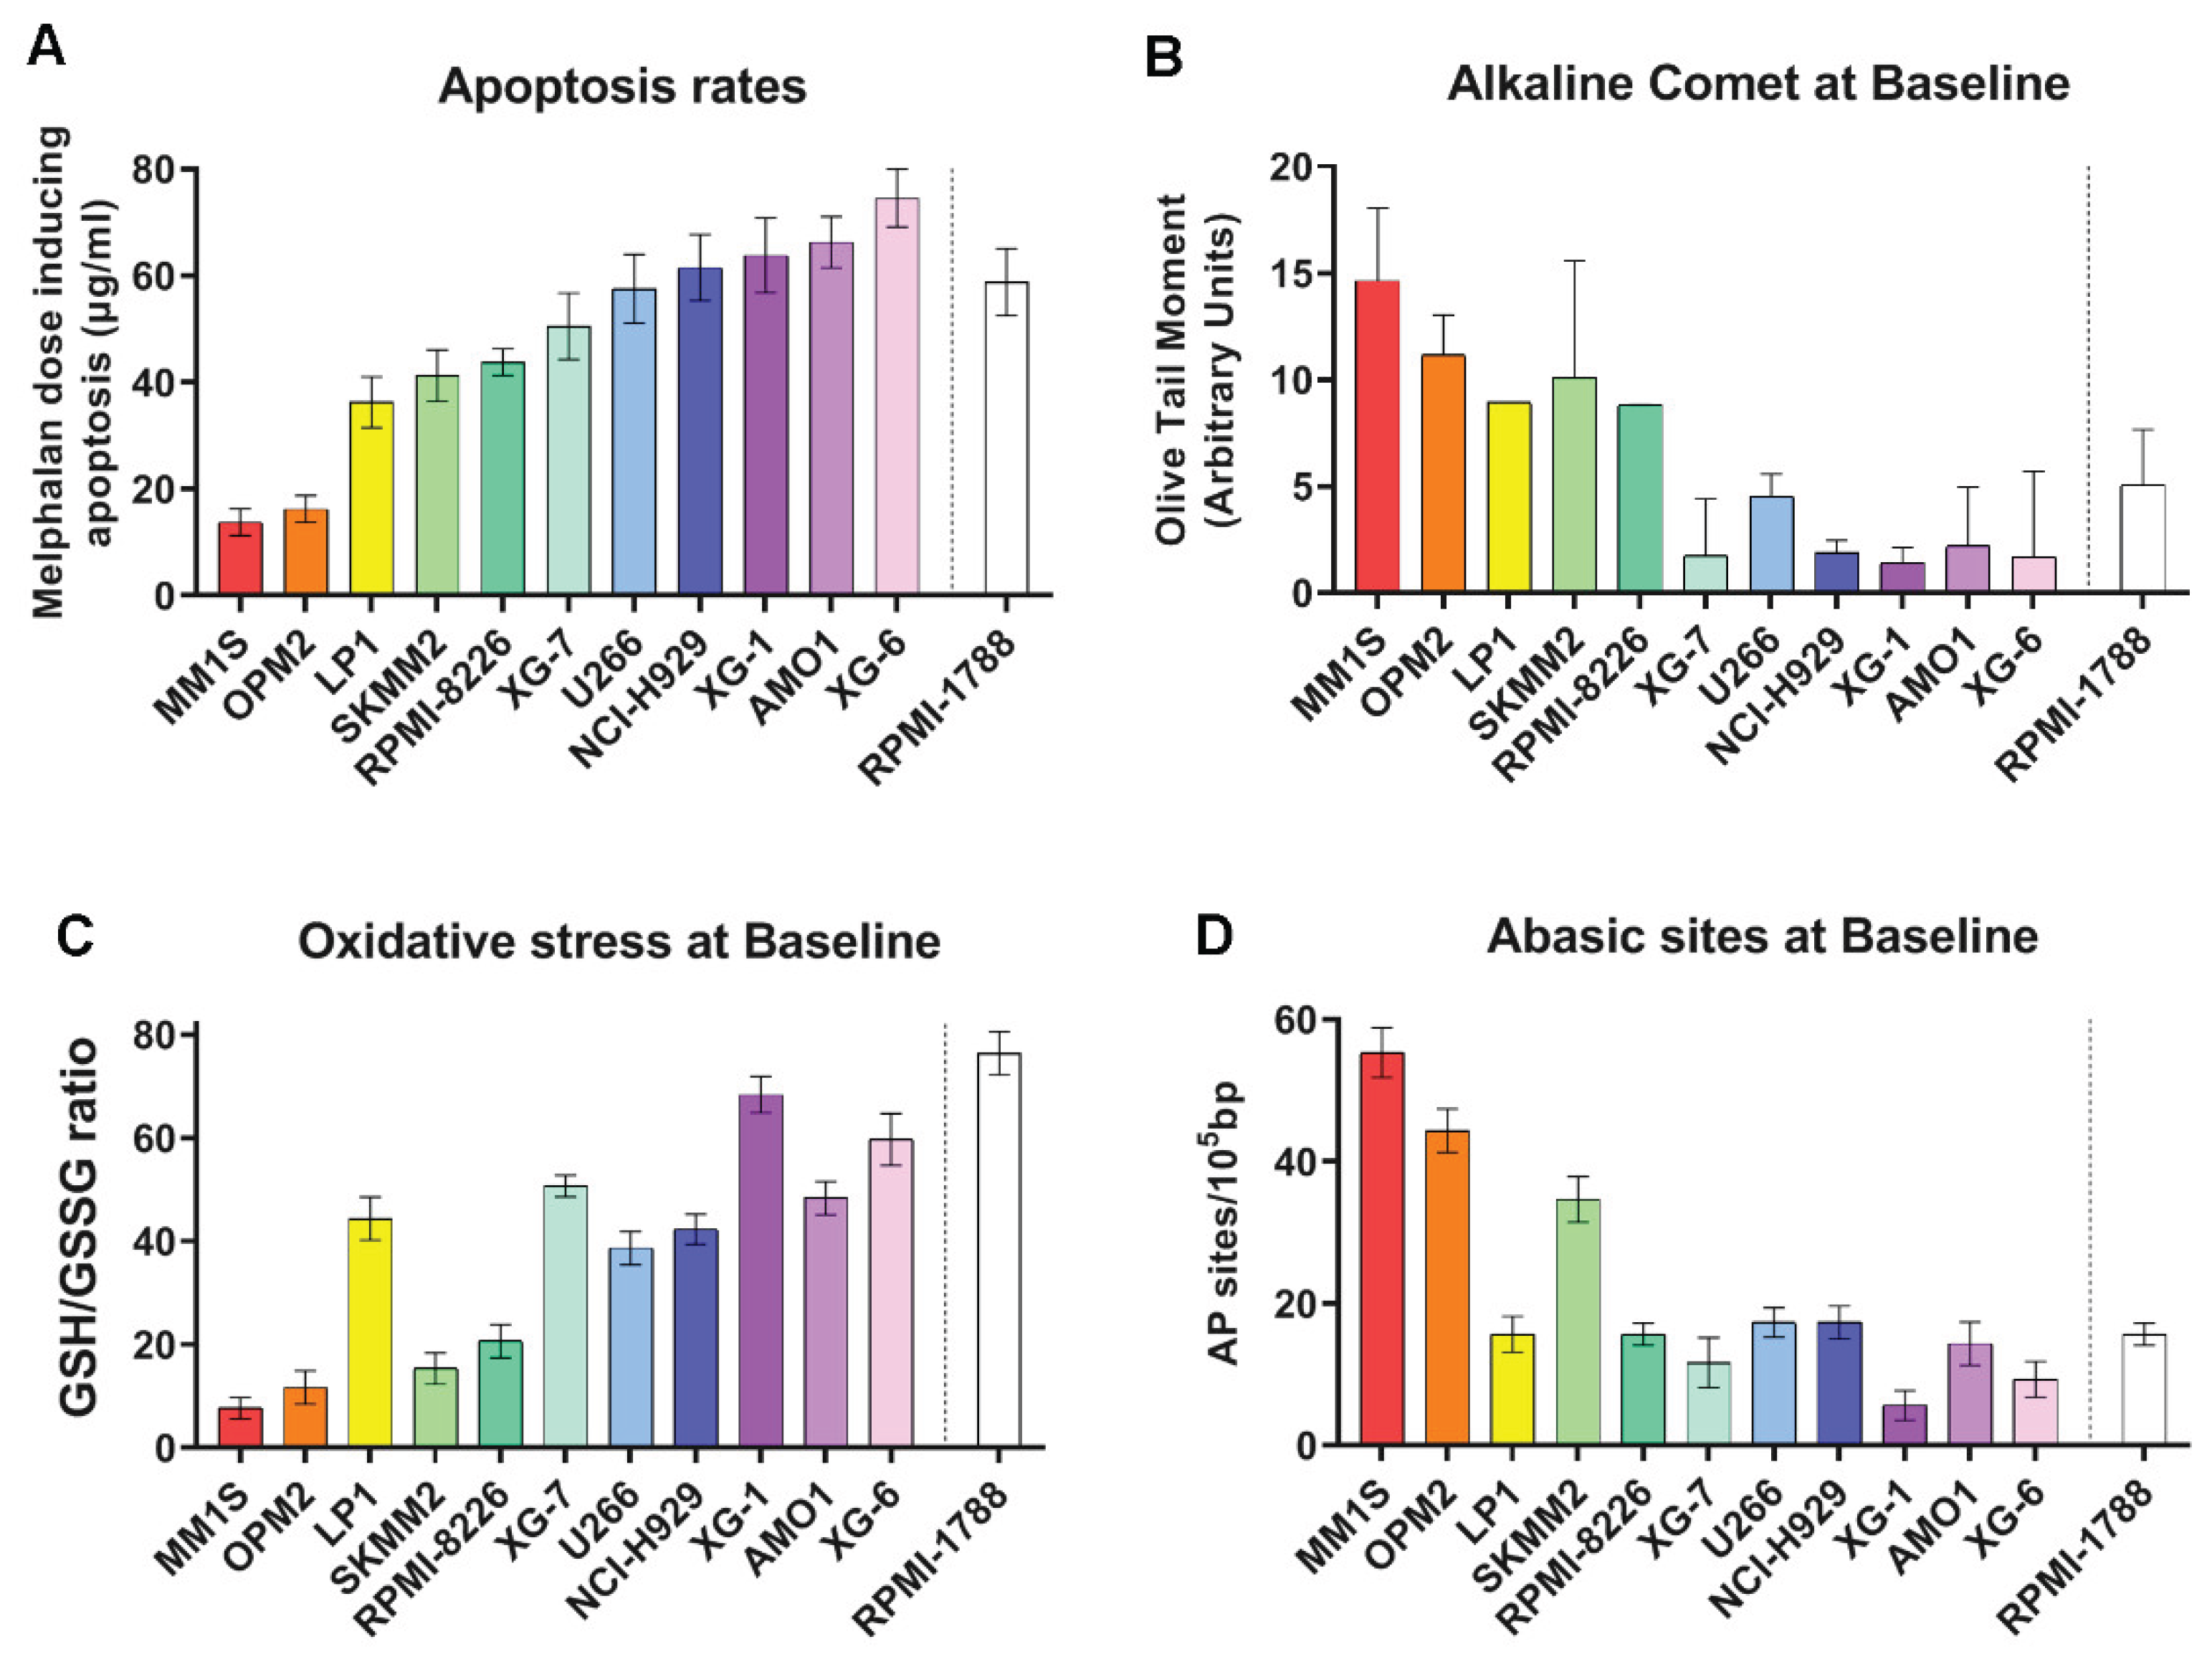
Figure 2.
UVC-induced DDR signals in MM cell lines. (A) Bar graphs of the kinetics of UVC-induced NER repair using alkaline comet assay for selected samples. (B) Representative images from alkaline comet assay of MM1S, AMO1 and RPMI-1788 (healthy) cells at baseline and at 2h and 6h after UVC irradiation. (C) Cumulative DNA damage levels quantified as AUC over the entire 0-6h time course in all samples. A minimum of three biological independent experiments was performed for each condition. Error bars represent SD.
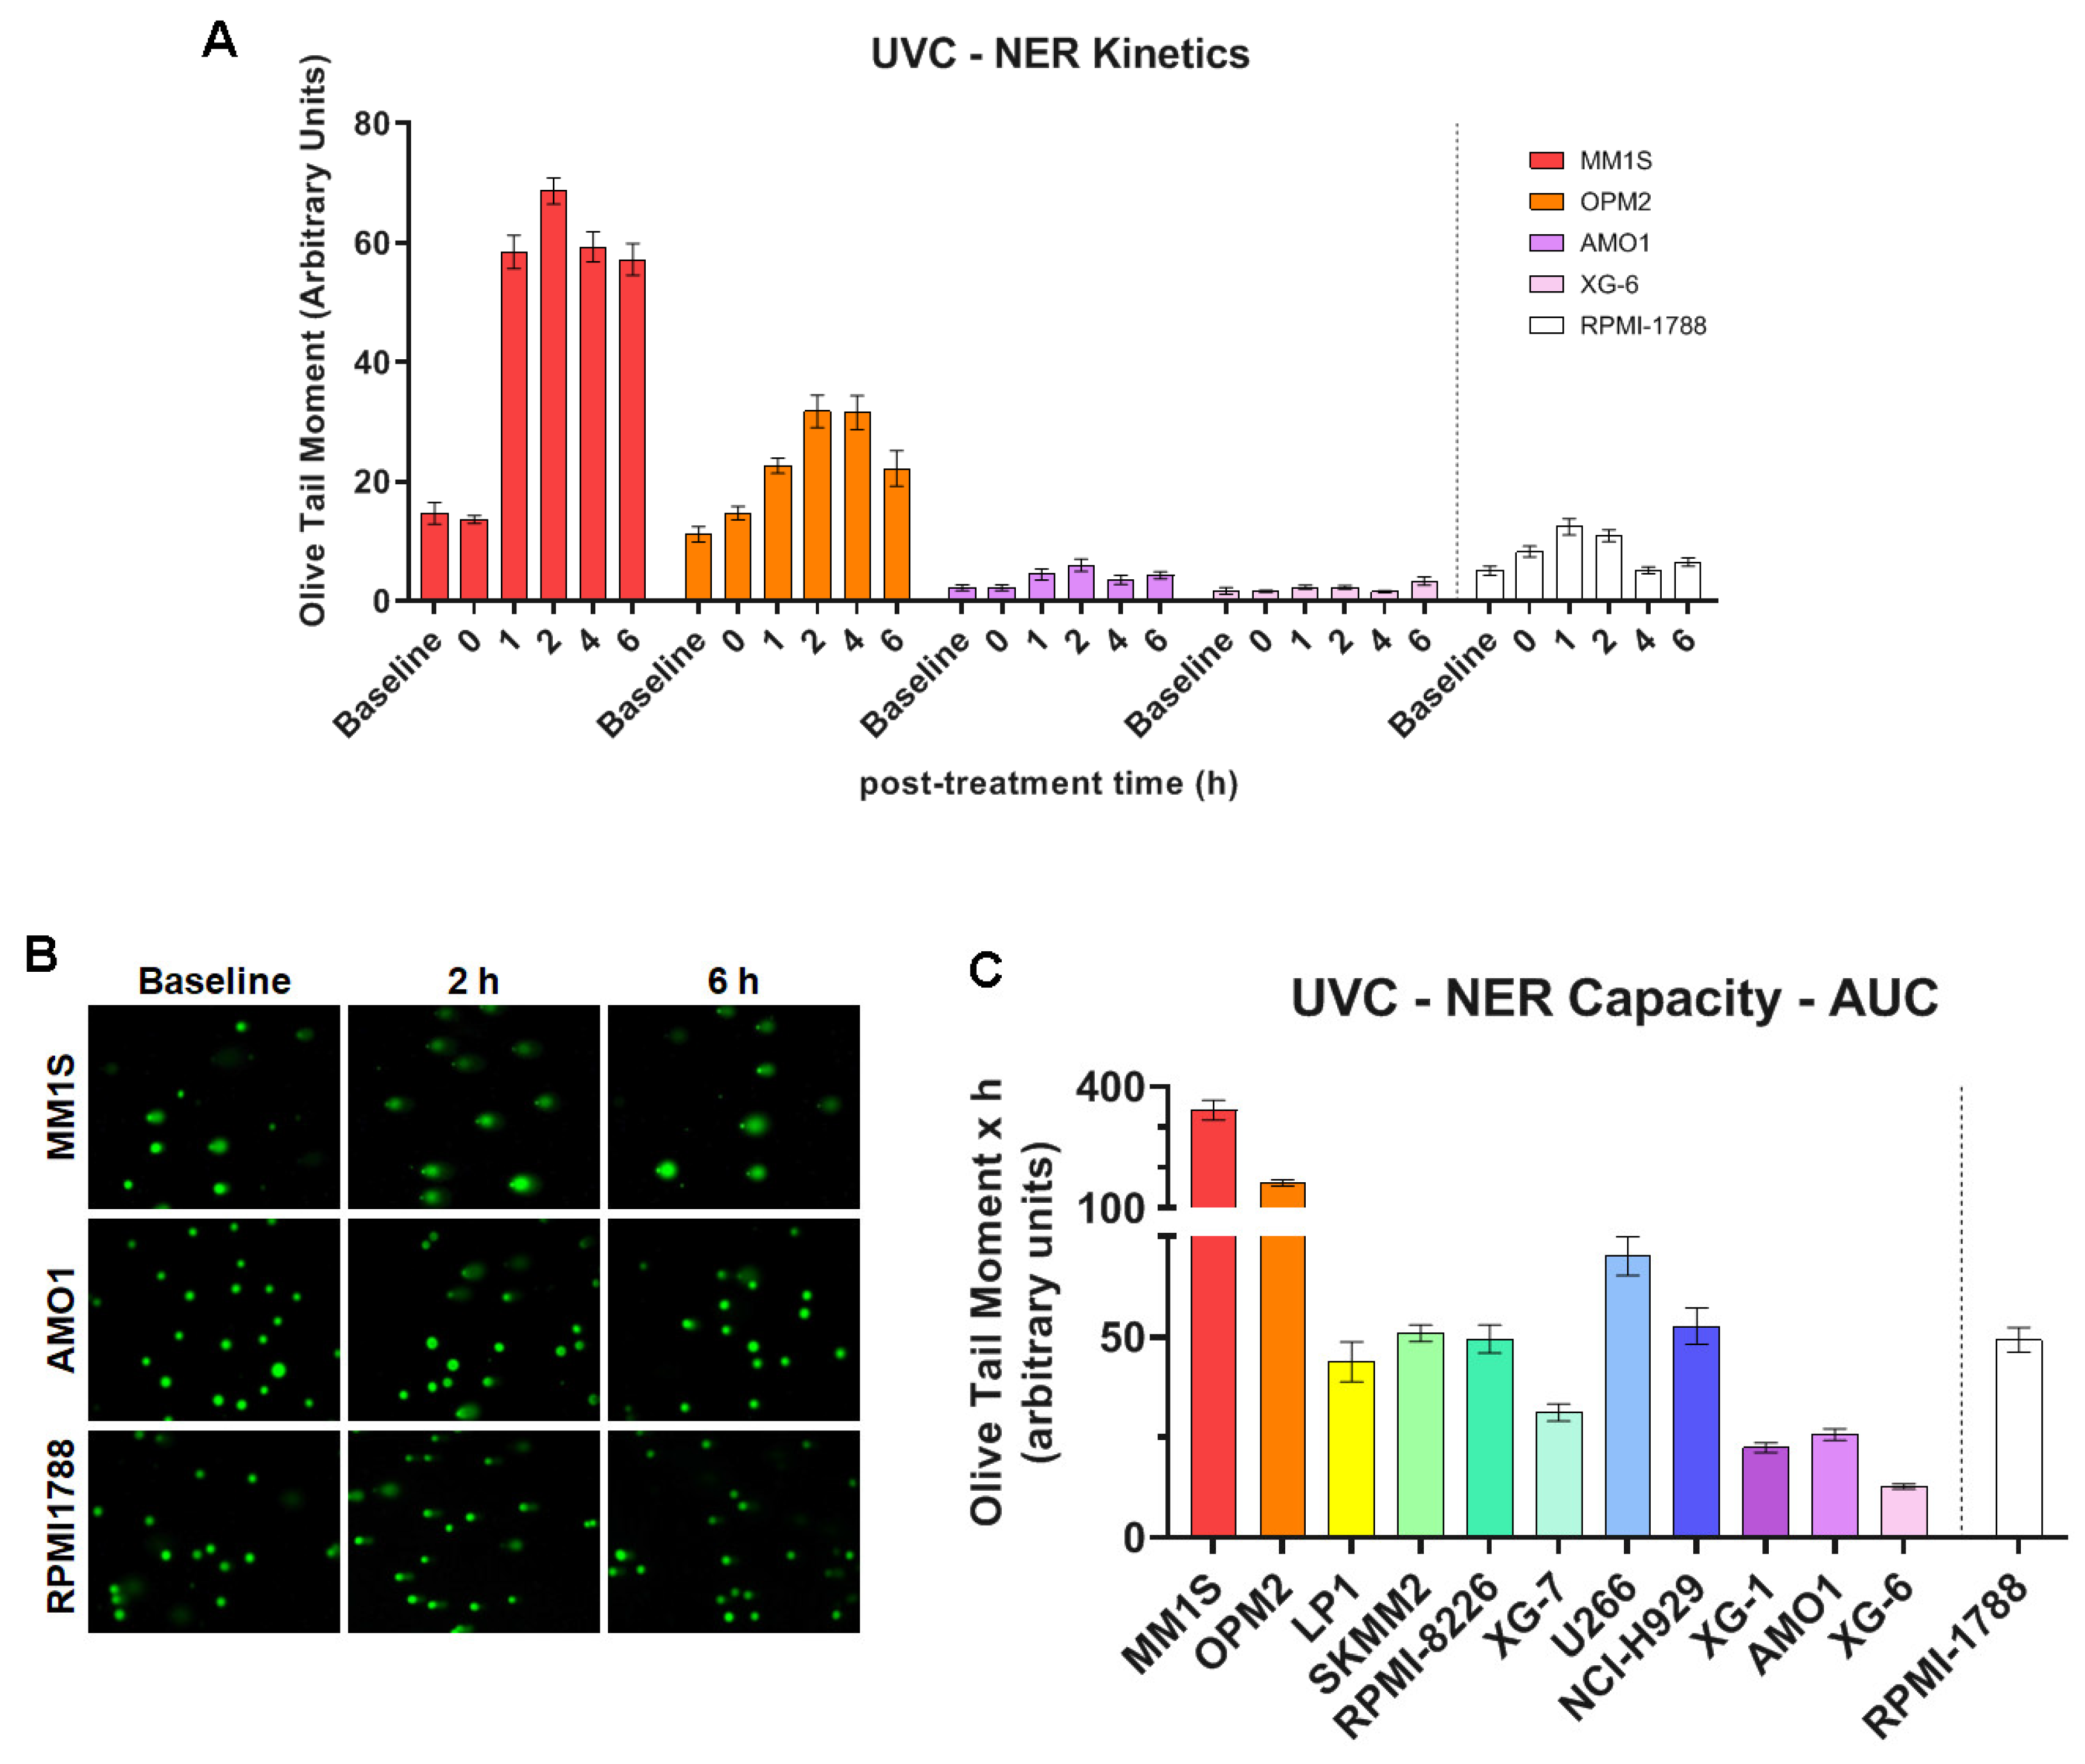
Figure 3.
UVC-induced oxidative stress and chromatin condensation of MM cell lines at baseline. (A) Oxidative stress as GSH/GSSG ratio in representative cells after UVC and (B) total oxidative stress as AUC across all samples. (C) AP-sites formation in representative cells after UVC irradiation and (D) total amounts of AP-sites quantified as AUC. A minimum of three biological independent experiments was performed for each condition. Error bars represent SD. (E) Representative autoradiograms showing chromatin condensation of the MM and healthy cell lines in the N-ras gene. M, 100bp DNA Ladder marker. U, untreated sample.
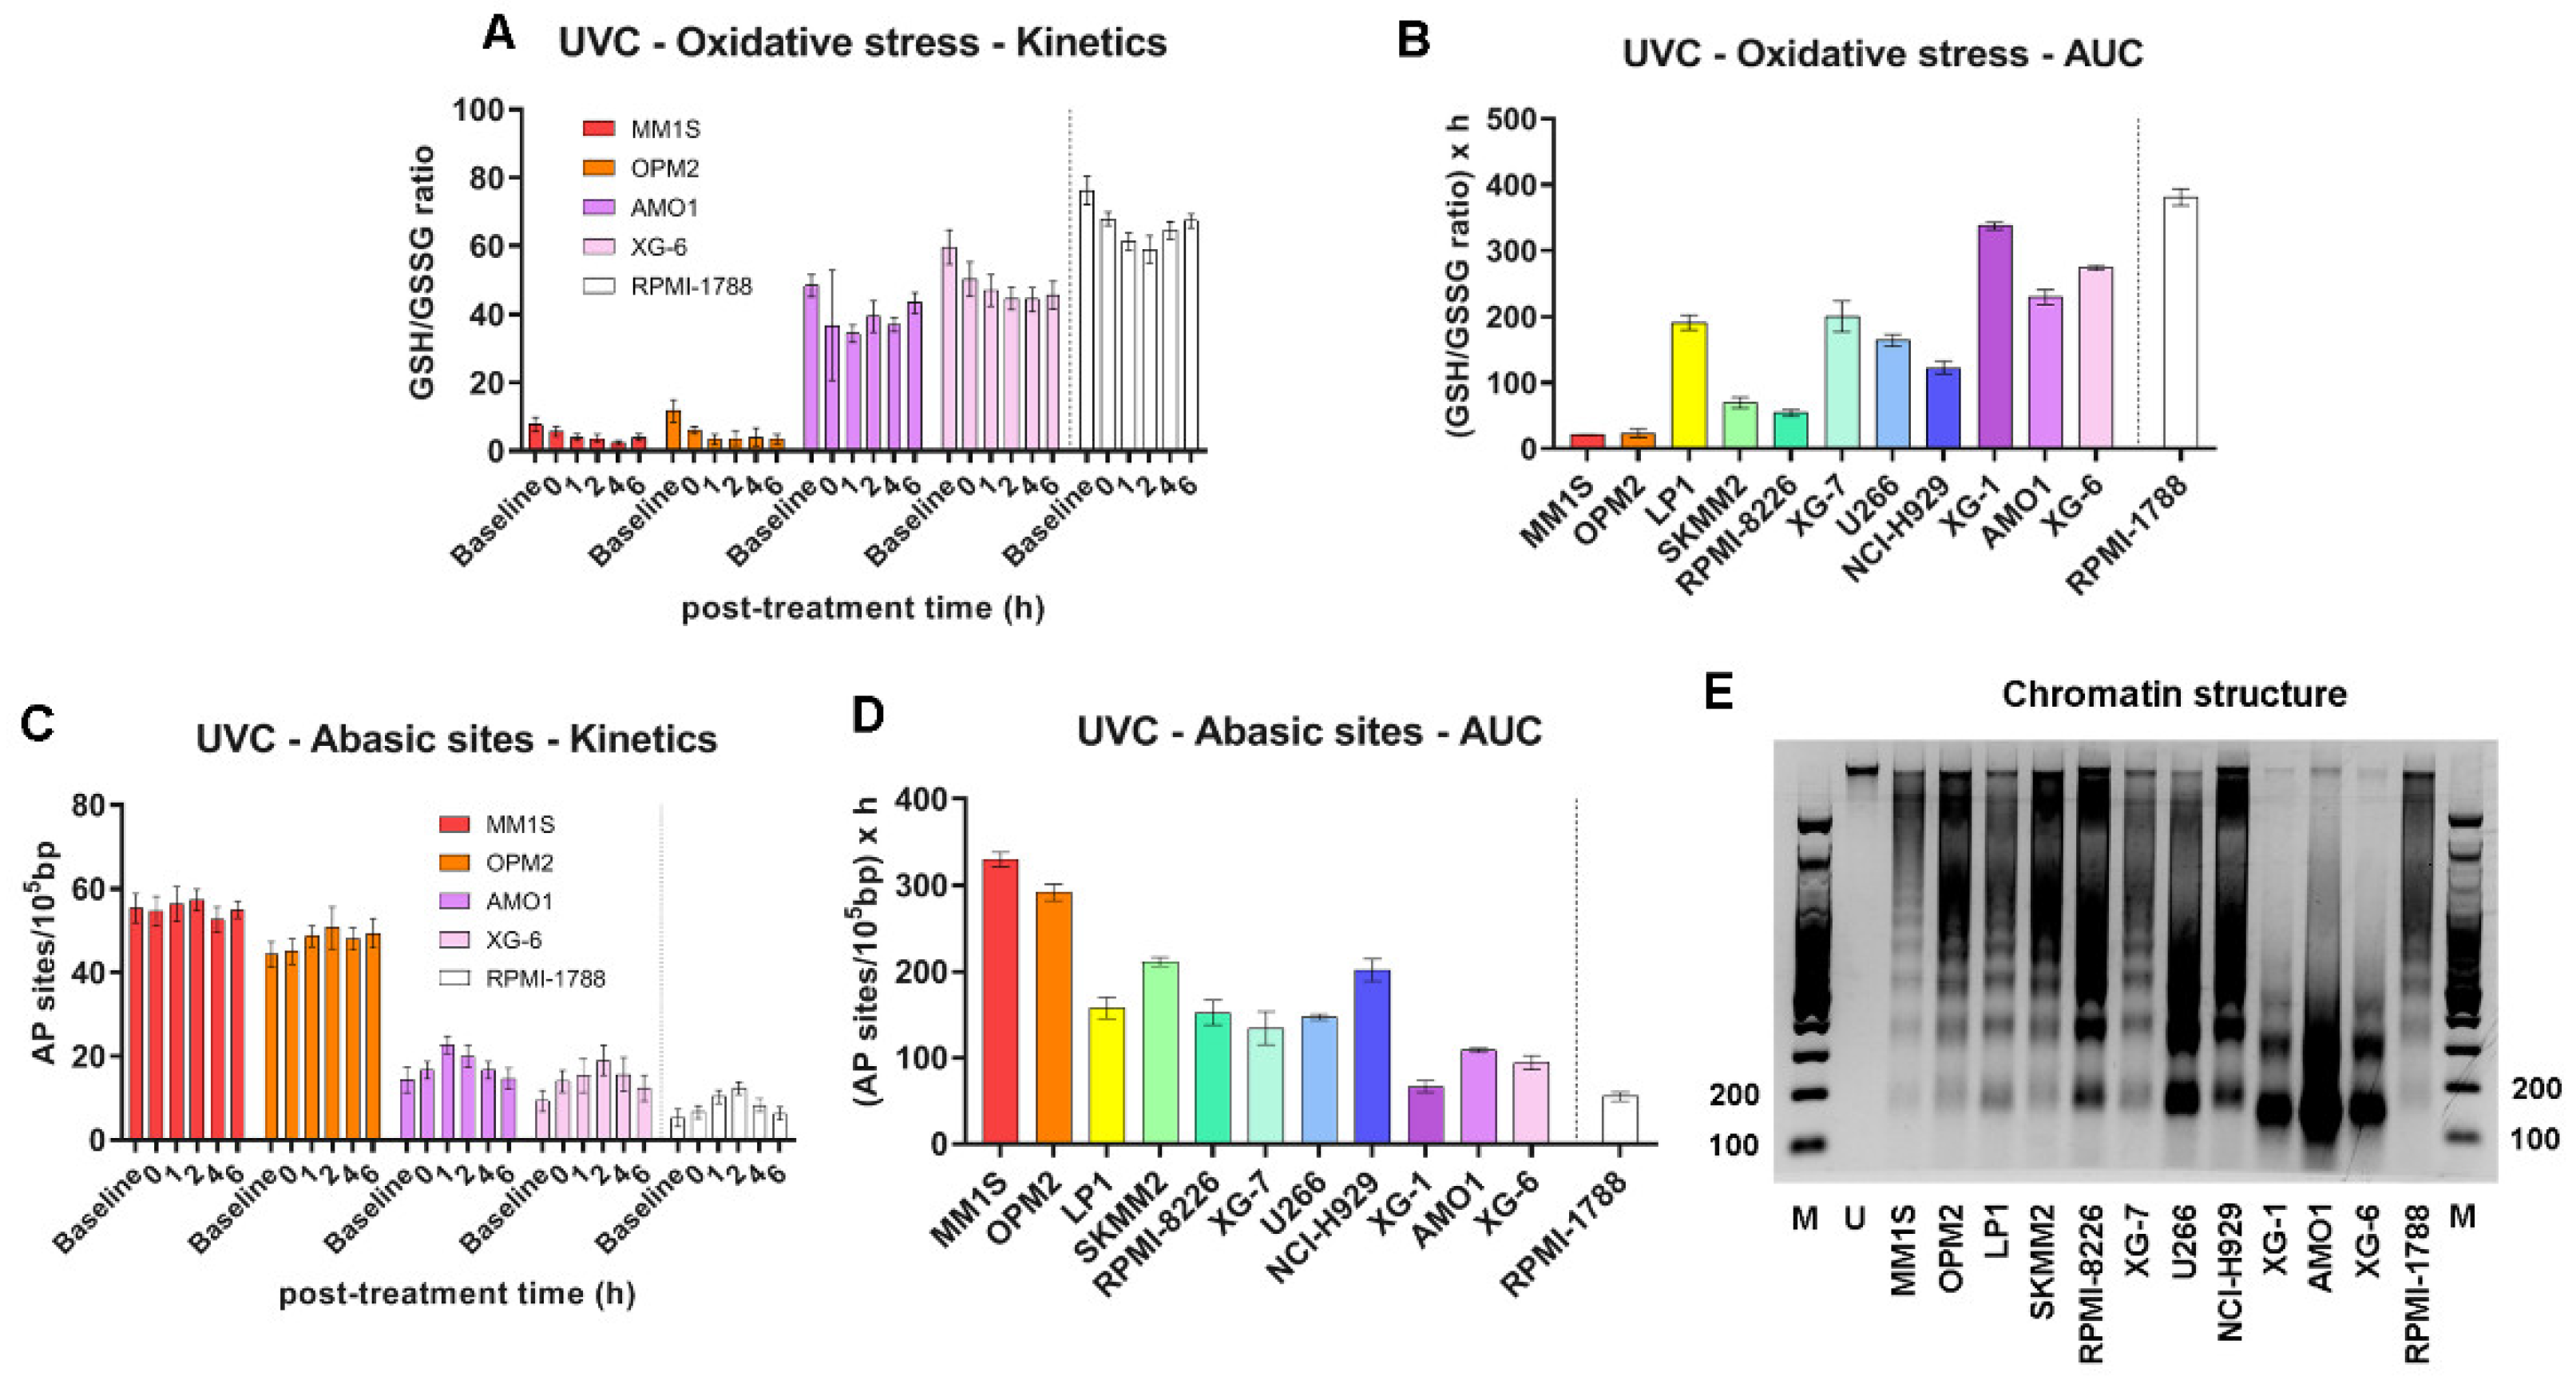
Figure 4.
DDR-related signals in MM cells following melphalan treatment. (A) Bar graphs of the kinetics of ICLs formation and repair upon melphalan treatment on representative cells. (B) Total ICL repair (ICL/R) capacity quantified as AUC. (C) Oxidative stress kinetics in selected samples expressed as GSH/GSSG ratio following melphalan exposure and (D) total oxidative stress across all samples quantified as AUC. (E) Selected cell’s AP-sites formation post-treatment and (F) total amounts of AP-sites measured as AUC. All experiments were conducted in at least three independent replicates. Error bars indicate SD.
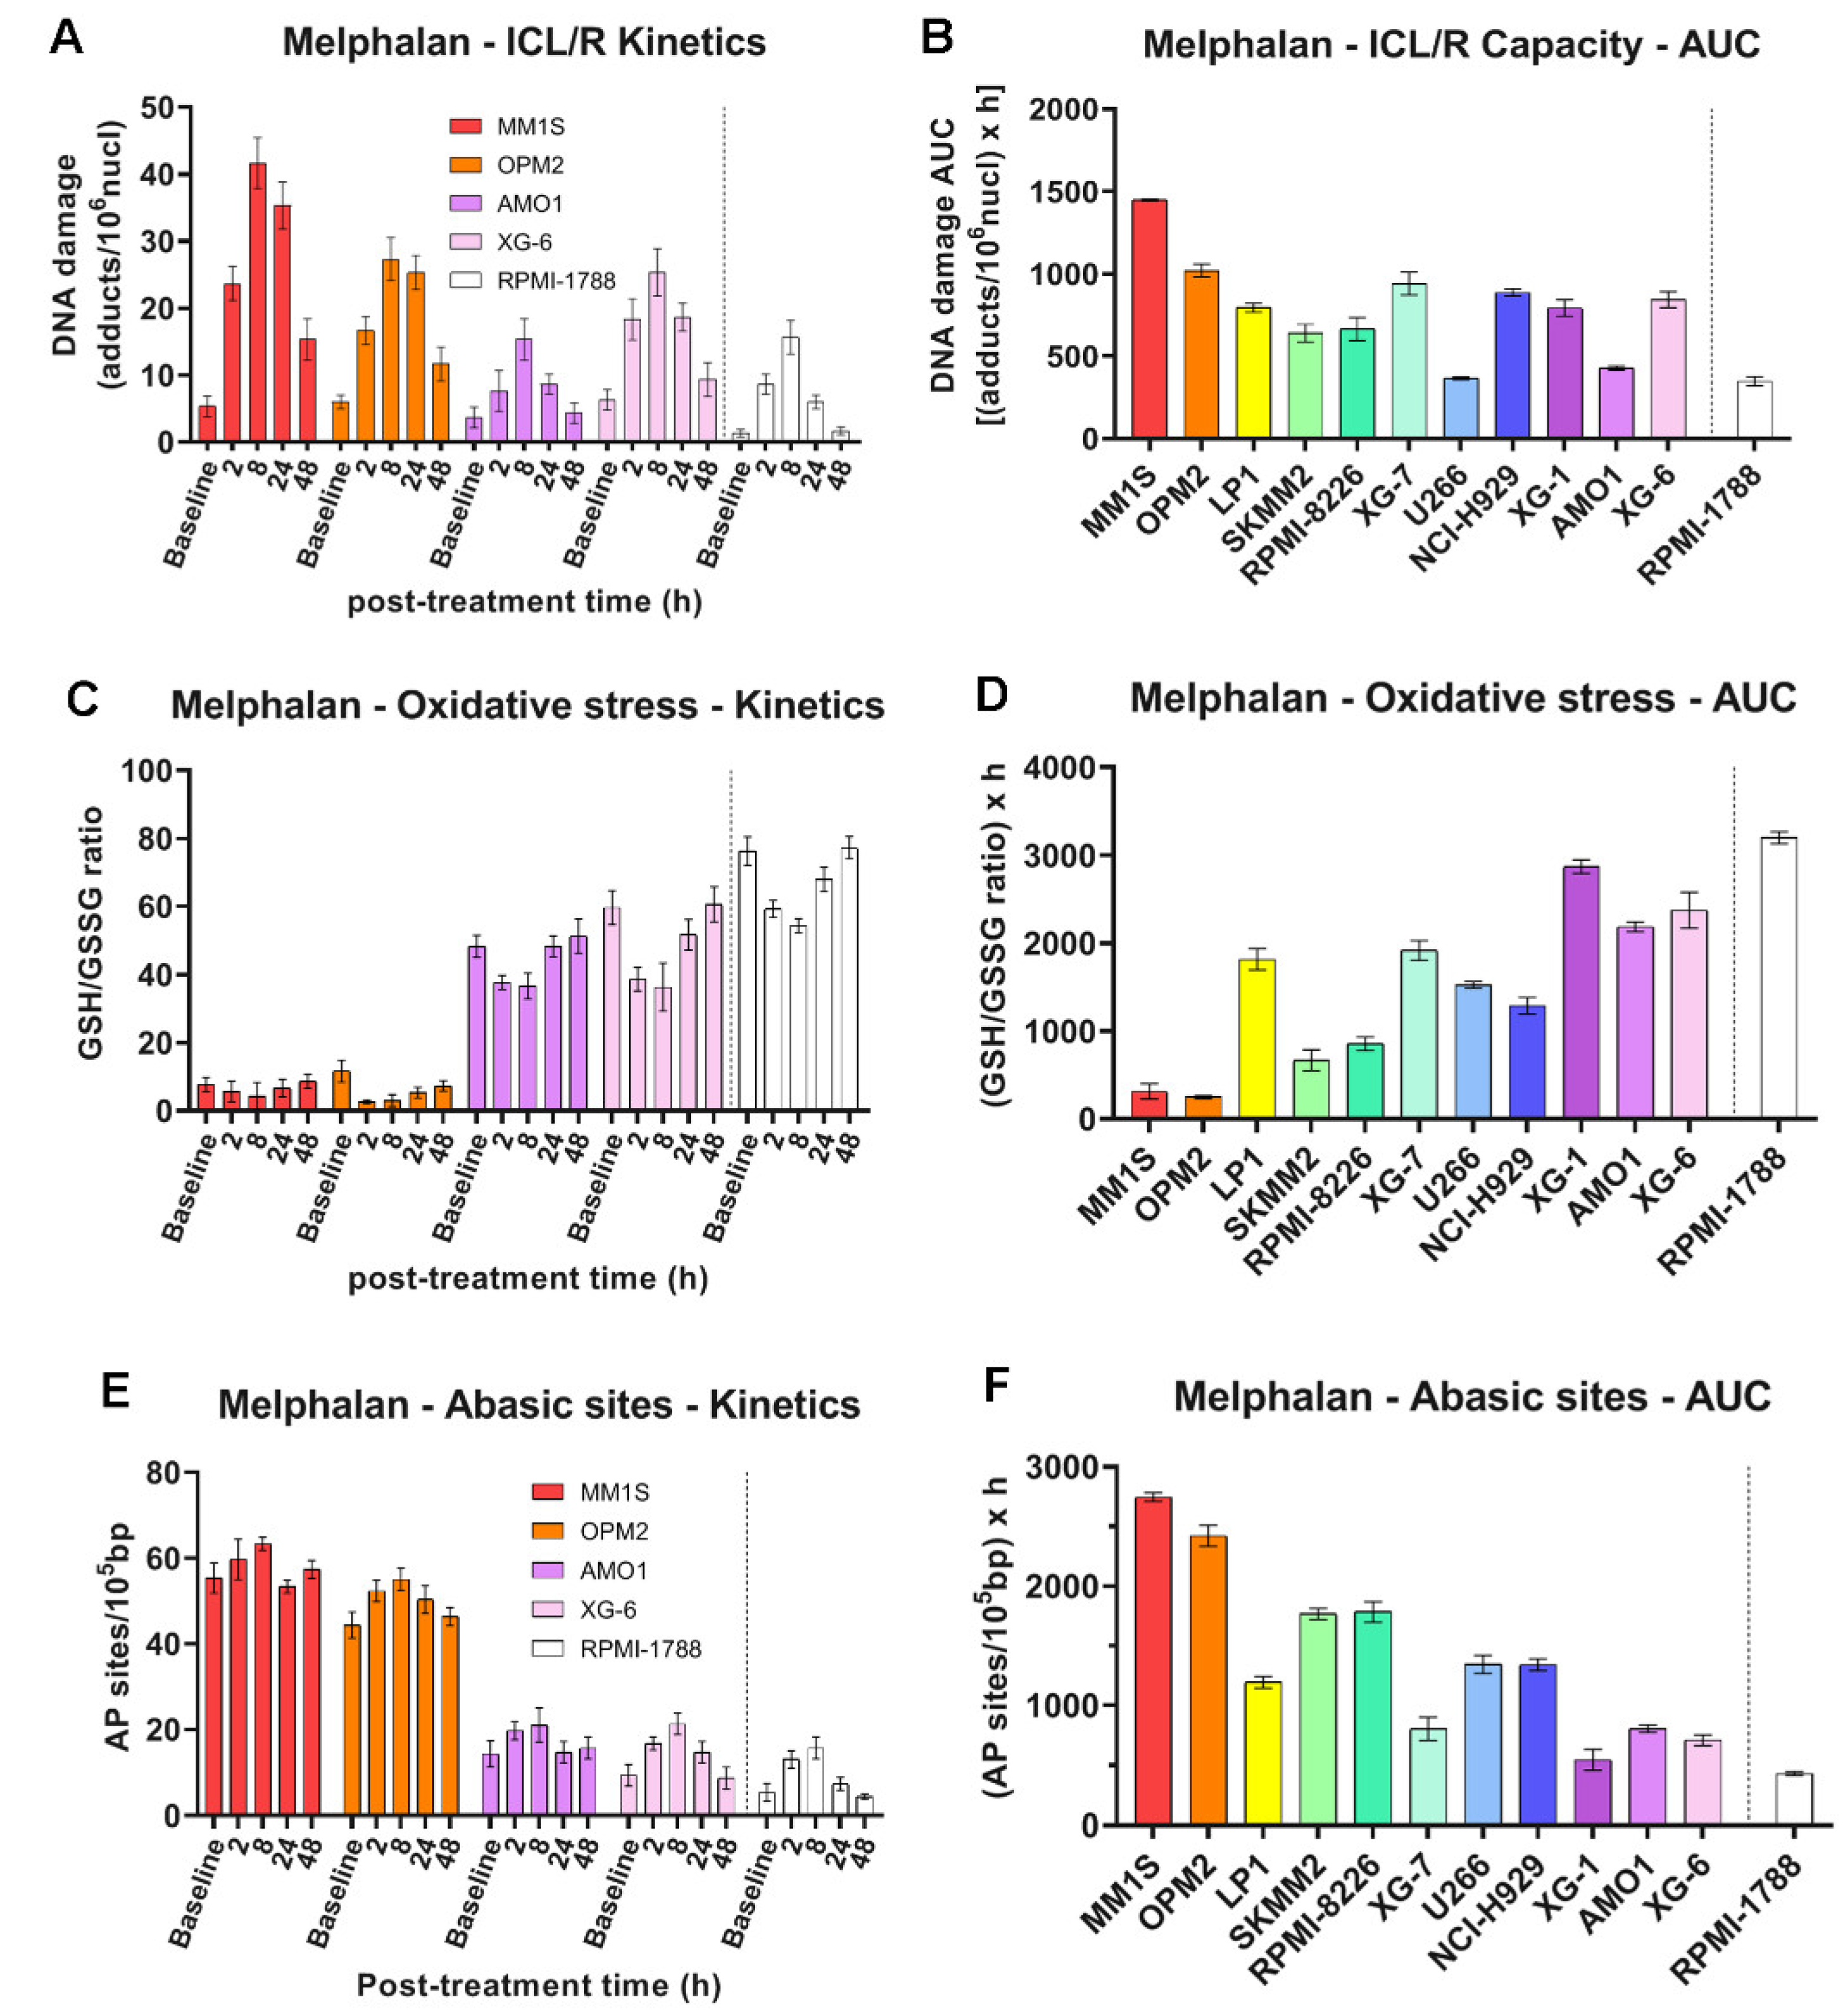
Figure 5.
DSB repair capacity of MM cell lines in response to treatment. (A) Representative confocal images of XG-6 and LP1 cells at baseline (-, untreated) and at 16 h following treatment (+, treated). Nuclei are stained with DAPI (blue), γH2AX foci (green) and RAD51 (red). (B) Bar graphs showing the kinetics of mean γH2AX foci per nucleus following melphalan treatment. (C) Total γH2AX foci levels quantified as AUC post treatment. (D) Bars present the kinetics of mean RAD51 foci per nucleus after stimulation with melphalan. (E) Total RAD51 foci levels expressed as AUC. Each experiment was repeated independently at least three times. Error bars represent SD.
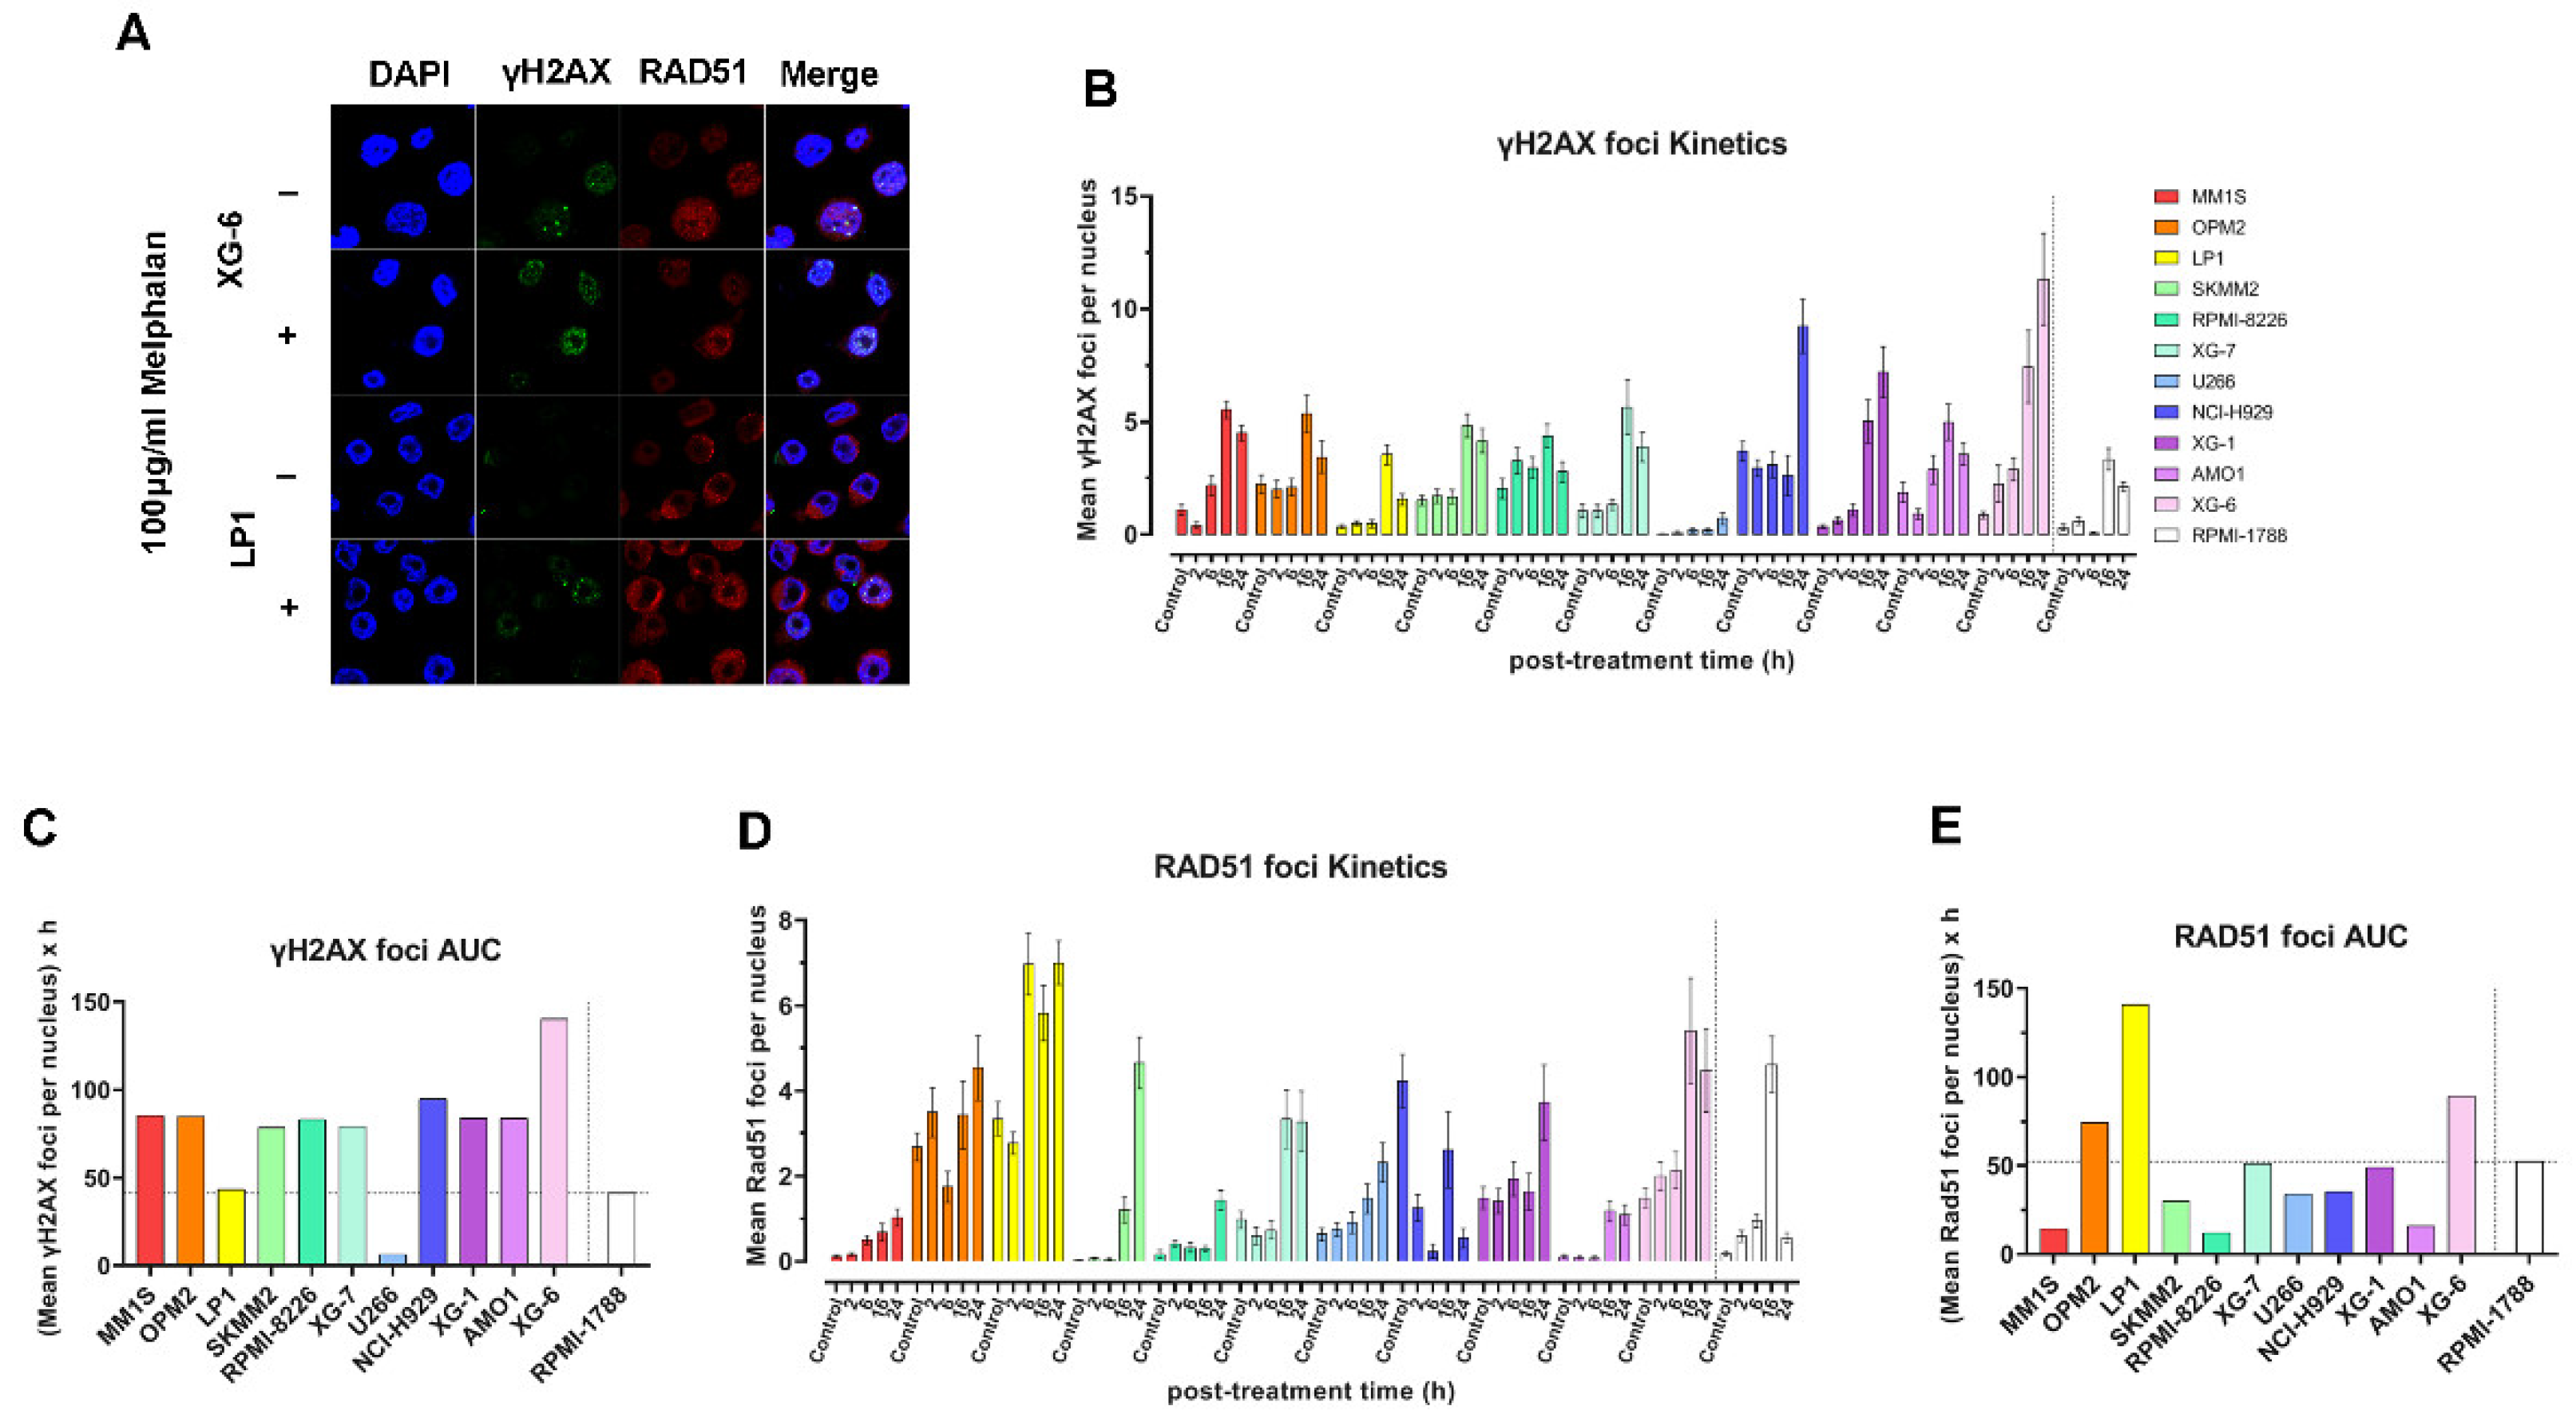
Figure 6.
Statistical analysis of DDR markers in MM cell lines. (A) Principal component analysis (PCA) reveals two distinct factors underlying the distribution of the markers across the cell lines. (B) Hierarchical clustering of Z-score normalized DDR marker values, using Ward’s method, identifies three distinct clusters among the samples.
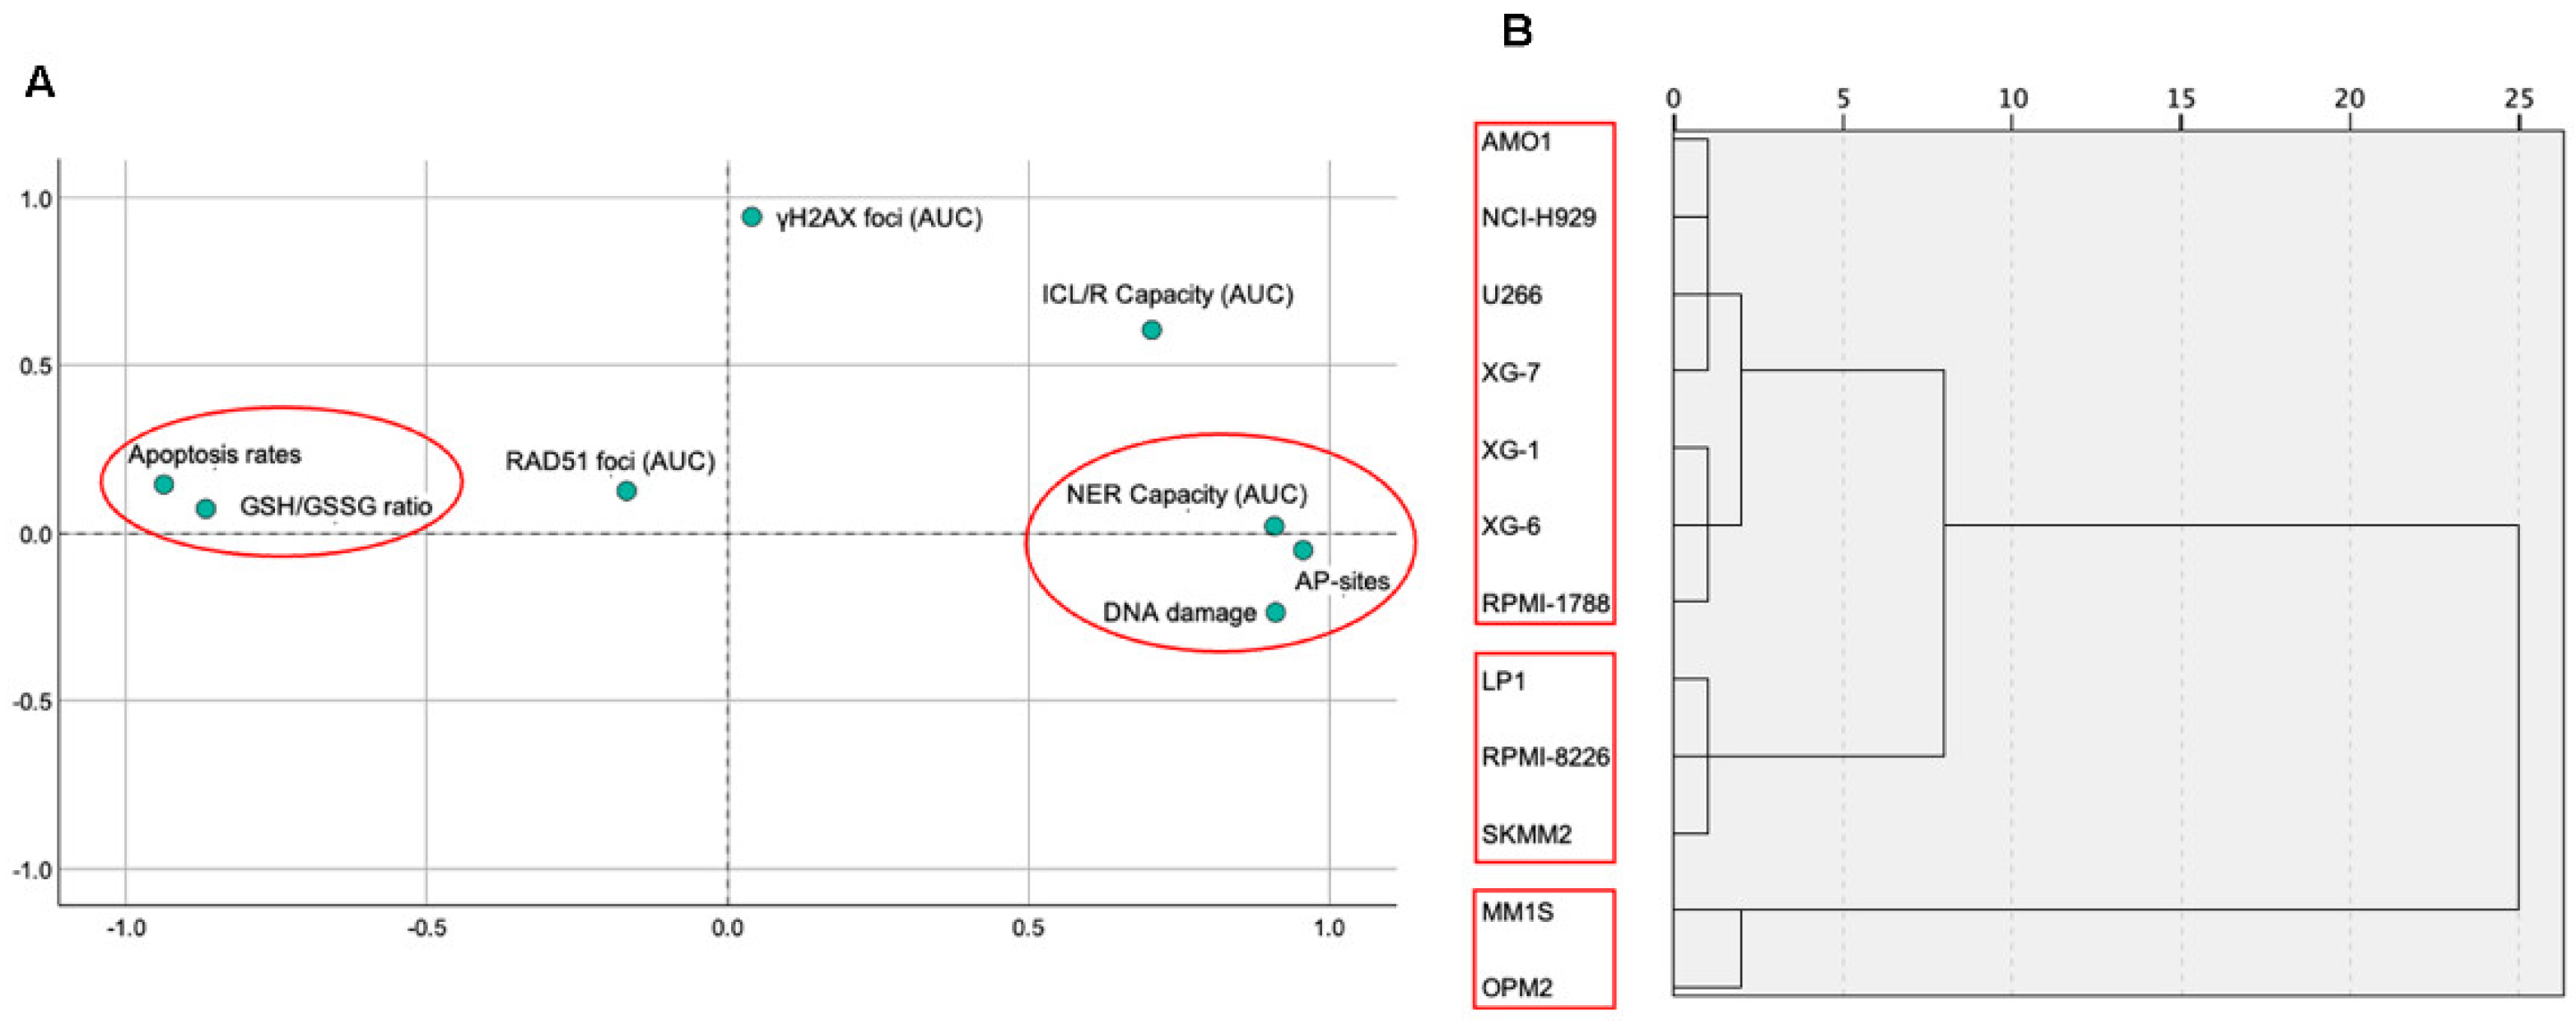

Table 1.
Pearson correlation analysis among DDR related parameters in MM cell lines.
| Apoptosis rates |
DNA damage |
GSH/GSSG ratio |
AP-sites | NER Capacity (AUC) |
ICL/R Capacity (AUC) |
γH2AX foci (AUC) |
|
|---|---|---|---|---|---|---|---|
| DNA damage | -.918** | ||||||
| GSH/GSSG ratio | .792** | -.804** | |||||
| AP-sites | -.864** | .864** | -.814** | ||||
| NER Capacity (AUC)# | -.792** | .762** | -.648* | .892** | |||
| ICL/R Capacity (AUC) | -.617* | 0.456 | -0.485 | .592* | .707* | ||
| γH2AX foci (AUC) | 0.135 | -0.145 | -0.053 | 0.021 | -0.003 | 0.483 | |
| RAD51 foci (AUC) | -0.032 | -0.033 | 0.286 | -0.215 | -0.244 | 0.073 | -0.03 |
| ** Correlation is significant at the 0.01 level (2-tailed); * Correlation is significant at the 0.05 level (2-tailed); # AUC: Area Under the Curve | |||||||
Disclaimer/Publisher’s Note: The statements, opinions and data contained in all publications are solely those of the individual author(s) and contributor(s) and not of MDPI and/or the editor(s). MDPI and/or the editor(s) disclaim responsibility for any injury to people or property resulting from any ideas, methods, instructions or products referred to in the content. |
© 2025 by the authors. Licensee MDPI, Basel, Switzerland. This article is an open access article distributed under the terms and conditions of the Creative Commons Attribution (CC BY) license (http://creativecommons.org/licenses/by/4.0/).
Copyright: This open access article is published under a Creative Commons CC BY 4.0 license, which permit the free download, distribution, and reuse, provided that the author and preprint are cited in any reuse.


