
Submitted:
01 September 2025
Posted:
02 September 2025
You are already at the latest version
Abstract
Peripheral nerve injuries remain a major clinical problem, and cell-free therapies using stem cell-derived bioproducts have emerged as promising alternatives. This study evaluated the influence of neurogenic differentiation and passage number on the secretomic and exosomal profile of human dental pulp stem cells. Conditioned media from undifferentiated and neurodifferentiated hDPSCs, and exosomes derived from undifferentiated hDPSCs at passages 4 and 7, were analyzed using multiplex immunoassays, RT-PCR, and scanning electron microscopy (SEM). Neurodifferentiated hDPSCs at early passages secreted higher levels of neurotrophic, angiogenic and immunomodulatory factors, including FGF-2, IL-6, IL-8, and PDGF-AA. Exosomes from early-passage undifferentiated cells showed a more abundant and relevant neuroregenerative mRNA cargo. Both cell types and exosomes adhered to the Reaxon® nerve guidance conduit, confirming the permissive nature of the materials regarding cells and cellular products allowing adhesion and survival. Neurite outgrowth assays performed on neurodifferentiated hDPSCs confirmed functional neural behavior. At later passages, a decline in secretory and exosomal activity was noted. These results highlight the relevance of early-passage hDPSCs as a source of bioactive factors and support their application in cell-free approaches for peripheral nerve regeneration.
Keywords:
biomaterials
; conditioned media
; exosomes
; human dental pulp stem cells
; peripheral nerve injury
; regenerative medicine
1. Introduction
Peripheral nerve injuries (PNIs) are a prevalent cause of sensory and motor deficits, often resulting from trauma, surgical procedures, or diseases [1]. Defects smaller than 4 cm usually have better outcomes, with regeneration occurring at a slow rate of 1-3mm per day, varying with the injury’s complexity and location [2,3]. Despite the peripheral nervous system’s intrinsic regenerative capacity, the functional recovery following extensive nerve damage remains suboptimal [4]. So, defects larger than 4 cm result in worst outcomes due to a lack of effective regeneration [2]. In these situations, neurorrhaphy and autologous nerve grafting remain the current gold standard techniques, yet they present significant drawbacks such as donor site morbidity, limited availability, and inconsistent outcomes [3]. Besides these difficulties, the peripheral nerve regeneration depends on the injury’s type and severity [5]. In response to these limitations, regenerative medicine has emerged as a promising field, with cell-based and, more recently, cell-free therapies gaining considerable interest for their ability to modulate the microenvironment and promote nerve repair [2,6].
To address the limitations of autologous grafting, several strategies have been developed to enhance peripheral nerve regeneration. Various studies developed techniques for preserving functional nerves by promoting axonal regeneration and enhancing recovery from PNI [7,8,9]. Nerve Guide Conduits (NGC) are a viable option for nerve repair, used to bridge the severed ends of the lesioned nerve, without sacrificing any healthy nerve for transplantation [1,10]. These devices provide a protected environment that supports and guides the axonal growth, cell migration, and extracellular matrix deposition, contributing to functional recovery [8]. However, in long-gap injuries, NGCs alone show limited effectiveness [11,12]. For that reason, the combination of NGC with stem cells and their secretions is one of the possibilities for an ideal treatment [2,9].
In peripheral nerve regeneration, mesenchymal stem cells (MSCs) have an important role due to their ability to produce and release a diverse collection of molecular and biochemical factors, denominated as secretome or its counterpart after conditioning, the conditioned medium(CM) [13]. Among the various cellular sources investigated, human dental pulp stem cells (hDPSCs) have drawn particular attention due to their neurotropic characteristics, ease of isolation, high proliferation, self-renewal capacity, multilineage differentiation and low immunogenicity [10,14,15]. Their capacity to differentiate toward neuronal and glial lineages, along with the secretion of bioactive molecules with trophic, angiogenic, and immunomodulatory properties, justifies their use in neuroregenerative therapies [16,17], and their self-renewing ability and pronounced plasticity support their application across various medical contexts [18]. However, despite their potential, the clinical implementation of stem cell-based therapies remains limited due to technical and biological limitations [19,20]. One of the main concerns is the safety, particularly the risks associated with immune rejection, uncontrolled cell proliferation, and pro-inflammatory responses [19,21,22] which, although rare, considering the immunoprivileged nature of these cells, can still occur. An alternative mechanism of therapeutic action has been proposed, highlighting the paracrine role of MSCs, the CM from hDPSCs (hDPSCs-CM) and hDPSCs-derived exosomes [1]. Specifically, hDPSCs-CM has emerged as a cell-free therapeutic agent that contains a rich mixture of soluble factors capable of modulating inflammation, promoting angiogenesis, and enhancing neural regeneration [23,24]. Building on this concept, research has supported the beneficial effects of MSCs predominantly mediated by the molecules they secrete [25,26]. Valadi et al. were among the first to describe the transfer of mRNA between cells mediated by extracellular vesicles (EVs), suggesting that genetic communication could occur independently of direct cell integration [27]. EVs, particularly exosomes, stand out due to their unique biogenesis and complex molecular cargo, positioning them as key mediators of MSC-induced tissue regeneration [28,29]. For that reason, hDPSCs-CM and hDPSCs-derived exosomes, have been increasingly recognized as critical effectors of tissue repair, acting via paracrine mechanisms rather than direct cell replacement [30,31,32].
According to the guidelines established by the International Society for Extracellular Vesicles (ISEV), the characterization of EVs must fulfill three essential criteria: (1) EVs must be isolated from conditioned cell culture media or biological fluids, ensuring minimal cellular disruption during the process; (2) At least one protein from each of three distinct categories should be identified in the EV preparation: cytosolic proteins, transmembrane or lipid-bound extracellular proteins, and intracellular proteins; (3) The vesicles must be characterized using at least two complementary techniques—one based on imaging, such as electron microscopy, and another that determines size distribution [33,34]. Exosomes are nanometric vesicles (30–150 nm) that encapsulate proteins, lipids, and nucleic acids, notably mRNA and microRNA, playing a crucial role in intercellular communication [35,36]. When derived from stem cells, exosomes carry neurotrophic and anti-inflammatory signals, influencing processes such as axonal outgrowth, Schwann cell activation, immune modulation, then facilitating cell proliferation and enhancing angiogenesis and regeneration [35,37,38]. Recent studies have highlighted the potential of hDPSC-derived exosomes to contribute to peripheral nerve regeneration [39,40,41].
The present study aims to investigate the influence of neurogenic differentiation and cellular passage number on the secretory and vesicular profiles of hDPSCs, with relevance to their application in peripheral nerve regeneration. To this end, the viability and adhesion of neurodifferentiatedhDPSCs and exosomes derived from hDPSCs, cultured within a commercially available NGC (Reaxon®) were evaluated to determine their compatibility with the biomaterial. Simultaneously, the paracrine activity of hDPSCs was assessed through quantification of cytokines and growth factors in the CM, alongside transcriptomic characterization of exosomes derived from undifferentiated cells at P4 and P7. A comprehensive methodological approach, comprising multiplex immunoassays, reverse transcription PCR, total protein content, and scanning electron microscopy, was employed to characterize the functional CM and exosomes. In addition, a neurite outgrowth assay was performed in different conditions to assess hDPSCs behavior. These findings are expected to contribute to the development of optimized cell-free therapeutic approaches and to support the incorporation of hDPSC-derived exosomes and hDPSCs-CM in future in vivo models for peripheral nerve repair.
2. Results
2.1. Analysis of hDPSCs Conditioned Medium and hDPSCs Exosomes
Results for the hDPSCs conditioned medium are presented in Table 1 and Figure 1a–e, and results for the hDPSCs exosomes are presented in Table 2 and Figure 1f–g. To evaluate the impact of neurogenic differentiation and passage number on the secretory activity of hDPSCs, both CM and exosomes were analyzed under various experimental conditions. In the CM fraction, comparisons were made between undifferentiated and neur-differentiated hDPSCs at P4 and P7, under both 1× and 5× concentrations.
At 1× concentration, neurodifferentiatedhDPSCs at passage 4 secreted higher levels of EGF, FLT-3L, Fractalkine, GRO-α, IFNα2, IL-1α, IL-6, IL-8, IL-9, IL-10, IL-12p40, IP-10, PDGF-AA, and RANTES, compared to the undifferentiated CM. Among these, Eotaxin, IL-15, MCP-3, and TNF-α showed statistically significant increases, indicating an enhanced neurotrophic, angiogenic, and immunomodulatory profile [2,42]. While most analytes were detected under both conditions, certain molecules were found exclusively in one group. For instance, EGF, IL-9, and IL-10 were detected only in the neurodifferentiatedcondition, whereas MIP and MCP-1 were exclusively present in the undifferentiated group. This selective expression pattern suggests that neuronal differentiation modulates specific components of the CM rather than inducing a uniform up or downregulation. These findings highlight that early passage neurodifferentiatedhDPSCs exhibit a robust secretory profile enriched in pro-inflammatory, immunoregulatory, and neuroactive factors [26].
At passage 7, still under 1× concentration, neurodifferentiatedhDPSCs showed moderately increased levels of several cytokines, including EGF, Eotaxin, Fractalkine, IL-1β, IL-6, IL-12p40, IL-13, IL-22, IL-27, IP-10, MCP-3, PDGF AB/BB, PDGF-AA, RANTES, and sCD40, compared to undifferentiated cells. Conversely, FGF-2, M-CSF, TNF-β, and VEGF-A were higher in the undifferentiated condition. Statistically significant increases were observed for MCP-1, IL-8, and GRO-α in the neurodifferentiatedgroup. Although the general pattern of change was like the one observed at P4, the magnitude of these differences was attenuated.
As expected, increasing the concentration from 1× to 5× led to a proportional rise in cytokine detection across all conditions. At P4, concentration enhanced levels of Eotaxin, FGF-2, IL-6, IL-22, M-CSF, MCP-3, PDGF-AA, and VEGF-A. In P7 samples, notable increases were observed in FGF-2, IL-8, M-CSF, MCP-1, and RANTES. These findings indicate that while concentration improves detection sensitivity, the intrinsic secretory output remains influenced by replicative senescence [43].
To further clarify the effect of passage number on neurodifferentiatedhDPSCs, a direct comparison between P4 and P7 was conducted using 5× concentrated CM. The analysis revealed a general decrease at P7 in the secretion of EGF, Eotaxin, FLT-3L, IFNα2, PDGF-AA, RANTES, M-CSF, MCP-3, IL-6, IL-9, IL-12p40, IL-15, sCD40, and TNF-α. Notably, PDGF-AA plays a key role in mitogenic stimulation and tissue repair, while the decline in TNF-α may reflect reduced immunomodulatory activity [44]. Nevertheless, some factors, such as VEGF-A and PDGF-AB/BB, remained relatively stable between passages, indicating that not all components of the CM are equally affected by senescence. Interestingly, MCP-2 was detected only at P7, and both GRO-α and FGF-2 exhibited increased levels in this later passage, further emphasizing the selective nature of the observed secretory changes, as seen Table 1.
Exosomes derived from undifferentiated hDPSCs were also evaluated at P4 and P7 under both 1× and 5× concentrations. Both concentration and passage number influenced the exosomal profile. At P4, exosome preparations displayed elevated levels of cytokines and growth factors, including Fractalkine, IL-1α, IL-22, IL-27, MCP-3, PDGF-AB/BB, and MIP-1α, all of which are implicated in immune modulation, neuroprotection, and regenerative signaling [45]. In contrast, P7-derived exosomes exhibited a generalized reduction in these molecules, particularly PDGF-AB/BB and MIP-1α, even after concentration. This suggests a passage-dependent decline in exosome-mediated signaling capacity. Although some analytes, such as EGF, Eotaxin, IL-5, IL-10, IL-8, and TNF-α remained relatively stable across passages, most exosome-associated factors showed decreased abundance with advancing passage, as detailed in Table 2.
In summary, the secretome and exosomal profiles of hDPSCs are dynamically regulated by both differentiation state and passage number. Neurodifferentiation, particularly at early passages, enhanced the secretion of neurotrophic and immunomodulatory factors in the CM. Furthermore, even exosomes derived from undifferentiated hDPSCs retained higher concentrations of key regenerative signals at early passages.

Table 1.
The neurodifferentiatedhDPSCs-CM analysis with mean concentration values for each biomolecule in P4 and P7 in both concentrations (x1) and (x5) (mean ± SEM).
Table 1.
The neurodifferentiatedhDPSCs-CM analysis with mean concentration values for each biomolecule in P4 and P7 in both concentrations (x1) and (x5) (mean ± SEM).
| Biomolecule | Mean ± SEM (P4) (x1) |
Mean ± SEM (P4) (x5) |
Mean ± SEM (P7) (x1) |
Mean ± SEM (P7) (x5) |
| EGF Eotaxin |
1.40 ± 0.00 41.66 ± 0.65 |
1.77 ± 0.77 148.06 ± 3.26 |
2.84 ± 0.63 4.93 ± 0.49 |
0.70 ± 0.00 2.90 ± 1.00 |
| FGF-2 | 31.24 ± 4.03 | 73.33 ± 1.42 | 40.83 ± 3.00 | 108.31 ± 5.20 |
| FLT-3L | 0.61 ± 0.11 | 1.42 ± 0.13 | 0.23 ± 0.06 | 0.25 ± 0.00 |
| Fractalkine Groα |
5.44 ±4.54 1.26 ±0.21 |
8.27 ± 3.21 2.03 ± 0.06 |
7.06 ± 7.98 14.93 ± 0.41 |
2.83 ± 0.00 25.46 ± 0.91 |
| IFN α 2 | 2.96 ±0.45 | 1.98 ± 0.64 | nd | nd |
| IFNγ | 0.3 ± 0.03 | 1.01 ± 0.09 | 0.35 ± 0.10 | 1.06 ± 0.03 |
| IL-1α IL-1b |
0.29 ± 0.06 0.71 ±0.49 |
0.46 ± 0.12 0.81 ± 0.55 |
nd 0.76 ± 0.00 |
nd 0.72 ± 0.36 |
| IL-1RA | 0.21 ± 0.03 | 0.25 ± 0.06 | nd | 0.19 ± 0.13 |
| IL-4 | 0.51 ± 0.01 | 1.48 ± 0.09 | 0.58 ± 0.11 | 1.58 ± 0.06 |
| IL-6 | 95.44 ± 2.04 | 254.07 ± 5.16 | 6.53 ± 0.19 | 21.07 ± 0.44 |
| IL-8 IL-9 |
11.7 ± 0.51 2.36 ±0.48 |
37.67 ± 3.48 2.13 ± 0.00 |
35.89 ± 1.83 nd |
102.60 ± 7.78 0.64 ± 0.00 |
| IL-10 | 0.16 ± 0.03 | nd | nd | nd |
| IL-12p40 | 1.25 ± 1.21 | 2.39 ± 3.06 | 2.11 ± 0.00 | nd |
| IL-13 | 6.82 ± 1.10 | 15.56 ± 1.74 | 9.13 ± 0.92 | 15.93 ± 1.77 |
| IL-15 IL-18 |
4.07 ± 0.17 0.08 ± 0.02 |
14.02 ± 0.87 nd |
1.37 ± 0.17 nd |
15.93 ± 1.77 nd |
| IL-22 IL-27 |
21.07 ± 2.09 2.01 ± 0.00 |
43.86 ± 1.52 4.29 ± 4.59 |
17.17 ± 2.32 5.83 ± 4.58 |
38.18 ± 4.45 7.21 ± 4.73 |
| IP-10 | 2.77 ± 0.31 | 1.91 ± 0.50 | 5.89 ± 0.21 | 4.60 ± 0.21 |
| M-CSF | 50.78 ± 3.15 | 156.36 ± 9.17 | 41.92 ± 2.91 | 128.81 ± 12.65 |
| MCP-1 | nd | nd | 114.2 ± 5.22 | 428.88 ± 12.34 |
| MCP-3 | 76.98 ± 1.59 | 217.32 ± 10.82 | 3.57 ± 0.69 | 4.11 ± 0.66 |
| MIG MIP PDGF-AA PDGF-AB/BB |
0.18 ± 0.05 nd 50.84 ± 2.28 25.45 ± 3.93 |
nd nd 192.09 ± 5.22 28.45 ± 6.69 |
nd nd 1.29 ± 0.21 33.69 ± 8.64 |
nd 4.02 ± 0.65 2.92 ± 0.28 27.52 ± 5.32 |
| TGFα | 0.22 ± 0.15 | nd | nd | 0.23 ± 0.04 |
| TNFα | 0.75 ± 0.00 | 1.11 ± 0.60 | nd | 14.90 ± 1.49 |
| TNFβ RANTES VEGF-A sCD40 |
5.49 ± 0.56 3.27 ± 0.35 98.89 ± 3.39 nd |
15.2 ± 1.30 7.00 ± 0.27 331.81 ± 4.57 3.27 ± 2.79 |
5.79 ± 0.39 0.95 ± 0.37 99.72 ± 5.17 2.72 ± 3.41 |
1.80 ± 0.07 356.41 ± 9.34 0.55 ± 0.00 nd |
Table 2.
hDPSCs derived exosomes analysis with mean concentration values for each biomolecule in P4 and P7 in both concentrations (x1) and (x5) (mean ± standard error of the mean (SEM)).
Table 2.
hDPSCs derived exosomes analysis with mean concentration values for each biomolecule in P4 and P7 in both concentrations (x1) and (x5) (mean ± standard error of the mean (SEM)).
| Biomolecule | Mean ± SEM (Exosomes P4) (x1) |
Mean ± SEM (Exosomes P4) (x5) |
Mean ± SEM (Exosomes P7) (x1) |
Mean ± SEM (Exosomes P7) (x5) |
| EGF Eotaxin |
0.70 ±0.00 0.60 ± 0.65 |
nd 0.60 ± 0.00 |
nd 0.41 ± 0.00 |
0.91 ± 0.00 0.86 ± 0.00 |
| FGF-2 | 0.08 ± 0.00 | nd | nd | Nd |
| FLT-3L | nd | 0.16 ± 0.09 | 0.07 ± 0.04 | 0.07 ± 0.04 |
| Fractalkine | nd | 3.3 ± 0.00 | nd | nd |
| IL-1α IL-1b |
nd nd |
0.12 ± 0.07 0.34 ± 0.23 |
nd nd |
nd 0.06 ± 0.00 |
| IL-1RA | 0.03 ± 0.00 | 0.12 ± 0.09 | nd | 0.19 ± 0.13 |
| IL-5 | 0.05 ± 0.01 | 0.04 ± 0.01 | 0.04 ± 0.01 | 0.04 ± 0.00 |
| IL-8 IL-9 |
0.01 ± 0.00 nd |
0.06 ± 0.05 0.64 ± 0.00 |
0.01 ± 0.00 nd |
0.01 ± 0.00 nd |
| IL-10 | 0.03 ± 0.00 | 0.16 ± 0.03 | 0.09 ± 0.03 | 0.08 ±0.05 |
| IL-12p40 | nd | 0.09 ± 0.00 | nd | nd |
| IL-13 | 2.76 ± 1.17 | 2.89 ± 1.86 | 2.44 ± 1.42 | 2.29 ± 1.12 |
| IL-15 IL-18 |
0.09 ± 0.07 nd |
0.19 ± 0.06 nd |
0.32 ± 0.11 nd |
0.04 ± 0.00 nd |
| IL-22 IL-27 |
0.41 ± 0.00 3.60 ± 0.88 |
nd nd |
nd nd |
nd nd |
| M-CSF | 1.78 ± 0.54 | 1.78 ± 0.54 | 12.58 ± 0.00 | 5.66 ± 0.00 |
| MCP-3 | 1.76 ± 0.90 | 1.77 ± 0.32 | 1.34 ± 0.18 | 0.27 ± 0.00 |
| MIG MIP PDGF-AA PDGF-AB/BB |
0.14 ± 0.09 2.10 ± 3.07 0.38 ± 0.27 21.07 ± 10.62 |
0.08 ± 0.00 1.31 ± 0.00 0.40 ± 0.18 21.45 ± 2.77 |
0.07 ± 0.05 nd 0.24 ± 0.14 12.84 ± 9.70 |
0.12 ± 0.05 nd 0.16 ± 0.14 17.06 ± 10.61 |
| TNFα | 0.13 ± 0.01 | 0.13 ± 0.02 | 0.12 ± 0.01 | 0.13 ± 0.01 |
| TNFβ RANTES sCD40 |
0.42 ± 0.31 0.17 ± 0.00 nd |
0.92 ± 0.25 0.13 ± 0.06 0.55 ± 0.00 |
0.56 ± 0.38 nd nd |
0.63 ± 0.54 nd nd |
Table 3.
Summary of the effects of neurodifferentiation, passage number, and concentration on key biomarkers in hDPSC-CM and their main biological roles.
Table 3.
Summary of the effects of neurodifferentiation, passage number, and concentration on key biomarkers in hDPSC-CM and their main biological roles.
| Cytokine / Factor | P4 | P7 | Function in Nerve Regeneration |
| FGF-2 | ✓ | ✓ | Angiogenesis, Schwann cell proliferation, axon outgrowth |
| VEGF-A | ✓ | — | Angiogenesis, neuroprotection |
| PDGF-AA | ✓ | — | Schwann cell support, tissue remodeling |
| IL-6 | ✓ | — | Inflammation resolution, glial modulation |
| IL-8 | ✓ | ✓ | Angiogenesis, chemotaxis |
| IL-22 | ✓ | ✓ | Tissue protection, neurotrophic signaling |
| M-CSF | ✓ | ✓ | Macrophage activation and polarization |
| MCP-3 | ✓ | — | Monocyte/macrophage recruitment |
| MCP-1 | — | ✓ | Monocyte chemotaxis, immune modulation |
| Eotaxin | ✓ | — | Chemokine signaling, potential glial effects |
| RANTES | — | ✓ | T-cell chemotaxis, axon growth, remyelination |
2.2. Scanning Electron Microscopy (SEM) and Energy Dispersive X-Ray Spectroscopy (EDS) Analysis
The outcomes of the scanning electron microscopy and energy dispersive X-ray Spectroscopy from hDPSCs can be found in Figure 2, and from hDPSCs exosomes in Figure 3. Following the evaluation of hDPSCs-CM and hDPSCs-derived exosomes, samples were prepared for scanning electron microscopy (SEM) and energy dispersive X-ray spectroscopy (EDS) analysis. This analysis was performed to assess the interaction between the tested biomaterial Reaxon® and both neuro-diferentiated hDPSCs and hDPSCs-derived exosomes.
SEM imaging of hDPSC-derived exosomes (Figure 2a and b) revealed uniformly distributed vesicles with spherical to slightly concave morphology and diameters predominantly ranging from 100 to 130 nm, consistent with typical exosome characteristics [46,47]. Their homogeneous appearance and preserved membrane integrity suggest successful isolation and structural stability. EDS analysis confirmed the biological nature of these vesicles. In regions containing visible exosomes (Z1 and Z2; Figure 2c), elements such as carbon, nitrogen, oxygen, phosphorus, and sulfur were detected, consistent with lipid membranes and nucleoprotein content (Figure 2 d and e). In contrast, the control region without vesicles (Z3; Figure 2c) showed an elemental profile dominated by silicon, calcium, and titanium, attributed to the scaffold or residual medium (Figure 2f). Gold and palladium, used for sputter coating, were present in all spectra. These findings confirm the exosomal identity and demonstrate their ability to adhere to the biomaterial surface.
Similarly, SEM images of neurodifferentiatedhDPSCs cultured on the inner surface of the Reaxon® conduit (Figure 3a and b) revealed scattered adherent cells exhibiting elongated morphology and cytoplasmic projections, characteristic of early neural-like differentiation but a continuous monolayer was not observed. EDS results from the cell-covered region (Spectrum 1; Figure 3b) revealed a biological elemental signature, including carbon, nitrogen, and oxygen, confirming the presence of cellular material (Figure 3e). In contrast, results from an uncovered region (Spectrum 2; Figure 3b) lacked nitrogen and other organic markers, further supporting the specificity of the signals in the cell-adherent area (Figure 3f). SEM imaging of the inner surface of the Reaxon® conduit without cells (Figure 3c) shows a uniform microstructured pattern characteristic of the biomaterial’s architecture. Elemental analysis by EDS of the Z5 region (Figure 3d) shows carbon and oxygen as the predominant elements, consistent with the polymeric composition of the conduit, with traces of silicon, gold, and palladium from the sputter-coating process. This profile matches the expected composition of the conduit surface before cell seeding.
Together, these observations confirm that the Reaxon® scaffold supports both the adhesion and morphological adaptation of neurodifferentiatedhDPSCs, as well as the stable interaction of exosomes with its surface.
2.3. Reverse Transcriptase Polymerase Chain Reaction (RT-PCR)
The outcomes of the RT-PCR of hDPSCs can be found in Table 4 and Figure 4, and from hDPSCs exosomes in Table 5 and Figure 5. Mean Ct values for each target gene, along with the corresponding ΔCt, ΔΔCt, and RQ calculations, are presented in Table 4. RNA purity, assessed by UV spectrophotometry, confirmed that all samples met the required quality standards, ensuring their suitability for downstream analyses. The melting curve profiles displayed a single peak for each gene, indicating the specific amplification of a single amplicon. The transcriptional profile of hDPSCs was evaluated by RT-PCR to assess the impact of neurogenic differentiation. Several genes associated with early neurogenesis and neural progenitor identity, including Ascl1, Nes, Cdk5r1, Sox2, Cd40, Cdh2 and Cript, were significantly upregulated in neurodifferentiated cells, suggesting activation of neurodevelopmental pathways [8]. Similarly, markers of neuronal maturation, Map2, Dcx, Syp and astroglial lineage commitment, Gfap, Aldh1l1 were strongly increased following differentiation, further supporting lineage specification toward neural phenotypes. Interestingly, Tubb3, commonly used as an early neuronal marker, was detected only in undifferentiated cells and absent in differentiated ones [48]. This pattern may reflect basal expression in the progenitor state and a transient downregulation during the induction process, or alternatively, an insufficient activation under the specific conditions applied. Some genes, such as Gap43, showed a downregulation between groups, suggesting they are not strongly modulated during early differentiation. Others, such as Mpz, Ncam1, Rbfox3 and Olig3 were undetected in both groups, possibly due to low expression levels or non-relevance to the specific neuroglial pathways engaged in this model. For transcripts not identified in either undifferentiated or neurodifferentiated cells, relative expression could not be determined.
Together, these results demonstrate that neurogenic induction in hDPSCs elicits a transcriptional shift characterized by increased expression of neuroprogenitor, neuronal, and astroglial markers, while certain lineage markers remain unaffected or undetectable.
The analysis of 22 neuroglial-related genes in exosomes derived from hDPSCs revealed a selective expression pattern and significant variation between P4 and P7. Overall, a greater number of transcripts were detected in P7 exosomes, although many exhibited low expression levels. Notably, Cd40 and Cdk5r1 were significantly upregulated in P7 compared to P4. In contrast, several neuroglial markers, including Tubb3, Gfap, and Mpz, showed reduced expression in P7-derived exosomes. Tubb3 was strongly downregulated, suggesting a diminished neurogenic content in vesicles from late-passage cells. Gfap and Mpz also declined modestly. Other genes such as Ascl1, Sox10, and Gap43 showed minimal changes between passages, indicating stable expression across conditions.
Certain transcripts were exclusively detected in one passage. Dcx, Ncam, Nes, Olig3, Syp, and Sox2 were only present in P7-derived exosomes, while Aldh1l1, Cdh2, Cript, Cspg4, Ocln, Rbfox3, and Neurod1 were undetectable under both conditions. This observation suggests that specific gene loading into exosomes is influenced by passage-dependent regulatory mechanisms and may not mirror cellular transcript abundance, as observed in Table 5.
Taken together, these findings demonstrate that the exosomal mRNA cargo is selectively modulated by passage number.
2.4. Neurite Outgrowth Assay
The outcomes of the neurite outgrowth assay for hDPSCs are shown in Figure 6, and the quantitative analysis is presented in Figure 7. Neurite outgrowth was assessed in differentiated hDPSCs cultured on 1 µm pore Millicell inserts. After a 48-hour incubation period, neuritic projections crossing the membrane were visualized by staining the basal membrane surface.
In the condition where membranes were coated with BSA (Figure 6a), the basal side showed only faint and sparse staining, with no evident linear or filamentous structures. The signal was mostly diffuse and punctate, indicating an absence of organized neuritic projections. This minimal staining is consistent with negligible neurite extension and supports the use of BSA as a negative control substrate.
In contrast, membranes coated with laminin (Figure 6b) exhibited intense, well-defined staining on the basal surface. Many elongated, fiber-like structures were visible, displaying a radiating pattern indicative of directional neurite extension through the pores. The distribution of the staining was widespread and homogeneous across the membrane surface, reflecting neuritic outgrowth.
When nocodazole (250 ng/mL) was added from the beginning of differentiation (Nocodazole 0h – Figure 6c), neurite staining was markedly reduced. Only sparse and discontinuous projections were detected on the basal surface, suggesting early and sustained disruption of microtubule dynamics that inhibited neurite formation.
In the condition where nocodazole was introduced after 24 hours of differentiation (Nocodazole 24h – Figure 6d), neurite staining was reduced relative to the standard differentiation condition but more pronounced than in the Nocodazole 0h group. Some less marked neuritic extensions remained visible, indicating that pre-established neurites may be partially resistant to delayed nocodazole exposure.
Quantification of neurite outgrowth was performed by extracting the membrane-bound stain and measuring absorbance at 570 nm. The quantitative analysis of neurite outgrowth (Figure 7) showed significantly increased absorbance in the laminin group, confirming its neuroinductive potential. BSA-coated membranes presented minimal absorbance, validating the absence of neurite formation. Nocodazole treatment from 0h reduced neurite-associated absorbance and when applied at 24h, absorbance remained high, suggesting partial resistance of pre-established neurites to depolymerizing conditions. To specifically quantify the number of cells, the QuPath v0.6.0 application was used. The analysis showed 733 cells in the BSA–coated wells, 2728 cells in the laminin-coated wells, 474 cells in the wells treated with nocodazole from the beginning of differentiation, and 1257 cells in the wells treated with nocodazole after 24 hours of differentiation.
2.5. Total Protein Quantification
The outcomes of the total protein quantification of different groups can be found in Figure 8 and the statistical differences are present in Table 6. The secretory activity of hDPSCs was influenced by both neurodifferentiation and cell passage number. This modulation was reflected in the composition of the CM, the cytokine profiles associated with exosomes, and the total protein content.
Total protein concentration was quantified in the CM of both undifferentiated and neurodifferentiated hDPSCs, as well as in hDPSCs derived exosomes, at P4 and P7. As shown in Figure 8, CM samples exhibited substantially higher protein concentrations than the corresponding exosomal fractions, reflecting the broader composition of the CM, which includes soluble proteins, cytokines, and growth factors in addition to vesicle-associated components. In contrast, the exosomal fraction represents a more selective subset, enriched in vesicle-specific cargo.
In neurodifferentiated cells, total protein levels were slightly higher at P4 compared to P7, indicating that neurodifferentiation enhances the secretory activity, particularly in early passages. Interestingly, in undifferentiated cells, the opposite pattern was observed: both CM and exosome fractions showed higher total protein content at P7 than at P4. Notably, the highest protein concentration was detected in the CM from undifferentiated P7 cells. This unexpected increase suggests a possible shift in basal secretory activity or altered metabolic behavior in late-passage undifferentiated cells.
Altogether, these results show that neurodifferentiation promotes increased protein secretion in early passages, while undifferentiated cells at later passages may retain or even enhance protein output.
3. Discussion
This study investigated how neurogenic differentiation, passage number, and CM concentration influence the secretory and vesicular profile of hDPSCs by analyzing the composition of the CM and exosomes, as well as their interaction with an NGC. These findings provide relevant insights for optimizing hDPSC-derived products for peripheral nerve regeneration, demonstrating that both neurogenic differentiation and passage number critically modulate the paracrine profiles of hDPSCs, with direct implications for their application in peripheral nerve regeneration. At early passage (P4), neurodifferentiatedhDPSCs exhibited a markedly enhanced secretory profile, particularly in the CM, with increased levels of bioactive molecules including FGF-2, VEGF-A, PDGF-AA, IL-6, IL-8, IL-22, M-CSF, MCP-3, and Eotaxin. These factors collectively support key regenerative processes such as angiogenesis, neuronal survival, Schwann cell activation, and immune modulation, essential functions for effective repair of injured peripheral nerves [19,49]. Several of these molecules act synergistically [50]. Angiogenic factors like VEGF-A and FGF-2 promote neovascularization and provide trophic support to regenerating tissues [51]. Cytokines such as IL-6 and IL-8 are involved in both inflammation regulation and tissue remodeling [52], while chemokines like MCP-3 and M-CSF enhance macrophage recruitment and polarization, contributing to Wallerian degeneration and the clearance of inhibitory debris [53]. The presence of IL-22 and Eotaxin further points to an activated, repair-oriented immune environment [54]. The coordinated upregulation of these molecules in early-passage, neurodifferentiatedcells highlight their regenerative potential and supports their use in cell-free therapeutic strategies [55].
At P7, despite a general attenuation in secretory activity, certain factors remained elevated, namely FGF-2, IL-8, IL-22, M-CSF, MCP-1, and RANTES. This pattern suggests a selective adaptation of the secretory phenotype with cellular aging. Of particular interest is the significant upregulation of RANTES, a chemokine involved in immune cell recruitment, but also increasingly recognized for roles in axonal regeneration, neuroimmune signaling, and remyelination [56]. Its elevation at P7 may reflect a compensatory response to reduced overall secretory capacity, or the onset of a senescence-associated secretory phenotype, where certain inflammatory and chemotactic factors are selectively maintained or amplified [56]. The rise in MCP-1 at P7 may further support this interpretation, as it plays a central role in monocyte/macrophage recruitment and has been implicated in both neuroinflammation and repair [23].
The comparison between 1× and 5× CM concentrations confirmed that concentration amplifies the detection of already abundant cytokines but does not overcome the intrinsic decline in secretion associated with cellular senescence [57]. This suggests that while CM concentration enhances analytical sensitivity, it does not modify the underlying secretory potential, further reinforcing the importance of using early-passage cells.
In parallel, the analysis of exosomes revealed results closely aligned with those observed in the CM. Exosomes derived from P4 hDPSCs contained higher levels of regenerative and immunomodulatory molecules such as Fractalkine, IL-1α, IL-22, IL-27, MCP-3, PDGF-AB/BB, and MIP-1α. These vesicle-associated factors contribute to immune modulation, axonal growth, and glial support, and their abundance in early-passage preparations suggests that exosome-mediated signaling is particularly effective at this stage [58]. In contrast, exosomes derived from P7 hDPSCs exhibited a broad reduction in most of these molecules, even after concentration, indicating a diminished vesicular bioactivity associated with replicative aging [59]. Despite some stability in factors like EGF, IL-8, IL-10, and TNF-α across both passages, the overall decline in exosome content at P7 supports the notion that passage number negatively affects not only the CM but also vesicle-based communication. Interestingly, some factors such as VEGF-A and PDGF-AB/BB remained relatively stable, suggesting that a subset of regenerative signals may resist senescence-induced downregulation [60].
Taken together, these findings highlight the dynamic nature of hDPSC paracrine signaling, and emphasize that neurodifferentiation enhances the CM, especially in early passages [2]. However, with increasing passage number, a selective and partial preservation of secretory activity is observed. While this may reflect compensatory mechanisms, the global decline in trophic and immunomodulatory content reinforces the importance of controlling passage number in the standardization of hDPSC-derived therapeutic products for use in PNIs therapeutics.
The SEM analysis of neurodifferentiated hDPSCs seeded on the inner surface of the Reaxon® scaffold revealed clear evidence of cell adhesion and morphological adaptation to the substrate. Although the cells did not form a continuous layer, their elongated shapes and cytoplasmic projections suggest effective adhesion and early acquisition of neural-like characteristics, potentially indicating initial stages of neurite extension. The non-confluent but stable adhesion is a sign of good cytocompatibility, demonstrating that the NGC can support the attachment and survival of differentiated hDPSCs, as well as undifferentiated hDPSCs as previously studied [2]. This is particularly relevant in the context of peripheral nerve regeneration, where cell–scaffold interactions help direct axonal regrowth [8,61]. EDS analysis of the cell-covered regions confirmed the presence of biological material through detection of nitrogen, carbon, and oxygen, elements commonly associated with cellular membranes and protein structures [62].
In parallel, combined SEM and EDS analyses also confirmed the successful isolation of hDPSC-derived exosomes and their adhesion in the NGC. The vesicles displayed typical exosomal morphology, spherical to slightly concave profiles, with diameters ranging between 100 and 130 nm [63]. Their preserved structure and even distribution suggest good stability and compatibility with the NGC surface. Elemental mapping from zones Z1 and Z2, where exosomes were identified, revealed an organic signature comprising carbon, nitrogen, oxygen, and phosphorus, consistent with lipid bilayer components and internal nucleoproteins. In contrast, the control region Z3, without vesicles, showed an inorganic profile, dominated by silica and calcium in line with the composition of the scaffold material or processing residues. This distinction confirms that the biological signal in Z1 and Z2 arises specifically from the exosomes, not from the substrate.
Altogether, these results validate both the morphology and biochemical composition of the exosomes and neurodifferentiated hDPSCs and confirm their interaction with the biomaterial. The ability of vesicles and cells to adhere to the scaffold while retaining structural integrity supports their application as paracrine effectors in cell-free regenerative strategies, especially in systems designed for guided nerve repair [64].
The capacity of hDPSCs to differentiate toward neurogenic lineages is of increasing interest, particularly due to their neural crest origin and associated plasticity [65,66]. In this study, neurogenic induction activated a transcriptional profile consistent with early neuronal and astroglial behavior. Differentiated hDPSCs expressed upregulations in markers such as Ascl1, Cd40, Nestin, Cdk5r1, Cript, Sox2, Cd40, and Cdh2, associated with neural progenitor activation and early lineage progression [67,68,69,70,71]. The presence of Map2, Dcx, and Syp, typically linked to cytoskeletal remodeling, migration, and synaptic vesicle formation, respectively, suggests that the cells acquired immature neuronal characteristics, without reaching full maturation [72]. Of relevance was the expression of Gfap and Aldh1l1, two well-established astrocytic markers, detected exclusively in differentiated hDPSCs. This indicates that the induction protocol activates not only neuronal but also astroglial differentiation pathways, reflecting the natural lineage diversity observed during early neural development [72]. This dual activation may be advantageous in regenerative applications, as both neurons and glial cells contribute to successful nerve repair, through trophic support, modulation of inflammation, and structural guidance [73,74].
In contrast, undifferentiated hDPSCs showed expression of Tubb3, Ocln, Sox10, and Cspg4. The presence of Sox10 and Cspg4, associated with neural crest-derived progenitors and immature glial precursors, confirms the multipotent state of the undifferentiated cells [75,76,77]. Ocln, a tight junction protein, further supports an epithelial-like form [78]. Interestingly, Tubb3, typically regarded as a pan-neuronal marker, was present in the undifferentiated group but absent in differentiated cells. This may reflect dynamic regulation of tubulin isoforms during early neuronal commitment or the predominance of alternative class III β-tubulin family members [72,79].
The absence of Mpz, Ncam1, Rbfox3, and Olig3 in both groups suggests that the differentiation protocol induced a partial neural commitment, but not terminal maturation into specific subtypes such as myelinating glia or fully functional neurons [80,81]. This incomplete profile is not unexpected given the relatively short induction period. Future protocols may benefit from longer culture durations and more targeted lineage cues to guide differentiation toward functional subtypes relevant for peripheral nerve regeneration. The downregulation of Gap43, a gene associated with axonal growth and neural remodeling, further supports the incomplete activation of regenerative pathways [82]. Although often upregulated during active neurite extension, its decreased expression may reflect insufficient cytoskeletal remodeling or lack of stimuli promoting axonal outgrowth [65,83,84]. Combined with the absence of maturation markers such as Mpz, Ncam1, Rbfox3, and Olig3, these results suggest that the applied differentiation protocol induced early neuroglial commitment but did not drive full maturation toward functionally specialized neuronal or glial subtypes [65,85]. The predominance of progenitor and early-lineage markers in the transcriptomic profile aligns with a transitional phenotype, which may require prolonged induction to achieve more advanced differentiation stages [67,86,87].
The analysis of 22 neuroglial-related genes in exosomes derived from undifferentiated hDPSCs revealed a selective and passage-dependent expression pattern. Although a greater number of transcripts were detected in P7-derived exosomes, many were present at low levels, suggesting that a broader transcript distribution does not necessarily equate to higher functional potential. More relevantly, key neurogenic and glial markers such as Tubb3, Gfap, and Mpz, showed reduced expression in P7 compared to P4. The marked downregulation of Tubb3 is particularly indicative of diminished neurogenic signaling, while the moderate decrease in Gfap and Mpz reflects a decline in glial and myelination-related content [88,89,90]. These findings suggest that exosomes from early-passage hDPSCs carry a transcript profile more compatible with neural repair.
Conversely, Cd40 and Cdk5r1 were significantly upregulated in exosomes from P7. CD40 is involved in immune activation and may reflect a shift toward inflammatory or stress-related pathways in aging cells [91]. Cdk5r1, a key regulator of neuronal cytoskeletal dynamics, is also implicated in cellular stress response and synaptic function [92,93]. Some transcripts, including Ascl1, Sox10, and Gap43, remained relatively stable between passages, indicating partial conservation of neural-related signals despite replicative aging [94,95,96]. Interestingly, genes such as Dcx, Ncam, Nes, Olig3, Syp, and Sox2 were exclusively detected in P7-derived exosomes. The consistent absence of Aldh1l1, Cdh2, Cript, Cspg4, Ocln, Rbfox3, and Neurod1 in exosomes from both early- and late-passage cells suggests that these transcripts are either not expressed at detectable levels or are not selectively incorporated into vesicles under basal conditions in undifferentiated hDPSCs. This supports the broader understanding that exosomal mRNA cargo does not merely mirror the cellular transcriptome, but results from active and regulated packaging mechanisms, likely influenced by cell state, passage number, and intracellular stress [97].
In summary, these findings confirm that replicative age modulates the exosomal transcriptome, with early-passage hDPSCs generating vesicles enriched in canonical neuroglial transcripts, and late-passage cells exhibiting a shift toward immune or stress-related signals. This reinforces the importance of controlling passage number when producing exosome-based therapies aimed at neuroregeneration. Overall, the results show that neurogenic induction triggers early neuroglial gene expression in hDPSCs, and that exosomes from early-passage cells carry mRNA profiles that may support nerve regeneration [72,98]. The observed impact of passage number on both cellular and exosomal RNA content emphasizes the importance of standardized expansion protocols and suggests that exosome profiling could serve as a useful quality control tool in the development of regenerative therapies [34].
The neurite outgrowth assay provided a reproducible and sensitive platform for evaluating neuritic extension under defined experimental conditions. The results demonstrated that hDPSCs respond dynamically to both permissive and inhibitory factors applied to the basal membrane surface. Membranes coated with laminin elicited robust neurite extension, in agreement with previous literature describing laminin as a pro-neurogenic extracellular matrix protein [99,100]. The pattern of neurite staining observed on the basal surface supports its efficacy in promoting axonal-like outgrowth, likely via integrin-mediated cytoskeletal signaling pathways [101,102].
The near absence of neuritic structures in the BSA-coated condition confirmed the biological inertness of BSA in this context and validated its role as a negative control [103]. Moreover, the lack of diffuse or non-specific signal in these membranes supports the assay’s capacity to selectively visualize membrane-translocating neuritic processes.
To assess the inhibitory modulation of neurite outgrowth, the microtubule-depolymerizing agent nocodazole was used. Nocodazole is a synthetic benzimidazole that binds to β-tubulin and disrupts microtubule polymerization, thereby impairing cytoskeletal dynamics essential for neurite formation and elongation [104,105]. This compound has been widely used in neurobiological studies as a tool to investigate the dependence of neurite extension on microtubule integrity [106,107]. In the present study, nocodazole was applied at two different time points to induce partial and complete inhibition of neurogenesis. The observed time-dependent suppression of neurite formation is consistent with the critical role of stable microtubules in supporting neuritic protrusion and guidance [108,109,110]. To confirm the role of microtubule stability in neurite formation, nocodazole was applied at 250 ng/mL either from the beginning of differentiation or after a 24-hour priming period. When nocodazole was present from time zero, neurite extension was severely impaired, reflecting the critical role of early microtubule polymerization in neurogenesis [111]. Delayed exposure to nocodazole (after 24 hours of differentiation) resulted in a milder reduction in neurite staining. This suggests that once neurites have initiated and partially matured, they may retain some structural stability or partial resistance to microtubule depolymerization, at least at the tested concentration. This finding aligns with reports that microtubule bundles in stabilized neurites exhibit increased resilience compared to dynamic, newly formed projections [112,113,114].
Quantitatively, absorbance measured at 570 nm showed a significant increase in the laminin-coated group, supporting its role as a neuroinductive substrate. In contrast, BSA-coated membranes exhibited minimal absorbance, confirming the absence of neurite formation. Nocodazole treatment from the beginning of differentiation markedly reduced absorbance values, indicating early inhibition of microtubule dynamics. When nocodazole was added after 24 hours, absorbance levels remained high, suggesting that pre-established neurites retain partial resistance to microtubule depolymerization. These data support the reliability of the assay in distinguishing permissive from inhibitory conditions for neurite extension.
The quantification of total protein revealed distinct patterns depending on both the differentiation status and passage number of the hDPSCs. In neurodifferentiated cells, there was a decrease in protein concentration from P4 to P7, suggesting a decline in global secretory activity associated with replicative aging. However, an opposite trend was observed in undifferentiated cells: both the CM and exosome fractions displayed higher total protein levels at P7 compared to P4, with the CM from undifferentiated P7 cells exhibiting the highest value among all the groups. This increase may reflect changes in cell metabolism, stress-related responses, or compensatory secretion mechanisms in late passages [115], although further studies are required to clarify the underlying causes. Notably, in all conditions, the CM consistently showed higher protein content than the corresponding exosome fraction, confirming that the soluble secretome encompasses a broader range of bioactive molecules beyond the vesicles [116]. These findings highlight the importance of considering both differentiation state and passage number when analyzing the secretory profile of hDPSCs and designing therapeutic strategies. The divergent behaviors observed emphasize the need for careful selection and standardization of culture parameters in the development of secretome- or exosome-based regenerative products.
These results collectively reinforce the notion that the therapeutic potential of hDPSC-derived products is not fixed but evolves with culture conditions and cellular aging. The neurogenic environment amplifies the regenerative signature of both the CM and exosomal fractions, particularly at early passages. Importantly, the sensitivity of hDPSCs to microenvironmental modulation, demonstrated by their response to both neuroinductive cues and cytoskeletal disruption, underscores their plasticity. These findings highlight the need to rigorously define and control in vitro parameters such as passage number, induction timing, and concentration protocols to harness the full regenerative potential of hDPSCs. Products derived from this cell lineage, when prepared under optimized conditions, represent a promising strategy for peripheral nerve repair, particularly in combination with NGC, offering a reproducible, cell-free approach with strong translational relevance. Nonetheless, the variability observed across the different analyses suggests that additional strategies may be required to further enhance the consistency and efficacy of hDPSC-derived products. One promising technique could involve the application of priming protocols to precondition hDPSCs, aiming to achieve a more uniform and enhanced regenerative profile [117,118]. Such modulation could help overcome variations seen in secretory, transcriptomic, and functional assays, ultimately strengthening the reliability and translational potential of these products for neuroregenerative applications.
4. Materials and Methods
4.1. Preparation of hDPSCs and Conditioned Medium
The isolation, expansion and characterization methodologies for hDPSCs were previously described in detail by our research group [2,9,119,120,121]. A commercially available hDPSC primary cell line (AllCells, LLC, Alameda, CA, USA; Cat. DP0037F, Lot DPSC090411–01) was used, which has been previously validated by the supplier regarding its primary cell properties. Conditioned medium derived from hDPSCs, was produced using previously established protocols, and extensively characterized for its periphery injury healing potential, as described in Bruna et al [1,2].
Briefly, hDPSCs were cultured under standard conditions, washed, and incubated in unsupplemented DMEM/F12 GlutaMAX™ for 48 hours. The collected medium was then centrifuged, filtered, and concentrated fivefold (5×) before being stored at −20°C for further analysis. The concentrated CM was stored at −20°C and later analyzed using the Luminex™ 200 system (Luminex, Austin, TX, USA) by Eve Technologies Corp. (Calgary, Alberta) to identify specific biomarkers.
In this study, the use of neurodifferentiated hDPSCs was introduced to compare their CM with undifferentiated cells. Additionally, exosomes were isolated from hDPSCs to investigate their content profile. These novel approaches allow a broader understanding of the differences in bioactive factors released by these cell populations.
For the experimental setup, different groups of hDPSCs and their derived products were analyzed. The groups included:
- -
- Undifferentiated hDPSCs at P7 and P4, both with unconcentrated CM (1×).
- -
- Neurodifferentiated hDPSCs at P4 and P7 with unconcentrated CM (1×).
- -
- Neurodifferentiated hDPSCs at P4 and P 7 with concentrated CM (5×).
- -
- Exosomes isolated from hDPSCs at P4 and P7 with unconcentrated CM (1×).
- -
- Exosomes isolated from hDPSCs at P4 and P7 with concentrated CM (5×).
4.2. Analysis of hDPSCs Conditioned Medium
The CM was analyzed to identify key chemokines and growth factors secreted by hDPSCs. This study included both early-passage (P4) and late-passage (P7) hDPSCs to compare their secretory profiles. Additionally, CM from neurodifferentiated hDPSCs and exosomes isolated from hDPSCs were explored, extending our previous investigations including the evaluation of two different concentrations [2].
Luminex xMAP technology was employed for the multiplexed quantification of 48 human cytokines, chemokines, and growth factors. The analysis was performed using Eve Technologies’ Human Cytokine Panel A 48-Plex Discovery Assay® (MilliporeSigma, Burlington, Massachusetts, USA) following the manufacturer’s protocol. The 48-plex panel included a broad range of biomarkers relevant to peripheral nerve regeneration, with sensitivities ranging from 0.14 to 50.78 pg/mL.
A comprehensive explanation of each biomarker and its role in this study is detailed in Bruna et al. [2].
4.3. Exosome Isolation from Cell Culture Media
Exosomes were isolated from hDPSCs culture media using the Total Exosome Isolation from cell culture media Kit (Thermo Fisher Scientific, Cat. No. 4478359), following the manufacturer’s instructions and other study from the group in the subject [122]. Briefly, the conditioned culture media was first centrifuged at 2,000 × g for 30 minutes to remove cells and debris. The supernatant was carefully transferred to a new tube, avoiding pellet disturbance. Exosomes were then precipitated by adding 0.5 volumes of the Total Exosome Isolation reagent to the cleared media, mixing thoroughly by vortexing, and incubating overnight at 2°C to 8°C. The mixture was then centrifuged at 10,000 × g for 1 hour at 4°C. The supernatant was discarded, and the exosome pellet was resuspended in 1X PBS to the desired volume. Isolated exosomes were stored at 2°C to 8°C for short-term use or at ≤ –20°C for long-term storage.
4.4. Neurogenic Differentiation Assay
For neurogenic differentiation, 4×10³ cells/cm² hDPSCs were seeded into a 12-well plate. The plate was maintained under standard conditions until cells reached 70-80% confluency. Media was removed from all the wells, and the neurogenic differentiation medium (MSC Differentiation Medium, PromoCell®) was allocated in 8 wells, while the remaining 2 wells were used as controls and maintained with the usual culture medium. Cells were maintained under differentiation for 4 days, and media were changed every 48 hours. A comprehensive explanation of neurogenic differentiation is detailed in Bruna et al. [2].
4.5. Scanning Electron Microscopy
Following the analysis of hDPSCs-CM and derived exosomes, a scanning electron microscopy analysis and energy-dispersive X-ray spectroscopy was conducted. This analysis used a high-resolution (Schottky) Environmental Scanning Electron Microscope equipped with X-ray Microanalysis and Electron backscattered diffraction (FEI Quanta 400 FEG ESEM/EDAX Genesis X4M). The microscope operated in high vacuum mode at an acceleration mode of 15 kV SEM. Reaxon® NGCs were cut transversely to fit the diameter of a well in a 24-well plate and then longitudinally. Each half-NGC was placed inside a well, and P4 hDPSCs were seeded at a density of 6000 cells/cm² with basal culture medium on the internal and external surface of the cut NGCs. The cells were cultured for 216 hours with medium changes every 2-3 days. The undifferentiated SEM was previously performed [2].
In this study, after this initial culture period, neurodifferentiation was induced within the NGC by replacing the culture medium with a neurogenic differentiation medium. This approach allowed assessment of whether hDPSCs could differentiate while maintaining adhesion to the NGC structure. Additionally, exosomes were directly seeded onto the Reaxon® scaffold and left at room temperature for one hour before undergoing the same fixation protocol as the neurodifferentiated cells. This distinct approach was necessary due to their higher sensitivity, allowing to assess their adhesion and morphological characteristics within the scaffold.
Following this process, both neurodifferentiated cells and exosomes underwent the same washing and fixation procedures. Wells were washed three times with 0.1 M HEPES buffer (Merck®, PHG0001). Cells on the NGCs’ inner surface were fixed with 2% buffered glutaraldehyde (Merck®, G7651) and left overnight in the refrigerator to ensure a slower process, while de exosomes only stayed one hour in this condition. Afterward, cells and exosomes were washed in three cycles of five minutes with 0.1 M HEPES buffer with gentle agitation. Samples were then dehydrated through a graded ethanol series (50%, 70%, 90%, 99%), with each concentration applied 2-3 times for 10-15 minutes. Finally, samples were infiltrated with a graded series of hexamethyldisilazane (HMDS) (Merck®, 440191) in ethanol for 15 minutes and incubated with HMDS alone for another 15 minutes. After removing HMDS, plates were left overnight in a laminar flow chamber for complete evaporation. Prior to SEM and EDS analysis, samples were coated with gold/palladium for 80 seconds using a 15mA current.
4.6. RT-PCR
To assess the expression of specific genes in hDPSCs, both in their undifferentiated state and after neurogenic differentiation, RT-PCR was performed. In addition, exosomes derived from hDPSCs evaluation was also assessed.
4.6.1. RNA Isolation and cDNA Synthesis from hDPSCs
RNA was extracted from hDPSCs at P4 in both undifferentiated conditions and following neurogenic differentiation, which was induced according to previously established protocols [2,123]. The isolation process was carried out using the Aurum™ Total RNA Mini Kit (Bio-Rad Laboratories®), following the manufacturer’s guidelines. Briefly, a pellet containing 2 × 10⁶ cells, both differentiated (after 72 hours of induction) and undifferentiated, was lysed using a lysis buffer. DNA contamination was eliminated using DNase I treatment, and the RNA was subsequently eluted in 80 μL of elution buffer. The purified RNA was stored at -80°C until further use.
Before proceeding with cDNA synthesis, RNA purity and concentration were evaluated using UV spectrophotometry. Absorbance ratios at A260/A280 (to assess protein contamination) and A260/A230 (to detect potential contamination with phenol, polysaccharides, or chaotropic salts) were measured using a NanoDrop™ One Microvolume UV-Vis Spectrophotometer (Thermo Scientific™). Acceptable purity values were considered within the range of 2.0–2.2 for A260/A280 and 1.8–2.2 for A260/A230 [8].
First-strand cDNA synthesis was performed using 4 μL of total RNA in a final reaction volume of 20 μL, following the instructions provided in the iScript™ cDNA Synthesis Kit (Bio-Rad Laboratories®). The reaction mixture was incubated in a thermal cycler (T100™ Thermal Cycler, Bio-Rad Laboratories®) under the time and temperature conditions specified by the manufacturer.
4.6.2. RNA Isolation and cDNA Synthesis from Exosomes Derived from hDPSCs
Total RNA was isolated from hDPSC-derived exosomes using the Total Exosome RNA and Protein Isolation Kit (Thermo Fisher Scientific, Cat# 4478545), following the manufacturer’s protocol. Briefly, samples were adjusted to a final volume of 200 μL with 1XPBS if necessary, followed by lysis and phase separation using Acid-Phenol:Chloroform. The aqueous phase was collected, and RNA was precipitated with ethanol before being passed through a filter cartridge via centrifugation. The retained RNA was washed with miRNA Wash Solution 1 and Wash Solution 2/3, followed by a final centrifugation step to remove residual contaminants. RNA was eluted in 50 μL of preheated (95°C) Elution Solution or nuclease-free water and stored at ≤ –20°C until further use.
Before proceeding with cDNA synthesis, RNA concentration and purity were assessed using UV spectrophotometry on a Nanodrop device (Implen GmbH, Isaza®, Munich, Germany). Purity was evaluated through the A260/A280 and A260/A230 absorbance ratios, which serve as indicators of protein contamination and the presence of polysaccharides, phenol, or chaotropic agents, respectively. Samples were considered acceptable if the A260/A280 ratio ranged between 2.0 and 2.2, and the A260/A230 ratio fell within 1.8 to 2.2.
First-strand cDNA synthesis was performed using the iScript™ cDNA Synthesis Kit (Bio-Rad Laboratories®) according to the manufacturer’s instructions, with 4 μL of total RNA in a final reaction volume of 20 μL. The reaction was carried out in a T100™ Thermal Cycler (Bio-Rad Laboratories®) under standard thermal conditions recommended by the manufacturer.
4.7. Quantitative RT-PCR Assay
The quantitative RT-PCR assay was performed using the CFX96 Touch™ Real-Time PCR Detection System (Bio-Rad Laboratories®) under standard reaction conditions. The amplification process was carried out with iTaq™ Universal SYBR Green Supermix (Bio-Rad Laboratories®), following the manufacturer’s protocol. A total of 22 genes related to neuroglial markers were analyzed, encompassing markers of both immature and mature neurons, as well as glial cells at various maturation stages.
Markers associated with glial cells included Aldh1l1, CD40, Cdh2, Cspg4, GAP43, GFAP, MPZ, NCAM, Nes, Ocln, Olig3, Sox10, and Sox2. Neuronal markers included Ascl1, Dcx, MAP2, NeuroD1, Rbfox3, Syn, Cdk5r1, Cript, Tubb3, and GAP43 (also classified as a glial marker). β-Actin was used as the reference housekeeping gene.
A 96-well PrimePCR Custom Plate (Bio-Rad Laboratories®) was prepared, containing predesigned primers for the selected 22 genes to enable their expression analysis. The plate was processed in a real-time PCR system, where two sets of primers were used to assess gene expression levels in both undifferentiated and differentiated P4 hDPSCs, as well as in exosomes derived from hDPSCs. The reaction mix targeting the 22 genes underwent temperature cycling according to the manufacturer’s specifications. Upon completion, gene expression levels were analyzed, including an evaluation of melting curves to verify product specificity.
Threshold cycle (Ct) values were interpreted as follows:
- -
- Ct < 29: Strong positive reaction, indicating a high abundance of the target nucleic acid.
- -
- 30 < Ct < 39: Moderate gene expression, with a detectable but lower quantity of the target nucleic acid.
- -
- Ct > 39: Weak signal, suggesting minimal target nucleic acid presence or possible environmental contamination.
To compare gene expression between the two groups, ΔCt values were calculated using the formula:
ΔCt = Ct(target gene) − Ct(housekeeping gene)
Fold changes between differentiated and undifferentiated cells were determined using the ΔΔCt method, where:
ΔΔCt = Ct(differentiated) − ΔCt(undifferentiated)
Relative quantification (RQ) of gene expression was calculated as:
RQ = 2−(ΔΔCt)
Genes were classified as downregulated when RQ values were < 0.5 and upregulated when RQ values were > 2.
4.8. Neurite Outgrowth Assay
Neurite outgrowth was assessed using the Neurite Outgrowth Assay Kit (NS220, Chemicon®), following the manufacturer’s protocol. hDPSCs were cultured in appropriate growth medium until reaching 70-80% confluence. Cells were then primed by replacing the culture medium with DMEM/F12 GlutaMAX Supplement (Gibco®) containing 1% FBS and 1% penicillin/streptomycin, followed by a 24-hour incubation to arrest proliferation.
For membrane preparation, Millicell inserts (1 µm pore size, included in the kit) were coated with Type I Collagen (10 µg/mL, Corning®) diluted in 1X PBS with Ca²⁺/Mg²⁺ (Gibco®). Inserts were incubated at 37°C for 2 hours before cell seeding. Control wells were coated with Bovine Serum Albumin (BSA, Gibco®) instead of collagen.
hDPSCs were detached using 0.05% trypsin-EDTA and resuspended in PromoCell® differentiation medium at a density of 1-2 × 10⁶ cells/mL. Inserts were transferred to wells containing 600 µL of differentiation medium, and 100 µL of the cell suspension was added on top of each insert. After 15 minutes at room temperature for uniform distribution, cultures were incubated at 37°C with 5% CO₂ for 48 hours to allow neurite extension.
To assess the effects of nocodazole, differentiation conditions included: control (BSA-coated wells), with differentiation without nocodazole; standard differentiation, with cells differentiated in PromoCell® medium without nocodazole; nocodazole 0h, with cells treated with 250 ng/mL nocodazole (Sigma-Aldrich®) from the beginning of differentiation; and nocodazole 24h, with cells differentiated for 24 hours followed by the addition of 250 ng/mL nocodazole for another 24 hours.
Neurite extensions were fixed in methanol (-20°C, 20 min) and stained using the Neurite Stain Solution (NS220, Chemicon®) for 15-30 minutes. After washing with PBS, cell bodies were removed using flattened cotton swabs. Stained neurites were extracted using Neurite Stain Extraction Buffer (NS220, Chemicon®), and absorbance was measured at 562 nm in a spectrophotometer for quantification.
4.9. Total Protein Quantification
Exosomal protein concentration was determined using the Pierce™ Dilution-Free™ Rapid Gold BCA Protein Assay (Thermo Fisher Scientific, Cat. No. A55860), following the manufacturer’s protocol. The working reagent was prepared by mixing Dilution-Free™ Rapid Gold BCA Reagent A with Reagent B in a 50:1 ratio. Then, 10 µL of each sample was added to a 96-well microplate in triplicate, followed by 200 µL of the WR. The plate was mixed thoroughly on a plate shaker for 30 seconds and incubated at room temperature for 5 minutes. In an alkaline environment, bicinchoninic acid (BCA) reacts with cuprous ions (Cu⁺), which are generated through the reduction of cupric ions (Cu²⁺) by peptide bonds in proteins [124]. This reaction leads to the formation of a stable, water-soluble complex with a characteristic purple coloration, which can be quantified spectrophotometrically. Absorbance was measured at 450 nm using a microplate reader, with a secondary measurement at 570 nm for background correction.
A standard curve was generated using the BSA standards, and the protein concentrations of the exosomal samples and CM of differentiated and undifferentiated from hDPSCs were calculated based on the average absorbance of the triplicates.
4.10. Statistical Analysis
Statistical analysis was carried out using GraphPad Prism version 6.00 for Mac OS x (GraphPad Software, La Jolla, California, USA). Data were expressed as mean ± SEM when appropriate. Group comparisons were conducted using parametric tests. A value of P < 0.05 is considered statistically significant. Significance of the results is showed according to P values by the symbol (∗), (∗) corresponding to 0.01 ≤P <0.05, (∗∗) to 0.001 ≤ P < 0.01, (∗∗∗) to 0.0001 ≤ P < 0.001 and (∗∗∗∗) to P < 0.0001.
5. Conclusions
This study demonstrates that neurogenic differentiation, passage number, and CM concentration critically influence the secretory and vesicular profiles of hDPSCs. Early-passage, neurodifferentiated hDPSCs produce CM and exosomes enriched in regenerative and immunomodulatory factors, supporting key processes such as angiogenesis, neuroprotection, and immune regulation. Although replicative aging alters this profile, certain functional components are selectively maintained, indicating a dynamic but partially conserved paracrine capacity.
Importantly, the isolation and characterization of hDPSC-derived exosomes confirmed their structural integrity, typical size distribution, and biochemical identity, as well as their compatibility with a nerve guidance conduit. These findings validate not only the feasibility of harvesting exosomes from this cell source but also their potential role as stable, cell-free effectors of regeneration.
Collectively, the findings support the application of hDPSC-derived products as a promising strategy for peripheral nerve repair. Their ability to interact effectively with NGCs such as Reaxon® further reinforces their translational value and highlights optimal production conditions for future clinical applications.
The identification of these optimal conditions is particularly relevant for in vivo studies and for the development of commercially viable therapeutic products, since each of these factors directly influences the quality of nerve regeneration and the final clinical outcomes.
Author Contributions
Bruna Lopes: Writing – original draft, Visualization, Software, Methodology, Investigation, Formal analysis, Data curation, Conceptualization. Rui Alvites: Writing – review & editing, Supervision, Software, Methodology, Investigation, Formal analysis, Conceptualization. Alexandra Rêma - Visualization, Methodology, Investigation. Ana Catarina Sousa: Visualization, Methodology, Investigation, Formal analysis. Patrícia Sousa: Visualization, Methodology, Investigation, Formal analysis. Alícia Moreira: Visualization, Methodology, Investigation, Formal analysis. Luís Atayde: Writing – review & editing, Supervision, Methodology, Investigation. António Salgado: Writing – review & editing, Validation, Supervision, Formal analysis. Stefano Geuna: Writing – review & editing, Validation, Supervision. Ana Colette Maurício: Writing – review & editing, Validation, Supervision, Resources, Project administration, Methodology, Investigation, Funding acquisition, Formal analysis, Data curation, Conceptualization.
Funding
The authors acknowledge FCT for funding the PhD Scholarships: Patrícia Sousa (2023.00246.BD), Alícia Moreira (2023.00544.BD), Bruna Lopes (2021.05265.BD). The authors would like to thank the project “TERM RES Hub – Scientific Infrastructure for Tissue Engineering and Regenerative Medicine”, reference PINFRA/22190/2016 (Norte-01-0145-FEDER-022190), funded by the Portuguese National Science Foundation (FCT) in cooperation with the Northern Portugal Regional Coordination and Development Commission (CCDR-N), for providing relevant lab facilities, state-of-the art equipment and highly qualified human resources. Additionally, the authors would like to acknowledge H2Cure Project (POCI-01-0247-FEDER-047032) and the individual grants UMINHO/BIPD/2021/18 (CC) and 2020.01541.CEECIND (LdS). The author Rui D. Alvites acknowledges the Centro de Estudos de Ciência Animal (CECA), Instituto de Ciências, Tecnologias e Agroambiente (ICETA), Porto University (UP), and Fundação para a Ciência e Tecnologia (FCT) for the funding and availability of all technical, structural, and human resources necessary for the development of this work. The work was supported through the project POCI-01-0247-FEDER-047032 and OLFABIONERVE [2022. 04501.PTDC] funded by FCT/MCTES through national funds.
Institutional Review Board Statement
Not applicable.
Informed Consent Statement
Not applicable.
Data Availability Statement
The data that support the findings of this study are available from the corresponding author on request.
Acknowledgments
The author, Bruna Lopes, acknowledges the Centro de Estudos de Ciência Animal (CECA), Instituto de Ciências, Tecnologias e Agroambiente (ICETA), Porto University (UP), and Fundação para a Ciência e Tecnologia (FCT) for the funding and availability of all technical, structural, and human resources necessary for the development of this work.
Conflicts of Interest
The authors declare no conflicts of interest.
Abbreviations
The following abbreviations are used in this manuscript:
| CM | Conditioned Medium |
| EDS | Energy Dispersive X-ray spectroscopy |
| EVs | Extracellular vesicles |
| hDPSCs | Human Dental Pulp Stem Cells |
| hDPSCs-CM | Human Dental Pulp Stem Cells Conditioned Medium |
| ISEV | International Society for Extracellular Vesicles |
| MSCs | Mesenchymal Stem Cells |
| NGC | Nerve Guide Conduit |
| PNIs | Peripheral Nerve Injuries |
| RT-PCR | Reverse Transcriptase Polymerase Chain Reaction |
| SEM | Scanning Eletron Microscopy |
References
- Lopes, B., et al., Peripheral Nerve Injury Treatments and Advances: One Health Perspective. Int J Mol Sci, 2022. 23(2).
- Lopes, B., et al., In vitro evaluation of dental pulp stem cells for sciatic nerve regeneration: foundations for future in vivo applications. Front Cell Dev Biol, 2025. 13: p. 1528213.
- Alvites, R., et al., Peripheral nerve injury and axonotmesis: State of the art and recent advances. Cogent Medicine, 2018. 5(1).
- Xu, G., et al., Advancements in autologous peripheral nerve transplantation care: a review of strategies and practices to facilitate recovery. Front Neurol, 2024. 15: p. 1330224.
- Zhu, J., et al., Advances in Peripheral Nerve Injury Repair with the Application of Nanomaterials. Journal of Nanomaterials, 2022. 2022: p. 1-22.
- Alvites, R.D., et al., Effects of Olfactory Mucosa Stem/Stromal Cell and Olfactory Ensheating Cells Secretome on Peripheral Nerve Regeneration. Biomolecules, 2022. 12(6).
- Shen, X., et al., Repairing sciatic nerve injury with self-assembling peptide nanofiber scaffold-containing chitosan conduit. Front Neurol, 2022. 13: p. 867711.
- Alvites, R.D., et al., Combined Use of Chitosan and Olfactory Mucosa Mesenchymal Stem/Stromal Cells to Promote Peripheral Nerve Regeneration In Vivo. Stem Cells Int, 2021. 2021: p. 6613029.
- Sousa, A.C., et al., Hybrid scaffolds for bone tissue engineering: Integration of composites and bioactive hydrogels loaded with hDPSCs. Biomater Adv, 2024. 166: p. 214042.
- Lopes, B., et al., Animal models in peripheral nerve transection studies: a systematic review on study design and outcomes assessment. Regen Med, 2023.
- Stocco, E., et al., Bridging Gaps in Peripheral Nerves: From Current Strategies to Future Perspectives in Conduit Design. Int J Mol Sci, 2023. 24(11).
- Redolfi Riva, E., et al., Beyond the limiting gap length: peripheral nerve regeneration through implantable nerve guidance conduits. Biomaterials Science, 2024. 12(6): p. 1371-1404.
- Smolinska, V., M. Bohac, and L. Danisovic, Current status of the applications of conditioned media derived from mesenchymal stem cells for regenerative medicine. Physiol Res, 2023. 72(S3): p. S233-S245.
- Stefanska, K., et al., Dental pulp stem cells - A basic research and future application in regenerative medicine. Biomed Pharmacother, 2024. 178: p. 116990.
- Fujii, Y., et al., Application of Dental Pulp Stem Cells for Bone and Neural Tissue Regeneration in Oral and Maxillofacial Region. Stem Cells Int, 2023. 2023: p. 2026572.
- Mattei, V. and S. Delle Monache, Dental Pulp Stem Cells (DPSCs) and Tissue Regeneration: Mechanisms Mediated by Direct, Paracrine, or Autocrine Effects. Biomedicines, 2023. 11(2).
- Tsuruta, T., et al., Dental pulp-derived stem cell conditioned medium to regenerate peripheral nerves in a novel animal model of dysphagia. PLoS One, 2018. 13(12): p. e0208938.
- Wang, W., et al., Prospective applications of extracellular vesicle-based therapies in regenerative medicine: implications for the use of dental stem cell-derived extracellular vesicles. Front Bioeng Biotechnol, 2023. 11: p. 1278124.
- Alvites, R., et al., Mesenchymal Stem/Stromal Cells and Their Paracrine Activity-Immunomodulation Mechanisms and How to Influence the Therapeutic Potential. Pharmaceutics, 2022. 14(2).
- Sagaradze, G., et al., Conditioned Medium from Human Mesenchymal Stromal Cells: Towards the Clinical Translation. Int J Mol Sci, 2019. 20(7).
- Ledesma-Martinez, E., V.M. Mendoza-Nunez, and E. Santiago-Osorio, Mesenchymal Stem Cells Derived from Dental Pulp: A Review. Stem Cells Int, 2016. 2016: p. 4709572.
- Gwam, C., N. Mohammed, and X. Ma, Stem cell secretome, regeneration, and clinical translation: a narrative review. Ann Transl Med, 2021. 9(1): p. 70.
- Bar, J.K., A. Lis-Nawara, and P.G. Grelewski, Dental Pulp Stem Cell-Derived Secretome and Its Regenerative Potential. Int J Mol Sci, 2021. 22(21).
- Younes, R., et al., The Secretome of Human Dental Pulp Stem Cells and Its Components GDF15 and HB-EGF Protect Amyotrophic Lateral Sclerosis Motoneurons against Death. Biomedicines, 2023. 11(8).
- Mohd Nor, N.H., et al., From Teeth to Therapy: A Review of Therapeutic Potential within the Secretome of Stem Cells from Human Exfoliated Deciduous Teeth. Int J Mol Sci, 2023. 24(14).
- Liu, Y., et al., Application of dental pulp stem cells for bone regeneration. Front Med (Lausanne), 2024. 11: p. 1339573.
- Valadi, H., et al., Exosome-mediated transfer of mRNAs and microRNAs is a novel mechanism of genetic exchange between cells. Nat Cell Biol, 2007. 9(6): p. 654-9.
- Vilaca-Faria, H., A.J. Salgado, and F.G. Teixeira, Mesenchymal Stem Cells-derived Exosomes: A New Possible Therapeutic Strategy for Parkinson’s Disease? Cells, 2019. 8(2).
- Odehnalova, N., et al., The potential of exosomes in regenerative medicine and in the diagnosis and therapies of neurodegenerative diseases and cancer. Front Med (Lausanne), 2025. 12: p. 1539714.
- Chansaenroj, J., et al., Potential of Dental Pulp Stem Cell Exosomes: Unveiling miRNA-Driven Regenerative Mechanisms. Int Dent J, 2025. 75(2): p. 415-425.
- Shafiei, M., et al., A Comprehensive Review on the Applications of Exosomes and Liposomes in Regenerative Medicine and Tissue Engineering. Polymers (Basel), 2021. 13(15).
- Gugliandolo, A. and E. Mazzon, Dental Mesenchymal Stem Cell Secretome: An Intriguing Approach for Neuroprotection and Neuroregeneration. Int J Mol Sci, 2021. 23(1).
- Lotvall, J., et al., Minimal experimental requirements for definition of extracellular vesicles and their functions: a position statement from the International Society for Extracellular Vesicles. J Extracell Vesicles, 2014. 3: p. 26913.
- Dilsiz, N., A comprehensive review on recent advances in exosome isolation and characterization: Toward clinical applications. Transl Oncol, 2024. 50: p. 102121.
- Li, Q., et al., Therapeutic Potential of Mesenchymal Stem Cell-Derived Exosomes as Nanomedicine for Peripheral Nerve Injury. Int J Mol Sci, 2024. 25(14).
- Lai, J.J., et al., Exosome Processing and Characterization Approaches for Research and Technology Development. Adv Sci (Weinh), 2022. 9(15): p. e2103222.
- Zhang, S., et al., MSC exosomes alleviate temporomandibular joint osteoarthritis by attenuating inflammation and restoring matrix homeostasis. Biomaterials, 2019. 200: p. 35-47.
- Wei, H., et al., Mesenchymal stem cell-derived exosomal miR-223 regulates neuronal cell apoptosis. Cell Death Dis, 2020. 11(4): p. 290.
- Chai, Y., et al., Study on the Role and Mechanism of Exosomes Derived from Dental Pulp Stem Cells in Promoting Regeneration of Myelin Sheath in Rats with Sciatic Nerve Injury. Mol Neurobiol, 2024. 61(9): p. 6175-6188.
- Yavuz, B., et al., Applications of Stem Cell-Derived Extracellular Vesicles in Nerve Regeneration. Int J Mol Sci, 2024. 25(11).
- Namini, M.S., et al., Cell-free therapy based on extracellular vesicles: a promising therapeutic strategy for peripheral nerve injury. Stem Cell Res Ther, 2023. 14(1): p. 254.
- Ezdakova, M.I. and E.R. Andreeva, Impaired Communication through Gap Junctions Reduces the Angiogenic Potential of the Secretome in Mesenchymal Stromal Cell—Endothelial Cell Interactions In Vitro. Bulletin of Experimental Biology and Medicine, 2024. 178(1): p. 139-144.
- Liu, J., et al., Senescence in Mesenchymal Stem Cells: Functional Alterations, Molecular Mechanisms, and Rejuvenation Strategies. Front Cell Dev Biol, 2020. 8: p. 258.
- Liu, Y., et al., Application of dental pulp stem cell-conditioned medium combined with deep cryopreservation of autologous cranial flaps. Stem Cell Res Ther, 2025. 16(1): p. 272.
- Harrell, C.R., et al., Therapeutic Use of Mesenchymal Stem Cell-Derived Exosomes: From Basic Science to Clinics. Pharmaceutics, 2020. 12(5).
- Rastogi, S., et al., The Evolving Landscape of Exosomes in Neurodegenerative Diseases: Exosomes Characteristics and a Promising Role in Early Diagnosis. Int J Mol Sci, 2021. 22(1).
- Chen, G.Y., et al., Effects of exosomes from human dental pulp stem cells on the biological behavior of human fibroblasts. Sci Rep, 2025. 15(1): p. 1134.
- Wu, S.H., et al., Adipose-Derived Mesenchymal Stem Cells From a Hypoxic Culture Improve Neuronal Differentiation and Nerve Repair. Front Cell Dev Biol, 2021. 9: p. 658099.
- Caseiro, A.R., et al., Mesenchymal Stem/ Stromal Cells metabolomic and bioactive factors profiles: A comparative analysis on the umbilical cord and dental pulp derived Stem/ Stromal Cells secretome. PLoS One, 2019. 14(11): p. e0221378.
- Gao, J., et al., Dental pulp stem cells conditioned medium-functionalized microspheres for endodontic regeneration. Frontiers in Cell and Developmental Biology, 2025. 13.
- Gharaei, M.A., et al., Human dental pulp stromal cell conditioned medium alters endothelial cell behavior. Stem Cell Res Ther, 2018. 9(1): p. 69.
- El Moshy, S., et al., Dental Stem Cell-Derived Secretome/Conditioned Medium: The Future for Regenerative Therapeutic Applications. Stem Cells Int, 2020. 2020: p. 7593402.
- Maccaferri, M., et al., Human dental pulp stem cells modulate pro-inflammatory macrophages both through cell-to-cell contact and paracrine signaling. Front Immunol, 2024. 15: p. 1440974.
- Barone, L., et al., Dental pulp mesenchymal stem cell (DPSCs)-derived soluble factors, produced under hypoxic conditions, support angiogenesis via endothelial cell activation and generation of M2-like macrophages. J Biomed Sci, 2024. 31(1): p. 99.
- Li, P., et al., Immunomodulatory properties of mesenchymal stem cells/dental stem cells and their therapeutic applications. Cell Mol Immunol, 2023. 20(6): p. 558-569.
- Alraies, A., et al., Variation in human dental pulp stem cell ageing profiles reflect contrasting proliferative and regenerative capabilities. BMC Cell Biol, 2017. 18(1): p. 12.
- Saito, Y., S. Yamamoto, and T.S. Chikenji, Role of cellular senescence in inflammation and regeneration. Inflamm Regen, 2024. 44(1): p. 28.
- Lin, C.Y., et al., The Exosomes of Stem Cells from Human Exfoliated Deciduous Teeth Suppress Inflammation in Osteoarthritis. Int J Mol Sci, 2024. 25(16).
- Hua, S., et al., Periodontal and Dental Pulp Cell-Derived Small Extracellular Vesicles: A Review of the Current Status. Nanomaterials (Basel), 2021. 11(7).
- Mai, Z., et al., Translational and Clinical Applications of Dental Stem Cell-Derived Exosomes. Front Genet, 2021. 12: p. 750990.
- Arimura, Y., et al., Peripheral-neuron-like properties of differentiated human dental pulp stem cells (hDPSCs). PLOS ONE, 2021. 16(5): p. e0251356.
- Sousa, A.C., et al., Assessment of 3D-Printed Polycaprolactone, Hydroxyapatite Nanoparticles and Diacrylate Poly(ethylene glycol) Scaffolds for Bone Regeneration. Pharmaceutics, 2022. 14(12).
- Brunello, G., et al., Exosomes Derived from Dental Pulp Stem Cells Show Different Angiogenic and Osteogenic Properties in Relation to the Age of the Donor. Pharmaceutics, 2022. 14(5).
- Harley-Troxell, M.E., et al., Interactions of Cells and Biomaterials for Nerve Tissue Engineering: Polymers and Fabrication. Polymers (Basel), 2023. 15(18).
- Pardo-Rodriguez, B., et al., Functional differentiation of human dental pulp stem cells into neuron-like cells exhibiting electrophysiological activity. Stem Cell Res Ther, 2025. 16(1): p. 10.
- Gao, Y., et al., Neuronal Cell Differentiation of Human Dental Pulp Stem Cells on Synthetic Polymeric Surfaces Coated With ECM Proteins. Front Cell Dev Biol, 2022. 10: p. 893241.
- Seonwoo, H., et al., Neurogenic Differentiation of Human Dental Pulp Stem Cells on Graphene-Polycaprolactone Hybrid Nanofibers. Nanomaterials (Basel), 2018. 8(7).
- Ellis, P., et al., SOX2, a persistent marker for multipotential neural stem cells derived from embryonic stem cells, the embryo or the adult. Dev Neurosci, 2004. 26(2-4): p. 148-65.
- Suzuki, S., et al., The neural stem/progenitor cell marker nestin is expressed in proliferative endothelial cells, but not in mature vasculature. J Histochem Cytochem, 2010. 58(8): p. 721-30.
- Vainorius, G., et al., Ascl1 and Ngn2 convert mouse embryonic stem cells to neurons via functionally distinct paths. Nat Commun, 2023. 14(1): p. 5341.
- Alimperti, S. and S.T. Andreadis, CDH2 and CDH11 act as regulators of stem cell fate decisions. Stem Cell Res, 2015. 14(3): p. 270-82.
- Al-Maswary, A.A., et al., Exploring the neurogenic differentiation of human dental pulp stem cells. PLOS ONE, 2022. 17(11): p. e0277134.
- Luzuriaga, J., et al., Advances and Perspectives in Dental Pulp Stem Cell Based Neuroregeneration Therapies. Int J Mol Sci, 2021. 22(7).
- Geuna, S., et al., In vitro models for peripheral nerve regeneration. European Journal of Neuroscience, 2016. 43(3): p. 287-296.
- Li, D., et al., Human Dental Pulp Stem Cells and Gingival Mesenchymal Stem Cells Display Action Potential Capacity In Vitro after Neuronogenic Differentiation. Stem Cell Reviews and Reports, 2019. 15(1): p. 67-81.
- Kucharova, K. and W.B. Stallcup, The NG2 proteoglycan promotes oligodendrocyte progenitor proliferation and developmental myelination. Neuroscience, 2010. 166(1): p. 185-94.
- Fujiwara, S., et al., SOX10 transactivates S100B to suppress Schwann cell proliferation and to promote myelination. PLoS One, 2014. 9(12): p. e115400.
- Pummi, K.P., et al., Tight junction proteins ZO-1, occludin, and claudins in developing and adult human perineurium. J Histochem Cytochem, 2004. 52(8): p. 1037-46.
- Latremoliere, A., et al., Neuronal-Specific TUBB3 Is Not Required for Normal Neuronal Function but Is Essential for Timely Axon Regeneration. Cell Rep, 2018. 24(7): p. 1865-1879 e9.
- Gusel’nikova, V.V. and D.E. Korzhevskiy, NeuN As a Neuronal Nuclear Antigen and Neuron Differentiation Marker. Acta Naturae, 2015. 7(2): p. 42-7.
- LeBlanc, S.E., et al., Direct regulation of myelin protein zero expression by the Egr2 transactivator. J Biol Chem, 2006. 281(9): p. 5453-60.
- Delle Monache, S., et al., Hypoxia Induces DPSC Differentiation versus a Neurogenic Phenotype by the Paracrine Mechanism. Biomedicines, 2022. 10(5).
- Holahan, M.R., A Shift from a Pivotal to Supporting Role for the Growth-Associated Protein (GAP-43) in the Coordination of Axonal Structural and Functional Plasticity. Front Cell Neurosci, 2017. 11: p. 266.
- Grasselli, G. and P. Strata, Structural plasticity of climbing fibers and the growth-associated protein GAP-43. Front Neural Circuits, 2013. 7: p. 25.
- Libberecht, K., et al., The Influence of Lysosomal Stress on Dental Pulp Stem Cell-Derived Schwann Cells. Biomolecules, 2024. 14(4).
- Candelise, N., et al., The Importance of Stem Cells Isolated from Human Dental Pulp and Exfoliated Deciduous Teeth as Therapeutic Approach in Nervous System Pathologies. Cells, 2023. 12(13).
- Bassett, C., et al., Differential Expression of MicroRNA (MiR-27, MiR-145) among Dental Pulp Stem Cells (DPSCs) Following Neurogenic Differentiation Stimuli. Biomedicines, 2023. 11(11).
- Radwitz, J., et al., Tubb3 expression levels are sensitive to neuronal activity changes and determine microtubule growth and kinesin-mediated transport. Cell Mol Life Sci, 2022. 79(11): p. 575.
- Jurga, A.M., et al., Beyond the GFAP-Astrocyte Protein Markers in the Brain. Biomolecules, 2021. 11(9).
- Konnova, E.A., et al., Characterisation of GFAP-Expressing Glial Cells in the Dorsal Root Ganglion after Spared Nerve Injury. Int J Mol Sci, 2023. 24(21).
- Mester, T., et al., CD40 Expression in Fibrocytes Is Induced by TSH: Potential Synergistic Immune Activation. PLoS One, 2016. 11(9): p. e0162994.
- Xia, L., et al., CDK5R1 promotes Schwann cell proliferation, migration, and production of neurotrophic factors via CDK5/BDNF/TrkB after sciatic nerve injury. Neuroscience Letters, 2023. 817: p. 137514.
- Ao, C., et al., The role of Cdk5 in neurological disorders. Front Cell Neurosci, 2022. 16: p. 951202.
- Sugimori, M., et al., Ascl1 is required for oligodendrocyte development in the spinal cord. Development, 2008. 135(7): p. 1271-81.
- Carney, T.J., et al., A direct role for Sox10 in specification of neural crest-derived sensory neurons. Development, 2006. 133(23): p. 4619-30.
- Tordoff, E., et al., A novel multiplexed immunoassay for surface-exposed proteins in plasma extracellular vesicles. J Extracell Vesicles, 2024. 13(11): p. e70007.
- Ahmad, P., et al., Isolation methods of exosomes derived from dental stem cells. Int J Oral Sci, 2025. 17(1): p. 50.
- Tang, Y., Y. Zhou, and H.J. Li, Advances in mesenchymal stem cell exosomes: a review. Stem Cell Res Ther, 2021. 12(1): p. 71.
- O’Connor, C., et al., Neurotrophic extracellular matrix proteins promote neuronal and iPSC astrocyte progenitor cell- and nano-scale process extension for neural repair applications. J Anat, 2025. 246(4): p. 585-601.
- Deng, L.X., et al., Laminin-coated multifilament entubulation, combined with Schwann cells and glial cell line-derived neurotrophic factor, promotes unidirectional axonal regeneration in a rat model of thoracic spinal cord hemisection. Neural Regen Res, 2021. 16(1): p. 186-191.
- Speer, J., et al., Integrin-mediated interactions with a laminin-presenting substrate modulate biosynthesis and phenotypic expression for cells of the human nucleus pulposus. Eur Cell Mater, 2021. 41: p. 793-810.
- Arimori, T., et al., Structural mechanism of laminin recognition by integrin. Nat Commun, 2021. 12(1): p. 4012.
- Nolan, A.M., et al., The neurite growth inhibitory effects of soluble TNFα on developing sympathetic neurons are dependent on developmental age. Differentiation, 2014. 88(4): p. 124-130.
- Popova, D. and S.O.P. Jacobsson, A fluorescence microplate screen assay for the detection of neurite outgrowth and neurotoxicity using an antibody against βIII-tubulin. Toxicology in Vitro, 2014. 28(3): p. 411-418.
- Sierra-Fonseca, J.A., et al., Nerve growth factor induces neurite outgrowth of PC12 cells by promoting Gbetagamma-microtubule interaction. BMC Neurosci, 2014. 15: p. 132.
- Gagnon, J., V. Caron, and A. Tremblay, SUMOylation of nuclear receptor Nor1/NR4A3 coordinates microtubule cytoskeletal dynamics and stability in neuronal cells. Cell Biosci, 2024. 14(1): p. 91.
- DeVault, L., et al., The response of Dual-leucine zipper kinase (DLK) to nocodazole: Evidence for a homeostatic cytoskeletal repair mechanism. PLOS ONE, 2024. 19(4): p. e0300539.
- Plessis-Belair, J., et al., Nuclear Import Defects Drive Cell Cycle Dysregulation in Neurodegeneration. Aging Cell, 2025: p. e70091.
- Verkest, C., et al., Intrinsically disordered intracellular domains control key features of the mechanically-gated ion channel PIEZO2. Nat Commun, 2022. 13(1): p. 1365.
- Borghi, R., et al., Altered cytoskeleton dynamics in patient-derived iPSC-based model of PCDH19 clustering epilepsy. Front Cell Dev Biol, 2024. 12: p. 1518533.
- Lasser, M., J. Tiber, and L.A. Lowery, The Role of the Microtubule Cytoskeleton in Neurodevelopmental Disorders. Front Cell Neurosci, 2018. 12: p. 165.
- Sanchez-Huertas, C. and E. Herrera, With the Permission of Microtubules: An Updated Overview on Microtubule Function During Axon Pathfinding. Front Mol Neurosci, 2021. 14: p. 759404.
- Verstraelen, P., et al., Dysregulation of Microtubule Stability Impairs Morphofunctional Connectivity in Primary Neuronal Networks. Front Cell Neurosci, 2017. 11: p. 173.
- Sferra, A., F. Nicita, and E. Bertini, Microtubule Dysfunction: A Common Feature of Neurodegenerative Diseases. Int J Mol Sci, 2020. 21(19).
- Harvey, A., et al., Proteomic analysis of the extracellular matrix produced by mesenchymal stromal cells: implications for cell therapy mechanism. PLoS One, 2013. 8(11): p. e79283.
- Abd-elwahab, S.A.-e., et al., Mesenchymal-Stem Cell-Derived Conditioned Media Versus Exosomes in the Treatment of Rat Model of Polycystic Ovary: An Attempt to Understand the Underlying Mechanisms (Biochemical and Histological Study). Microscopy and Microanalysis, 2023. 29(3): p. 1244-1257.
- Novais, A., et al., Priming Dental Pulp Stem Cells from Human Exfoliated Deciduous Teeth with Fibroblast Growth Factor-2 Enhances Mineralization Within Tissue-Engineered Constructs Implanted in Craniofacial Bone Defects. Stem Cells Transl Med, 2019. 8(8): p. 844-857.
- Zhou, T., et al., Conditioned medium derived from 3D tooth germs: A novel cocktail for stem cell priming and early in vivo pulp regeneration. Cell Prolif, 2021. 54(11): p. e13129.
- Sousa, A.C., et al., Production, Characterisation, and In Vitro Evaluation of 3D Printed PCL/HANp/PEGDA Scaffold for Bone Regeneration, in Materiais 2022. 2022.
- Caseiro, A.R., et al., Human umbilical cord blood plasma as an alternative to animal sera for mesenchymal stromal cells in vitro expansion - A multicomponent metabolomic analysis. PLoS One, 2018. 13(10): p. e0203936.
- Machado, A., et al., Dextrin hydrogel loaded with a macroporous Bonelike® scaffold and dental pulp stem cells for critical-sized defect repair. Materialia, 2023. 30.
- Sousa, P., et al., Rat Hair Follicle Stem Cell-Derived Exosomes: Isolation, Characterization and Comparative Analysis of Their In Vitro Wound Healing Potential. Int J Mol Sci, 2025. 26(11).
- Alvites, R.D., et al., Rat Olfactory Mucosa Mesenchymal Stem/Stromal Cells (OM-MSCs): A Characterization Study. International Journal of Cell Biology, 2020. 2020: p. 1-21.
- Clerici, M., et al., Pitfalls of Accurate Protein Determination inside PLGA Nanoparticles Using the Micro BCA Assay, in The 1st International Electronic Conference on Pharmaceutics. 2020.
Figure 1.
(a–e) Concentration of each biomolecule present in the CM-hDPSCs under different experimental conditions (mean ± SEM). (f–g) Concentration of each biomolecule present in exosomes derived from hDPSCs (mean ± SEM). The significance of the results is indicated by symbols (∗), with (∗) corresponding to 0.01 ≤ P < 0.05 and (∗∗) to 0.001 ≤ P < 0.01.
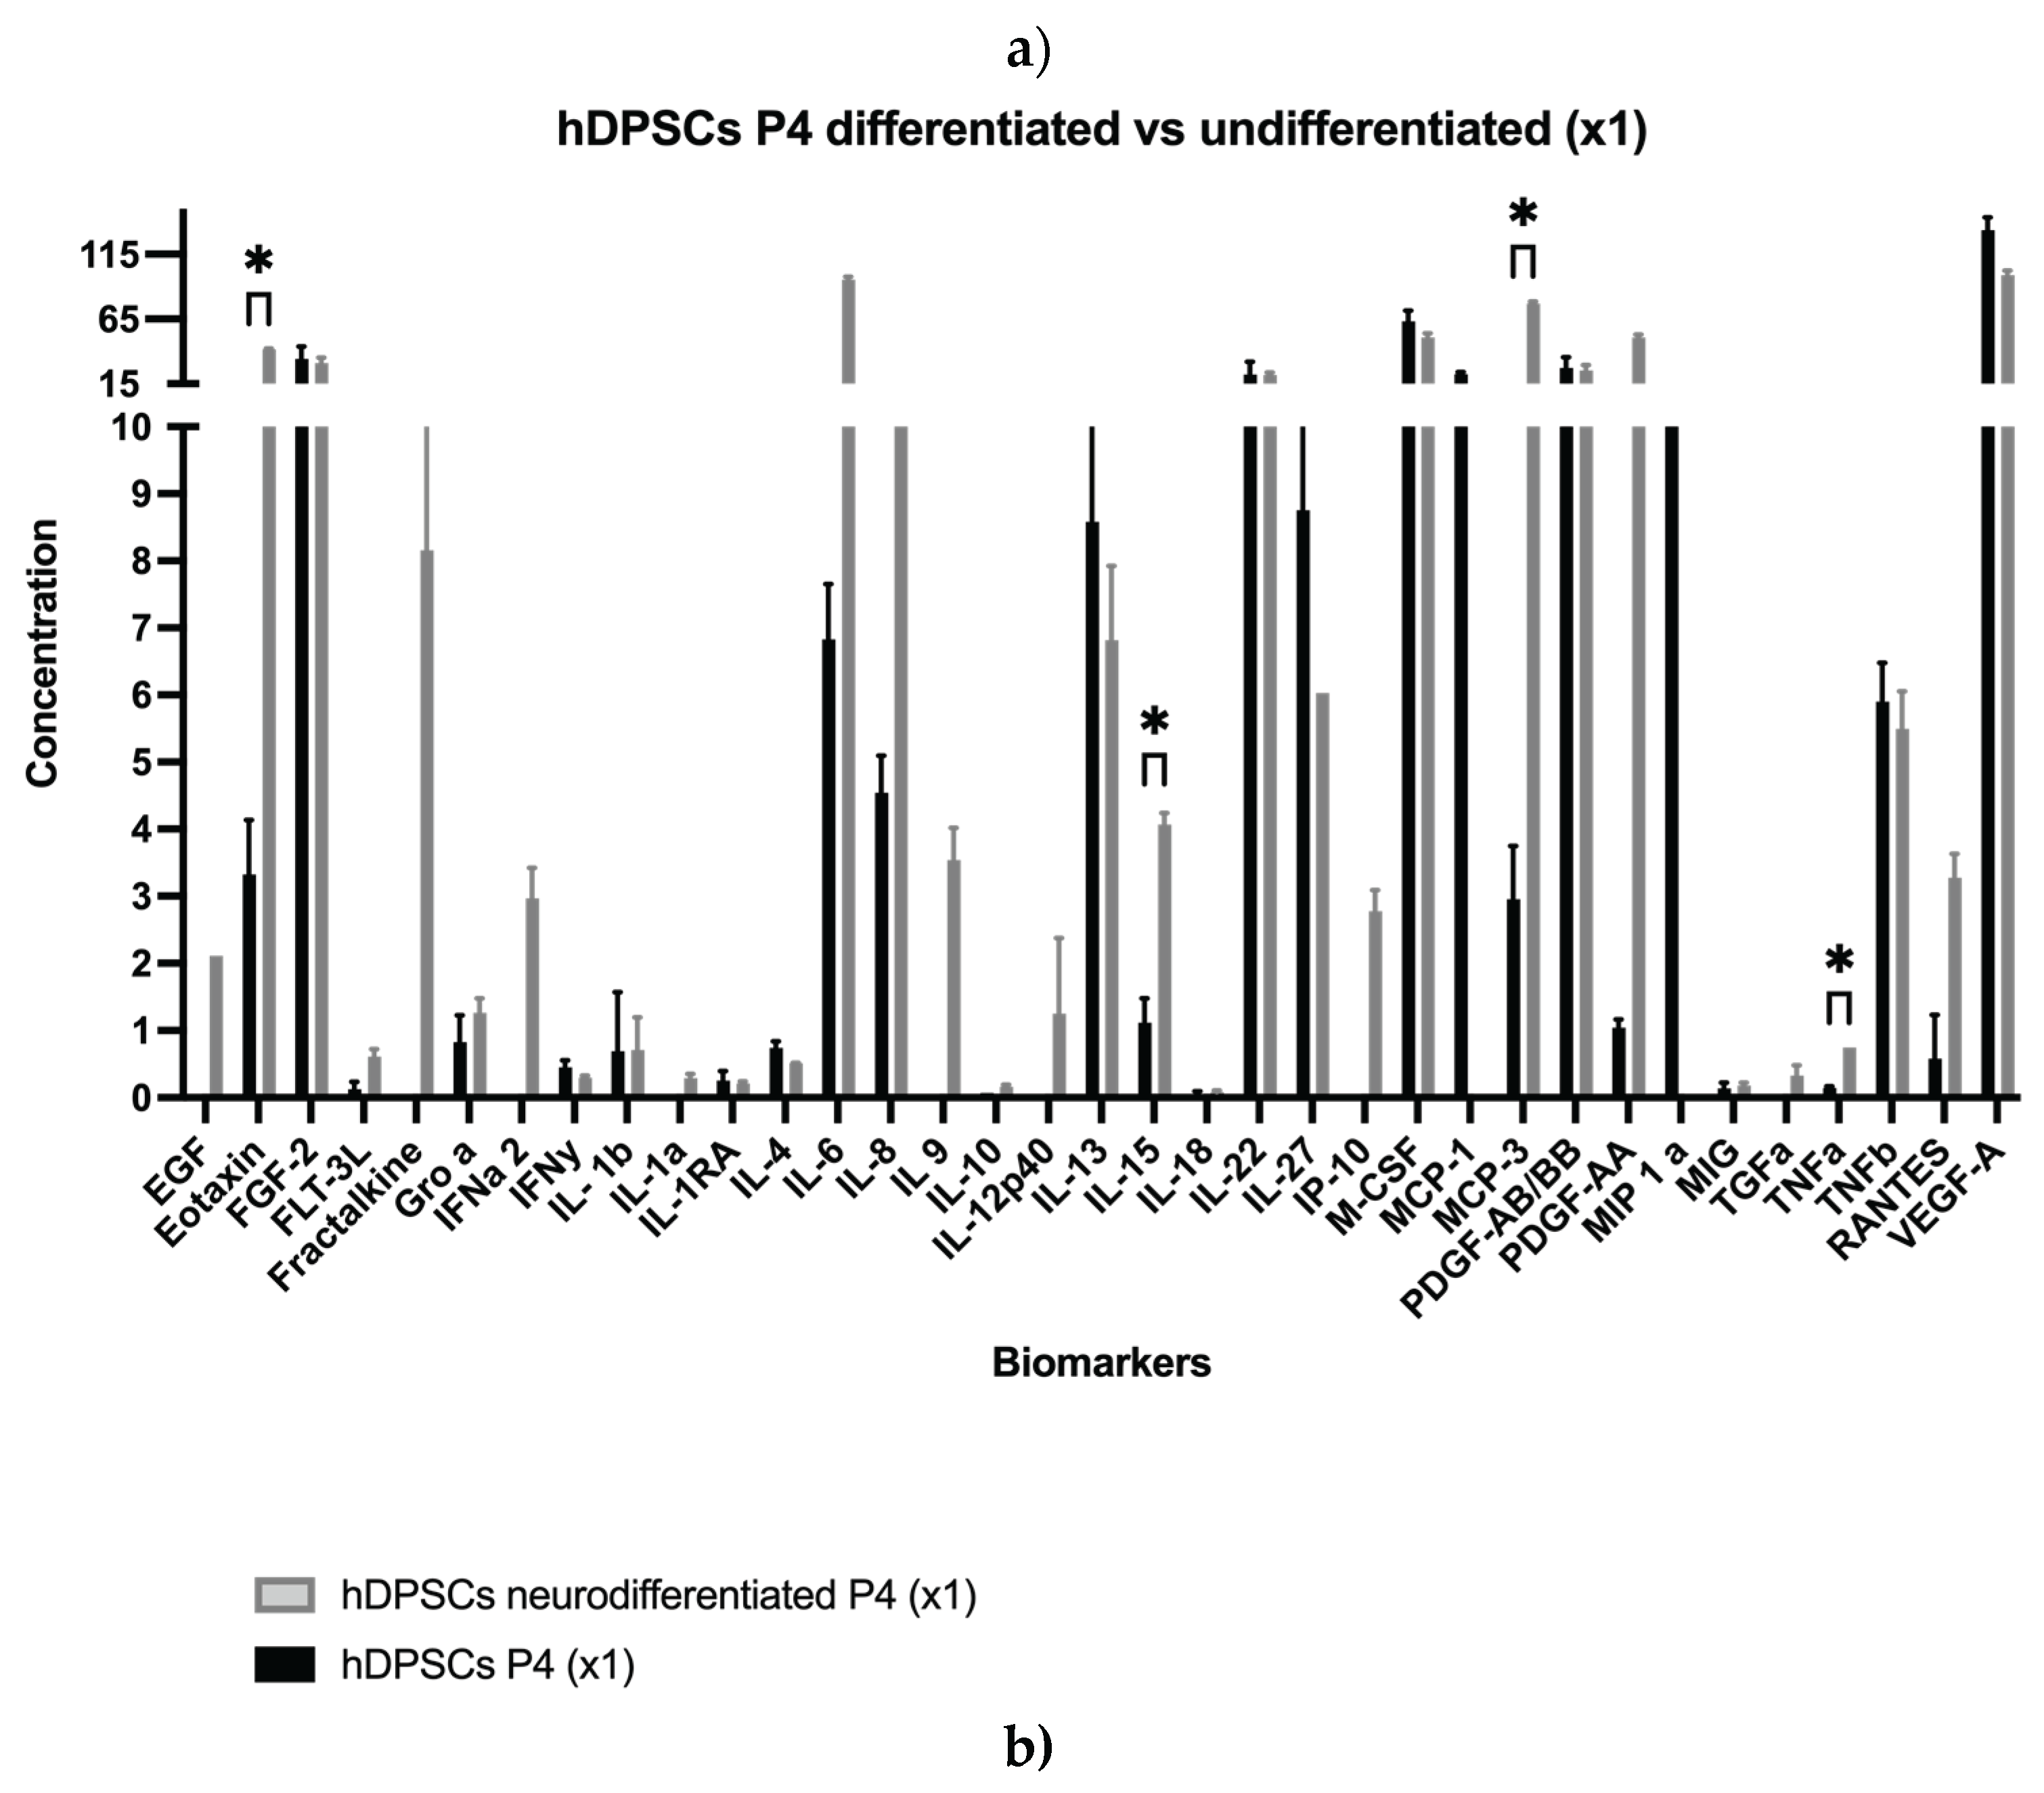
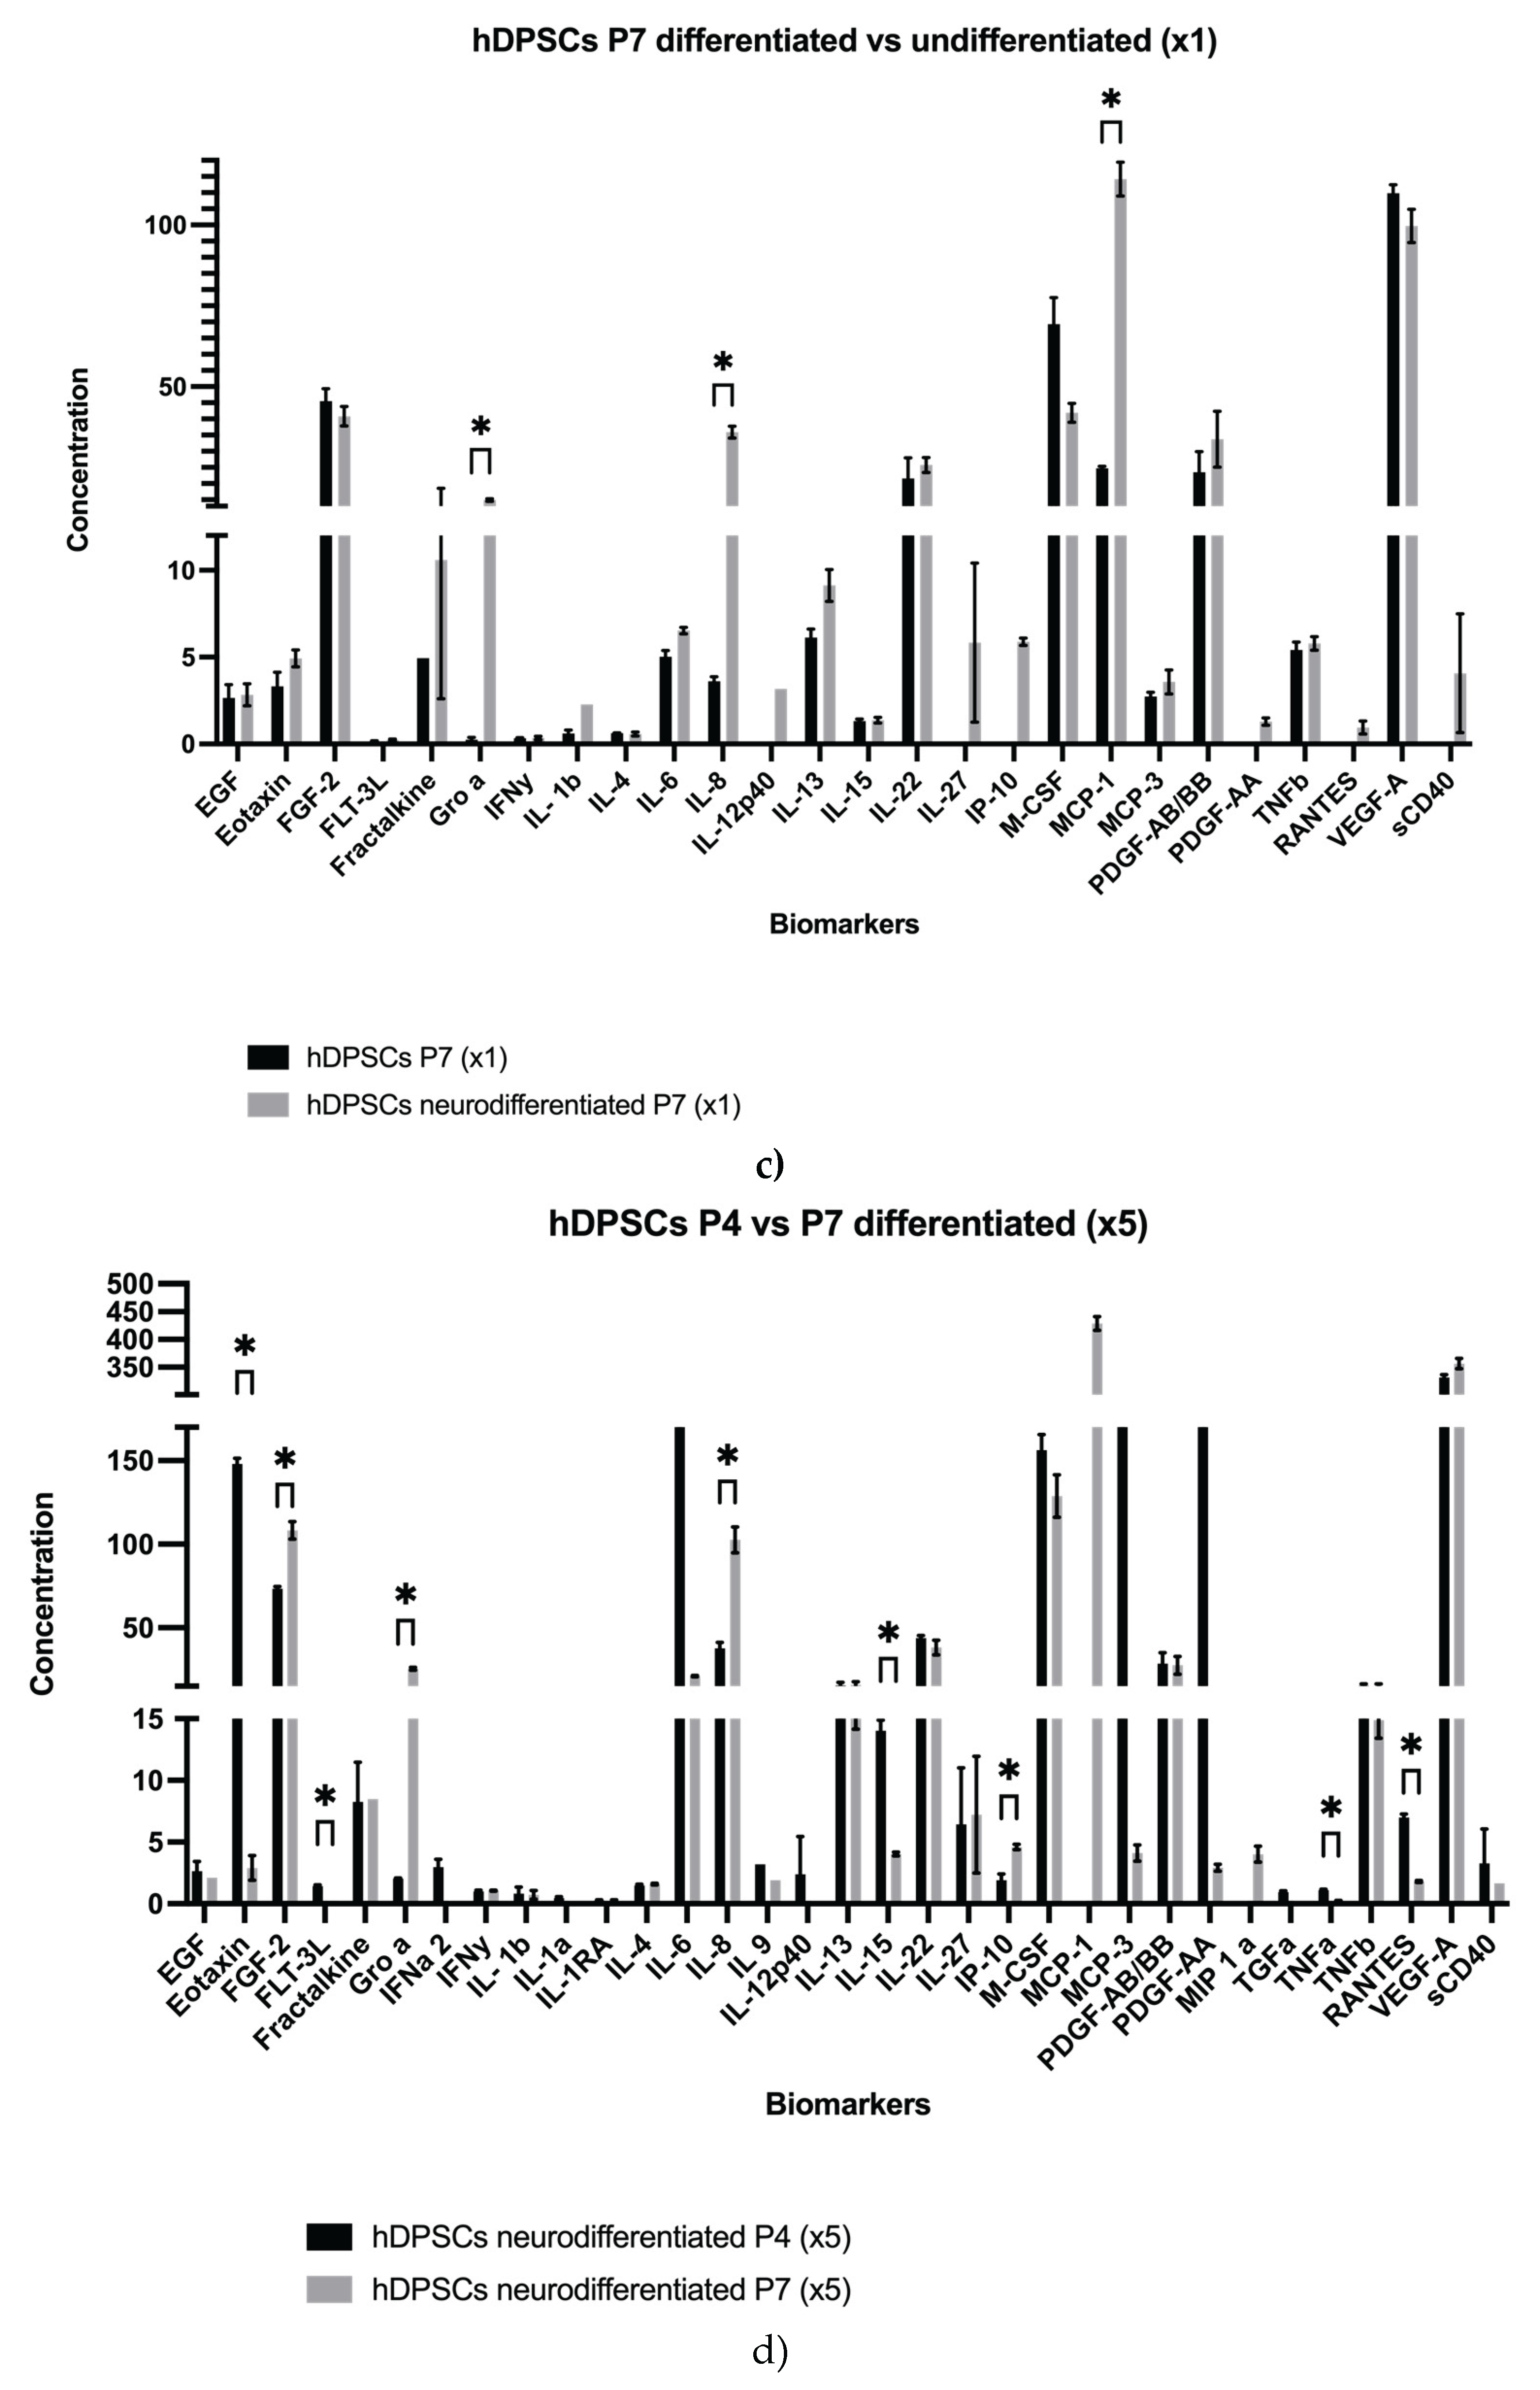
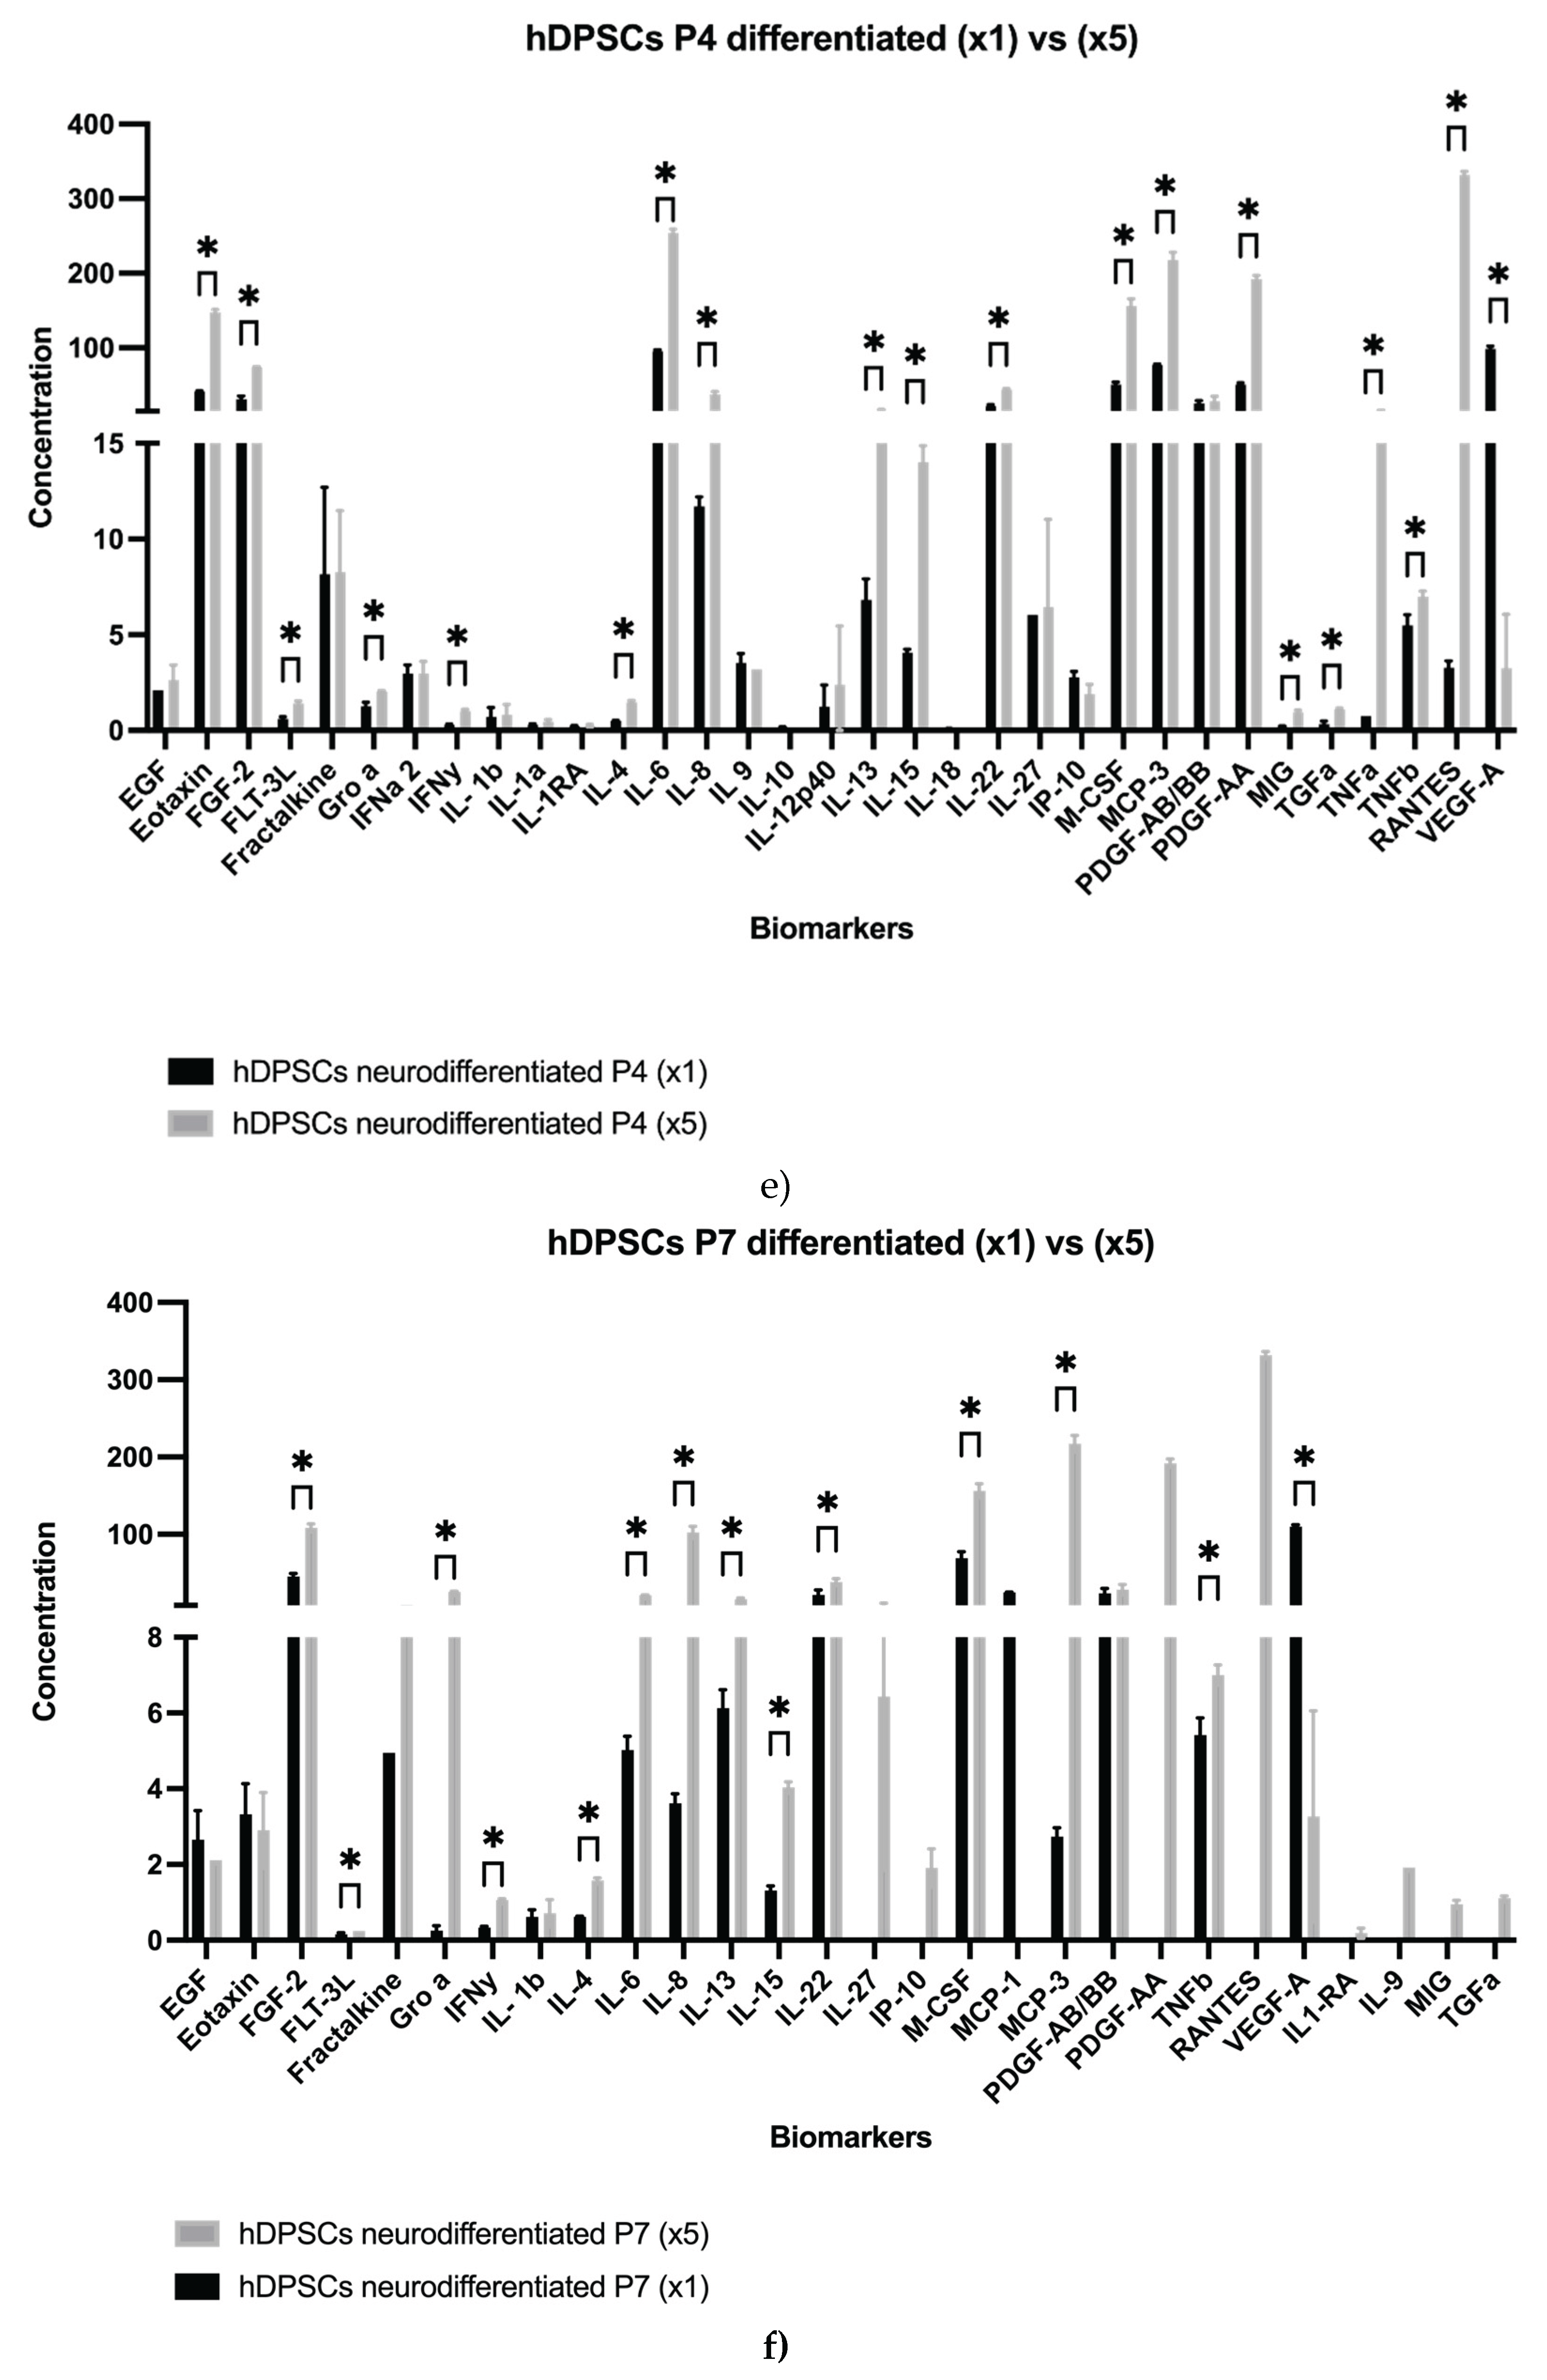
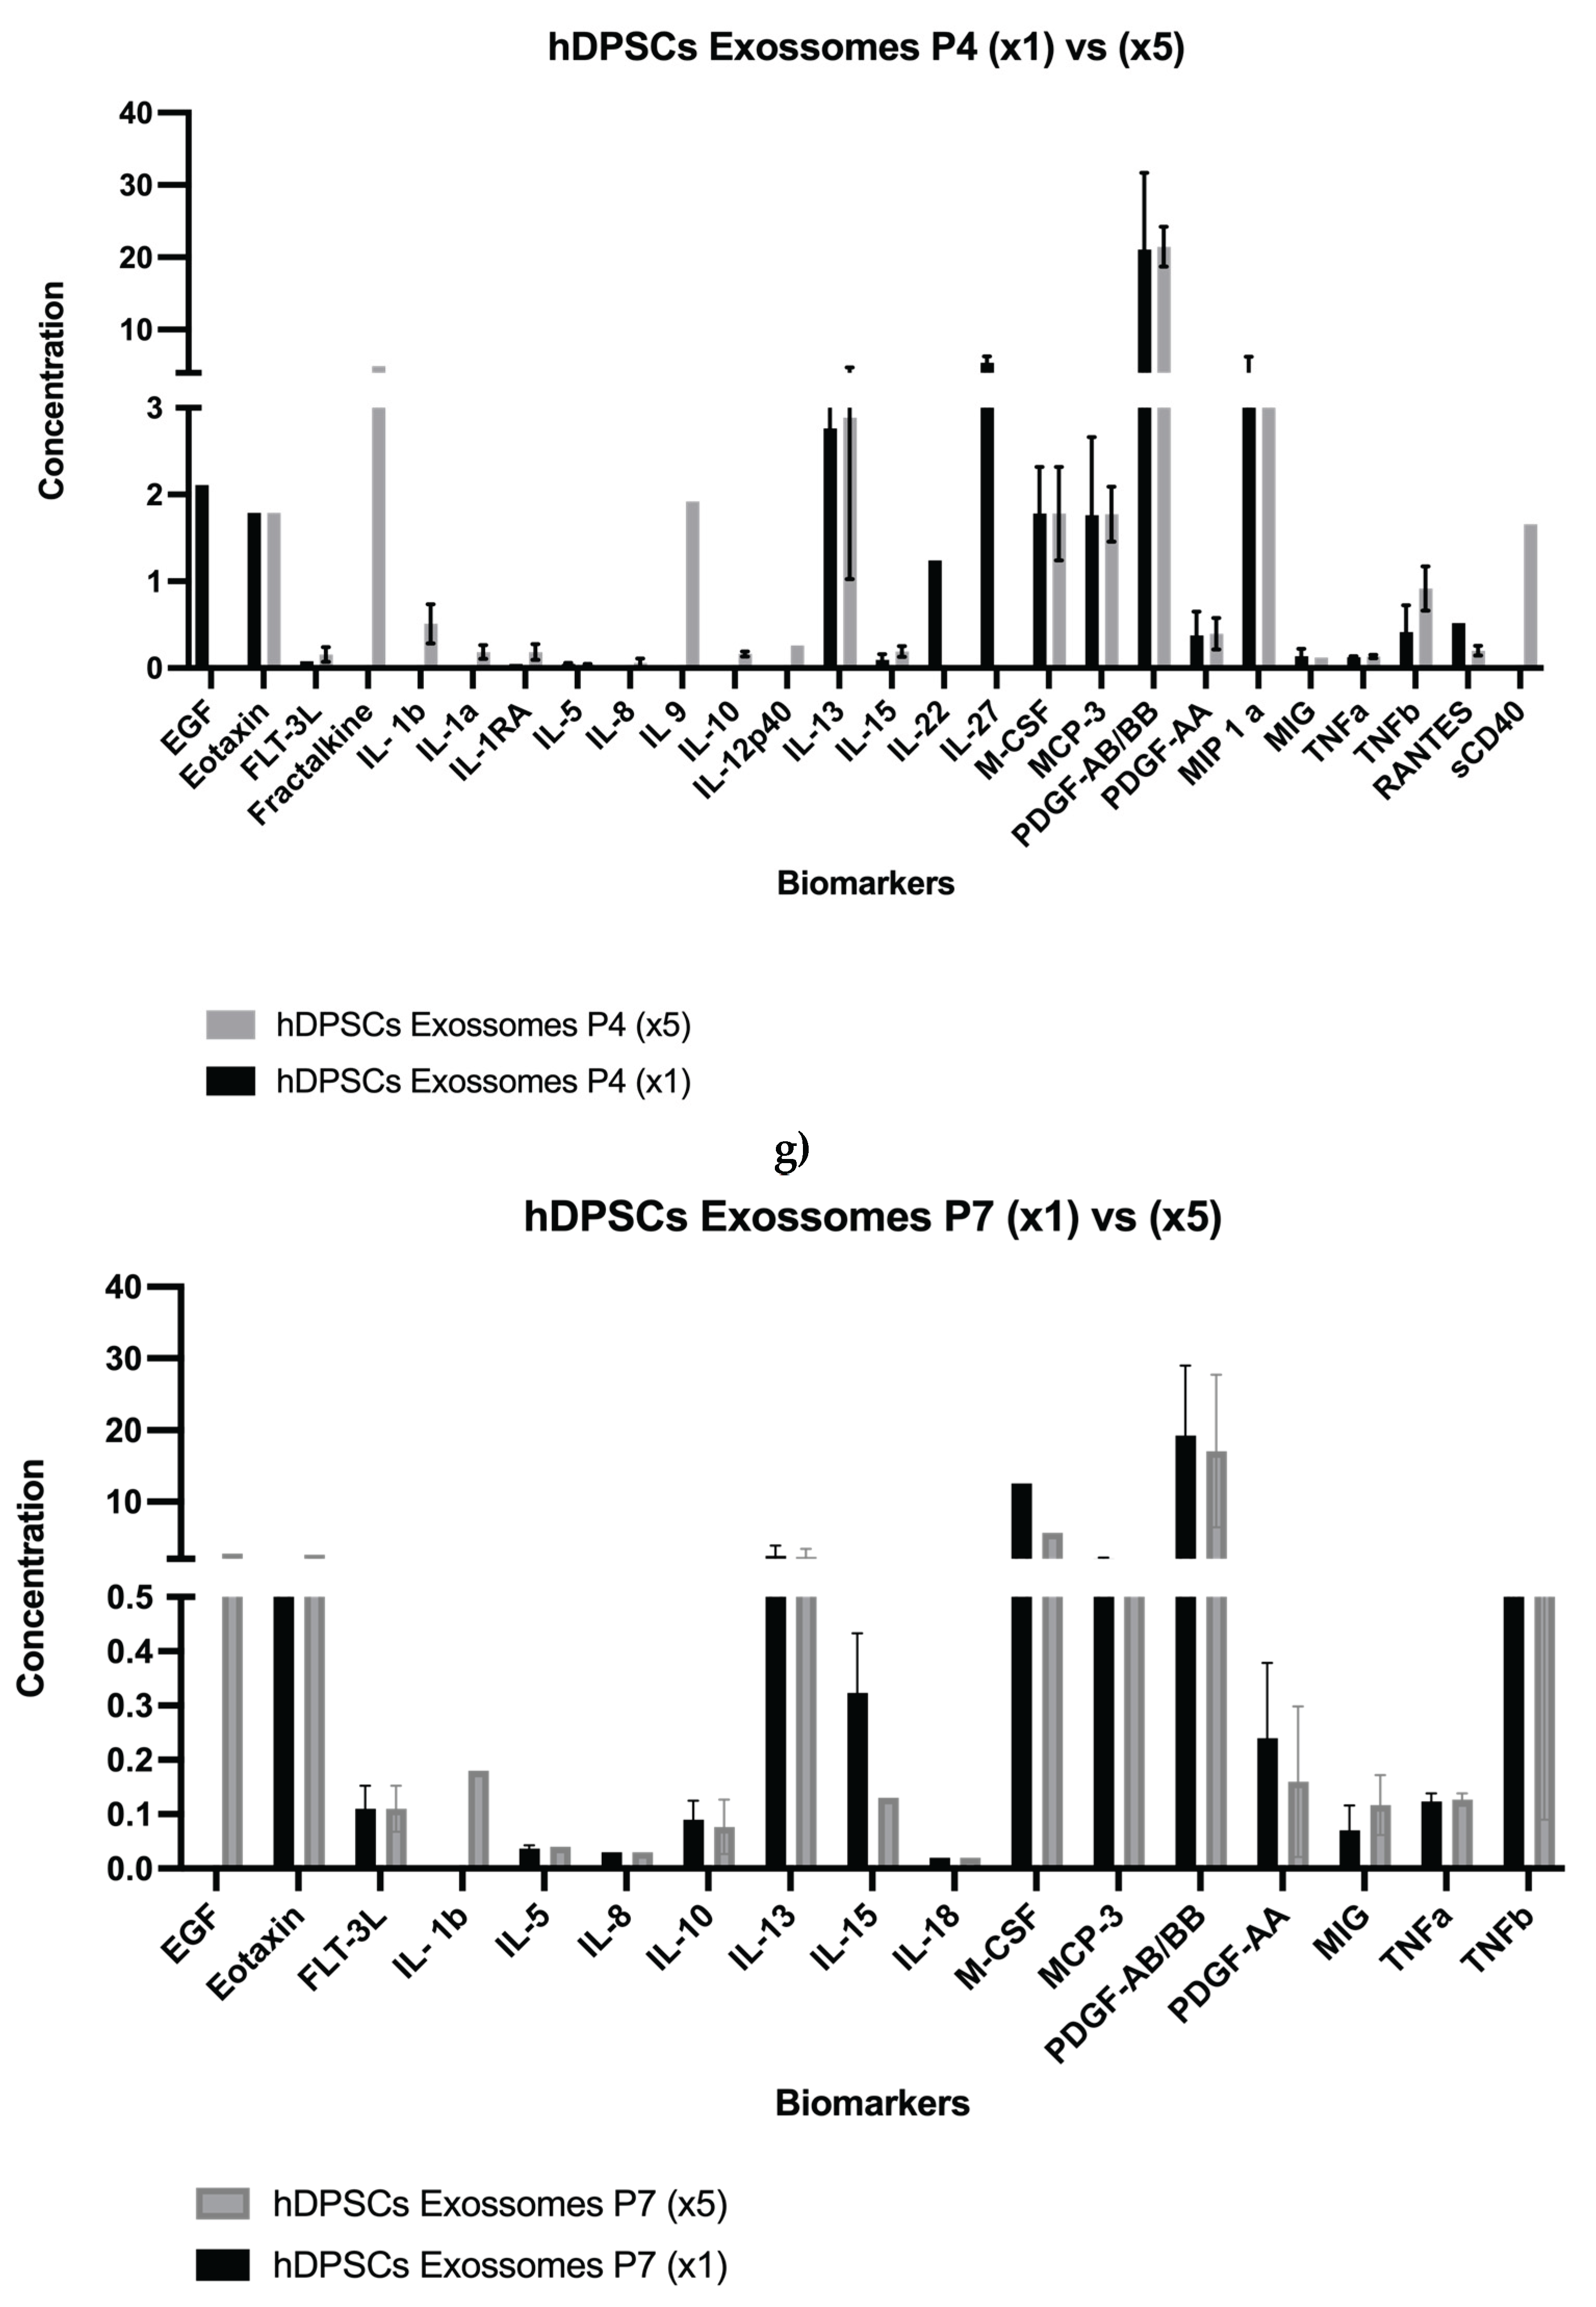
Figure 2.
SEM with EDS analysis of hDPSCs-Derived Exosomes: (a-b) SEM image of exosomes with measurement of exosome dimensions; (c) identification of exosome regions for elemental analysis; (d) EDS spectrum of exosome region Z1; (e) EDS spectrum of exosome region Z2 and (f) EDS spectrum of exosome region Z3.
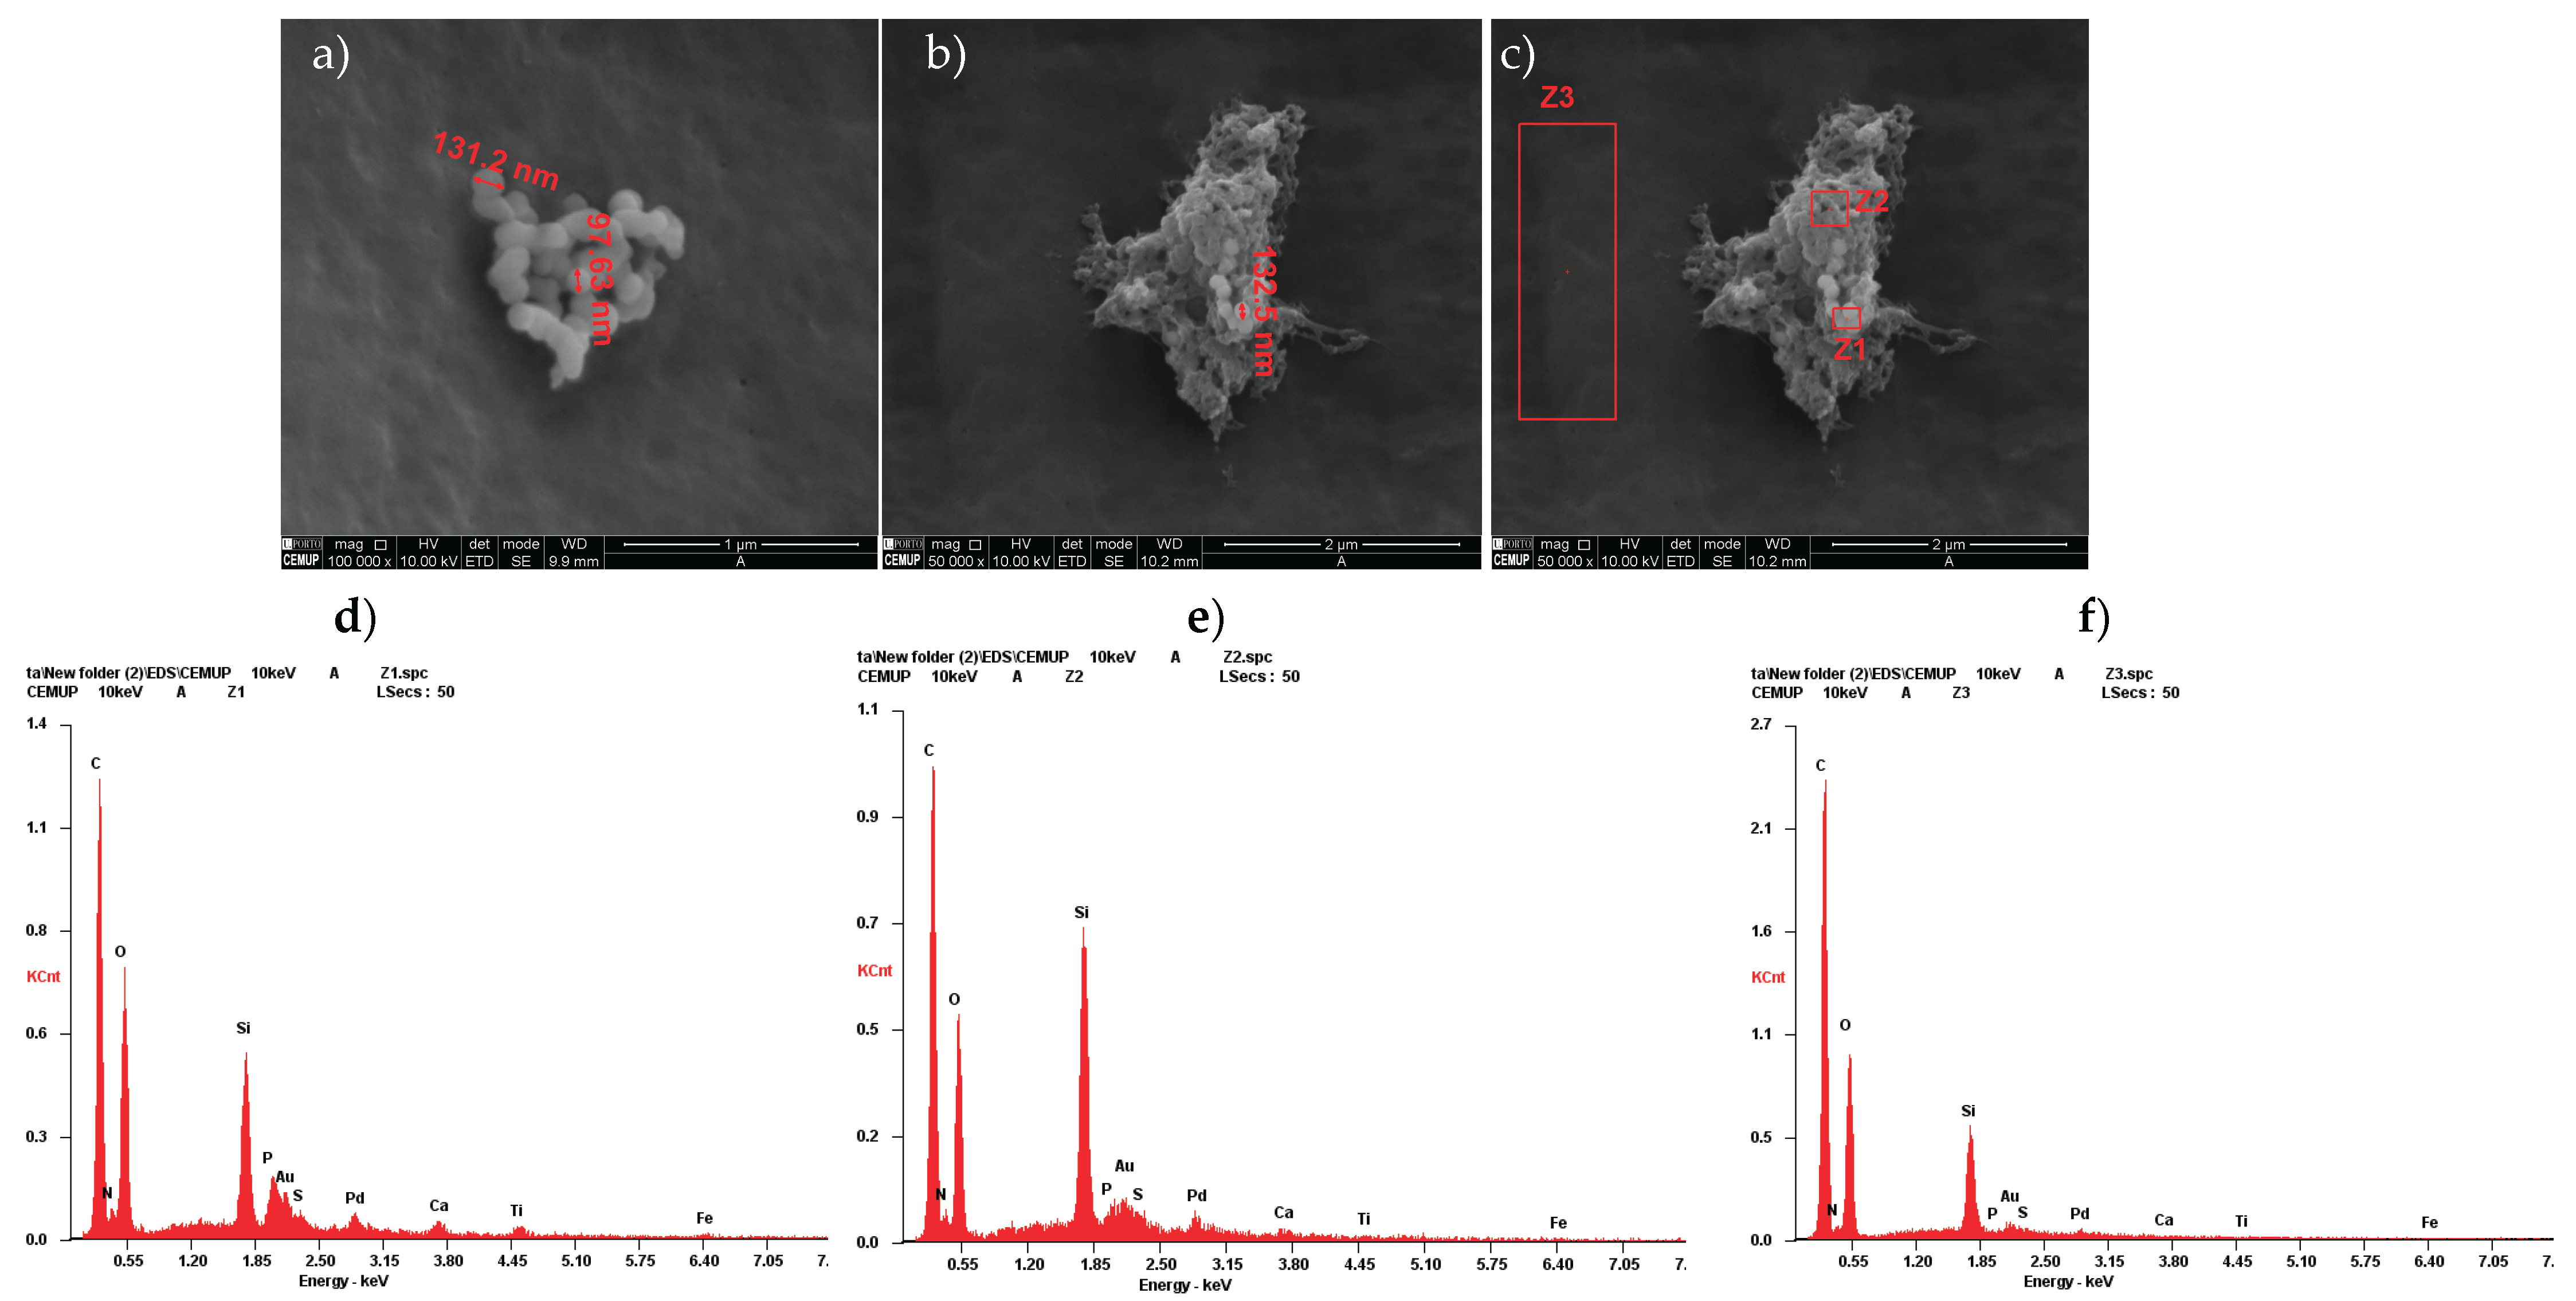
Figure 3.
SEM and EDS evaluation of the Reaxon® NGC and hDPSCs neurodifferentiated: (a) hDPSCs cell layer adhered to the inner face of the Reaxon® NGC, magnification: 2000x; (b) identification of hDPSCs regions for elemental analysis; (c) inner surface of the Reaxon® tube without cells; (d) EDS evaluation of Z5 region; (e) EDS evaluation of the Spectrum 1 region; (f) EDS evaluation of the Spectrum 2.
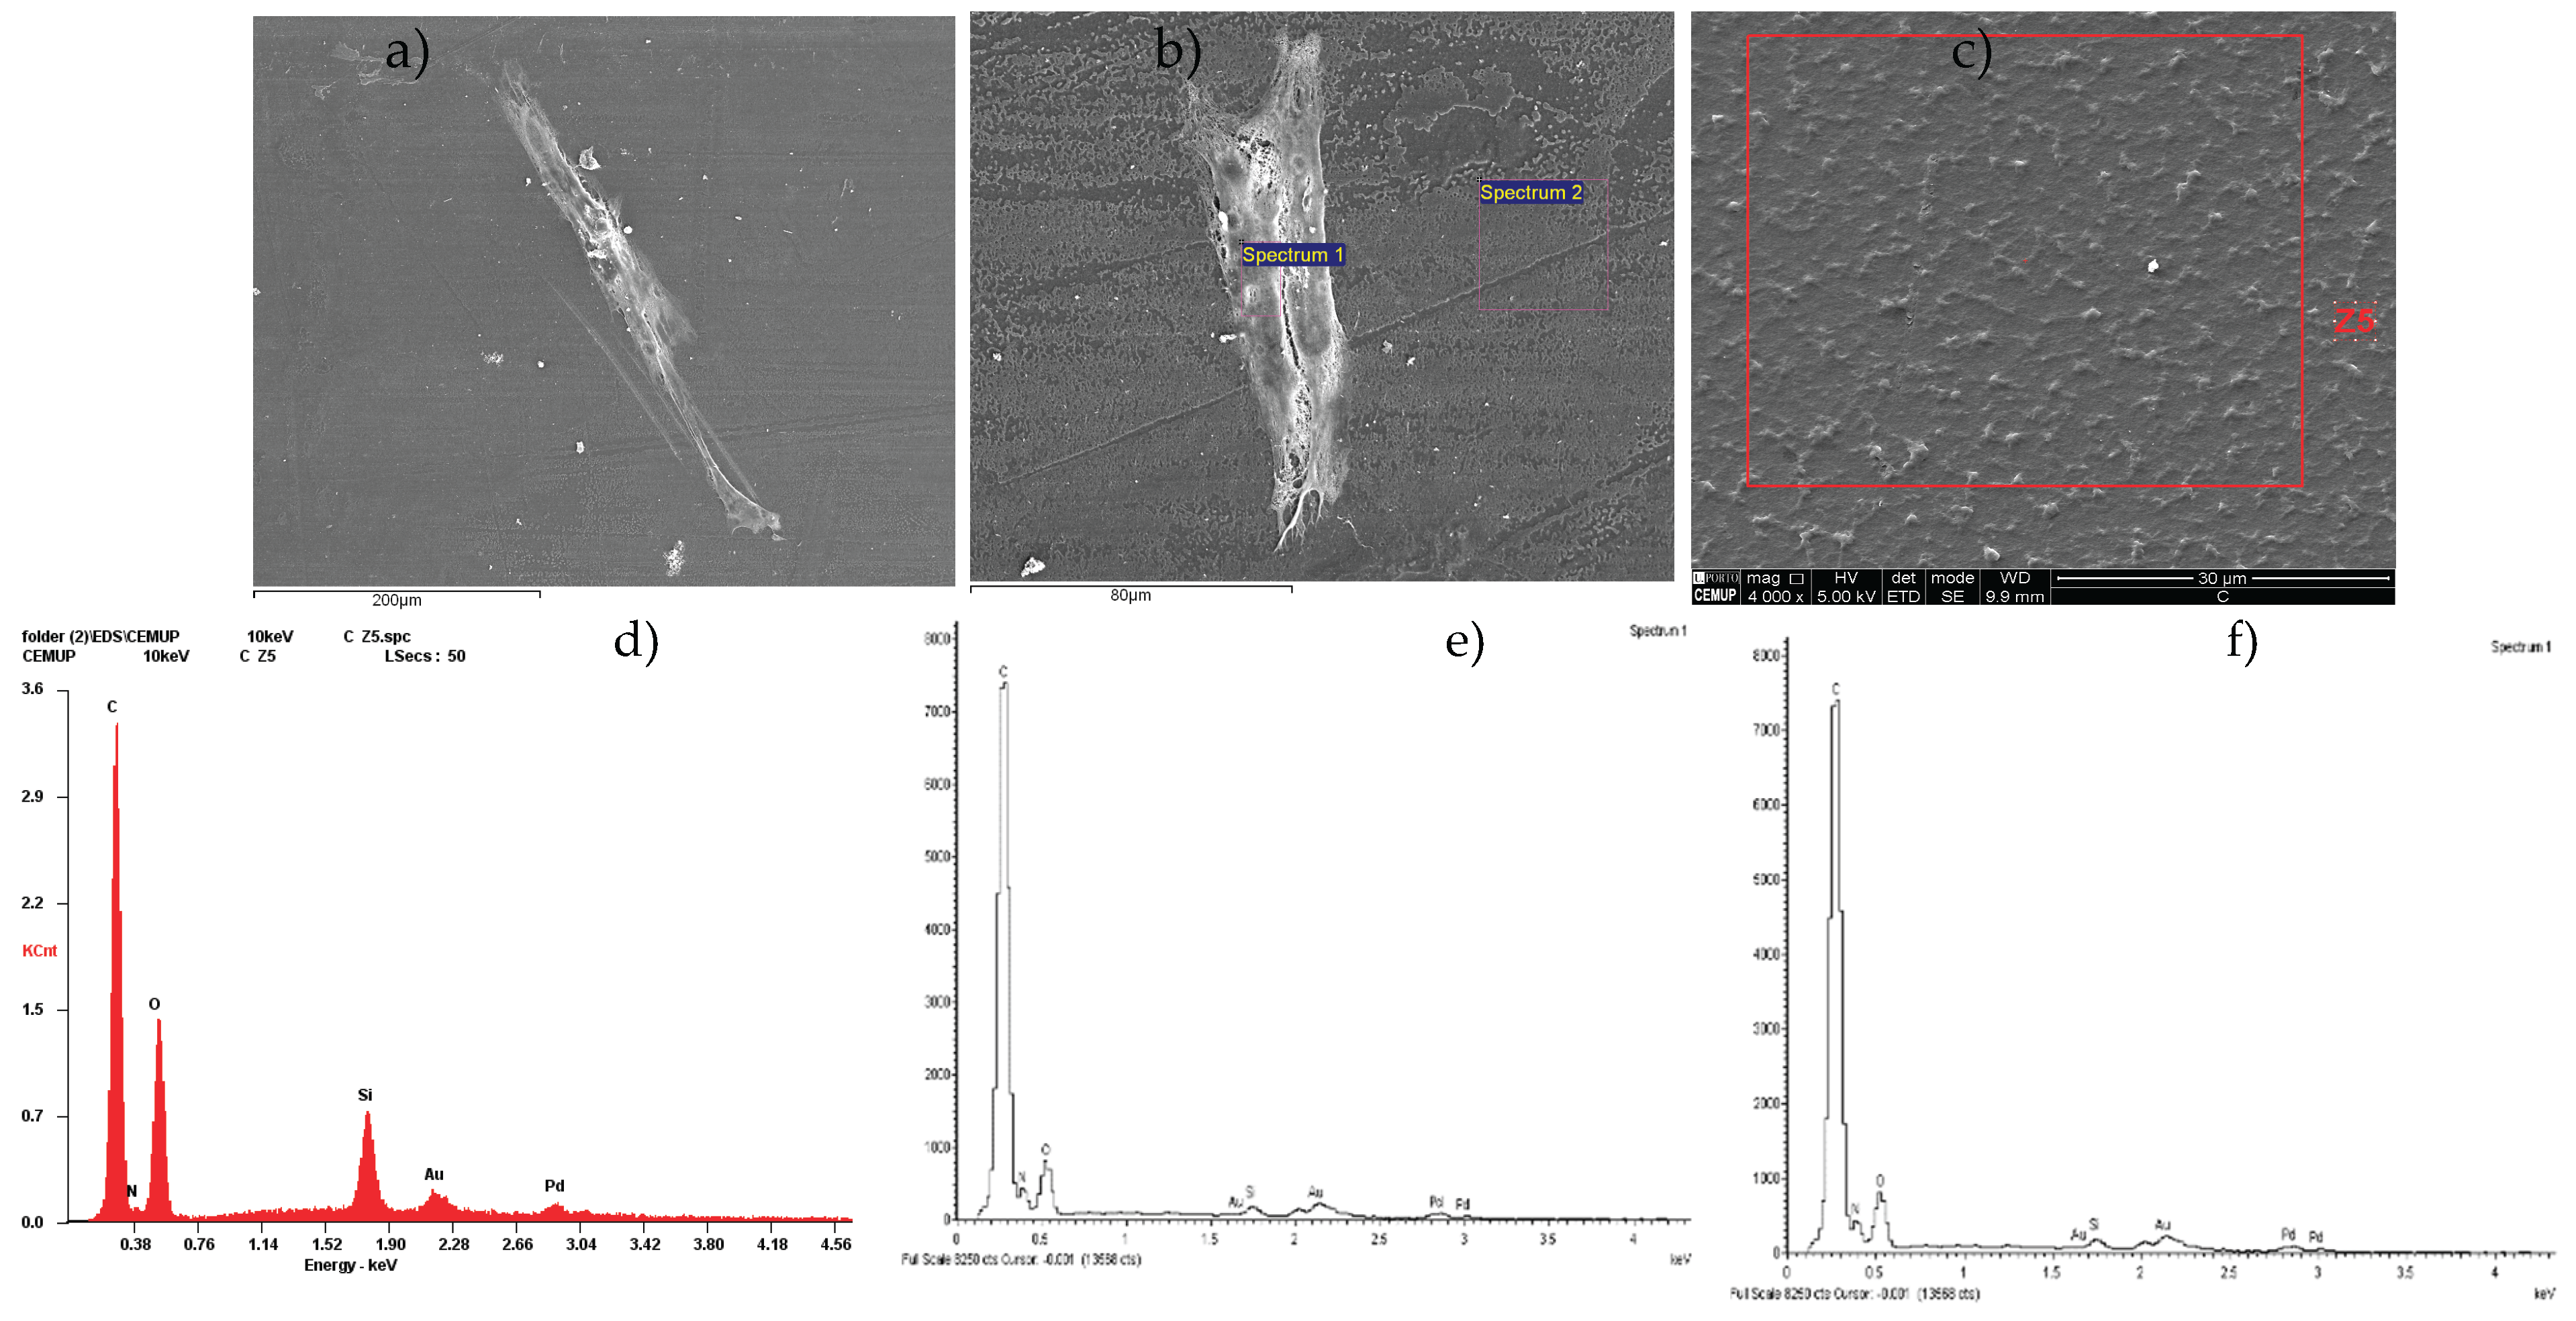
Figure 4.
∆Ct values for the different genes under study in hDPSCs undifferentiated and after neurogenic differentiation. Higher ∆Ct values represent lower expresion. Results are presented as mean ± SEM.
Figure 4.
∆Ct values for the different genes under study in hDPSCs undifferentiated and after neurogenic differentiation. Higher ∆Ct values represent lower expresion. Results are presented as mean ± SEM.
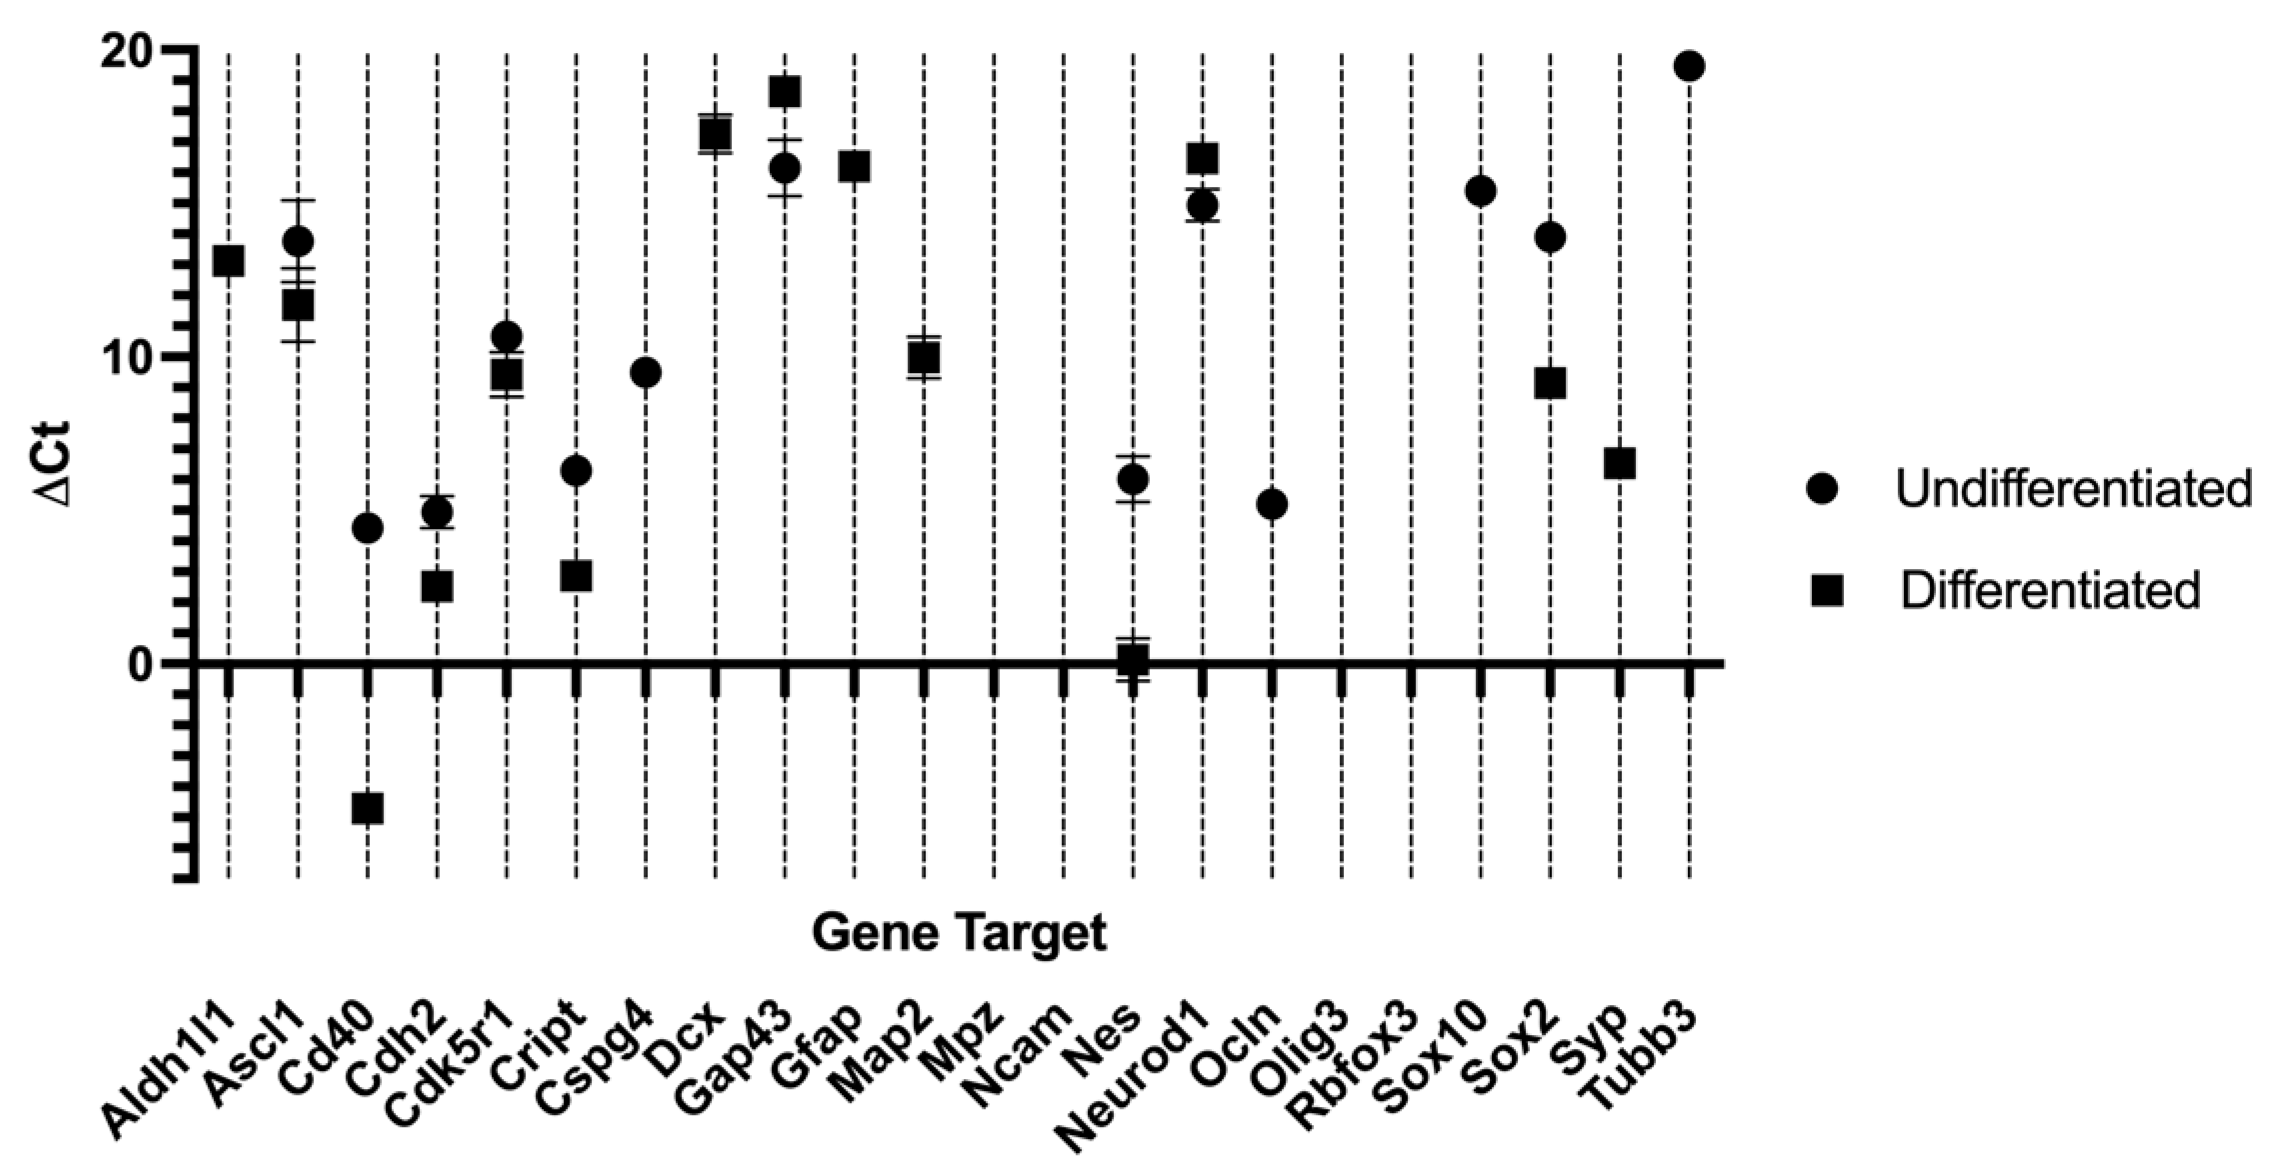
Figure 5.
∆Ct values for the different genes under study in hDPSCs Exosomes in the different passages. Higher ∆Ct values represent lower expresion. Results are presented as mean ± SEM.
Figure 5.
∆Ct values for the different genes under study in hDPSCs Exosomes in the different passages. Higher ∆Ct values represent lower expresion. Results are presented as mean ± SEM.
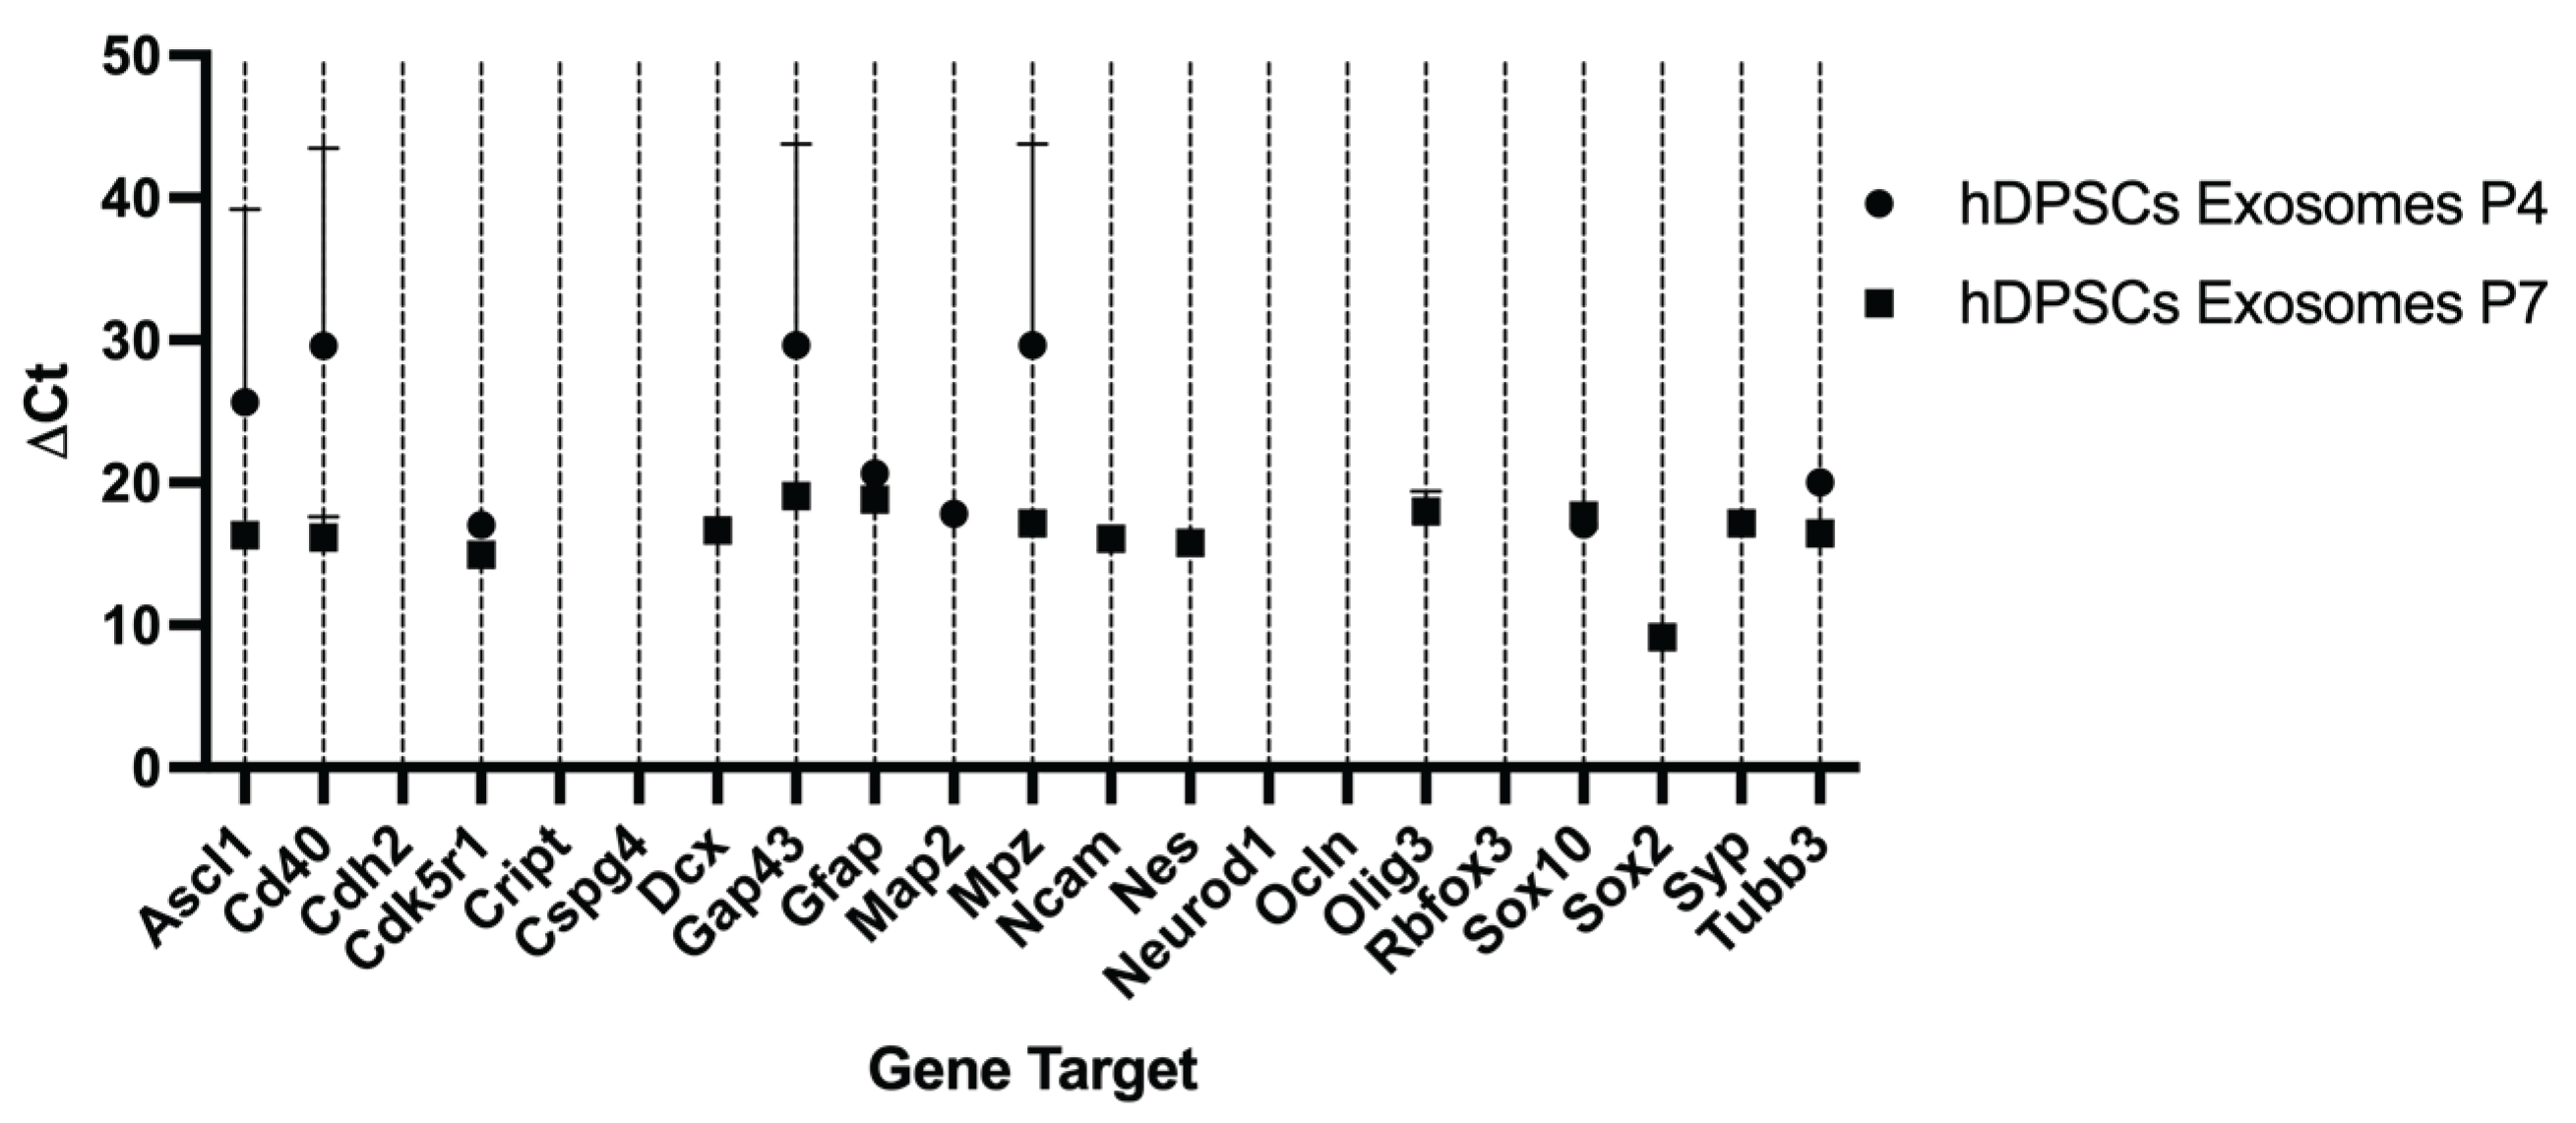
Figure 6.
Representative images of neurite outgrowth in hDPSCs under different conditions: a) BSA coated inserts (2 mg/mL), serum free media (negative control), b) laminin coated inserts (10 µg/mL), serum free media, c) laminin coated inserts, serum free media plus nocodazole 250 ng/mL 0h (from the beginning of differentiation), and d) laminin coated inserts, serum free media plus nocodazole 250 ng/mL 24h (Cells differentiated for 24 hours, followed by the addition of 250 ng/mL nocodazole for another 24 hours). Neuritic projections (black arrow) on the basal membrane surface reflect differential modulation of neurite extension. Scale bar: 200 µm.
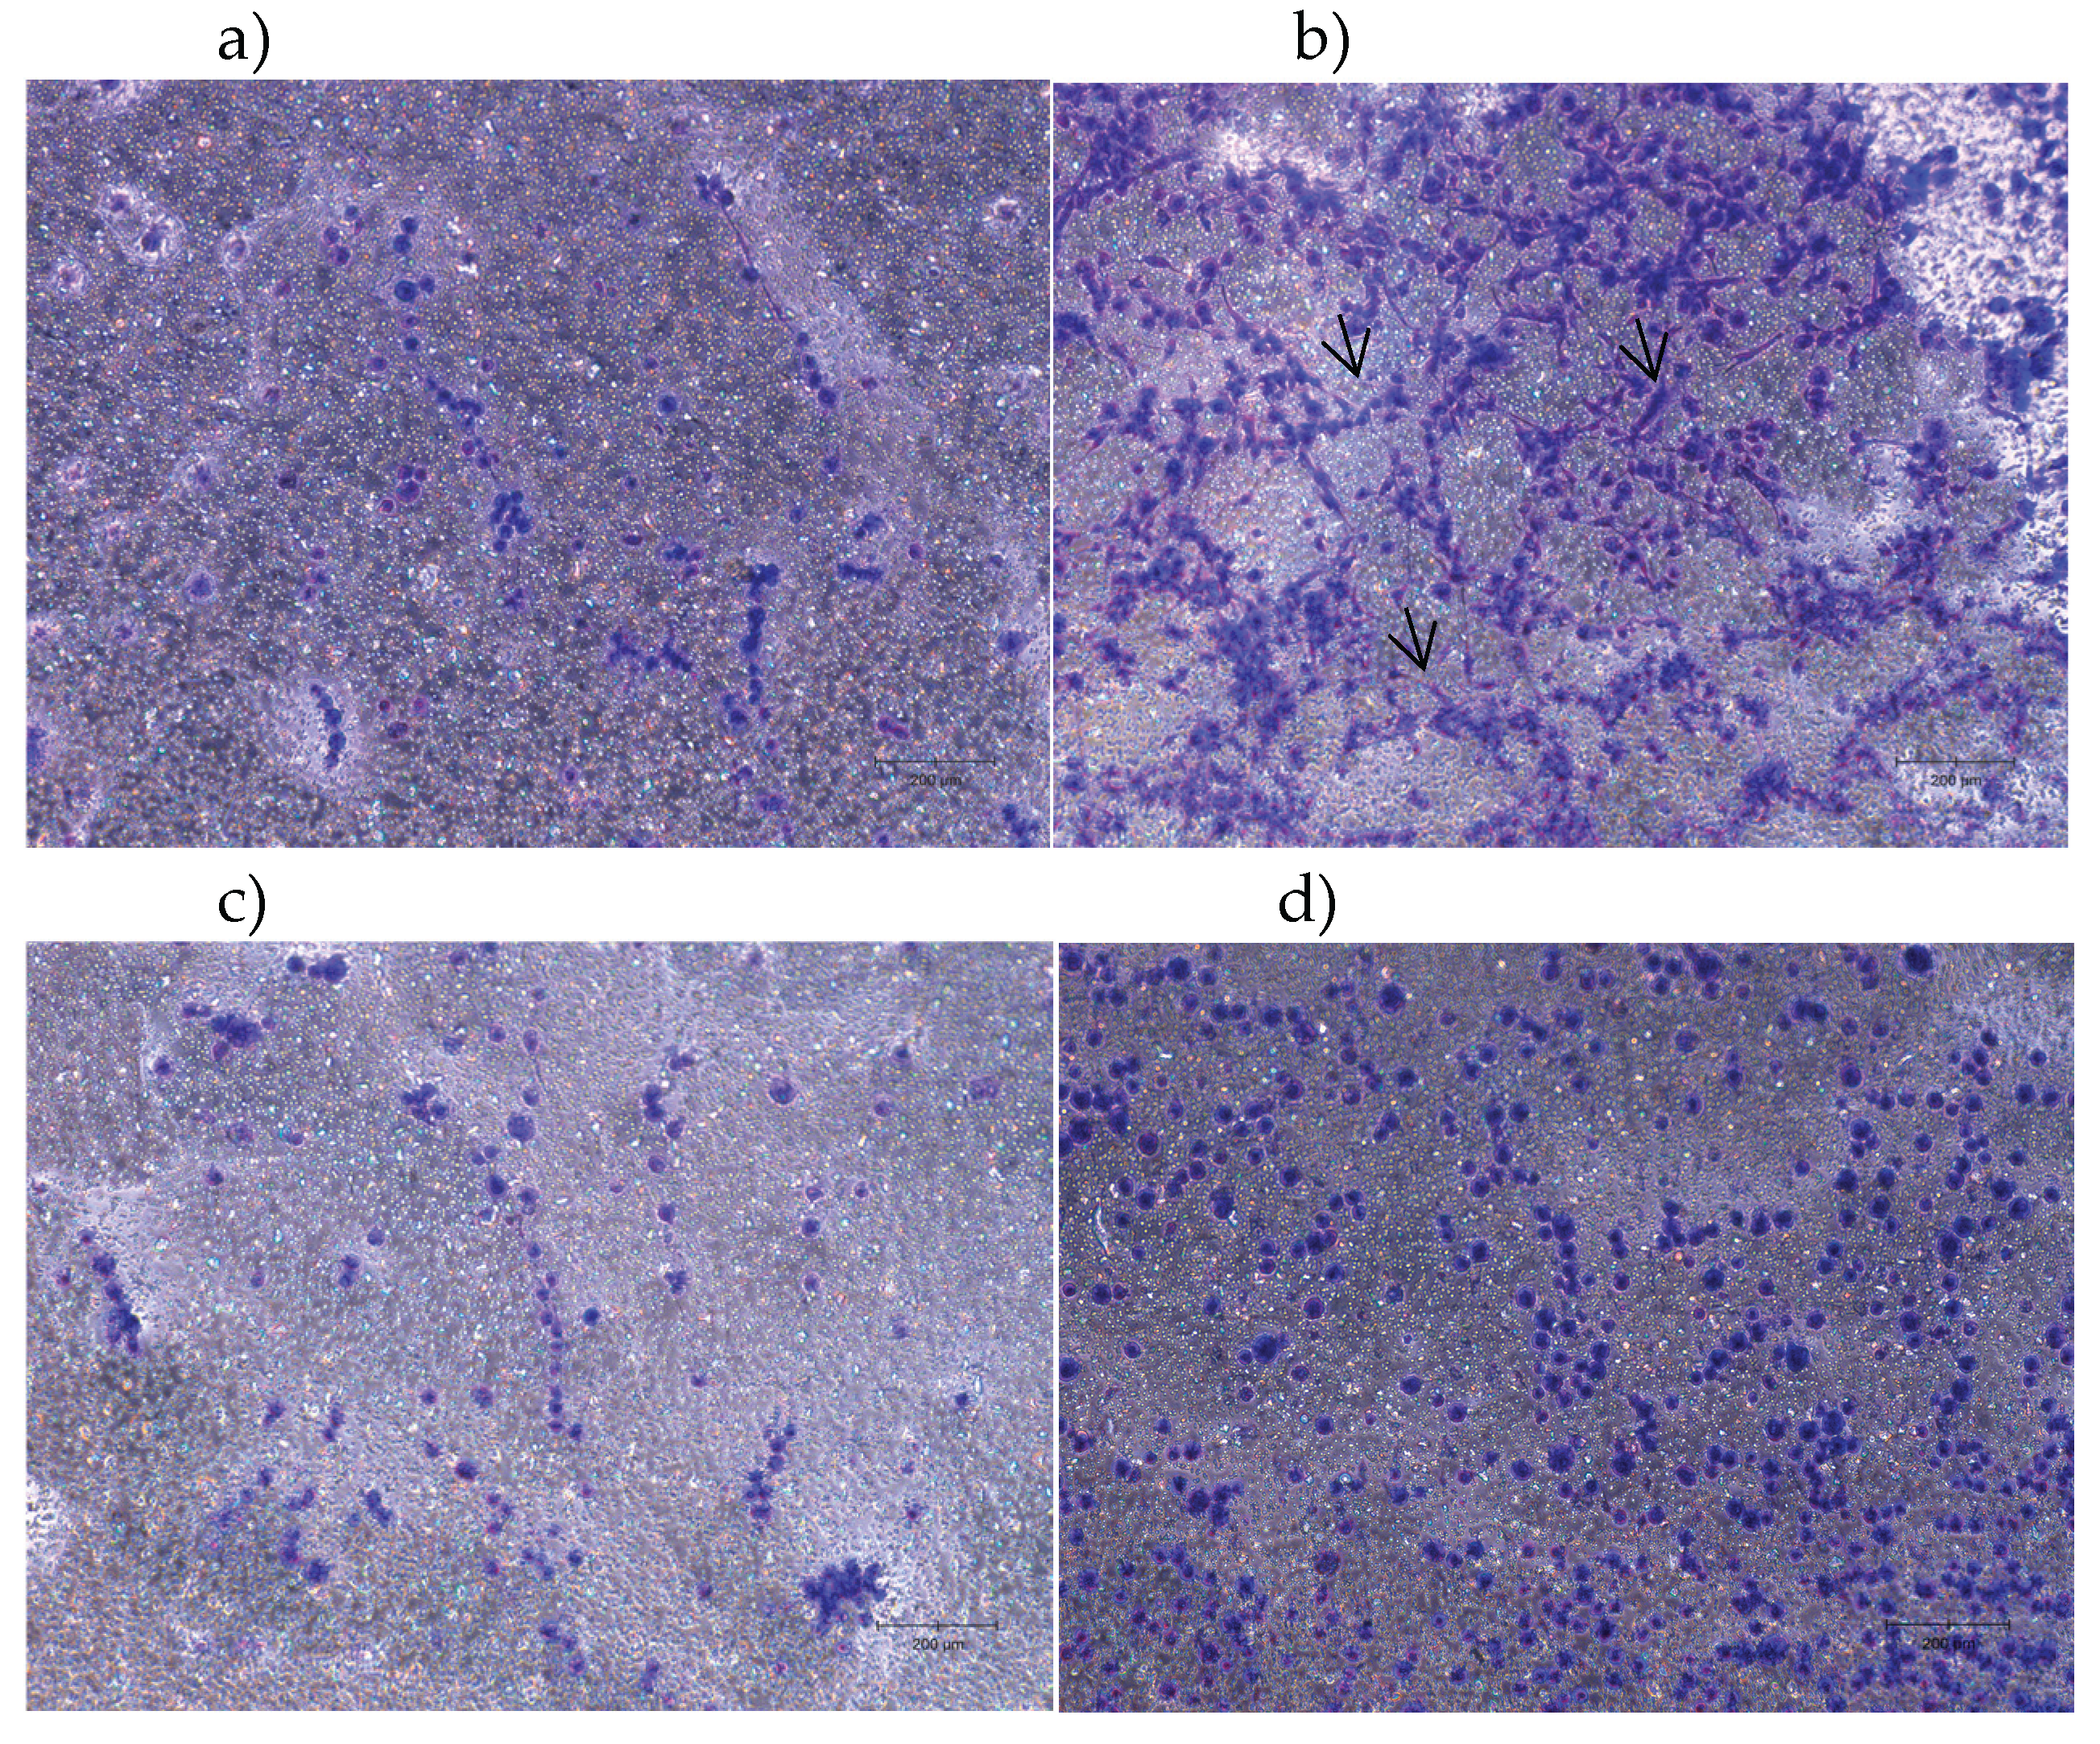
Figure 7.
Quantification of neurite outgrowth in hDPSCs under different conditions. Conditions included BSA (negative control), laminin (positive control), and nocodazole treatment applied at 0 h or 24 h of differentiation. Data are expressed as mean ± SEM. Results significances are presented through the symbol (*), according to the p-value, with one, two, three, or four symbols, corresponding to 0.01 < p ≤ 0.05; 0.001 <p ≤ 0.01; 0.0001 < p ≤ 0.001 and p ≤ 0.0001.
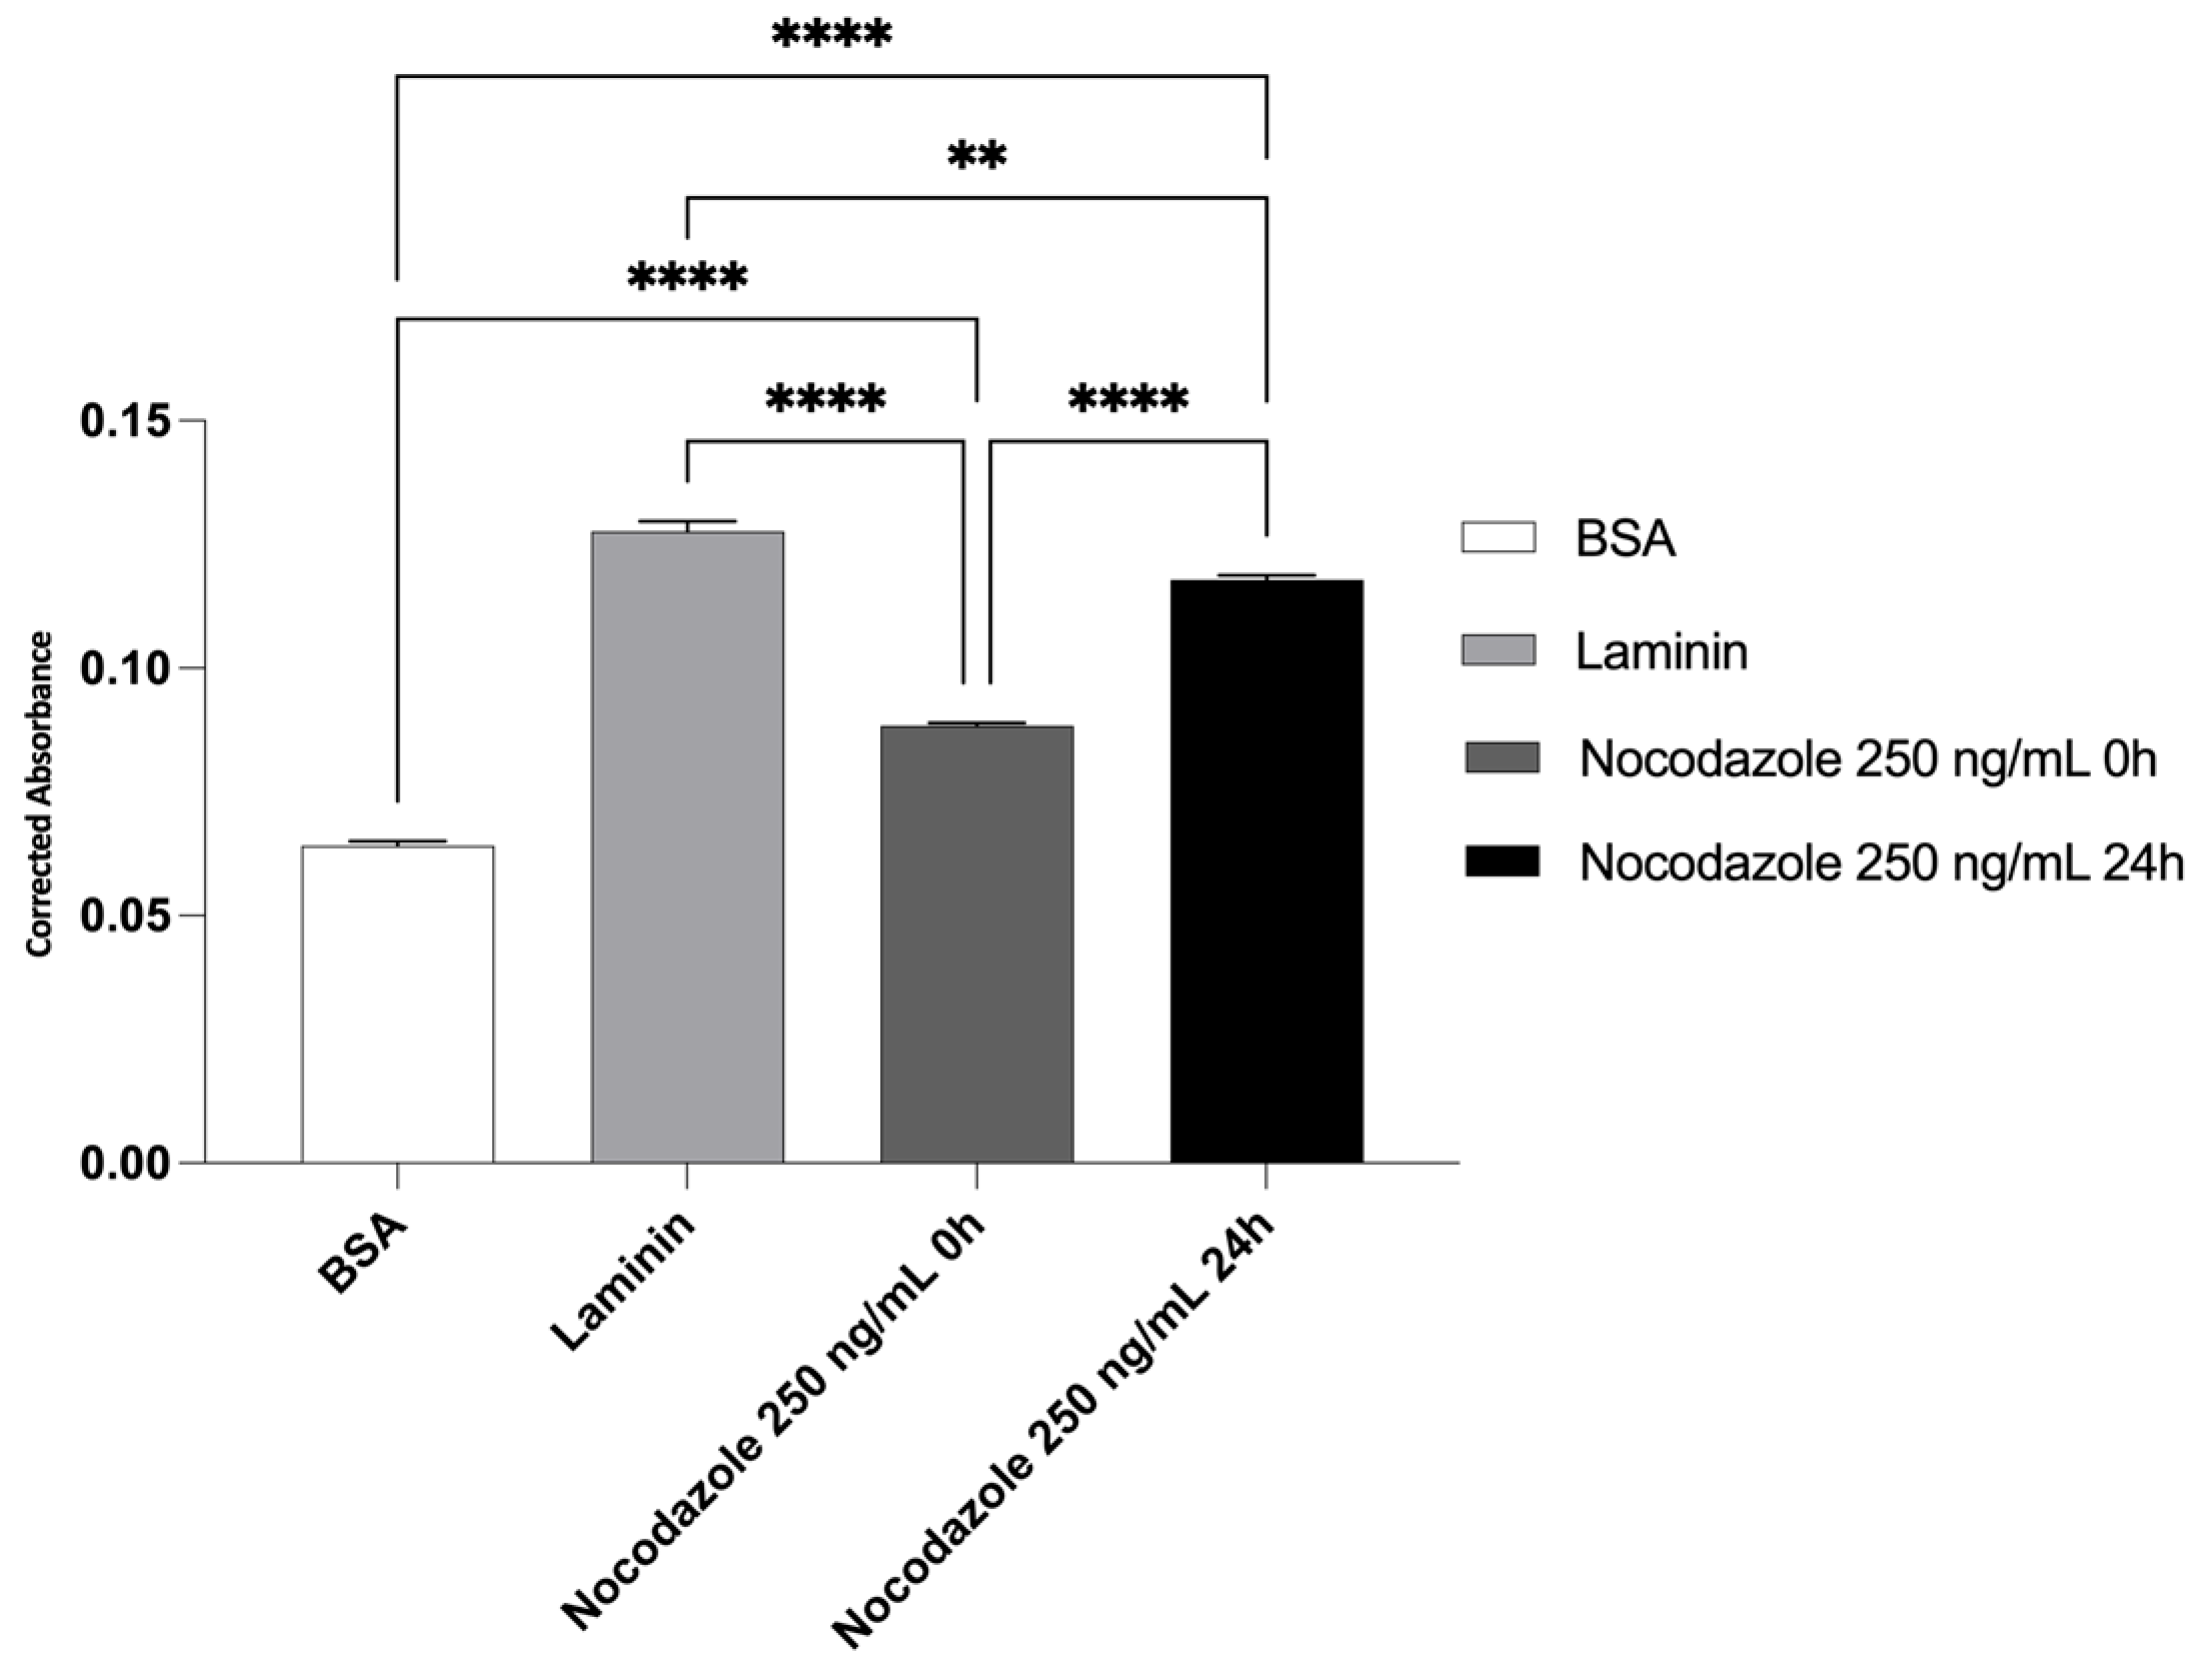
Figure 8.
Protein concentration for secretome and exosomes isolated from cells in P4 and P7 (mean ± SEM). Results significances are presented through the symbol (*), according to the p-value, with one, two, three, or four symbols, corresponding to 0.01 < p ≤ 0.05; 0.001 <p ≤ 0.01; 0.0001 < p ≤ 0.001 and p ≤ 0.0001.
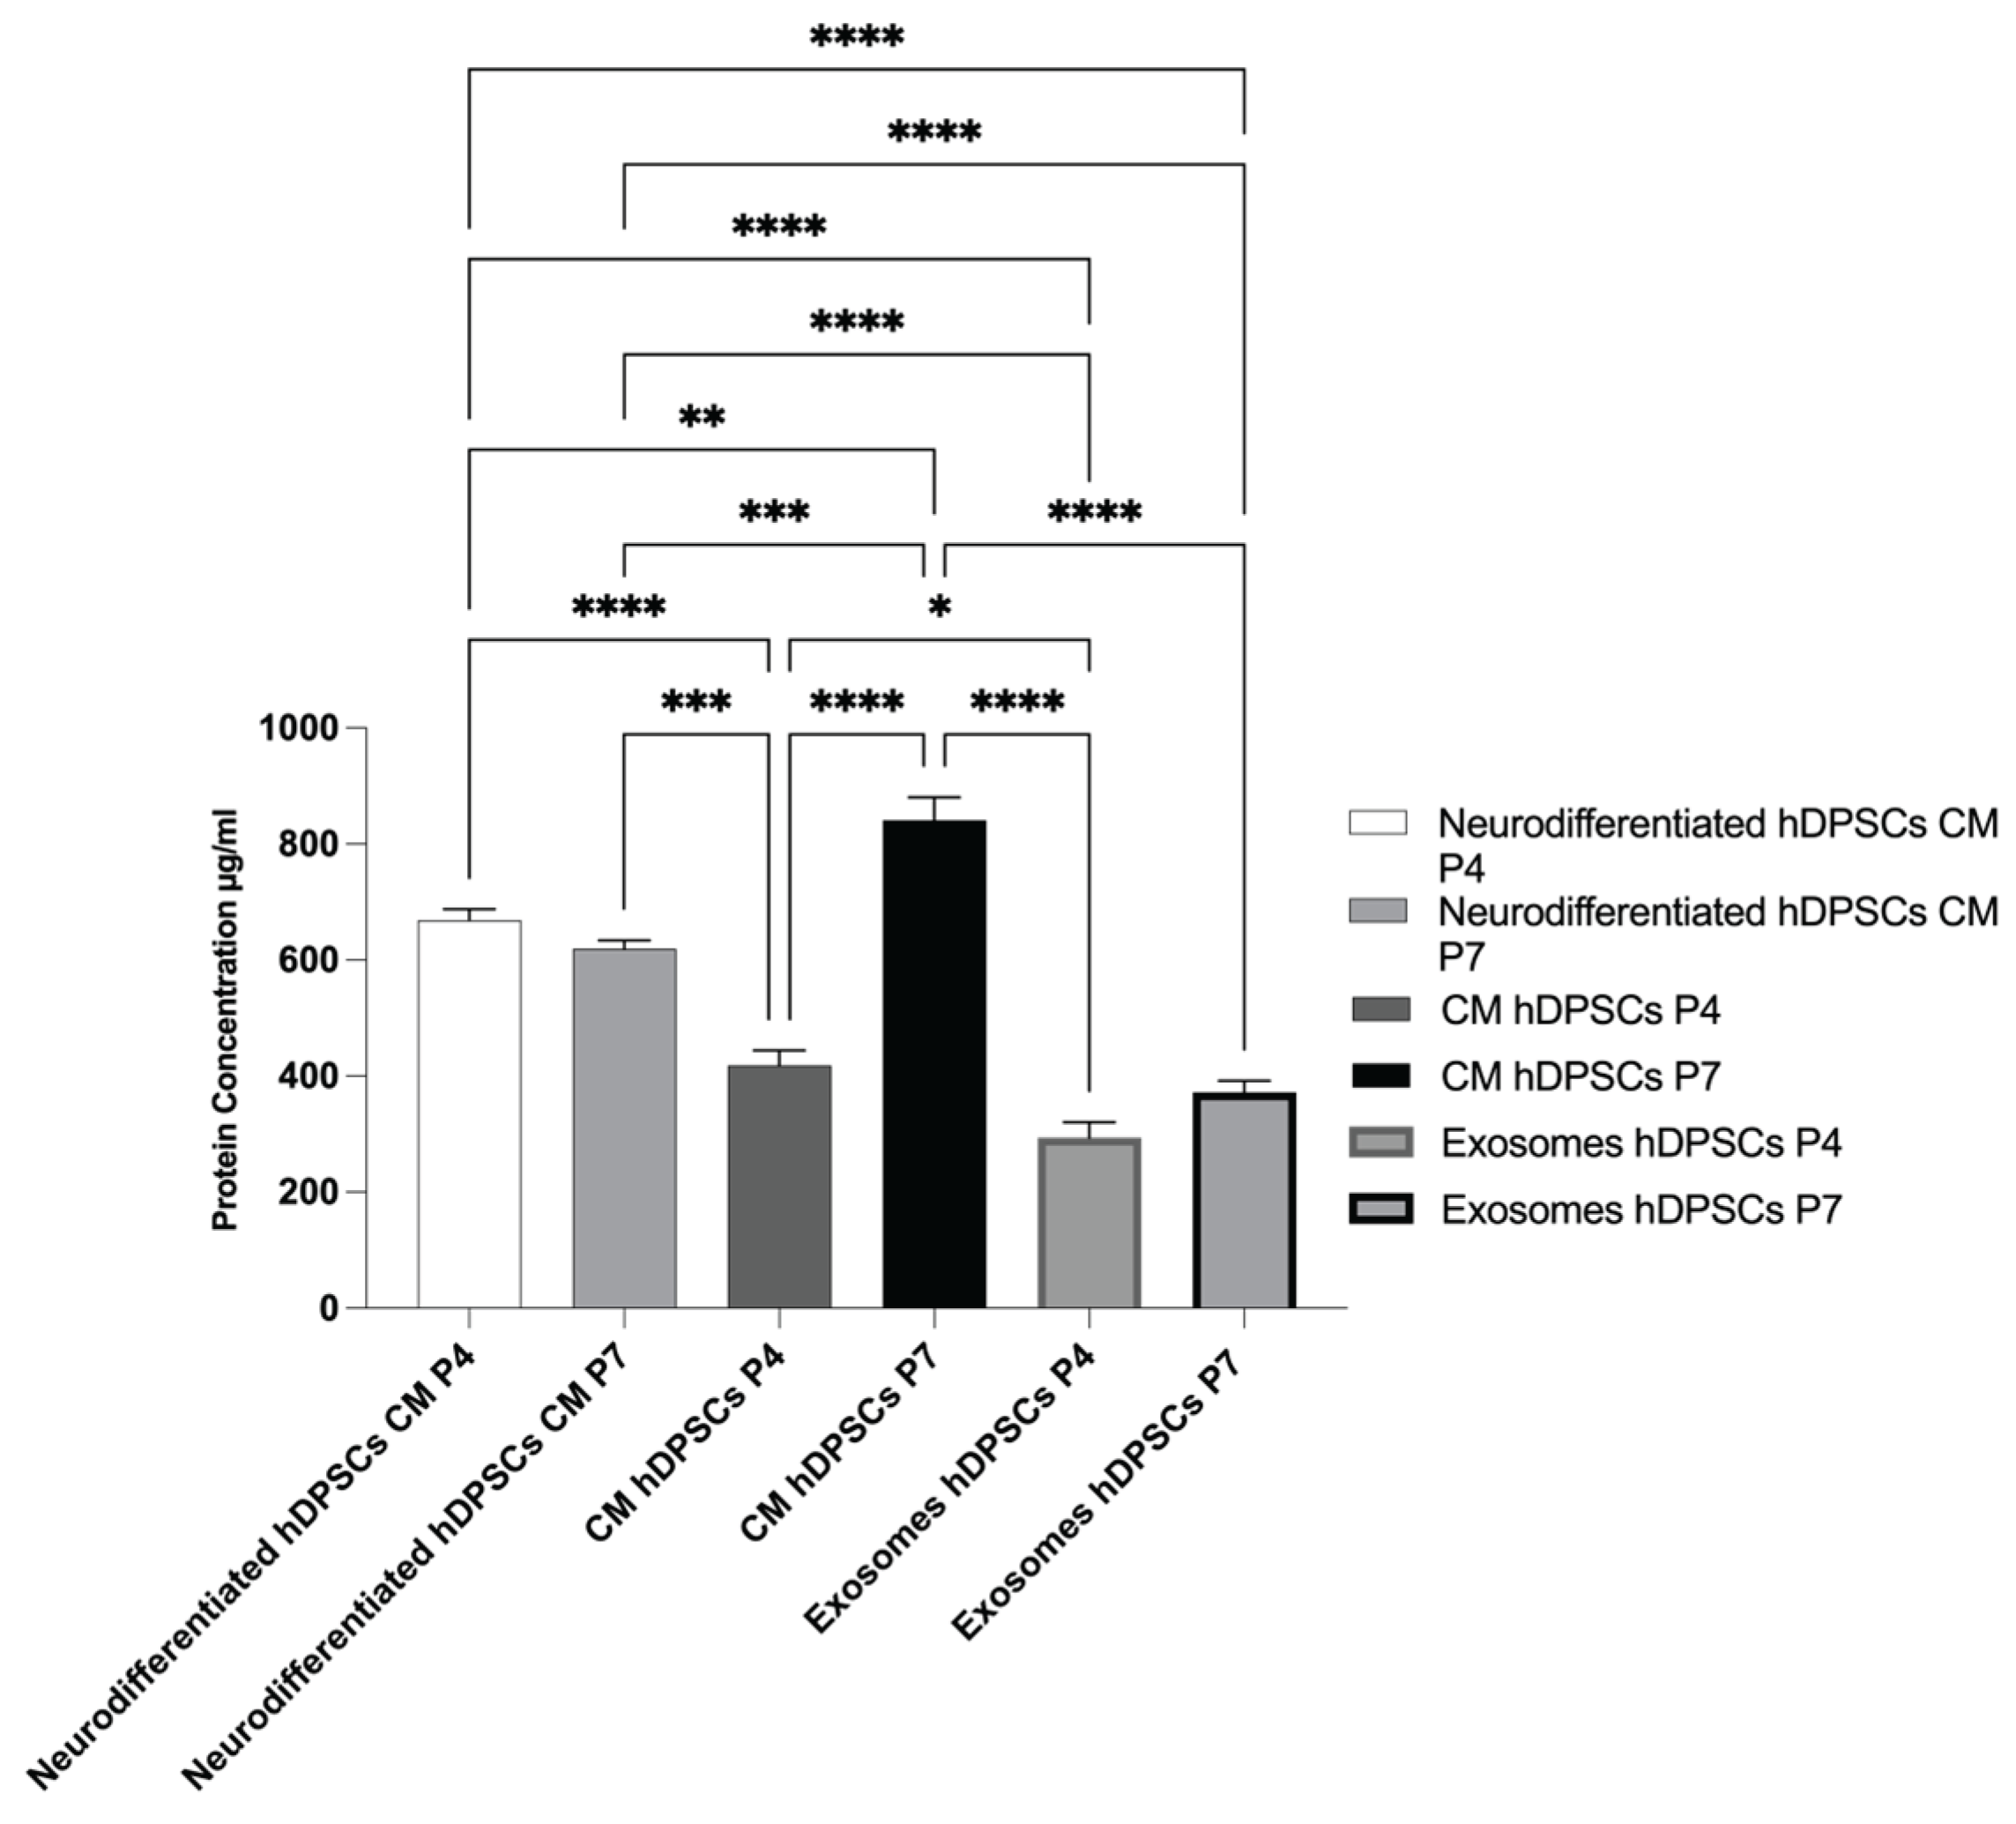
Table 4.
Ct, ΔCt, ΔΔCt, and RQ values for all genes under study for hDPSCs undifferentiated and after neurogenic differentiation. N = normal; ↑ = upregulated; ↓ = downregulated; nd = nondefined.
Table 4.
Ct, ΔCt, ΔΔCt, and RQ values for all genes under study for hDPSCs undifferentiated and after neurogenic differentiation. N = normal; ↑ = upregulated; ↓ = downregulated; nd = nondefined.
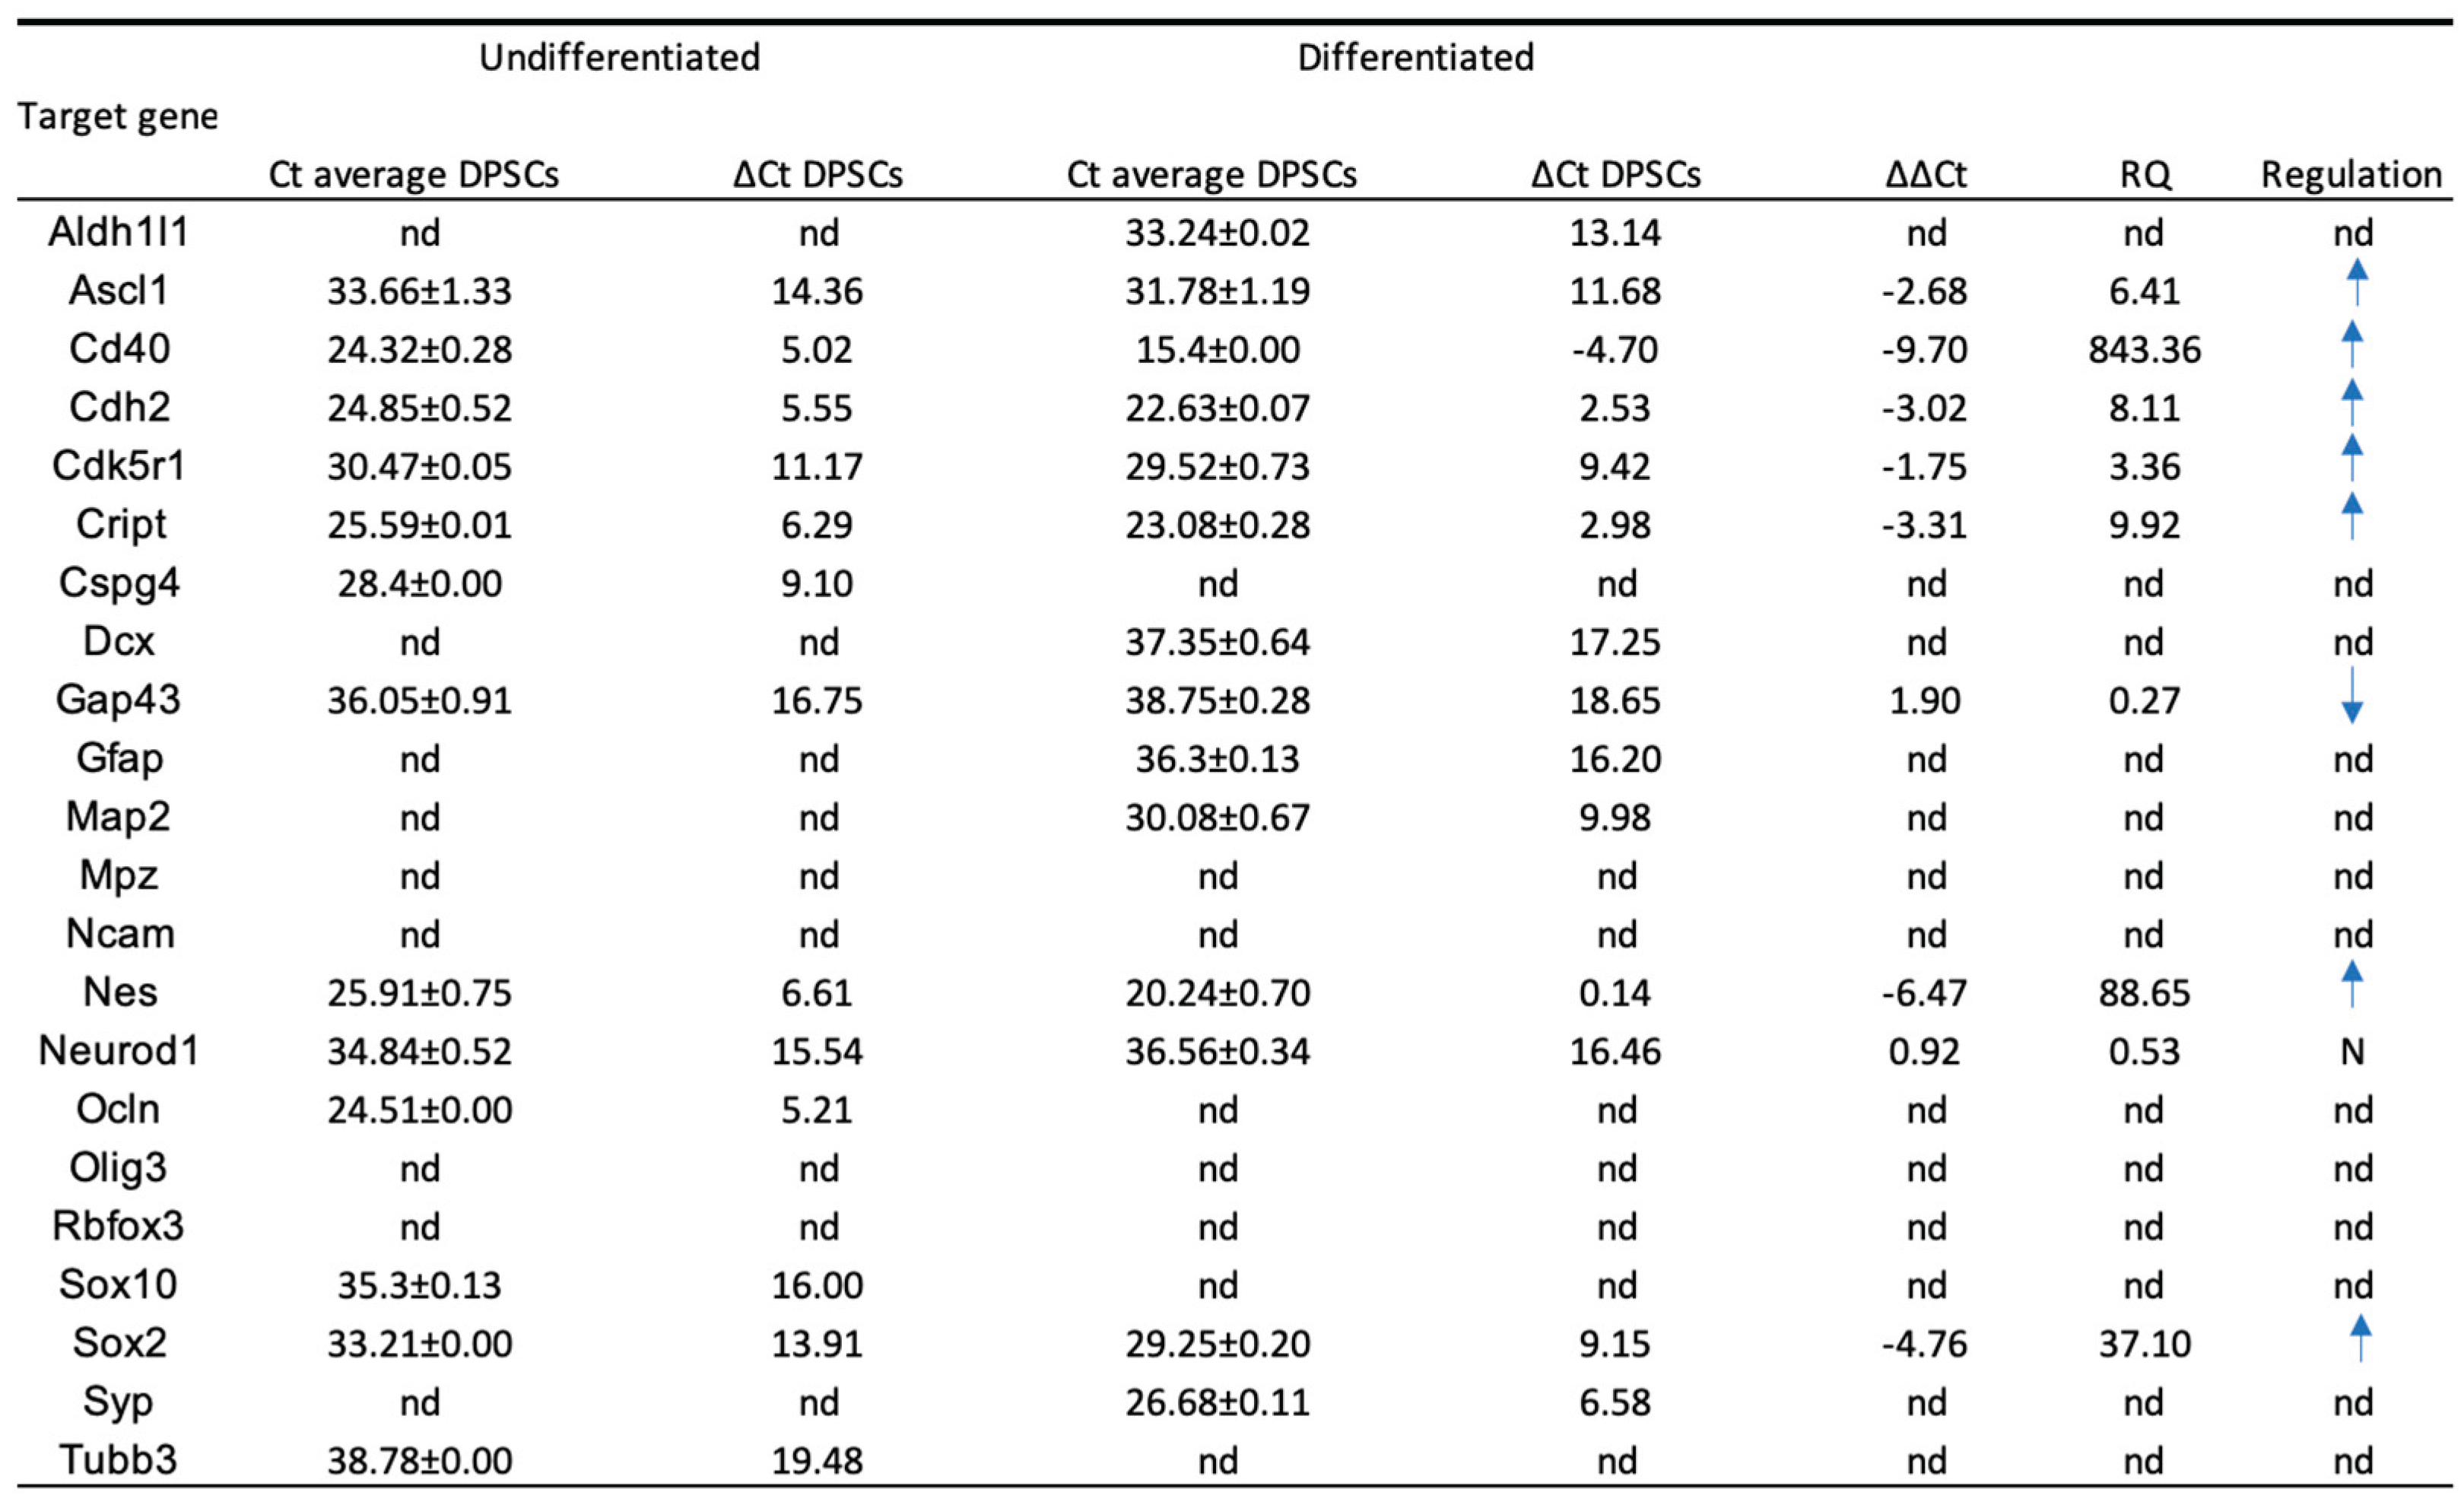 |
Table 5.
Ct, ΔCt, ΔΔCt, and RQ values for all genes under study for hDPSCs exosomes. N = normal; ↑ = upregulated; ↓ = downregulated; nd = nondefined.
Table 5.
Ct, ΔCt, ΔΔCt, and RQ values for all genes under study for hDPSCs exosomes. N = normal; ↑ = upregulated; ↓ = downregulated; nd = nondefined.
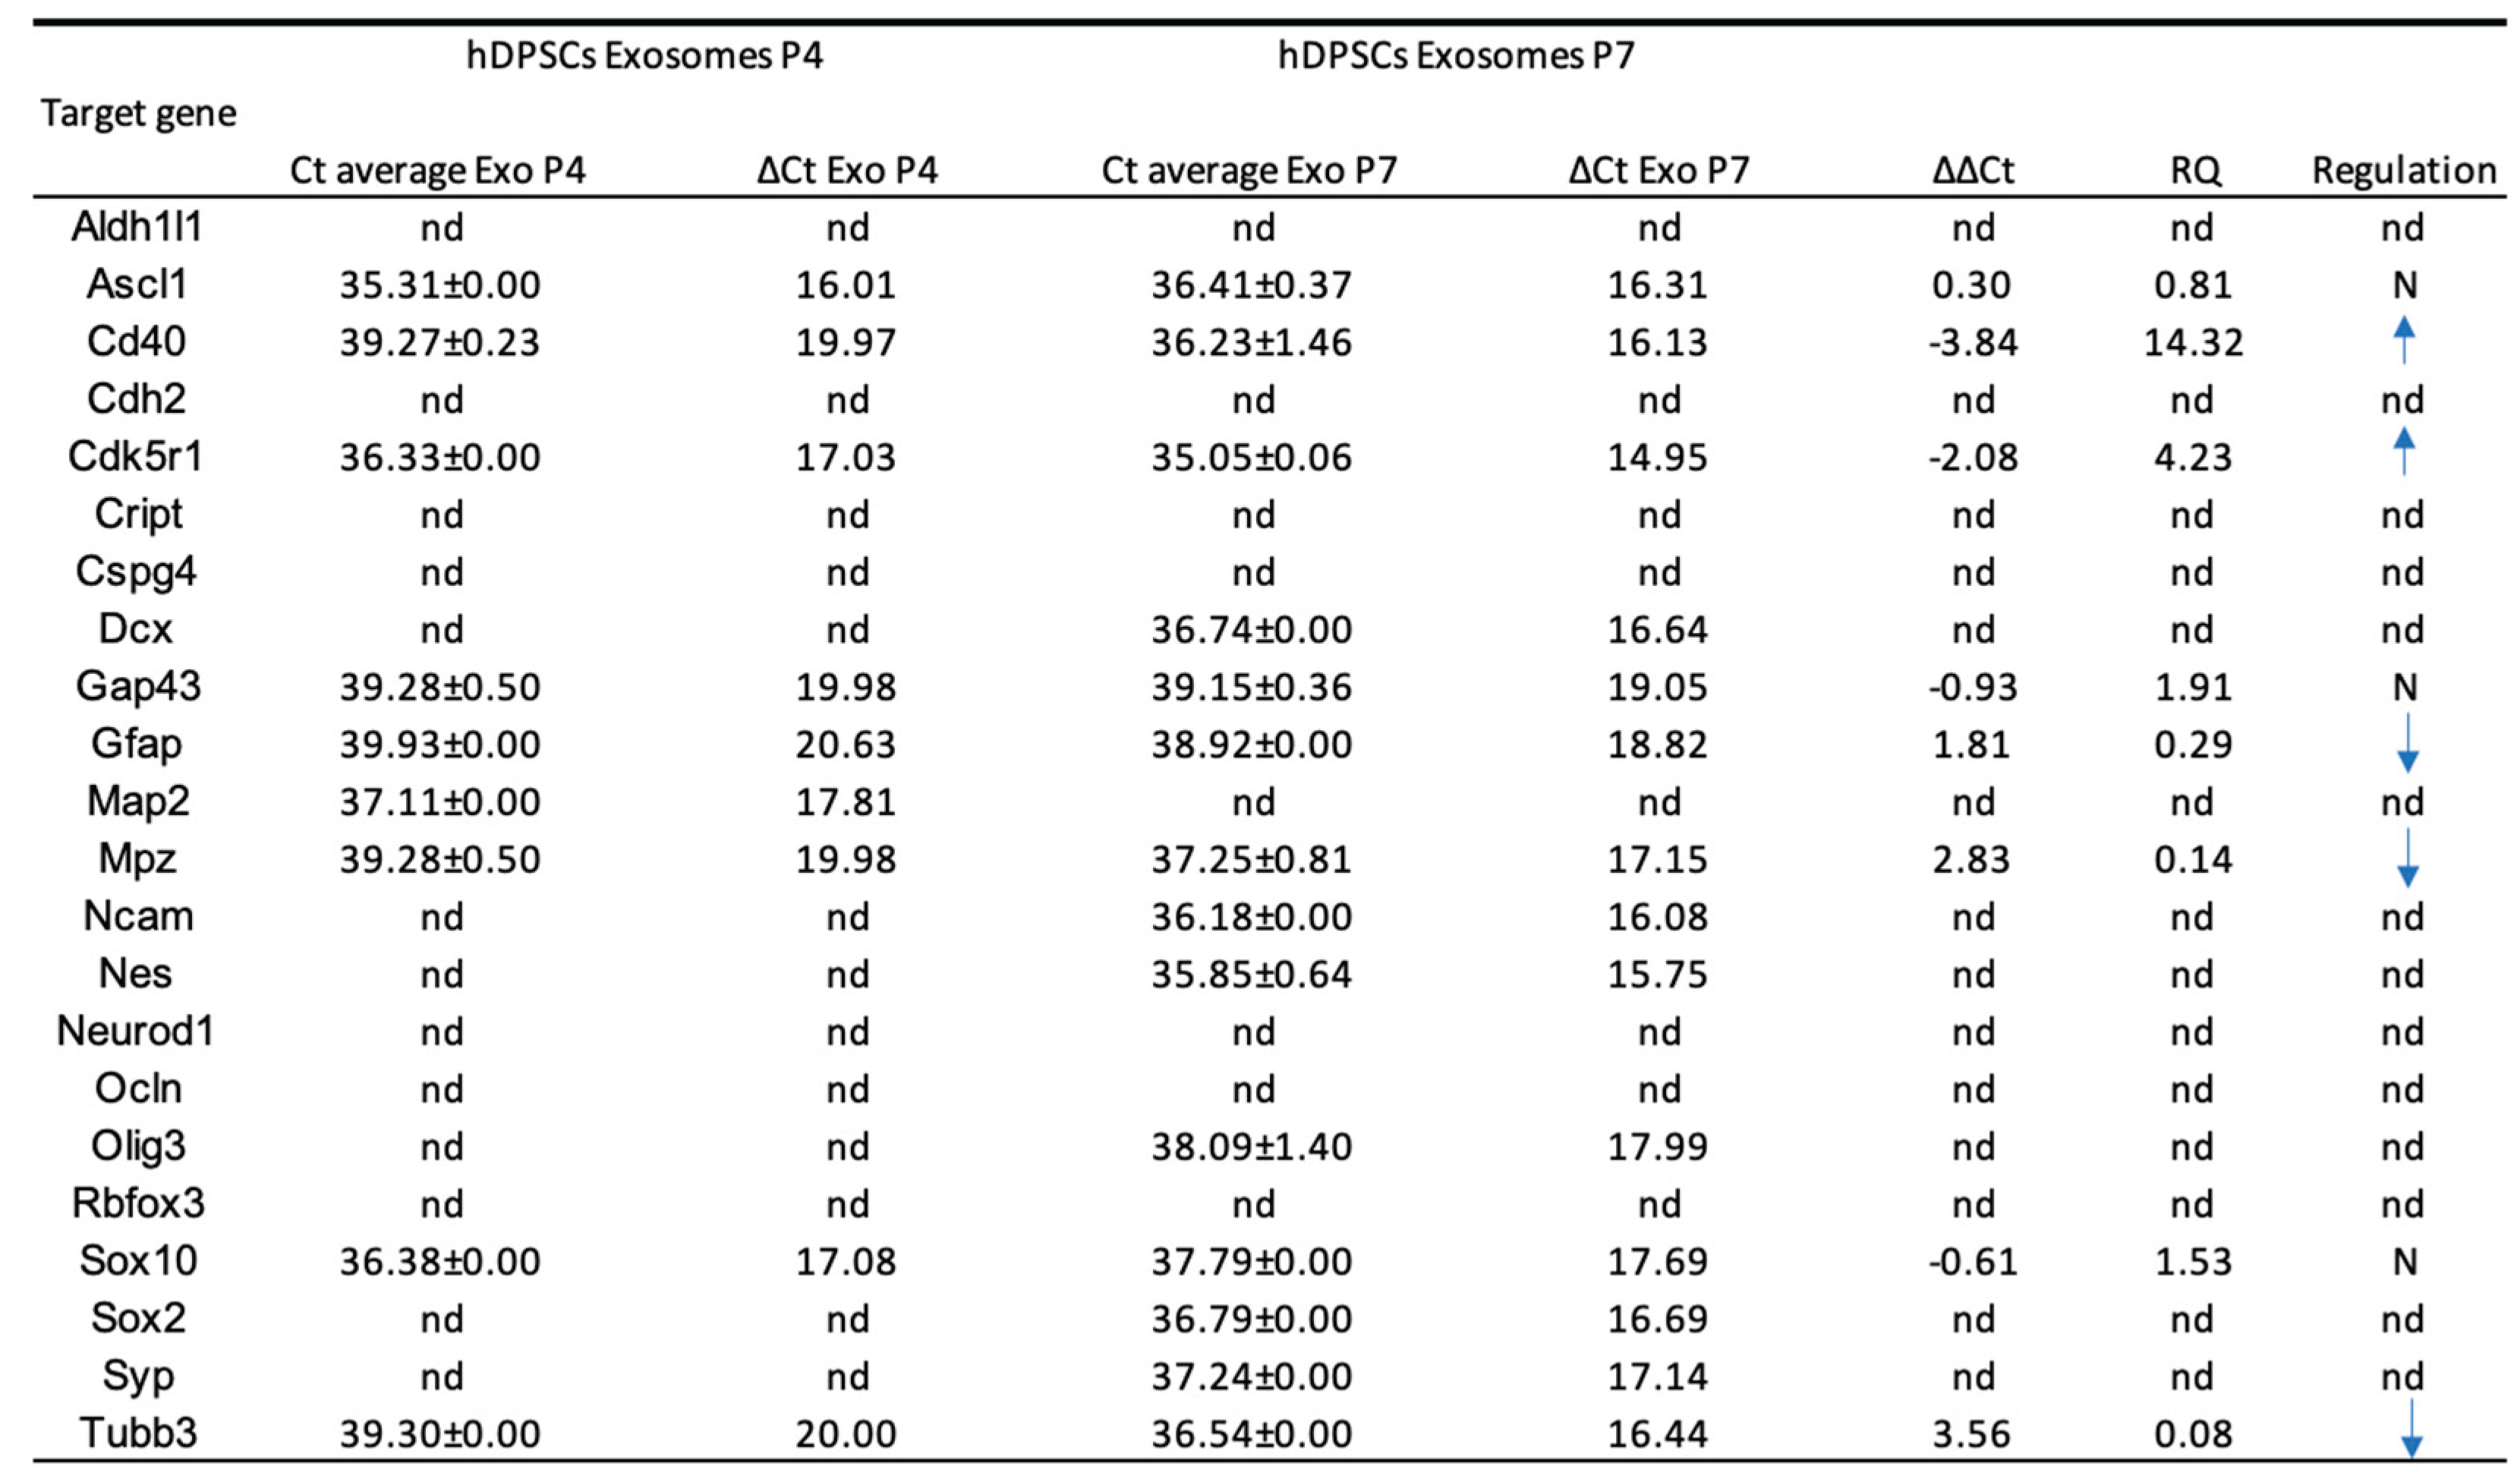 |
Table 6.
Statistical differences identified between groups. Results significances are presented through the symbol (*), according to the p-value, with four symbols, corresponding to p ≤ 0.0001. (ns = no statistically significant differences).
Table 6.
Statistical differences identified between groups. Results significances are presented through the symbol (*), according to the p-value, with four symbols, corresponding to p ≤ 0.0001. (ns = no statistically significant differences).
| Neurodifferentiated hDPSCs CM P4 | Neurodifferentiated hDPSCs CM P7 | CM hDPSCs P4 | CM hDPSCs P7 | Exosomes hDPSCs P4 | Exosomes hDPSCs P7 | |
| Neurodifferentiated hDPSCs CM P4 | ns | **** | ** | **** | **** | |
| Neurodifferentiated hDPSCs CM P7 | *** | *** | **** | **** | ||
| CM hDPSCs P4 | **** | * | ns | |||
| CM hDPSCs P7 | **** | **** | ||||
| Exosomes hDPSCs P4 | ns |
Disclaimer/Publisher’s Note: The statements, opinions and data contained in all publications are solely those of the individual author(s) and contributor(s) and not of MDPI and/or the editor(s). MDPI and/or the editor(s) disclaim responsibility for any injury to people or property resulting from any ideas, methods, instructions or products referred to in the content. |
© 2025 by the authors. Licensee MDPI, Basel, Switzerland. This article is an open access article distributed under the terms and conditions of the Creative Commons Attribution (CC BY) license (http://creativecommons.org/licenses/by/4.0/).
Copyright: This open access article is published under a Creative Commons CC BY 4.0 license, which permit the free download, distribution, and reuse, provided that the author and preprint are cited in any reuse.


