
Submitted:
20 May 2025
Posted:
21 May 2025
You are already at the latest version
Abstract
Dental pulp stem cells (DPSCs), mesenchymal stem cells found in deciduous and permanent teeth, possess multilineage differentiation potential, including neuronal commitment. Their ability to differentiate into neuronal phenotypes holds promise for neurodegenerative disease therapies, cell-based treatments, and tissue engineering. This study investigated the neuronal differentiation potential of DPSCs isolated from the first molar of a healthy 46-year-old female donor. Cells were cultured in a chemically defined medium (ITS 1%: Insulin, Transferrin, Selenium) with or without growth factors (BDNF, GDNF). Phenotypic characterization was performed via Western blot, immunofluorescence, RT-PCR, and flow cytometry. Undifferentiated DPSCs expressed mesenchymal (CD105, CD90, CD73, CD13) and neural/stem cell markers (βIII-tubulin, GFAP, Nestin, SOX2, Oct3/4, NANOG) but lacked hematopoietic markers (CD45, CD34, CD31, CD14). After 15 to 35 days in vitro (DIV) in ITS medium plus GDNF, DPSCs exhibited upregulated mature neuronal markers (NeuN, NF-M) and downregulated mesenchymal markers, confirming neuronal commitment. Electrophysiological analysis (whole-cell patch-clamp) revealed more hyperpolarized resting membrane potentials (RMP) in GDNF-treated cells (15 DIV) compared to controls (DMEM/F12 + 10% FBS), alongside increased membrane capacitance (Cm) and input resistance (Rin), suggesting progressive neuronal maturation. While action potentials were not observed, these electrophysiological shifts indicate early functional differentiation. In conclusion, prolonged GDNF exposure (15–35 DIV) in a chemically defined medium promoted DPSCs differentiation into a mature neuronal phenotype, marked indicated by NeuN expression and altered membrane properties. These findings highlight DPSCs as a viable tool for regenerative medicine and neurodegenerative disease research.
Keywords:
Mesenchymal stem cells
; Dental Pulp Stem Cells
; neuronal differentiation
; growth factors
; BDNF
; GDNF
; chemically defined medium
; neurodegeneration
; NeuN
; passive membrane properties
; electrophysiology
1. Introduction
Mesenchymal stem cells (MSCs) are capable of differentiating into the lineages of the three germ layers: ectoderm, mesoderm, and endoderm, depending on the microenvironmental conditions. In vitro, it depends on the culture media and supplements used to induce differentiation of the MSCs. Based on its origin, the multi-lineage potential, the secretion of anti-inflammatory molecules, and the immunoregulatory effects [1]. MSCs are considered a source of cells with possible applications for cell therapy in the treatment of autoimmune, inflammatory diseases, and degenerative diseases; moreover, they constitute a useful tool for disease modeling.
The International Society of Cell Therapy established that the expression of a specific set of cell surface markers is one of the essential characteristics of MSCs [2], in particular the presence of CD73, CD90, CD105, and the absence of CD14, CD34, CD45, and HLA-DR. Other criteria to recognize MSCs are their capability to differentiate into three lineages: adipocytes, chondrocytes, and osteoblasts [3].
MSCs are present not only in fetal tissues, but also in many adult tissues, such as bone marrow [4], adipose tissue [5], dental tissue [6], menstrual blood [7], peripheral blood [8], salivary glands [9], skin and foreskin [10].
Dental pulp is a soft connective tissue confined in the pulp chamber and is a source of stem cells. Dental pulp stem cells (DPSCs) have a high proliferative capacity and differentiate into odontoblasts, osteoblasts, and chondrocytes to produce dentin tissues, bone, and cartilage, respectively, for the repairing process. DPSCs mainly derive from cranial neural crest cells during embryonic development, and maintain the expression of GFAP, HNK-1, Nestin, P75, S-100, and βIII-tubulin markers of neural stem cells [11].
DPSCs have the capability for self-renewal, which is why they can proliferate for several passages without losing their stemness. These cells represent a unique source of adult stem cells, which are relatively easy to obtain through non-invasive techniques from DPSCs as compared with other sources of adult stem cells [12]. DPSCs could model chronic degenerative diseases and may have therapeutic applications.
Several studies have demonstrated that among the 8 types of mesenchymal cells that can be obtained from a tooth, DPSCs, are the ones with the most potential for neurogenic differentiation [13]. As we mentioned, DPSC have a common embryological origin with the cells of the nervous system as from the neural crest, in addition, they have high rates of proliferation, being able to expand in vitro in a few weeks, they can be obtained in a less traumatic and simple way, compared with other mesenchymal stem cells, which is why they have been considered as ideal candidates for neuronal regeneration therapy. They could be used for cell therapy in pathologies such as cerebrovascular, ischemia, traumatic brain injury, and neurodegenerative diseases, such as Parkinson's, Huntington´s, and Alzheimer´s [13,14].
DPSCs can be differentiated into different cell types, including odontoblasts, osteoblasts, chondrocytes, cardiomyocytes, neuronal cells, adipocytes, epithelial cells, melanocytic cells, and β-pancreatic cells in different inductive media [15].
DPSCs have been differentiated in vitro by Miura and collaborators, obtaining active and functional neurons [16]. In animal models, after implanting, these cells were able to integrate and survive in the neural tissue of the host, adopting a neural phenotype and promoting neurogenesis [14]. DPSCs under conditions of neuronal differentiation, with growth factors and cytokines, have been shown to express neuronal markers such as Nestin, βIII-tubulin, GFAP, and NF [17]. Exposure to specific microenvironment signals induces the differentiation of DPSCs into active neurons, in addition to coordinating axonal and stromal cell guidance, inducing neuroplasticity, and improving neurological dysfunction caused by stroke in animal models after transplanting these cells [18].
Patient-derived mesenchymal cells from different stem cell niches, such as Dental tissue, to model degenerative diseases, will allow a better understanding of the molecular processes involved in neurodegenerative diseases and the possible design of therapeutic strategies. Here, we propose the use of DPSCs, to obtain neuronal cells through the induction of differentiation by neurotrophic factors.
2. Materials and Methods
Isolation and Primary Culture of DPSCs
This study was conducted by the Declaration of Helsinki and approved by the Research and Ethics Committees of the Research Division of the School of Medicine-UNAM. (Project No. FM/DI/023/2017).
DPSCs were obtained from the first molar of a 46-year-old apparently healthy Mexican female volunteer (without cognitive impairment), a product of a routine tooth extraction with her informed consent, and this work was approved by the Research and Ethics Committee of the School of Medicine of the National Autonomous University of Mexico (UNAM) (https://drive.google.com/drive/folders/1JzUgQO80CblAuRCeWSs23dXPyWaxFiMJ?usp=drive_link).
The dental piece was transferred and kept in a saline solution at 4° C before digestion to preserve the integrity of the sample. The tooth was transversely sliced with a dental micromotor. The dental pulp was isolated with number 5 sterile forceps and immersed in a digestion solution (3 mg/ml type I collagenase/dispase in DMEM-F12). After incubating for 45 minutes at 37° C, with shaking every 10 minutes, the enzymes were inactivated with culture medium, DMEM-F12 plus 10% FBS, and resuspended in fresh medium. DPSCs were seeded in a 25 cm2 bottle with complete culture medium (DMEM-F12 with 10% inactivated fetal bovine serum, 2 mM L-glutamine, 100 U / ml penicillin, and 100 mg/ml streptomycin) and the bottle was placed in an incubator at 37° C and 5% CO2 in air. DPSCs expanded to 70% confluence. Cell passages were performed with 0.05% trypsin-EDTA. Cryopreservation was performed in complete DMEM-F12 medium plus 10% DMSO at -70 ° C. All culture reagents were purchased from Invitrogen.
Phenotype Characterization by FACS
MSCs were characterized based on their expression of cell markers, morphology and differentiation potential. Phenotypic markers evaluated: CD90 PE-Cy5, CD73 PE-Cy7, CD13 APC, HLA-ABC FITC, HLA-DR PE, CD45 PE, CD34 APC, CD31 FITC, CD14 FITC (BD Biosciences, San Diego, CA, USA) and CD105 PE (Biolegend, San Diego, CA, USA), were used for immunophenotypic characterizations and analyzed by FACS Canto II flow cytometer (BD Bioscienses, San Diego, CA, USA) and the data were analyzed with FlowJo 10 software (FlowJo LLC, Ashland, OR, USA). Adipogenic differentiation was induced for 21 days in the presence of Dexamethasone, 3-Isobutyl-1-methylxanthine, insulin, and indomethacin. Adipogenic differentiation was determined by visualizing the presence of Oil Red O- stained (Sigma-Aldrich, St. Louis, MO, USA) lipid vacuoles. Osteogenic differentiation was induced during 21 days with Dexamethasone, β-Glycerophosphate, Ascorbic acid, and 2-Phospho-L-ascorbic acid. Osteogenic differentiation was assessed by alkaline phosphatase staining (FAST BCIP/NBT, Sigma-Aldrich). Chondrogenic differentiation was induced during 21 days with Dexamethasone, Sodium pyruvate, Proline, 2-Phospho-L-ascorbic acid, ITS, and TGF-β and was evaluated with Alcian blue dye (Sigma-Aldrich) [19].
Neural Differentiation of DPSCs
DPSCs were grown in complete medium: DMEM-F12 plus 10% FBS (inactivated) in a T25 Culture bottle until a 70-80% confluence was reached. Subsequently, a subculture was performed at a density of 200,000 cells per 25 cm2 bottle in DMEM-F12 complete culture medium with 10% FBS for 24 h, next the medium was changed to a chemically defined medium: Madium ITS (Insulin, Transferrin and Selenium) 1% medium (based on the culture medium reported by [20,21] containing: DMEM-F12, 2 mM L-glutamine, 100 U/ml penicillin, 100 mg /ml streptomycin, 0.1 M putrescine 10 µM progesterone, and 1% of a mixture of Insulin-Transferrin-Selenium (ITS) supplemented with 5 ng/ml of bFGF and 5 ng/mL of EGF for 3 d. This process is called transition, and after 3 days, a subculture is performed and changed to the differentiation medium: ITS 1% medium, plus the combination of neurotrophic factors as indicated:
- 1% ITS medium + 20 ng / mL BDNF
- 1% ITS medium + 20 ng / mL GDNF
- 1% ITS medium + 20 ng / mL BDNF + 20 ng / mL GDNF
- Medium ITS 1% without growth factors.
The cells were kept in this medium for 5 or 35 days, with medium change every third day.
DPSCs Differentiation
DPSCs are grown in complete medium DMEM-F12 plus 10% FBS until a density of 1,000,000 cells per 25 cm2 bottle is reached (70-80% confluence). Subsequently, a subculture is performed at a density of 200,000 cells per 25 cm2 bottle in DMEM-F12 culture medium with 10% FBS for 24 hours; It is replaced by the chemically defined medium ITS 1% (based on the culture medium reported by [20,21] (DMEM-F12, 2 mM L-glutamine, 100 U / ml penicillin, 100 mg/ml streptomycin, 0.1 M putrescine, 10 µM progesterone and 1% of a mixture of Insulin-Transferrin-Selenium (ITS) supplemented with 5 ng/ml of bFGF and 5 ng/mL of EGF for 3 days, this process is called transition. After 3 days a subculture is performed in the medium ITS 1% plus the combination of neurotrophic factors as indicated: a) Medium ITS 1%, b) Medium ITS 1% + 20 ng/mL BDNF, c) Medium ITS 1% + 20 ng/ml GDNF, d) Medium ITS 1% + 20 ng/ml BDNF + 20 ng/ml GDNF. The cells were kept in these media for 5 or 35 days, with a medium change every third day for their subsequent evaluation by immunodetection, endpoint PCR, and electrophysiology.
RNA Extraction
RNA extraction from differentiated DPSCs was performed with the Zymo Research Quick-RNA ™ MicroPrep (Plus) KIT (catalog number R1057). The adherent cells were removed from the medium, and 100 µl of lysis solution was added. Lysates were collected and centrifuged at 12,000 rpm for 1 min. The supernatant is transferred to an RNase-free tube, 1 volume of 100% ethanol is added, mixed, and transferred to a Zymo-Spin column with a collecting tube and centrifuged for 30 s at 12,000 rpm. The liquid is discarded from the collector; the column is pre-washed with 400 μL of RNA wash solution and centrifuged for 30 s at 12,000 rpm. The liquid in the collector is discarded and 40 μL of DNase I (DNase I2 5 μl + DNA digestion solution 35 μL) are added to the column, incubated at 25° C for 15 min, centrifuged for 30 s at 12,000 rpm, the liquid is discarded from the collection tube, 400 μL of Prep RNA solution are added to the column, centrifuge for 30 seconds at 12,000 rpm and dry the contents of the collection tube. 700 µl of RNA wash solution is added to the column, centrifuged for 30 s at 12,000 rpm, and the collecting tube is discarded. 400 μL of RNA wash solution is added and centrifuged for 2 min at 12,000 rpm until the wash solution is completely removed. The column is transferred to an RNase-free tube, and 15 µL of RNase-free water is placed directly on the column and centrifuged for 30 s. The eluted RNA is stored at -70° C.
Retro-Transcription
BIOLINE's Tetro reverse transcriptase system (catalog number BIO-65050) was used. The samples were mixed according to the following scheme:
Total RNA 5 μg μL, Ramdom hexamers (40 μM) 1 ul, 10 mM dNTPs mixture 1 ul, 5x Buffer RT, 4 ul, RiboSafe Rnase Inhibitor 1 ul, Tetro Reverse Transcriptase (200 u/μL) 1 ul, Treated water DEPC up to 20 μL.
Incubate for 10 minutes at 25° C followed by another incubation at 45° C for 30 minutes. The reaction is stopped by incubating at 85 ° C for 5 minutes and stored at -20° C or used in PCR.
Endpoint PCR
Amplification of DPSCs characterization and neuronal differentiation genes was performed using the BIOLINE MyTaq ™ DNA Polymerase PCR KIT (catalog number BIO-21105), under the following reaction:
5x Taq Reaction Buffer BIOLINE 4 μL, cDNA, forward primer (0.1 μg / μL), (Table 4) 1 μL, reverse primer (0.1 μg/μL) (Table 1) 1 uL, DNA polymerase BIOLINE 0.3 μL, Sterile H2O molecular biology grade (the volume needed to reach the final volume of 20 μL) for 20 μL, Total for 1 reaction 20 μL
Amplification cycle: Initial denaturation 95° C 5 min, Denaturation 95° C 45 s, Alignment 45 s, Extension 72° C 45s, for 40 cycles and a final extension at 72o C of 7 min.
Reactions were visualized in a transilluminator with ethidium bromide-stained agarose gels.
Protein Extraction
The culture medium was removed, and the cells were washed with Glucose Buffered Saline, GBS (5.4 mM KCl, 138 mM NaCl, 22 mM glucose, 2 mM Na-KPO4, pH 7.2) at 4° C or with PBS (phosphate buffered saline, pH 7.4). Cold RIPA 1x buffer (1X PBS, 1% (w/v) NP-40 (Fisher Scientific), 0.1% (w/v) SDS, and 0.5% (w/v) desoxycholate containing protease/phosphatase inhibitors (1 mM AEBSF (Gold Biotechnology, St. Louis, MO), 20 mg/ml of leupeptin and pepstatin (US Biochemicals, Cleveland, OH), 10 mM NaF, 1 mM Na orthovanadate, 20 mM β-glycerophosphate (Sigma) was added directly to the plate (100-150 µl per well for a 6-well plate, or 200 µl for a T-25 box). It was incubated for 5 min on ice, shaking manually to completely detach the monolayer. The lysate was transferred to a 1.5 ml tube and frozen -20° C for 16 h. The next day, the sample was thawed and resuspended before centrifuging at 14,000 rpm for 10 min at 4° C. The supernatant was transferred to a clean tube, and an aliquot was taken to determine the protein content by the protein BCA assay (bicinchoninic acid, colorimetric assay, from PIERCE, Thermo Fisher Scientific).
Western Blot
Cells were lysed in RIPA 1x buffer (4X PBS, 0.4% SDS, 4% NP-40, 2% sodium deoxycholate, 1000x AEBSF, 10 mg/ml aprotinin, 10 mg/ml leupeptin, pepstatin at 2 mg/ml, benzamidine at 500 mM, β-glycerophosphate at 50x, NaF at 1mM, O-vanadate at 250 mM, EDTA at 0.5 M pH 8, EGTA at 0.5 M pH 8). Each 10 µg protein sample was subjected to SDS-PAGE (SDS-polyacrylamide gels with a concentration of 8 to 10%), and the separated proteins were transferred to 0.22 mm nitrocellulose membrane. The membranes were incubated with primary antibodies (Table 3), followed by secondary antibodies according to the species of the primary, and were visualized using chemiluminescence (ECL). The images were acquired from the image system MicroChemi (DNR). The densitometry of the protein bands was analyzed using the Fiji ImageJ software.
Immunocytofluorescence
Cells were fixed in 4% (m / v) paraformaldehyde in phosphate buffer (PBS) for 15 min and washed 2 times with GBS for 10 min. Fixed cells were permeabilized by incubation in 0.25% (m / v) Triton X-100 in PBS for 10 minutes, non-specific binding was blocked by incubating with 1% (m / v) bovine serum albumin (m / v) in PBS for 30 minutes. Subsequently, cells were incubated with primary antibody overnight in Triton PBS and 1% BSA, washed, and incubated with secondary fluorescein antibodies Alexa 488 or Alexa 546 (Thermo Fisher Scientific) in PBS plus 1% BSA for 1 hour, and nuclei stained with DAPI. at 10 μg/ml for 10 minutes. The coverslips were mounted with Fluorogel (Electron Microscopy Sciences) and allowed to dry overnight.
Confocal Microscopy
In each experimental group, a minimum of 5 fields from three experiments of a replicate, randomly selected cells obtained from three separate experiments of differentiation, were analyzed. Images were captured under confocal microscopy Leica TCS SP8 microscope the z-sections were processed and analyzed using FIJI ImageJ. All images presented here are maximum intensity projections of these z sections unless otherwise noted.
Electrophysiology
Patch-clamp measurements were recorded with the Axopatch 200-A amplifier (Axon Instruments, Foster City, CA, United States). Data were acquired with a sampling rate of 20 kHz and low-pass filtered (4 kHz). To measure the passive properties of the membrane, depolarization pulses of 10 mV for 200 ms were applied, with a holding potential of -80 mV. The data were analyzed using pCLAMP 8.0 (Axon Instruments, Foster City, CA, United States). The pipettes had a resistance of between 4-5 MΩ. The standard pipette solution (pH 7.2) contained (in mM): 2 MgCl2, 125 KCl, 10 HEPES, 1 CaCl2, 10 EGTA, 2 Mg-ATP, 2 Na2ATP. The bath solution (pH 7.4) contained (in mM): 2 CaCl2, 145 NaCl, 2 MgCl2, 10 HEPES, 1.5 KCl, and 10 glucose.
Statistics
Statistical analyses were conducted using GraphPad Prism 7.0 (GraphPad Software, La Jolla, CA, USA) to evaluate expression differences among the different treatments and conditions. Data are presented as mean ± standard deviation. For analysis involving multiple groups, one-way or two-way ANOVA with post hoc Fischer’s or Tukey’s, or Bonferroni’s test (as appropriate) was used. For all other comparisons (including inter-group comparisons), Student’s t-test was used. For all purposes, p≤0.05 was considered as statistically significant.
3. Results
3.1. Establishment and Characterization of Mesenchymal Stem Cells from Dental Pulp.
Mesenchymal stem cells derived from dental pulp (DPSCs) exhibit self-renewal capacity, allowing them to proliferate while maintaining an undifferentiated state. The major advantage of DPSCs is that they are non-genetically modified and possess multipotent differentiation capacity. Stem cells of dental pulp were isolated from the first molar of a healthy donor of 46 years of age. DPSCs cultured showed fibroblastic-like morphology, with large cytoplasm and presented partially homogenous orientation at high densities, and proliferation through the in vitro passages (Figure 1A). The "Mesenchymal and Tissue Stem Cell Committee" of the International Society of Cell Therapy proposed the minimum criteria to define human mesenchymal cells [2]: 1) ability to adhere to plastic; 2) the expression pattern of the surface markers known as "Cluster of Differentiation", being positive for CD105 (endoglin), CD73 (5'-nucleotidase) and CD13 (alanyl-aminopeptidase), and negative for CD45, CD34, CD14 Or CD11b, CD79 or CD19 and surface molecules such as HLA-DR; and 3) the potential to differentiate in vitro to osteoblasts, adipocytes and chondroblasts. According to the above criteria of MSCs classification, we characterized our cultures through the expression of CD90 PE-Cy5, CD73 PE-Cy7, CD13 APC, HLA-ABC FITC, HLA-DR PE, CD45 PE, CD34 APC, CD31 FITC, CD14 FITC, and CD105 PE for immunophenotypic characterizations and analyzed by FACS Canto II flow cytometer (Figure 1B). We performed the complete profile of DPSCs markers expression evaluation by flow cytometry (Figure S1), and it correlated with the mesenchymal phenotype. A normal karyotype of a 46-year-old female was confirmed with a chromosome number of 46, with the finding of an increase in normal centromeric heterochromatin on chromosome 16 (16qh +) obtained by the G-band karyotype technique (Figure 1C); this finding is not relevant to the present investigation.
Mesenchymal cells are considered progenitor cells capable of responding to specific differentiating stimuli. To confirm the above, we carried out an in vitro differentiation test. Adipogenic differentiation was induced for 21 days in the presence of Dexamethasone, 3 Isobutyl-1-methylxanthine, insulin, and indomethacin. Adipogenic differentiation was confirmed by Oil Red O- staining of the lipid vacuoles (Figure 1D). Osteogenic differentiation was induced during 21 days with Dexamethasone, β-Glycerophosphate, Ascorbic acid and 2-Phospho-L-ascorbic acid. Osteogenic differentiation was confirmed by alkaline phosphatase staining (Figure 1D). Chondrogenic differentiation was induced during 21 days with Dexamethasone, Sodium pyruvate, Proline, 2-Phospho-L-ascorbic acid, ITS, and TGF-β and was confirmed with Alcian blue dye, (Figure 1D). These phenotypic changes were observed under the light microscope and confirm that the DPSCs used in our study retained the characteristic plasticity of MCS by differentiating into chondroblasts, osteoblasts, and adipocytes with the inducing media, in addition to expression of corresponding phenotypic markers and their adherence to the plastic (Figure 1).
The mesenchymal phenotype of DPSCs is corroborated by the expression of the main markers: CD105 and CD73 by immunofluorescence. CD105 (Endoglin) is a protein associated with the Transforming Growth Factor Receptor β (TGFβR). CD73 is an enzyme (5'-nucleotidase, 5'-NT) encoded by the NT5E gene (Mokry et al., 2010), used as a marker of differentiation of lymphocytes and MSCs (Figure 2A).
DPSCs are derived mainly from cranial neural crest cells during embryonic development, and maintain the expression of markers such as GFAP, HNK-1, Nestin, P75, S-100, and βIII Tubulin markers for neural stem cells. We evaluated by immunofluorescence and end point RT-PCR the expression of some relevant markers such as Ki67 (proliferation) and neural markers (Nestin, GFAP and βIII Tubulin), showing neural characteristics when cultured in the growing medium (with 10% of FBS) without being induced to differentiate in the chemical defined medium (ITS 1% plus growth factors) (Figure 2).
DPSCs, in addition to expressing mesenchymal (CD105, CD73, and CD13) (Figure 3A) and neural markers (Nestin, GFAP, and βIII Tubulin) (Figure 3B), also express embryonic stem cell pluripotency markers, such as Oct4, Nanog, Sox-2, SSEA-4, and TRA-160. We evaluated the expression of Nanog, Oct4, and Sox-2 by Western blot technique (Figure 3C). Together, these data confirm the mesenchymal identity and differentiation capacity of the DPSCs used in this study.
3.2. Transition and Differentiation of DPSCs
Numerous studies have been conducted to establish effective culture strategies that promote the differentiation of mesenchymal cells from the dental pulp to the neuronal lineage. First, we cultivate the DPSCs in medium containing 10 % of DMSO, then we changed the medium to a chemically defined culture medium (Insulin Transferrin Selenium 1%) plus 5 ng/ml of bFGF and 5 ng/ml of EGF, to induce changes in the morphology of the DPSCs, which is known as a transition process. The morphological changes that we observed were cells with neurite-like extensions, a decrease in the cytoplasmic area, and radial forms (Figure 4A). After this process, we subcultured the cells to induce their differentiation under different conditions with the neurotrophic factors BDNF and/or GDNF (Figure 4B-D).
We induced the differentiation of the mesenchymal cells of the dental pulp under different conditions Medium ITS at 1%, Medium ITS at 1% + BDNF, Medium ITS at 1% + GDNF, and Medium ITS at 1% + BDNF + GDNF, follow the changes in morphology for 5, 24 and 35 days. We observe that BDNF induces bipolar morphology and neurite-like extensions at 5 DIV (Figure 4B) while GDNF induces, to a lesser extent, fine neuritic growth and the development of bipolar cells with the presence of fibroblastic forms (Figure 4C). Under a combination of trophic factors (BDNF + GDNF), we observed neuroblast and fibroblast morphologies (Figure 4B-D). ITS 1% alone induces neural forms to a lesser extent, and the presence of fibroblastic morphology.
We evaluated the expression of markers of DPSCs subjected to differentiation during 5 DIV with neurotrophic factors and basal differentiation medium (chemically defined medium) (ITS 1%), and observed that during the differentiation process the expression of the Ki67 (proliferation marker) was lost, and the presence of the glial marker GFAP was not detectable (Figure 5) but DPSCs in these conditions maintain the expression of neural markers such as Nestin and βIII Tubulin, nevertheless the expression of mesenchymal markers, such as CD105 and CD73, decreases (Figure 6).
Culture of DPSCs differentiated for 35 DIV showed the presence and preservation of cells with predominant neuronal morphology in the conditions of defined medium (ITS 1%) plus BDNF or GDNF (Figure 4). To confirm this, we performed end-point PCR of the mature neuronal marker NeuN and the mesenchymal markers CD166 and CD146, and we found an evident increase in NeuN expression with a decrease in CD166 and CD146 expression (Figure 7).
Finally, we evaluated passive membrane properties of the DPSCs cultures under two culture conditions: in complete medium (DMEM/F12 + 10 % FBS) and in Defined medium (ITS 1% + GDNF for 15 days). Passive membrane properties refer to the intrinsic electrical characteristics of a cell membrane that determine how it responds to subthreshold electrical signals (i.e., signals that do not trigger action potentials). These properties govern the passive spread of electrical signals such as electrotonic potentials across the membrane. The key passive membrane properties include: Membrane Capacitance (Cₘ) and Input Resistance (Rᵢₙ). We measured these two properties and the resting potential.
We found that DPSCs cultured for 15 days in the differentiation medium (Defined medium ITS 1% + GDNF) had more negative RMP, an increase in the capacitance, and an increase in the input resistance as compared to DPSCs cultured in complete medium with 10%FBS) (Figure 8), all of this changes point to a more mature phenotype and more functional stage of these cells when cultured in the differentiation medium (Defined medium ITS 1% + GDNF).
4. Discussion
The term stem cell can be applied to a diverse group of cells with two properties: 1) prolonged or unlimited capacity for self-renewal under controlled conditions, and 2) potential to differentiate into a variety of specialized cells. The neural differentiation of DPSCs is clinically relevant due to the possibility of obtaining patient-specific cells for the treatment of neurological diseases. The stem cells of the dental pulp are multipotent, so neural differentiation should, in principle, be achievable, generating neuronal cells with mature electrophysiological properties.
In this work, mesenchymal stem cells were isolated from the dental pulp of an apparently healthy volunteer's first molar by enzymatic treatment [22]. The isolated DPSCs showed adherence to the polystyrene culture plate. Nevertheless, the adhesion properties are not sufficient to classify this cell population as MSCs [23,24]. There are studies in which fibroblasts, macrophages, and some hematopoietic cell lines can adhere to plastic and present morphological characteristics similar to those of MSCs [25]. Furthermore, cell density may also be an influencing factor in the ability of MSCs to adhere to plastic, since low density allows mesenchymal cells to adhere more quickly to plastic [26,27].
DPSCs showed fibroblast-like morphology with a defined orientation at high confluence, fibroblast-like morphology has been reported in mesenchymal stem cells derived from bone marrow and in various dental tissues, giving a characteristic profile of DPSCs [22,28,29].
The "Mesenchymal and Tissue Stem Cell Committee" of the International Society for Cell Therapy proposed the minimum criteria to define human MSCs: 1) ability to adhere to plastic; 2) the expression pattern of the surface markers known as "Cluster of Differentiation", being positive for CD105, CD73, and CD90, and negative for CD45, CD34, CD14 or CD11b, CD79 or CD19 and surface molecules such as HLA-DR; and 3) the potential to differentiate osteoblasts, adipocytes, and chondroblasts in vitro [3,30].
Different methods of isolation and expansion of DPSCs have been reported, and their phenotypic characterization has been widely documented [28,31-33]. In the present study, DPSCs were positive for the following MSCs: CD105, CD90, CD73, CD13, and negative for hematopoietic markers: HLA-DR, CD45, CD34, CD31, CD14, detected by flow cytometry, immunofluorescence, endpoint PCR, and Western blot. The expression of these markers agrees with previous findings that indicate that these markers are expressed in MSCs [28,34,35].
When investigating the neural differentiation potential of MSCs, the success of differentiation is based on the expression of neural and neuronal markers such as Nestin, βIII-tubulin, Neurofilament, GFAP, Map2, and NeuN, as well as the electrophysiological properties of excitable cells [36-39]. Neuronal markers such as Nestin, βIII-tubulin, GFAP, and the Ki67 proliferation marker highly expressed in pulp tissue cells, have been identified by immunodetection in human DPSCs [36-39]. Bone marrow MSCs have been reported to be capable of expressing neural genes under incubation in culture media with a high percentage of serum and epidermal growth factor, leading to Nestin and Neurofilament expression [40]. DPSCs have also been reported to be capable of expressing low levels of neural markers [41]. In addition to the expression of neural markers by DPSCs, several studies indicate the production and secretion of neurotrophic factors such as BDNF, GDNF, and nerve growth factor (NGF) [42,43].
We evaluated passive membrane properties of the DPSCs cultures under two conditions: in complete medium (DMEM/F12 + 10 % FBS) and in Defined medium (ITS 1% + GDNF for 15 days) to assess if the culture conditions in medium ITS 1% + GDNF for 15 days could induce a more mature and functionally committed phenotype. Passive membrane properties refer to the intrinsic electrical characteristics of a cell membrane that determine how it responds to subthreshold electrical signals (i.e., signals that do not trigger action potentials). These properties govern the passive spread of electrical signals such as electrotonic potentials across the membrane. The key passive membrane properties include: Membrane Capacitance (Cₘ) and Input Resistance (Rᵢₙ). We measured these two properties and the resting potential. Our findings of an RMP more negative in the condition of ITS 1% + GDNF for 15 days as compared to the cells cultured in complete medium (DMEM/F12 + 10 % FBS) suggest that the cells are differentiating toward a neural phenotype, and the increase in the capacitance (Cm) in the differentiation conditions could be interpreted as the membrane charges/discharges more slowly, slowing signal propagation, and the increase in the input resistance (Rin) corresponds to smaller cells that produce larger voltage changes for a given current. The reduced cell size observed in differentiated conditions further supports their more advanced maturation stage than those that grow in the complete medium in the presence of FBS. When DPSCs differentiate, there are morphological changes that make them smaller and thinner [14,44]. Although DPSCs cultured in ITS 1% + GDNF for 15 days were more differentiated than the ones cultured in complete medium with FBS 10%, they were not finally differentiated because they could not trigger action potentials at this point. Our results are consistent with the data reported by Cortés and colleagues 2016 [45] in relation to GDNF effects in embryonic stem cells, they found that GDNF promotes neuronal differentiation by increasing the yield of differentiated motor neurons, and improving their electrophysiological maturation, thus influencing both commitment and survival during the differentiation process of embryonic stem cells [45]. Furthermore, Bonafina and colleagues 2018, reported that GDNF promotes neuronal differentiation of cortical neural precursors by inhibiting their self-renewal capacity, particularly in the presence of low concentrations of FGF2, and enhances dendritic spine formation in postmitotic neurons, indicating its essential role in cortical development [46]. In relation to the mechanisms of action of GDNF, it has been reported that GDNF binds to the GFRα1 receptor, which is crucial for its signaling pathway. This interaction is enhanced by TGF-β, which facilitates GDNF signaling by localizing GFRα1 to the cell surface [44]. It has been proposed that the inhibition of self-renewal in cortical neural precursors is due to the GDNF/GFRα1 complex that promotes differentiation even in the presence of growth factors like FGF2 [46]. Likewise, the knockout of GDNF in a Zebrafish model showed that its depletion leads to reduced dopaminergic neuron numbers and affects transcription factors related to neuron fate specification, indicating its crucial role in neuronal differentiation [47]. Further experiments are needed to clarify the mechanisms of action of the trophic factor GDNF on stem cell differentiation and maturation.
Our study shows that DPSCs in vitro naturally express immature neural markers. Under special permissive conditions, these cells must acquire neuronal traits and exhibit the expression of βIII Tubulin, GFAP, and Nestin, so it is crucial to induce neural differentiation to its final stage of maturation to increase its therapeutic potential. Our results indicate that DPSCs cultured in the presence of GDNF in a chemically defined medium differentiate into a neuronal phenotype, evidenced by the reduction in the expression of the mesenchymal markers CD105, CD73, and the increased expression of Nestin, β-III Tubulin, and at longer in vitro exposure to this growth factor (at 35 days in vitro), the more mature neuronal marker NeuN is expressed, correlating with more mature passive membrane properties. The efficacy of GDNF as a neurogenic factor depends on the concentration used, which can promote survival, differentiation, or anti-apoptotic activity. Neurotrophic factor concentrations between 12.5 ng/ml and 100 ng/ml have been reported to induce a morphological change, increase in cell survival, maintenance, and neuronal induction in MSCs [48].
GDNF, a significant neurotrophic factor, actively participates in the differentiation of MSCs into cells with neuronal characteristics [49,50]. Investigations have shown that the combined action of GDNF and neurotrophin-3 (NT-3) stimulates the expression of neuronal markers such as MAP-2, Nestin, and Neuron Specific Enolase (NSE) [51,52]. By virtue of these characteristics and its ability to induce neuronal differentiation in MSCs, GDNF presents itself as a valuable alternative for the study and therapeutic implications on various neurological pathologies [53,54].
Since DPSCs’ embryonic origin comes from the neural crest, they could be an ideal stem cell source candidate for the treatment and modeling of neurological and neurodegenerative diseases. The stem cells of the dental pulp have several advantages, including less invasive isolates, ex vivo proliferation, and an inherent propensity to differentiate into neurons and glia. Studies are warranted to explore the therapeutic potential of DPSCs in the treatment of various neurodegenerative diseases, looking for the causes and alterations involved in intracellular signaling.
5. Conclusions
Our findings align with the international criteria for mesenchymal stem cell (MSC) classification [2,11], confirming that dental pulp stem cells (DPSCs) express canonical MSC markers (CD105, CD90, CD73, CD13) while lacking hematopoietic markers (CD45, CD34, CD31, CD14). Additionally, DPSCs exhibited proliferative activity (Ki67) and basal expression of neural markers (Nestin, βIII-tubulin, GFAP), consistent with their neural crest origin. Notably, prolonged exposure (15–35 days) to GDNF in a chemically defined medium induced DPSCs to adopt a more mature neuronal phenotype, marked by morphological changes, upregulation of NeuN, and alterations in passive membrane properties.
These results highlight the potential of DPSCs as a promising tool for regenerative medicine and disease modeling, particularly in neurodegenerative disorders. However, further research is needed to fully characterize DPSC subpopulations using predictive marker profiles and to validate their therapeutic utility through standardized differentiation protocols, functional assays, and electrophysiological studies. Such efforts will be critical to translating DPSC-based therapies into clinical applications and disease modeling.
Supplementary Materials
Figure S1. Complete DPSCs profile of expression. Expression of cell markers was determined by flow cytometry. Results represent positive cells for each particular marker.
Author Contributions
M.-d.-C.S.-L., G.L.-T., V.A.C.-M., J.J.M., and R.S.-C. designed experimental techniques. M.-d.-C. C.-A., M.-d.-C.S.-L., G.L.-T., J.-R.P.-M. F.-A.J.-O., D.E.G and I.L.-R. wrote the article. M.-d.-C.S.-L., G.L.-T., V.A.C.-M., J.J.M., and R.S.-C. Contributed to the design of the figures. M.-d.-C.S.-L., G.L.-T., and M.-d.-C. C.-A. performed the literature search, wrote, and contributed to the design and creation of the figures. M.-d.-C. C.-A., conceived, supervised, wrote, and coordinated its development, and performed final paper revision writing and discussion. All authors have read and agreed to the published version of the manuscript.
Funding
This work was financed by the program PAPIIT/DGAPA/UNAM, grant numbers: IA208118 and IA210620 and to SECIHTI no. 319578.
Institutional Review Board Statement
This study was conducted by the Declaration of Helsinki and approved by the Research and Ethics Committees, from the Research Division of the School of Medicine-UNAM. (Project No. FM/DI/023/2017).
Informed Consent Statement
Informed consent was obtained from all subjects involved in the study. (https://drive.google.com/drive/folders/1JzUgQO80CblAuRCeWSs23dXPyWaxFiMJ?usp=drive_link).
Acknowledgments
We would like to thank the postdoctoral program from DGAPA/UNAM (2018–2020) for the fellowship granted to Maria-del-Carmen Silva-Lucero.
Conflicts of Interest
The authors declare that this research article was prepared in the absence of any commercial or financial relationships that could be construed as potential conflicts of interest.
Abbreviations
The following abbreviations are used in this manuscript:
| MSCs | Mesenchymal Stem Cells |
| DPSCs | Dental Pulp Stem Cells |
| BDNF | Brain-derived Neurotrophic Factor |
| GDNF | Glial-derived Neurotrophic Factor |
| ITS | Insulin Transferrin Selenium |
References
- Figueroa, F.E.; Carrion, F.; Villanueva, S.; Khoury, M. Mesenchymal stem cell treatment for autoimmune diseases: a critical review. Biological research 2012, 45, 269–277. [Google Scholar] [CrossRef] [PubMed]
- Horwitz, E.M.; Le Blanc, K.; Dominici, M.; Mueller, I.; Slaper-Cortenbach, I.; Marini, F.C.; Deans, R.J.; Krause, D.S.; Keating, A.; International Society for Cellular, T. Clarification of the nomenclature for MSC: The International Society for Cellular Therapy position statement. Cytotherapy 2005, 7, 393–395. [Google Scholar] [CrossRef] [PubMed]
- Dominici, M.; Le Blanc, K.; Mueller, I.; Slaper-Cortenbach, I.; Marini, F.; Krause, D.; Deans, R.; Keating, A.; Prockop, D.; Horwitz, E. Minimal criteria for defining multipotent mesenchymal stromal cells. The International Society for Cellular Therapy position statement. Cytotherapy 2006, 8, 315–317. [Google Scholar] [CrossRef] [PubMed]
- Pittenger, M.F.; Mackay, A.M.; Beck, S.C.; Jaiswal, R.K.; Douglas, R.; Mosca, J.D.; Moorman, M.A.; Simonetti, D.W.; Craig, S.; Marshak, D.R. Multilineage potential of adult human mesenchymal stem cells. Science 1999, 284, 143–147. [Google Scholar] [CrossRef]
- Wagner, W.; Wein, F.; Seckinger, A.; Frankhauser, M.; Wirkner, U.; Krause, U.; Blake, J.; Schwager, C.; Eckstein, V.; Ansorge, W.; et al. Comparative characteristics of mesenchymal stem cells from human bone marrow, adipose tissue, and umbilical cord blood. Experimental hematology 2005, 33, 1402–1416. [Google Scholar] [CrossRef]
- Seifrtova, M.; Havelek, R.; Cmielova, J.; Jiroutova, A.; Soukup, T.; Bruckova, L.; Mokry, J.; English, D.; Rezacova, M. The response of human ectomesenchymal dental pulp stem cells to cisplatin treatment. International endodontic journal 2012, 45, 401–412. [Google Scholar] [CrossRef]
- Allickson, J.G.; Sanchez, A.; Yefimenko, N.; Borlongan, C.V.; Sanberg, P.R. Recent Studies Assessing the Proliferative Capability of a Novel Adult Stem Cell Identified in Menstrual Blood. The open stem cell journal 2011, 3, 4–10. [Google Scholar] [CrossRef]
- Ab Kadir, R.; Zainal Ariffin, S.H.; Megat Abdul Wahab, R.; Kermani, S.; Senafi, S. Characterization of mononucleated human peripheral blood cells. TheScientificWorldJournal 2012, 2012, 843843. [Google Scholar] [CrossRef]
- Rotter, N.; Oder, J.; Schlenke, P.; Lindner, U.; Bohrnsen, F.; Kramer, J.; Rohwedel, J.; Huss, R.; Brandau, S.; Wollenberg, B.; et al. Isolation and characterization of adult stem cells from human salivary glands. Stem cells and development 2008, 17, 509–518. [Google Scholar] [CrossRef]
- Bartsch, G.; Yoo, J.J.; De Coppi, P.; Siddiqui, M.M.; Schuch, G.; Pohl, H.G.; Fuhr, J.; Perin, L.; Soker, S.; Atala, A. Propagation, expansion, and multilineage differentiation of human somatic stem cells from dermal progenitors. Stem cells and development 2005, 14, 337–348. [Google Scholar] [CrossRef]
- Potdar, P.D.; Jethmalani, Y.D. Human dental pulp stem cells: Applications in future regenerative medicine. World journal of stem cells 2015, 7, 839–851. [Google Scholar] [CrossRef] [PubMed]
- Sharpe, P.T. Dental mesenchymal stem cells. Development 2016, 143, 2273–2280. [Google Scholar] [CrossRef] [PubMed]
- Lee, J.Y.; Xu, K.; Nguyen, H.; Guedes, V.A.; Borlongan, C.V.; Acosta, S.A. Stem Cell-Induced Biobridges as Possible Tools to Aid Neuroreconstruction after CNS Injury. Frontiers in cell and developmental biology 2017, 5, 51. [Google Scholar] [CrossRef] [PubMed]
- Nakashima, M.; Iohara, K.; Sugiyama, M. Human dental pulp stem cells with highly angiogenic and neurogenic potential for possible use in pulp regeneration. Cytokine & Growth Factor Reviews 2009, 20, 435–440. [Google Scholar] [CrossRef]
- Yu, J.; He, H.; Tang, C.; Zhang, G.; Li, Y.; Wang, R.; Shi, J.; Jin, Y. Differentiation potential of STRO-1+ dental pulp stem cells changes during cell passaging. BMC cell biology 2010, 11, 32. [Google Scholar] [CrossRef]
- Chang, C.C.; Chang, K.C.; Tsai, S.J.; Chang, H.H.; Lin, C.P. Neurogenic differentiation of dental pulp stem cells to neuron-like cells in dopaminergic and motor neuronal inductive media. J Formos Med Assoc 2014, 113, 956–965. [Google Scholar] [CrossRef]
- Duman, R.S.; Nakagawa, S.; Malberg, J. Regulation of adult neurogenesis by antidepressant treatment. Neuropsychopharmacology : official publication of the American College of Neuropsychopharmacology 2001, 25, 836–844. [Google Scholar] [CrossRef]
- Yang, K.L.; Chen, M.F.; Liao, C.H.; Pang, C.Y.; Lin, P.Y. A simple and efficient method for generating Nurr1-positive neuronal stem cells from human wisdom teeth (tNSC) and the potential of tNSC for stroke therapy. Cytotherapy 2009, 11, 606–617. [Google Scholar] [CrossRef]
- Chaires-Rosas, C.P.; Ambriz, X.; Montesinos, J.J.; Hernandez-Tellez, B.; Pinon-Zarate, G.; Herrera-Enriquez, M.; Hernandez-Estevez, E.; Ambrosio, J.R.; Castell-Rodriguez, A. Differential adhesion and fibrinolytic activity of mesenchymal stem cells from human bone marrow, placenta, and Wharton's jelly cultured in a fibrin hydrogel. J Tissue Eng 2019, 10, 2041731419840622. [Google Scholar] [CrossRef]
- Pachernik, J.; Esner, M.; Bryja, V.; Dvorak, P.; Hampl, A. Neural differentiation of mouse embryonic stem cells grown in monolayer. Reprod Nutr Dev 2002, 42, 317–326. [Google Scholar] [CrossRef]
- Weiss, S.; Dunne, C.; Hewson, J.; Wohl, C.; Wheatley, M.; Peterson, A.C.; Reynolds, B.A. Multipotent CNS stem cells are present in the adult mammalian spinal cord and ventricular neuroaxis. J Neurosci 1996, 16, 7599–7609. [Google Scholar] [CrossRef]
- Gronthos, S.; Mankani, M.; Brahim, J.; Robey, P.G.; Shi, S. Postnatal human dental pulp stem cells (DPSCs) in vitro and in vivo. Proc Natl Acad Sci U S A 2000, 97, 13625–13630. [Google Scholar] [CrossRef] [PubMed]
- Orciani, M.; Di Primio, R.; Ferretti, C.; Orsini, G.; Salvolini, E.; Lazzarini, R.; Mattioli-Belmonte, M. In vitro evaluation of mesenchymal stem cell isolation possibility from different intra-oral tissues. J Biol Regul Homeost Agents 2012, 26, 57–63. [Google Scholar] [PubMed]
- Bertassoli, B.M.; Costa, E.S.; Sousa, C.A.; Albergaria, J.D.S.; Maltos, K.L.M.; Goes, A.M.; Matins, T.M.d.M.; Silva, G.A.B.; Jorge, E.C. Rat dental pulp stem cells: isolation and phenotypic characterization method aiming bone tissue bioengineering. Brazilian Archives of Biology and Technology 2016, 59, e16150613. [Google Scholar] [CrossRef]
- Schrepfer, S.; Deuse, T.; Lange, C.; Katzenberg, R.; Reichenspurner, H.; Robbins, R.C.; Pelletier, M.P. Simplified protocol to isolate, purify, and culture expand mesenchymal stem cells. Stem cells and development 2007, 16, 105–108. [Google Scholar] [CrossRef]
- Deans, R.J.; Moseley, A.B. Mesenchymal stem cells: biology and potential clinical uses. Experimental hematology 2000, 28, 875–884. [Google Scholar] [CrossRef]
- Chang, H.Y.; Chi, J.-T.; Dudoit, S.; Bondre, C.; Van De Rijn, M.; Botstein, D.; Brown, P.O. Diversity, topographic differentiation, and positional memory in human fibroblasts. Proceedings of the National Academy of Sciences 2002, 99, 12877–12882. [Google Scholar] [CrossRef]
- Gronthos, S.; Brahim, J.; Li, W.; Fisher, L.W.; Cherman, N.; Boyde, A.; DenBesten, P.; Robey, P.G.; Shi, S. Stem cell properties of human dental pulp stem cells. J Dent Res 2002, 81, 531–535. [Google Scholar] [CrossRef]
- Jesus, A.A.d.; Soares, M.B.P.; Soares, A.P.; Nogueira, R.C.; Guimarães, E.T.; Araújo, T.M.d.; Santos, R.R.d. Collection and culture of stem cells derived from dental pulp of deciduous teeth: technique and clinical case report. Dental Press Journal of Orthodontics 2011, 16, 111–118. [Google Scholar] [CrossRef]
- Bernardi, L.; Luisi, S.B.; Fernandes, R.; Dalberto, T.P.; Valentim, L.; Bogo Chies, J.A.; Medeiros Fossati, A.C.; Pranke, P. The isolation of stem cells from human deciduous teeth pulp is related to the physiological process of resorption. J Endod 2011, 37, 973–979. [Google Scholar] [CrossRef]
- Hadaegh, Y.; Niknam, M.; Attar, A.; Maharlooei, M.K.; Tavangar, M.S.; Aarabi, A.M.; Monabati, A. Characterization of stem cells from the pulp of unerupted third molar tooth. Indian J Dent Res 2014, 25, 14–21. [Google Scholar] [CrossRef] [PubMed]
- Ducret, M.; Fabre, H.; Degoul, O.; Atzeni, G.; McGuckin, C.; Forraz, N.; Mallein-Gerin, F.; Perrier-Groult, E.; Alliot-Licht, B.; Farges, J.C. Immunophenotyping Reveals the Diversity of Human Dental Pulp Mesenchymal Stromal Cells In vivo and Their Evolution upon In vitro Amplification. Front Physiol 2016, 7, 512. [Google Scholar] [CrossRef] [PubMed]
- Luisi, S.B.; Pranke, P.H.L. Isolation, immunophenotypic characterization and pluripotency of dental pulp stem cells. Dental, oral and craniofacial research. London. Vol. 3, no. 5 (2017), p. 1-3.
- Alsulaimani, R.S.; Ajlan, S.A.; Aldahmash, A.M.; Alnabaheen, M.S.; Ashri, N.Y. Isolation of dental pulp stem cells from a single donor and characterization of their ability to differentiate after 2 years of cryopreservation. Saudi Medical Journal 2016, 37, 551. [Google Scholar] [CrossRef]
- Vishwanath, V.R.; Nadig, R.R.; Nadig, R.; Prasanna, J.S.; Karthik, J.; Pai, V.S. Differentiation of isolated and characterized human dental pulp stem cells and stem cells from human exfoliated deciduous teeth: An: in vitro: study. Journal of Conservative Dentistry and Endodontics 2013, 16, 423–428. [Google Scholar] [CrossRef]
- Alexanian, A.R.; Maiman, D.J.; Kurpad, S.N.; Gennarelli, T.A. In vitro and in vivo characterization of neurally modified mesenchymal stem cells induced by epigenetic modifiers and neural stem cell environment. Stem cells and development 2008, 17, 1123–1130. [Google Scholar] [CrossRef]
- Karaöz, E.; Doğan, B.N.; Aksoy, A.; Gacar, G.; Akyüz, S.; Ayhan, S.; Genç, Z.S.; Yürüker, S.; Duruksu, G.; Demircan, P.Ç. Isolation and in vitro characterisation of dental pulp stem cells from natal teeth. Histochemistry and cell biology 2010, 133, 95–112. [Google Scholar] [CrossRef]
- Safford, K.M.; Hicok, K.C.; Safford, S.D.; Halvorsen, Y.-D.C.; Wilkison, W.O.; Gimble, J.M.; Rice, H.E. Neurogenic differentiation of murine and human adipose-derived stromal cells. Biochemical and biophysical research communications 2002, 294, 371–379. [Google Scholar] [CrossRef]
- Tropel, P.; Platet, N.; Platel, J.C.; Noël, D.; Albrieux, M.; Benabid, A.L.; Berger, F. Functional neuronal differentiation of bone marrow-derived mesenchymal stem cells. Stem cells 2006, 24, 2868–2876. [Google Scholar] [CrossRef]
- Blondheim, N.R.; Levy, Y.S.; Ben-Zur, T.; Burshtein, A.; Cherlow, T.; Kan, I.; Barzilai, R.; Bahat-Stromza, M.; Barhum, Y.; Bulvik, S. Human mesenchymal stem cells express neural genes, suggesting a neural predisposition. Stem cells and development 2006, 15, 141–164. [Google Scholar] [CrossRef]
- Lan, X.; Sun, Z.; Chu, C.; Boltze, J.; Li, S. Dental Pulp Stem Cells: An Attractive Alternative for Cell Therapy in Ischemic Stroke. Front Neurol 2019, 10, 824. [Google Scholar] [CrossRef]
- Nosrat, I.V.; Smith, C.A.; Mullally, P.; Olson, L.; Nosrat, C.A. Dental pulp cells provide neurotrophic support for dopaminergic neurons and differentiate into neurons in vitro; implications for tissue engineering and repair in the nervous system. European Journal of Neuroscience 2004, 19, 2388–2398. [Google Scholar] [CrossRef] [PubMed]
- Nosrat, I.V.; Widenfalk, J.; Olson, L.; Nosrat, C.A. Dental pulp cells produce neurotrophic factors, interact with trigeminal neurons in vitro, and rescue motoneurons after spinal cord injury. Developmental biology 2001, 238, 120–132. [Google Scholar] [CrossRef] [PubMed]
- Zajzon, K.; Prols, F.; Heermann, S. Concerted interaction of TGF-beta and GDNF mediates neuronal differentiation. Neuroreport 2013, 24, 704–711. [Google Scholar] [CrossRef]
- Cortes, D.; Robledo-Arratia, Y.; Hernandez-Martinez, R.; Escobedo-Avila, I.; Bargas, J.; Velasco, I. Transgenic GDNF Positively Influences Proliferation, Differentiation, Maturation and Survival of Motor Neurons Produced from Mouse Embryonic Stem Cells. Front Cell Neurosci 2016, 10, 217. [Google Scholar] [CrossRef] [PubMed]
- Bonafina, A.; Fontanet, P.A.; Paratcha, G.; Ledda, F. GDNF/GFRalpha1 Complex Abrogates Self-Renewing Activity of Cortical Neural Precursors Inducing Their Differentiation. Stem Cell Reports 2018, 10, 1000–1015. [Google Scholar] [CrossRef]
- Wong, C.E.D.; Hua, K.; Monis, S.; Saxena, V.; Norazit, A.; Noor, S.M.; Ekker, M. gdnf affects early diencephalic dopaminergic neuron development through regulation of differentiation-associated transcription factors in zebrafish. J Neurochem 2021, 156, 481–498. [Google Scholar] [CrossRef]
- Jahan, S.; Kumar, D.; Kumar, A.; Rajpurohit, C.S.; Singh, S.; Srivastava, A.; Pandey, A.; Pant, A. Neurotrophic factor mediated neuronal differentiation of human cord blood mesenchymal stem cells and their applicability to assess the developmental neurotoxicity. Biochemical and biophysical research communications 2017, 482, 961–967. [Google Scholar] [CrossRef]
- Choudhary, P.; Gupta, A.; Gupta, S.K.; Dwivedi, S.; Singh, S. Comparative evaluation of divergent concoction of NGF, BDNF, EGF, and FGF growth factor's role in enhancing neuronal differentiation of adipose-derived mesenchymal stem cells. International Journal of Biological Macromolecules 2024, 260, 129561. [Google Scholar] [CrossRef]
- Roussa, E.; Krieglstein, K. GDNF promotes neuronal differentiation and dopaminergic development of mouse mesencephalic neurospheres. Neurosci Lett 2004, 361, 52–55. [Google Scholar] [CrossRef]
- Zhu, T.; Yu, D.; Feng, J.; Wu, X.; Xiang, L.; Gao, H.; Zhang, X.; Wei, M. GDNF and NT-3 induce progenitor bone mesenchymal stem cell differentiation into neurons in fetal gut culture medium. Cell Mol Neurobiol 2015, 35, 255–264. [Google Scholar] [CrossRef]
- Du, J.; Gao, X.; Deng, L.; Chang, N.; Xiong, H.; Zheng, Y. Transfection of the glial cell line-derived neurotrophic factor gene promotes neuronal differentiation. Neural Regen Res 2014, 9, 33–40. [Google Scholar] [CrossRef] [PubMed]
- Pavlova, G.; Lopatina, T.; Kalinina, N.; Rybalkina, E.; Parfyonova, Y.; Tkachuk, V.; Revishchin, A. In Vitro Neuronal Induction of Adipose-Derived Stem Cells and their Fate after Transplantation into Injured Mouse Brain. Current Medicinal Chemistry 2012, 19, 5170–5177. [Google Scholar] [CrossRef] [PubMed]
- Lara-Rodarte, R.; Cortés, D.; Soriano, K.; Carmona, F.; Rocha, L.; Estudillo, E.; López-Ornelas, A.; Velasco, I. Mouse Embryonic Stem Cells Expressing GDNF Show Enhanced Dopaminergic Differentiation and Promote Behavioral Recovery After Grafting in Parkinsonian Rats. Frontiers in cell and developmental biology 2021, 9, 661656. [Google Scholar] [CrossRef] [PubMed]
Figure 1.
Characterization of MSCs from Dental Pulp, morphology, expression of specific cell surface markers, and differentiation capacity. A) DPSCs grown in medium containing 10% FBS, showed adherence to the plastic culture bottle, and a fibroblast-like cell morphology at 1, 5, 8 and 12 DIV. The arrangement of the DPSCs at the confluence shows organization and aligned growth at 8 DIV. Cultures were in passage number 3, Scale bar = 100 μm. B) Cell surface markers analysis of MSCs from dental pulp, showed positive expression of CD90, CD105, CD73 and CD13, while negative expression of HLA-DR, CD45, CD34, and CD31. MSCs were incubated with antibodies and analyzed by flow cytometry; autofluorescence (dark gray histograms) and positive populations (light gray histograms) are shown. C) Karyotype of a 46-year-old female is observed, with a normal chromosome number (46) and an increase in normal centromeric heterochromatin on chromosome 16 (16qh +). D) In vitro lineage differentiation potential of MSCs from dental pulp, morphology was stained with Wright staining; Adipogenic differentiation was indicated by lipid droplets stained with Oil Red O; Chondroblastic differentiation was indicated by chondrogenic matrix, as indicated by Alcian blue staining; Osteoblastic differentiation was confirmed by alkaline phosphatase staining. Scale bar = 100 μm.
Figure 2.
Characterization of specific markers expressed by MSCs of the Dental Pulp. A) Immunofluorescence analysis showed positive expression of mesenchymal-specific markers CD73 and CD105 observed in green, nuclei were counterstained with DAPI (blue). DPSCs were in passage 5, Scale bar = 50 μm. B) RT-PCR expression of mesenchymal (CD105, CD13, and CD73) and neural (GFAP and βIII-Tubulin) specific markers in MSCs. RPLP0 was used as a housekeeping gene control. C) Immunofluorescence analysis showed positive expression of neural markers, dental pulp cells are proliferative, indicated by the expression of the nuclear marker Ki67 (red), and express early neural markers such as Nestin and GFAP (green) and βIII-Tubulin (red), DAPI stains the nucleus. DPSCs were cultured at passage 5. Scale bar = 50 µm. DPSCs grew in medium containing 10 % of FBS.
Figure 3.
Expression of mesenchymal, neural, and pluripotent markers by Dental Pulp stem cells. A) Immunoblots of DPSCs cultured in medium containing 10% of FBS showed the expression of mesenchymal markers CD105 (95 kDa), CD73 (72 kDa), and CD13 (110 kDa). B)Immunoblots of DPSCs cultured in medium containing 10% of FBS showed positive expression of Neural markers Nestin (220-240 kDa), βIII-Tubulin (50-55 kDa), and GFAP (50 kDa). C) Immunoblots of DPSCs cultured in medium containing 10% of FBS showed the expression of Nanog (35 kDa), Oct4 (43–50 kDa), and Sox2 (34 kDa). β-actin (42 kDa) was used as a loading control. Graphs depict the densitometric analysis of the expression of the evaluated pluripotent and neural markers relative to β-actin.
Figure 4.
In vitro trans-differentiation of DPSCs. A) DPSCs cultured in transition medium (ITS 1%, 5 ng /ml of EGF and 5 ng /ml of bFGF), the cells show morphological changes with neuritic-type extensions, decreased cytoplasmic area, and radial morphology, 3 Days in vitro (DIV). Scale bars = 50 μm and, 100 μm, respectively. B,C,D) DPSCs cultured in the differentiation medium under different stimuli: Medium ITS at 1%, Medium ITS at 1% + BDNF, Medium ITS at 1% + GDNF, Medium ITS at 1% + BDNF + GDNF. B (5 Days) C (24 Days) D (35 Days).
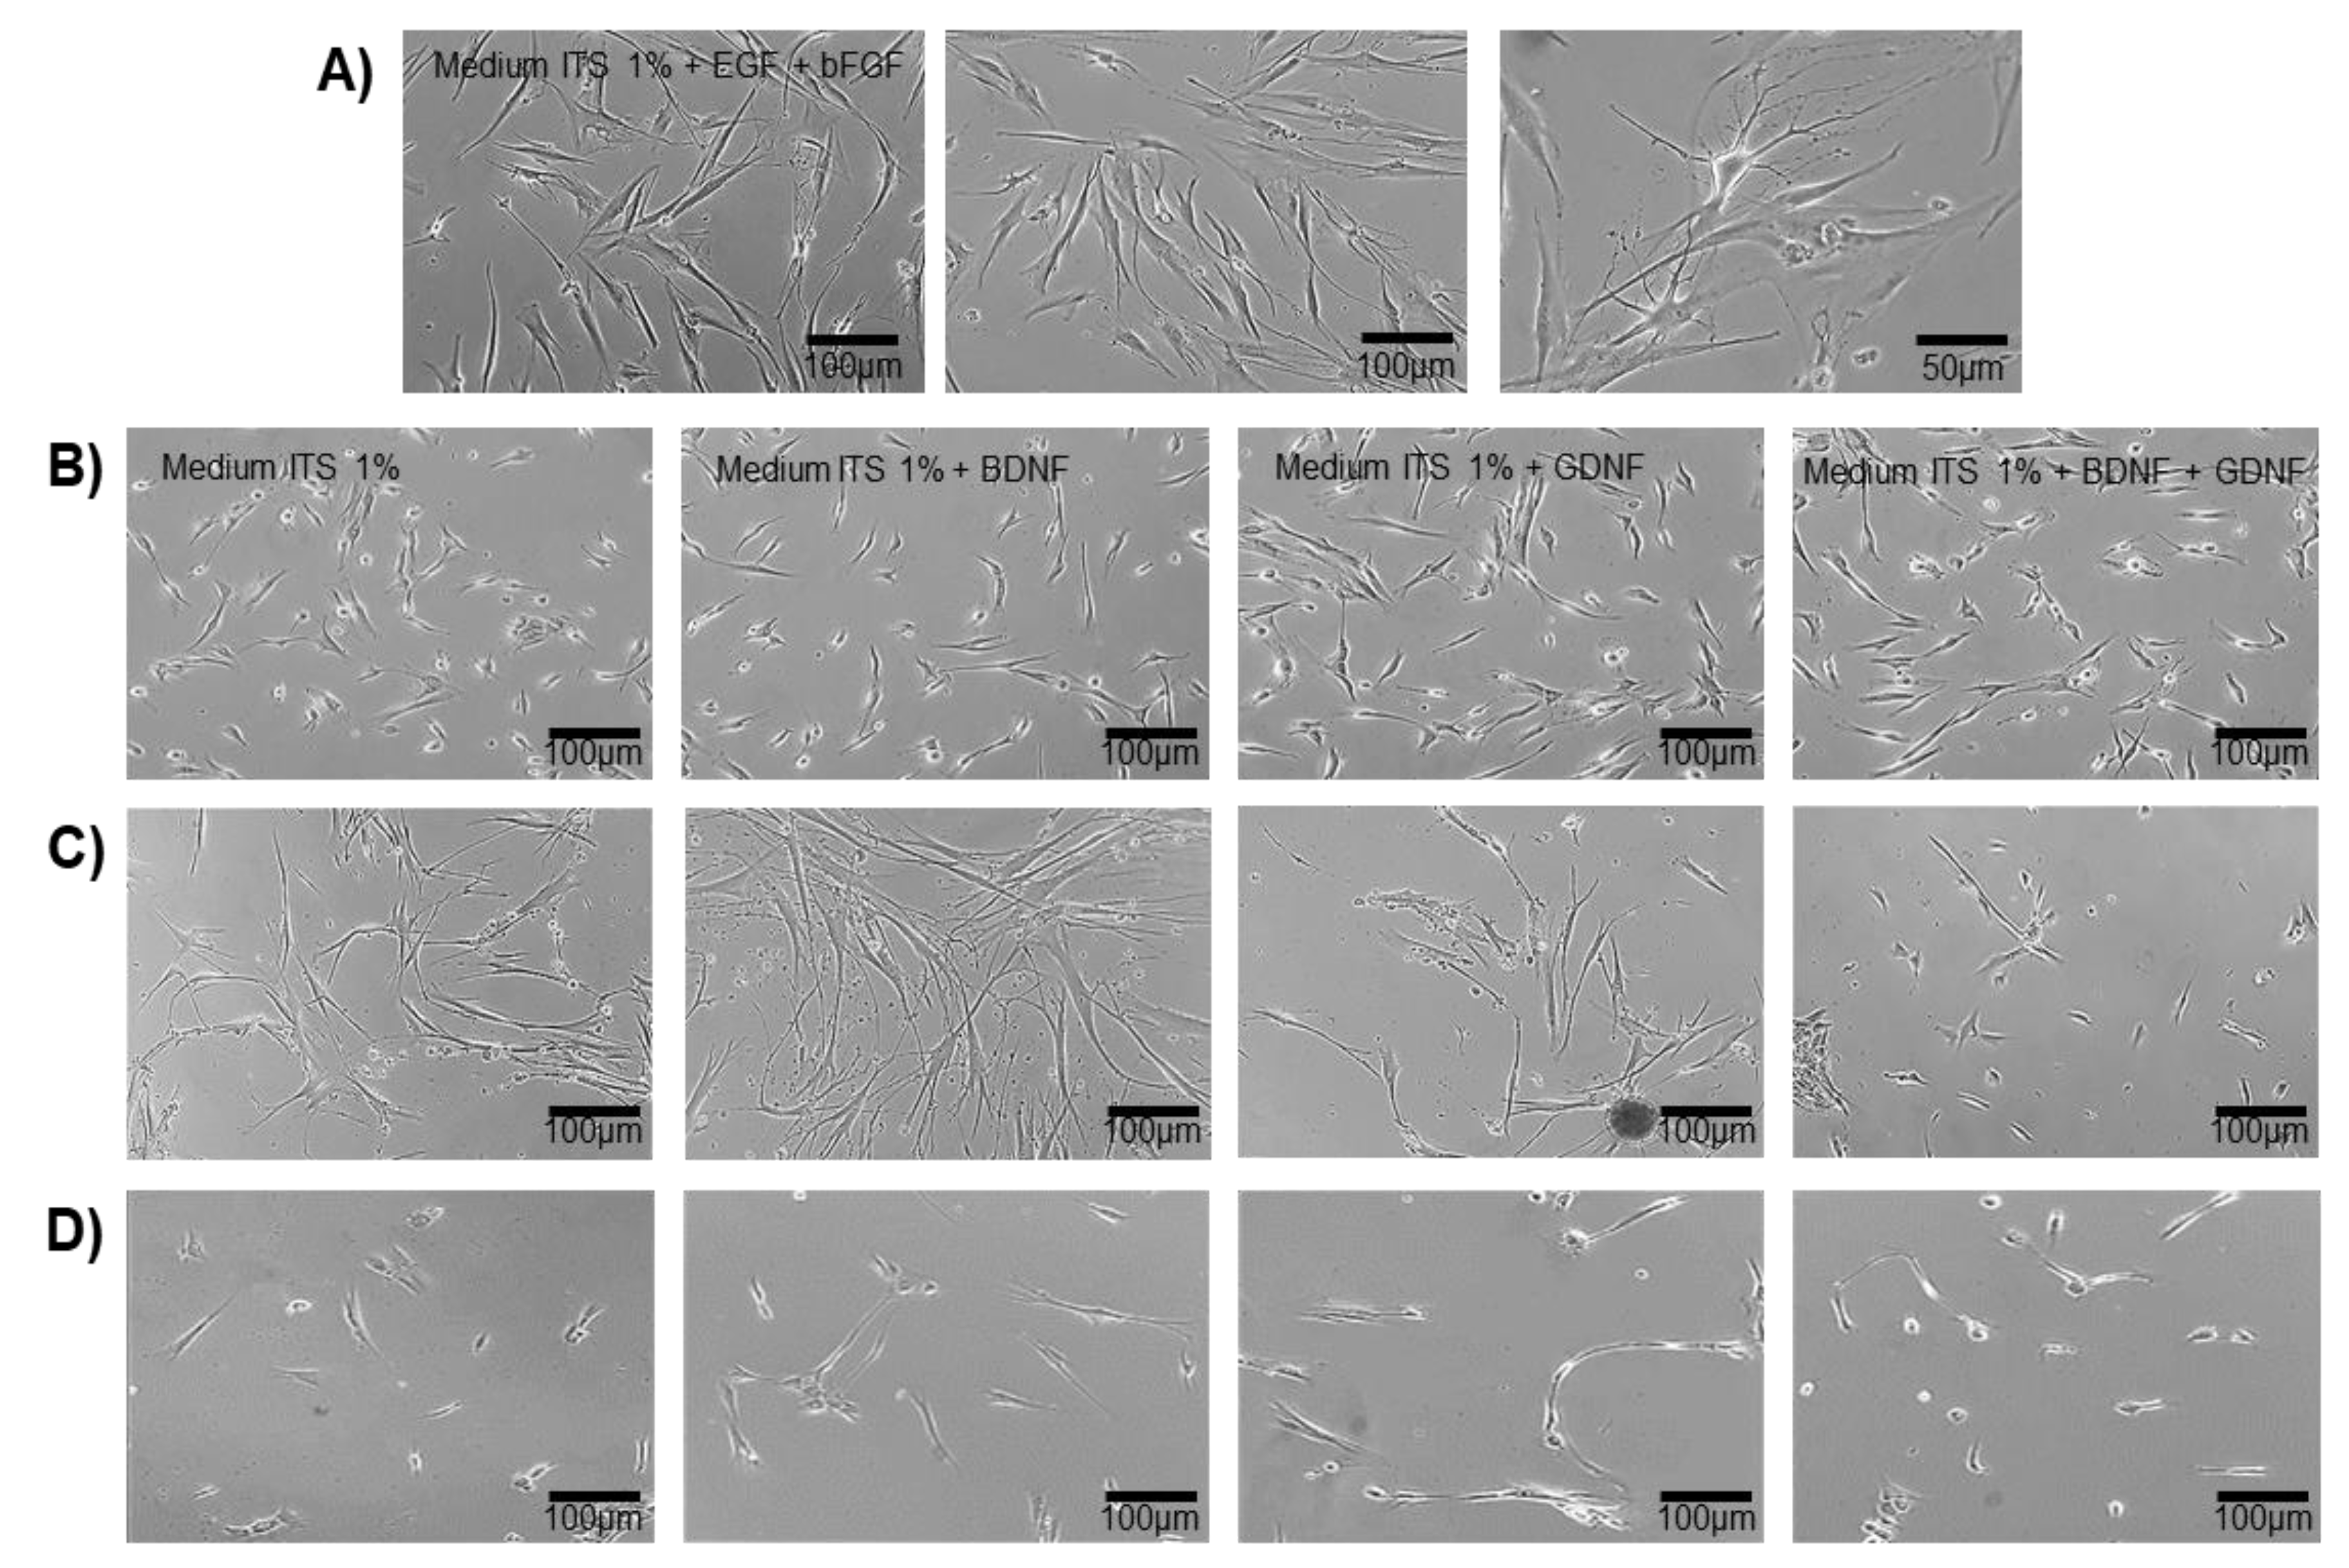
Figure 5.
In vitro differentiation of DPSCs into neuronal-like cells. A) Immunofluorescence analysis showed positive expression of neural-specific marker Nestin and loss of expression of the proliferative marker (Ki67). DAPI stains the nucleus. Cells were cultured in the differentiation medium for 5 days as indicated on the left side of the figure. B) Immunofluorescence analysis showed positive expression of neuronal-specific marker βIII-tubulin (Tuj-1). Nuclei were counterstained with DAPI (blue). After 5 days of treatment. Scale bar = 50 μm.
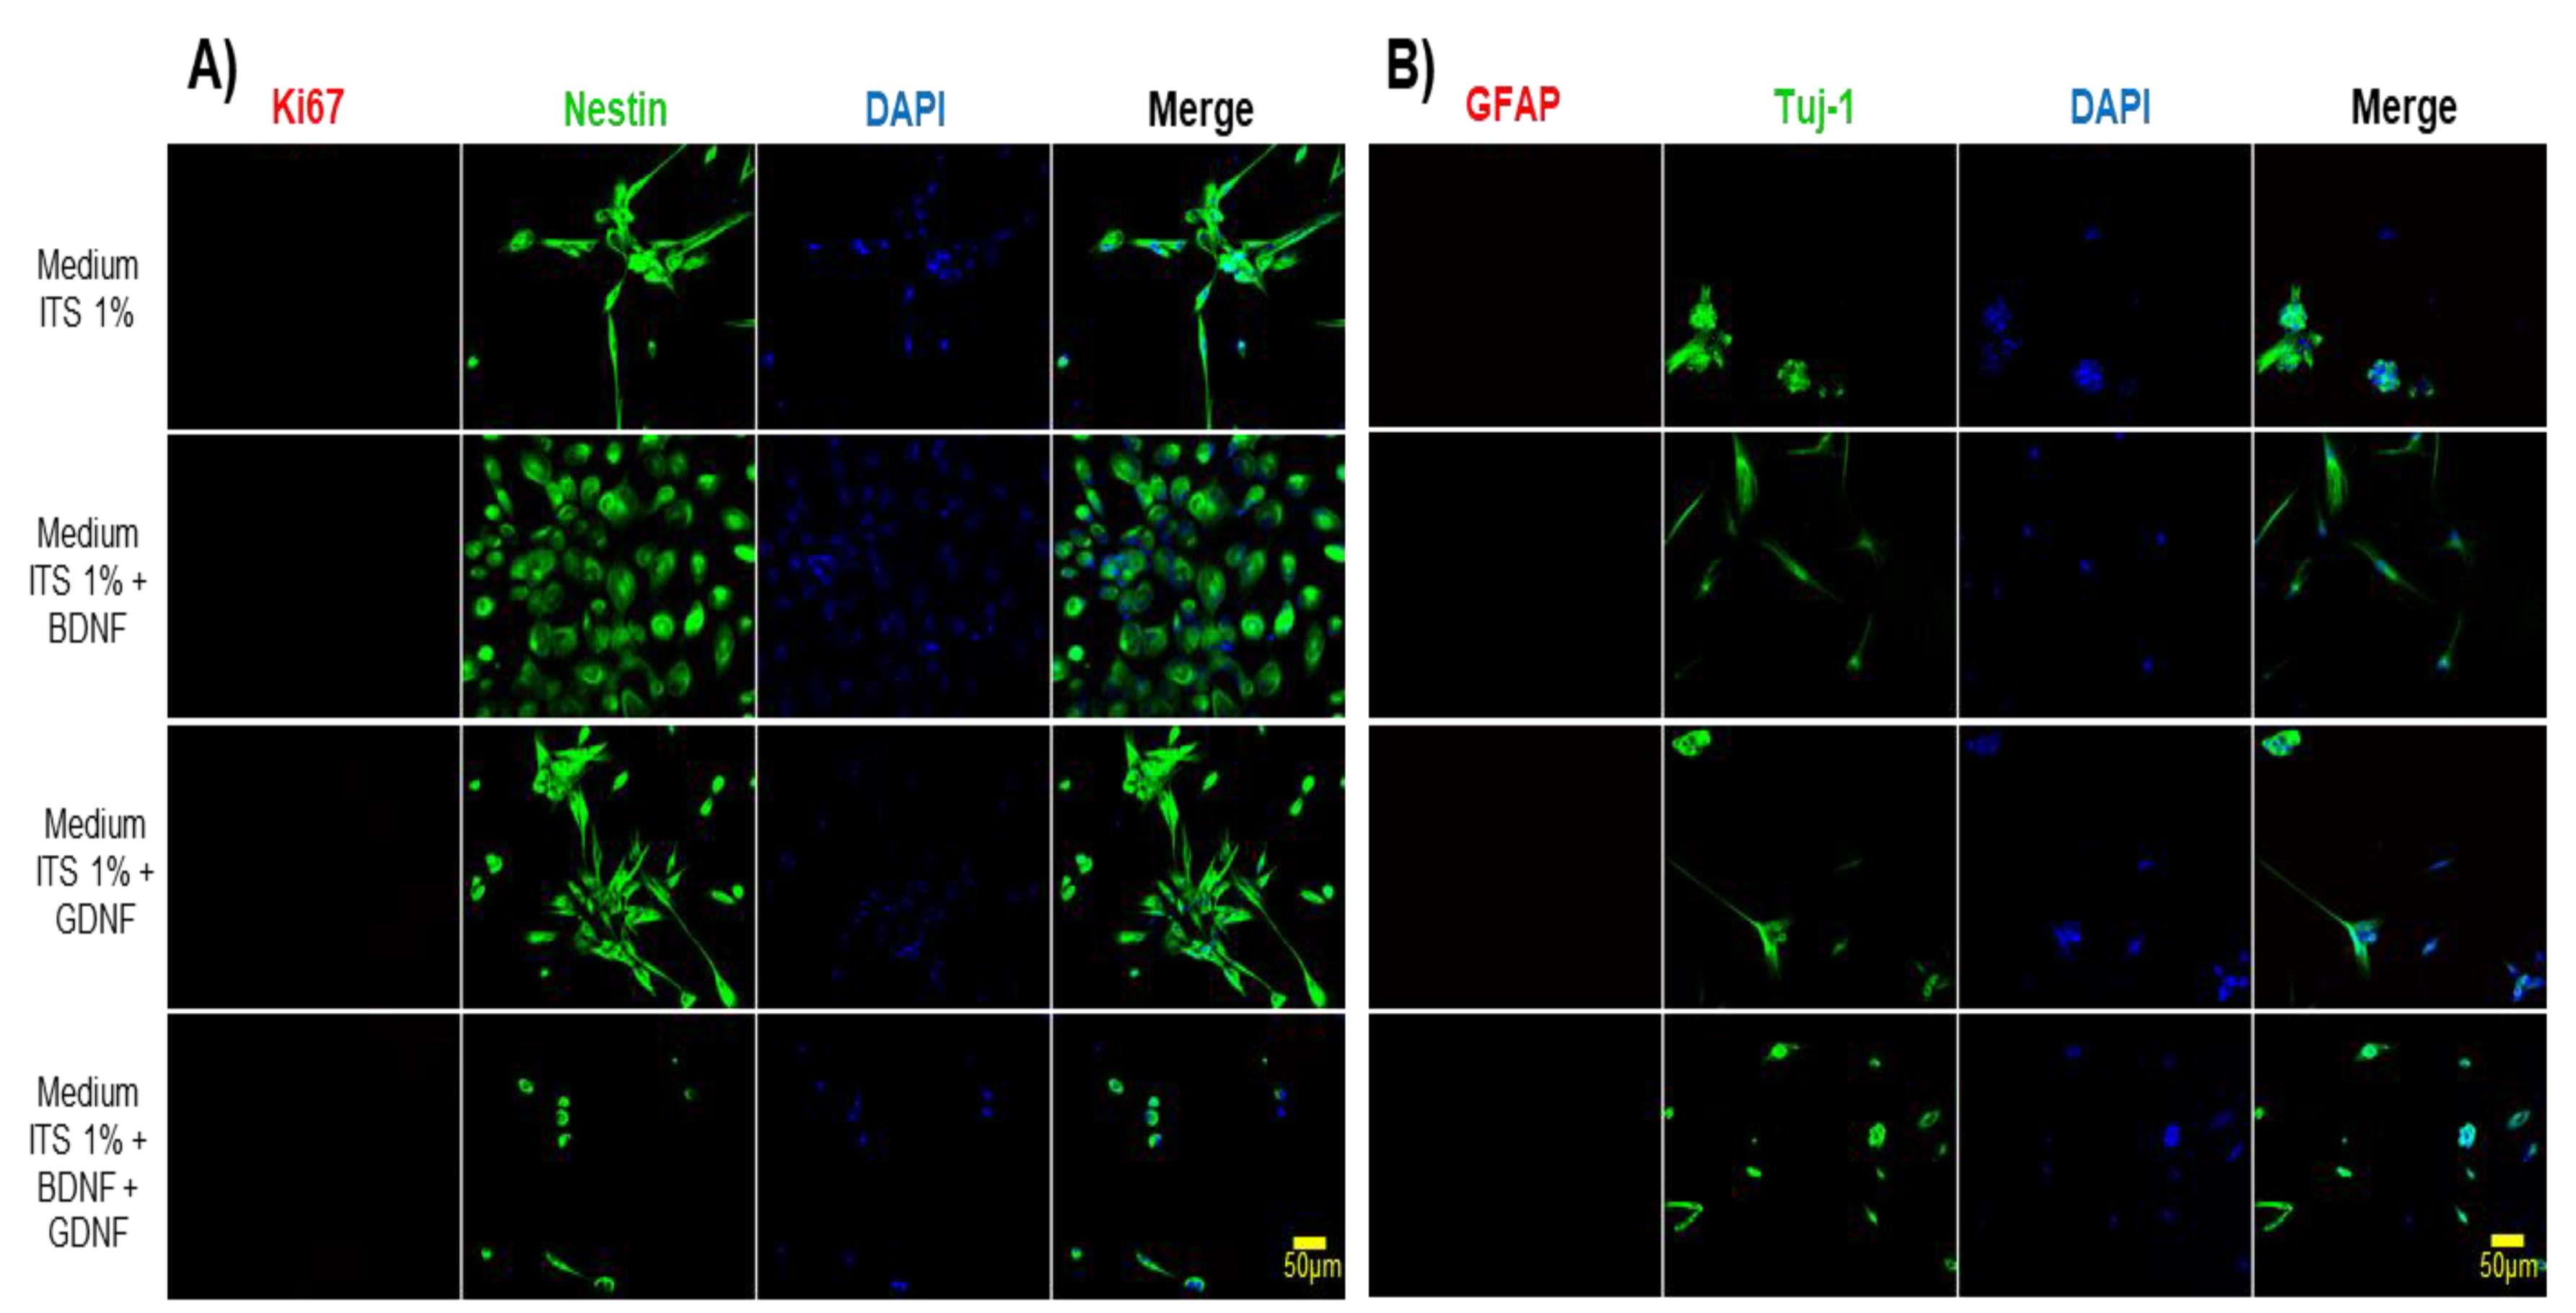
Figure 6.
Immunoblot of markers of DPSCs cultured under differentiation and non-differentiation conditions for 5 days. A) Immunoblot of the expression of mesenchymal markers (CD105, CD73) and neural markers (Nestin and βIII-Tubulin). β-actin (42 kDa) was used as a loading control. B) Densitometric analysis, graphs depict the relative density of mesenchymal and neural markers to β-actin. Statistical significance was assessed using one-way ANOVA; p < 0.05.
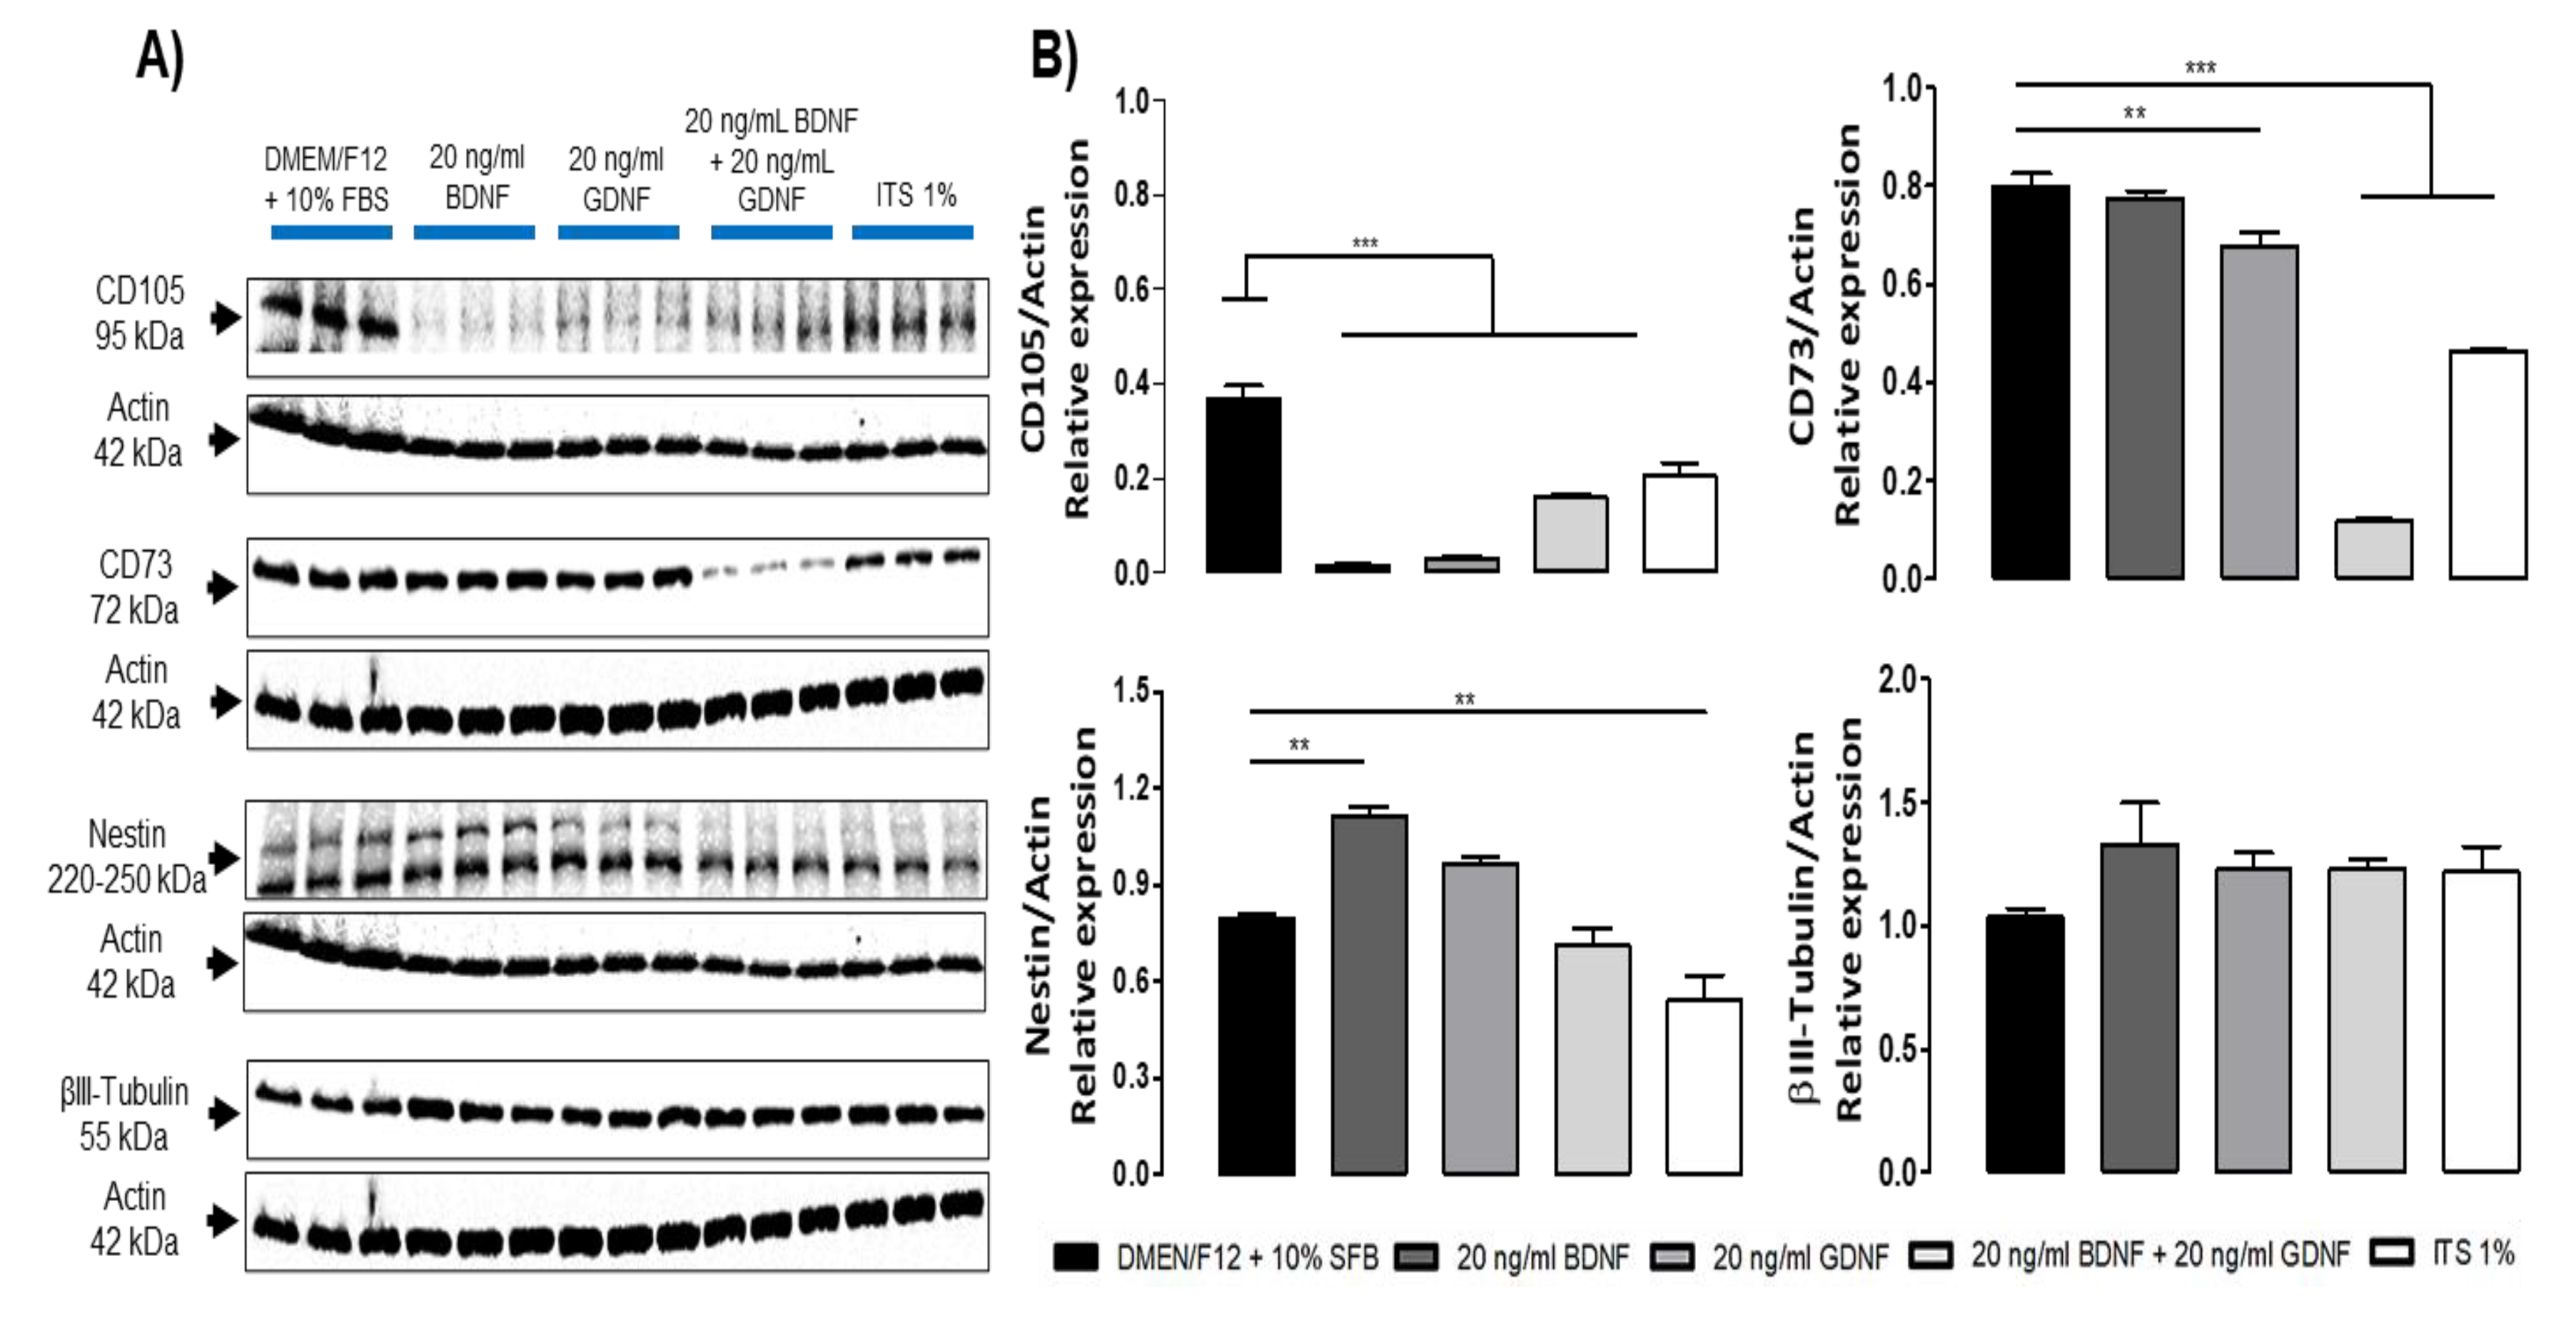
Figure 7.
DPSCs cultured under differentiation medium for 35 DIV expressed mature neuronal Differentiation markers. A) End-point RT-PCR evaluation of the expression of CD166, CD146, and NeuN in DPSCs under different culture conditions for 35 days (DIV): FBS 10%, BDNF, GDNF, BDNF+GDNF, and ITS 1% alone. RPLP0 was used as an internal control. B) Immunofluorescence analysis showed positive NeuN and Neurofilament (NF-M) expression at 35 days in vitro in DPSCs cultured with medium ITS 1% + GDNF. Scale bar = 100 μm. Nuclei were counterstained with DAPI (blue).
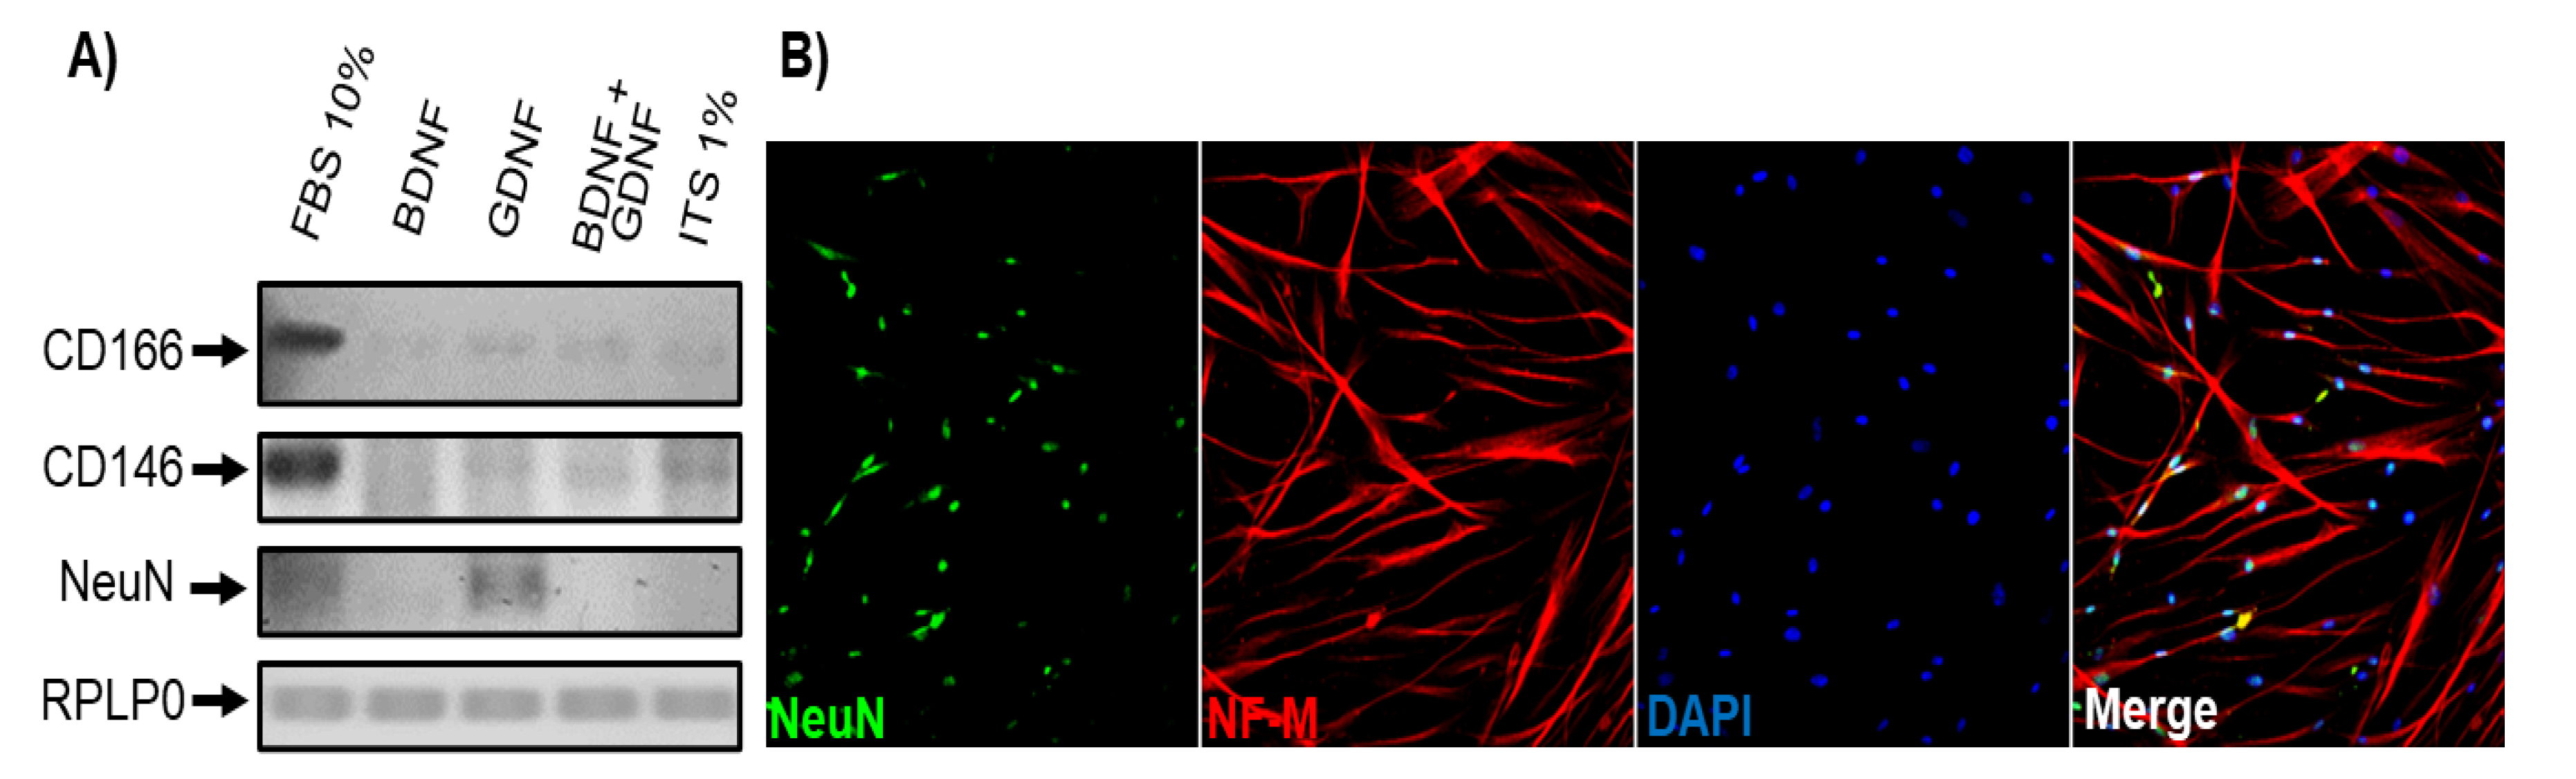
Figure 8.
Passive electrical properties of DPSCs cultured in differentiation (ITS 1%+GDNF) and non-differentiation medium for 15 DIV. DPSCs were cultured for 15 DIV in either complete medium (DMEM/F12 + 10% FBS, blue) or defined differentiation medium (ITS 1% + 20 ng/mL GDNF, red). Cells cultured in the defined medium exhibited a more negative resting membrane potential (RMP), increased membrane capacitance (Cm), and higher input resistance (Rin), indicating a more functionally mature phenotype. Data are presented as mean ± SD. p < 0.05, unpaired Student’s t-test, n = 5 per group.
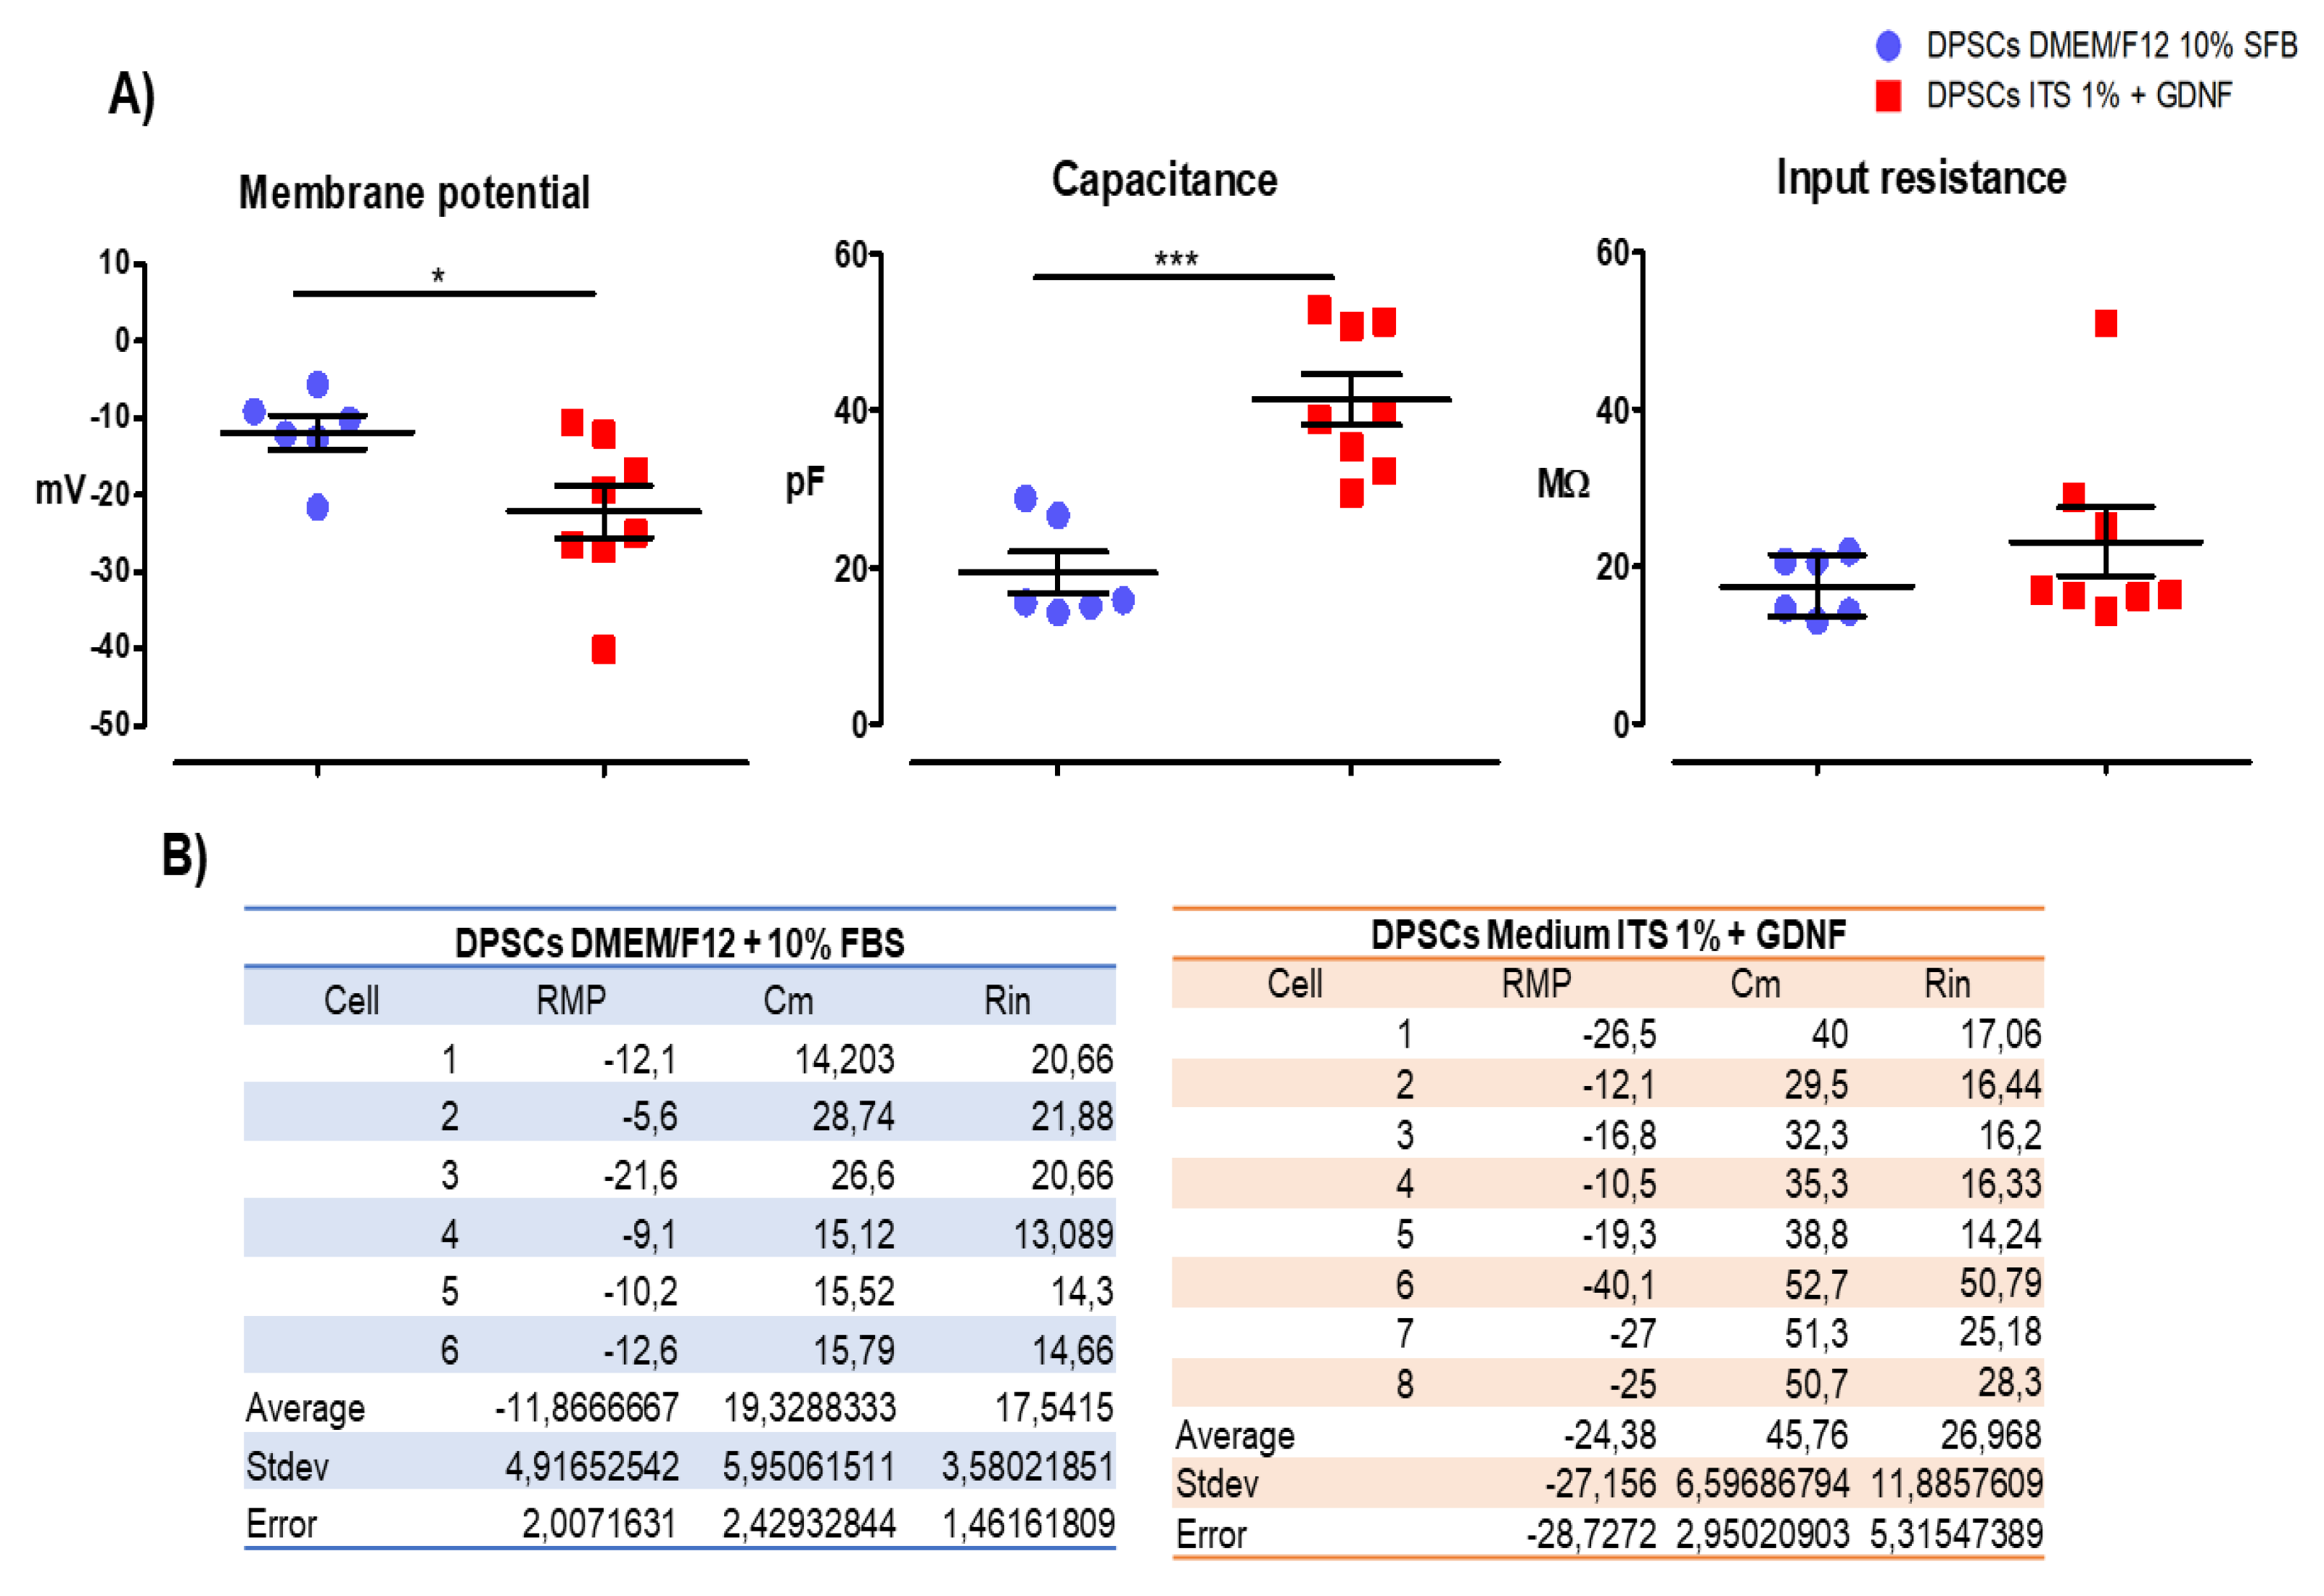

Table 1.
PCR reaction components.
| 5x Taq Reaction Buffer BIOLINE | 4 μL |
|---|---|
| cDNA from DPSCs | 20-50 ng |
| Forward Primer (0.1 μg/μL) (Table 2) | 1 μL |
| Reverse Primer (0.1 μg/μL) (Table 2) | 1 uL |
| DNA polymerase BIOLINE | 0.3 μL |
| H2O sterile for molecular biology | For 20 μL |
| Total reaction | 20 μL |
Table 2.
Primer sequences.
| Mesenchymal Phenotype | ||
|---|---|---|
| Primer | Sequence 5´-3´ | Amplified Size |
| CD105_F | TGCACTTGGCCTACAATTCCA | 105 pb |
| CD105_R | AGCTGCCCACTCAAGGATCT | |
| CD73_F | GCCTGGGAGCTTACGATTTTG | 196 pb |
| CD73_R | TAGTGCCCTGGTACTGGTCG | |
| CD13_F | GACGCTGAGACCGTACCTC | 201 pb |
| CD13_R | TCAGTCTTGTCAATGTCGGGG | |
| CD146_F | GGACCTTGAGTTTGAGTGG | 479 pb |
| CD146_R | CAGTGGTTTGGCTGGAGT | |
| CD166_F | AACATGGCGGCTTCAACG | 630 pb |
| CD166_R | GACGACACCAGCAACGAG | |
| CD31_F | GGTCTTGTCGCAGTATCAG | 355 pb |
| CD31_R | ATGGCAATTATCCGCTCT | |
| Neural Phenotype | ||
| Primer | Sequence 5´-3´ | Amplified Size |
| NESTIN_F | CGCTCGGGAGAGTCGCTT | 215 pb |
| NESTIN_R | CCAGTTGCTGCCCACCTTC | |
| TUB3_F | ACGCATCTCGGAGCAGTT | 125 pb |
| TYB3_R | CGGACACCAGGTCATTCA | |
| GFAP_F | CCTCTCCCTGGCTCGAATG | 161 pb |
| GFAP_R | GGAAGCGAACCTTCTCGATGTA | |
| NEUN_F | CCAAGCGGCTACACGTCTC | 191 pb |
| NEUN_R | CGTCCCATTCAGCTTCTCCC | |
| GAPDH_F | CAACGGCACAGTCAAGG | 717 pb |
| GAPDH_R | AAGGTGGAAGAGTGGGAG | |
Table 3.
Antibodies.
| Mesenchymal Phenotype | |||
|---|---|---|---|
| Antibody | Company | Catalog | Dilution (WB, IF) |
| CD105 | Genetex | GTX100508 | (1:1000) (1:500) |
| CD73 | Genetex | GTX101140 | (1:1000) (1:500) |
| CD13 | Genetex | GTX102788 | (1:1000) (1:500) |
| Neural Phenotype | |||
| Antibody | Company | Catalog | Dilution |
| Nestin | Genetex | GTX30671 | (1:1000) (1:500) |
| GFAP | Sigma Aldrich | G3893 | (1:1000) (1:500) |
| βIII-Tubulin | Genetex | GTX5078 | (1:1000) (1:500) |
| NeuN | Genetex | GTX30773 | (1:1000) (1:500) |
| MAP2 | Genetex | GTX27756 | (1:1000) (1:500) |
Disclaimer/Publisher’s Note: The statements, opinions and data contained in all publications are solely those of the individual author(s) and contributor(s) and not of MDPI and/or the editor(s). MDPI and/or the editor(s) disclaim responsibility for any injury to people or property resulting from any ideas, methods, instructions or products referred to in the content. |
© 2025 by the authors. Licensee MDPI, Basel, Switzerland. This article is an open access article distributed under the terms and conditions of the Creative Commons Attribution (CC BY) license (http://creativecommons.org/licenses/by/4.0/).
Copyright: This open access article is published under a Creative Commons CC BY 4.0 license, which permit the free download, distribution, and reuse, provided that the author and preprint are cited in any reuse.


