
Submitted:
31 October 2025
Posted:
04 November 2025
You are already at the latest version
Abstract
Neurodegenerative diseases pose a significant challenge to modern medicine. Despite significant advances in neurology, current therapeutic approaches often prove insufficient to treat such disorders. This study investigates the neuroprotective effect of extracellular vesicles derived from glial derivates of human induced pluripotent stem cells. The extra-cellular vesicle’s cargo was characterised by proteomic analysis. They neuroprotective ef-fect was assessed using a model of glutamate excitotoxicity performed on primary culture of cortical neurons. The viability of cortical neurons was estimated using the MTT test and morphometric analyses. A comprehensive methodology was applied to investigate intra-cellular mechanisms, integrating assessments of intracellular calcium concentrations, mitochondrial membrane potential, and targeted inhibition of the PI3K‑Akt pathway. Transcriptomic analysis of cortical neurons was used to validated the role of obtained mechanisms of extracellular vesicle’s neuroprotective effect. The obtaining results demon-strated the improvement of neuronal survival by reducing intracellular calcium levels, and stabilizing mitochondrial membrane potential under glutamate-induced excitotoxi-city via PI3K-Akt signaling pathway activation. Moreover, the vesicles contained proteins that contribute to preventing apoptotic processes, activating regeneration of nervous sys-tem, modulating of calcium ion transport and associated with redox processes. Further transcriptomic analyses of neuroglial cultures treated with EVs showed up-regulation of genes associated with regeneration, inhibition of calcium ion transport, regulation of membrane depolirisation and negative regulation of apoptotic pathways.
Keywords:
extracellular vesicles
; neuroprotection
; glutamate
; proteome
; transcriptome
; glial progenitor cells
1. Introduction
Neurological disorders are a large group of diseases of the nervous system characterised by a variety of clinical manifestations and developmental mechanisms. According to the World Health Organisation, neurological disorders are one of the most common causes of disability in the population. The increase in diseases such as Alzheimer’s disease, cerebrovascular diseases including stroke, demyelinating diseases, traumatic brain injury and others is a major medical and social problem.
One of the most important pathogenetic mechanisms of damage to the nervous system in various neurological diseases is excitotoxicity. Research into the mechanisms of glutamate excitotoxicity is of fundamental importance for understanding the pathogenesis of such diseases and opens up new perspectives for the development of effective methods of prevention and treatment. Glutamate, the most important excitatory neurotransmitter of the brain, plays a special role in this process, whereby an excess of glutamate can lead to irreversible consequences for the neurons. In transsynaptic transmission, glutamate then activates the glutamate receptors on the postsynaptic membrane after it releases. This leads to activation of the receptors and entry of calcium ions into the neurons, then to depolarisation of the membrane and transmission of an electrical signal from the dendrite to the soma of the neuron and the initiation of metabolic cascades that affect intracellular homeostasis [1]. However, a high concentration of glutamate molecules in the synaptic cleft has a hyperstimulatory effect on the receptors. This promotes a more active flow of calcium ions into the neurons. High calcium concentrations disrupt mitochondrial function, stimulate the production of reactive oxygen species, inhibit protein folding and activate endoplasmic reticulum stress, leading to the initiation of apoptotic cascades and cell death [2].
Currently, there are many drugs that affect glutamatergic transmission: by inhibiting glutamate receptors (memantine, tiglutik [3,4]), by reducing the synthesis of this neurotransmitter (tiglutik), by slowing the flow of calcium and sodium ions into cells (riluzone [5]), or by promoting the synthesis of glutamate inhibitors (cholinesterase inhibitors [6]). The Food and drug administration (FDA) approves these drugs to treat Alzheimer’s disease, amyotrophic lateral sclerosis and stroke, but have only a short-term effect. Cell therapy is a universal multi-target approach that has shown high efficacy in brain pathologies in many in vivo models [7]. The beneficial effects of multipotential mesenchymal stem cells (mMSCs) treatment include anti-apoptotic activity, activation of neuro- and angiogenesis, and immunomodulation, which together may have a neuroprotective effect. However, the use of cell therapy has several disadvantages, including a low percentage of cell survival [8,9], the risk of oncogenicity [10,11,12], and a high immunogenicity of the therapy, which may neutralise the positive effect of the treatment [13]. There are no approved cell drugs to treat neurological diseases, and the development of a multi-target therapy that can act simultaneously on several targets remains an urgent task for modern medicine.
Numerous experimental data suggest that paracrine activity mediates the positive therapeutic effect of multipotential stem cells (MSCs) transplantation [14], and not by the replacement of lost cells [15], which is confirmed by the presence of neuroprotective factors in their secretome [16,17]. It includes proteins, signaling molecules, nucleic acids and extracellular vesicles (EVs) that may have therapeutic effects, including neuroprotection [18]. To date, extracellular vesicles are one of the most promising tools in regenerative medicine. They represent a new class of multitarget therapeutics and show a polyvalent effect by transporting a specific cargo complex of proteins, peptides, nucleic acids and metabolic components. In addition, extracellular vesicles have a number of advantages. They retain their content in the blood, lymph or tissue fluid because of the bilipid layer, bind specifically to target cells via specific receptors on the membrane surface and can cross the blood-brain barrier [19]. The properties described above determine the high therapeutic potential of extracellular vesicles as a promising group of therapeutics for the pathogenetic correction of neurodegenerative diseases and the restoration of functional activity of the nervous system. Numerous studies are limited to analysing the therapeutic effect of EVs derived from MSCs of various origins in models of neurological diseases. The most suitable source for obtaining EVs are cells of the nervous tissue, for example neuroglia, which are a series of auxiliary cells for neurons and fulfil metabolic, structural, homeostatic and neuroprotective functions, such as the removal of excess neurotransmitters, the formation of synapses, the maintenance of neuronal homeostasis, the stabilisation and regulation of the blood-brain barrier. The glial cells perform these functions through direct contact with the target cells and through paracrine influence by EVs, cytokines and other signaling molecules [20]. In a traumatic brain injury model, the therapeutic effect of extracellular vesicles derived from human glial progenitor cells (EV-GPCs) has been demonstrated, but the neuroprotection mechanisms are not well understood [21]. Therefore, the aim of this study was to investigate the mechanisms of neuroprotective effects of extracellular vesicles derived from human GPCs in a model of glutamate excitotoxicity.
2. Materials and Methods
2.1. Isolation of Glial Progenitor Cell-Derived Extracellular Vesicles (EV-GPCs)
Cultures of glial progenitor cells (GPCs), used for the EV preparation, were previously derived from a healthy donor by differentiating induced pluripotent stem cells (iPSCs) towards a glial lineage [291]. GPCs were cultured to monolayer confluence in DMEM/F12 medium («PanEco», Russia) supplemented with 1% N2 supplement («PanEco», Russia), 1% fetal bovine serum (FBS, Gibco, USA), 1 mM glutamine («PanEco», Russia), 50 U/mL penicillin-streptomycin («PanEco», Russia), 20 ng/mL EGF (Peprotech, USA), and 20 ng/mL CNTF (Peprotech, USA). To obtain the conditioned medium (CM) containing EVs, cells were washed with Hank’s solution and incubated for 24 hours in serum-free culture medium. The conditioned medium was centrifuged at 10,000 × g for 30 min to separate apoptotic bodies and then at 108,000 × g for 1.5 hours twice: first to deposition extracellular vesicles, and then to wash them free of culture medium using an Avanti JXN-30 ultracentrifuge equipped with a JA-30.50 Ti rotor (Beckman Coulter Inc., USA). The resulting vesicle pellet was validated according to previously described methodologies. The prepared EV aliquots were stored at -80 °C. Extracellular vesicles characterization in terms of immunoblotting for specific EV markers, transmission electron microscopy, and nanotracking analysis for EV quantification were held previously [21,22].
2.2. Preparation of Neuroglial Culture
Newborn Wistar rats (P1-P2) were used to obtain primary neuroglial cultures, as described previously [23]. Animals were euthanasied with inhalation a lethal dose of isoflurane (Aerrane, Baxter HealthCare Corporation, USA), decapitated, and the brains were extracted. The cerebral cortex was isolated and cleared of the vascular lining. A suspension of cortical neuroglial cells (10⁶ cells/mL) was obtained by treating the brain tissue with papain (10 U/mL and dissociating by pipetting with subsequent deposition (200 × g) in Neurobasal medium («Gibco», USA). The cells were seeded into 48-well flat-bottom plates (2.5 × 10⁵ cells/well) («Costar», USA) and into Petri dishes (Ø35 mm) with a glass-bottom insert (Ø14 mm) («MatTeck», USA). The plates and Petri dishes were pre-coated with polyethylenimine (0.05 mg/mL, 60 min). After one hour, 1.5 mL of Neurobasal Medium (NBM) containing 2% B-27 supplement, 1% GlutaMAX, and 1% antibiotic-antimycotic solution (all reagents from Gibco, USA) was added. Cytosine arabinoside (1 µM) was added to the medium on day 3 in vitro (DIV) to prevent excessive glial cell proliferation. Cells were incubated for 10-14 days in vitro (DIV) at 37 °C in a humidified atmosphere of 5% CO₂ / 95% air. A partial culture medium change was performed every three days.
2.3. Induction of Glutamate Excitotoxicity In Vitro
The primary neuroglial cultures at 9-10 DIV were used to establish the model of glutamate excitotoxicity. The culture was washed twice with a buffer solution of the following composition: 140 mM NaCl, 5 mM KCl, 2 mM CaCl₂, 5 mM glucose, and 20 mM HEPES (pH ~7.4), followed by the addition of a solution containing 100 µM glutamate, 140 mM NaCl, 5 mM KCl, 10 mM glycine, 2 mM CaCl₂, 5 mM glucose, and 20 mM HEPES (pH ~7.4) and incubation was continued for 1 hour. Thereafter, cells were washed twice buffer solution and returned to the conditioned culture medium, which had been collected beforehand. The EV-GPCs preparation was added 24 hours prior to model induction at a concentration of 10 µg/mL. To assess the involvement of the PI3K-Akt signaling pathway, the selective PI3Kγ subunit inhibitor AS605240 (1 µg/mL) was used, which was added together with EV-GPCs. Memantine (100 µM) – a low-affinity, voltage-dependent, non-competitive antagonist of N-methyl-D-aspartate (NMDA) glutamate receptors – was used as a positive control and was added together with the glutamate-containing solution. Viability assessment was performed on the day following the modeling of glutamate excitotoxicity.
2.4. Assessment of Cell Viability Using the MTT Test and Morphometric Evaluation of Neuronal Death
Cell survival was assessed using the MTT test – a colorimetric assay for which MTT reagent (3-[4,5dimethylthiazol-2-thiazolyl]-2,5-diphenyl-tetrazolium bromide dissolved in phosphate-buffered saline (pH=7.4) (Merck, Germany) to a concentration of 5 mg/mL was used. The resulting stock solution was added to the cell culture medium (final concentration 0.5 mg/mL) and incubated for 1.5 hours at 37 °C. The culture medium was then aspirated and DMSO (ThermoFisher, USA) was added. The staining intensity was measured using an a ClarioStars multimodal plate reader (BMG Labtech, Germany) at a wavelength of 520 nm with a reference wavelength of 690 nm. The obtained data were normalised, with the result in control cultures taken as 100%.
Morphometric assessment of neuronal death included the evaluation of nuclear fragmentation (apoptosis) by live-cell staining for 30 minutes with the fluorescent dye Hoechst 33342 Ready Flow™ Reagent (Invitrogen, USA) at a concentration of 5 µg/mL and the vital dye 0.5 µM Calcein-AM (percentage of live cells). The number of necrotic cells was assessed using 1 µg/mL propidium iodide (PI) with a 10-minute incubation, which penetrates cells with a compromised plasma membrane. Live-cell imaging of cultures was then performed using a Leica DMi8 fluorescence microscope (Germany) with a 20x/0.35 Dry objective, equipped with a Leica DFC7000 T camera and Leica Microsystems Imaging Software. Image processing and analysis were performed using ImageJ software.
2.5. Proteomic Analysis of Extracellular Vesicles
Extracellular vesicle samples were lysed in a buffer containing 4% SDS, 50 mM TRIS-HCl (pH=8), and protease inhibitors (Sigma-Aldrich) for 30 minutes at 60 °C on a thermoshaker. The samples were then sonicated (3 cycles of 10 pulses at 30% amplitude). Subsequently, protein was precipitated using chilled acetone for 14 hours (sample-to-acetone ratio 1:10). After precipitation, samples were centrifuged at 4 °C, 16,000 × g for 10 min; the pellets were washed once with chilled acetone. After centrifugation (4 °C, 16,000 × g, 10 min), the pellets were dried in a vacuum concentrator and dissolved in buffer (8 M urea, 2 M thiourea, 10 mM Tris-HCl (pH=7.5)) for 20 minutes at 24 °C. Protein concentration in the samples was measured by the Bradford method (Bio-Rad) according to the manufacturer’s protocol. An equal amount of protein from each sample was then aliquoted for proteomic analysis. For reduction of disulfide bonds, samples were incubated in a 5 mM DTT solution at 24 °C for 30 min, followed by alkylation by incubating samples in a 10 mM iodoacetamide solution at room temperature for 20 min in the dark. Alkylated samples were diluted with a 50 mM ammonium bicarbonate solution in a 1:4 ratio; trypsin solution was then added to the samples (0.01 µg trypsin (Promega, LC-MS/MS grade) per 1 µg of protein), and they were incubated at 37 °C for 12 h. After hydrolysis, the reaction was stopped by adding formic acid to a final concentration of 5% in the solution. The resulting tryptic peptides were desalted using SDB-RPS microcolumns, dried in a vacuum concentrator, and stored at -80 °C until LC-MS/MS analysis.
Peptide fractions after trypsin digestion were injected in an aqueous solution containing 3% acetonitrile and 0.1% TFA onto a column (75 µm inner diameter, 25 cm length) packed with Aeris Peptide XB-C18 2.6 µm material (Phenomenex). Peptide separation was performed on an Ultimate 3000 Nano LC System (Thermo Fisher Scientific) coupled to a Q Exactive HF mass spectrometer (Thermo Fisher Scientific) via a nanoelectrospray ion source (Thermo Fisher Scientific). Peptides were loaded onto the column, thermostatted at 40 °C, in buffer A (0.2% formic acid (FA) in water) and eluted with a linear (120 min) gradient of 4>55% buffer B (0.1% FA, 19.9% water, 80% acetonitrile) in buffer A at a flow rate of 350 nL/min. Before each new injection, the column was washed with 95% buffer B in A for 5 min and equilibrated with buffer A for 5 min. Mass spectrometric data were acquired in a data-dependent acquisition mode automatically switching between one MS1 scan and up to 15 MS/MS scans (topN method). The target value for MS1 scans was set to 3 × 10⁶ in the range of 300−1200 *m/z* with a maximum ion injection time of 60 ms and a resolution of 60,000. Isolation of precursor ions was performed with a 1.4 m/z window and a fixed first mass of 100.0 m/z. Precursor ions were fragmented by higher-energy collisional dissociation (HCD) in the C-trap with a normalized collision energy of 28 eV. MS/MS scans were acquired with a resolution of 15,000 at m/z 400 and a target value of 1×10⁵ for ions in the range of 200-2000 *m/z* with a maximum ion injection time of 30 ms.
Raw mass spectrometric data from the instrument were converted into MGF (Mascot Generic Format) peak lists using MSConvert (ProteoWizard Software Foundation). The following parameters were used for this procedure: «--mgf –filter peakPicking true]». For thorough protein identification, the generated peak list was analyzed using MASCOT (version 2.5.1) and X! Tandem (ALANINE, 2017.02.01) search engines against the UniProtKB database, taxon Homo Sapiens. Statistical validation of identifications was performed based on a search against a decoy reversed database of protein sequences. Allowed mass deviations for the precursor and fragment ions were 20 ppm and 0.04 Da, respectively. Database search parameters were as follows: allowance for one missed cleavage site for trypsin, fixed modification – carbamidomethylation (C), and dynamic modification – oxidation (M). For X! Tandem, parameters allowing for rapid checking of N-terminal protein residue acetylation, loss of ammonia from N-terminal glutamine residues of peptides, or loss of water from N-terminal glutamic acid residues of peptides were also selected. The resulting files were loaded into Scaffold 4 software (version 4.0.7) for validation and meta-analysis. Peptides and proteins falling within the identification array with a Local FDR of 5% were considered reliably identified.
Quantitative analysis of proteins was performed based on the spectral count method (“total spectral count”) of peptide fragments identified for the corresponding proteins. The resulting protein list was analyzed for cellular compartment and biological process affiliation using the String 11.0 database.
2.6. Measurement of [Ca²⁺]i and Mitochondrial Potential (ΔΨm) in Cortical Neurons
Fluorescence measurements were performed on an experimental setup comprising an Olympus IX-71 inverted fluorescence microscope with 20× and 40× fluorite objectives, a Sutter Lambda 10-2 illumination system with a 175 W xenon lamp (Sutter Instruments, USA), and a CoolSNAP HQ2 CCD camera (Photometrics, USA), controlled by MetaFluor software (Universal Imaging Corp., USA).
Measurements of intracellular free Ca²⁺ concentration ([Ca²⁺]i) and mitochondrial membrane potential (ΔΨm) were performed on cortical neurons (9-11 DIV) cultured on Ø35 mm culture dishes with a glass bottom (MatTeck, Ashland, MA, USA) at a density of 2.5 × 10⁵ cells/dish, as described above. EV-GPCs were added to neuronal cultures 24 hours prior to fluorescence microscopy measurements at a final concentration of 10 µg/mL.
[Ca²⁺]i measurements were performed using the fluorescent low-affinity Ca²⁺ indicator Fura2 in its acetoxymethyl ester (AM) form (Thermo Fisher Scientific, USA) at a concentration of 2 µM, by incubation in the culture medium for 60 min at 37 °C and 5% CO₂. To facilitate Fura2 penetration into cells, it was added as a suspension with the non-ionic detergent Pluronic F-127 (0.02%. Sigma, USA). Fura2 fluorescence was alternately excited at 340 ± 5 and 380 ± 5 nm and recorded at 525 ± 25 nm (500 nm dichroic mirror). For simultaneous monitoring of changes in [Ca²⁺]i and ΔΨm, cells were loaded with the potential-sensitive dye Rhodamine123 (Rh123, 2.5 µg/mL), (Thermo Fisher Scientific, USA) for 15 min at 37 °C, the fluorescence of which was excited and recorded at 485 ± 5 and 525 ± 25 nm, respectively. Measurements were performed at 24-26 °C sequentially in buffers of the following composition: normal buffer (130 mM NaCl, 5 mM KCl, 2 mM CaCl₂, 1 mM MgCl₂, 20 mM HEPES, and 5 mM glucose (pH 7.4)) - to record the fluorescence of both dyes under standard conditions; glutamate buffer (130 mM NaCl, 5 mM KCl, 2 mM CaCl₂, 20 mM HEPES, 5 mM glucose, 100 µM glutamate, and 10 µM glycine (pH 7.4)) – for 15 minutes; nominally Ca²⁺-free buffer (130 mM NaCl, 5 mM KCl, 2 mM MgCl₂, 20 mM HEPES, 5 mM glucose, 10 µM glycine, 100 µM EGTA (pH 7.4)) – for 30 minutes to record the recovery of [Ca²⁺]i and ΔΨm by the cells; nominally Ca²⁺-free buffer with the addition of 1 µM protonophore carbonyl cyanide 4-(trifluoromethoxy)phenylhydrazone (FCCP) – for 5 minutes to assess the maximum Rh123 signal during mitochondrial depolarization and the amount of Ca²⁺ accumulated by mitochondria. At the end of the experiment, 1 µM ionomycin ionophore (in the presence of 5 mM Ca²⁺ and without added Mg²⁺) was used to determine the maximum cytoplasmic calcium capacity. Image processing was performed using MetaFluor Analysis software (Universal Imaging Corp., USA).
2.7. Transcriptomic Analysis (mRNA Sequencing)
To investigate the intracellular pathways activated in the presence of the EV-GPCs preparation (two experimental groups: IC – intact culture, EV – culture with EV-GPCs addition), total RNA analysis was performed via transcriptomic analysis. For this, total RNA was collected from cortical neuron cultures 4 hours after EV-GPCs addition using the RNeasy Plus Mini Kit (Qiagen, Germany) according to the manufacturer’s instructions. Samples were stored and transported at -80 °C
The next stage of the experiment was the transcriptomic analysis of neuroglial cultures after glutamate exposure. For this, cultures were treated with EV-GPCs preparations 24 hours prior to model induction. The following day, glutamate and memantine were added to the cultures as indicated in the methodology above. Thus, the experiment included 4 groups: IC – intact culture without glutamate addition, GL – cultures incubated with glutamate, GL_EV – cultures pre-incubated with EV-GPCs and then incubated with glutamate 24 hours later, GL_MEM – cultures incubated with glutamate and memantine. Upon completion of the experiment, cultures were incubated for 4 hours in culture medium, after which total RNA was collected as described above.
The obtained total RNA samples were treated with the Turbo DNA-Free Kit (Thermo Fisher Scientific) in a 50 µL volume and then purified using Agencourt RNAClean XP (Beckman Coulter, USA) according to the manufacturer’s instructions. Total RNA quantity was measured using the Quant-iT Ribogreen RNA assay kit (ThermoFisher Scientific), and the quality of the isolated RNA was checked on an Agilent Bioanalyzer using Agilent RNA 6000 Pico Chips (Agilent Technologies, USA).
For transcriptomic library preparation, 250 ng of total RNA was used as starting material. RNA libraries were prepared using the NEBNext Poly(A) mRNA Magnetic Isolation Module and the KAPA RNA HyperPrep Kit (Roche, Switzerland) according to the manufacturer’s protocol. RNA was then purified using the RNA Clean XP kit (Beckman Coulter, Brea, USA) and the libraries were given a final cleanup using Agencourt AMPure XP magnetic beads (Beckman Coulter, Brea, USA). Library size distribution and quality were assessed using the Agilent High Sensitivity DNA kit (Agilent Technologies, USA), and library concentration was determined using the Quant-iT DNA Assay Kit, High Sensitivity (Thermo Fisher Scientific, USA). Thereafter, libraries were pooled in equimolar amounts and diluted to a final concentration of 750 pM. Sequencing of the prepared libraries was performed on a NextSeq 1000 platform (Illumina, USA) using the NextSeq 1000/2000 P2 Reagents kit (200 Cycles) v3, supplemented with 2% Phix (Illumina) as an internal control.
Primary quality control of reads was performed using the FastQC utility [24]. Removal of low-quality read regions and technical adapters was performed using the Trimmomatic utility [25]; reads were additionally processed with the Cutadapt utility with the parameter --nextseq-trim 20. For quantitative assessment of gene expression levels, the Salmon utility [26] (mapping-based mode) was used. The complete transcript set for the R. norvegicus genome version rn6 from the ENSEMBL database (version 106) was used as the reference transcriptome. When building the reference transcriptome index, the genome nucleotide sequence was used as a decoy sequence to avoid erroneous read assignment to transcripts. Gene expression levels were calculated based on the expression values of individual transcripts of these genes using the R package tximport [27].
Visualization of sample clustering by principal component analysis (PCA) was performed using the R package PCAtools. The R package edgeR [28], was used to assess differential gene expression between groups, and the glmLRT was chosen as the statistical test. An FDR < 0.05 was considered the criterion for statistically significant changes in gene expression between groups.
2.8. Statistical Analysis
All experiments were performed in duplicate at least 4 times on cultures of unrelated cells. Results of the MTT test and morphometric analysis were processed using the Shapiro-Wilk test and the Kruskal-Wallis test with Dunn’s post-hoc test, as the data deviated from a normal distribution. Results of calcium and ΔΨm imaging analysis were processed according to the methodology described previously, and statistical analysis was performed using the non-parametric Student’s t-test followed by the Mann-Whitney test [23]. Data are presented as violin and box plots indicating medians and interquartile ranges. Differences were considered statistically significant at a confidence level of p ≤ 0.05. Statistical data processing was performed using Excel and Prism 10.
3. Results
3.1. Proteomic Analysis of EVs
To assess the protein composition of EVs of glial progenitor cells, a proteomic analysis was performed. 1357 and EV-GPCs proteins were identified and classified according to molecular function, intracellular compartments, biological process, signaling pathways [29,30,31]. A complete list of detected proteins is available in the Supplementary materials.
3.1.1. Belonging of Proteins to Intracellular Compartments
After localisation (categories of cellular components), 60% of the identified proteins belong to the groups “vesicles” and “extracellular vesicles”, indicating that a preparation enriched with extracellular vesicles was obtained. In this category, proteins belonging to the “secretory granules” (17% of the identified proteins) and “secretory vesicles” (17%) compartments were identified, which may be associated with specialised proteins for extracellular export (Figure 1A). 69%, 13% and 3% of the identified proteins belong to the groups “membrane”, “membrane protein complex” and “vesicle coat”, respectively. The identified proteins are probably localised in the membranes of the vesicles themselves. 56.5% of the proteins were found in the category “cytosol”, indicating that these proteins are localised in the vesicle lumina. In addition, 53%, 15% and 5% of the identified proteins were assigned to the categories “extracellular region”, “focal adhesion” and “extracellular matrix”, respectively. Most likely, the proteins of these groups are exposed on the outer surface of the vesicles and are therefore the first to bind to the receptors on the membranes and transmit a signal to the target cells. In addition, 8%, 6.5% and 3% of the proteins were assigned to the categories “lumen of secretory granules”, “Golgi membrane” and “late endosome”, respectively. “Late endosome” (especially various Rab family proteins such as Rab7, Rab6a, Rab5 [32] and others that regulate the formation and distribution of intracellular membrane compartments, suggesting pathways of extracellular vesicle formation and intracellular migration through the Golgi apparatus and the late endosomal compartment. It was also found that 7% of the identified proteins belong to the categories “Ribosome”, suggesting the presence of ribosomal proteins in the obtained preparation.
3.1.2. Participation of Cargo Proteins in Biological Processes
According to the categories of biological processes, 60% of the analysed proteins are involved in metabolic processes, 38% in developmental processes, 27.5% in processes of the immune system, 25% in the formation of cellular components and 9% in cellular communication. Among the identified proteins belonging to the “immune system processes” group, proteins related to lymphocyte migration were found, such as STK10, also known as LOK, and proteins [33], that have an anti-inflammatory effect, such as TOLLIP, an inhibitor of Toll-like receptors [34], CD59, also known as MACIF, an inhibitor of the complement system [35] and MDA-9/syntenin, which also has an anti-inflammatory effect [36]. In addition, many proteins of the integrin family have been found in the vesicles, such as ITGA3, ITGB1 [37] and others, which regulate the permeability of blood vessels and the attraction of leukocytes, which may indicate their involvement in the control of inflammatory processes by regulating the infiltration of blood cells into brain tissue. The protein MVP (major vault protein) has also been found to help reduce inflammatory processes by suppressing the proliferative activity of macrophages in models of atherosclerosis and osteoporosis [38]. In addition, a protein with anti-inflammatory properties, annexin A2 [39], has been found to be a modulator of autophagy in cells and to maintain the integrity of blood vessels, thereby reducing leukocyte infiltration (Figure 1C). Furthermore, the detected proteins were distributed among the BP groups “oxidation-reduction processes” (8% of the identified proteins) and “response to decreased oxygen levels” (6%). Among these proteins responsible for maintaining the redox balance of the intracellular environment and activating the response to hypoxia are Ferritin with all its subunits [40], various peroxiredoxins (peroxiredoxin 1, peroxiredoxin 6, peroxiredoxin 4 and others [41]), which are responsible for the oxidation/reduction of lipids and proteins, and the protein Hypoxia Up-Regulated 1 [42] (known as ORP150), which is the main activator of the response pathway to decrease oxygen levels. In addition, 9% of the identified proteins were assigned to the “negative regulation of cell death” group, while 4% of the proteins were assigned to the “negative regulation of neuron death” group. These include proteins that directly negatively regulate cell death (e.g. all subunits of the 14-3-3 protein, which is a direct inhibitor of the proapoptotic protein Bad [43], and indirectly, e.g. the DDB1 protein [44], which is involved in DNA repair, endoplasmin, which is involved in the transfer of misfolded proteins to the ERAD complex [45], the 60 kDa heat shock protein [46], which is responsible for the correct assembly of unfolded polypeptides formed under stress conditions in the mitochondrial matrix, and others. In addition, 2.5% of the identified proteins were classified in the BP category “NIK-Nf-kappaB signalling”. These included the following proteins: subunits of the Nf-kappaB complex and activators of NIK-Nf-kappaB signalling (e.g. DDX1 [47]). These data suggest that extracellular vesicle proteins activate cell survival pathways and stabilise intracellular homeostasis.
In addition, 8% of the proteins were assigned to both the BP category “neuronal differentiation” and the category “positive regulation of cellular differentiation”. 4% of the proteins were assigned to the groups “positive regulation of neuronal differentiation” and “positive regulation of nervous system development”, including, for example, the protein MMP14 [48], which is involved in the migration of neural stem cells, as well as PEDF [49] and Copine 1 [50], which are involved in the proliferation and differentiation of neuronal progenitor cells. A small proportion of the proteins belong to the BP “positive regulation of neurogenesis” (5%), including proteins such as Drebrin or the DOCK10 protein [51,52], which are responsible for the development and stability of the dendritic tree and dendritic spines, as well as proteins such as Attractin, which plays a crucial role in the myelination of the central nervous system [53], Plexin-B2 or MANF [54,55], which are responsible for the regeneration and development of the nervous system. 4% of the proteins were assigned to the BP “axon development” and 1% to the BP “axon elongation”, including the following proteins: Dynamin-2 [56], Neuropilin-1 [57] and others, which may indicate that extracellular vesicles also contribute to neuroplasticity development and neural tissue regeneration. 3% of the proteins were categorised as “positive growth regulation”, and 2% of the proteins were identified as proteins in the “vascular development” and “positive regulation of angiogenesis” categories, including proteins such as Myeloid-derived growth factor or Endoglin [58,59], and Lactadherin or Heparan sulphate proteoglycan 2 proteins [60], which are involved in vascular growth, migration and proliferation of endothelial cells, suggesting that vesicles may be involved in the activation and regulation of vascular growth in damaged tissue (Figure 1C).
3.1.3. Molecular Functions of EV-GPCs Cargo Proteins
The main category was “protein binding” (about 68% of identified vesicle proteins), which included categories such as “cell adhesion protein binding” (14%), “ubiquitin-like protein ligase binding” and “ubiquitin protein ligase binding” (4% both), “protease binding” and “chaperone binding” (1.5% both), “ubiquitin binding” and “tau protein binding” (1% both). Proteins with various activities were also distinguished, such as “structural molecule activity” (10%), “oxidoreductase activity” (6%) (e.g. Superoxide dismutase 2 [61], Glutathione peroxidase 4 and peroxidase 8 [62], “antioxidant activity” (1.5%) (the already mentioned peroxiredoxins, as well as Thioredoxin and “peroxidase activity” (1%), indicating the role of extracellular vesicles in cellular communication, signal transduction, proper protein compaction and cell survival (Figure 1B).
3.1.4. Activated Signaling Pathways by Protein Cargo of EV-GPCs
Among the established KEGG signaling pathways, the “PI3K-Akt pathway” is the most interesting as it is one of the most important signaling pathways promoting neuroglial cell survival in different areas of the brain under conditions of oxygen and glucose deprivation and neurotoxicity, as confirmed by numerous studies. In addition, this signaling pathway is involved in cell cycle control, promotes proliferation and regulates angiogenesis. Among the proteins involved in this signaling pathway, subunits of the ITGA and ITGB receptors have been identified that activate this pathway via focal contacts, for example via the various laminins and thrombospondins (e.g. Laminin beta-1 and Thrombospondin 1). CDC37 proteins [63], as well as both subunits of HSP90 [64], which are part of the AKT activator complex, all subunits of the Ras protein, which also activates PI3K, the Jak protein [65], which indicates a cytokine signaling pathway for PI3K-Akt activation, and the beta/gamma subunit of the G protein (Gβγ), which activates PI3K by mediating chemokine signaling [66] were also identified. Furthermore, 14-3-3 protein subunits (YWHAB, YWHAE, YWHAH, YWHAG, YWHAQ, YWHAZ) were identified by proteomic analysis. The 14-3-3 protein family mediates signaling transduction by binding to phosphoserine-containing proteins. They are adaptor proteins involved in the regulation of a variety of general and specialised signaling pathways, in particular in the positive regulation of the cell cycle and cell survival by inhibiting proapoptotic proteins (Figure 1D,E). Based on the KEGG data, an “axon guidance” category was identified. Identified proteins included: Plexin-A2 and Reticulon-4, also known as Nogo, which stop axon-axon interactions and promote neurite branching [67,68], or Ephrin type - B receptor 2 and Ephrin type - B receptor 3 [69], which are also involved in axon guidance via ephrin signaling. Moreover, proteins associated with the ROBO signaling pathway (the ROBO1 gene protein) were found to regulate many functions, but also axonal cone growth and navigation as well as angiogenesis [70] (Figure 1D).
The signaling pathways “MAPK signaling” (2.3% of the proteins found, in particular both subunits of the Erk protein), “mTOR signaling” (2% of the proteins, in particular the mTOR protein itself, as well as several subunits of the Ragulator protein complex, which is an activator of mTOR), “HIF-1 signaling” (2%), “Appelin signaling” (2%), “Relaxin signaling” (2%), “AMPK signaling” (2%), neurotrophin signaling (1%) and “TGF-beta signaling” (1%). In addition, according to the KEGG data, the following groups were identified: “synaptic vesicle cycle” (1.5% of the detected proteins, such as syntaxins and synaptotagmins) and categories related to different types of synapses: “dopaminergic synapse” (about 2%), “serotonergic synapse” (about 2%), “cholinergic synapse” (about 2%), “glutamatergic synapse” (1.5%) and “GABAergic synapse” (about 1%). Among the proteins assigned to these categories, the proteins of the Gi/o family and the PP1-1 protein, which are responsible for synaptic plasticity, should be emphasised. In addition, for the categories “glutamatergic synapse” and “GABAergic synapse”, the protein SNAT8 was identified, which is responsible for the transport of glutamine from glial cells into the neuron and is thus involved in the metabolism of glutamate and GABA (Figure 1D).
The main categories of Reactome pathways were: “metabolism” (24% of the detected proteins), “immune system” (23%), “nervous system development” (13%), “axon navigation” (about 13% of proteins), “hemostasis” (9%), “ROBO receptor signaling” (about 9% of proteins), “PIP3-activated AKT signaling” (about 4% of proteins), “neurotransmitter receptors and postsynaptic signaling” (2%), “EPH-Ephrin signaling” (2%), “VEGF signaling” (2%), “NTRKs signaling” (1.5%), “MAP2K and MAPK activation” (1%), “reactive oxygen species detoxification” (1% of proteins), and “mTORC1-mediated signaling” (1% of proteins), which is consistent with the previously obtained data from other methods of analysis (Figure 1F).
Among the groups identified using Wikipathways were: “VEGFA-VEGFR2 signaling pathway” (10% of proteins), “focal adhesion: PI3K-Akt-mTOR signaling pathway” (4% of identified proteins), “PI3K-Akt signaling pathway” (3%), “MAPK signaling pathway” and “brain-derived neurotrophic factor (BDNF) signaling pathway” (2% each), “NRF2 pathway” (2%), “synaptic vesicle pathway” (1%), “PDGF pathway” (1% of proteins, in particular the PDGFRB receptor subunit for this factor), and “hepatocyte growth factor receptor signaling pathway” (1%), which is also consistent with the data on the putative mechanisms of actions of extracellular vesicles associated with neuroprotection, nervous system regeneration, and angiogenesis (Figure 1G).
3.2. Modeling Glutamate Excitotoxicity and the Neuroprotective Effect of Vesicles
Evaluation of neuroprotective efficacy involved survival analysis and morphometric assessment of karyonecrosis. Induction of glutamate excitotoxicity reduced the viability of cortical neurons by 39.6 ± 5.93% compared to the intact control group (p < 0.0001). Treatment with EV-GPCs promoted a dose-dependent increase in neuronal survival. At a concentration of 1 μg/mL, the survival rate of cortical neurons was significantly increased by 20.0 ± 2.91% (p = 0.0181). A dose of 3 μg/mL increased survival by 30.0 ± 2.98% (p = 0.0142), while a dose of 10 μg/mL restored survival to levels observed in the intact control (p < 0.0001). The efficacy at the highest dose was comparable to that of the positive control, memantine (p = 0.0001) (Figure 2B).
On morphometric analysis, the control group had 28% Calcein+ cells (Q25 = 23.28 - Q75 = 30.27; n = 45982, where n is the number of nuclei stained with Hoechst 33342), while the percentage of cells with karyonecrosis was 77% (Q25 = 74.25 - Q75 = 81.45; n = 45982), consistent with partial cell death during planting of the primary culture. Glutamate excitotoxicity increased the percentage of necrotic cells in the culture to 94% (Q25 = 90.95 - Q75 = 95.41; n = 48735; p < 0.0001) and decreased the percentage of viable cells to 6% (Q25 = 5.778 - Q75 = 10.34; n = 48735; p < 0.0001). The presence of memantine as a positive control increased the number of viable cells to 21% (Q25 = 16.76 - Q75 = 24.81; n = 46434; p < 0.0001) and reduced the percentage of necrotic cells to 83% (Q25 = 79.40 - Q75 = 84.66; n = 46434; p < 0.0001). The addition of 10 μg/ml EV-GPCs also increased the percentage of Calcein+ cells to 15% (Q25 = 10.08 - Q75 = 16.19; n = 45100; p= 0.0174) and decreased the percentage of necrosis in the culture to 85% (Q25 = 83.23 - Q75 = 90.47; n = 45100; p= 0.0005) (Figure 2A,C,D).
3.3. Measurement of Intracellular Ca²⁺ Concentration ([Ca²⁺]i) and Mitochondrial Transmembrane Potential (ΔΨm)
The addition of glutamate (Glu) at a concentration of 100 μM (15 min) significantly increased the cytoplasmic calcium level [Ca2+]i and simultaneously caused a decrease in Ψm in all cells (619 cells for glutamate group (Glu), 621 cells for group with glutamate and EV-GPCs addition) (Figure 3A,B). Figure 3С shows rechiometric fluorescence images of a Fura2-loaded cortical neuron culture demonstrating changes in Ca2+ levels after glutamate exposure and glutamate removal by buffer exchange with a calcium-free buffer containing EGTA (warmer color corresponds to higher [Ca2+]i levels). To evaluate the intracellular changes in the studied groups, various parameters were analysed as previously described [71]. Briefly, the value of changes in [Ca2+]i and Ψm in individual neurons was assessed by the change in the area under the curve (AUC) of fluorescence of the corresponding Fura2 and Rh123 dyes.
The intensity of calcium ion accumulation in the cytoplasm of the cells against the background of glutamate action, estimated by the AUCGlu parameter, decreased significantly (p=0.0211) from the glutamate group values of 8.515 relative units (Q25 = 3.531 - Q75 = 14.66; n = 619) to 7.093 relative units (Q25 = 3.141 - Q75 = 13.84; n = 621) against the background of pre-incubation of the cells with EV-GPCs (Figure 3D). The removal of glutamate in a nominally calcium-free buffer led to a decrease in [Ca2+]i in the analysed groups. At the same time, the value of the parameter AUCCa2++EGTA decreased significantly to 2.155 relative units (Q25 = 1.038 - Q75 = 4.956; n = 621) in the group with cell pre-incubation with EV-GPCs compared to the glutamate group 4.421 relative units (Q25 = 2.431 - Q75 = 10.47; n = 619), indicating a more intense removal of Ca2+ ions from the cytoplasm of cortical neurons in the post-glutamate period (Figure 3E). This is consistent with a smaller increase in [Ca2+]i after the addition of FCCP (Figure 4A). The percentage of recovery of [Ca2+]i to baseline during this period increased significantly to 95.71% (Q25 = 90.38 - Q75 = 99.05; n = 621) in the presence of EV-GPCs compared to 85.40% (Q25 = 72.67 - Q75 = 92.13; n = 619) for the glutamate group (Figure 3G).
Mitochondria are the most important intracellular stores of calcium ions in neurons and protect the cytosol and nucleoplasm from Ca2+ overload [72]. Upon depolarisation of the inner mitochondrial membrane by addition of the protonophore FCCP (1 μM), electrophoretic retention of Ca2+ in the mitochondrial matrix ceases and Ca2+ is released into the cytoplasm, causing a rapid increase in [Ca2+]i (Figure 3A). The addition of EV-GPCs resulted in less Ca2+ release from the mitochondria (Figure 3F). The AUCFCCP value decreased significantly from 0.6466 relative units (Q25 = 0.2265 - Q75 = 4.607; n = 619) in glutamate group to 0.3072 relative units (Q25 = 0.1522 - Q75 = 1.101; n = 621).
To evaluate the changes in Ψm before and after exposure, the signal intensity of the voltage-sensitive mitochondrial probe Rh123 was measured under the effect of the protonophore FCCP and glutamate. AUCGlu and AUCCa2++EGTA were calculated from the fluorescence curves of the Rh123 probe for individual cells as described above. The addition of Glu (100 μM) resulted in an increase in Rh123 signal, indicating mitochondrial depolarisation (Figure 4B). The addition of FCCP resulted in maximal signal amplification as Rh123 dye accumulated in the cytoplasm following a rapid decrease in Ψm. To determine the ability of the cells to maintain Ψm, the ratios AUCFCCP/AUCGlu and AUCFCCP/AUCCa2++EGTA were measured. The higher the AUCFCCP ratio in the investigated stages, the more Rh123 dye accumulated in the mitochondria, as these were less depolarised. The addition of EV-GPCs led to a significant and reliable increase in the AUCFCCP/AUCGlu ratio to 0.6098 relative units (Q25 = 0.4687 - Q75 = 0.7943; n = 621) compared to the glutamate group 0.5176 relative units (Q25 = 0.4091 - Q75 = 0.7196; n = 619) (Figure 4H). The AUCFCCP/AUCCa2++EGTA ratio was also higher in the EV-GPCs background: 0.419 relative units (Q25 = 0.309 - Q75 = 0.587; n = 434) compared to the glutamate group 0.363 relative units (Q25 = 0.280 - Q75 = 0.510; n = 485) (Figure 4I).
At the end of the experiment, ionomycin (Iono, 2 μM) with Ca2+ 5 mM was added to achieve the maximum concentration of Ca2+ in the cells.
3.4. The Role of PI3K-Akt Pathway in Neuron Survival
As in the previous experiment, the addition of glutamate reduced the survival rate of neuroglial cultures by 39.6±5.93% compared to the control group, and the addition of 10 μg/ml EV-GPCs contributed to an increase in viable neurons to control levels (p<0.001). The simultaneous administration of 1 μg/ml AS605240 and glutamate had no effect on cell survival. However, the simultaneous addition of the inhibitor and the EV-GPCs drug (10 μg/ml) resulted in a reliable decrease in survival to values in the group with glutamate excitotoxicity. (Figure 4A,B).
3.5. The Effect of EV-GPCs on the Gene Expression Profile of Neuroglial Cultures. Comparison of Gene Expression in Intact Cells with Neuronal Cultures Pretreated by EV-GPCs (IC_vs_EV)
To investigate the changes in the gene expression profile of the neuroglia culture after addition of EV-GPCs, mRNA sequencing analysis was performed. In the IC_vs_EV comparison group, 52 differentially expressed genes (DEGs) were significantly up-regulated, while 181 DEGs were significantly down-regulated (p<0.05 and |FC|<1.5). The complete lists of DEGs, results of clustering (Supplementary Material, S1) and the heatmap (Supplementary Material, S2) can be found in the Supplementary material. The volcano plot in Figure 5B demonstrates the differences in differential gene expression between groups and illustrates the molecular changes induced by the addition of EV-GPCs. The most striking DEGs are shown in Heatmap 5A.
Analysis of differentially expressed genes (DEGs) using the Gene Ontology (GO) Biological Process database revealed a significant enrichment of down-regulated DEGs in key biological pathways. Table 1 presents the most significant DEGs belonging to the selected biological pathways (Table 1). The process categories containing the highest number of DEGs were wound healing, response to hypoxia, and the cytokine-mediated signaling pathway (Figure 5D)
It was found that down-regulated DEGs were reliably grouped into biological pathways responsible for changes in the cytoskeleton, extracellular matrix, and cell adhesion: extracellular matrix organization; cell-substrate adhesion; actin filament organization; positive regulation of cell adhesion; homotypic cell-cell adhesion, and axonogenesis (Figure 5D, Table 1).
Down-regulated DEGs were also significantly associated with alterations in canonical signaling pathways, including the ERK1 and ERK2 cascade, canonical NF-κB signal transduction, response to cAMP, response to reactive oxygen species, and cellular response to decreased oxygen levels (Figure 5D, Table 1). This pattern suggests the activation of sequential signal transduction events that promote adaptive cellular responses aimed at maintaining homeostasis and ensuring cell survival under exogenous stress.
Furthermore, several DEGs were classified into categories related to regeneration and neurogenesis, such as: regulation of cellular catabolic processes, regulation of neurogenesis, gliogenesis, negative regulation of apoptotic signaling, regulation of autophagy, and regeneration (Figure 5D, Table 1).
To further elucidate the underlying mechanisms and activated intracellular cascades, down-regulated DEGs were analyzed for enrichment in signaling pathways using the KEGG database [22,23,24]. This analysis identified several key pathways: the PI3K-Akt signaling pathway, Focal adhesion, regulation of actin cytoskeleton, MAPK signaling pathway, NF-κB signaling pathway, Apelin signaling pathway, HIF-1 signaling pathway, and JAK-STAT signaling pathway (Figure 5E). Most notable are the PI3K-Akt, NF-κB, MAPK, and HIF-1 signaling pathways, whose activation is directly implicated in pro-survival mechanisms and the maintenance of cellular homeostasis.
Gene Set Enrichment Analysis (GSEA) was performed to assess coordinated variations in the expression of pre-defined gene sets. This method evaluates whether defined sets of genes exhibit statistically significant, concordant differences in expression between two biological states, rather than focusing on individual genes. Figure 6C presents the results obtained using the Hallmark gene set collection, illustrating gene sets that are activated in the control group (Normalized Enrichment Score, NES > 0) and in the group treated with extracellular vesicles (NES < 0), with a significance threshold of p-value < 0.05.
3.6. Assessment of Gene Expression in Neuroglial Cultures Under Glutamate-Induced Excitotoxicity
The subsequent phase of the experiment involved transcriptomic analysis of neuroglial cultures following glutamate excitotoxicity. Three comparison groups were established: control group without glutamate addition versus cultures incubated with glutamate (IC_vs_GL), cultures incubated with glutamate and memantine versus cultures incubated with glutamate (GL_Mem_vs_GL), and control group without glutamate addition versus cultures incubated with glutamate and memantine (IC_vs_GL_Mem), in which subsequent differential gene expression (DEG) analysis and classification by biological processes and signaling pathways were performed.
DEG analysis in the IC_vs_GL comparison group revealed that 969 genes were significantly up-regulated, while 300 genes were significantly down-regulated (p-value < 0.05 and |FC| > 1.5). In the GL_Mem_vs_GL comparison group, 797 genes were identified as significantly up-regulated and 300 as down-regulated (p-value < 0.05 and |FC| > 1.5). No significantly differentially expressed genes were detected in the IC_vs_GL_Mem comparison group. Complete lists of DEGs and results of clustering (Supplementary material, S3) corresponding heatmaps (Supplementary Material, S4, S5) are provided in the Supplementary Materials. The volcano plots presented in Figure 6A,D illustrate the differences in gene expression between the groups, highlighting the distinct molecular alterations induced by glutamate and memantine treatment.
Analysis of differentially expressed genes (DEGs) using the Gene Ontology database revealed a significant enrichment of up-regulated genes in specific Biological Processes for both the “IС_vs_GL” and “GL_Mem_vs_GL” comparison groups. Subsequent analysis demonstrated that the categories of biological processes identified in the “IС_vs_GL” comparison group exhibited 80% similarity with the up-regulated pathway categories detected in the “GL_Mem_vs_GL” comparison group (Figure 6B,C). The most significant upregulated DEGs associated with these selected biological pathways are presented in Table 2.
Among the most significantly enriched up-regulated categories, key biological pathways associated with synaptic function, axonal outgrowth, and dendritic arborization were identified. These included axonogenesis, regulation of synapse structure or activity, dendrite development, and neurotransmitter transport. This enrichment pattern suggests that EV-GPCs treatment promotes the maintenance of neurotransmission in neuroglial cultures and supports neurite outgrowth and development.
The most highly activated biological processes can be categorized into several functional groups: regulation of neuronal synapse activity, including postsynapse organization, positive regulation of synaptic transmission, regulation of neuronal synaptic plasticity, glutamate receptor signaling pathway, and regulation of membrane depolarization; Maintenance of homeostasis and ion concentration regulation, encompassing regulation of metal ion transport, calcium ion transport, positive regulation of secretion by cell, intracellular calcium ion homeostasis, response to calcium ion, and positive regulation of cell-substrate adhesion; neural tissue development and neurogenesis, comprising positive regulation of nervous system development, positive regulation of neurogenesis, gliogenesis; axonal and dendritic growth pathways, including axon guidance, neuron projection extension, regulation of axonogenesis, actin filament organization, dendritic spine development, and axo-dendritic transport.
However, DEG analysis in the GL_Mem_vs_GL comparison group revealed the activation of pathways associated with the regulation of apoptosis, which were not detected in the IC_vs_GL group (Figure 6C). Specifically, the “neuron apoptotic process” was identified, alongside genes negatively regulating apoptosis. This observation may be attributed to the partial toxic effect of glutamate supplementation and the subsequent activation of compensatory cellular mechanisms to protect against apoptotic cell death.
Furthermore, up-regulated DEGs were classified into signaling pathways using the KEGG database. Subsequent analysis revealed that the categories of signaling pathways identified in the “IC_vs_GL” comparison group exhibited 80% similarity with the pathway categories detected in the “GL_Mem_vs_GL” comparison group (Figure 7A,B). DEGs were significantly enriched in the following pathways: axon guidance, calcium signaling pathway, cAMP signaling pathway, MAPK signaling pathway, glutamatergic synapse, synaptic vesicle cycle, dopaminergic synapse, Ras signaling pathway, chemokine signaling pathway, focal adhesion, neurotrophin signaling pathway, and long-term potentiation.
Furthermore, analysis of up-regulated DEGs in the GL_Mem_vs_GL comparison group revealed significant enrichment of pathways associated with the induction of autophagy. This finding may again be attributed to the partial intracellular influx of glutamate and its subsequent toxic impact on neuronal function. Specifically, the mTOR signaling pathway and FoxO signaling pathway were identified as significantly activated (Figure 7B).
Following the analysis and classification of up-regulated DEGs in the IC_vs_GL and GL_Mem_vs_GL groups, the down-regulated DEGs we analysed. The number of down-regulated DEGs was 300 in both the IC_vs_GL and GL_Mem_vs_GL comparison groups. Subsequent analysis revealed that the categories of biological processes identified in the IC_vs_GL group exhibited 76% similarity with the pathway categories detected in the GL_Mem_vs_GL group (Figure 6E,F). Furthermore, down-regulated DEGs in the GL_Mem_vs_GL group did not show significant enrichment for any specific signaling pathways in the KEGG database analysis. The most significant down-regulated DEGs associated with the selected biological processes are presented in Table 2.
Classification of genes by biological processes using the Gene Ontology database revealed categories associated with the activation of protective cellular pathways against glutamate toxicity. These included: response to hypoxia, cellular response to abiotic stimulus, cellular response to chemical stress, negative regulation of cell development, cellular response to oxidative stress, response to reactive oxygen species, and response to endoplasmic reticulum stress. The enrichment of these pathways indicates the activation of intrinsic neuronal mechanisms responsible for mounting an intracellular response to stress and the disruption of neuronal homeostasis. Additionally, pathways associated with programmed cell death were identified, including regulation of apoptotic signaling pathway and extrinsic apoptotic signaling pathway. Furthermore, categories related to regeneration and repair were significantly enriched, such as wound healing, regeneration, and regulation of neurogenesis. The presence of these processes suggests that under glutamate-induced toxicity, cells activate programs aimed at recovery and survival. Concurrent with the identification of wound healing processes, pathways governing cellular adhesion and reorganisation of the extracellular space in the neuroglial culture were also identified. These included regulation of cell-cell adhesion, extracellular structure organisation, and regulation of cell-substrate adhesion (Figure 6E,F).
Analysis of the IC_vs_GL comparison group using the KEGG database confirmed activation of key signaling pathways, revealing a coordinated cellular response to glutamate-induced excitotoxicity. This response encompasses pathways mediating programmed cell death (apoptosis), pro-survival signaling (MAPK, PI3K-Akt, NF-kappa B, and JAK-STAT pathways), and integrated stress responses (TNF, HIF-1, FoxO, and p53 pathways). Additionally, pathways regulating cellular architecture and adhesion, including regulation of actin cytoskeleton, focal adhesion, and ErbB signaling were significantly enriched (Figure 7C). Complementing these findings, Gene Set Enrichment Analysis (GSEA) was performed to identify functionally coordinated gene expression changes. Hallmark gene set analysis defined signatures significantly activated in the IC_vs_GL (Figure 7D) and GL_Mem_vs_GL (Figure 7E) using a significance threshold of p-value < 0.05 and normalised enrichment score (NES) directionality.
3.7. The Effect of EV-GPCs on the Gene Expression Profile of Neuroglial Cultures Under Glutamate Exitotoxicity
Differential gene expression analysis identified 190 significantly up-regulated and 309 significantly down-regulated genes in the GL_EV_vs_GL comparison group (p-value < 0.05 and |FC| > 1.5). Complete DEG lists and corresponding heatmaps (Supplementary material, S6) are provided in Supplementary Tables. Figure 9A presents a volcano plot visualising the genome-wide expression differences between groups, highlighting the distinct molecular changes induced by extracellular vesicle supplementation following glutamate exposure. Additionally, Figure 8C displays a heatmap of selected differentially expressed genes, illustrating specific expression patterns across experimental conditions.
Analysis of upregulated differentially expressed genes (DEGs) using the Gene Ontology database revealed significant enrichment in specific Biological Process categories. The most significant DEGs associated with these selected biological pathways are presented in Table 3. The predominant enriched categories included processes related to regeneration, extracellular matrix and cytoskeletal reorganisation, homeostasis maintenance, and cellular stress response. Regeneration-associated pathways encompassed wound healing, phosphatidylinositol 3-kinase/protein kinase B signal transduction, regeneration, tissue regeneration, regulation of wound healing, and regulation of axonogenesis. Extracellular matrix and cytoskeleton-related categories featured subprocesses including cell-substrate adhesion, extracellular matrix organisation, actin filament organisation and positive regulation of cell-substrate adhesion.
Furthermore, the stress response category demonstrated significant enrichment for processes including gliogenesis, response to reactive oxygen species, cellular response to chemical stress, cellular response to oxidative stress, reactive oxygen species metabolic process, response to hydrogen peroxide, cellular response to reactive oxygen species and response to axon injury.
The final category of identified processes involved the maintenance of intracellular homeostasis, which encompassed the following pathways: regulation of metal ion transport, positive regulation of transmembrane transport, positive regulation of secretion by cell, peptide hormone secretion, neuropeptide signaling pathway, positive regulation of ion transmembrane transporter activity, receptor recycling, and regulation of membrane depolarisation (Figure 8A).
Analysis of down-regulated pathways revealed significant enrichment of processes associated with neuronal physiology, including: axonogenesis, regulation of cellular response to stress, dendrite development, regulation of synapse organisation, calcium ion transport, regulation of synapse structure or activity, axon guidance, neuron projection guidance, regulation of calcium ion transport, calcium ion transmembrane import into cytosol, negative regulation of epigenetic gene expression, neuron projection organisation, actin-mediated cell contraction, regulation of calcium ion transmembrane transport via high voltage-gated calcium channel, and axo-dendritic protein transport (Figure 8B).
For deeper functional insights, we performed KEGG pathway enrichment analysis, consistent with our previous experimental approach. Upregulated DEGs showed significant enrichment in several signaling pathways, including focal adhesion, PI3K-Akt signaling pathway, ECM-receptor interaction, motor proteins, phagosome, regulation of actin cytoskeleton, and glutathione metabolism (Figure 9B). Downregulated DEGs were significantly associated with pathways including cAMP signaling pathway, MAPK signaling pathway, calcium signaling pathway, dopaminergic synapse, cGMP-PKG signaling pathway, ras signaling pathway, cellular senescence, Wnt signaling pathway, axon guidance, long-term potentiation, cholinergic synapse, apelin signaling pathway, glutamatergic synapse, and GABAergic synapse (Figure 9C).
Gene Set Enrichment Analysis (GSEA) identified coordinated gene expression patterns distinguishing the glutamate (GL) and extracellular vesicle-treated (GL_EV) groups. Figure 9D presents Hallmark gene set results, demonstrating signatures significantly activated in the control group (K) (NES > 0) compared to the glutamate group (GL) (NES < 0) at p-value < 0.05.
4. Discussion
Dysregulation of the glutamatergic system is a fundamental pathogenetic mechanism underlying neural tissue damage in a variety of neurological disorders. Disruption of the glutamate balance in the nervous system leads to the development of excitotoxicity and irreversible damage to neurons. Current approaches to the treatment of glutamate excitotoxicity have limited efficacy because of the complexity of the pathogenetic mechanisms of this process. To date, therapy based on extracellular vesicles (EVs) is a promising tool for regenerative medicine as it has several advantages over cell therapeutic strategies and conventional pharmacological drugs [274]. EVs are spherical membrane structures formed by invagination of the cytoplasmic membrane during exocytotic processes. The structural organisation of EVs, including a bilipid layer, ensures their long-term stability in tissue fluid and systemic blood flow. The presence of receptor proteins on the vesicle surface ensures their specific interaction with target cells, and the multicomponent composition helps to achieve a complex effect on cellular structures [275]. This work investigated the neuroprotective effect of EVs derived from glial progenitor cells in a model of glutamate excitotoxicity. EV-GPCs neutralised the effect of glutamate excitotoxicity and increased the survival of cortical neurons. This effect is probably due to the presence of proteins in EV-GPCs that inhibit the apoptotic cascade, such as the 14-3-3 protein, which is an inhibitor of the proapoptotic protein Bad, which may indicate the ability of EVs to reduce cell death. Proteins related to the development of the nervous system and regeneration have also been found to have a protective effect against toxic effects, such as the proteins PEDF and Copine 1 [276].
During synaptic transmission, glutamate is released into the synaptic cleft and binds to specific receptors on the postsynaptic membrane. The activation of these receptors leads to an increased influx of calcium and sodium ions into the cytosol, depolarisation of the membrane and electrical signal transmission. These processes stimulate the activation of intracellular signalling cascades that cause changes in intracellular homeostasis. Pathological accumulation of glutamate causes hyperstimulation of receptors (the phenomenon of excitotoxicity), which leads to a critical increase in intracellular Ca²⁺ and eventually to neuronal death [277]. Calcium imaging showed that pre-incubation of cortical neurons with EV-GPCs leads to a less efficient accumulation of free calcium in the cytoplasm. Such an effect could presumably be related to a more efficient operation of the calcium exchangers that remove excess calcium from the cells into the intercellular space, as well as to a more efficient operation of the ATP-dependent pumps at the membrane of the endoplasmic reticulum and the outer membrane of the mitochondria, as both organelles can serve as calcium depots [278,279]. Next, the ability of neurons to restore their original level of intracellular calcium after cytoplasmic overload was analysed. It was found that cortical neurons pre-incubated with EV-GPCs restored the original level of cytosolic calcium more effectively than the control culture, which could also be related to changes in the functioning of the calcium exchangers. According to transcriptome analysis, the addition of EV-GPCs after exposure to glutamate decreased the expression of genes related to the development of the glutamatergic synapse, such as Plcb1, Prkacb, Cacna1c, Cacna1d [280], as well as with calcium transport in neurons, reducing the expression of calcium transmembrane channel genes such as Atp2b4, Atp2b1, Plcb1, Ryr2, which contributes to less efficient entry of calcium ions into the cytosol of neurons upon calcium overload. In addition, incubation of cortical neurons with EV-GPCs reduced the expression of genes responsible for dendrite growth and branching, which may also contribute to the protective effect, as a reduction in the number of dendritic spines reduces the total number of synapses and thus reduces the total number of receptors that are channels for calcium entry. This is consistent with existing data showing that neurons can suppress the formation of processes and synapses under certain conditions, particularly during processes that are essential for survival. This suppression is not a general suppression of dendritic and axonal development, but a specific mechanism that priorities survival under conditions of limited resources or stress [281,282]. One of the most important consequences of cytosolic overload is the secondary accumulation of Ca²⁺ in the mitochondria, which acts as a trigger for the impairment of the electron transport chain and promotes oxidative stress, the synthesis of reactive oxygen species (ROS) and the disruption of cellular respiration. Furthermore, the increased permeability of the mitochondrial membrane contributes to the activation of cell death pathways [283]. These findings are consistent with the data obtained in the present study, as rhodamine-based imaging showed that a 15-min exposure to glutamate caused a collapse of the mitochondrial membrane potential (ΔΨm) in cortical neurons. At the same time, the addition of EV-GPCs stabilised mitochondrial function during glutamate toxicity, which contributed to the neuroprotection of neurons and more effectively restored the mitochondrial potential to baseline after glutamate exposure. Proteomic analysis revealed that EV-GPCs contain proteins associated with redox processes, the response to hypoxia and the response to reactive oxygen species. These include various peroxiredoxins involved in the Hif-1-alpha signalling pathway and the protein Hypoxia Up-Regulated 1, which responds to reduced oxygen levels in cells. These data were confirmed by transcriptomic analysis, as the addition of extracellular vesicles increased the expression of genes related to the above signalling pathways. It is well known that reactive oxygen species, including hydrogen peroxide, are the main cause of membrane permeability disruption, leading to the breakdown of mitochondrial membrane potential [284]. Their neutralisation therefore helps to the maintenance of proper mitochondrial function. These data suggest that EVs exert their neuroprotective effect by stabilising mitochondrial function during glutamate hyperstimulation through the attenuation of oxidative stress and the removal of reactive oxygen species.
Memantine was selected as the positive control in this experiment. Memantine is an FDA-approved drug for the treatment of various neurological disorders. Its simultaneous use with glutamate increased the survival rate of neurons to the control level. The mechanism of action of memantine is based on its interaction with NMDA receptors and inhibition of calcium ion influx into the cells, which promotes neuron survival and protects them from calcium overload [285]. Comparison of EV-GPCs and memantine with the MTT assay showed that both agents increased neuronal survival to control levels during glutamate exposure. Morphometric analysis of cell death showed that both compounds also significantly increased the proportion of viable cells and significantly decreased the proportion of necrotic cells.
The mechanism of action of EVs is based on the primary interaction with the target cells and begins with attachment to the cell membrane by special receptor proteins that recognise the corresponding molecules on the vesicle surface [19]. After attachment, EVs are internalised by phagocytosis, which is characterised by a latency period of several hours, or by membrane fusion with a time interval of 1–3 hours, depending on the initial concentration of extracellular vesicles in the medium, and complete accumulation after 10–12 hours [286]. After internalisation, the vesicle content is released into the cytoplasm or intercellular space and signalling pathways are initiated. The content of extracellular vesicles assessed by proteomic analysis revealed proteins that can initiate signalling pathways: NIK-Nf-kappaB, PI3K-Akt, MAPK, HIF-1 and Apelin, which was confirmed by transcriptomic analyses during incubation of EV-GPCs with intact cortical neurons.
Upon glutamate excitotoxicity, the addition of EV-GPCs triggered the activation of the following signalling pathways: PI3K-Akt, Focal adhesion, Phagosome and Regulation of the actin cytoskeleton regulation. At the same time, the signalling pathways responsible for the formation of dopaminergic, glutamatergic, cholinergic and GABAergic synapses, long-term potentiation, axonal growth direction and calcium signalling were inhibited. Despite the similar efficacy of the neuroprotective effects of EV-GPCs and memantine, the signalling pathways they activated were different. The addition of memantine led to increased expression of genes associated with the following signalling pathways: Axonogenesis, dendritic tree expansion, control of neurotransmitter synthesis, regulation of membrane depolarisation and glutamatergic synapse formation, as well as MAPK signalling, neurotrophin signalling and synaptic vesicle synthesis cycle. At the same time, memantine did not activate signalling pathways related to PI3K-Akt, regeneration and oxidative stress response, but on the contrary stimulated the development of different types of synapses and supported neurotransmitter transmission. These processes indicate that the two drugs follow different pathways of neuroprotection: While memantine inhibits the influx of calcium ions into the cell under the influence of excess glutamate by binding to calcium transporters, EV-GPCs stimulate the pathways within cells responsible for the protective effect of glutamate by decreasing the expression of genes related to neurotransmission and increasing the expression of survival signalling pathway genes, such as PI3K-Akt.
One of the main pathways involved in the neuroprotection of neurons is PI3K-Akt. This is one of the most extensive signalling pathways responsible for the maintenance of homeostasis, control of intracellular calcium levels, survival, growth and development of the dendrite tree and negative regulation of apoptosis [287,288]. Proteomic analysis revealed proteins that are activators of this signalling pathway: HSP90 protein subunits, Jak kinase subunits and Cdc37 protein. Its activation during glutamate excitotoxicity may play a key role in the mechanisms of neuroprotection. In the glutamate excitotoxicity model, the addition of a selective PI3Kᵧ inhibitor - AS605240 - completely neutralised the neuroprotective effect of EV-GPCs. Transcriptomic analyses also confirmed that EV-GPCs increase the expression of genes that activate this signalling cascade in both intact cells and cells exposed to glutamate. Previously, the involvement of PI3K-Akt in the neuroprotective effect of extracellular vesicles isolated from MSCs and NSCs has been demonstrated in models of glucose deprivation, oxidative stress, amyloid and glutamate toxicity, which is consistent with the data obtained in this study [289,290,291,292,293,294,295,296,297].
Thus, this study demonstrates that extracellular vesicles from human glial progenitor cells have a neuroprotective effect related to the regulation of intracellular homeostasis, calcium ion transport and maintenance of mitochondrial function. Presumably, the mechanism of the neuroprotective effect is linked to the activation of the PI3K-Akt signalling pathway. However, further studies are needed to investigate the mechanisms of the neuroprotective effect of extracellular vesicles in more detail.
5. Conclusions
The results suggest that extracellular vesicles secreted by human GPCs may exert a neuroprotective effect in glutamate excitotoxicity. Mechanisms likely include a reduction in free cytoplasmic calcium levels and stabilisation of mitochondrial potential against a background of glutamate action due to activation of various signalling pathways, including PI3K-Akt. The observed multitarget effect appears to be associated with proteins that are part of the membrane and cargo of the extracellular vesicle.
Supplementary Materials
The following supporting information can be downloaded at the website of this paper posted on Preprints.org.
Author Contributions
D.S. and D.G. contributed to the study conception and design. M.S. performed the experiments, analyzed the experimental data, prepared the figures, and wrote the manuscript. Z.B. contributed to the study conception and design and performed the experiments, analyzed the data and participated in the writing and editing. A.G., E.K., E.G. interpreted the results of the transcriptome profiling, and prepared the figures. I.K. performed the experiments, analyzed the data, prepared the figures, and participated in the writing and editing. A.S. and Y.M. participated in the writing and editing of the manuscript. M.S. and D.F. analysed experimental data. Z.N. prepared primary neuroglial cultures and participated in the writing and editing. V.B., K.S. and T.F. made additions to the manuscript. All authors approved the final version of the manuscript. All the authors agreed to publish this manuscript.
Funding
The work was supported by a grant from the Ministry of Education and Science KBK 075 0110 47 2 U8 70440 621. Scientific topic code: FSSF-2025-0004.
Institutional Review Board Statement
All experimental studies involving animals were conducted in strict compliance with the ethical principles and regulatory documents recommended by the European Science Foundation (ESF) and the Declaration on Humane Treatment of Animals. The research was performed in accordance with Order No. 708n of the Ministry of Health and Social Development of the Russian Federation dated August 23, 2010, titled “On Approval of Laboratory Practices”. Animal care, breeding, and experimental procedures were carried out as required by the Ethical committee of the Federal State Budgetary Scientific Institution «Research Institute of Human Morphology» (Protocol No. 38(14) from May 31 2022), carried out in accordance with Directive 2010/63/EU of the European Parliament and of the Council and ARRIVE guidelines. For skin biopsy collection from donors, informed consent was obtained from all study participants. This procedure was approved by the Institutional Ethics Committee of the Research Centre for Medical Genetics (Protocol No. 2019-2/3 dated October 13, 2020) and in accordance with the Declaration of Helsinki.
Data Availability Statement
The data generated or analysed during the current study that are relevant to the results presented are included in this article and its Supplementary Information files. Other data that were not relevant to the results presented here are available from the corresponding authors on reasonable request. “The mass spectrometry proteomics data have been deposited to the ProteomeXchange Consortium via the PRIDE [http://www.ebi.ac.uk/pride] partner repository with the dataset identifier PXD067360 and 10.6019/PXD067360”. Transcriptomic data have been deposited to the Gene Expression Omnibus, Series numbers for publication GSE282138 and GSE307721.
Acknowledgments
Sequensing and proteomic analysis was performed using the core facilities of the Lopukhin FRCC PCM “Genomics, proteomics, metabolomics” (http://rcpcm.org/?p=2806). We thank Dr. A.M. Surin for useful pieces of advice on measuring intracellular Ca2+ concentration and mitochondrial potential.
Conflicts of Interest
The authors declare no conflicts of interest.
References
- Di Maio, V. The glutamatergic synapse: a complex machinery for information processing. Cognitive Neurodynamics 2021, 15. [Google Scholar] [CrossRef]
- Armada-Moreira, A.; et al. Going the Extra (Synaptic) Mile: Excitotoxicity as the Road Toward Neurodegenerative Diseases. Frontiers in Cellular Neuroscience 2020, 14. [Google Scholar] [CrossRef]
- Ansari, U.; et al. Assessing the efficacy of amyotrophic lateral sclerosis drugs in slowing disease progression: A literature review. AIMS Neurosci 2024, 11, 166–177. [Google Scholar] [CrossRef]
- Tang, B.C.; Wang, Y.T.; Ren, J. Basic information about memantine and its treatment of Alzheimer’s disease and other clinical applications. Ibrain 2023, 9. [Google Scholar] [CrossRef]
- Bellingham, M.C. A Review of the Neural Mechanisms of Action and Clinical Efficiency of Riluzole in Treating Amyotrophic Lateral Sclerosis: What have we Learned in the Last Decade? CNS Neuroscience and Therapeutics 2011, 17. [Google Scholar] [CrossRef]
- Pope, C.; Karanth, S.; Liu, J. Pharmacology and toxicology of cholinesterase inhibitors: Uses and misuses of a common mechanism of action. Environmental Toxicology and Pharmacology 2005, 19. [Google Scholar] [CrossRef] [PubMed]
- Svendsen, S.P.; Svendsen, C.N. Cell therapy for neurological disorders. Nature Medicine 2024, 30, 2756–2770. [Google Scholar] [CrossRef] [PubMed]
- Liang, Y.; Ågren, L.; Lyczek, A.; Walczak, P.; Bulte, J.W.M. Neural progenitor cell survival in mouse brain can be improved by co-transplantation of helper cells expressing bFGF under doxycycline control. Exp Neurol 2013, 247. [Google Scholar] [CrossRef] [PubMed]
- Nakaji-Hirabayashi, T.; Kato, K.; Iwata, H. In vivo study on the survival of neural stem cells transplanted into the rat brain with a collagen hydrogel that incorporates laminin-derived polypeptides. Bioconjug Chem 2013, 24. [Google Scholar] [CrossRef] [PubMed]
- Fujikawa, T.; et al. Teratoma formation leads to failure of treatment for type I diabetes using embryonic stem cell-derived insulin-producing cells. American Journal of Pathology 2005, 166. [Google Scholar] [CrossRef]
- Richards, M.; Fong, C.Y.; Chan, W.K.; Wong, P.C.; Bongso, A. Human feeders support prolonged undifferentiated growth of human inner cell masses and embryonic stem cells. Nat Biotechnol 2002, 20. [Google Scholar] [CrossRef]
- Lee, J.B.; et al. Migration and differentiation of nuclear fluorescence-labeled bone marrow stromal cells after transplantation into cerebral infarct and spinal cord injury in mice. Neuropathology 2003, 23. [Google Scholar] [CrossRef]
- Saboori, M.; Riazi, A.; Taji, M.; Yadegarfar, G. Traumatic brain injury and stem cell treatments: A review of recent 10 years clinical trials. Clinical Neurology and Neurosurgery 2024, 239. [Google Scholar] [CrossRef]
- Baraniak, P.R.; McDevitt, T.C. Stem cell paracrine actions and tissue regeneration. Regenerative Medicine 2010, 5. [Google Scholar] [CrossRef] [PubMed]
- Shimada, I.S.; Spees, J.L. Stem and progenitor cells for neurological repair: Minor issues, major hurdles, and exciting opportunities for paracrine-based therapeutics. J Cell Biochem 2011, 112. [Google Scholar] [CrossRef] [PubMed]
- Bogatcheva, N.V.; Coleman, M.E. Conditioned Medium of Mesenchymal Stromal Cells: A New Class of Therapeutics. Biochemistry (Moscow) 2019, 84. [Google Scholar] [CrossRef] [PubMed]
- Drago, D.; et al. The stem cell secretome and its role in brain repair. Biochimie 2013, 95. [Google Scholar] [CrossRef]
- Xia, X.; Wang, Y.; Zheng, J.C. Extracellular vesicles, from the pathogenesis to the therapy of neurodegenerative diseases. Translational Neurodegeneration 2022, 11. [Google Scholar] [CrossRef]
- Kumar, M.A.; et al. Extracellular vesicles as tools and targets in therapy for diseases. Signal Transduction and Targeted Therapy 2024, 9. [Google Scholar] [CrossRef]
- Lee, H.G.; Wheeler, M.A.; Quintana, F.J. Function and therapeutic value of astrocytes in neurological diseases. Nature Reviews Drug Discovery 2022, 21. [Google Scholar] [CrossRef]
- Salikhova, D.I.; et al. Extracellular vesicles of human glial cells exert neuroprotective effects via brain miRNA modulation in a rat model of traumatic brain injury. Sci Rep 2023, 13. [Google Scholar] [CrossRef]
- Salikhova, D.; et al. Therapeutic effects of hipsc-derived glial and neuronal progenitor cells-conditioned medium in experimental ischemic stroke in rats. Int J Mol Sci 2021, 22. [Google Scholar] [CrossRef]
- Bakaeva, Z.; et al. Lipopolysaccharide From E. coli Increases Glutamate-Induced Disturbances of Calcium Homeostasis, the Functional State of Mitochondria, and the Death of Cultured Cortical Neurons. Front Mol Neurosci 2022, 14. [Google Scholar] [CrossRef] [PubMed]
- Andrews, S.; others. FastQC: a quality control tool for high throughput sequence data. 2010. Https://Www.Bioinformatics.Babraham.Ac.Uk/Projects/Fastqc/ (2019).
- Bolger, A.M.; Lohse, M.; Usadel, B.; Trimmo1; Bolger, A.M.; Lohse, M.; Usadel, B. Trimmomatic: A flexible trimmer for Illumina sequence data. Bioinformatics 2014, 30, 2114–2120. [Google Scholar] [CrossRef]
- Patro, R.; Duggal, G.; Love, M.I.; Irizarry, R.A.; Kingsford, C. Salmon provides fast and bias-aware quantification of transcript expression. Nat Methods 2017, 14. [Google Scholar] [CrossRef] [PubMed]
- Soneson, C.; Love, M.I.; Robinson, M.D. Differential analyses for RNA-seq: transcript-level estimates improve gene-level inferences. F1000Res 2015, 4. [Google Scholar] [CrossRef]
- Robinson, M.D.; McCarthy, D.J.; Smyth, G.K. edgeR: A Bioconductor package for differential expression analysis of digital gene expression data. Bioinformatics 2009, 26. [Google Scholar] [CrossRef]
- Kanehisa, M.; Goto, S. KEGG: Kyoto Encyclopedia of Genes and Genomes. Nucleic Acids Research 2000, 28. [Google Scholar] [CrossRef]
- Kanehisa, M. Toward understanding the origin and evolution of cellular organisms. Protein Science 2019, 28. [Google Scholar] [CrossRef] [PubMed]
- Kanehisa, M.; Furumichi, M.; Sato, Y.; Matsuura, Y.; Ishiguro-Watanabe, M. KEGG: biological systems database as a model of the real world. Nucleic Acids Res 2025, 53, D672–D677. [Google Scholar] [CrossRef]
- Skjeldal, F.M.; et al. De novo formation of early endosomes during Rab5-to-Rab7a transition. J Cell Sci 2021, 134. [Google Scholar] [CrossRef]
- Zhang, L.; et al. STK10 knockout inhibits cell migration and promotes cell proliferation via modulating the activity of ERM and p38 MAPK in prostate cancer cells. Exp Ther Med 2021, 22. [Google Scholar] [CrossRef]
- Shah, J.A.; et al. Genetic variation in toll-interacting protein is associated with leprosy susceptibility and cutaneous expression of interleukin 1 receptor antagonist. Journal of Infectious Diseases 2016, 213. [Google Scholar] [CrossRef]
- Petranka, J.G.; Fleenor, D.E.; Sykes, K.; Kaufman, R.E.; Rosse, W.F. Structure of the CD59-encoding gene: Further evidence of a relationship to murine lymphocyte antigen Ly-6 protein. Proc Natl Acad Sci U S A 1992, 89. [Google Scholar] [CrossRef]
- Pradhan, A.K.; et al. Pharmacological inhibition of MDA-9/Syntenin blocks breast cancer metastasis through suppression of IL-1β. Proc Natl Acad Sci U S A 2021, 118. [Google Scholar] [CrossRef] [PubMed]
- Fukumoto, I.; et al. Abstract 1100: Targeting ITGA3/ITGB1 signaling by tumor-suppressive microRNA-223 inhibits cancer cell migration and invasion in prostate cancer. Cancer Res 2016, 76. [Google Scholar] [CrossRef]
- Yang, Y.; et al. Macrophage MVP regulates fracture repair by promoting M2 polarization via JAK2-STAT6 pathway. Int Immunopharmacol 2023, 120. [Google Scholar] [CrossRef]
- Morozova, K.; et al. Annexin A2 promotes phagophore assembly by enhancing Atg16L+ vesicle biogenesis and homotypic fusion. Nat Commun 2015, 6. [Google Scholar] [CrossRef] [PubMed]
- MacKenzie, E.L.; Ray, P.D.; Tsuji, Y. Role and regulation of ferritin H in rotenone-mediated mitochondrial oxidative stress. Free Radic Biol Med 2008, 44. [Google Scholar] [CrossRef] [PubMed]
- Gao, D.; et al. Peroxiredoxin 6 maintains mitochondrial homeostasis and promotes tumor progression through ROS/JNK/p38 MAPK signaling pathway in multiple myeloma. Sci Rep 2025, 15. [Google Scholar] [CrossRef]
- Papadopoulou, D.; et al. Discovery of the First-in-Class Inhibitors of Hypoxia Up-Regulated Protein 1 (HYOU1) Suppressing Pathogenic Fibroblast Activation. Angewandte Chemie - International Edition 2024, 63. [Google Scholar] [CrossRef]
- Masters, S.C.; Yang, H.; Datta, S.R.; Greenberg, M.E.; Fu, H. 14-3-3 inhibits Bad-induced cell death through interaction with serine-136. Mol Pharmacol 2001, 60. [Google Scholar] [CrossRef] [PubMed]
- Gao, J.; et al. The CUL4-DDB1 ubiquitin ligase complex controls adult and embryonic stem cell differentiation and homeostasis. Elife 2015, 4. [Google Scholar] [CrossRef]
- Bhat, T.A.; et al. Endoplasmic reticulum-mediated unfolded protein response and mitochondrial apoptosis in cancer. Biochimica et Biophysica Acta - Reviews on Cancer 2017, 1867. [Google Scholar] [CrossRef]
- Li, Y.; Cao, S.; Li, Y. Mechanistic study of heat shock protein 60-mediated apoptosis in DF-1 cells. Poult Sci 2024, 103. [Google Scholar] [CrossRef]
- Zhang, H.; et al. DDX1 from Cherry valley duck mediates signaling pathways and anti-NDRV activity. Vet Res 2021, 52. [Google Scholar] [CrossRef]
- Yan, T.; et al. MMP14 regulates cell migration and invasion through epithelial-mesenchymal transition in nasopharyngeal carcinoma. Am J Transl Res 2015, 7. [Google Scholar]
- Sanchez, A.; et al. Pigment epithelium-derived factor (PEDF) protects cortical neurons in vitro from oxidant injury by activation of extracellular signal-regulated kinase (ERK) 1/2 and induction of Bcl-2. Neurosci Res 2012, 72. [Google Scholar] [CrossRef]
- Kim, T.H.; et al. Copine1 regulates neural stem cell functions during brain development. Biochem Biophys Res Commun 2018, 495. [Google Scholar] [CrossRef] [PubMed]
- Namekata, K.; et al. Neuroprotection and axon regeneration by novel low-molecular-weight compounds through the modification of DOCK3 conformation. Cell Death Discov 2023, 9. [Google Scholar] [CrossRef]
- Shirao, T.; et al. The role of drebrin in neurons. Journal of Neurochemistry 2017, 141. [Google Scholar] [CrossRef]
- Kuramoto, T.; et al. Attractin/mahogany/zitter plays a critical role in myelination of the central nervous system. Proc Natl Acad Sci U S A 2001, 98. [Google Scholar] [CrossRef] [PubMed]
- Henderson, M.J.; Richie, C.T.; Airavaara, M.; Wang, Y.; Harvey, B.K. Mesencephalic astrocyte-derived neurotrophic factor (MANF) secretion and cell surface binding are modulated by KDEL receptors. Journal of Biological Chemistry 2013, 288. [Google Scholar] [CrossRef] [PubMed]
- Khan, A.; Sharma, P.; Dahiya, S.; Sharma, B. Plexins: Navigating through the neural regulation and brain pathology. Neuroscience and Biobehavioral Reviews 2025, 169. [Google Scholar] [CrossRef] [PubMed]
- Trochet, D.; Bitoun, M. A review of Dynamin 2 involvement in cancers highlights a promising therapeutic target. Journal of Experimental and Clinical Cancer Research 2021, 40. [Google Scholar] [CrossRef]
- Murga, M.; Fernandez-Capetillo, O.; Tosato, G. Neuropilin-1 regulates attachment in human endothelial cells independently of vascular endothelial growth factor receptor-2. Blood 2005, 105. [Google Scholar] [CrossRef]
- Sánchez-Elsner, T.; Botella, L.M.; Velasco, B.; Langa, C.; Bernabéu, C. Endoglin expression is regulated by transcriptional cooperation between the hypoxia and transforming growth factor-β pathways. Journal of Biological Chemistry 2002, 277. [Google Scholar] [CrossRef]
- Zheng, Y.S.; Liu, Y.L.; Xu, Z.G.; He, C.; Guo, Z.Y. Is myeloid-derived growth factor a ligand of the sphingosine-1-phosphate receptor 2? Biochem Biophys Res Commun 2024, 706. [Google Scholar] [CrossRef]
- Farach-Carson, M.C.; Warren, C.R.; Harrington, D.A.; Carson, D.D. Border patrol: Insights into the unique role of perlecan/heparan sulfate proteoglycan 2 at cell and tissue borders. Matrix Biology 2014, 34. [Google Scholar] [CrossRef]
- Kang, S.W. Superoxide dismutase 2 gene and cancer risk: Evidence from an updated meta-analysis. International Journal of Clinical and Experimental Medicine 2015, 8. [Google Scholar]
- Pei, J.; Pan, X.; Wei, G.; Hua, Y. Research progress of glutathione peroxidase family (GPX) in redoxidation. Frontiers in Pharmacology 2023, 14. [Google Scholar] [CrossRef] [PubMed]
- Liu, Y.; et al. Up-regulation of Cdc37 contributes to schwann cell proliferation and migration after sciatic nerve crush. Neurochem Res 2018, 43. [Google Scholar] [CrossRef]
- Giulino-Roth, L.; et al. Inhibition of Hsp90 suppresses PI3K/AKT/mTOR signaling and has antitumor activity in Burkitt lymphoma. Mol Cancer Ther 2017, 16. [Google Scholar] [CrossRef]
- Bousoik, E.; Montazeri Aliabadi, H. “Do We Know Jack” About JAK? A Closer Look at JAK/STAT Signaling Pathway. Frontiers in Oncology 2018, 8. [Google Scholar] [CrossRef]
- Kamp, M.E.; Liu, Y.; Kortholt, A. Function and regulation of heterotrimeric g proteins during chemotaxis. International Journal of Molecular Sciences 2016, 17. [Google Scholar] [CrossRef]
- Yuasa-Kawada, J.; Kinoshita-Kawada, M.; Tsuboi, Y.; Wu, J.Y. Neuronal guidance genes in health and diseases. Protein and Cell 2023, 14. [Google Scholar] [CrossRef]
- Andermatt, I.; et al. Semaphorin 6B acts as a receptor in post-crossing commissural axon guidance. Development (Cambridge) 2014, 141. [Google Scholar]
- Xu, N.J.; Henkemeyer, M. Ephrin reverse signaling in axon guidance and synaptogenesis. Seminars in Cell and Developmental Biology 2012, 23. [Google Scholar] [CrossRef] [PubMed]
- Long, H.; et al. Conserved roles for Slit and Robo proteins in midline commissural axon guidance. Neuron 2004, 42. [Google Scholar] [CrossRef] [PubMed]
- Salikhova, D.I.; et al. Neuroprotective and anti-inflammatory properties of proteins secreted by glial progenitor cells derived from human iPSCs. Front Cell Neurosci 2024, 18. [Google Scholar] [CrossRef]
- Zgodova, A.; et al. Isoliquiritigenin Protects Neuronal Cells against Glutamate Excitotoxicity. Membranes (Basel) 2022, 12. [Google Scholar] [CrossRef] [PubMed]
- Saganich, M.J.; Machado, E.; Rudy, B. Differential expression of genes encoding subthreshold-operating voltage-gated K+ channels in brain. Journal of Neuroscience 2001, 21. [Google Scholar] [CrossRef]
- Xu, Q.; Fan, G.; Shao, S. Role of TNFRSF12A in cell proliferation, apoptosis, and proinflammatory cytokine expression by regulating the MAPK and NF-κB pathways in thyroid cancer cells. Cytokine 2025, 186. [Google Scholar] [CrossRef] [PubMed]
- Ashutosh; Chao, C.; Borgmann, K.; Brew, K.; Ghorpade, A. Tissue inhibitor of metalloproteinases-1 protects human neurons from staurosporine and HIV-1-induced apoptosis: Mechanisms and relevance to HIV-1-associated dementia. Cell Death Dis 2012, 3. [Google Scholar] [CrossRef]
- Gauthier-Kemper, A.; et al. Annexins A2 and A6 interact with the extreme N terminus of tau and thereby contribute to tau’s axonal localization. Journal of Biological Chemistry 2018, 293. [Google Scholar] [CrossRef]
- Mandal, P.; Belapurkar, V.; Nair, D.; Ramanan, N. Vinculin-mediated axon growth requires interaction with actin but not talin in mouse neocortical neurons. Cellular and Molecular Life Sciences 2021, 78. [Google Scholar] [CrossRef]
- Buttiglione, M.; Revest, J.M.; Rougon, G.; Faivre-Sarrailh, C. F3 neuronal adhesion molecule controls outgrowth and fasciculation of cerebellar granule cell neurites: A cell-type-specific effect mediated by the Ig-like domains. Mol Cell Neurosci 1996, 8. [Google Scholar] [CrossRef]
- Istiaq, A.; Ohta, K. A review on Tsukushi: mammalian development, disorders, and therapy. Journal of Cell Communication and Signaling 2022, 16. [Google Scholar] [CrossRef] [PubMed]
- Gimenez-Cassina, A.; Lim, F.; Cerrato, T.; Palomo, G.M.; Diaz-Nido, J. Mitochondrial hexokinase II promotes neuronal survival and acts downstream of glycogen synthase kinase-3. Journal of Biological Chemistry 2009, 284. [Google Scholar] [CrossRef]
- Nitti, M.; et al. Heme oxygenase 1 in the nervous system: Does it favor neuronal cell survival or induce neurodegeneration? International Journal of Molecular Sciences 2018, 19. [Google Scholar] [CrossRef]
- Dziennis, S.; Alkayed, N.J. Role of Signal Transducer and activator of transcription 3 in neuronal survival and regeneration. Reviews in the Neurosciences 2008, 19. [Google Scholar] [CrossRef] [PubMed]
- Yoshida, T.; et al. Interleukin-1 receptor accessory protein organizes neuronal synaptogenesis as a cell adhesion molecule. Journal of Neuroscience 2012, 32. [Google Scholar] [CrossRef]
- Dzwonek, J.; Wilczyński, G.M. CD44: Molecular interactions, signaling and functions in the nervous system. Front Cell Neurosci 2015, 9. [Google Scholar] [CrossRef]
- Ji, E.; et al. The Chemokine CCL2 Promotes Excitatory Synaptic Transmission in Hippocampal Neurons via GluA1 Subunit Trafficking. Neurosci Bull 2024, 40, 1649–1666. [Google Scholar] [CrossRef]
- Lieberam, I.; Agalliu, D.; Nagasawa, T.; Ericson, J.; Jessell, T.M. A Cxcl12-Cxcr4 chemokine signaling pathway defines the initial trajectory of mammalian motor axons. Neuron 2005, 47. [Google Scholar] [CrossRef]
- Caminero, A.; Comabella, M.; Montalban, X. Role of tumour necrosis factor (TNF)-α and TNFRSF1A R92Q mutation in the pathogenesis of TNF receptor-associated periodic syndrome and multiple sclerosis. Clin Exp Immunol 2011, 166. [Google Scholar] [CrossRef] [PubMed]
- Sun, Z.; et al. EGR1 recruits TET1 to shape the brain methylome during development and upon neuronal activity. Nat Commun 2019, 10. [Google Scholar] [CrossRef]
- Yang, N.J.; et al. Anthrax Toxin as a Molecular Platform to Target Nociceptive Neurons and Modulate Pain. bioRxiv 2020. [Google Scholar] [CrossRef]
- Mohamedi, Y.; Fontanil, T.; Cobo, T.; Cal, S.; Obaya, A.J. New insights into adamts metalloproteases in the central nervous system. Biomolecules 2020, 10. [Google Scholar] [CrossRef]
- Li, J.; Parker, B.; Martyn, C.; Natarajan, C.; Guo, J. The PMP22 gene and its related diseases. Molecular neurobiology 2013, 47. [Google Scholar] [CrossRef]
- Camenisch, T.D.; et al. Disruption of hyaluronan synthase-2 abrogates normal cardiac morphogenesis and hyaluronan-mediated transformation of epithelium to mesenchyme. Journal of Clinical Investigation 2000, 106, 349–360. [Google Scholar] [CrossRef]
- Joy, M.T.; Vrbova, G.; Dhoot, G.K.; Anderson, P.N. Sulf1 and Sulf2 expression in the nervous system and its role in limiting neurite outgrowth in vitro. Exp Neurol 2015, 263. [Google Scholar] [CrossRef] [PubMed]
- Cao, Y.; Jin, H.G.; Ma, H.H.; Zhao, Z.H. Comparative analysis on genome-wide DNA methylation in longissimus dorsi muscle between Small Tailed Han and DorperSmall Tailed Han crossbred sheep. Asian-Australas J Anim Sci 2017, 30. [Google Scholar] [CrossRef] [PubMed]
- Leung, G.; et al. ARPC1B binds WASP to control actin polymerization and curtail tonic signaling in B cells. JCI Insight 2021, 6. [Google Scholar] [CrossRef]
- Kim, H.R.; et al. TAGLN2 polymerizes G-actin in a low ionic state but blocks Arp2/3-nucleated actin branching in physiological conditions. Sci Rep 2018, 8. [Google Scholar] [CrossRef]
- Chen, Z.; Wang, C.; Li, M.; Cai, S.; Liu, X. SPRED3 regulates the NF-κB signaling pathway in thyroid cancer and promotes the proliferation. Sci Rep 2024, 14. [Google Scholar] [CrossRef]
- Pan, A.L.; et al. Dual-specificity protein phosphatase 6 (DUSP6) overexpression reduces amyloid load and improves memory deficits in male 5xFAD mice. Front Aging Neurosci 2024, 16. [Google Scholar] [CrossRef]
- Huang, S.; et al. GLIPR-2 Overexpression in HK-2 Cells Promotes Cell EMT and Migration through ERK1/2 Activation. PLoS One 2013, 8. [Google Scholar] [CrossRef] [PubMed]
- Satoh, J.; Kino, Y.; Yanaizu, M.; Ishida, T.; Saito, Y. Microglia express GPNMB in the brains of Alzheimer’s disease and Nasu-Hakola disease. Intractable Rare Dis Res 2019, 8. [Google Scholar] [CrossRef]
- Seijffers, R.; et al. ATF3 expression improves motor function in the ALS mouse model by promoting motor neuron survival and retaining muscle innervation. Proc Natl Acad Sci U S A 2014, 111. [Google Scholar] [CrossRef]
- Liu, Y.; et al. TRIM25 Promotes TNF-α–Induced NF-κB Activation through Potentiating the K63-Linked Ubiquitination of TRAF2. The Journal of Immunology 2020, 204. [Google Scholar] [CrossRef]
- Ye, J.; et al. Increased expression of immediate early response gene 3 protein promotes aggressive progression and predicts poor prognosis in human bladder cancer. BMC Urol 2018, 18. [Google Scholar] [CrossRef]
- Srivastava, A.K.; et al. Mutant HSPB1 overexpression in neurons is sufficient to cause age-related motor neuronopathy in mice. Neurobiol Dis 2012, 47. [Google Scholar] [CrossRef]
- Jin, H.; Kanthasamy, A.; Anantharam, V.; Rana, A.; Kanthasamy, A.G. Transcriptional regulation of pro-apoptotic protein kinase Cδ: Implications for oxidative stress-induced neuronal cell death. Journal of Biological Chemistry 2011, 286. [Google Scholar] [CrossRef]
- Léger, H.; et al. Ndr kinases regulate retinal interneuron proliferation and homeostasis. Sci Rep 2018, 8. [Google Scholar] [CrossRef]
- Nakazawa, S.; et al. Expression of sorting Nexin 18 (SNX18) is dynamically regulated in developing Spinal Motor Neurons. Journal of Histochemistry and Cytochemistry 2011, 59. [Google Scholar] [CrossRef]
- Corgiat, E.B.; List, S.M.; Rounds, J.C.; Corbett, A.H.; Moberg, K.H. The RNA-binding protein Nab2 regulates the proteome of the developing Drosophila brain. Journal of Biological Chemistry 2021, 297. [Google Scholar] [CrossRef] [PubMed]
- Yang, Z.; Wang, K.K.W. Glial fibrillary acidic protein: From intermediate filament assembly and gliosis to neurobiomarker. Trends in Neurosciences 2015, 38. [Google Scholar] [CrossRef] [PubMed]
- Cai, J.; et al. TMBIM1 promotes proliferation and attenuates apoptosis in glioblastoma cells by targeting the p38 MAPK signalling pathway. Transl Oncol 2022, 19. [Google Scholar] [CrossRef] [PubMed]
- Santoro, A.; et al. BAG3 is involved in neuronal differentiation and migration. Cell Tissue Res 2017, 368. [Google Scholar] [CrossRef]
- Kerosuo, L.; et al. Enhanced expression of MycN/CIP2A drives neural crest toward a neural stem cell-like fate: Implications for priming of neuroblastoma. Proc Natl Acad Sci U S A 2018, 115. [Google Scholar] [CrossRef]
- Pantazopoulos, H.; Woo, T.U.W.; Lim, M.P.; Lange, N.; Berretta, S. Extracellular matrix-glial abnormalities in the amygdala and entorhinal cortex of subjects diagnosed with schizophrenia. Arch Gen Psychiatry 2010, 67. [Google Scholar] [CrossRef] [PubMed]
- Sampieri, L.; Funes Chabán, M.; Di Giusto, P.; Rozés-Salvador, V.; Alvarez, C. CREB3L2 Modulates Nerve Growth Factor-Induced Cell Differentiation. Front Mol Neurosci 2021, 14. [Google Scholar] [CrossRef]
- Shibasaki, K.; Murayama, N.; Ono, K.; Ishizaki, Y.; Tominaga, M. TRPV2 enhances axon outgrowth through its activation by membrane stretch in developing sensory and motor neurons. Journal of Neuroscience 2010, 30. [Google Scholar] [CrossRef]
- Franquinho, F.; et al. The dyslexia-susceptibility protein kiaa0319 inhibits axon growth through smad2 signaling. Cerebral Cortex 2017, 27. [Google Scholar] [CrossRef] [PubMed]
- Jósvay, K.; et al. Besides neuro-imaging, the Thy1-YFP mouse could serve for visualizing experimental tumours, inflammation and wound-healing. Sci Rep 2014, 4. [Google Scholar] [CrossRef] [PubMed]
- Kim, H.R.; et al. NELL2 function in axon development of hippocampal neurons. Mol Cells 2020, 43. [Google Scholar]
- Wang, J.; et al. RTN4/NoGo-receptor binding to BAI adhesion-GPCRs regulates neuronal development. Cell 2021, 184. [Google Scholar] [CrossRef]
- Sherchan, P.; Travis, Z.D.; Tang, J.; Zhang, J.H. The potential of Slit2 as a therapeutic target for central nervous system disorders. Expert Opinion on Therapeutic Targets 2020, 24. [Google Scholar] [CrossRef]
- Gatto, G.; et al. Protein tyrosine phosphatase receptor type O inhibits trigeminal axon growth and branching by repressing TrkB and ret signaling. Ann Intern Med 2013, 158. [Google Scholar] [CrossRef]
- Kim, M.; Roesener, A.P.; Mendonca, P.R.F.; Mastick, G.S. Robo1 and Robo2 have distinct roles in pioneer longitudinal axon guidance. Dev Biol 2011, 358. [Google Scholar] [CrossRef] [PubMed]
- Orioli, D.; Klein, R. The Eph receptor family: Axonal guidance by contact repulsion. Trends in Genetics 1997, 13. [Google Scholar] [CrossRef]
- Corradini, I.; Verderio, C.; Sala, M.; Wilson, M.C.; Matteoli, M. SNAP-25 in neuropsychiatric disorders. Annals of the New York Academy of Sciences 2009, 1152. [Google Scholar] [CrossRef]
- Ha, S.; et al. Cerebellar shank2 regulates excitatory synapse density, motor coordination, and specific repetitive and anxiety-like behaviors. Journal of Neuroscience 2016, 36. [Google Scholar] [CrossRef]
- de Wit, J.; Ghosh, A. Control of neural circuit formation by leucine-rich repeat proteins. Trends in Neurosciences 2014, 37. [Google Scholar] [CrossRef]
- Bustos, F.J.; et al. Epigenetic editing of the Dlg4/PSD95 gene improves cognition in aged and Alzheimer’s disease mice. Brain 2017, 140. [Google Scholar] [CrossRef]
- Niftullayev, S.; Lamarche-Vane, N. Regulators of rho GTPases in the nervous system: Molecular implication in axon guidance and neurological disorders. International Journal of Molecular Sciences 2019, 20. [Google Scholar] [CrossRef]
- Chen, Y.; et al. Ankyrin repeat-rich membrane spanning protein (Kidins220) is required for neurotrophin and ephrin receptor-dependent dendrite development. Journal of Neuroscience 2012, 32. [Google Scholar] [CrossRef] [PubMed]
- Shima, Y.; et al. Opposing roles in neurite growth control by two seven-pass transmembrane cadherins. Nat Neurosci 2007, 10. [Google Scholar] [CrossRef]
- Du, H.; et al. Transcription factors Bcl11a and Bcl11b are required for the production and differentiation of cortical projection neurons. Cerebral Cortex 2022, 32. [Google Scholar] [CrossRef] [PubMed]
- Carreño Gutiérrez, H.; et al. Nitric oxide interacts with monoamine oxidase to modulate aggression and anxiety-like behaviour. European Neuropsychopharmacology 2020, 30. [Google Scholar] [CrossRef]
- Pinna, A.; Serra, M.; Marongiu, J.; Morelli, M. Pharmacological interactions between adenosine A2A receptor antagonists and different neurotransmitter systems. Parkinsonism Relat Disord 2020, 80. [Google Scholar] [CrossRef]
- Tan, J.; et al. Structural insights into thyroid hormone transporter MCT8. Nature Communications 2025, 16. [Google Scholar] [CrossRef]
- Eriksen, J.; Li, F.; Edwards, R.H. The mechanism and regulation of vesicular glutamate transport: Coordination with the synaptic vesicle cycle. Biochimica et Biophysica Acta - Biomembranes 2020, 1862. [Google Scholar] [CrossRef]
- Pizzagalli, M.D.; Bensimon, A.; Superti-Furga, G. A guide to plasma membrane solute carrier proteins. FEBS Journal 2021, 288. [Google Scholar] [CrossRef] [PubMed]
- Batten, S.R.; et al. Linking kindling to increased glutamate release in the dentate gyrus of the hippocampus through the STXBP5/tomosyn-1 gene. Brain Behav 2017, 7. [Google Scholar] [CrossRef]
- Um, J.W.; et al. IQ Motif and SEC7 domain-containing protein 3 (IQSEC3) interacts with gephyrin to promote inhibitory synapse formation. Journal of Biological Chemistry 2016, 291. [Google Scholar] [CrossRef]
- Köster, J.D.; et al. Inositol-1,4,5-trisphosphate-3-kinase-A controls morphology of hippocampal dendritic spines. Cell Signal 2016, 28. [Google Scholar] [CrossRef] [PubMed]
- Matt, L.; Kim, K.; Chowdhury, D.; Hell, J.W. Role of palmitoylation of postsynaptic proteins in promoting synaptic plasticity. Frontiers in Molecular Neuroscience 2019, 12. [Google Scholar] [CrossRef]
- Paul, M.S.; et al. A syndromic neurodevelopmental disorder caused by rare variants in PPFIA3. Am J Hum Genet 2024, 111, 96–118. [Google Scholar] [CrossRef] [PubMed]
- Okerlund, N.D.; et al. Dact1 is a postsynaptic protein required for dendrite, spine, and excitatory synapse development in the mouse forebrain. Journal of Neuroscience 2010, 30. [Google Scholar] [CrossRef] [PubMed]
- Zhang, Y.; et al. Psychomotor development and attention problems caused by a splicing variant of CNKSR2. BMC Med Genomics 2020, 13. [Google Scholar] [CrossRef] [PubMed]
- Kwon, S.E.; Chapman, E.R. Synaptophysin Regulates the Kinetics of Synaptic Vesicle Endocytosis in Central Neurons. Neuron 2011, 70. [Google Scholar] [CrossRef]
- Barman, A.; et al. Genetic variation of the RASGRF1 regulatory region affects human hippocampus-dependent memory. Front Hum Neurosci 2014, 8. [Google Scholar] [CrossRef]
- Ismail, V.; et al. Identification and functional evaluation of GRIA1 missense and truncation variants in individuals with ID: An emerging neurodevelopmental syndrome. Am J Hum Genet 2022, 109. [Google Scholar] [CrossRef]
- Camp, C.R.; Yuan, H. GRIN2D/GluN2D NMDA receptor: Unique features and its contribution to pediatric developmental and epileptic encephalopathy. European Journal of Paediatric Neurology 2020, 24. [Google Scholar] [CrossRef]
- Rigter, P.M.F.; et al. Role of CAMK2D in neurodevelopment and associated conditions. Am J Hum Genet 2024, 111. [Google Scholar] [CrossRef]
- Suthar, S.K.; et al. Bioinformatic Analyses of Canonical Pathways of TSPOAP1 and its Roles in Human Diseases. Front Mol Biosci 2021, 8. [Google Scholar] [CrossRef]
- Wu, L.Y.; Song, Y.J.; Zhang, C.L.; Liu, J. KV Channel-Interacting Proteins in the Neurological and Cardiovascular Systems: An Updated Review. Cells 2023, 12. [Google Scholar] [CrossRef]
- Geering, K. FXYD proteins: New regulators of Na-K-ATPase. American Journal of Physiology - Renal Physiology 2006, 290. [Google Scholar] [CrossRef] [PubMed]
- Murata, K.; et al. Region- and neuronal-subtype-specific expression of Na,K-ATPase alpha and beta subunit isoforms in the mouse brain. Journal of Comparative Neurology 2020, 528. [Google Scholar] [CrossRef]
- Strehler, E.E.; Thayer, S.A. Evidence for a role of plasma membrane calcium pumps in neurodegenerative disease: Recent developments. Neuroscience Letters 2018, 663. [Google Scholar] [CrossRef]
- Cusick, J.K.; Alcaide, J.; Shi, Y. The RELT Family of Proteins: An Increasing Awareness of Their Importance for Cancer, the Immune System, and Development. Biomedicines 2023, 11. [Google Scholar] [CrossRef]
- Ilic, K.; Auer, B.; Mlinac-Jerkovic, K.; Herrera-Molina, R. Neuronal signaling by thy-1 in nanodomains with specific ganglioside composition: Shall we open the door to a new complexity? Front Cell Dev Biol 2019, 7. [Google Scholar] [CrossRef]
- Huang, J.Y.; Wang, K.; Vermehren-Schmaedick, A.; Adelman, J.P.; Cohen, M.S. PARP6 is a Regulator of Hippocampal Dendritic Morphogenesis. Sci Rep 2016, 6. [Google Scholar] [CrossRef]
- Tsou, J.H.; et al. Important Roles of Ring Finger Protein 112 in Embryonic Vascular Development and Brain Functions. Mol Neurobiol 2017, 54. [Google Scholar] [CrossRef]
- Lin, T.Y.; et al. Functional defects in FOXG1 variants predict the severity of brain anomalies in FOXG1 syndrome. Mol Psychiatry 2025. [Google Scholar] [CrossRef] [PubMed]
- Funa, K.; Sasahara, M. The roles of PDGF in development and during neurogenesis in the normal and diseased nervous system. Journal of Neuroimmune Pharmacology 2014, 9. [Google Scholar] [CrossRef] [PubMed]
- Brawley, C.M.; Uysal, S.; Kossiakoff, A.A.; Rock, R.S. Characterization of engineered actin binding proteins that control filament assembly and structure. PLoS One 2010, 5. [Google Scholar] [CrossRef]
- Stark, B.C.; Lanier, M.H.; Cooper, J.A. CARMIL family proteins as multidomain regulators of actin-based motility. Molecular Biology of the Cell 2017, 28. [Google Scholar] [CrossRef] [PubMed]
- Altas, B.; Romanowski, A.J.; Bunce, G.W.; Poulopoulos, A. Neuronal mTOR Outposts: Implications for Translation, Signaling, and Plasticity. Front Cell Neurosci 2022, 16. [Google Scholar] [CrossRef]
- Chouinard, F.C.; Davis, L.; Gilbert, C.; Bourgoin, S.G. Functional Role of AGAP2/PIKE-A in Fcγ Receptor-Mediated Phagocytosis. Cells 2023, 12. [Google Scholar] [CrossRef]
- Zhang, L.; et al. Hypoxia-induced ROS aggravate tumor progression through HIF-1α-SERPINE1 signaling in glioblastoma. J Zhejiang Univ Sci B 2023, 24. [Google Scholar] [CrossRef] [PubMed]
- Chen, H.; et al. The Potential Role of Hypoxia-Inducible Factor-1 in the Progression and Therapy of Central Nervous System Diseases. Curr Neuropharmacol 2021, 20. [Google Scholar] [CrossRef] [PubMed]
- Foxler, D.E.; et al. A HIF – LIMD 1 negative feedback mechanism mitigates the pro-tumorigenic effects of hypoxia. EMBO Mol Med 2018, 10. [Google Scholar] [CrossRef]
- Salma, J.; McDermott, J.C. Suppression of a MEF2-KLF6 survival pathway by PKA signaling promotes apoptosis in embryonic hippocampal neurons. Journal of Neuroscience 2012, 32. [Google Scholar] [CrossRef] [PubMed]
- Bryan, L.; Kordula, T.; Spiegel, S.; Milstien, S. Regulation and functions of sphingosine kinases in the brain. Biochimica et Biophysica Acta - Molecular and Cell Biology of Lipids 2008, 1781. [Google Scholar] [CrossRef]
- Li, M.; Yue, W. VRK2, a Candidate Gene for Psychiatric and Neurological Disorders. Complex Psychiatry 2018, 4. [Google Scholar] [CrossRef] [PubMed]
- Takata, S.; et al. LIF–IGF Axis Contributes to the Proliferation of Neural Progenitor Cells in Developing Rat Cerebrum. Int J Mol Sci 2022, 23. [Google Scholar] [CrossRef]
- Joo, J.Y.; Schaukowitch, K.; Farbiak, L.; Kilaru, G.; Kim, T.K. Stimulus-specific combinatorial functionality of neuronal c-fos enhancers. Nat Neurosci 2015, 19. [Google Scholar] [CrossRef]
- Lu, C.; Jiang, Y.; Xu, W.; Bao, X. Sestrin2: multifaceted functions, molecular basis, and its implications in liver diseases. Cell Death and Disease 2023, 14. [Google Scholar] [CrossRef]
- Baur, K.; et al. Growth/differentiation factor 15 controls ependymal and stem cell number in the V-SVZ. Stem Cell Reports 2024, 19. [Google Scholar] [CrossRef]
- Li, L.; et al. The role of heat shock protein 90B1 in patients with polycystic ovary syndrome. PLoS One 2016, 11. [Google Scholar] [CrossRef]
- Moon, B.S.; et al. Bone morphogenetic protein 4 stimulates neuronal differentiation of neuronal stem cells through the ERK pathway. Exp Mol Med 2009, 41. [Google Scholar] [CrossRef]
- Hwang, J.Y.; Zukin, R.S. REST, a master transcriptional regulator in neurodegenerative disease. Current Opinion in Neurobiology 2018, 48. [Google Scholar] [CrossRef]
- Peiris, M.; et al. Peripheral Kv7 channels regulate visceral sensory function in mouse and human colon. Mol Pain 2017, 13, 1–16. [Google Scholar] [CrossRef]
- Zhong, L.; et al. Identification of the Fosl1/AMPK/autophagy axis involved in apoptotic and inflammatory effects following spinal cord injury. Int Immunopharmacol 2022, 103. [Google Scholar] [CrossRef] [PubMed]
- Singh, K.; et al. TRIB1 confers therapeutic resistance in GBM cells by activating the ERK and Akt pathways. Sci Rep 2023, 13. [Google Scholar] [CrossRef] [PubMed]
- Navarro, E.; Esteras, N. Multitarget Effects of Nrf2 Signalling in the Brain: Common and Specific Functions in Different Cell Types. Antioxidants 2024, 13. [Google Scholar] [CrossRef]
- Kim, S.; et al. The antioxidant enzyme Peroxiredoxin-1 controls stroke-associated microglia against acute ischemic stroke. Redox Biol 2022, 54. [Google Scholar] [CrossRef] [PubMed]
- Biermanns, M.; Gärtner, J. Genomic organization and characterization of human PEX2 encoding a 35-kDa peroxisomal membrane protein. Biochem Biophys Res Commun 2000, 273. [Google Scholar] [CrossRef]
- Winship, A.L.; et al. Interleukin-11 up-regulates endoplasmic reticulum stress induced target, PDIA4 in human first trimester placenta and in vivo in mice. Placenta 2017, 53. [Google Scholar] [CrossRef]
- Petrova, K.; Oyadomari, S.; Hendershot, L.M.; Ron, D. Regulated association of misfolded endoplasmic reticulum lumenal proteins with P58/DNAJc3. EMBO Journal 2008, 27. [Google Scholar] [CrossRef]
- de Souza Ferreira, L.P.; et al. Annexin A1 in neurological disorders: Neuroprotection and glial modulation. Pharmacology and Therapeutics 2025, 267. [Google Scholar] [CrossRef] [PubMed]
- Kollárovič, G.; Topping, C.E.; Shaw, E.P.; Chambers, A.L. The human HELLS chromatin remodelling protein promotes end resection to facilitate homologous recombination and contributes to DSB repair within heterochromatin. Nucleic Acids Res 2020, 48. [Google Scholar] [CrossRef]
- Jin, H.; et al. IER3 is a crucial mediator of TAp73β-induced apoptosis in cervical cancer and confers etoposide sensitivity. Sci Rep 2015, 5. [Google Scholar] [CrossRef] [PubMed]
- Raoul, C.; et al. Motoneuron death triggered by a specific pathway downstream of fas: Potentiation by ALS-linked SOD1 mutations. Neuron 2002, 35. [Google Scholar] [CrossRef]
- Chen, W.; et al. Tumor protein translationally controlled 1 is a p53 target gene that promotes cell survival. Cell Cycle 2013, 12. [Google Scholar] [CrossRef]
- Lozinski, B.M.; Ta, K.; Dong, Y. Emerging role of galectin 3 in neuroinflammation and neurodegeneration. Neural Regeneration Research 2024, 19. [Google Scholar] [CrossRef]
- Hausott, B.; Klimaschewski, L. Sprouty2—a Novel Therapeutic Target in the Nervous System? Molecular Neurobiology 2019, 56. [Google Scholar] [CrossRef]
- Cheng, Z.; et al. The role of KLF4 in Alzheimer’s disease. Frontiers in Cellular Neuroscience 2018, 12. [Google Scholar] [CrossRef]
- Hao, Q.; et al. Cysteine- and glycine-rich protein 1 predicts prognosis and therapy response in patients with acute myeloid leukemia. Clin Exp Med 2024, 24. [Google Scholar] [CrossRef] [PubMed]
- Jiang, D.; et al. Local and transient inhibition of p21 expression ameliorates age-related delayed wound healing. Wound Repair and Regeneration 2020, 28. [Google Scholar] [CrossRef]
- El Soury, M.; Gambarotta, G. Soluble neuregulin-1 (NRG1): A factor promoting peripheral nerve regeneration by affecting Schwann cell activity immediately after injury. Neural Regeneration Research 2019, 14. [Google Scholar] [CrossRef]
- Srivastava, S.; et al. Notch1 regulates the functional contribution of RhoC to cervical carcinoma progression. Br J Cancer 2010, 102. [Google Scholar] [CrossRef]
- Jing, Y.; Jian-Xiong, Y. Human tissue factor pathway inhibitor-2 suppresses the wound-healing activities of human Tenon’s capsule fibroblasts in vitro. Mol Vis 2009, 15. [Google Scholar]
- Farooq, M.; Khan, A.W.; Kim, M.S.; Choi, S. The role of fibroblast growth factor (FGF) signaling in tissue repair and regeneration. Cells 2021, 10. [Google Scholar] [CrossRef] [PubMed]
- Takouda, J.; Katada, S.; Imamura, T.; Sanosaka, T.; Nakashima, K. SoxE group transcription factor Sox8 promotes astrocytic differentiation of neural stem/precursor cells downstream of Nfia. Pharmacol Res Perspect 2021, 9. [Google Scholar] [CrossRef] [PubMed]
- Kim, J.; Lo, L.; Dormand, E.; Anderson, D.J. SOX10 maintains multipotency and inhibits neuronal differentiation of neural crest stem cells. Neuron 2003, 38. [Google Scholar] [CrossRef]
- Warner, L.E.; et al. Mutations in the early growth response 2 (EGR2) gene are associated with hereditary myelinopathies. Nat Genet 1998, 18. [Google Scholar] [CrossRef]
- Greene, L.A.; Lee, H.Y.; Angelastro, J.M. The transcription factor ATF5: Role in neurodevelopment and neural tumors. Journal of Neurochemistry 2009, 108. [Google Scholar] [CrossRef]
- Briscoe, J.; et al. Homeobox gene Nkx2.2 and specification of neuronal identity by graded Sonic hedgehog signalling. Nature 1999, 398. [Google Scholar] [CrossRef]
- Tu, M.; et al. Notch1 signaling activation contributes to adult hippocampal neurogenesis following traumatic brain injury. Medical Science Monitor 2017, 23. [Google Scholar] [CrossRef]
- Escobedo, N.; et al. Syndecan 4 interacts genetically with Vangl2 to regulate neural tube closure and planar cell polarity. Development (Cambridge) 2013, 140. [Google Scholar]
- Wu, Y.; et al. CXCL12 increases human neural progenitor cell proliferation through Akt-1/FOXO3a signaling pathway. J Neurochem 2009, 109. [Google Scholar] [CrossRef]
- Chi, S.; et al. Astrocytic Piezo1-mediated mechanotransduction determines adult neurogenesis and cognitive functions. Neuron 2022, 110. [Google Scholar] [CrossRef]
- Tamura, R.E.; et al. GADD45 Proteins: Central Players in Tumorigenesis. Curr Mol Med 2012, 12. [Google Scholar] [CrossRef]
- Liu, C.; et al. Protein phosphatase 1 regulatory subunit 15 A promotes translation initiation and induces G2M phase arrest during cuproptosis in cancers. Cell Death Dis 2024, 15. [Google Scholar] [CrossRef] [PubMed]
- Grubbs, E.G.; et al. Role of CDKN2C copy number in sporadic medullary thyroid carcinoma. Thyroid 2016, 26. [Google Scholar] [CrossRef] [PubMed]
- Rogers, C.D.; Phillips, J.L.; Bronner, M.E. Elk3 is essential for the progression from progenitor to definitive neural crest cell. Dev Biol 2013, 374. [Google Scholar] [CrossRef] [PubMed]
- Rudenok, M.M.; et al. Expression Analysis of Genes Involved in Transport Processes in Mice with MPTP-Induced Model of Parkinson’s Disease. Life 2022, 12. [Google Scholar] [CrossRef]
- Ould-Yahoui, A.; et al. A new role for TIMP-1 in modulating neurite outgrowth and morphology of cortical neurons. PLoS One 2009, 4. [Google Scholar] [CrossRef] [PubMed]
- Huang, T.; et al. Fgr contributes to hemorrhage-induced thalamic pain by activating NF-κB/ ERK1/2 pathways. JCI Insight 2020, 5. [Google Scholar] [CrossRef] [PubMed]
- Islam, M.I.; et al. Thioredoxin-1 protein interactions in neuronal survival and neurodegeneration. Biochim Biophys Acta Mol Basis Dis 2025, 1871. [Google Scholar] [CrossRef] [PubMed]
- Mohammadzadeh, P.; Amberg, G.C. AXL/Gas6 signaling mechanisms in the hypothalamic-pituitary-gonadal axis. Frontiers in Endocrinology 2023, 14. [Google Scholar] [CrossRef]
- Lyngstadaas, A.V.; et al. Anti-Inflammatory and Pro-Resolving Actions of the N-Terminal Peptides Ac2-26, Ac2-12, and Ac9-25 of Annexin A1 on Conjunctival Goblet Cell Function. American Journal of Pathology 2023, 193. [Google Scholar] [CrossRef]
- Zheng, S.L.; Li, Z.Y.; Song, J.; Liu, J.M.; Miao, C.Y. Metrnl: A secreted protein with new emerging functions. Acta Pharmacologica Sinica 2016, 37. [Google Scholar] [CrossRef]
- Fischer-Huchzermeyer, S.; et al. The Cellular Retinoic Acid Binding Protein 2 Promotes Survival of Malignant Peripheral Nerve Sheath Tumor Cells. American Journal of Pathology 2017, 187. [Google Scholar] [CrossRef]
- Schaeffer, J.; Tannahill, D.; Cioni, J.M.; Rowlands, D.; Keynes, R. Identification of the extracellular matrix protein Fibulin-2 as a regulator of spinal nerve organization. Dev Biol 2018, 442. [Google Scholar] [CrossRef]
- Nonaka, M.; Fukuda, M. Galectin-1 for Neuroprotection? Immunity 2012, 37. [Google Scholar] [CrossRef]
- Chen, M.X.; Oh, Y.S.; Kim, Y. S100A10 and its binding partners in depression and antidepressant actions. Frontiers in Molecular Neuroscience 2022, 15. [Google Scholar] [CrossRef]
- Iwanicka, J.; et al. The Association of ADAMTS7 Gene Polymorphisms with the Risk of Coronary Artery Disease Occurrence and Cardiovascular Survival in the Polish Population: A Case-Control and a Prospective Cohort Study. Int J Mol Sci 2024, 25. [Google Scholar] [CrossRef]
- Pagnamenta, A.T.; et al. An ancestral 10-bp repeat expansion in VWA1 causes recessive hereditary motor neuropathy. Brain 2021, 144. [Google Scholar] [CrossRef]
- Konietzny, A.; Bär, J.; Mikhaylova, M. Dendritic actin cytoskeleton: Structure, functions, and regulations. Frontiers in Cellular Neuroscience 2017, 11. [Google Scholar] [CrossRef] [PubMed]
- Kim, N.C.; et al. Gene ontology analysis of pairwise genetic associations in two genome-wide studies of sporadic ALS. BioData Min 2012, 5. [Google Scholar] [CrossRef] [PubMed]
- Notter, T.; et al. Neuronal activity increases translocator protein (TSPO) levels. Mol Psychiatry 2021, 26. [Google Scholar] [CrossRef] [PubMed]
- Silbereis, J.C.; et al. Olig1 Function Is Required to Repress Dlx1/2 and Interneuron Production in Mammalian Brain. Neuron 2014, 81. [Google Scholar] [CrossRef]
- Gómez de San José, N.; et al. Neuronal pentraxins as biomarkers of synaptic activity: from physiological functions to pathological changes in neurodegeneration. Journal of Neural Transmission 2022, 129. [Google Scholar] [CrossRef]
- Uzor, N.E.; et al. Aging lowers PEX5 levels in cortical neurons in male and female mouse brains. Molecular and Cellular Neuroscience 2020, 107. [Google Scholar] [CrossRef]
- Chapleau, A.; et al. Neuropathological characterization of the cavitating leukoencephalopathy caused by COA8 cytochrome c oxidase deficiency: a case report. Front Cell Neurosci 2023, 17. [Google Scholar] [CrossRef]
- Mucha, M.; et al. Lipocalin-2 controls neuronal excitability and anxiety by regulating dendritic spine formation and maturation. Proc Natl Acad Sci U S A 2011, 108. [Google Scholar] [CrossRef]
- Kolobynina, K.G.; Solovyova, V.V.; Levay, K.; Rizvanov, A.A.; Slepak, V.Z. Emerging roles of the single EF-hand Ca2+ sensor tescalcin in the regulation of gene expression, cell growth and differentiation. Journal of Cell Science 2016, 129. [Google Scholar] [CrossRef]
- Nixon, B.; et al. The role of the molecular chaperone heat shock protein A2 (HSPA2) in regulating human sperm-egg recognition. Asian Journal of Andrology 2015, 17. [Google Scholar] [CrossRef] [PubMed]
- Wang, J.; et al. GAD65 tunes the functions of Best1 as a GABA receptor and a neurotransmitter conducting channel. Nature Communications 2024, 15. [Google Scholar] [CrossRef] [PubMed]
- Gotliv, I.L. FXYD5: Na + /K + -ATPase regulator in health and disease. Frontiers in Cell and Developmental Biology 2016, 4. [Google Scholar] [CrossRef]
- Shen, J.; et al. Severe ocular phenotypes in Rbp4-deficient mice in the C57BL/6 genetic background. Laboratory Investigation 2016, 96. [Google Scholar] [CrossRef]
- Reichmann, F.; Holzer, P. Neuropeptide Y: A stressful review. Neuropeptides 2016, 55. [Google Scholar] [CrossRef]
- Zhu, Z.; et al. SCN1B Genetic Variants: A Review of the Spectrum of Clinical Phenotypes and a Report of Early Myoclonic Encephalopathy. Children 2022, 9. [Google Scholar] [CrossRef]
- Pang, W.; et al. Untangle the Multi-Facet Functions of Auts2 as an Entry Point to Understand Neurodevelopmental Disorders. Frontiers in Psychiatry 2021, 12. [Google Scholar] [CrossRef]
- Wagner, M.; et al. Loss of TNR causes a nonprogressive neurodevelopmental disorder with spasticity and transient opisthotonus. Genetics in Medicine 2020, 22. [Google Scholar] [CrossRef]
- Ageta-Ishihara, N.; Kinoshita, M. Developmental and postdevelopmental roles of septins in the brain. Neuroscience Research 2021, 170. [Google Scholar] [CrossRef]
- Cukier, H.N.; et al. An Alzheimer’s disease risk variant in TTC3 modifies the actin cytoskeleton organization and the PI3K-Akt signaling pathway in iPSC-derived forebrain neurons. Neurobiol Aging 2023, 131. [Google Scholar] [CrossRef] [PubMed]
- Carvalho, S.D.S.; et al. Vangl2 acts at the interface between actin and N-cadherin to modulate mammalian neuronal outgrowth. Elife 2020, 9. [Google Scholar]
- Rolando, C.; et al. Multipotency of Adult Hippocampal NSCs In Vivo Is Restricted by Drosha/NFIB. Cell Stem Cell 2016, 19. [Google Scholar] [CrossRef]
- Ruiz-Gabarre, D.; Carnero-Espejo, A.; Ávila, J.; García-Escudero, V. What’s in a Gene? The Outstanding Diversity of MAPT. Cells 2022, 11. [Google Scholar] [CrossRef]
- Li, W.; et al. KIF5C deficiency causes abnormal cortical neuronal migration, dendritic branching, and spine morphology in mice. Pediatr Res 2022, 92. [Google Scholar] [CrossRef] [PubMed]
- Sakabe, I.; Hu, R.; Jin, L.; Clarke, R.; Kasid, U.N. TMEM33: a new stress-inducible endoplasmic reticulum transmembrane protein and modulator of the unfolded protein response signaling. Breast Cancer Res Treat 2015, 153. [Google Scholar] [CrossRef]
- Martínez, J.C.; et al. Pum2 Shapes the Transcriptome in Developing Axons through Retention of Target mRNAs in the Cell Body. Neuron 2019, 104. [Google Scholar] [CrossRef] [PubMed]
- Desole, C.; et al. HGF and MET: From Brain Development to Neurological Disorders. Frontiers in Cell and Developmental Biology 2021, 9. [Google Scholar] [CrossRef]
- Łuczyńska, K.; Zhang, Z.; Pietras, T.; Zhang, Y.; Taniguchi, H. NFE2L1/Nrf1 serves as a potential therapeutical target for neurodegenerative diseases. Redox Biology 2024, 69. [Google Scholar] [CrossRef]
- Higelin, J.; et al. NEK1 loss-of-function mutation induces DNA damage accumulation in ALS patient-derived motoneurons. Stem Cell Res 2018, 30. [Google Scholar] [CrossRef]
- Santo, E.E.; Paik, J. FOXO in Neural Cells and Diseases of the Nervous System. Current Topics in Developmental Biology 2018, 127. [Google Scholar]
- Klopf, E.; Schmidt, H.A.; Clauder-Münster, S.; Steinmetz, L.M.; Schüller, C. INO80 represses osmostress induced gene expression by resetting promoter proximal nucleosomes. Nucleic Acids Res 2017, 45. [Google Scholar] [CrossRef]
- Yue, W.; et al. Deubiquitination of SARM1 by USP13 regulates SARM1 activation and axon degeneration. Life Medicine 2023, 2. [Google Scholar] [CrossRef] [PubMed]
- Zhang, Z.; Zhao, Y. Progress on the roles of MEF2C in neuropsychiatric diseases. Molecular Brain 2022, 15. [Google Scholar] [CrossRef]
- Jia, Z.; Bachelin, C.; Nait Oumesmar, B.; Bouslama-Oueghlani, L.; Bouslama-Oueghlani, L. The intellectual disability protein PAK3 regulates oligodendrocyte precursor cell differentiation. Neurobiol Dis 2017, 98. [Google Scholar]
- Flores, C.E.; Méndez, P. Shaping inhibition: Activity dependent structural plasticity of GABAergic synapses. Frontiers in Cellular Neuroscience 2014, 8. [Google Scholar] [CrossRef]
- Hussain, N.K.; Hsin, H.; Huganir, R.L.; Sheng, M. MINK and TNIK differentially act on Rap2-mediated signal transduction to regulate neuronal structure and AMPA receptor function. Journal of Neuroscience 2010, 30. [Google Scholar] [CrossRef] [PubMed]
- Aabdien, A.; et al. Schizophrenia risk proteins ZNF804A and NT5C2 interact in cortical neurons. European Journal of Neuroscience 2024, 59. [Google Scholar] [CrossRef]
- Guo, H.; et al. Disruptive mutations in TANC2 define a neurodevelopmental syndrome associated with psychiatric disorders. Nat Commun 2019, 10. [Google Scholar] [CrossRef]
- Assali, A.; et al. EphB1 controls long-range cortical axon guidance through a cell non-autonomous role in GABAergic cells. Development (Cambridge) 2024, 151. [Google Scholar] [CrossRef]
- Nagy, G.N.; et al. Structure and function of Semaphorin-5A glycosaminoglycan interactions. Nat Commun 2024, 15. [Google Scholar] [CrossRef]
- Le, V.H.; et al. CXCL12 promotes the crossing of retinal ganglion cell axons at the optic chiasm. Development (Cambridge) 2024, 151. [Google Scholar] [CrossRef] [PubMed]
- Chang, C.; et al. Ubiquitin ligase and signalling hub MYCBP2 is required for efficient EPHB2 tyrosine kinase receptor function. Elife 2024, 12. [Google Scholar] [CrossRef]
- Koga, M.; et al. Involvement of SMARCA2/BRM in the SWI/SNF chromatin-remodeling complex in schizophrenia. Hum Mol Genet 2009, 18. [Google Scholar] [CrossRef]
- Hayek, L. El et al. Kdm5a mutations identified in autism spectrum disorder using forward genetics. Elife 2020, 9. [Google Scholar] [CrossRef] [PubMed]
- Condylis, C.; et al. Dense functional and molecular readout of a circuit hub in sensory cortex. Science (1979) 2022, 375. [Google Scholar] [CrossRef]
- Sollazzo, R.; et al. Structural and functional alterations of neurons derived from sporadic Alzheimer’s disease hiPSCs are associated with downregulation of the LIMK1-cofilin axis. Alzheimer’s Research and Therapy 2024, 16. [Google Scholar] [CrossRef]
- Baumgärtel, K.; et al. PDE4D regulates Spine Plasticity and Memory in the Retrosplenial Cortex. Sci Rep 2018, 8. [Google Scholar] [CrossRef]
- Nishioka, M.; et al. Neuronal cell-type specific DNA methylation patterns of the Cacna1c gene. International Journal of Developmental Neuroscience 2013, 31. [Google Scholar] [CrossRef]
- Muresan, V.; et al. KIF3C and KIF3A form a novel neuronal heteromeric kinesin that associates with membrane vesicles. Mol Biol Cell 1998, 9. [Google Scholar] [CrossRef]
- Kanai, Y.; et al. KIF5C, a novel neuronal kinesin enriched in motor neurons. Journal of Neuroscience 2000, 20. [Google Scholar] [CrossRef]
- Reed, S.L.; Escayg, A. Extracellular vesicles in the treatment of neurological disorders. Neurobiology of Disease 2021, 157. [Google Scholar] [CrossRef]
- Ginini, L.; Billan, S.; Fridman, E.; Gil, Z. Insight into Extracellular Vesicle-Cell Communication: From Cell Recognition to Intracellular Fate. Cells 2022, 11. [Google Scholar] [CrossRef]
- Bürger, S.; et al. Pigment epithelium-derived factor (Pedf) receptors are involved in survival of retinal neurons. Int J Mol Sci 2021, 22. [Google Scholar] [CrossRef]
- Wu, W.L.; Gong, X.X.; Qin, Z.H.; Wang, Y. Molecular mechanisms of excitotoxicity and their relevance to the pathogenesis of neurodegenerative diseases—an update. Acta Pharmacologica Sinica 2025. [Google Scholar] [CrossRef] [PubMed]
- Segal, M.; Korkotian, E. Endoplasmic reticulum calcium stores in dendritic spines. Frontiers in Neuroanatomy 2014, 8. [Google Scholar] [CrossRef] [PubMed]
- Pivovarova, N.B.; Andrews, S.B. Calcium-dependent mitochondrial function and dysfunction in neurons: Minireview. FEBS Journal 2010, 277. [Google Scholar] [CrossRef] [PubMed]
- Spires, T.L.; et al. Activity-dependent regulation of synapse and dendritic spine morphology in developing barrel cortex requires phospholipase C-β1 signalling. Cerebral Cortex 2005, 15, 385–393. [Google Scholar] [CrossRef]
- Krishnan, A.; et al. Survival of compromised adult sensory neurons involves macrovesicular formation. Cell Death Discov 2022, 8. [Google Scholar] [CrossRef]
- Vaillant, A.R.; et al. Signaling mechanisms underlying reversible activity-dependent dendrite formation. Neuron 2002, 34. [Google Scholar] [CrossRef]
- Nicosia, N.; Giovenzana, M.; Misztak, P.; Mingardi, J.; Musazzi, L. Glutamate-Mediated Excitotoxicity in the Pathogenesis and Treatment of Neurodevelopmental and Adult Mental Disorders. International Journal of Molecular Sciences 2024, 25. [Google Scholar] [CrossRef]
- Biswas, K.; Alexander, K.; Francis, M.M. Reactive Oxygen Species: Angels and Demons in the Life of a Neuron. NeuroSci 2022, 3. [Google Scholar] [CrossRef] [PubMed]
- Phillips, M.B.; Povysheva, N.V.; Harnett-Scott, K.A.; Aizenman, E.; Johnson, J.W. State-specific inhibition of NMDA receptors by memantine depends on intracellular calcium and provides insights into NMDAR channel blocker tolerability. 2024. [CrossRef]
- Bonsergent, E.; et al. Quantitative characterization of extracellular vesicle uptake and content delivery within mammalian cells. Nat Commun 2021, 12. [Google Scholar] [CrossRef] [PubMed]
- Read, D.E.; Gorman, A.M. Involvement of Akt in neurite outgrowth. Cellular and Molecular Life Sciences 2009, 66. [Google Scholar] [CrossRef]
- Sánchez-Alegría, K.; Flores-León, M.; Avila-Muñoz, E.; Rodríguez-Corona, N.; Arias, C. PI3K signaling in neurons: A central node for the control of multiple functions. International Journal of Molecular Sciences 2018, 19. [Google Scholar] [CrossRef] [PubMed]
- Turovsky, E.A.; et al. Mesenchymal stromal cell-derived extracellular vesicles afford neuroprotection by modulating PI3K/AKT pathway and calcium oscillations. Int J Biol Sci 2022, 18. [Google Scholar] [CrossRef]
- Bonafede, R.; et al. Exosome derived from murine adipose-derived stromal cells: Neuroprotective effect on in vitro model of amyotrophic lateral sclerosis. Exp Cell Res 2016, 340. [Google Scholar] [CrossRef]
- Rao, S.; et al. Extracellular Vesicles from Human iPSC-derived NSCs Protect Human Neurons Against Aβ-42 Induced Neurodegeneration, Mitochondrial Dysfunction and Tau Phosphorylation. Alzheimer’s & Dementia 2024, 20. [Google Scholar]
- Xiong, W.P.; Yao, W.Q.; Wang, B.; Liu, K. BMSCs-exosomes containing GDF-15 alleviated SH-SY5Y cell injury model of Alzheimer’s disease via AKT/GSK-3β/β-catenin. Brain Res Bull 2021, 177. [Google Scholar] [CrossRef]
- Xie, Y.; et al. Adipose Mesenchymal Stem Cell-Derived Exosomes Enhance PC12 Cell Function through the Activation of the PI3K/AKT Pathway. Stem Cells Int 2021, 2021. [Google Scholar] [CrossRef] [PubMed]
- Wei, H.; et al. Mesenchymal stem cell-derived exosomal miR-223 regulates neuronal cell apoptosis. Cell Death Dis 2020, 11. [Google Scholar]
- Yeung, A.W.K.; et al. Quercetin: Total-scale literature landscape analysis of a valuable nutraceutical with numerous potential applications in the promotion of human and animal health a review. Anim Sci Pap Rep 2021, 39. [Google Scholar]
- Deng, M.; et al. Preservation of neuronal functions by exosomes derived from different human neural cell types under ischemic conditions. European Journal of Neuroscience 2018, 47. [Google Scholar] [CrossRef] [PubMed]
- Namini, M.S.; Beheshtizadeh, N.; Ebrahimi-Barough, S.; Ai, J. Human endometrial stem cell-derived small extracellular vesicles enhance neurite outgrowth and peripheral nerve regeneration through activating the PI3K/AKT signaling pathway. J Transl Med 2025, 23. [Google Scholar] [CrossRef]
Figure 1.
Proteomic analysis of extracellular vesicles from glial progenitor cells. Extracellular vesicle proteins were classified using String 11.8 into: Cellular component (A), Molecular function (B), Biological processes (C), KEGG (D), Reactome pathways (F), and Wikipathways (G). The PI3K-Akt signaling pathway is visualized from the KEGG_PATHWAY, PI3K-Akt signaling pathway (hsa04151), proteins found in EVs are marked with yellow stars (E).
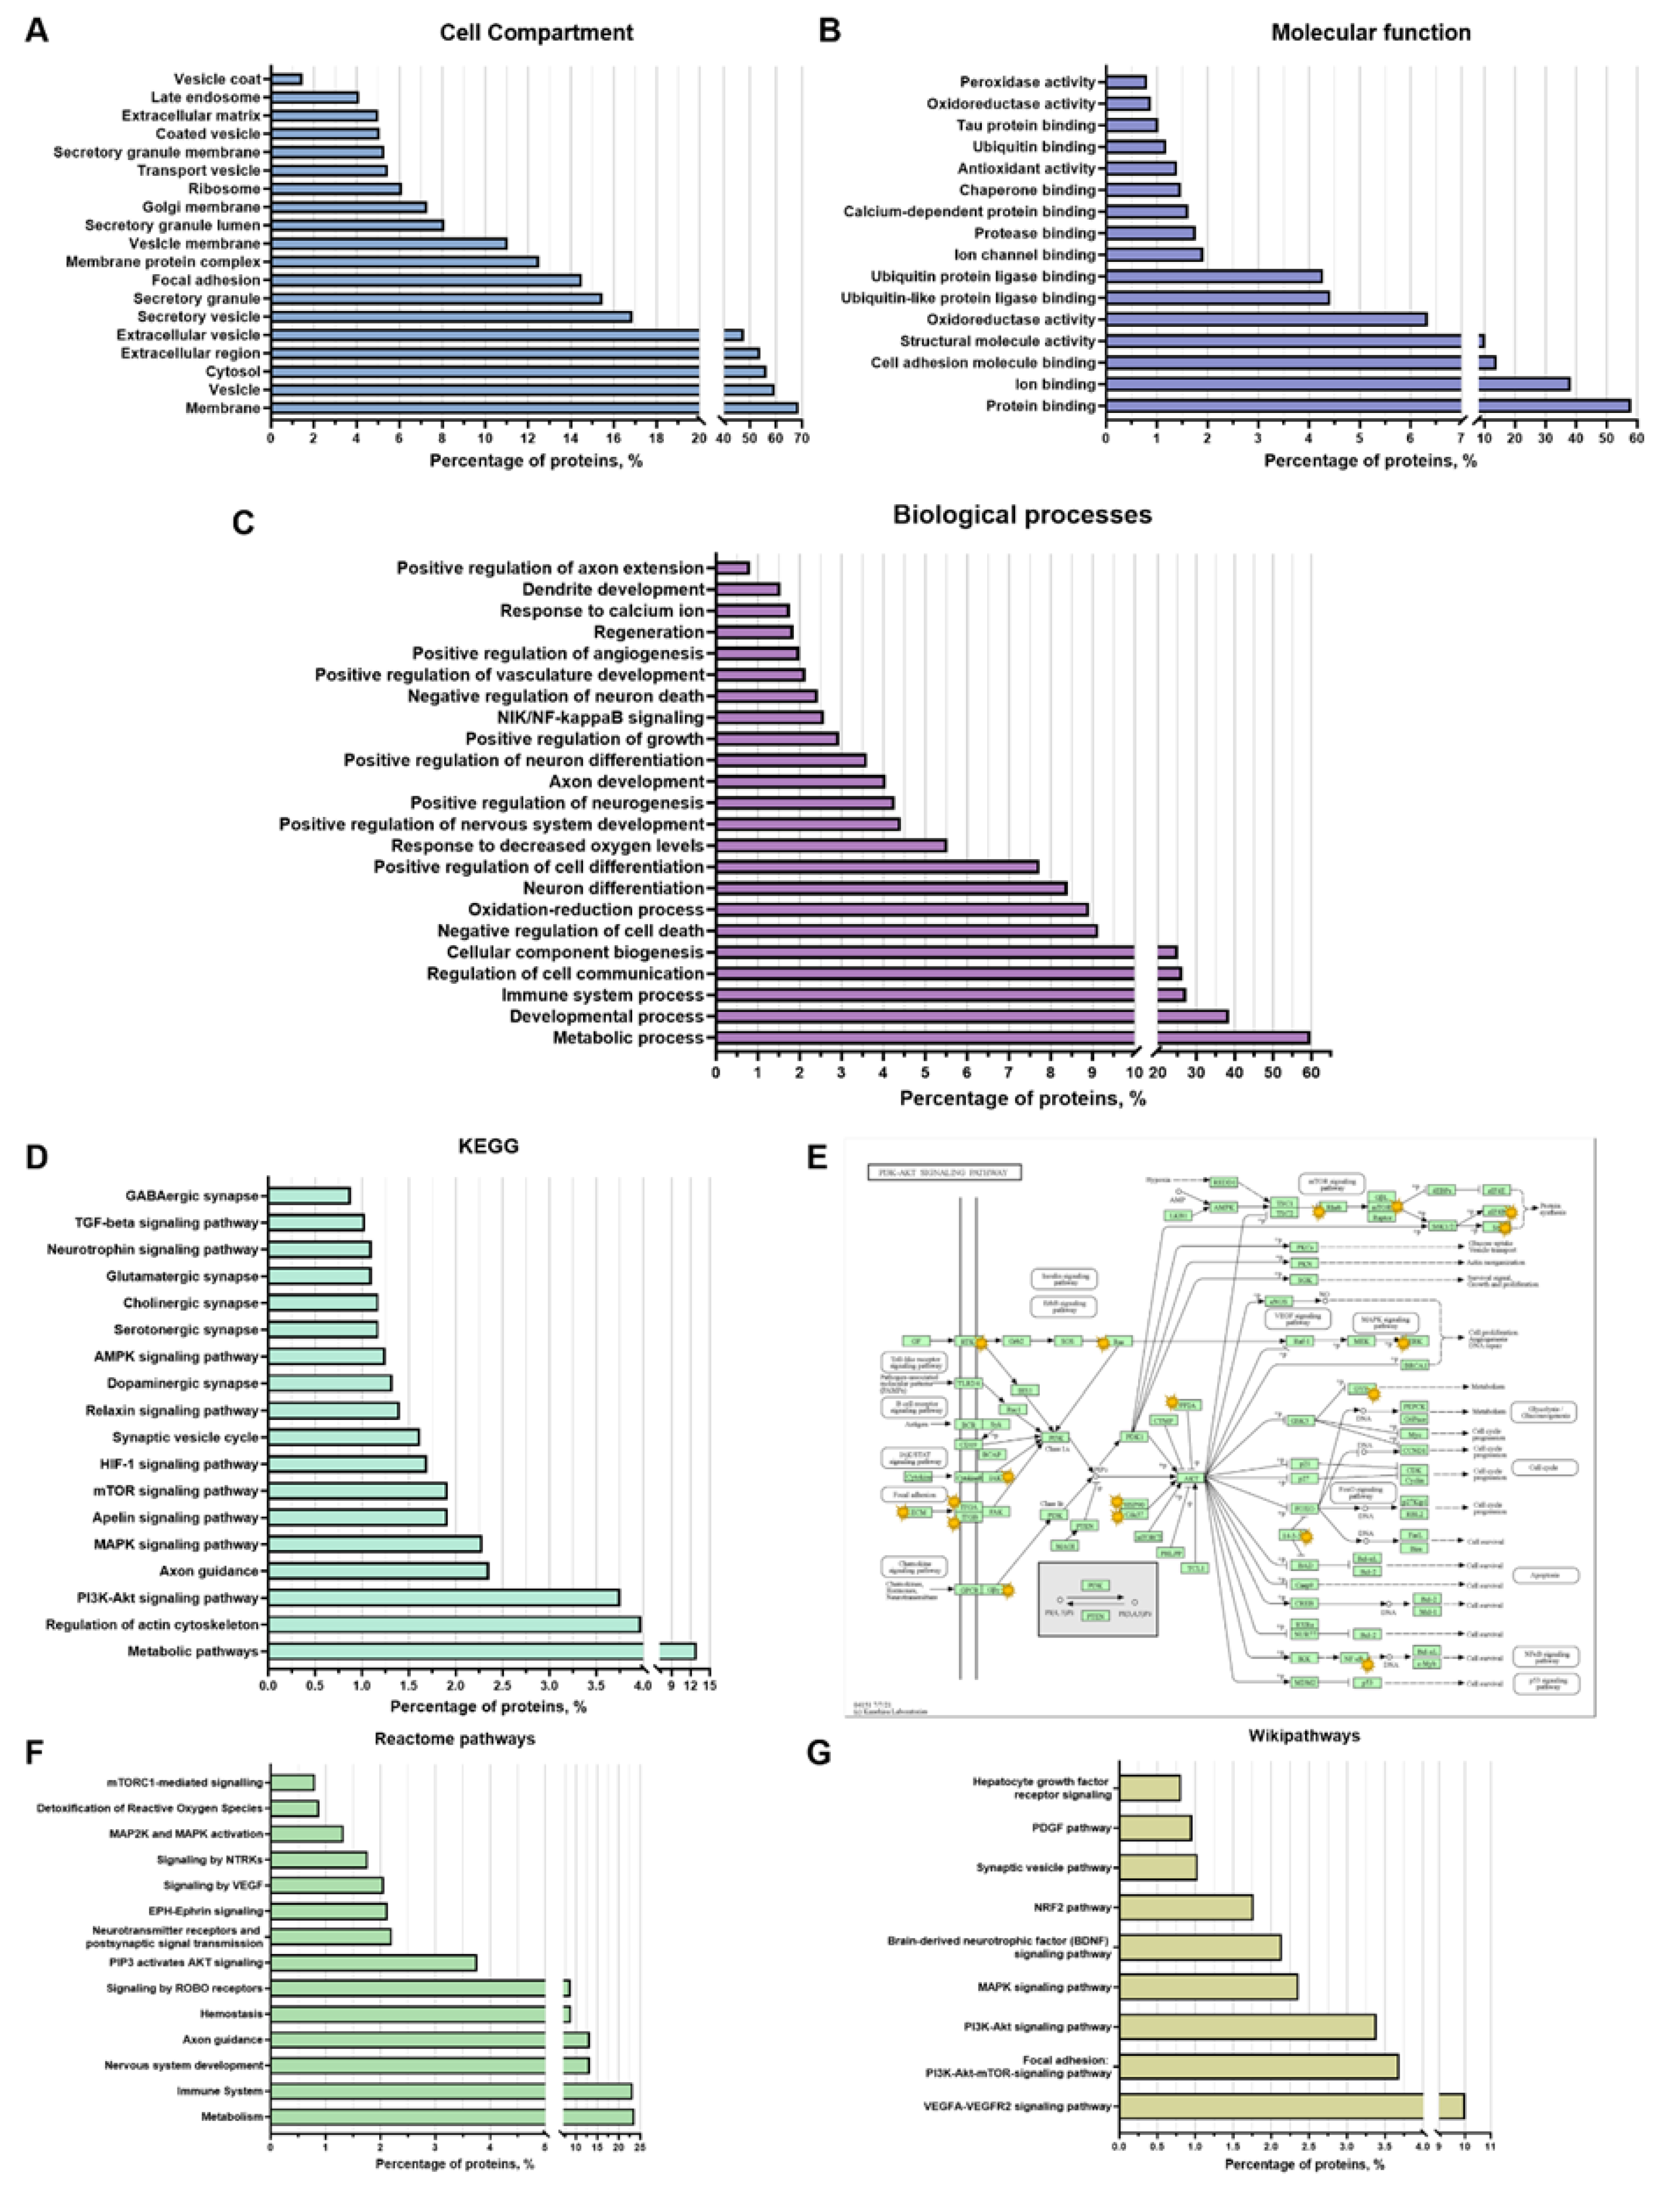
Figure 2.
Neuroprotective properties of EV-GPCs in a model of glutamate excitotoxicity. Cultures were treated with 100 µM glutamate (Glu) to induce excitotoxicity. Experimental groups were co-treated with EV-GPCs or 100 µM memantine (Mem) as a positive control. (A) Representative fluorescence micrographs of cortical cultures stained with Hoechst 33342 (nuclei, blue), Calcein AM (viable cells, green), and propidium iodide (PI) (necrotic nuclei, red). Scale bar: 20 µm. (B) Viability of neuronal cultures assessed by MTT assay. Data are presented as a percentage of survival relative to the intact control group. (C) Percentage of necrotic cells. (D) Percentage of viable cells. All data were analyzed by the Kruskal-Wallis test with Dunn’s post-hoc test. Results are presented as violin plots showing medians and interquartile ranges.
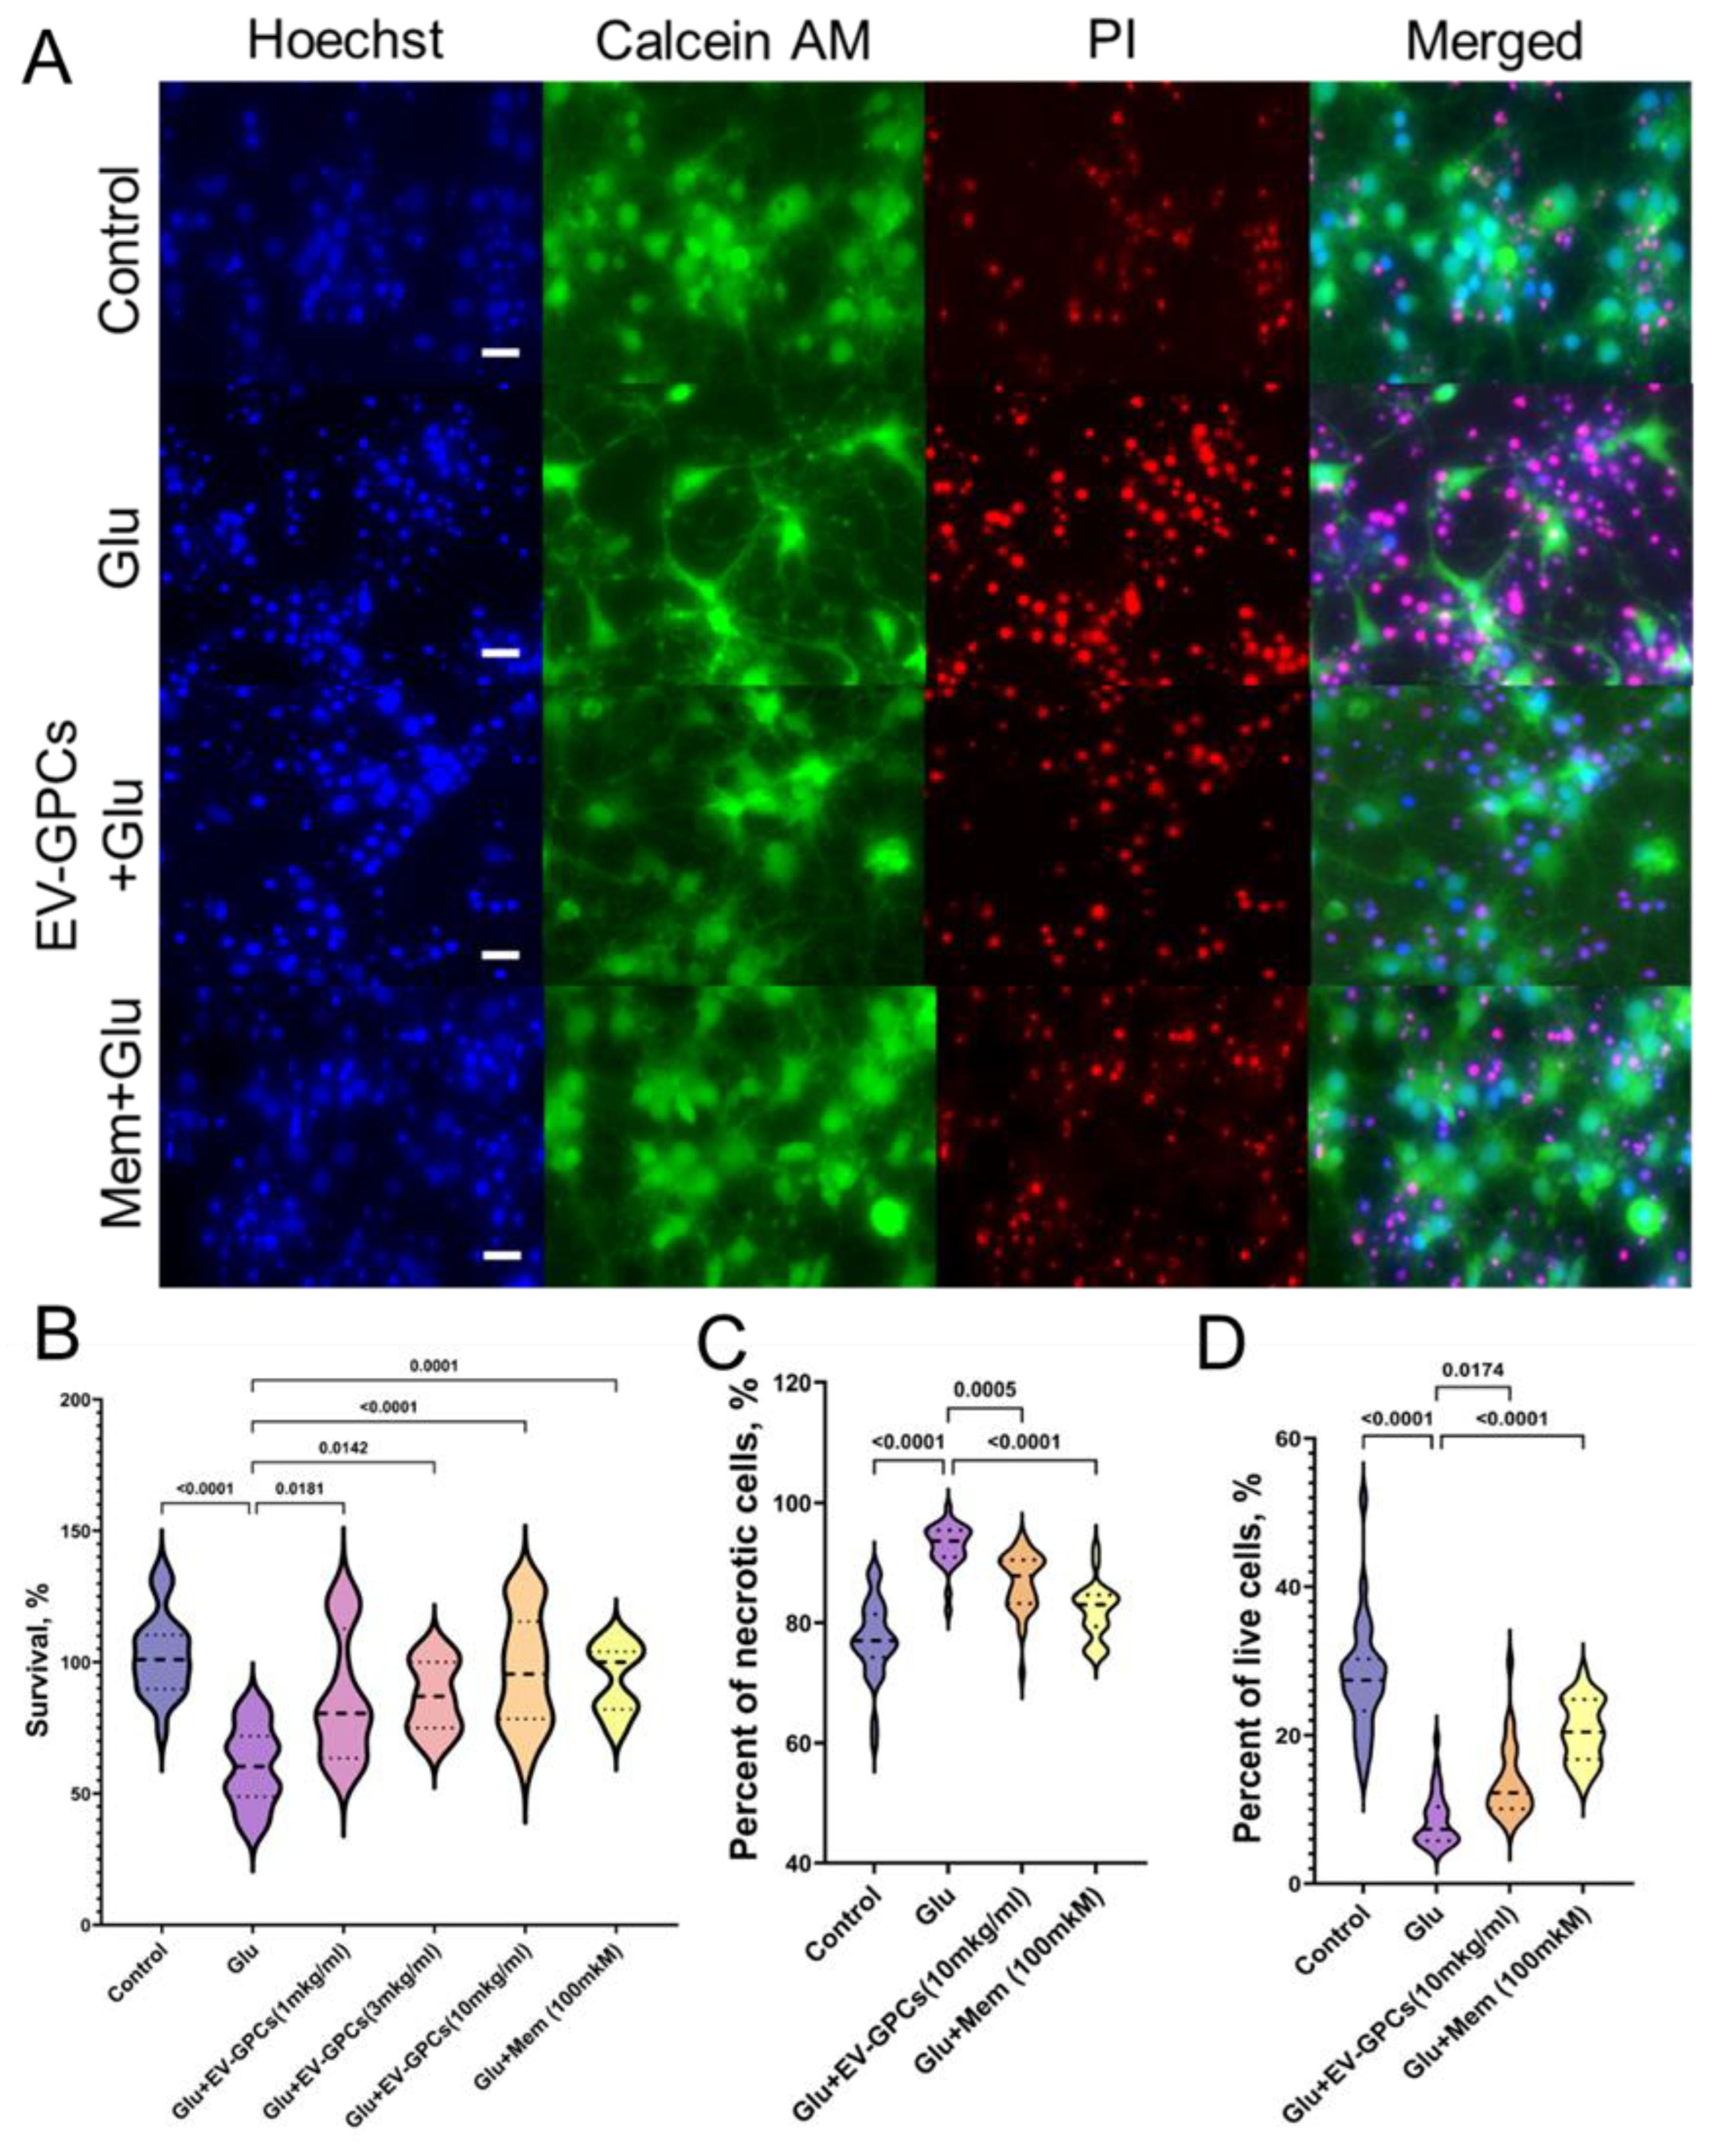
Figure 3.
Comparison of the parameters of dynamic changes in calcium homeostasis and mitochondrial potential in the modeling of glutamate excitotoxicity in the glutamate group (Glu, 100 μM) and with the supplement of glutamate (100 μM) and EV-GPCs (10 μg/ml) 24 h before the experiment. [Ca2+]i and Ψm were measured using Fura2 and Rh123, respectively. A - Average curves of [Ca2+]i changes in the glutamate group (black line, n = 619 cells) and the group with the addition of glutamate and EV-GPCs (red line, n = 621 cells). B - Average curves of the dynamics of Ψm changes in the glutamate group and the group with the addition of glutamate and EV-GPCs. Data are presented as means and standard deviations. C - Representative images of cortical neuron cultures before addition of glutamate, after 15 minutes of incubation with glutamate, and after removal of glutamate and replacement of the solution with a calcium-free solution, color represents intensity of Fura2 fluorescence and ranges from blue (low-intensity) to red (high- intensity); Scale bar – 10µm. D-I Analysis of [Ca2+]i and Ψm changes by calculating the areas under the curves (AUC) in different periods. D - Effect of EV-GPCs on AUC values during Glutamate exposure (15 min) (AUCGlu), E - after Glutamate removal in nominally calcium-free buffer (20 min) (AUC-Ca+EGTA), F - after adding of FCCP protonophore (5 min) (AUCFCCP) and G - % recovery of baseline [Ca2+]i. H - degree of Ψm reduction expressed as AUCFCCP/AUCGlu, I - degree of Ψm recovery expressed as AUCFCCP/AUCEGTA. Data were analysed by nonparametric unpaired t-test followed by Mann-Whitney test and presented as median and interquartile range.
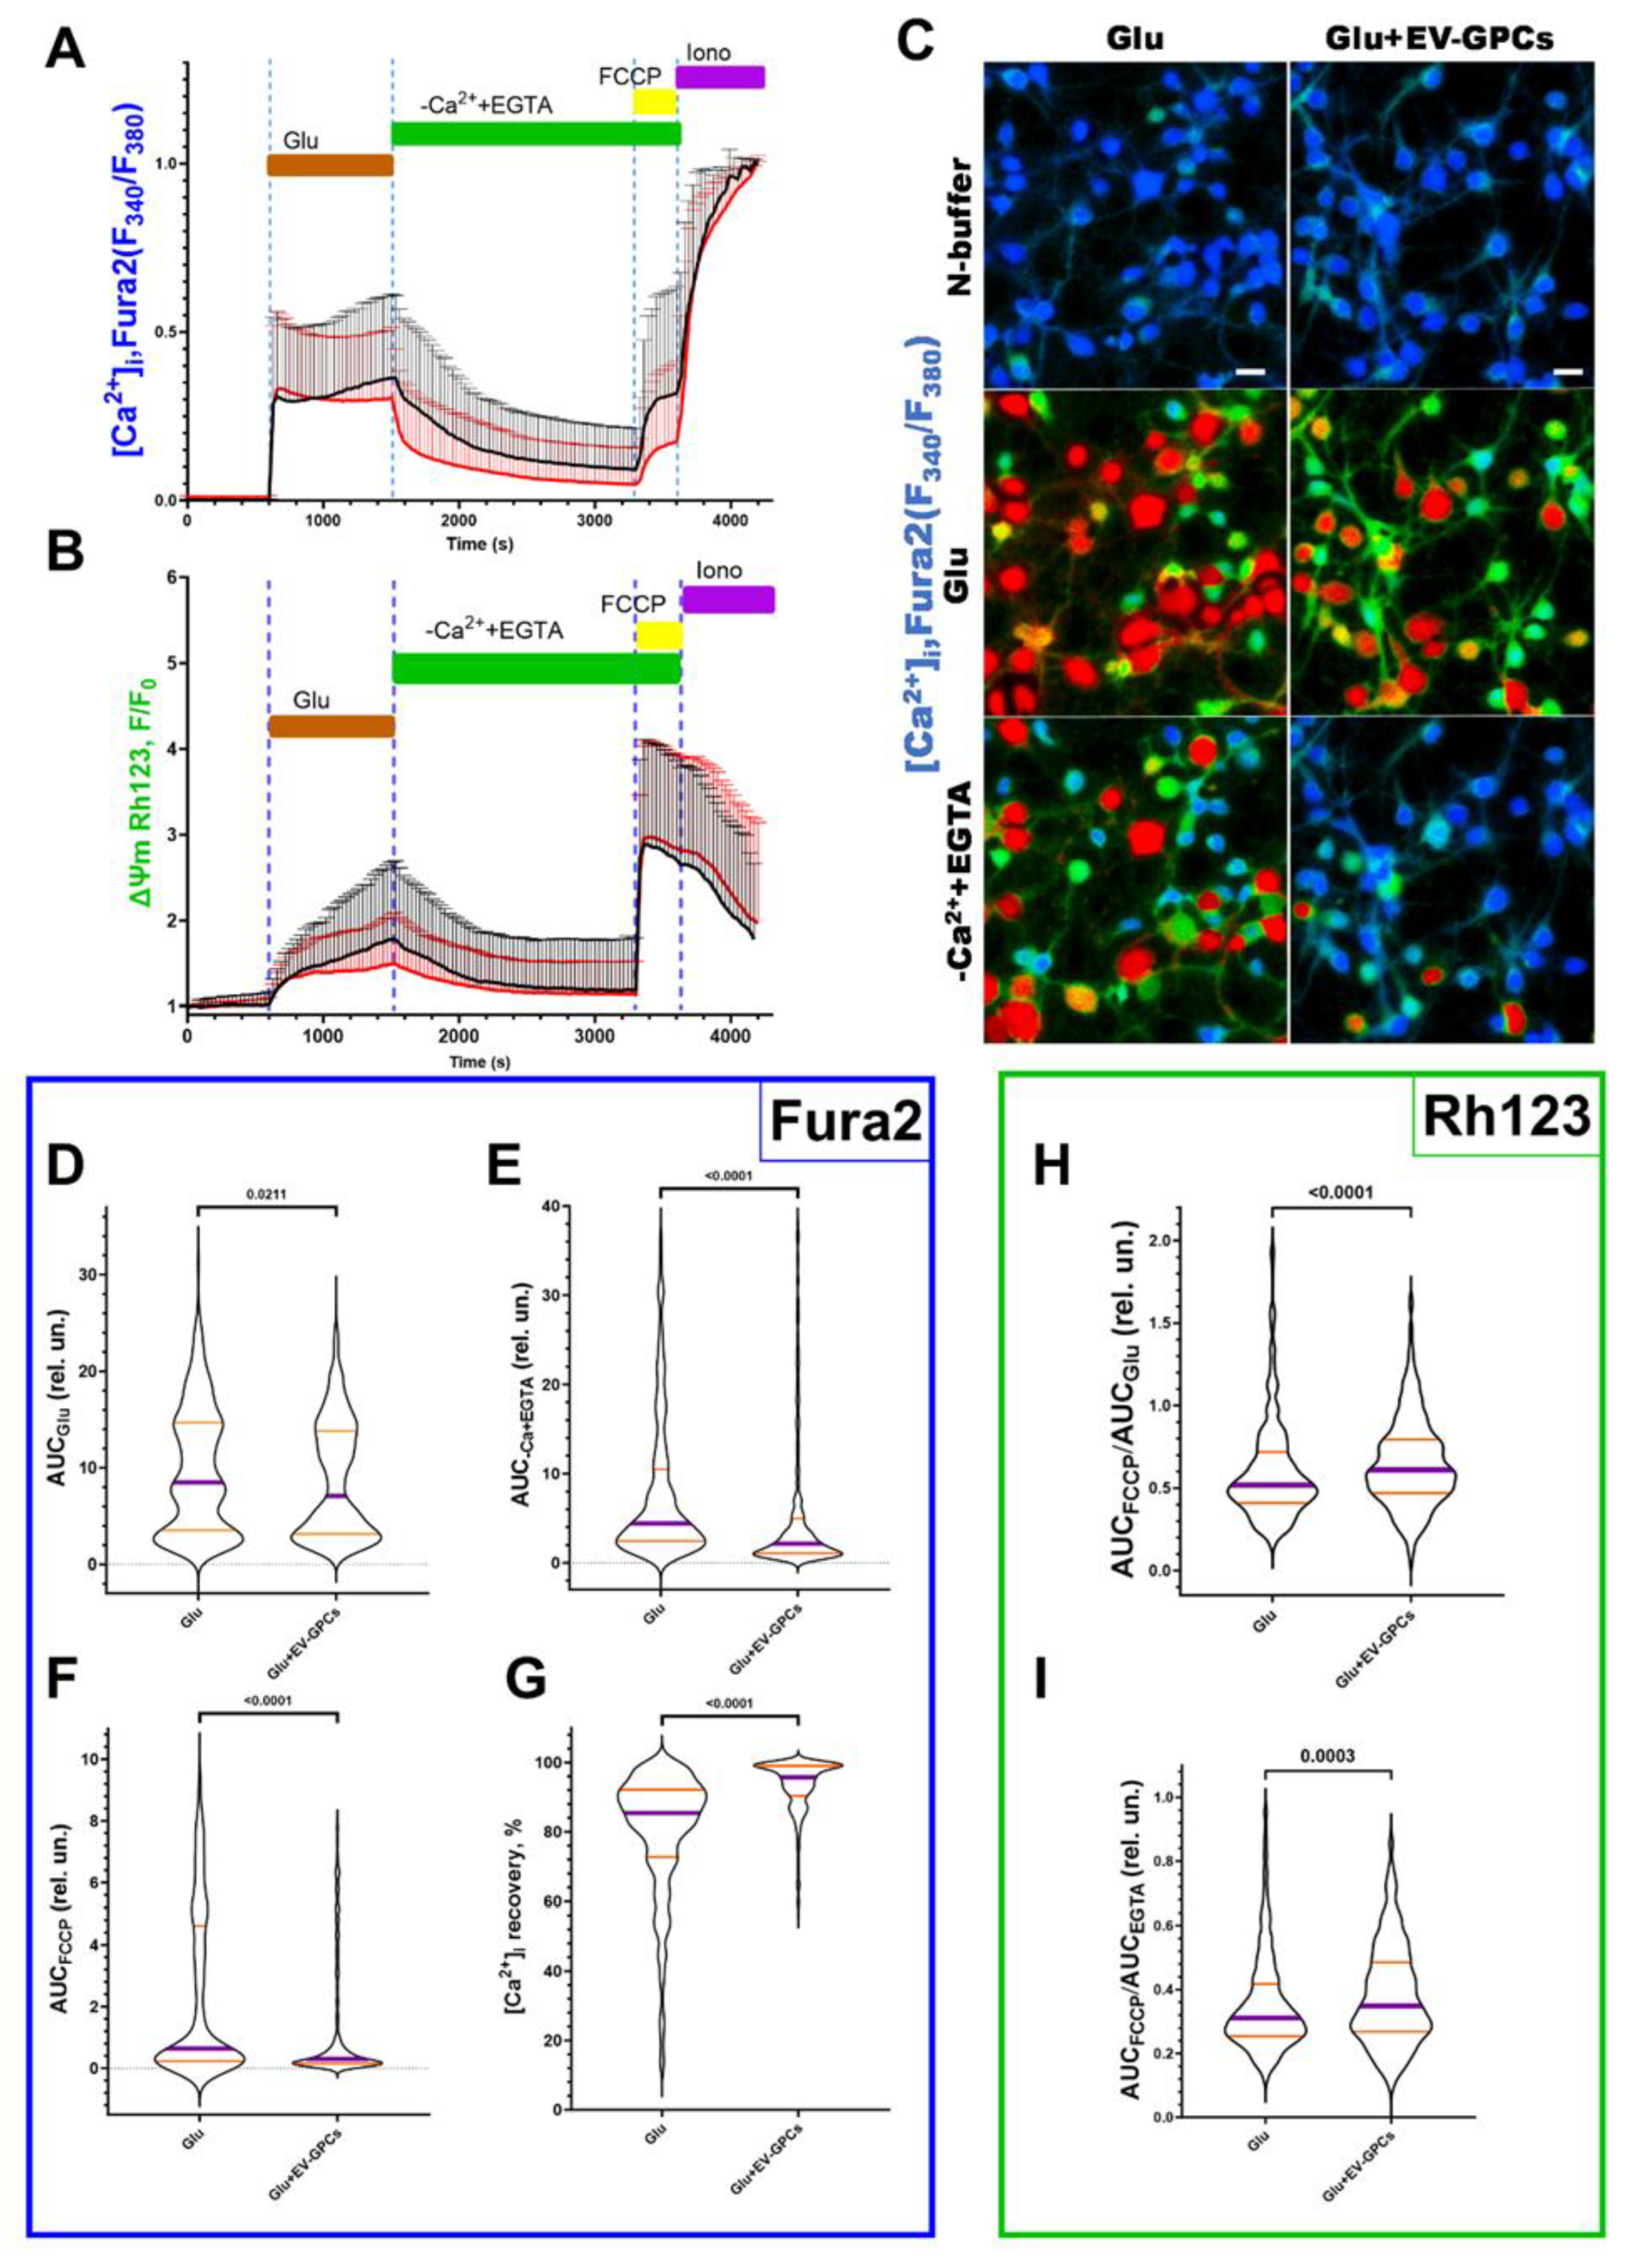
Figure 4.
Pharmacological inhibition of the PI3K signaling pathway attenuates the neuroprotective efficacy of EV-GPCs. (A) Representative micrographs of cortical cultures stained with Hoechst 33342 (nuclei, blue) and Calcein AM (viable cells, green). Scale bar, 20 μm. (B) Assessment of neuronal culture viability by MTT assay. Data are normalised and presented as a percentage of survival relative to the untreated control group. Experimental conditions: Glutamate (Glu, 100 μM), EV-GPCs (EV-GPCs, 10 μg/mL), and the PI3K inhibitor AS605240 (AS605240 1 μg/mL). Statistical analysis was performed using the Kruskal-Wallis test followed by Dunn’s post hoc test for multiple comparisons. Results are presented as violin plots depicting median values and interquartile ranges.
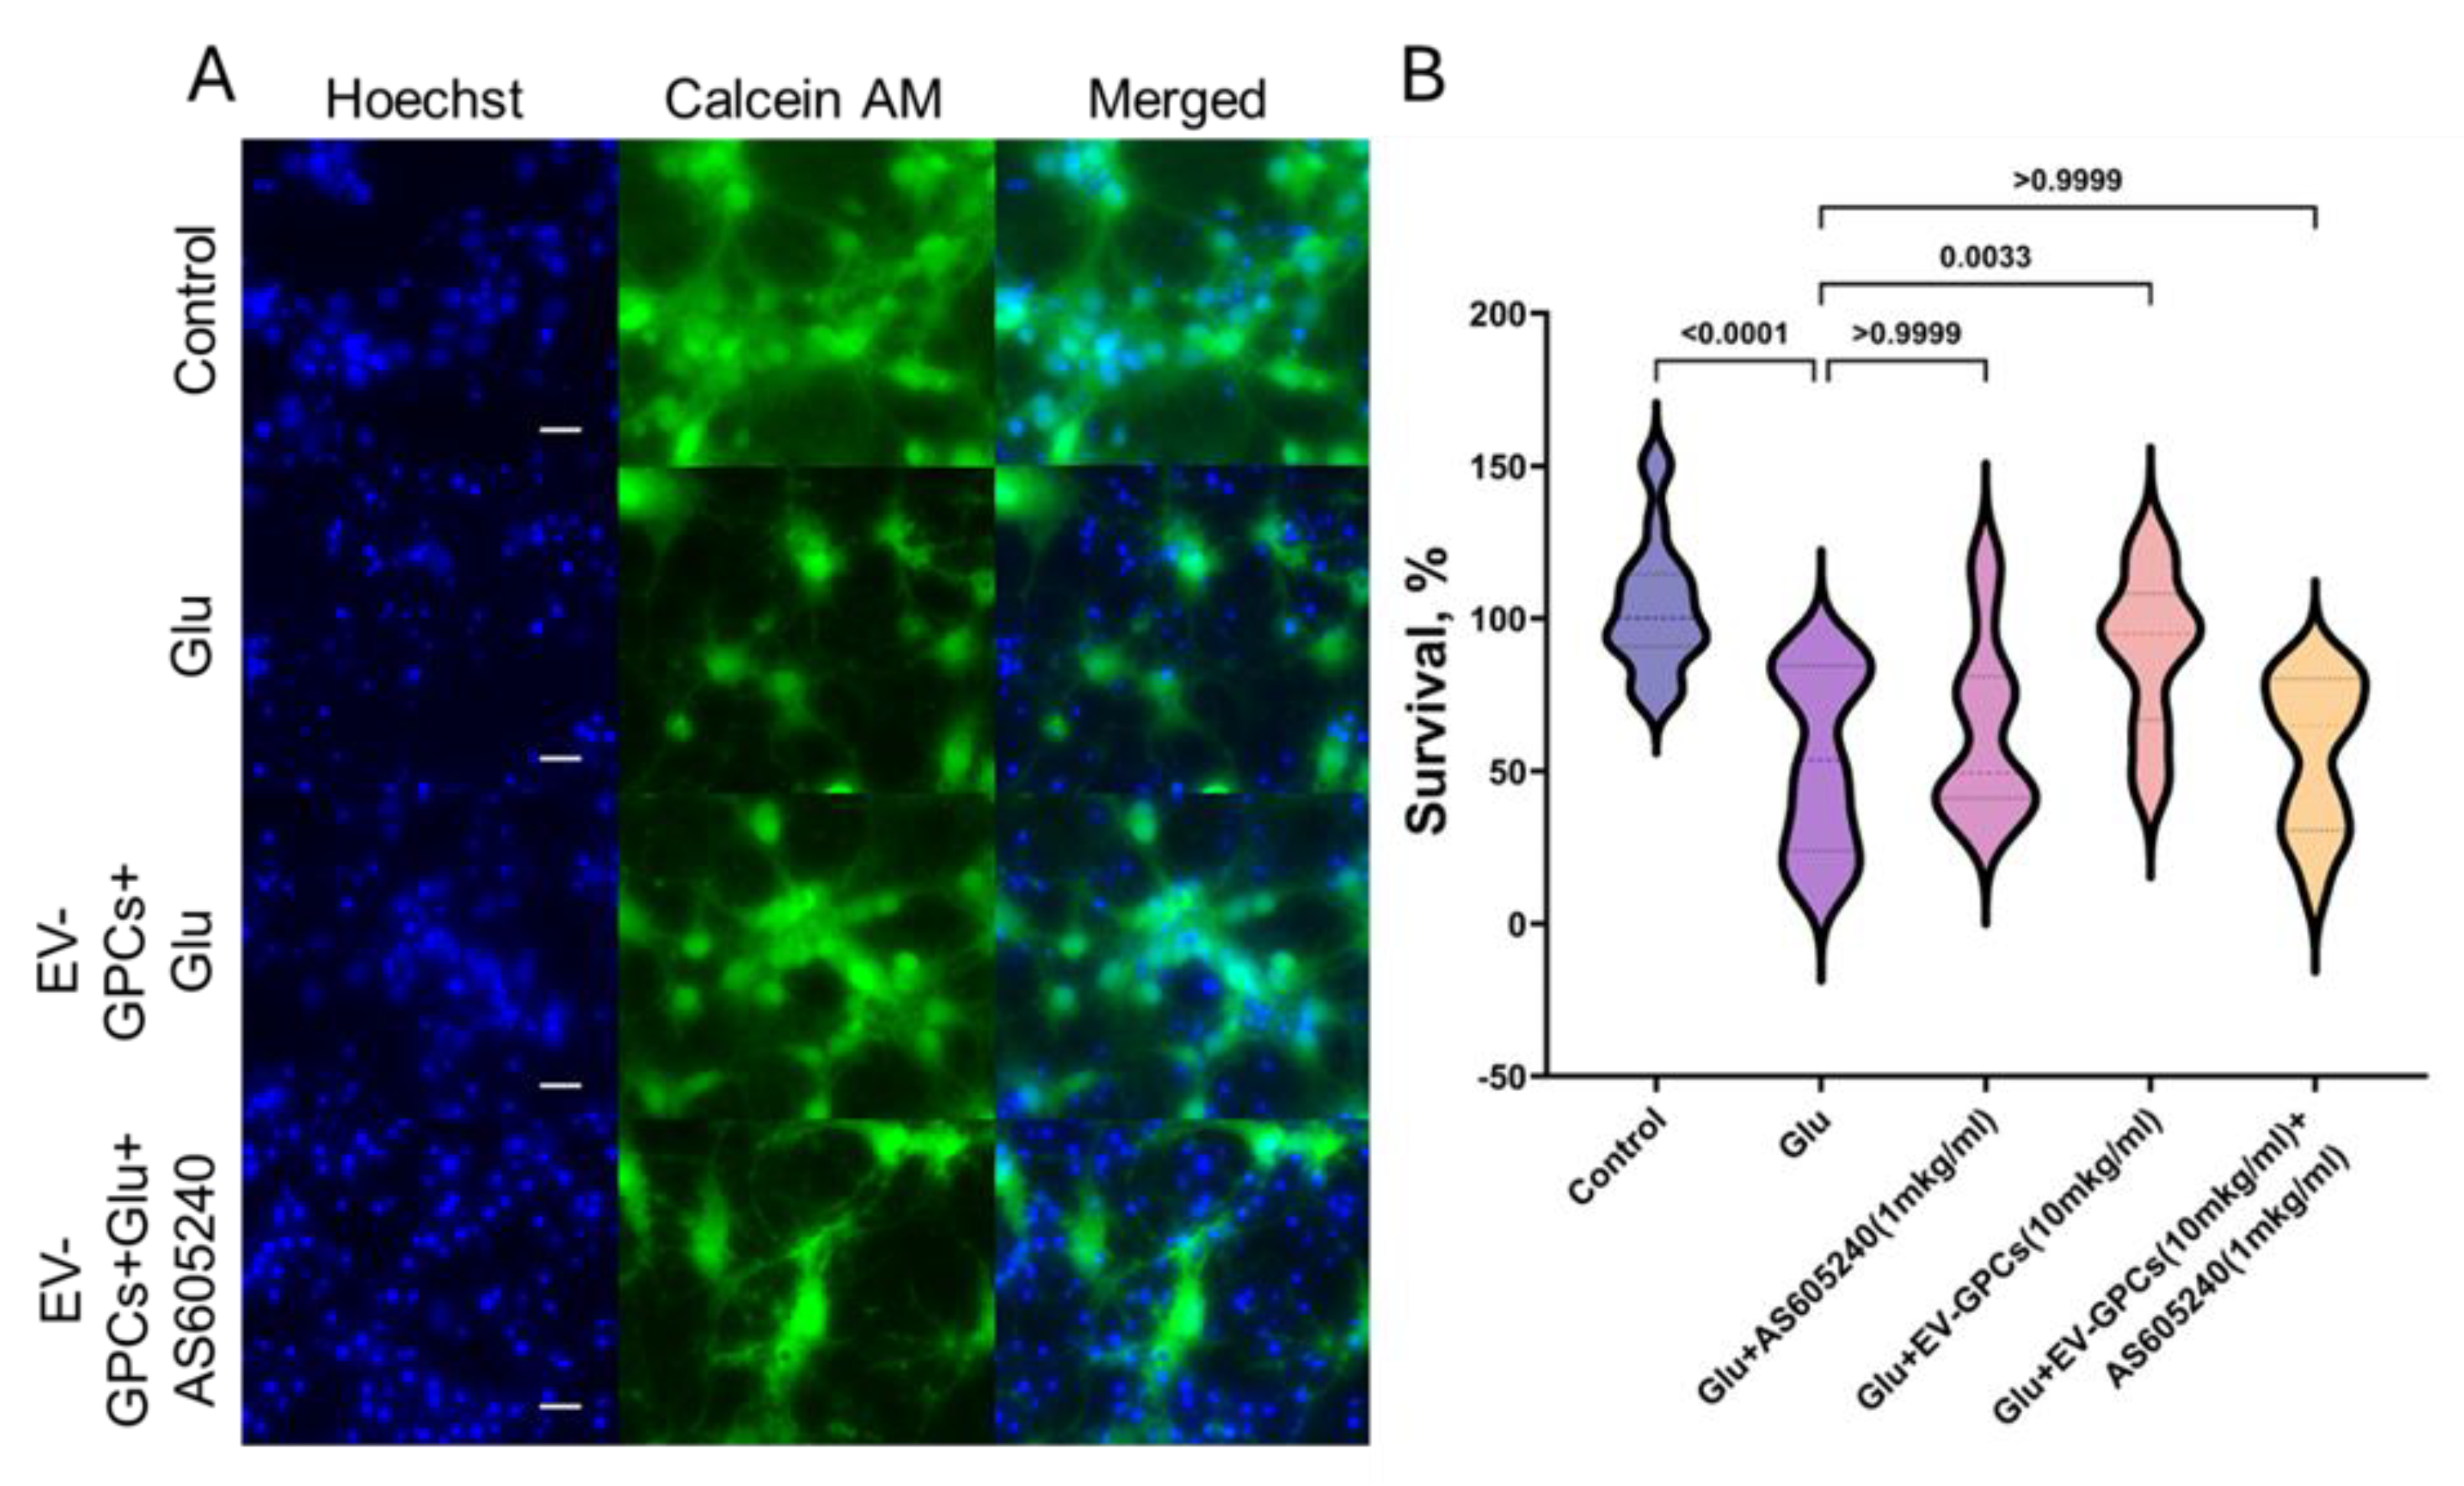
Figure 5.
Transcriptomic profiling of neuroglial cultures following EV-GPCs treatment. A – Heatmaps of differentially expressed genes (DEGs) were obtained using pheatmap R package. Each row represents a gene and each column corresponds to an individual sample, sample groups indicated by column annotations. Log2-transformed gene expression values were row-scaled, hierarchical clustering was performed for both rows (genes) and columns (samples) using Euclidean distance and the complete clustering method. The color scale represents scaled expression values and ranges from blue (down-regulated) to red (up-regulated); B – Volcano plot showing the level of gene expression depending on the fold change and p-value (p<0.05 and |FC|<1.5), the expression of genes in the control group is shown relative to the experimental group, FC<1.5 – down-regulated genes, FC>1.5 – up-regulated genes; C – Gene set enrichment analysis (GO-base) in the comparison group IC_vs_EV; D - Results of classification of down-regulated DEGs using the Gene Onthology Biological processes database. The X-axis shows the ratio of pathway DEGs to the total number of DEGs, and the Y-axis shows the selected Biological processes; E - Results of classification of down-regulated DEGs using the KEGG database. The X-axis shows the ratio of pathway DEGs to the total number of DEGs, and the Y-axis shows the selected Signaling pathways.
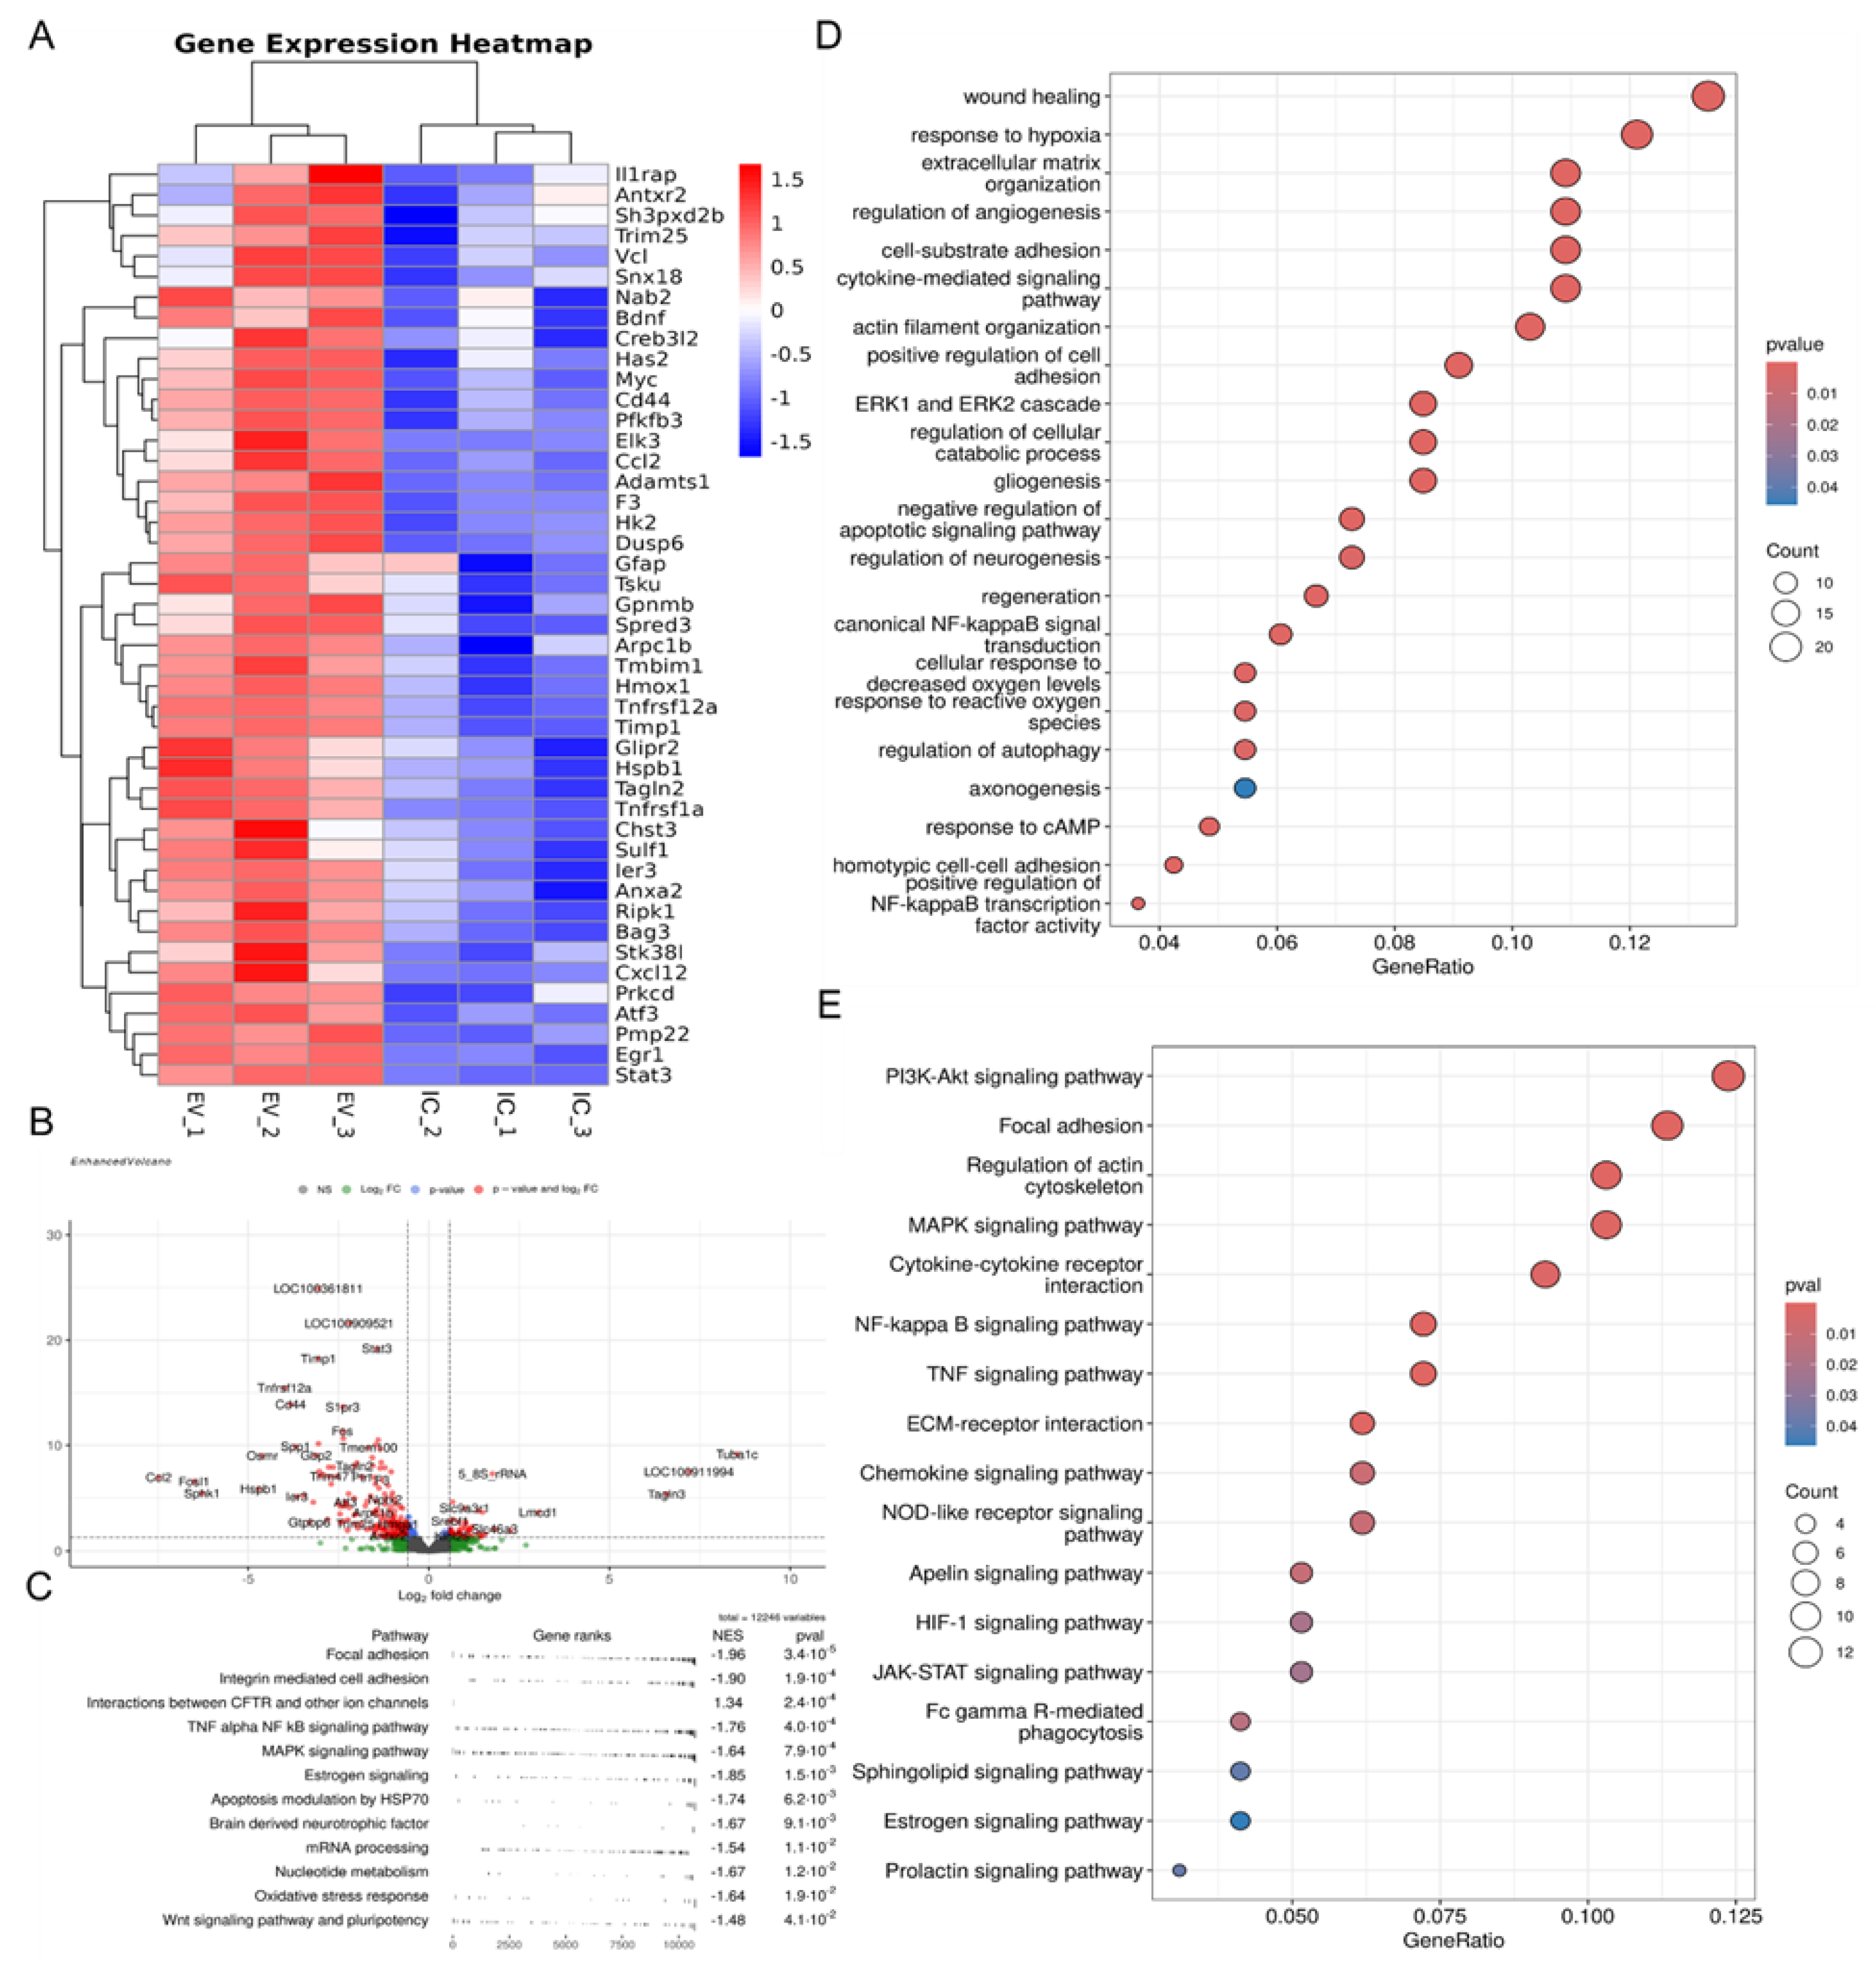
Figure 6.
Differential gene expression analysis for the IС_vs_GL and GL_Mem_vs_GL comparison groups. A, D – Volcano plots showing the gene expression level depending on the fold change and p-value (p-value <0.05 and |FC|<1.5) in the comparison groups IС_vs_GL (A), GL_Mem_vs_GL (D). Results of the classification of up-regulated DEGs of the comparison groups IС_vs_GL (B), GL_Mem_vs_GL (C) and down-regulated DEGs of the comparison groups IС_vs_GL (E), GL_Mem_vs_GL (F) using the Gene Onthology Biological processes database. The X-axis shows the ratio of pathway DEGs to the total number of DEGs, and the Y-axis shows the selected Biological processes.
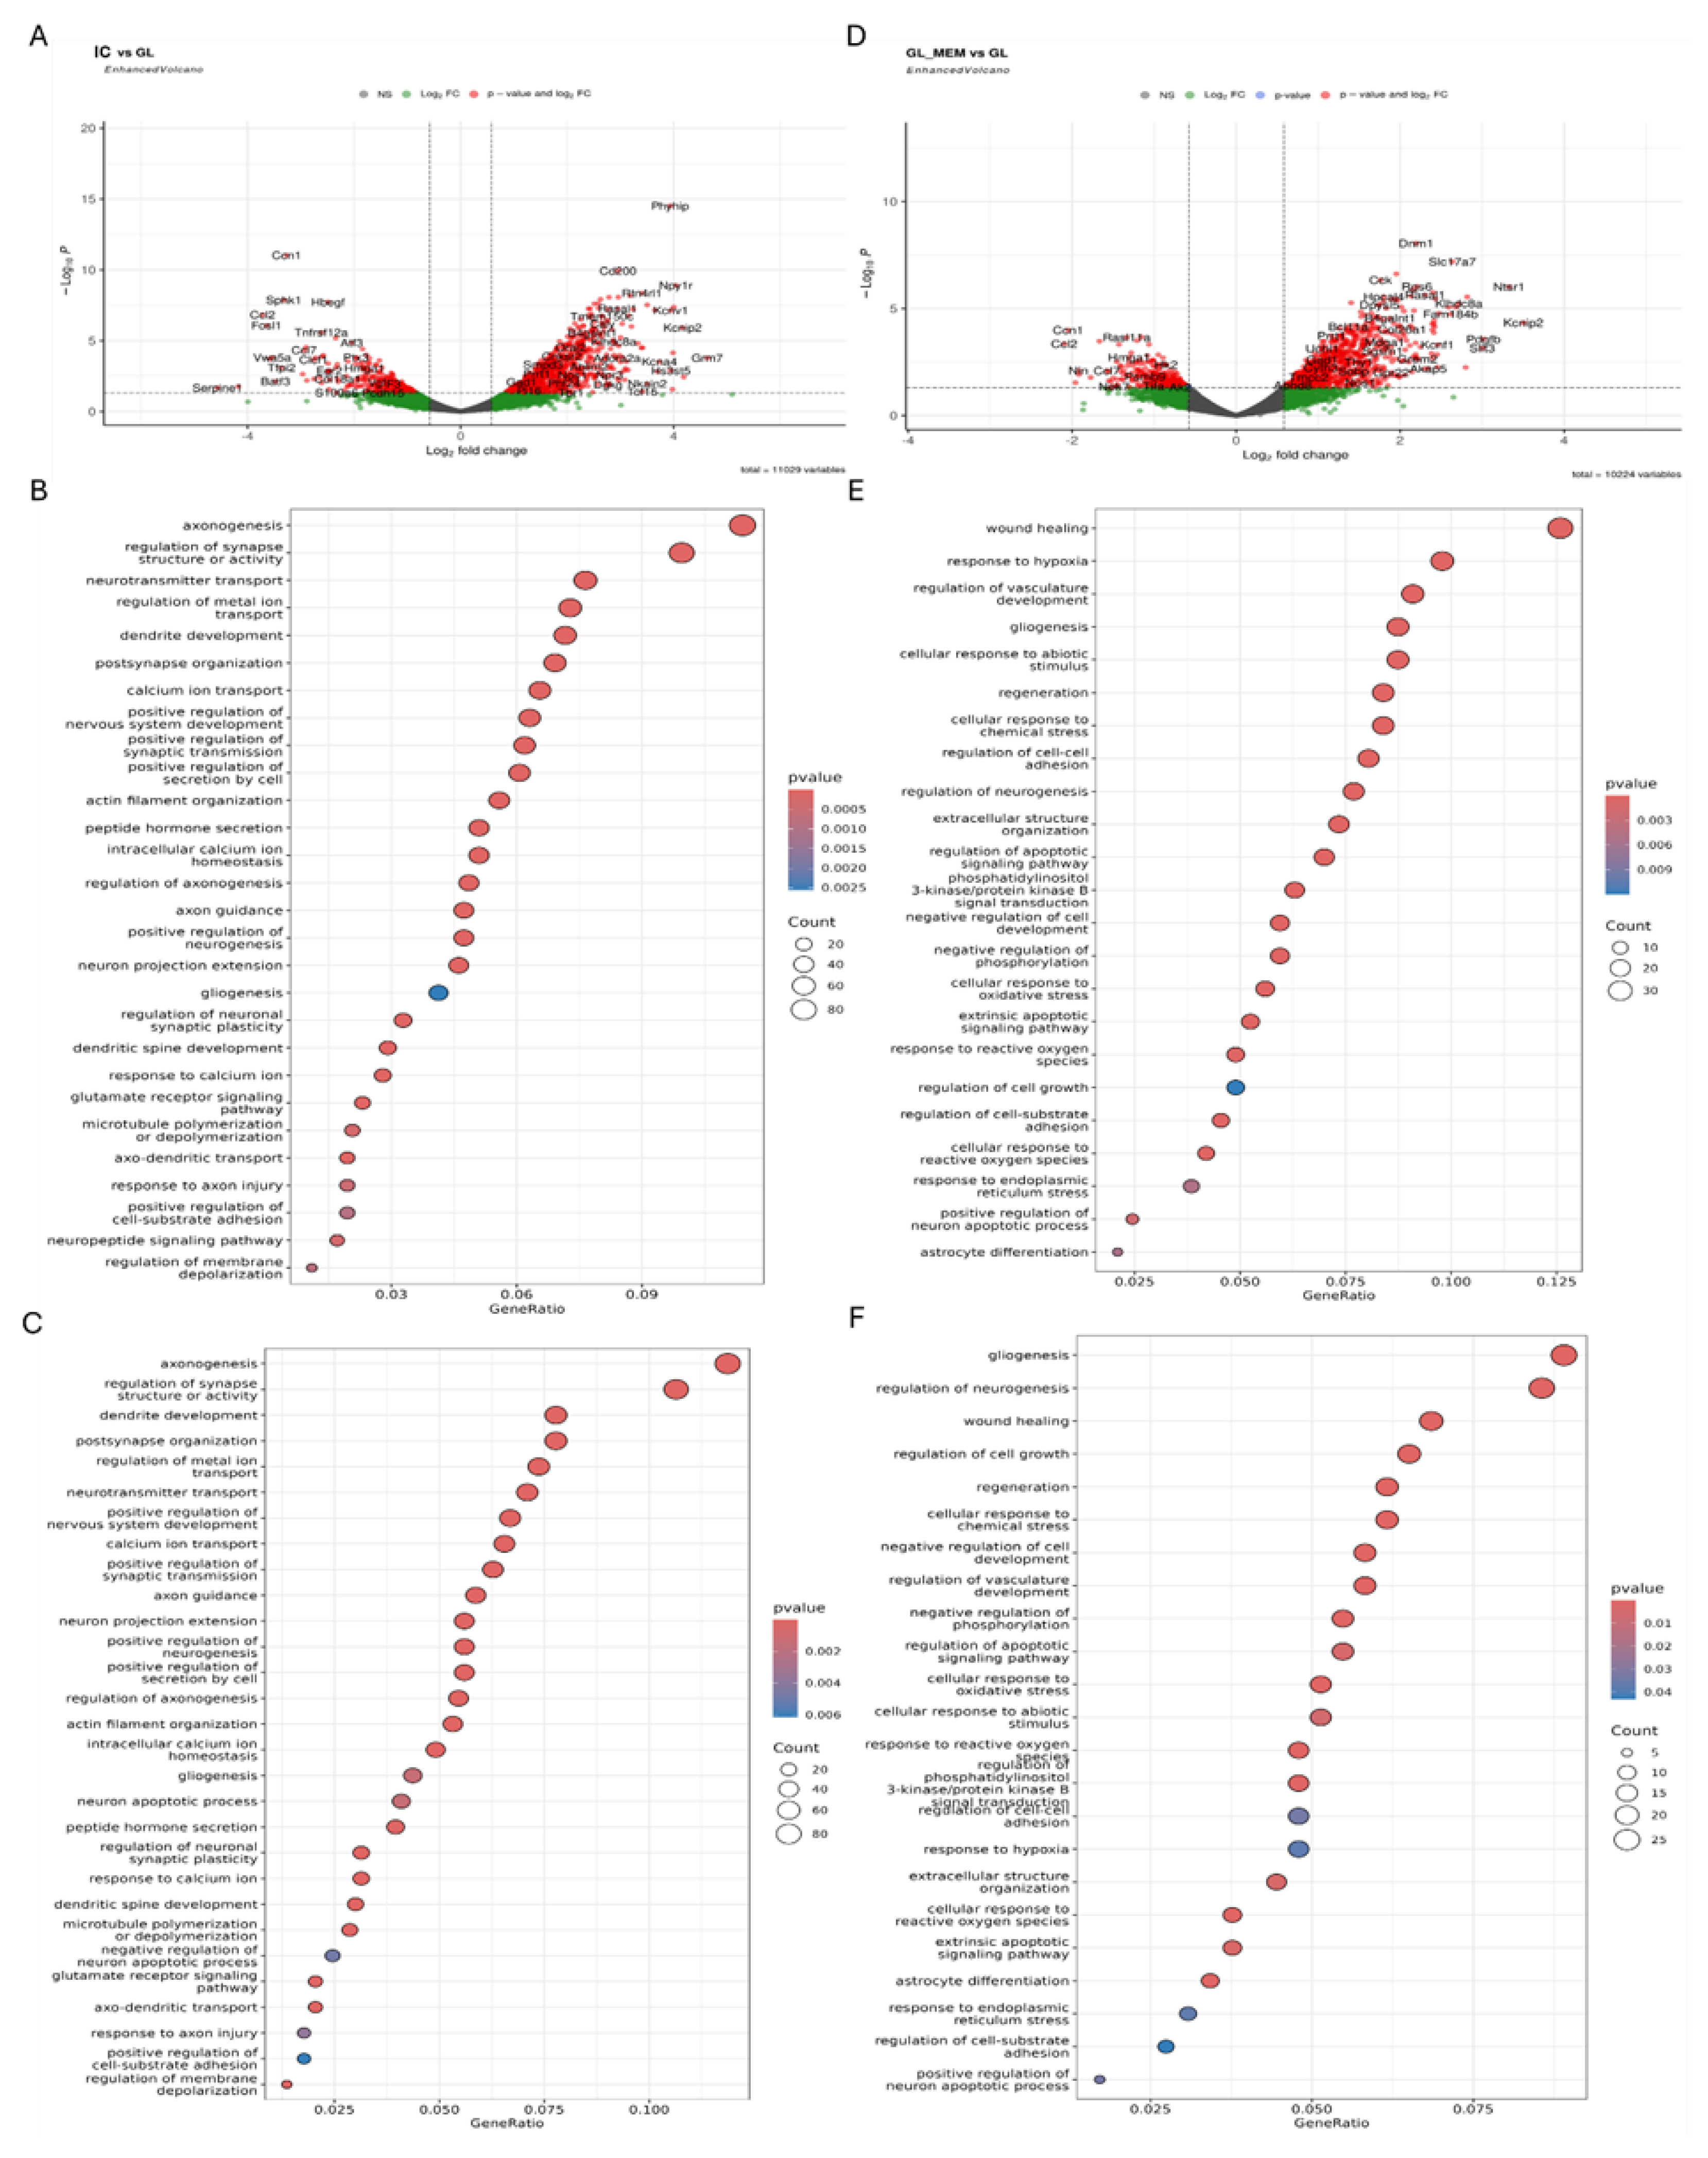
Figure 7.
Results of classification of up-regulated DEGs of comparison groups IC_vs_GL (A), GL_Mem_vs_GL (B) and down-regulated DEGs of comparison groups IC_vs_GL (C) using the KEGG database. The X-axis shows the ratio of pathway DEGs to the total number of DEGs, and the Y-axis shows the selected Signaling pathways. Gene set enrichment analysis (GO-base) in the comparison group IC_vs_GL (D) and GL_Mem_vs_GL (E).
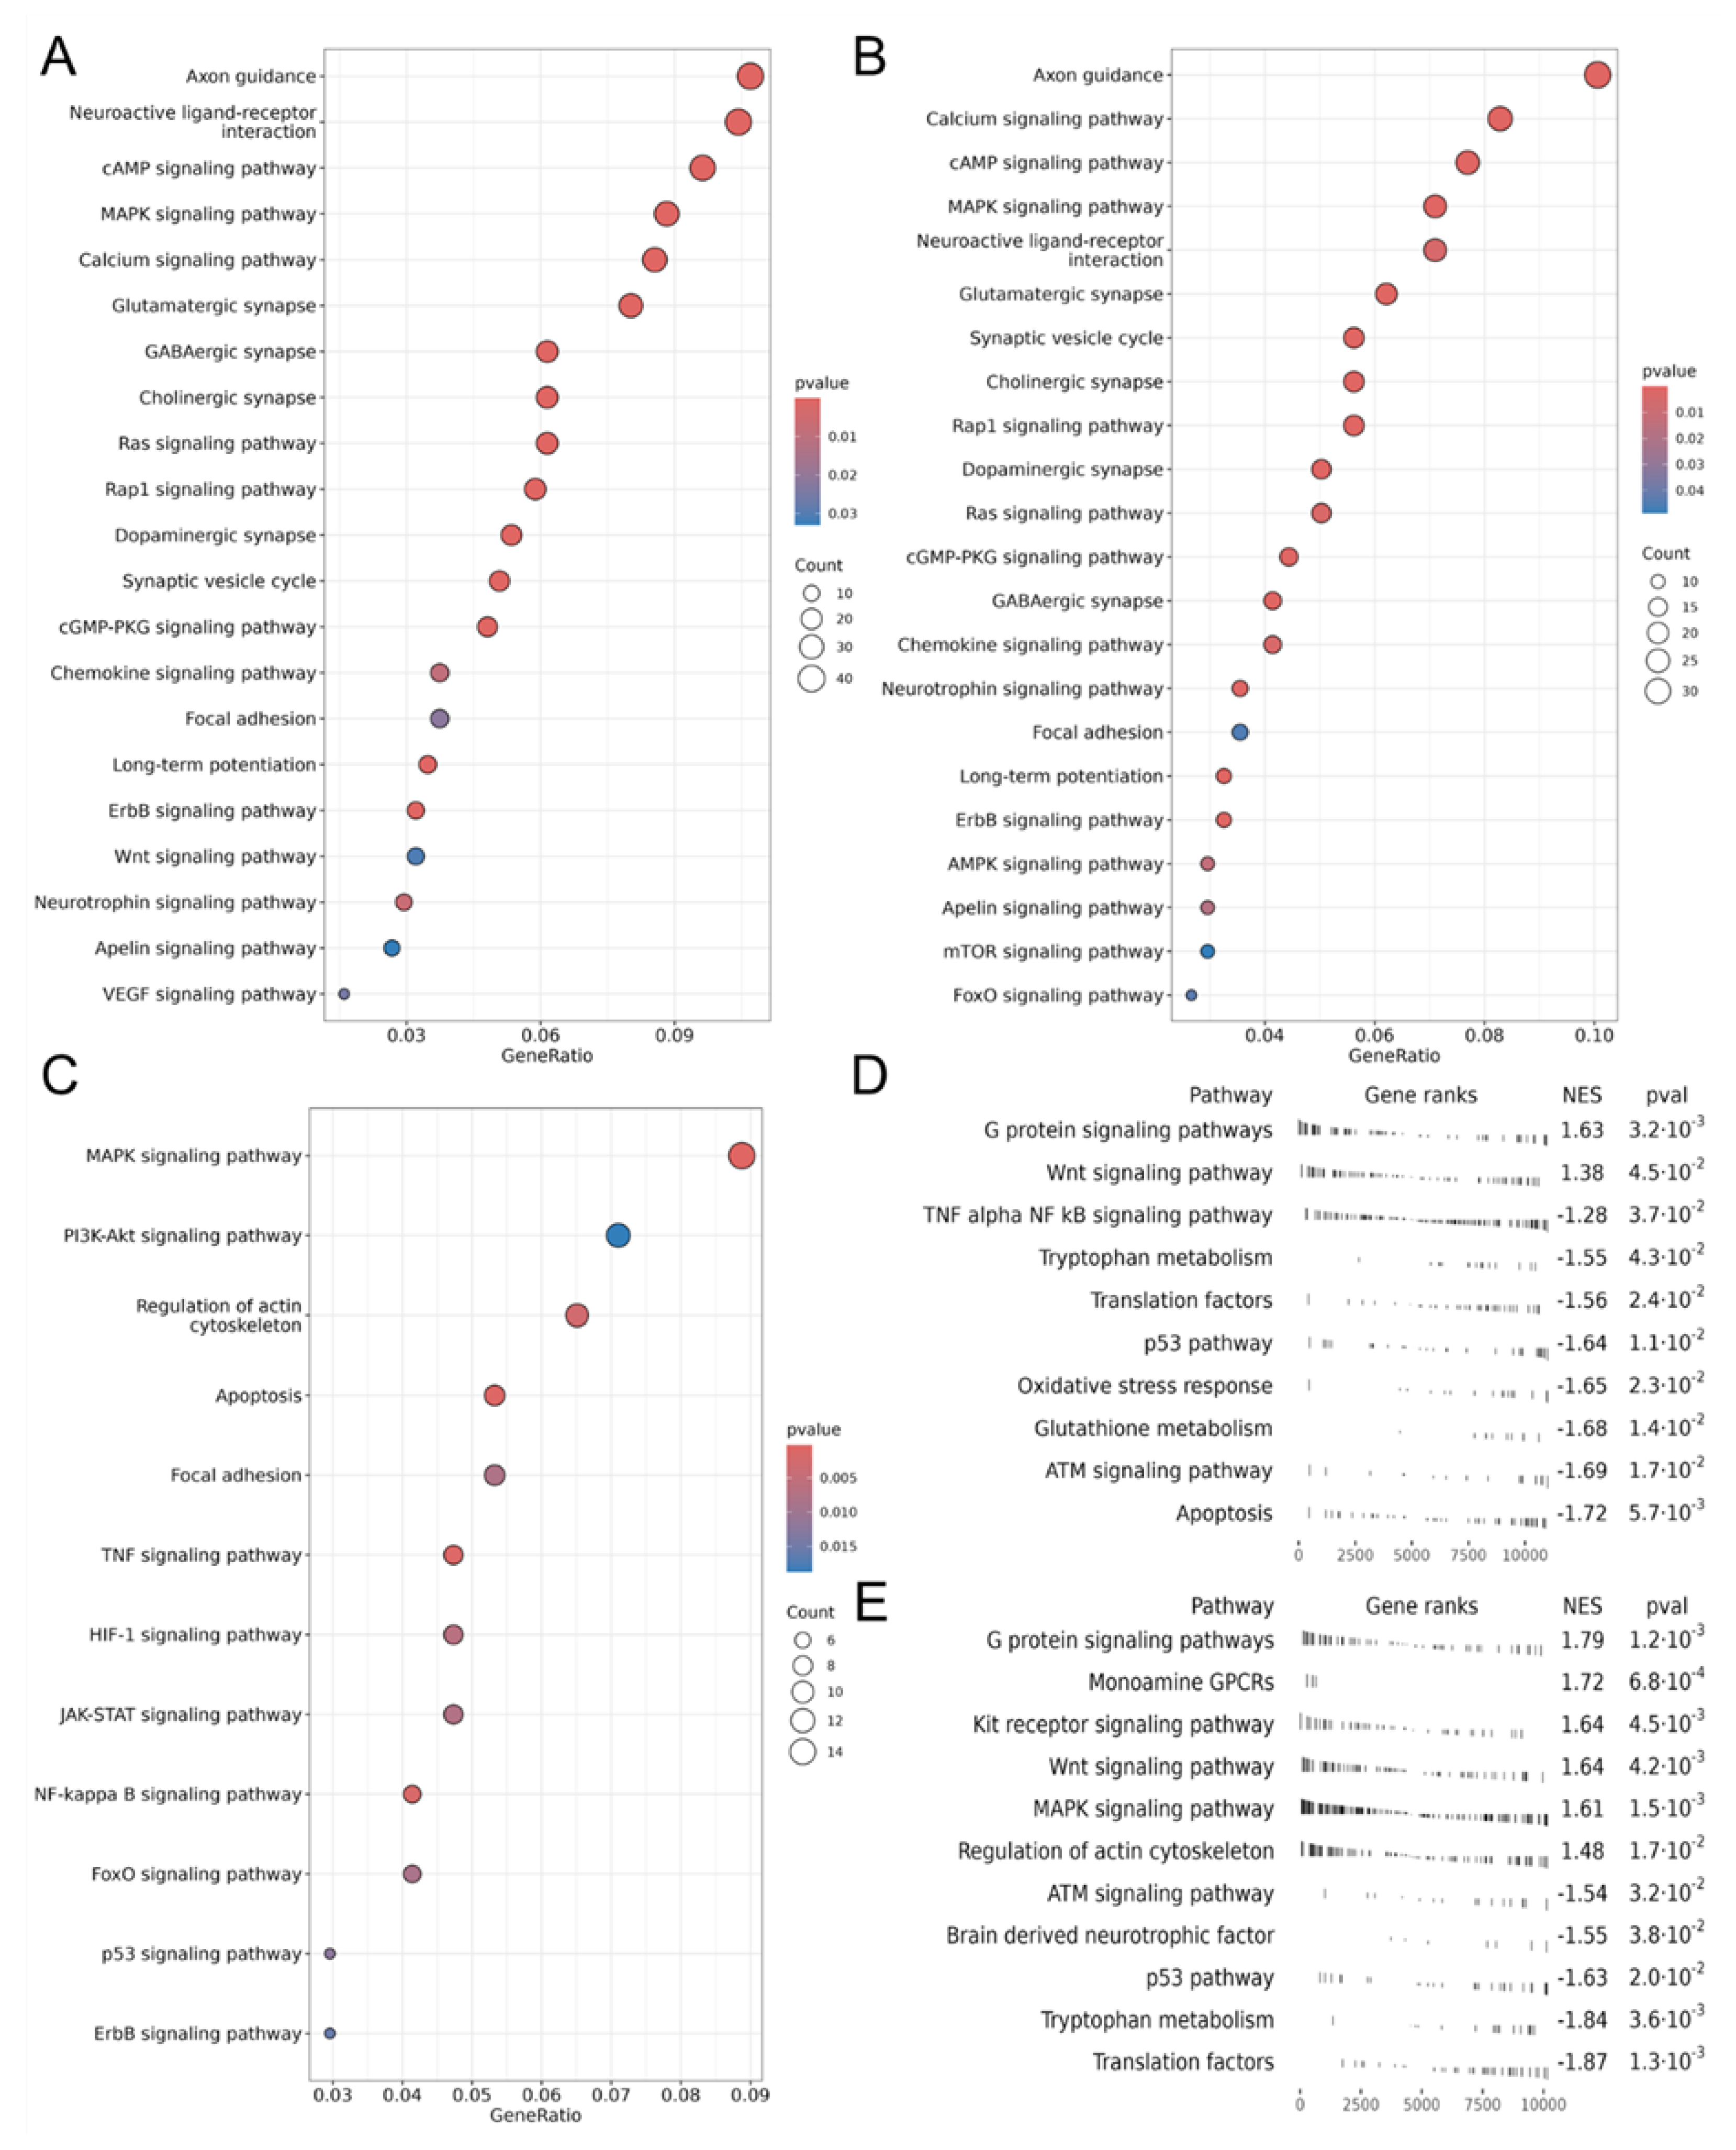
Figure 8.
RNA-sequencing results of the glutamate-added group (GL) and the EV-GPCs-added group (GL_EV). A - The results of up-regulated DEG classification using the Gene Onthology Biological processes database. B - The results of down-regulated DEG classification using the Gene Onthology Biological processes database. The X-axis shows the ratio of pathway DEGs to the total number of DEGs, and the Y-axis shows the selected Biological processes. C - Heatmaps of differentially expressed genes (DEGs) were obtained using pheatmap R package. Each row represents a gene and each column corresponds to an individual sample, sample groups indicated by column annotations. Log2-transformed gene expression values were row-scaled, hierarchical clustering was performed for both rows (genes) and columns (samples) using Euclidean distance and the complete clustering method. The color scale represents scaled expression values and ranges from blue (down-regulated) to red (up-regulated).
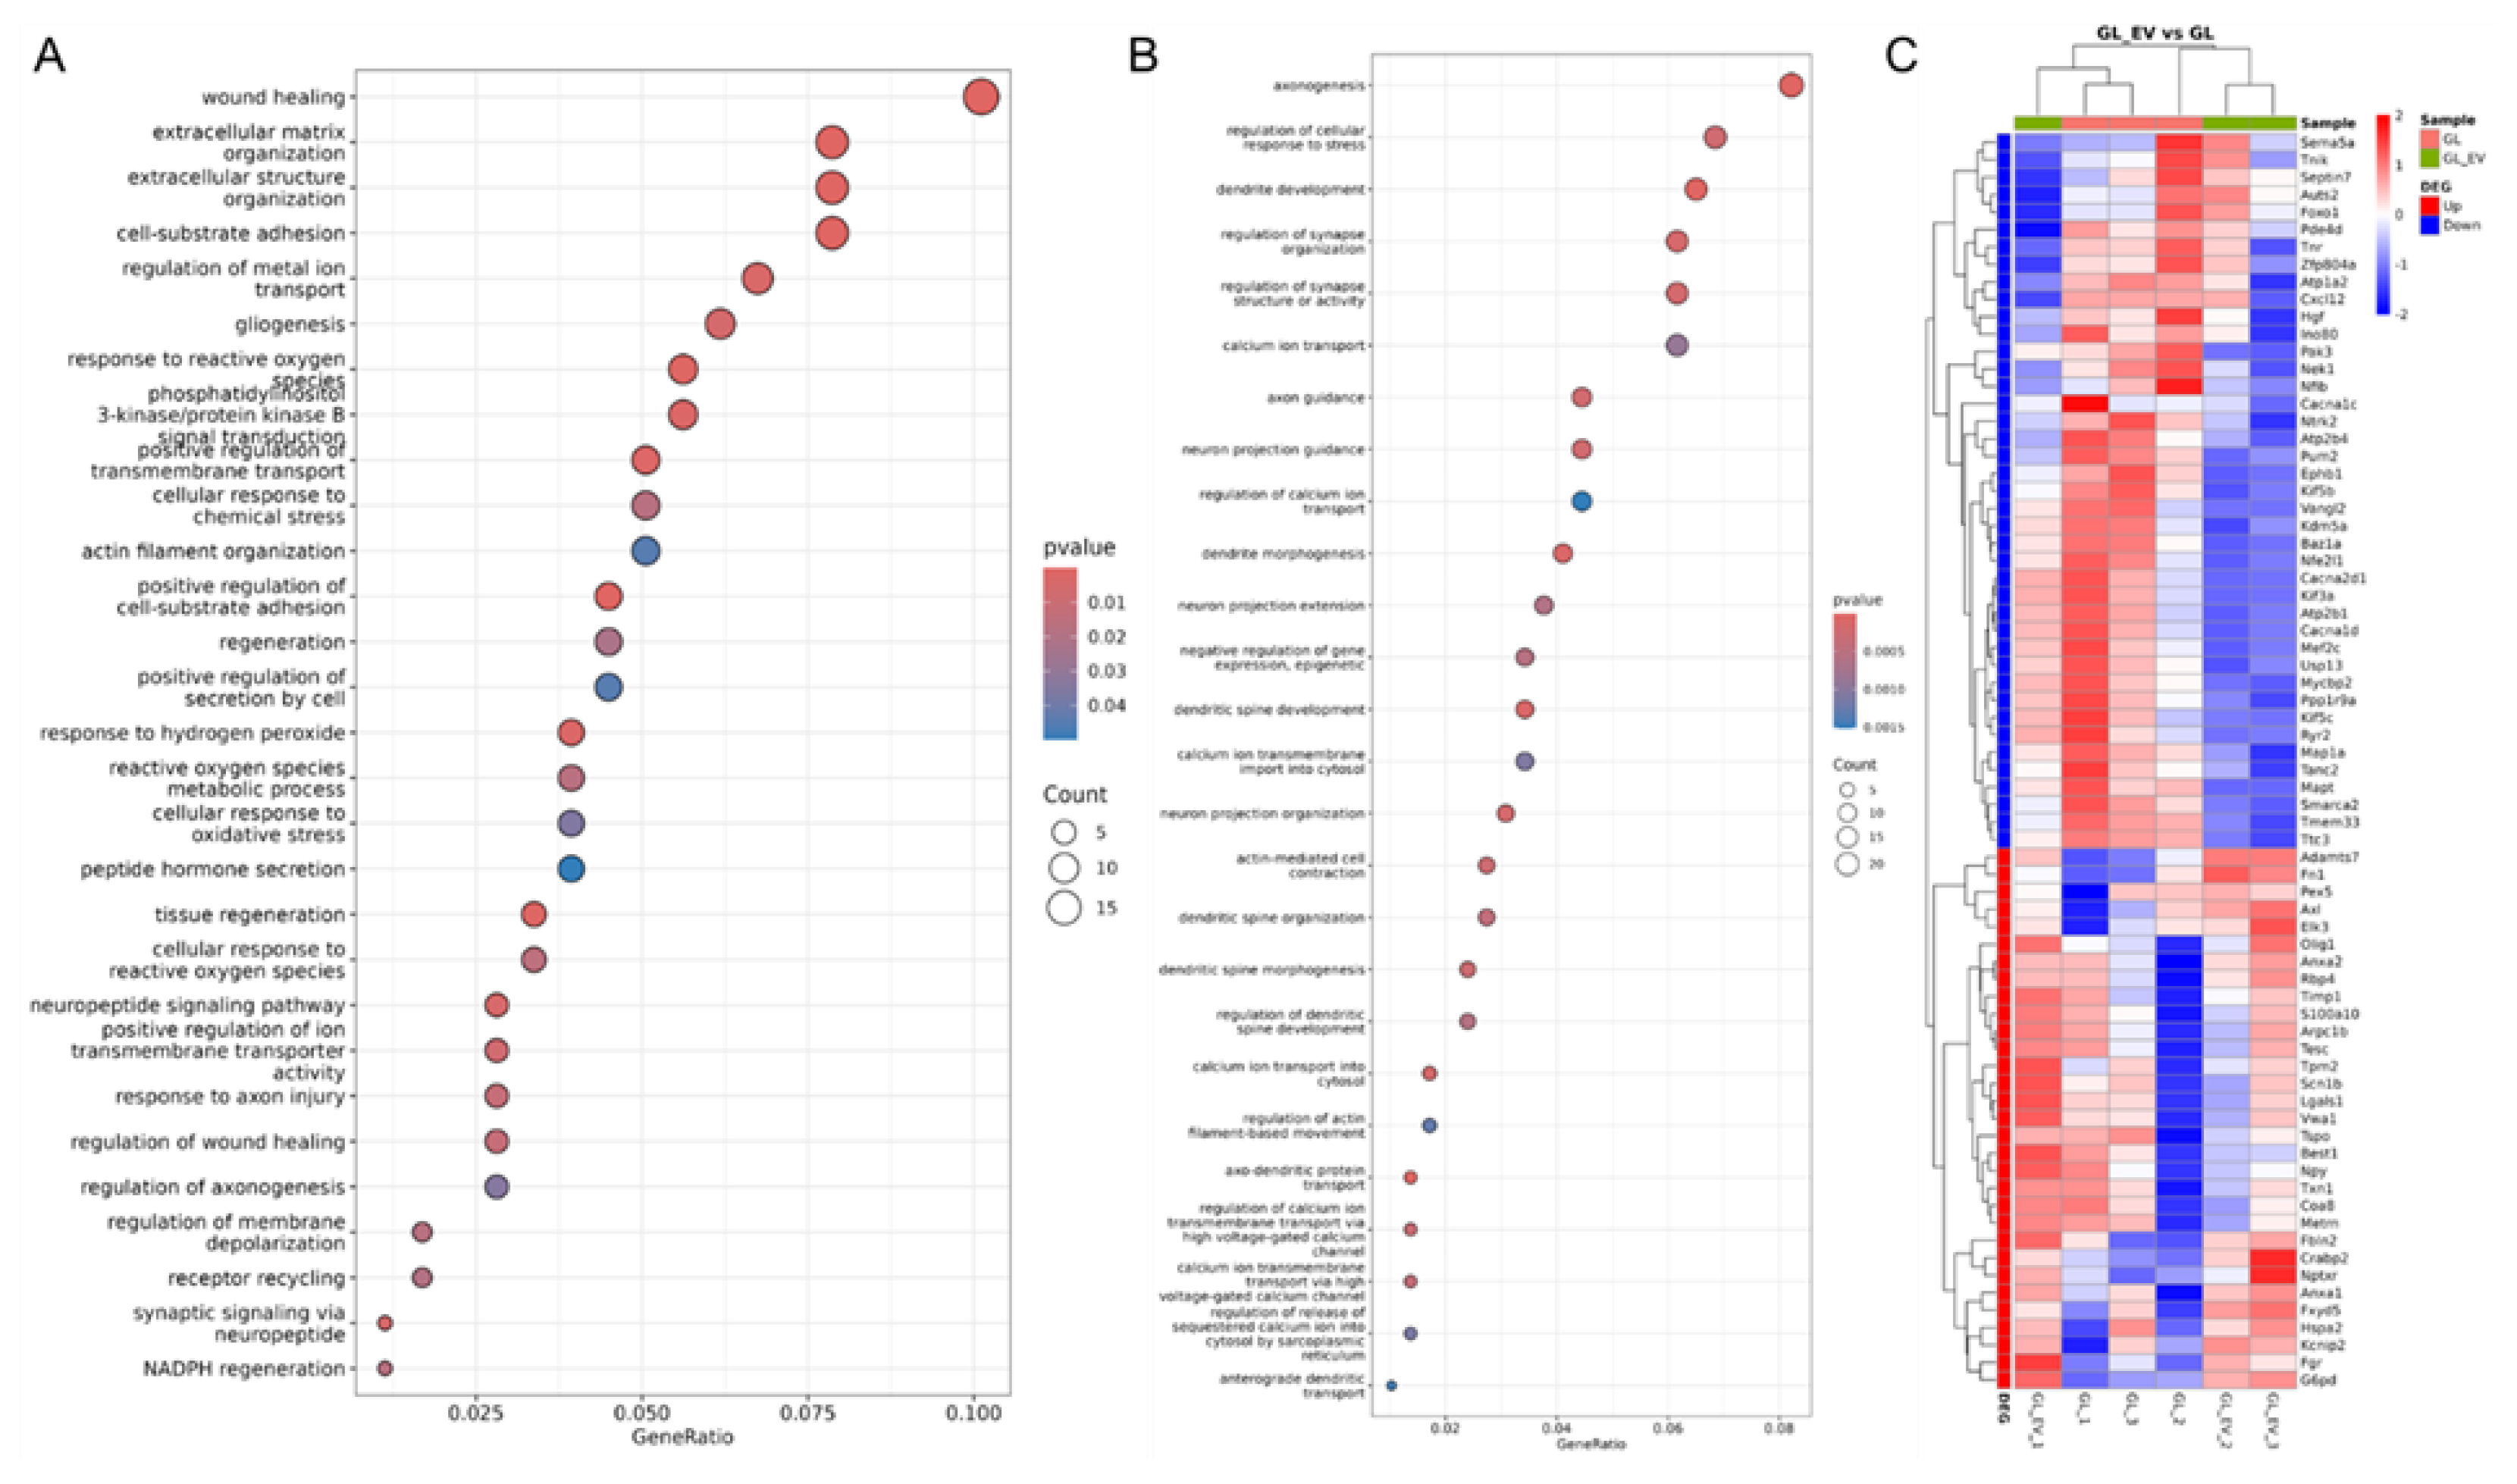
Figure 9.
Transcriptomic profiling of neuroglial cultures following EV-GPCs treatment in modeling glutamate excitotoxicity. A – Vulcano plot demonstrating the gene expression level depending on the fold change and p-value (p<0.05 and |FC|<1.5), gene expression is shown in the comparison group GL_EV_vs_GL, FC<1.5 – down-regulated genes, FC>1.5 – up-regulated genes; B – Results of classification of up-regulated DEGs using the KEGG database. The ratio of DEGs of the pathway to the total number of DEGs is shown on the X axis, and the selected Signaling pathways are shown on the Y axis. C – Results of classification of down-regulated DEGs using the KEGG database. The ratio of DEGs of the pathway to the total number of DEGs is shown on the X axis, and the selected Signaling pathways are shown on the Y axis. D – Gene set enrichment analysis (GO-base) in the comparison group GL_EV_vs_GL.
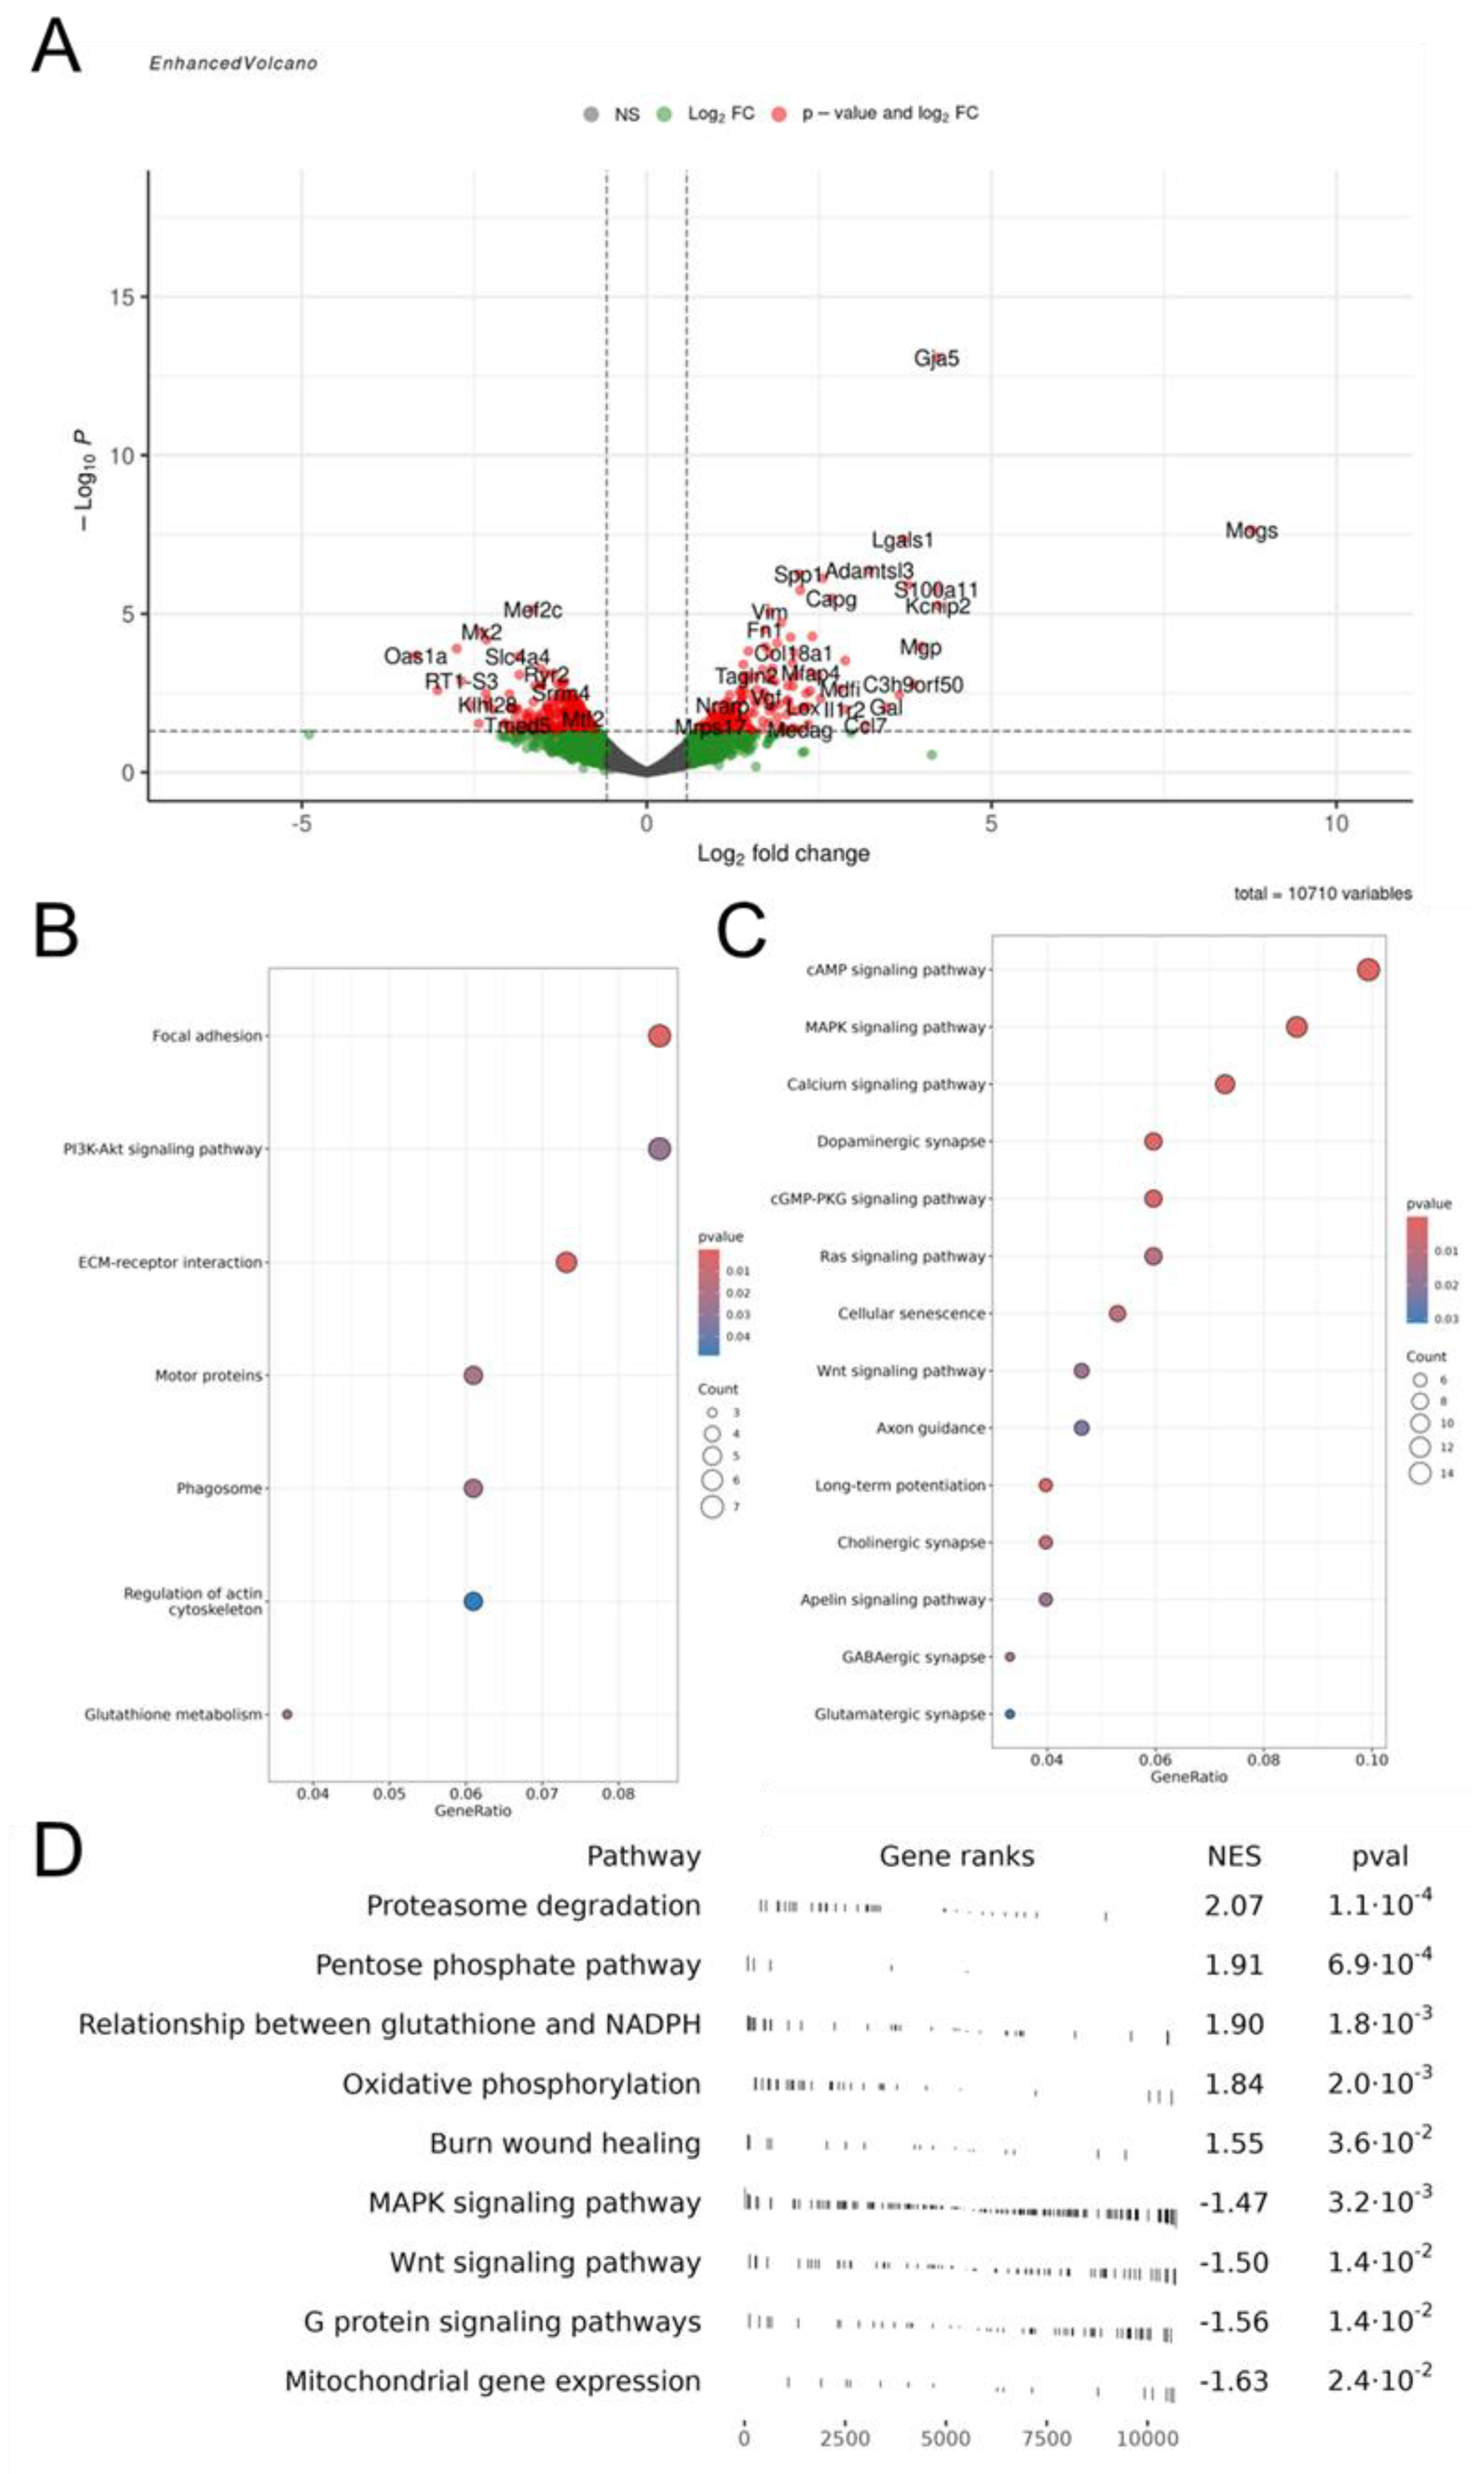

Table 1.
Lists of the most significant down-regulated differentially expressed genes (DEGs) associated with enriched biological pathways in the IC_vs_EV comparison group.
Table 1.
Lists of the most significant down-regulated differentially expressed genes (DEGs) associated with enriched biological pathways in the IC_vs_EV comparison group.
| Up/Down-regulated | Name of the gene | Description | GO_Biological processes |
|---|---|---|---|
| Up-regulated | Elk3 | transcription factor of cell cycle, cell growth and neural tissue development [73] | wound healing |
| Tnfrsf12a | receptor that activates various pathways in neurons [74] | ||
| Timp1 | inhibitor of metalloproteinases responsible for the survival and neuroprotection of neurons [75] | ||
| Anxa2 | gene is critical for axonal growth and cytoskeletal stabilization in neurites [76] | ||
| Vcl | gene controls axon growth through interaction with the extracellular matrix [77] | ||
| F3 | gene controls axon growth through interaction with the extracellular matrix [78] | ||
| Tsku | gene interacts with molecules involved in Wnt signaling and TGF-beta signaling [79] | ||
| Hk2 | gene controls glucose metabolism and energy production [80] | response to hypoxia | |
| Hmox1 | gene that controls redox balance and is involved in various cellular processes, including antioxidant defense and antiapoptosis [81] | ||
| Stat3 | gene stimulates the synthesis of genes responsible for reducing ROS [82] | ||
| Il1rap | interleukin-1 receptor, which in neurons is involved in the development and maintenance of synapses [83] | cytokine-mediated signaling pathway | |
| Cd44 | receptor that binds to hyaluronic acid and is responsible for axonal growth [84] | ||
| Ccl2 | gene is necessary for synapse function and is also involved in neuropeptide transduction [85] | ||
| Cxcl12 | chemokine that controls migration processes, the direction of axon growth, and interactions with other cells [86] | ||
| Tnfrsf1a | TNF receptor, the activation of which leads to the induction of many processes associated with inflammation, neuroprotection and cell homeostasis [87] | ||
| Egr1 | gene responsible for signals in the synaptic cleft and synaptic plasticity [88] | ||
| Antxr2 | gene remodels extracellular matrix [89] | extracellular matrix organization | |
| Adamts1 | gene remodels extracellular matrix [90] | ||
| Pmp22 | gene helps maintain the myelin sheath around the processes [91] | ||
| Has2 | hyaluronic acid synthetase [92] | ||
| Sulf1 | gene modifies heparan sulfate, thereby being able to modify various signaling pathways [93] | ||
| Sh3pxd2b | gene controls the actin cytoskeleton and cell adhesion [94] | cell-substrate adhesion | |
| Arpc1b | gene that controls actin polymerization and cell migration [95] | actin filament organization | |
| Tagln2 | control the growth of dendritic spines and the elongation of axons [96] | ||
| Spred3 | Ras/MAPK cascade inhibitors [97] | ERK1 and ERK2 cascade | |
| Dusp6 | Ras/MAPK cascade inhibitors [98] | ||
| Glipr2 | activators of the pathway that stimulates the development and survival of neurons [99] | ||
| Gpnmb | activators of the pathway that stimulates the development and survival of neurons [100] | ||
| Atf3 | gene activated by the ERK1 and ERK2 cascade and stimulating cell proliferation [101] | ||
| Trim25 | activator of NF-kappa B signaling pathway [102] | canonical NF-kappaB signal transduction | |
| Ier3 | activator of NF-kappa B signaling pathway [103] | ||
| Hspb1 | gene protectes against reactive oxygen species and the elimination of proteins damaged by it [104] | response to reactive oxygen species | |
| Prkcd | kinase that controls the balance between cell death and survival [105] | ||
| Stk38l | gene controles microtubule reorganization and neurite growth [106] | regulation of cellular catabolic process | |
| Snx18 | gene regulates the development of the axonal cone [107] | regulation of neurogenesis | |
| Nab2 | gene controls axon growth and dendrite branching [108] | ||
| Gfap | gene controles maintaining the structure and function of astrocytes [109] | gliogenesis | |
| Tmbim1 | transmembrane subunit of the BAX inhibitor - regulates the level of intracellular calcium, and also blocks the action of the proapoptotic protein Bax [110] | ||
| Bag3 | gene controls the formation of autophagosomes and stabilizes the functioning of mitochondria [111] | negative regulation of apoptotic signaling pathway | |
| Bdnf | gene plays a vital role in supporting the growth and survival of neurons in the brain | regulation of autophagy | |
| Mycn | gene acts as a transcription factor, influencing gene expression related to cell growth, proliferation, and differentiation [112] | regeneration | |
| Chst3 | the chondroitin 6-O-sulfotransferase 1 gene, which is responsible for modifications of chondroitin sulfate proteoglycans needed for the regeneration of neuronal processes [113] | ||
| Creb3l2 | transcription factor involved in neuroregeneration, particularly by promoting neurite outgrowth and neuronal differentiation [114] |
Table 2.
Lists of the most significant differentially expressed genes (DEGs) associated with enriched biological pathways in the IС_vs_GL and GL_Mem_vs_GL comparison groups.
Table 2.
Lists of the most significant differentially expressed genes (DEGs) associated with enriched biological pathways in the IС_vs_GL and GL_Mem_vs_GL comparison groups.
| Up/Down-regulated | Name of the gene | Description | GO_Biological processes |
|---|---|---|---|
| Up-regulated | Trpv2, Nell2, Thy1, Kiaa0319 | gene’s proteins are found in the axonal cone and provide guidance for axon growth [115,116,117,118] | axonogenesis |
| Rtn4rl1 | gene is an active participant in axon regeneration [119] | ||
| Slit2 | gene is responsible for axon navigation, inhibiting its growth in the wrong direction [120] | ||
| Ptpro | gene controls axon elongation and branching in response to BDNF [121] | ||
| Robo2 | Robo-signaling protein responsible for axon elongation [122] | ||
| Epb41l3, Epha4, Ephb6, Ephx4 | the ephrin family genes are responsible for axon elongation [123] | ||
| Snap25 | synaptovesicle protein [124] | regulation of synapse structure or activity | |
| Shank2, Shank1 | synaptic scaffold proteins, to control receptor positioning [125] | ||
| Lrfn1, Dlg4, Arhgap33 | genes control synaptic plasticity and structure control [126,127,128] | ||
| Kidins220, Celsr2, Bcl11a | dendrite formation genes [129,130,131] | dendrite development | |
| Nos1 | nitric oxide (NO) synthetase, which acts as a signaling messenger in various neural processes [132] | neurotransmitter transport | |
| Adora2a | receptor that influence the release of various neurotransmitters, including glutamate, dopamine and GABA [133] | ||
| Slc16a2 | thyroid hormone transporter [134] | ||
| Slc17a6, Slc17a7 | glutamate transporters [135] | ||
| Slc2a3, Slc2a6 | glucose transporters [136] | ||
| Stxbp5 | neurotransmitter exocytosis regulator [137] | ||
| Iqsec3 | gene participates in the regulation of the postsynaptic membrane in GABAergic synapses [138] | postsynapse organization | |
| Itpka | one of the subunits of postsynaptic kinases that respond to activation of receptors on the postsynaptic membrane [139] | ||
| Grip2 | the major protein of scaffolds on the postsynaptic membrane that controls the location of AMPA-kainate receptors [140] | ||
| Ppfia2, Ppfia3, Ppfia4, Rims1, Unc13a | proteins form presynaptic terminals by regulating the fusion of synaptic vesicles with the membrane [141] | positive regulation of synaptic transmission | |
| LRRTM1, Cnksr2, Dact1 | genes responsible for synapse structuring and formation [142,143] | ||
| Syp | gene modulates the function of the synapse, which controls vesicle fusion and neurotransmitter exocytosis [144] | ||
| Rasgrf1 | a protein in the Ras signaling pathway that is responsible for the response to calcium influx at the postsynaptic membrane [145] | ||
| Gria4, Gria1 | glutamate receptor subunits [146] | glutamate receptor signaling pathway | |
| Grin1, Grin2d | NMDA receptor subunit genes that respond to glutamate [147] | ||
| Camk1g, Camk2a, Camk2b, Camk2d, Camkk1 | Ca2+/calmodulin-dependent protein kinase genes, which are responsible for the membrane depolarization response [148] | regulation of membrane depolarization | |
| Tspoap1 | gene influences the localization of voltage-gated channels [149] | regulation of metal ion transport | |
| Kcnip1, Kcnip2, Kcnip4 | Potassium ion voltage-gated channel proteins [150] | ||
| Fxyd6, Fxyd7 | proteins that control the work of Na+/K+-ATPase [151] | ||
| Atp1a3, Atp1b1 | Na+/K+-ATPase subunit proteins [152] | ||
| Atp2b2, Atp2b3, Atp2b4 | Plasma membrane Ca2+ transporting ATPase (PMCA2) plays a critical role in neurons by regulating calcium ion concentrations [153] | calcium ion transport | |
| Rell2 | gene for a transmembrane protein that activates Rell signaling [154] | positive regulation of cell-substrate adhesion | |
| Thy1 | CD90 protein is a membrane protein that controls axonal growth by anchoring it to the extracellular matrix [155] | ||
| Foxg1, Rnf112, Parp6 | genes involved in neuronal development [156,157,158] | positive regulation of nervous system development | |
| Pdgfb | astrocyte proliferation stimulating protein [159] | gliogenesis | |
| Bmerb1, Carmil2, Carmil3 | proteins that regulate actin polymerization and signaling pathways in neurons [160,161] | actin filament organization | |
| mTOR | autophagy regulating protein [162] | negative regulation of neuron apoptotic process | |
| Agap2 | gene stimulates neuronal survival processes by activating the PI3K/Akt pathway [163] | ||
| Down-regulated | Hmox1, Serpine1 | hypoxia response protein [164] | response to hypoxia |
| Pmaip1 | proapoptotic protein, inhibitory anti-apoptotic protein Mlc-1 [165] | ||
| Limd1 | Hif-1alpha inhibitory gene [166] | ||
| Lif, Vrk2, Sphk1, Klf6 | activators of cell survival pathways [167,168,169,170] | cellular response to chemical stress | |
| Fos, Sesn2, Gdf15 | a marker of cellular response to stress [171,172,173] | ||
| Hsp90b1 | heat shock protein that responds to the accumulation of misfolded proteins [174] | ||
| Rest, Bmp4 | protein activated by oxidative stress [175,176] | ||
| Bdkrb2 | bradykinin receptor that triggers neuroinflammation processes [177] | ||
| Trib1, Fosl1 | genes that are activated by different types of stress, such as DNA damage from reactive oxygen species [178,179] | cellular response to oxidative stress | |
| Nfe2l2, Prdx1, Pex2 | genes for proteins that neutralizes reactive oxygen species, thereby protecting cells [180,181,182] | ||
| Dnajc3, Pdia4 | genes are activated by ER stress [183,184] | response to endoplasmic reticulum stress | |
| Anxa1, Hells | their expression is increased during apoptosis [185,186] | regulation of apoptotic signaling pathway | |
| Ier3, Fas, Tnfrsf12a | genes that are activated by any type of stress, stimulating apoptosis [187,188] | ||
| Tpt1 | a gene that controls both cell survival and cell death pathways [189] | ||
| Lgals3 | galectin-3 protein, which is activated by glutamate excitotoxicity and triggers autophagy and apoptosis processes [190] | ||
| Spry2 | gene reacts to a decrease in oxygen by activating cell death processes [191] | ||
| Klf4 | a gene for a protein that enhances the response to oxidative stress, thereby stimulating apoptosis [192] | ||
| Cdkn1a, Csrp1 | a gene that is activated in response to cell damage and stimulates its repair [193,194] | wound healing | |
| Nrg1 | gene actively participates in the development of neurons and in the restoration of synapse function [195] | ||
| Tfpi2, Rhoc | genes activated by axonal injury [196,197] | ||
| Fgf2 | cell division stimulating growth factor [198] | ||
| Egr2, Etv5, Nin, Sox10, Sox8 | proteins that control neurite elongation [199,200,201,202] | regulation of neurogenesis | |
| Nkx2-2, Notch1 | proteins stimulate regeneration [203,204] | ||
| Sdc4, Cxcl12 | genes responsible for intercellular adhesion and migration [205,206] | regulation of cell-cell adhesion | |
| Has2 | gene controls synthesis of hyaluronic threads [92] | extracellular structure organization | |
| Piezo1 | mechanotransduction gene activated by neuronal adhesion [207] | ||
| Gadd45b, Gadd45g, Gadd45a | genes for subunits of phosphatase that inhibits the MAPK kinase cascade [208] | negative regulation of phosphorylation | |
| Ppp1r15a | a gene that is activated in response to various types of cellular stress, including oxidative stress [209] | ||
| Cdkn2c, Cdkn2b | inhibitors of CDK4 and CDK6, thereby inhibiting the cell cycle [210] |
Table 3.
Lists of the most significant differentially expressed genes (DEGs) associated with enriched biological pathways in the GL_EV_vs_GL comparison group.
Table 3.
Lists of the most significant differentially expressed genes (DEGs) associated with enriched biological pathways in the GL_EV_vs_GL comparison group.
| Up/Down-regulated | Name of the gene | Description | GO_Biological processes |
|---|---|---|---|
| Up-regulated | Elk3, Timp1, Anxa2 | genes stimulate wound healing by enhancing proliferation, elongating processes and inhibiting apoptosis [211,212,213] | wound healing |
| Fgr | tyrosine kinase that activates NF-κB and ERK1/2 pathways [214] | phosphatidylinositol 3-kinase/protein kinase B signal transduction | |
| Txn1 | thioredoxin, which acts as an antioxidant, thereby protecting against oxidative stress [215] | ||
| Axl | Gas6 receptor, activation of which also promotes survival [216] | ||
| Metrn | gene responsible for the elongation of axons [218] | regulation of axonogenesis | |
| Crabp2 | gene participates in axon regeneration [219] | regulation of axonogenesis cell-substrate adhesion |
|
| Fbln2 | a gene encoding an extracellular matrix protein that is involved in the outgrowth of the dendritic tree [220] | ||
| Lgals1 | galectin, which is actively expressed in neurons and is responsible for the interaction between cells of the nervous tissue [221] | cell-substrate adhesion extracellular matrix organisation |
|
| S100a10 | it is involved in the regulation of serotonin receptor traffic, glutamatergic transmission and calcium signaling in neurons [222] | ||
| Fn1 | fibronectin, a key component of the brain’s extracellular matrix | ||
| Adamts7 | a metalloproteinase that can degrade components of the extracellular matrix [223] | extracellular matrix organisation actin filament organisation |
|
| Vwa1 | gene is actively expressed at the ends of neurites and interacts with the extracellular matrix [224] | ||
| Arpc1b | a protein responsible for the branching of the actin cytoskeleton and thus for the branching of neurites [225] | ||
| Tpm2 | gene controls the formation of axons and dendrites, the elongation of nerve cell processes [226] | actin filament organisation gliogenesis |
|
| Tspo | gene responsible for astrocyte proliferation [227] | ||
| Olig1 | gene activates oligodendrocytes and stimulates the protection of neuronal processes [228] | gliogenesis response to reactive oxygen species |
|
| Nptxr | pentraxin, which controls synapse formation and the flow of ions into neurons [229] | ||
| Pex5 | gene involved in the formation of peroxisomes [230] | response to reactive oxygen species cellular response to oxidative stress |
|
| G6pd | gene involved in cellular respiration and synthesis | ||
| Coa8 | electron transport chain gene cytochrome c oxidase-binding [231] | cellular response to oxidative stress reactive oxygen species metabolic process |
|
| Lcn2 | gene participates in the control of neuronal responses to external stimuli [232] | ||
| Spp1 | gene is associated with cell survival and axon reorganization upon injury [216] | response to axon injury | |
| Tesc | gene controls the entry of metal ions into neurons, especially calcium ions, by binding to it [233,234] | regulation of metal ion transport | |
| Hspa2 | heat shock protein gene, which is involved in ion transport by binding to the CatSper ion channel [234] | regulation of metal ion transport peptide hormone secretion |
|
| Kcnip2 | Potassium ion voltage-gated channel [150] | ||
| Best1 | calcium-activated anion channel, meaning it allows chloride ions to pass through cell membranes in response to changes in intracellular calcium levels [235] | ||
| Fxyd5 | gene regulates the work of Na+/K+-ATPase [236] | ||
| Rbp4 | gene participates in the transport of retinoic acid [237] | ||
| Npy | a neuropeptide essential for the survival of neurons [238] | peptide hormone secretion regulation of membrane depolarisation |
|
| Scn1b | voltage-gated sodium channel beta-1 subunit (VGSC) [239] | ||
| Auts2, Tnr, Septin7 | genes regulate of axon and neurite growth [240,241,242] | axonogenesis | |
| Down-regulated | Ttc3, Vangl2, Nfib | genes inhibit the emergence of neurites and the elongation of axons [243,244,245] | axonogenesis regulation of cellular response to stress |
| Kif5c, Kif5b, Mapt | genes responsible for transport in axons and dendrites [246,247] | ||
| Tmem33 | an ER stress-induced molecule that modulates the unfolded protein response signaling cascade leading to apoptosis [248] | ||
| Pum2 | gene responsible for axon regeneration in response to stress [249] | regulation of cellular response to stress dendrite development |
|
| Hgf | gene stimulates neuronal survival in response to injury [250] | ||
| Nfe2l1 | gene activated by ER stress [251] | ||
| Nek1 | gene plays a key role in the response to DNA damage [252] | ||
| Foxo1 | one of the key genes in the response to oxidative stress [253] | ||
| Ino80 | gene responsible for the repair of double-strand DNA breaks [254] | ||
| USP13 | gene plays a role in various cellular processes in neurons, including regulation of protein degradation and axonal degeneration [255] | ||
| Mef2c | a gene encoding a protein that regulates the formation of dendritic spines, which stimulates the elimination of spines during excitotoxicity [256] | ||
| Pak3 | gene participates in the formation of dendritic spines [257] | dendrite development regulation of synapse organization |
|
| Ppp1r9a | gene responsible for the creation of protein scaffolds in the synapse [258] | ||
| Tnik, Zfp804a, Tanc2 | genes responsible for regulating the structure and function of synapses [259,260,261] | regulation of synapse organization axon guidance |
|
| Ntrk2, Ephb1, Sema5a, Cxcl12 | genes are necessary for the correct direction of axon growth [262,263,264] | ||
| Mycbp2 [265] | gene is involved in axon degradation | axon guidance regulation of calcium ion transport |
|
| Atp2b4, Atp2b1, Atp1a2, Ryr2, Camk4 | genes of ion transporters that control the transport of calcium ions into the cytoplasm of neurons | ||
| Baz1a, Kdm5a, Smarca2 | genes that control DNA remodeling [266,267,268] | negative regulation of gene expression, epigenetic | |
| Limch1, Pde4d | gene play a role in regulating cell motility [269,270] | actin-mediated cell contraction | |
| Cacna1c, Cacna1d, Cacna2d1 | subunits of voltage-dependent calcium channel [271] | calcium ion transmembrane transport via high voltage-gated calcium channel | |
| Kif3a, Map1a | genes of motor proteins responsible for cargo transport from axons and dendrites [272,273] | axo-dendritic protein transport |
Disclaimer/Publisher’s Note: The statements, opinions and data contained in all publications are solely those of the individual author(s) and contributor(s) and not of MDPI and/or the editor(s). MDPI and/or the editor(s) disclaim responsibility for any injury to people or property resulting from any ideas, methods, instructions or products referred to in the content. |
© 2025 by the authors. Licensee MDPI, Basel, Switzerland. This article is an open access article distributed under the terms and conditions of the Creative Commons Attribution (CC BY) license (http://creativecommons.org/licenses/by/4.0/).
Copyright: This open access article is published under a Creative Commons CC BY 4.0 license, which permit the free download, distribution, and reuse, provided that the author and preprint are cited in any reuse.


