
Submitted:
13 August 2025
Posted:
14 August 2025
You are already at the latest version
Abstract
White asparagus spears were grown in the dark under a low tunnel (100 cm wide and 60 cm high) for 7 days before being exposed to sunlight for 0, 2, 3, 4, 5 or 7 h. Subsequently, the spears were either harvested and kept in the dark or continued to grow in the dark for 0, 24 or 48 h. At the end of the treatments, the color and the anthocyanins’ and total phenols’ content of the top 7 cm of the spears were determined. The results showed that the infrared radiation that was trapped below the tunnel during the 7-day growing period of white asparagus spears induced anthocyanin biosynthesis only in the lower part (base) of the spears. Exposure to sunlight for at least 3 h was critical for significant anthocyanin biosynthesis in the epidermal cells of the top 7 cm part of white asparagus spears. The amount of anthocyanins 24 h later was proportional to the exposure time and was greater in the spears harvested and kept in the dark than in spears that continued to grow in dark conditions.
Keywords:
Asparagus officinalis L.
; anthocyanins
; color
; phenols
; light
; infrared radiation
1. Introduction
The biosynthesis of anthocyanins and their accumulation in the epidermal cells of white asparagus spears results in the development of violet coloration, which is considered an undesirable quality characteristic, according to existing commercial grading standards, both for the fresh consumption and for the processing industry, resulting in a significant loss of its market value [1,2,3,4,5]. Thus, the presence of anthocyanins in the white asparagus spears even though it has significant positive effects on human health [4,5] is undesirable in the market, due to the lower commercial quality.
Although in recent decades, many studies have revealed the mechanisms that control the biosynthesis and regulation of anthocyanins in many plant tissues, very little is known about these processes in white asparagus spears. The biosynthesis of anthocyanins in most plants is light dependent [6], as a branch of the phenylpropanoid pathway, an important pathway linking primary and secondary metabolism in plants, in which phenylalanine ammonia-lyase (PAL) is the key rate-limiting enzyme [7]. Several authors have assumed that light is the most important activating factor for the biosynthesis of these pigments in both white [2,3,5,8] and purple [6] asparagus spears. In white asparagus, it has been documented [2] that light stimulates PAL activity, thus controlling the biosynthetic pathway of flavonoids (the most common class of polyphenols), in which anthocyanins belong. Just 1 h of exposure to light under 250 μmol m−2 s−1 intensity supplied by 400W mercury vapor lamps (corresponding to about 1/7 of sunlight radiation on a mild day in winter) was enough to activate PAL activity by 10-fold.
In white asparagus, anthocyanins are not synthesized at all in the absence of sunlight [1,4,6]. The accumulation of anthocyanins in the epidermal cells of white asparagus spears, when they are exposed to sunlight, could act as a protective mechanism against harmful ultraviolet radiation, as has been reported in other plant tissues [7,9]. For noticeable anthocyanin biosynthesis in the epidermal cells of white asparagus spears, an exposure to sunlight either before or after harvest for at least 3 h is thought to be a critical requirement [8,10,11], after which anthocyanin accumulation continues, regardless of the presence of light or not [10]. In purple asparagus spears, significant amounts of anthocyanins were synthesized during the first 3 days of spear growth, under exposure to natural light [6]. On the other hand, anthocyanin biosynthesis was induced in the first hour of exposure to light intensity of 250 μmol m−2 s−1 supplied by 400W mercury vapor lamps, while after 3 h of exposure to these lighting conditions, a pink hue was already observed in the epidermis of the spears of white asparagus, which after 20 h of exposure turned into an intense purple color [2].
Although the effects of light on asparagus spears are variable, given that anthocyanin accumulation can be influenced by light quality and intensity, as well as by the duration of the exposure [5], only a few studies have evaluated the effects of light of different sources and wavelength ranges on anthocyanin accumulation in asparagus spears and all of these are mainly focused on the postharvest period [3,12,13]. However, there are no relevant reports on the pre-harvest effects of light on anthocyanin biosynthesis in white asparagus spears.
On the other hand, the effect of light on anthocyanin biosynthesis in plant tissues mainly focuses on the effect of visible light, while the relevant research on responses to non-visible light, especially infrared radiation, is extremely limited [9]. Infrared is the radiation with a wavelength ranging from 780 nm – 1 mm and recent studies have revealed that this radiation promotes the synthesis of anthocyanins in some plant tissues [9]. However, there are no relevant reports on the pre-harvest effects of infrared radiation on anthocyanin biosynthesis in white asparagus spears.
Thus, the purpose of the present study was to investigate the biosynthesis of anthocyanins in white asparagus spears upon exposure to solar and infrared radiation during their growth and development.
2. Materials and Methods
2.1. Plant Material and Handling
In a commercial asparagus field (Galatades, Giannitsa, Greece) planted with ‘Grande’ F1 hybrid, one ridge in a total length of 240 m was leveled and an opaque plastic cover, with white color on the outside and black in the inside, was installed over the planting row two weeks before the end of the harvesting season. Wire hoops, spaced 50 cm apart over the planting row, supported the row covers to a height of 60 cm and a width of 100 cm. The temperature and relative humidity conditions inside the tunnel were recorded every 10 min using a Squirrel Meter/Logger (Grand Instruments Ltd. Barrington, Cambridge, England) using thermistor probs. In order to confirm the dark conditions inside the tunnel, the light radiation was also recorded every 10 min, using a data logger Lufft Opus II (Lufft Mess-und Regeltechnik GMBH, Stuttgart, Germany) with an external solar radiation sensor (pyranometer).
Seven days after covering the row, the plastic was removed and the growing spears were exposed to sunlight for 0, 2, 3, 4, 5 or 7 h. The temperature, relative humidity and light radiation were recorded every 10 min. The spears after being exposed to sunlight were either harvested at the surface of the soil or covered again with opaque plastic and continued their growth in the dark for 0, 24 or 48 h and then they were harvested.
The harvested spears from each treatment were divided into 3 groups, each group consisted of 3 replicates of 9 spears each. In one group, the color and the anthocyanin and total phenol content were determined, while the other two groups of spears were kept in the dark for 24 or 48 h, respectively, at room temperature (~20 οC) and then the same determinations were performed.
2.2. Determinations
2.2.1. Color
On each spear, three readings were taken at 1, 2 and 3 cm from the tip. The color of the spear tips was monitored using a chromameter (Minolta CR-200, Minolta, Osaka, Japan), equipped with an 8-mm measuring head and a C illuminant (6774 K). The instrument was calibrated using the manufacturer’s standard white plate (Y= 93.9, X= 0.313 and y= 0.3209). From the instrument readings L*, a* and b*, color changes were expressed with the L*, a*, ho (h°=tan−1 [b*/a*] or h°=180°+tan−1 [b*/a*], when a*>0 and b*>0 or a*<0 and b*>0, respectively) and C* (C*= ) values. L* refers to the lightness of the spear, and ranges from black= 0 to white= 100. A negative value of a* indicates green or white, while a positive value indicates violet-purple color. An increase in the hue angle value has been correlated with an increase in anthocyanin content, while an increase in the chroma value corresponds to a more intense color [14,15].
2.2.2. Anthocyanins and Total Phenols
For the determination of anthocyanins and total phenols, the 7 cm apical segments of the spears were macerated in a blender. Anthocyanins were also determined in the lower 7 cm of the spears (base) immediately after the tunnel was opened.
The anthocyanins were extracted from a 5 g sample with 50 mL of acidified ethanol (85:15 v/v EtOH:0.1N HCl) for 24 h at 4 οC in the dark. After centrifugation at 5,000 x g for 20 min at 4 οC, the absorbance of the extract was measured in a Spectronic 20D spectrophotometer at a wavelength of 532 nm [2], where the maximum absorbance (peak) of these anthocyanins was determined by scanning [10]. The anthocyanin content was expressed as μg total anthocyanins g−1 FW using the extinction coefficient ε= 98,400 g mL−1 (1 cm cell) [2].
For the total phenols extraction, a 5 g sample was homogenized in a Polytron apparatus (Kinematica GmbH) with 10 mL of 95% ethanol and centrifuged at 5,000 x g for 10 min. The pellet was extracted a second time with 95% ethanol and then a third time with 5% ethanol [16]. In the combined supernatants, after being supplemented with 95% ethanol to a final volume of 100 mL, the total phenols were determined colorimetrically by the Folin-Ciocalteu method [17,18]. Briefly, a quantity of 2.5 mL of the Folin-Ciocalteu reagent (diluted 10 times with distilled water) and 2 mL of Na2CO3 solution (75 g L−1) were added to 0.5 mL of the sample (diluted 10 times with distilled water). The addition of Na2CO3 was done within the time interval of 30 sec to 8 min from the addition of the Folin-Ciocalteu reagent. The samples were placed in a water bath at 50 οC for 5 min and after cooling to room temperature, the absorption of the solution was measured at 760 nm in a Thermospectronic Helios a spectrophotometer (Thermo Fisher Scientific, Waltham, MA, USA). The measurement data were expressed as mg gallic acid equivalent (GAE) g−1 FW. The standard reference curve was made by measuring the absorbance of solutions of known concentration of gallic acid (8-80 μg mL−1) (y= 102.781x - 0.907, R= 0.9998), which resulted from dilutions of a concentrated solution (80 mg 100 −1 mL).
2.2.3. Statistical Analysis
The analysis of variance (ANOVA) of the data was performed based on a completely randomized design (CRD), with 3 replicates. When F-values were significant (P < 0.05), the comparison of means was performed using the Least Significant Difference (LSD).
To determine the relative contribution of each factor (Duration of exposure to light for 0, 2, 3, 4, 5 or 7 h, growing after exposure on or out of the plant and duration of lag phase of 0, 24 or 48 h), as well as their interaction on the total variability of each parameter determined, η2 (eta squared) was calculated as follows: η2= SSfactor/SStotal, where SS= sum of squares, while η2x100 values are presented.
3. Results
3.1. Anthocyanin Biosynthesis
During the 7 days of spear growth in the dark, the temperature, relative humidity and radiation inside the tunnel were in the range of 10.2-36.0 oC, 22-100% and 0.1-0.6 W m−2, respectively (Figure 1). Under these conditions, anthocyanin biosynthesis was not observed in the top 7 cm of the spears (Figure 2). In contrast, anthocyanin biosynthesis (0.82±0.04 μg g-1 FW) was observed in the lower 7 cm of the spears (base), close to the soil surface.
After opening the tunnel, the spears were exposed to solar radiation for 0, 2, 3, 4, 5 and 7 h, during which periods the average temperature was 28.0, 29.0, 30.1, 30.5 and 31.0 οC, respectively and the sum of the solar radiation intensity was 1,454, 1,965, 2,620, 3,039 and 3,807 (W m−2), respectively (Figure 3).
The top 7 cm of the spears that were exposed to sunlight for 2 or 3 h did not contain any anthocyanins, similarly to those that were not exposed to sunlight at all. In contrast, in spears that were exposed to sunlight for ≥4 h, appreciable amounts of anthocyanins were synthesized (Figure 2) which were linearly increasing with increasing exposure duration (y= 0.1585x - 0.162, R2= 0.9953).
Twenty-four hours upon exposure to sunlight, a great increase in the anthocyanins content in the top 7 cm of the spears was observed, which was proportional to the time of exposure to sunlight. This increase was greater in spears that were harvested and kept in dark conditions, compared to spears that continued to grow in darkness (Figure 4). In the subsequent 24 h period, a significant increase in the content of anthocyanins were observed only in spears that were not exposed to sunlight.
3.2. Color
After opening the tunnel and leaving the spears exposed to solar radiation for 0, 2, 3, 4, 5 and 7 h, the color parameter L*, C* and hο of the spear tips decreased linearly with increasing exposure duration (y = -1,4604x + 75,625, R2 = 0,9914; y = -0,6863x + 15,956, R2 = 0,9531; y = -2,3086x + 106,64, R2 = 0,9846 for the color parameter L*, C* and hο, respectively) (Figure 5). On the other hand, the color parameter a* on the spear tips increased linearly with increasing exposure duration (y = 0,6029x + 4,1966, R2 = 0,9814), reaching positive values after exposure to sunlight for 7 h (Figure 5).
3.3. Total Phenols
The top 7 cm of the spears that were exposed to sunlight for 2 h contained the same amount of total phenols as those that were not exposed to sunlight. In contrast, appreciable amounts of total phenols were synthesized in the top 7 cm of the spears that were exposed to sunlight for 3 h, which were not further increasing while increasing exposure duration from 3 to 5 h (Figure 6). Thereafter, higher amounts (by 1.2-fold) of total phenols were synthesized only after 7 h of exposure to sunlight.
Twenty-four hours after exposure to sunlight, a small (11-15%) but significant increase in the content of total phenols in the top 7 cm was observed only in spears that were exposed to light for ≤3h and then were harvested and maintained in dark conditions (Figure 7). In the subsequent 24 h period, no significant changes in the total phenol content were observed. On the other hand, in spears that continued to grow in darkness, an increase (19-37%) in the content of total phenols in the top 7 cm was observed both after 24 and 48 h of exposure to sunlight (Figure 7).
3.4. The Contribution of the Three Factors
The analysis of variance of the data (ANOVA) showed that all three factors that were studied (Duration of exposure to light for 0, 2, 3, 4, 5 or 7 h, growing after exposure on or out of the plant and duration of lag phase of 0, 24 or 48 h), as well as their interactions, had a significant effect (P< 0.001) on the anthocyanin content of the top 7 cm of white asparagus spears (Table 1). However, the duration of lag phase clearly emerged as the most important one for the anthocyanin content, confirmed by the higher η2 (68.3) than of the duration of exposure to light (η2= 20.0), growing after exposure on or out of the plant (η2= 2.6) or their interactions (η2= 1.0-4.4).
On the other hand, all three factors, as well as the interaction growing after exposure on or out of the plant × duration of lag phase had a significant effect (P< 0.001) on the total phenol content of the top 7 cm of white asparagus spears (Table 1). However, the duration of exposure to light and duration of lag phase contributed almost equally to the total variability of total phenol content (η2= 40.2 and 36.5, respectively), while the contribution of growing after exposure on or out of the plant and the interaction growing after exposure on or out of the plant × duration of lag phase was lower (η2= 15.6 and 6.0, respectively).
4. Discussion
Although the covering material that was used in the study was impermeable to light, inside the tunnel, where the spears were growing, a radiation intensity of 0.1-0.6 W m−2 was recorded, with the maximum value occurring when the temperature was minimum (in the early morning hours) and the minimum value when the temperature was maximum (in the early afternoon hours) (Figure 1). It is obvious that this radiation is the energy radiated from the ground surface into the tunnel in the form of heat or infrared radiation. The ground surface absorbs solar radiation during the day and re-radiates it as long-wave radiation during the night [19]. Similarly, Jishi et al. (2008) [20] recorded irradiance up to 0.35 Lux into tunnels covered with opaque plastic 60 cm wide and 50 cm high, while lower irradiation (<0.01 Lux) was recorded into larger tunnels (230 cm wide and 200 cm high).
This intensity of infrared radiation that was trapped under the low tunnel (60 cm height, 100 cm width) of our study induced the anthocyanin biosynthesis only in the lower part of the white asparagus spears during the 7-day exposure period. In contrast, the top section of the spears, which is constantly growing and elongating, was exposed to infrared radiation for a shorter period, that was apparently not sufficient for anthocyanin biosynthesis. Similarly, anthocyanin biosynthesis only in the lower part of white asparagus spears grown in darkness under a low tunnel (50 cm height, 60 cm width) and not under a higher one (200 cm height, 230 cm width) has been reported by Jishi et al. (2008) [20].
Although research related to the role of infrared radiation in anthocyanin biosynthesis is still scarce, it has recently been shown that the application of infrared light in radiation chambers increases anthocyanin content in red grape berries [19]. Between various light spectra (ultraviolet <380 nm, visible 380–780 nm and infrared >780 nm), the ultraviolet region has been mainly studied during the postharvest life of white asparagus spears [3,12,13], while the effect of any spectrum during preharvest production has not been clarified.
The results of the present study support the common belief [8,10,11] that exposure to sunlight for at least 3 h is considered as a critical condition for triggering significant anthocyanin biosynthesis in the epidermal cells of the tip in white asparagus spears (Figure 2). Twenty-four hours after exposure to sunlight, the anthocyanin content in the top 7 cm of the spears was proportional to the time of light exposure and was higher in spears that upon harvesting were kept under dark conditions, compared to the ones that continued to grow in darkness (Figure 4). This latter result was somehow expected given that harvesting asparagus spears induces severe wounding stress [21] and it is well known that in turn this stress results in increased PAL activity [22,23,24], thus leading to the biosynthesis of a greater amount of anthocyanins in harvested spears compared to unharvested ones (Figure 4). During the process of anthocyanin biosynthesis, the PAL is the key enzyme that catalyzes the first reaction of the phenylpropanoid pathway [7] and its activity is induced, in addition to wounding stress due to the harvesting of asparagus spears, by exposure to sunlight of both green [23] and white asparagus spears [2], with increased activity observed after 9 h [23].
A total of 1,045 metabolites were detected in spears of three green and one white asparagus cultivar, of which the polyphenolic components accounted for 37.5% [25]. Phenolic compounds are secondary metabolites in plants and their functions are not always known. Some are structural polymers, UV-protective filters, antioxidants and attractants, while others are involved in non-specific defense mechanisms. In addition, their importance in determining certain quality characteristics and properties in fresh fruits and vegetables, such as color, texture, flavor and aroma, should be highlighted. Moreover, one of the main roles that have been proposed as part of their actions in humans is that of antioxidants [25,26].
The apical parts (0-7 cm) of the asparagus spears and those with purple and green coloration have the highest content of phenolics [24,25,27,28], suggesting that exposure of the asparagus spears to light is necessary for their accumulation [25,30,31]. This is supported by the results of the present study (Figure 6), according to which the total phenol content increased by 1.42 times upon 7 h of exposure to sunlight. The biosynthesis of secondary metabolites occurs mainly via the phenylpropanoid metabolic pathway, where PAL and chalcone synthase (CHS), which catalyze the rate-limiting step, are restricted under reduced light conditions [25].
Exposure of white asparagus spears to sunlight results in significant changes in the color of their tip, as confirmed by decreases of the parameters L*, C* and ho and by an increase of the parameter a* (Figure 5). Apparently, these changes are mainly a consequence of the biosynthesis of anthocyanins and their accumulation in the epidermal cells (Figure 2), which is perceived during the development of a violet coloration on the spear tips [2]. The color of the skin of fruits and vegetables results from various pigments, such as chlorophyll, carotenoids, phenolics (anthocyanins, flavonols and proanthocyanins) etc., which selectively absorb and reflect the incident visible light to generate a characteristic reflectance spectrum. However, there are conflicting reports regarding the correlation between color and pigment composition, as a given set of coordinates in color space can be explained by many combinations of pigments [15]. The importance of the color of the white asparagus spear tip is clear, as long as any deviation from white appearance degrades the marketable quality [1,2,3,4,5].
5. Conclusions
Infrared radiation trapped in a low tunnel (60 cm high, 100 cm wide) during the 7-day growing period of white asparagus spears induces anthocyanin biosynthesis only in the lower part (base) of the spears. Exposure to sunlight for at least 3 h is a critical condition for significant anthocyanin biosynthesis in the epidermal cells of the top 7 cm of white asparagus spears that were grown in darkness. The amount of accumulated anthocyanins 24 h later was proportional to the exposure time and was greater in spears that were harvested and kept in dark conditions than in spears that continued to grow in darkness. The biosynthesis of anthocyanins and their accumulation in the epidermal cells of the top 7 cm of white asparagus spears due to their exposure to solar radiation results in significant changes in their color (parameters L*, C*, ho and a*) that degrade the commercial quality of the harvested product.
Author Contributions
Conceptualization, P.P.P. and A.S.S.; methodology, P.P.P and A.S.S.; formal analysis, P.P.P., E.A.S. and A.S.S.; data curation, P.P.P., E.A.S. and S.A.S.; writing—original draft preparation, A.S.S.; writing—review and editing, P.P.P., E.A.S. and S.A.S.; supervision, A.S.S.; project administration, A.S.S. All authors have read and agreed to the published version of the manuscript.
Funding
This research received no external funding.
Data Availability Statement
The raw data supporting the conclusions of this article will be made available by the authors on request.
Acknowledgments
We thank J. Kouloudeitsis for conceding the asparagus field and D. Stavroglou and his Company Daios Plastics S.A for supplying the film used for experiments. We gratefully acknowledge P. Tsouvaltzis for helpful discussions and critical reading of the manuscript.
Conflicts of Interest
The authors declare no conflicts of interest.
Abbreviations
The following abbreviations are used in this manuscript:
| PAL | Phenylalanine ammonia lyase (EC 4.3.1.24) |
| GAE | Gallic acid equivalent |
| FW | Fresh weight |
| CRD | Completely randomized design |
| LSD | Least significant difference |
| UV | Ultraviolet |
| CHS | Chalcone synthase (EC 2.3.1.74) |
References
- Siomos, A.S. Quality, handling and storage of white asparagus. In Crop Management and Postharvest Handling of Horticultural Products, Vol. II: Fruits and Vegetables; Dris, R., Niskanen, R., Jain, S.M., Eds.; Science Publishers Inc.: Enfield (NH), USA, 2003; pp. 63–85. [Google Scholar]
- Flores, F.B.; Oosterhaven, J.; Martínez-Madrid, M.C.; Romojaro, F. Possible regulatory role of phenylalanine ammonia-lyase in the production of anthocyanins in asparagus (Asparagus officinalis L). J. Sci. Food Agric. 2005, 85, 925–930. [Google Scholar] [CrossRef]
- Sanz, S.; Olarte, C.; Ayala, F.; Echavarri, J.F. Evolution of quality characteristics of minimally processed asparagus during storage in different lightning conditions. J. Food Sci. 2009, 74, 296–302. [Google Scholar] [CrossRef]
- Siomos, A.S. The quality of asparagus as affected by preharvest factors. Sci. Hortic. 2018, 233, 510–519. [Google Scholar] [CrossRef]
- Huyskens-Keil, S.; Eichholz-Dündar, I.; Hassenberg, K.; Herppich, W.B. Impact of light quality (white, red, blue light and UV-C irradiation) on changes in anthocyanin content and dynamics of PAL and POD activities in apical and basal spear sections of white asparagus after harvest. Postharvest Biol. Technol. 2020, 161, 111069. [Google Scholar] [CrossRef]
- Dong, T.T.; Han, R.P.; Yu, J.W.; Zhu, M.K.; Zhang, Y.; Gong, Y.; Li, Z.Y. Anthocyanins accumulation and molecular analysis of correlated genes by metabolome and transcriptome in green and purple asparaguses (Asparagus officinalis L.). Food Chem. 2019, 271, 18–28. [Google Scholar] [CrossRef]
- Dong, N.Q.; Lin, H.X. Contribution of phenylpropanoid metabolism to plant development and plant-environment interactions. J. Integr. Plant Biol. 2021, 63, 180–209. [Google Scholar] [CrossRef]
- Siomos, A.S.; Dogras, C.C.; Sfakiotakis, E.M. Effect of temperature and light during storage on the composition and color of white asparagus spears. Acta Hortic. 1995, 379, 359–365. [Google Scholar] [CrossRef]
- Yin, H.; Wang, L.; Wu, Y.; Xi, Z. Roles of non-visible light and temperature in the regulation of anthocyanin synthesis in fruits and vegetables. Food Front. 2024, 5, 1968–1983. [Google Scholar] [CrossRef]
- Siomos, A.S.; Dogras, C.C.; Sfakiotakis, E.Μ. Modified atmosphere packaging of white asparagus spears: composition, color and textural quality responses to temperature and light. Sci. Hortic. 2000, 84, 1–13. [Google Scholar] [CrossRef]
- Siomos, A.S.; Dogras, C.C.; Sfakiotakis, E.Μ. Color development in harvested white asparagus spears in relation to carbon dioxide and oxygen concentration. Postharvest Biol. Technol. 2001, 23, 209–214. [Google Scholar] [CrossRef]
- Eichholz, I.; Rohn, S.; Gamm, A.; Beesk, N.; Herppich, W.B.; Kroh, L.W.; Ulrichs, C.; Huyskens-Keil, S. UV-B-mediated flavonoid synthesis in white asparagus (Asparagus officinalis L.): Effect of spear development and irradiation dose on the activity of associated enzymes. Food Res. Int. 2012, 48, 196–201. [Google Scholar] [CrossRef]
- Mastropasqua, L.; Tanzarella, P.; Paciolla, C. Effects of postharvest light spectra on quality and health-related parameters in green Asparagus officinalis L. Postharvest Biol. Technol. 2016, 112, 143–151. [Google Scholar]
- McGuire, R.G. Reporting of objective color measurements. HortScience 1992, 27, 1254–1255. [Google Scholar] [CrossRef]
- Lancaster, J.E.; Lister, C.E.; Reay, P.F.; Triggs, C.M. Influence of pigment composition on skin color in a wide range of fruit and vegetables. J. Amer. Soc. Hortic. Sci. 1997, 122, 594–598. [Google Scholar] [CrossRef]
- Cheng, G.W. , Breen, P.J. Activity of phenylalanine ammonia-lyase (PAL) and concentrations of anthocyanins and phenolics in developing strawberry fruit. J. Am. Soc. Hortic. Sci. 1991, 116, 865–869. [Google Scholar] [CrossRef]
- Singleton, V.L.; Rossi, J.A.Jr. Colorimetry of total phenolics with phosphomolybdic-phosphotungstic acid reagents. Am. J. Enol. Vitic. 1965, 16, 144–158. [Google Scholar] [CrossRef]
- Scalbert, A.; Monties, B.; Janin, G. Tannins in wood: Comparison of different estimation methods. J. Agric. Food Chem. 1989, 37, 1324–1329. [Google Scholar] [CrossRef]
- López-Martínez, A.; Molina-Aiz, F.D.; Moreno-Teruel, M.d.l.Á.; Peña-Fernández, A.; Baptista, F.J.F.; Valera-Martínez, D.L. Low tunnels inside Mediterranean greenhouses: Effects on air/soil temperature and humidity. Agronomy 2021, 11, 1973. [Google Scholar] [CrossRef]
- Jishi, T.; Shiga, Y. & Konno, K.; Tanaka, S. White asparagus production with opaque film in rootstock planting forcing culture. Hortic. Res. 2008, 7, 241–247. [Google Scholar]
- Papadopoulou, P.; Siomos, A.S.; Dogras, C. Metabolism of etiolated and green asparagus before and after harvest. J. Hortic. Sci. Biotechnol. 2001, 76, 497–500. [Google Scholar] [CrossRef]
- Goldstein, L.D.; Jennings, P.H.; Marsh, H.V. L-phenylalanine ammonia-lyase activity in asparagus spears: Effects of excision and incubation. Plant Cell Physiol. 1972, 13, 783–793. [Google Scholar] [CrossRef]
- Powers, J.R.; Drake, S.R. Effect of cut and field-holding conditions of activity of phenylalanine ammonia-lyase and texture in fresh asparagus spears. J. Food Sci. 1980, 45, 509–510. [Google Scholar] [CrossRef]
- Bhowmik, P.K.; Matsui, T.; Suzuki, H.; Kosugi, Y. A phenylalanine ammonia-lyase gene from asparagus: cDNA cloning, sequence and expression in response to wounding. Asian J. Plant Sci. 2003, 2, 425–430. [Google Scholar] [CrossRef]
- Liu, P.; Gao, R.; Gao, L.; Bi, J.; Jiang, Y.; Zhang, X.; Wang, Y. Distinct quality changes of asparagus during growth by widely targeted metabolomics analysis. J. Agric. Food Chem. 2022, 70, 15999–16009. [Google Scholar] [CrossRef]
- Xu, L.; Wang, X.A. Comprehensive review of phenolic compounds in horticultural plants. Int. J. Mol. Sci. 2025, 26, 5767. [Google Scholar] [CrossRef]
- Papadopoulou, P.P.; Siomos, A.S.; Dogras, C.C. Comparison of textural and compositional attributes of green and white asparagus produced under commercial conditions. Plant Foods Hum. Nutr. 2003, 58, 1–9. [Google Scholar] [CrossRef]
- Papoulias, E.; Siomos, A.S.; Koukounaras, A.; Gerasopoulos, D.; Kazakis, E. Effects of genetic, pre- and post-harvest factors on phenolic content and antioxidant capacity of white asparagus spears. Int. J. Mol. Sci. 2009, 10, 5370–5380. [Google Scholar] [CrossRef]
- Li, Y.; Brown, S.E.; Li, Y.; Cheng, Q.; Wu, H.; Wei, S.; Li, X.; Lin, C.; Liu, Z.; Mao, Z. 2024. Profiles of phenolics and their synthetic pathways in Asparagus officinalis L. Food Chem. Mol. Sci., 2024, 8, 100187. [Google Scholar]
- Maeda, T.; Honda, K.; Sonoda, T.; Motoki, S.; Inoue, K.; Suzuki, T.; Oosawa, K.; Suzuki, M. Light condition influences rutin and polyphenol contents in asparagus spears in the mother-fern culture system during the summer–autumn harvest. J. Japan. Soci. Hortic. Sci. 2010, 79, 161–167. [Google Scholar] [CrossRef]
- Kulczyński, B. , Kobus-Cisowska, J., Kmiecik, D., Gramza-Michałowska, A., Golczak, D., Korczak, J. Antiradical capacity and polyphenol composition of asparagus spears varieties cultivated under different sunlight conditions. Acta Sci. Pol. Technol. Aliment. 2016, 15, 267–279. [Google Scholar] [CrossRef]
Figure 1.
Temperature (oC) and radiation (W m−2) inside the tunnel during the 7 days of spear growth in darkness.
Figure 1.
Temperature (oC) and radiation (W m−2) inside the tunnel during the 7 days of spear growth in darkness.
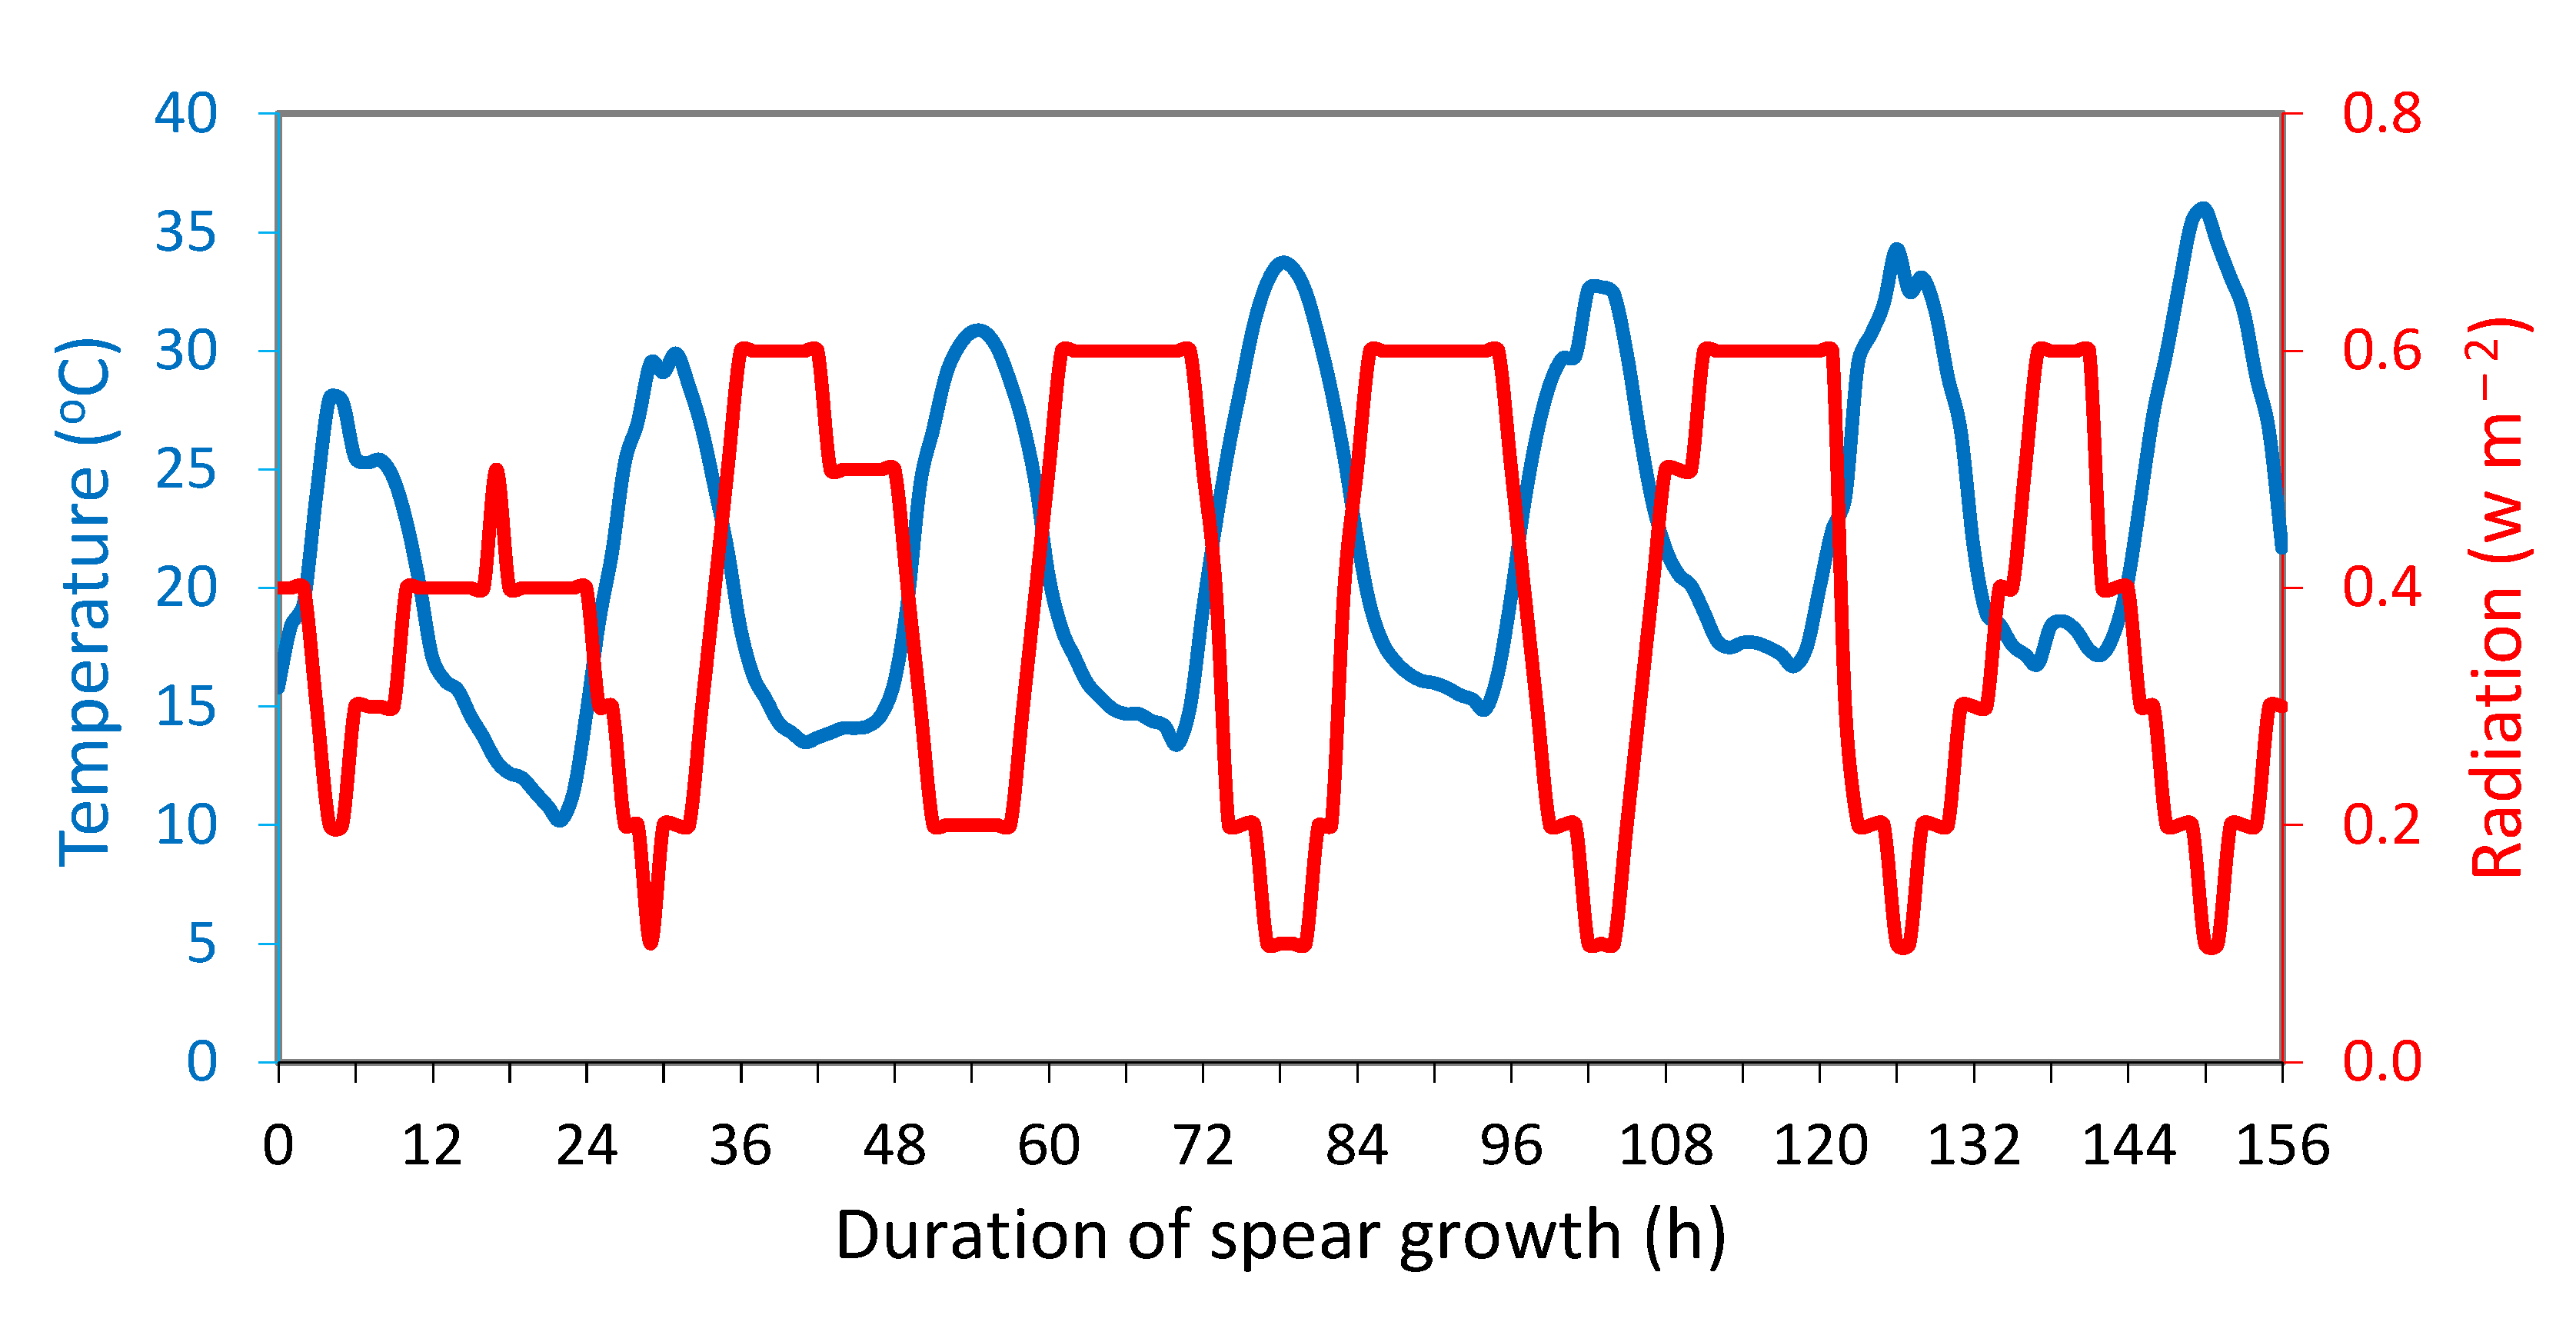
Figure 2.
Anthocyanin content (μg g−1 FW) in the top 7 cm of white asparagus spears grown for 7 days in darkness and then exposed to sunlight for 0, 2, 3, 4, 5 or 7 h. Each column represents the mean of three replicates ±SE and the vertical bar in the graph represents the 5% LSD value.
Figure 2.
Anthocyanin content (μg g−1 FW) in the top 7 cm of white asparagus spears grown for 7 days in darkness and then exposed to sunlight for 0, 2, 3, 4, 5 or 7 h. Each column represents the mean of three replicates ±SE and the vertical bar in the graph represents the 5% LSD value.
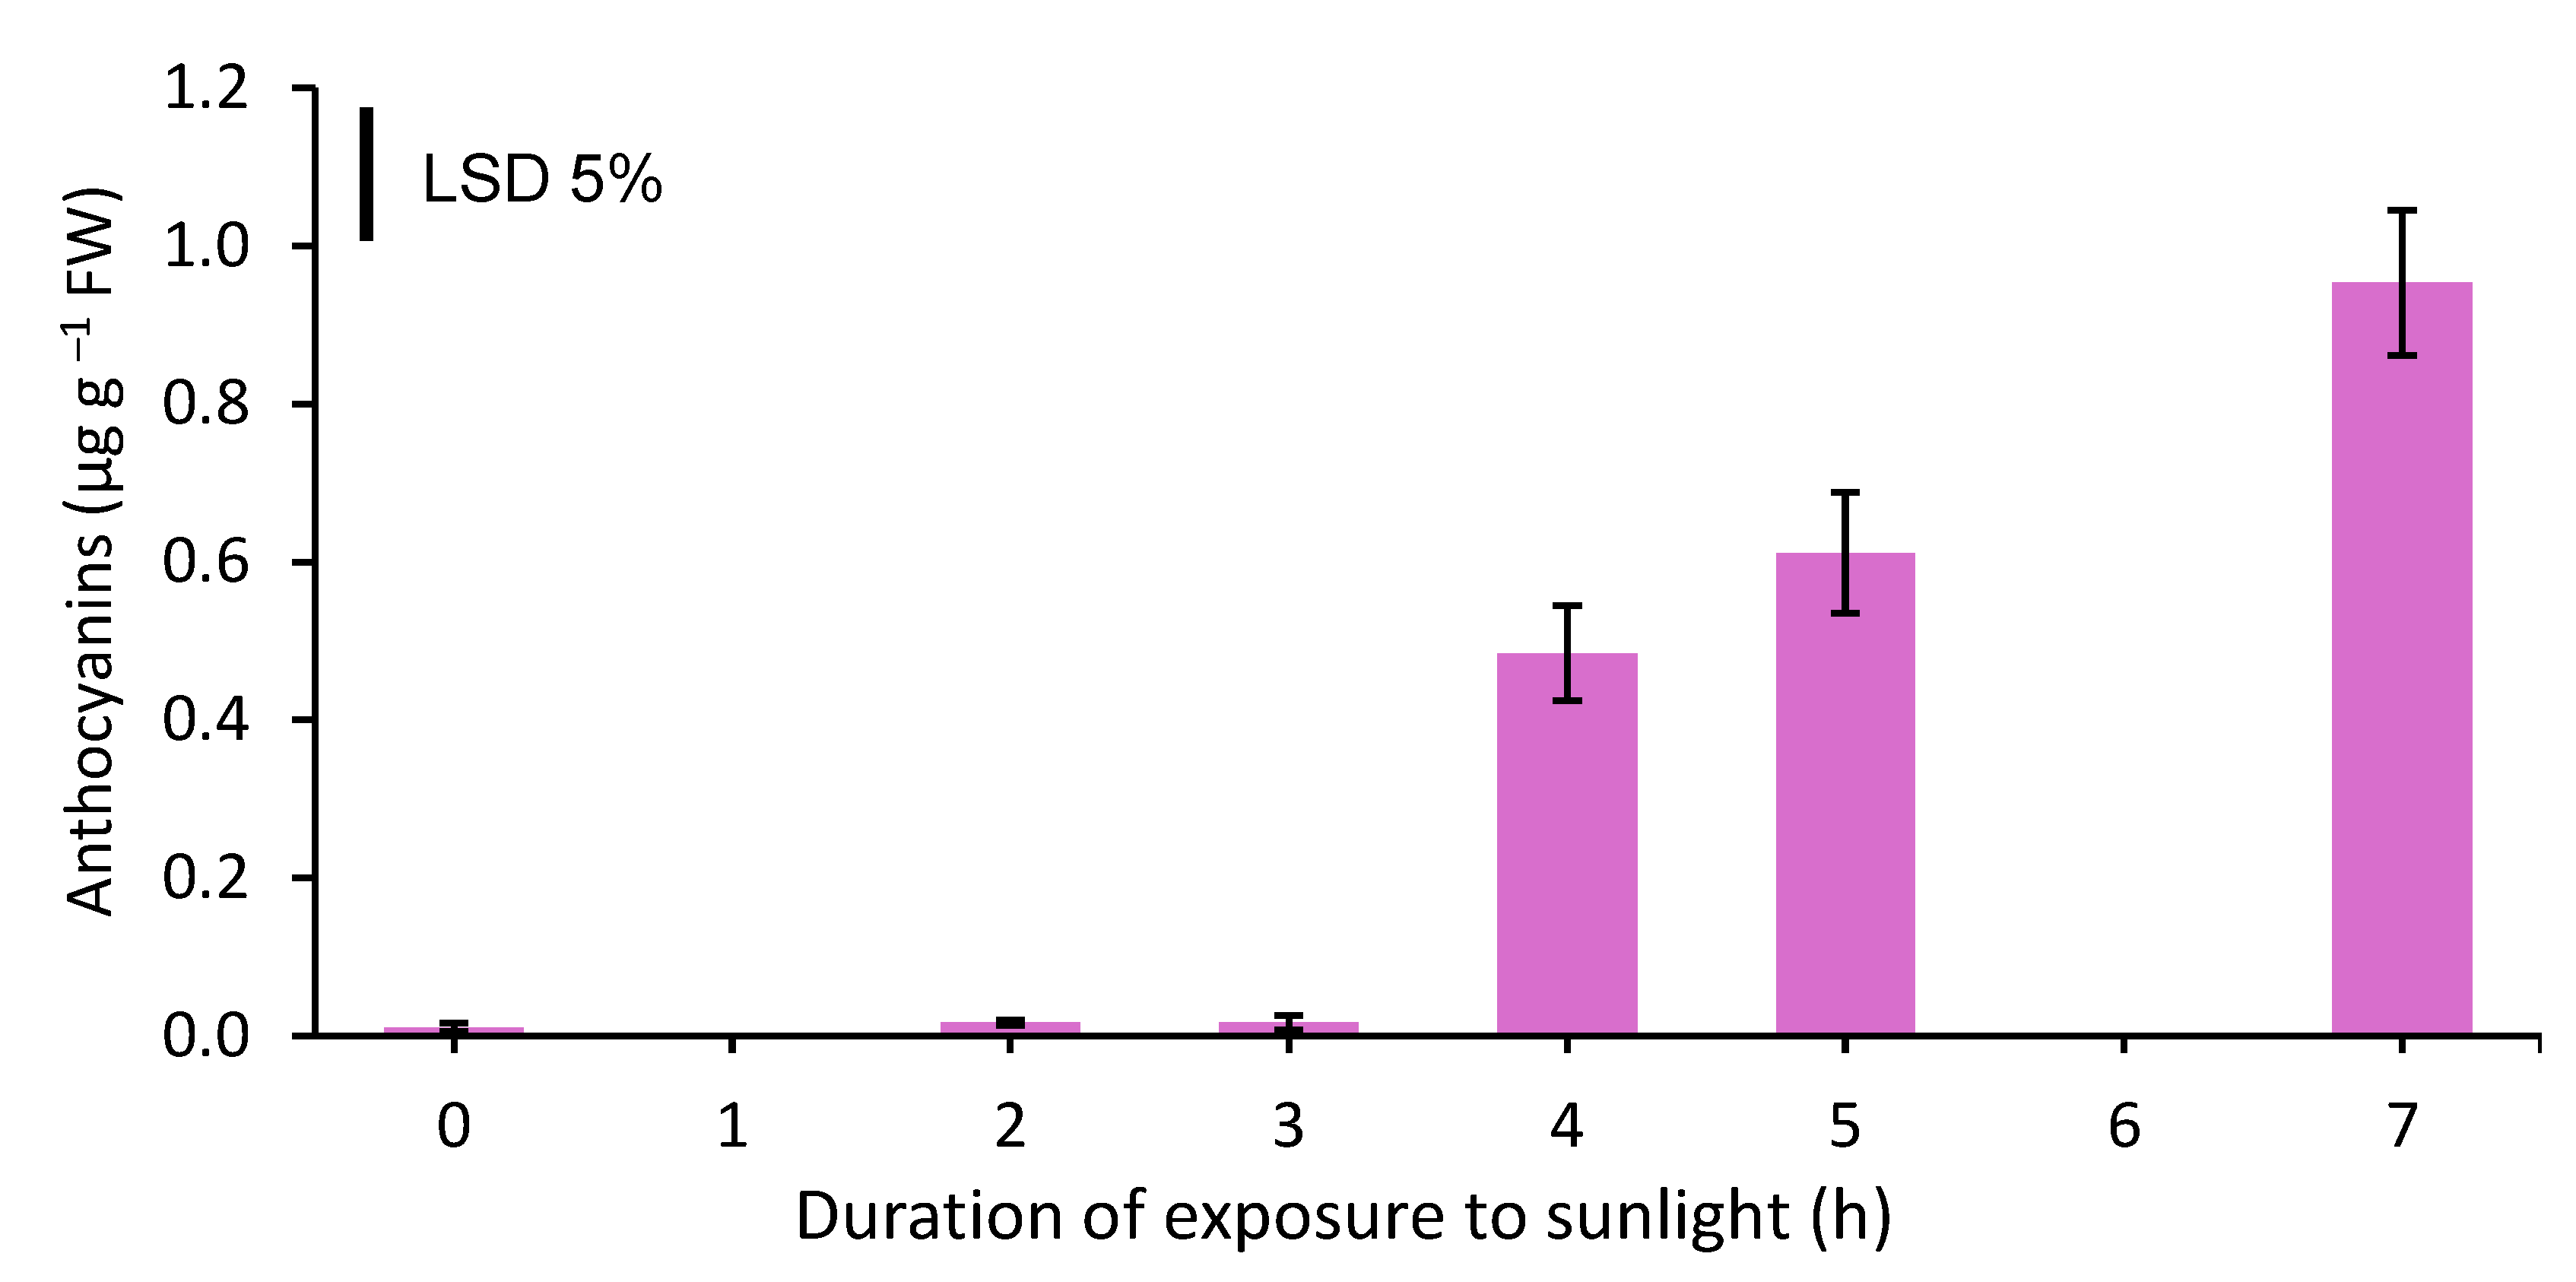
Figure 3.
Temperature (oC) and radiation (W m−2) during the exposure of the white asparagus spears to sunlight for 0, 2, 3, 4, 5 or 7 h.
Figure 3.
Temperature (oC) and radiation (W m−2) during the exposure of the white asparagus spears to sunlight for 0, 2, 3, 4, 5 or 7 h.
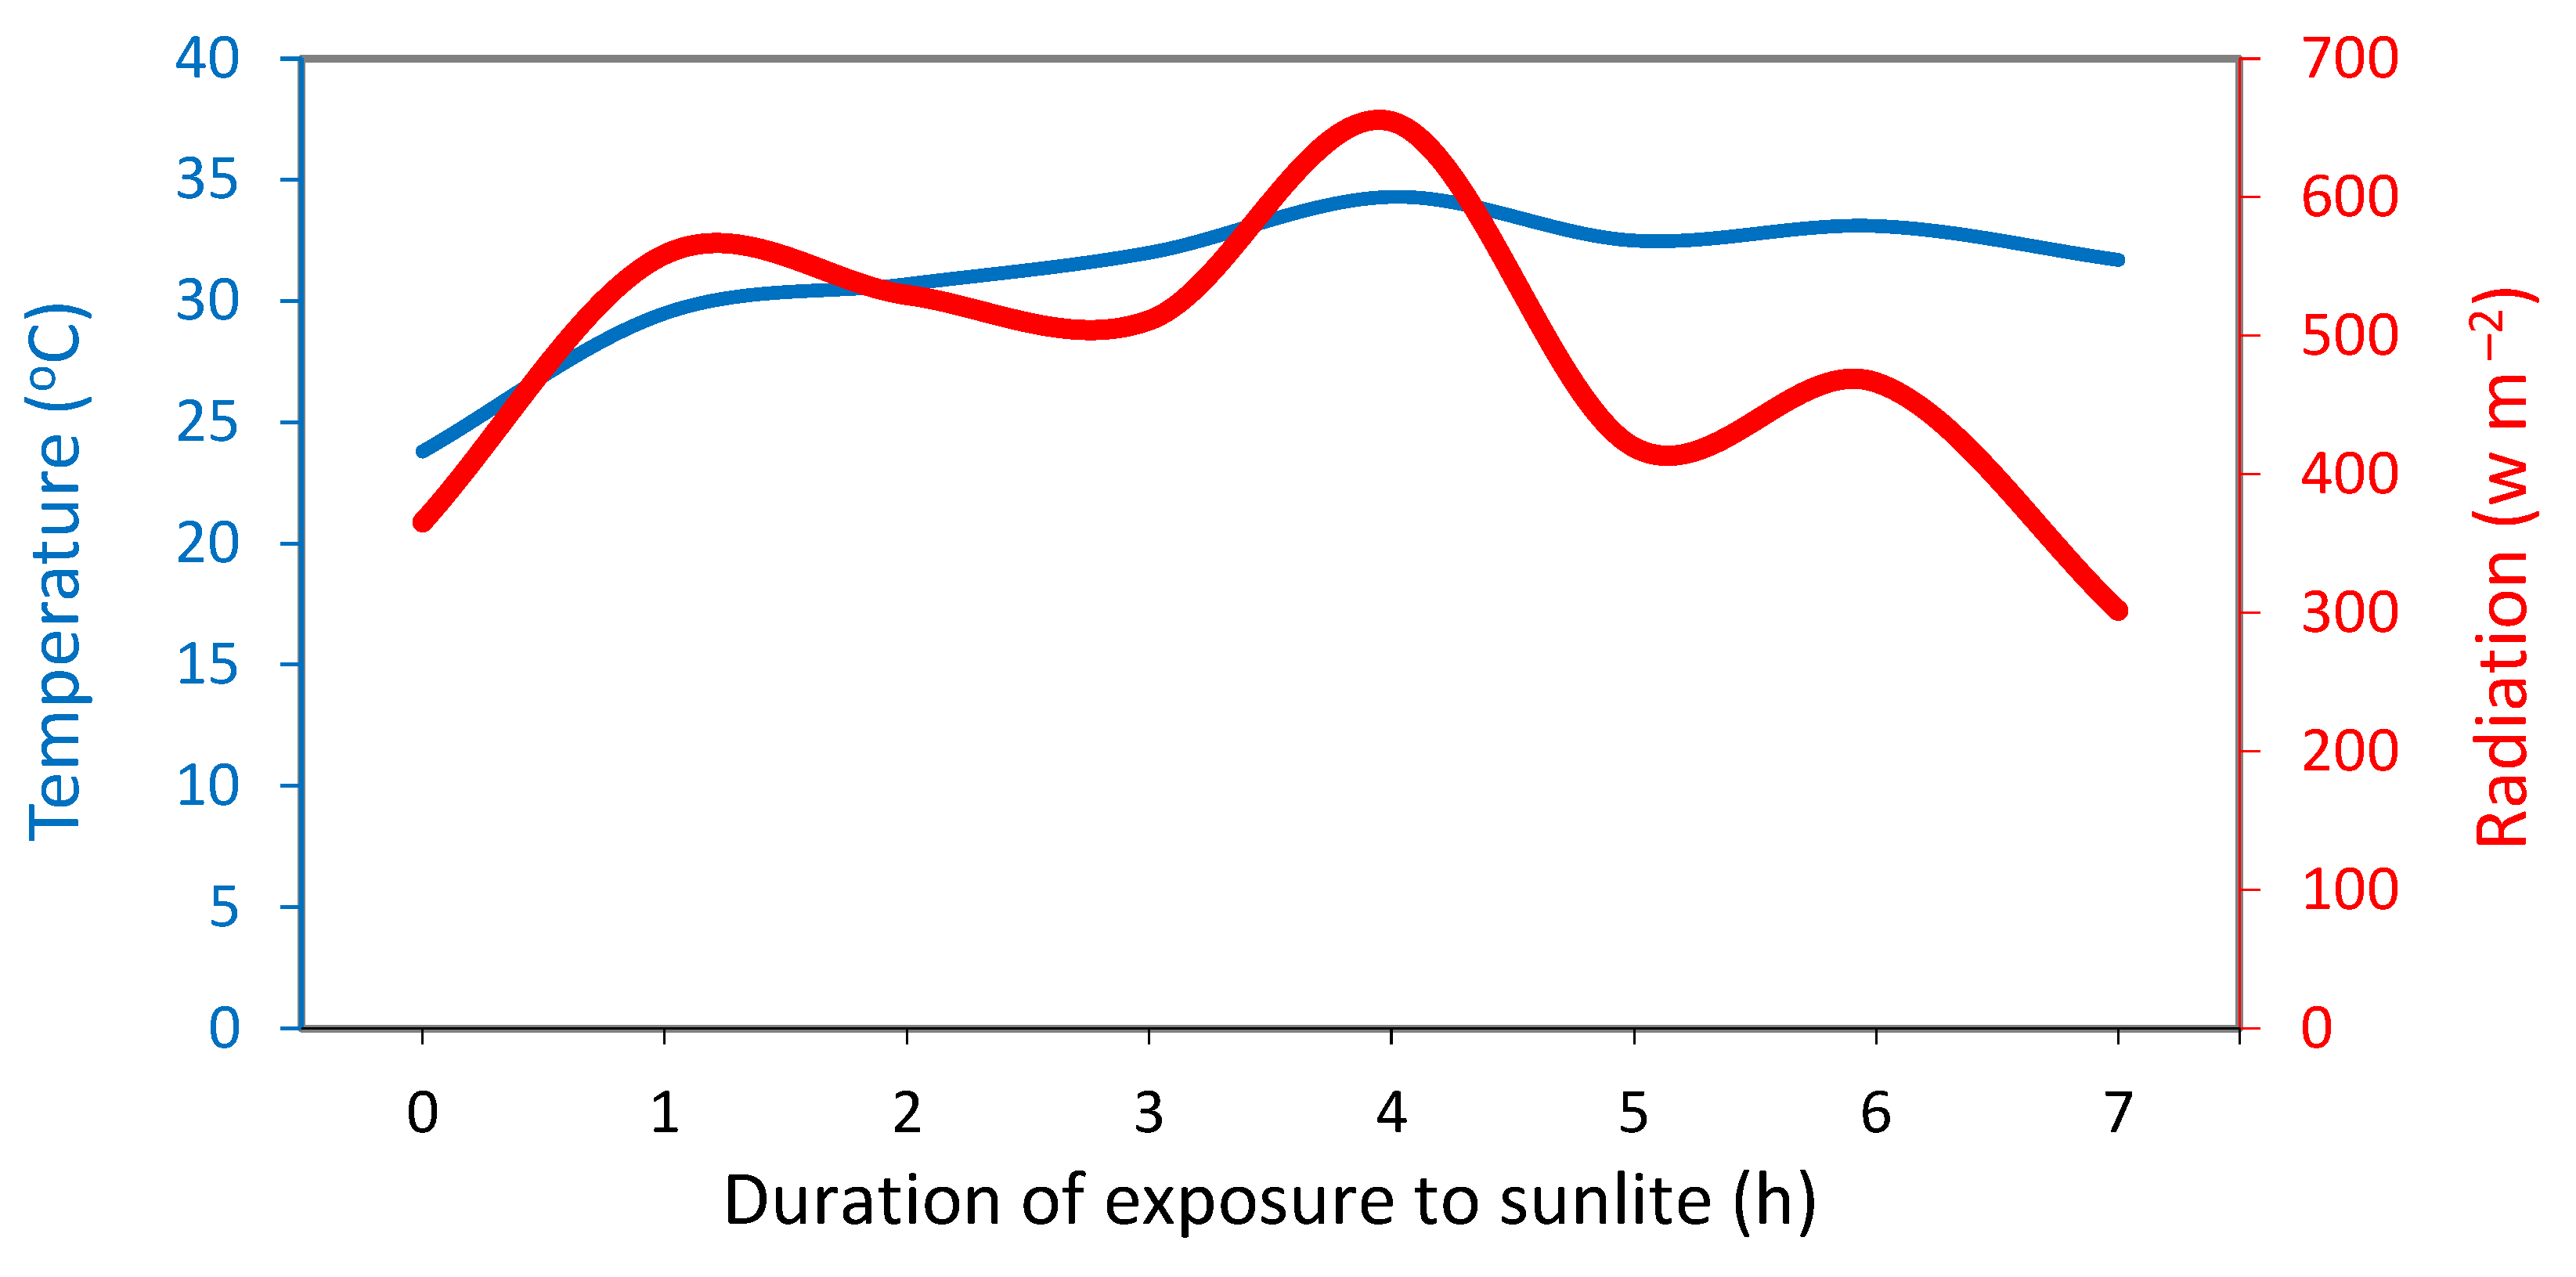
Figure 4.
Anthocyanin content (μg g−1 FW) in the top 7 cm of white asparagus spears that were grown for 7 days in darkness, then exposed for 0, 2, 3, 4, 5 or 7 h to sunlight and harvested and kept in dark conditions (A) or continued to grow in darkness (B) for 0, 24 or 48 h. Each data point is the mean of three replicates ±SE and the vertical bars in the graphs represent the 5% LSD value.
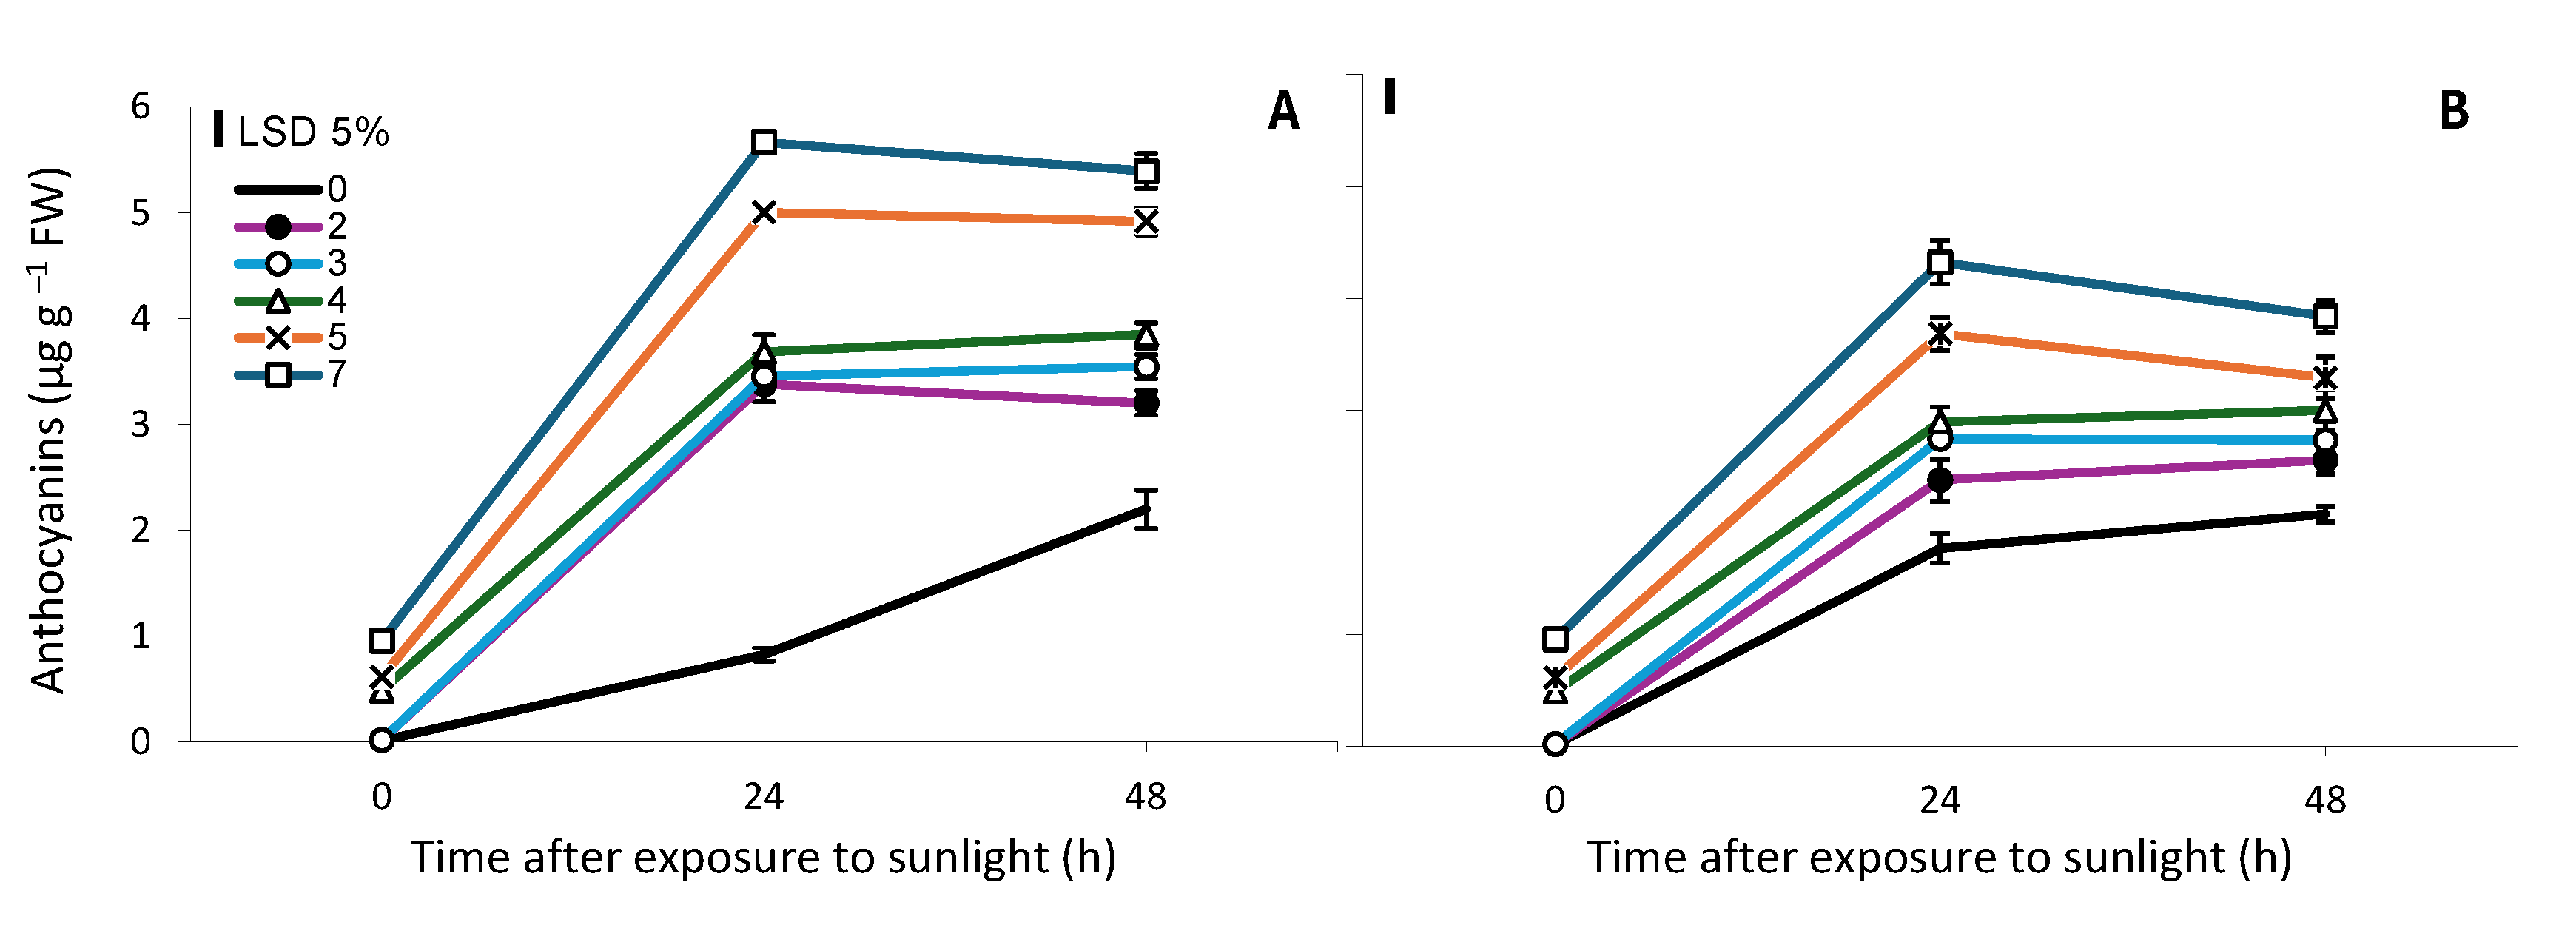
Figure 5.
The color parameter L*, C*, hο and a* of the spear tips after the exposure of the white asparagus spears to sunlight for 0, 2, 3, 4, 5 or 7 h. Each column represents the mean of three replicates ±SE and the vertical bars in the graphs represent the 5% LSD value.
Figure 5.
The color parameter L*, C*, hο and a* of the spear tips after the exposure of the white asparagus spears to sunlight for 0, 2, 3, 4, 5 or 7 h. Each column represents the mean of three replicates ±SE and the vertical bars in the graphs represent the 5% LSD value.
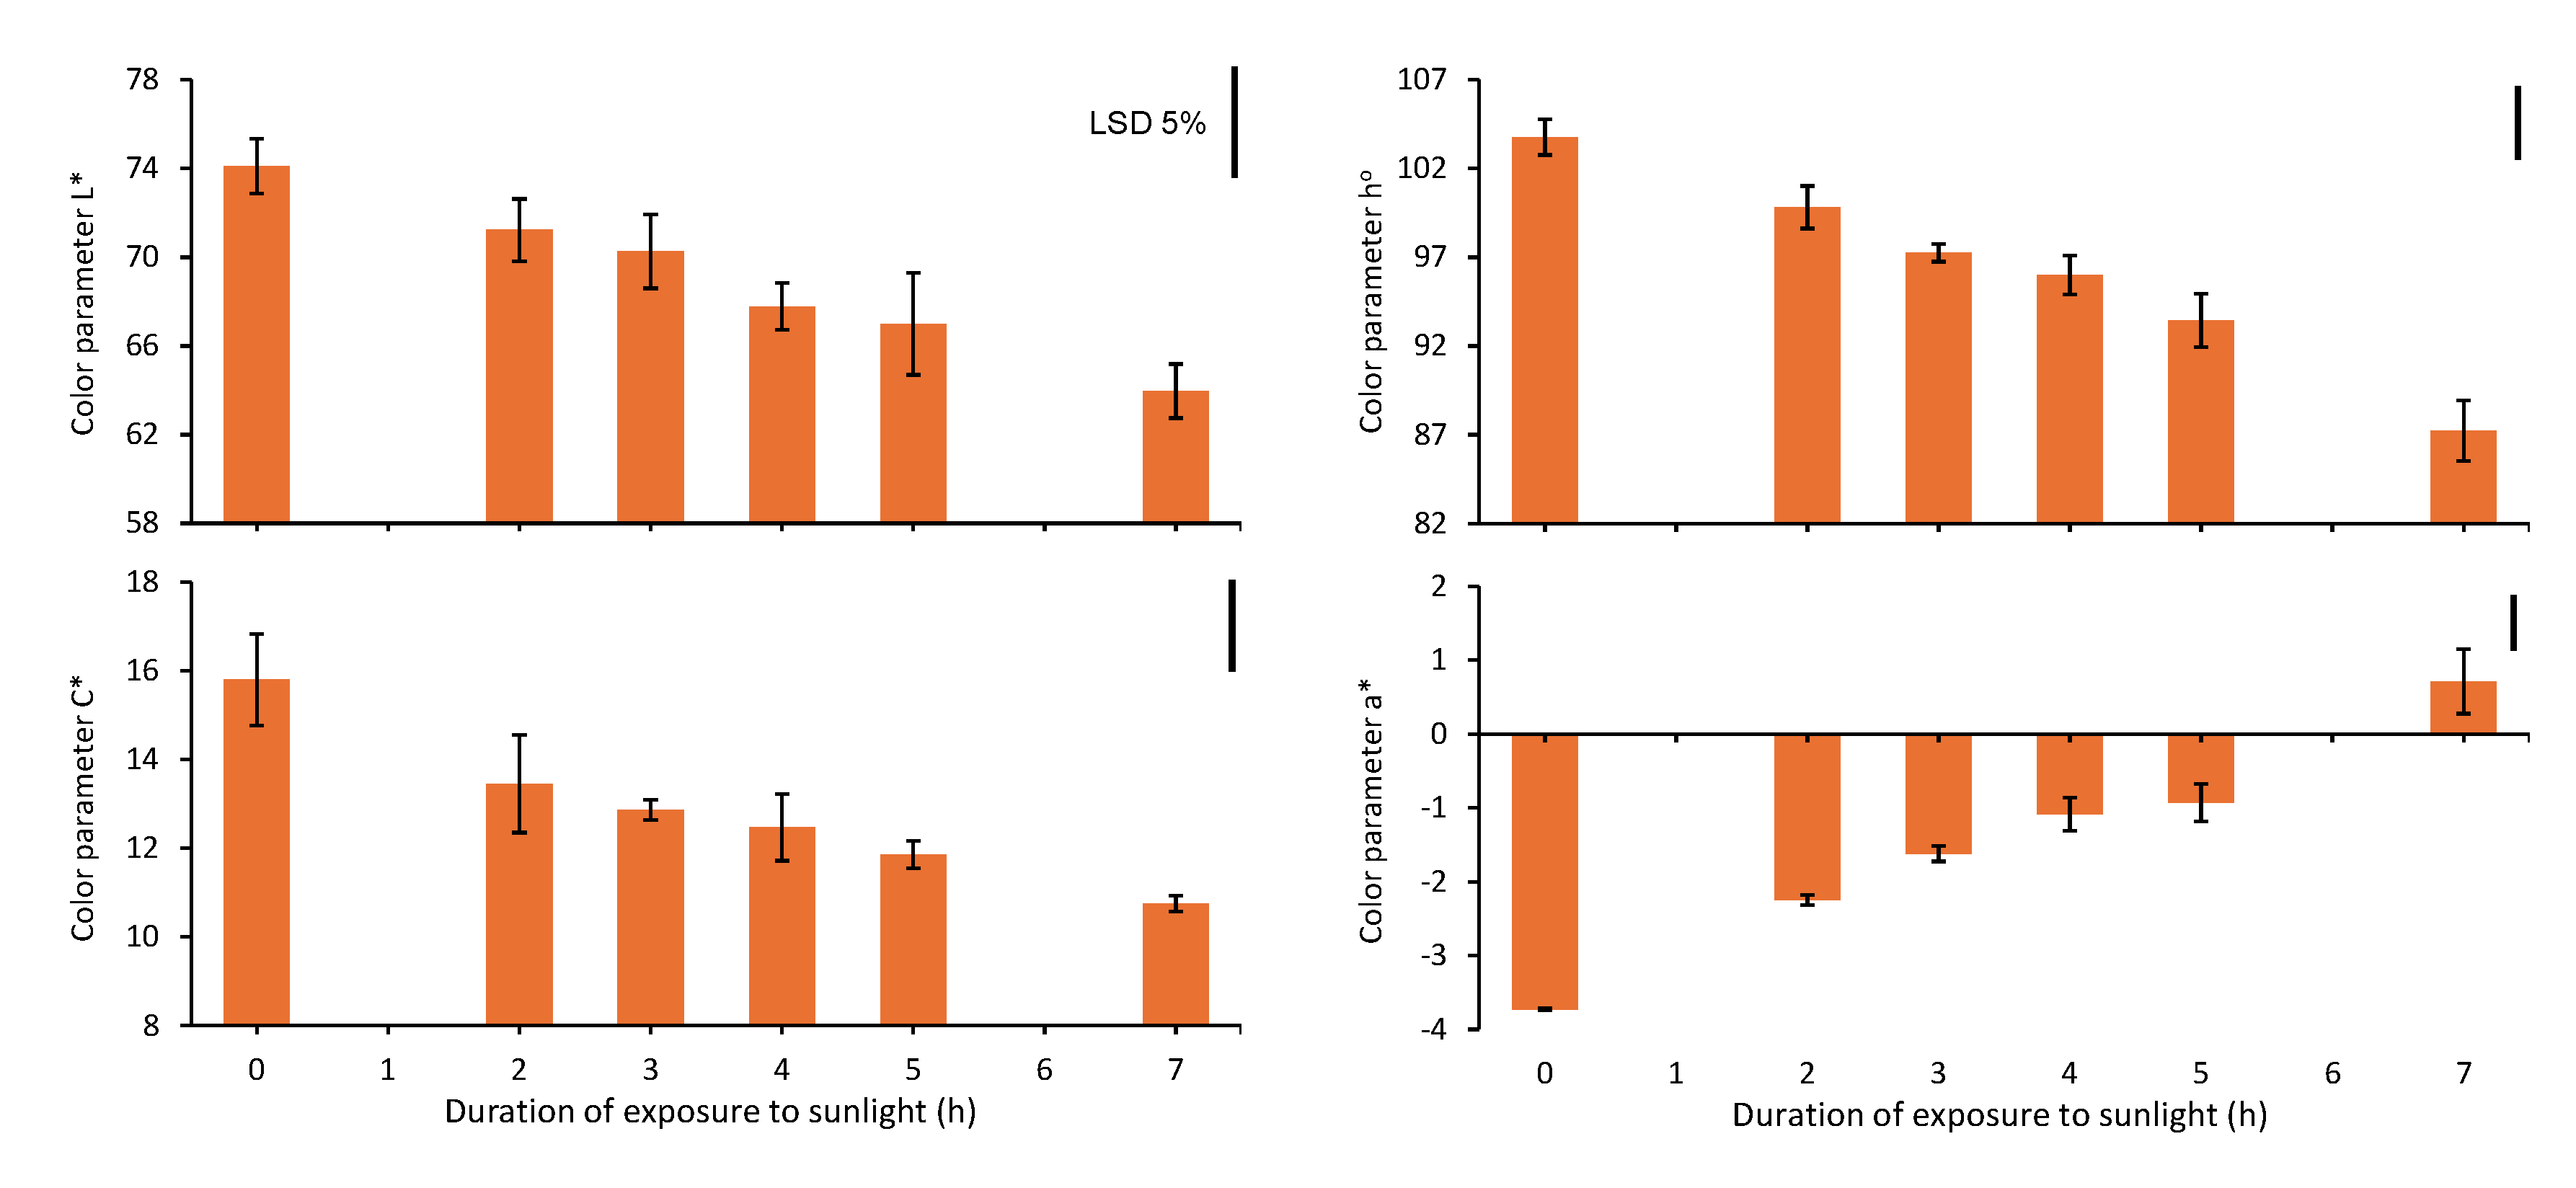
Figure 6.
Total phenol content (mg gallic acid equivalent (GAE) g−1 FW) in the top 7 cm of white asparagus spears grown for 7 days in darkness and then exposed to sunlight for 0, 2, 3, 4, 5 or 7 h. Each column represents the mean of three replicates ±SE and the vertical bar in the graph represents the 5% LSD value.
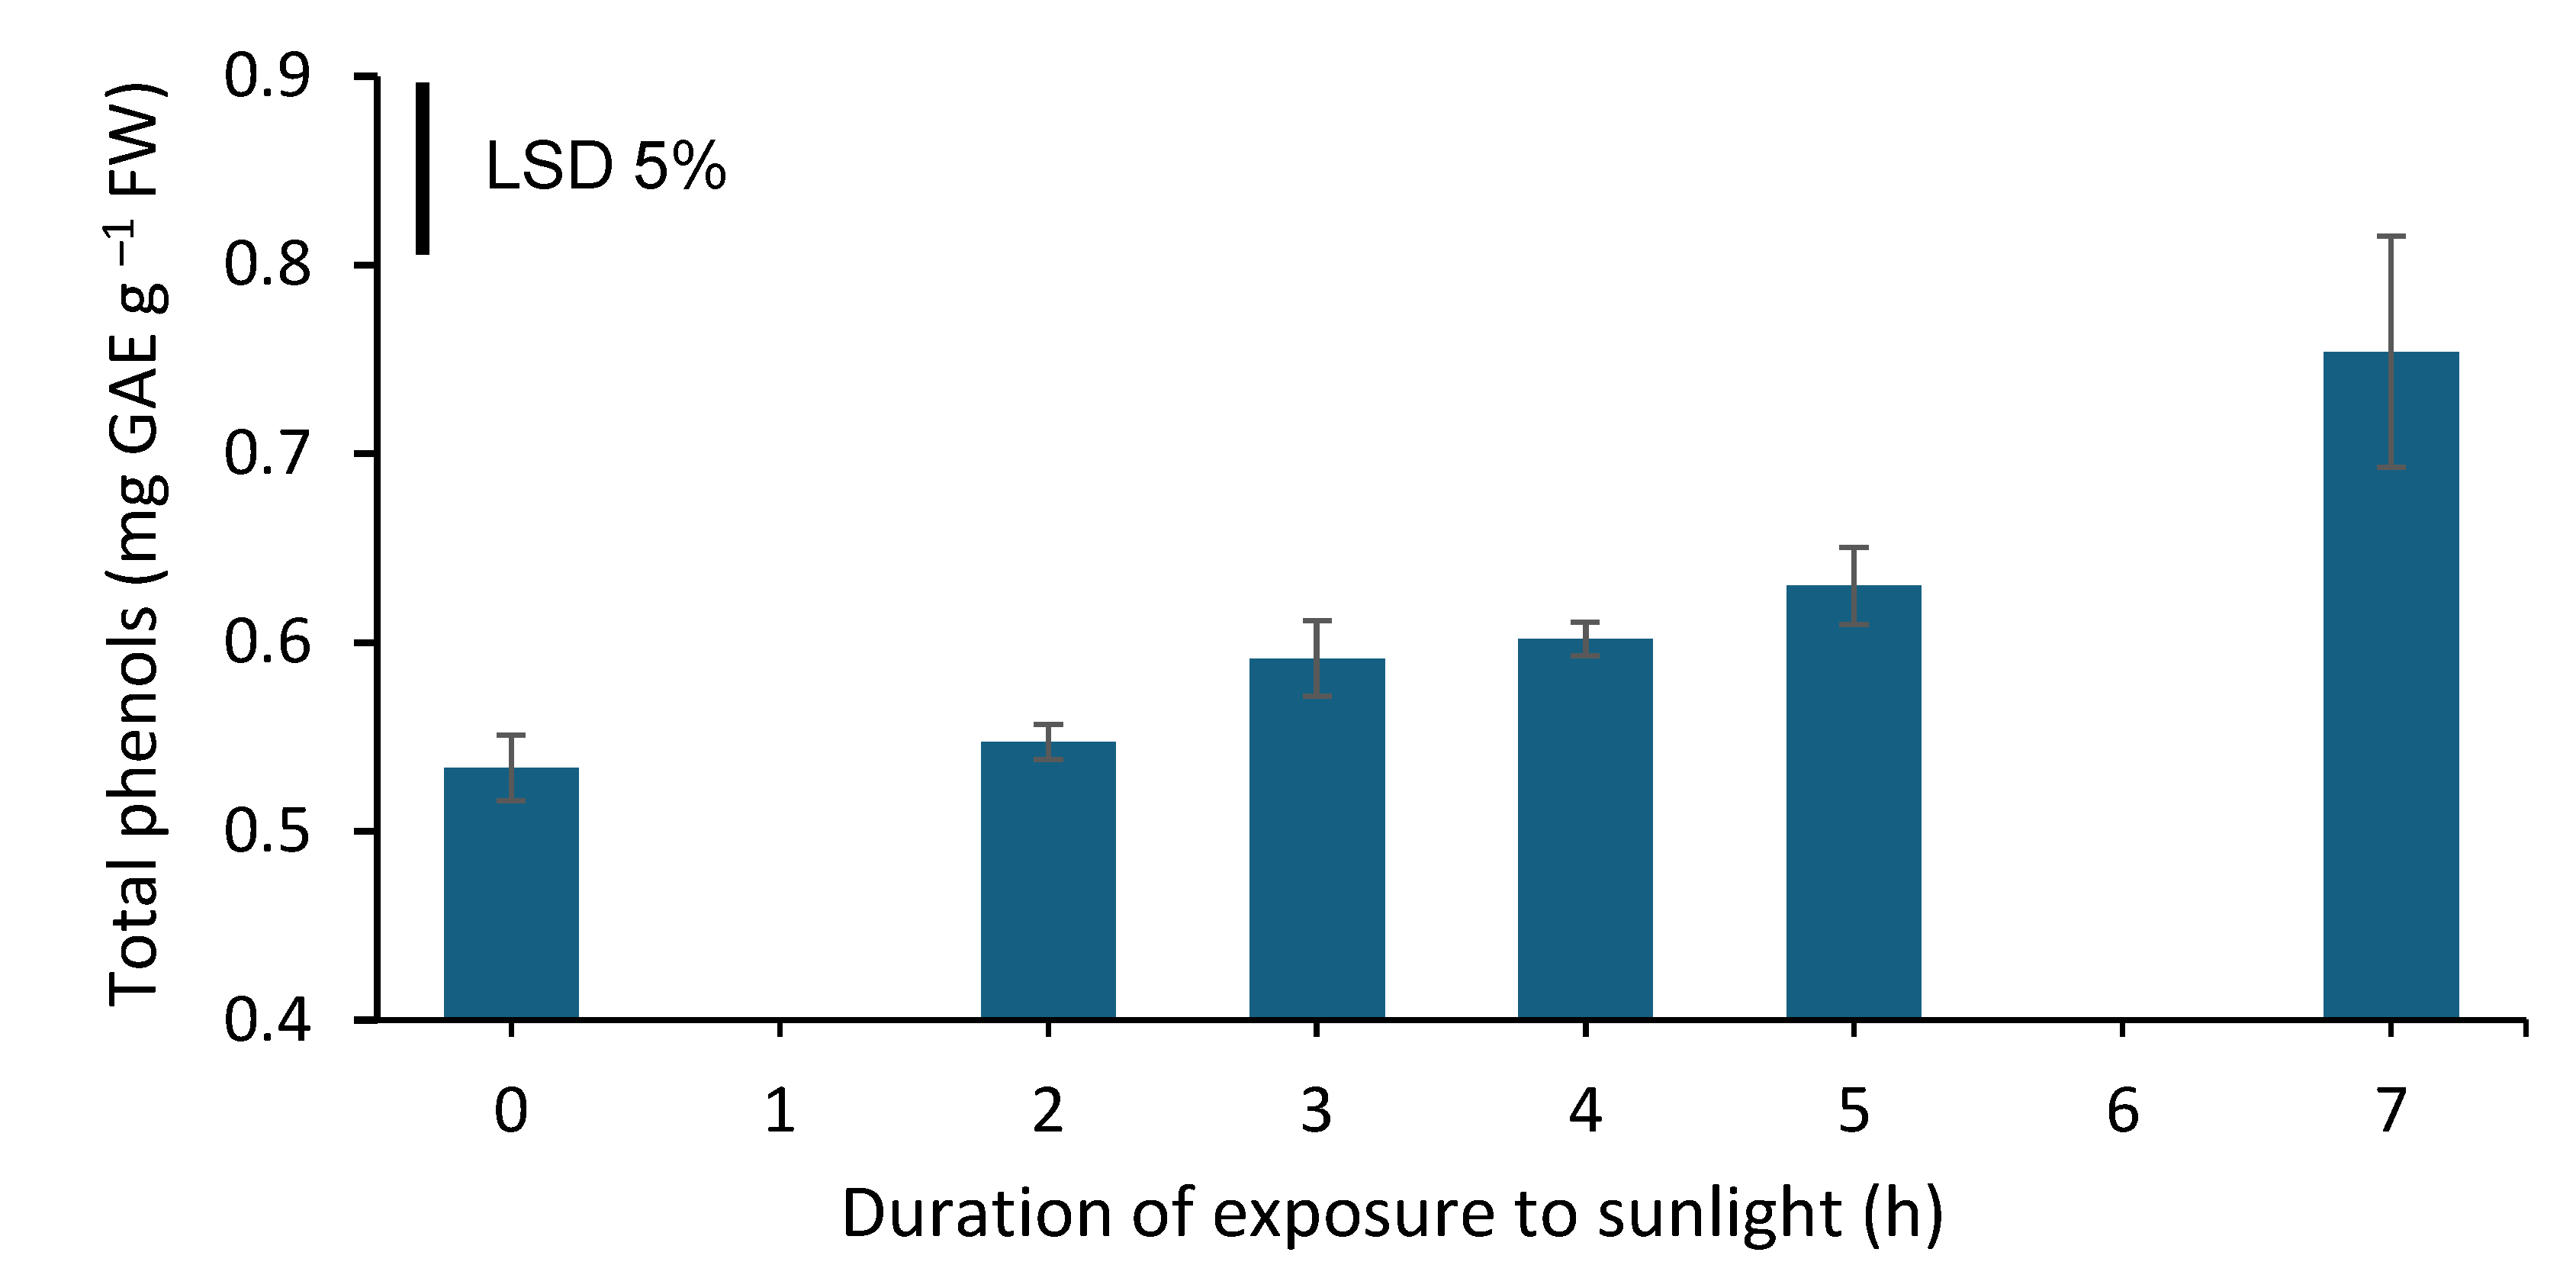
Figure 7.
Total phenol content (mg gallic acid equivalent (GAE) g−1 FW) in the top 7 cm of white asparagus spears that were grown for 7 days in darkness, then exposed to sunlight for 0, 2, 3, 4, 5 or 7 h and harvested and maintained in dark conditions (A) or continued to grow in darkness (B) for 0, 24 or 48 h. Each data point is the mean of three replicates ±SE and the vertical bars in the graphs represent the 5% LSD value.
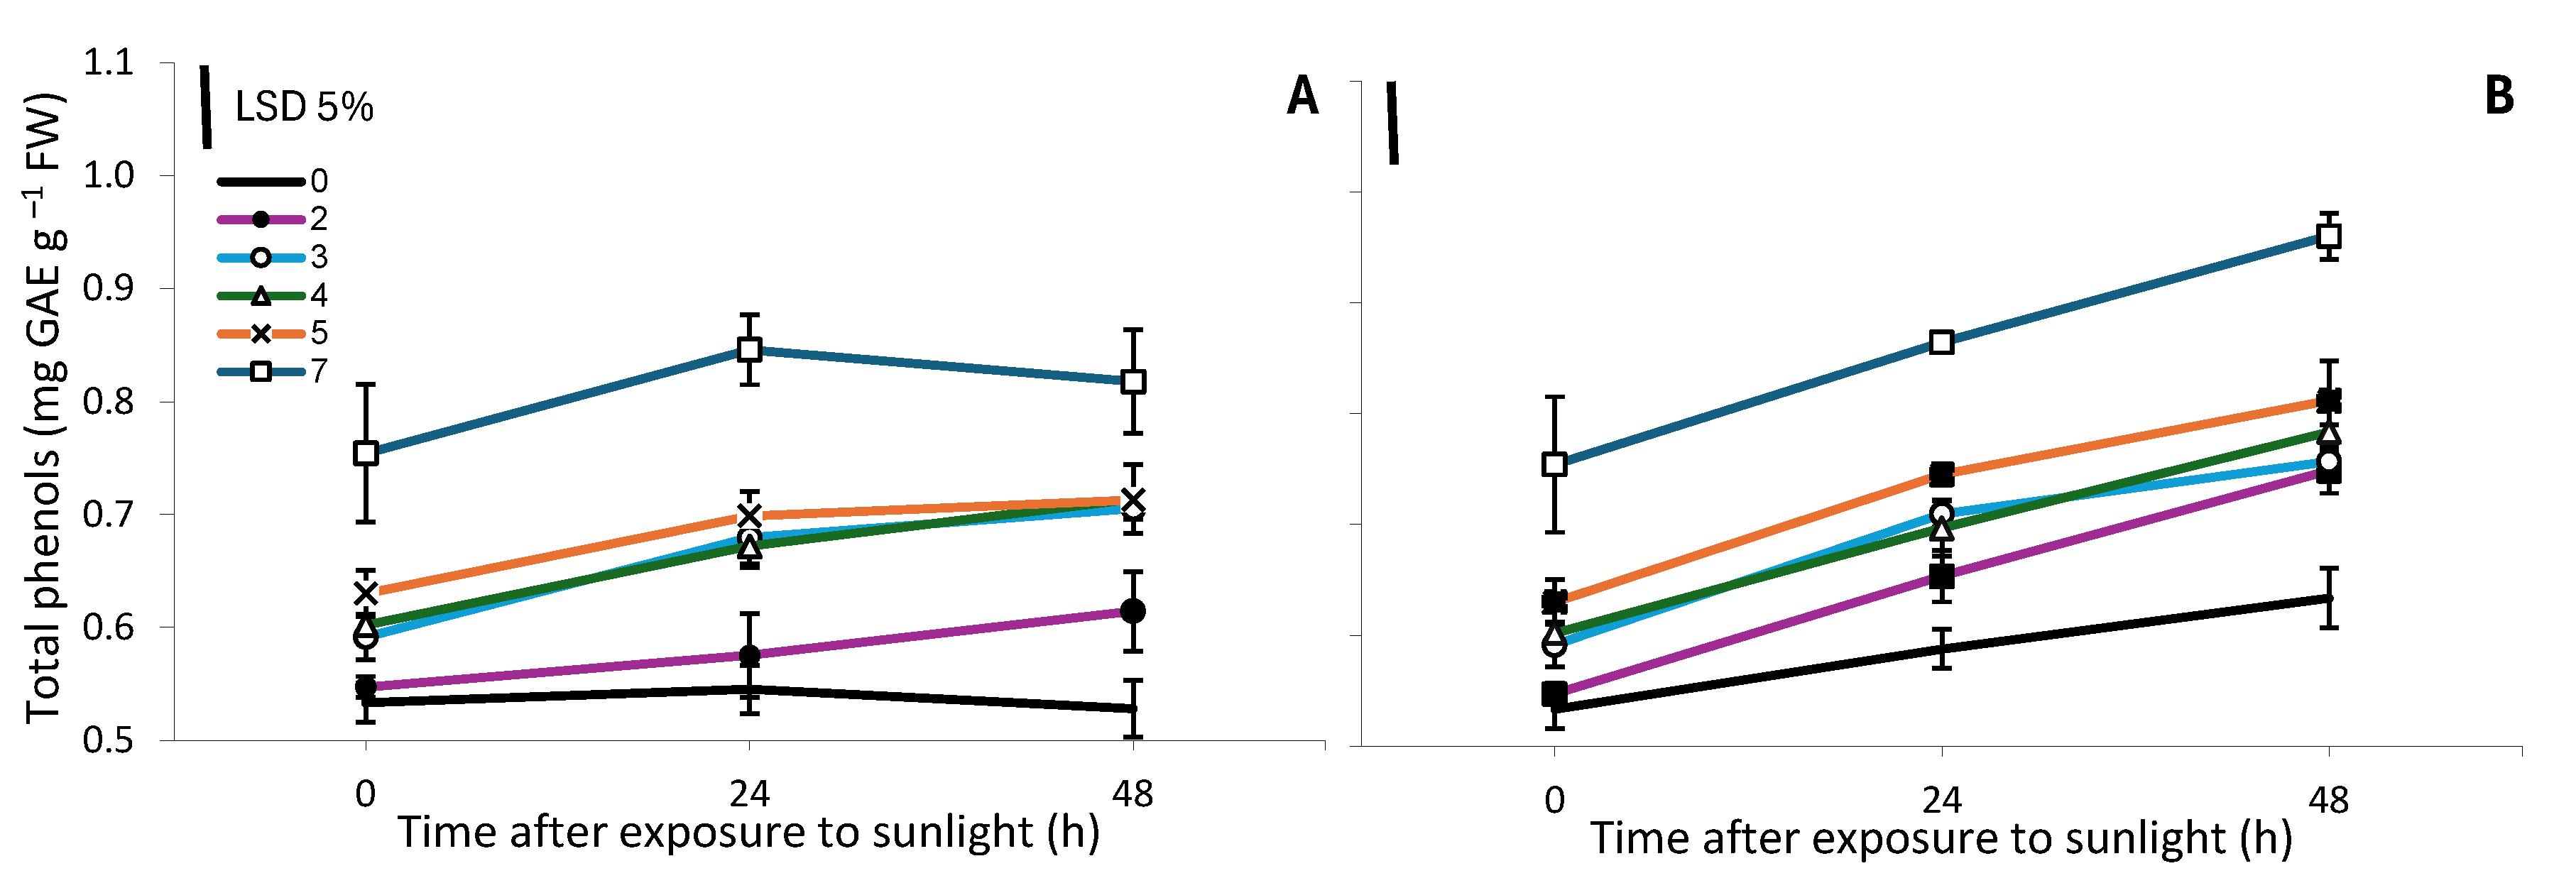

Table 1.
Analysis of variance (ANOVA) for anthocyanin and total phenol content of the 7 cm apical segments of the white asparagus spears that were grown in darkness under a low tunnel for 7 days and then exposed to sunlight for 0, 2, 3, 4, 5 or 7 h. Subsequently, the spears were either harvested and kept in dark conditions (Out of the plant) or continued to grow in the dark (On the plant) for 0, 24 or 48 h (Lag phase).
| Anthocyanins | Total phenols | ||||||
| Source of variance | DF | MS | P | η2 | MS | P | η2 |
| Duration of exposure to light (A) | 5 | 12.678 | *** | 20.0 | 0.153 | *** | 40.2 |
| Growing after exposure on or out of the plant (B) | 1 | 8.093 | *** | 2.6 | 0.059 | *** | 15.6 |
| Duration of lag phase (C) | 2 | 108.065 | *** | 68.3 | 0.139 | *** | 36.5 |
| AxB | 5 | 0.935 | *** | 1.5 | 0.001 | 0.3 | |
| AxC | 10 | 1.399 | *** | 4.4 | 0.002 | 0.7 | |
| BxC | 2 | 2.144 | *** | 1.4 | 0.023 | *** | 6.0 |
| AxBxC | 10 | 0.316 | *** | 1.0 | 0.001 | 0.2 | |
| Error | 72 | 0.039 | 0.002 | ||||
DF, degrees of freedom; MS, mean square; P, probability; η2, eta squared effect size index; *** significance at P < 0.001.
Disclaimer/Publisher’s Note: The statements, opinions and data contained in all publications are solely those of the individual author(s) and contributor(s) and not of MDPI and/or the editor(s). MDPI and/or the editor(s) disclaim responsibility for any injury to people or property resulting from any ideas, methods, instructions or products referred to in the content. |
© 2025 by the authors. Licensee MDPI, Basel, Switzerland. This article is an open access article distributed under the terms and conditions of the Creative Commons Attribution (CC BY) license (http://creativecommons.org/licenses/by/4.0/).
Copyright: This open access article is published under a Creative Commons CC BY 4.0 license, which permit the free download, distribution, and reuse, provided that the author and preprint are cited in any reuse.


