
Submitted:
06 November 2024
Posted:
11 November 2024
You are already at the latest version
Abstract
Indoor controlled-environment plant production allows precise control over factors such as lighting, photoperiod, temperature, nutrient and water supply to enhance crop yield and quality. However, maintaining stable conditions that exclude environmental stressors can weaken plants' defence mechanisms, including the accumulation of protective phytochemicals, which are important components of the human diet. Our previous research demonstrated that even short-term supplementation with ultraviolet (UV) light to the growth spectrum can effectively stimulate the synthesis of secondary metabolites (SM) and boost the overall antioxidant capacity in lettuce. To assess whether this approach is also effective for other species, the present study investigates the efficacy of short-term, pre-harvest supplementation of red-green-blue (RGB, LED) light with ultraviolet B (UV-B, 311 nm) or ultraviolet C (UV-C, 254 nm) light in enhancing phytochemical synthesis in two basil cultivars. Additionally, considering the potential biological risks associated with high-energy UV radiation, we monitored the condition of the photosynthetic apparatus (PA) throughout the treatment. Our study demonstrated that UV-B radiation, administered at a cumulative dose of 15.622 kJ m–2, had no detrimental effect on the photosynthetic apparatus (PA), while it significantly enhanced the overall antioxidant capacity of green-leaf basil by increasing the levels of polyphenolic secondary metabolites, including total flavonoids, anthocyanins, as well as the ascorbic acid. However, in dark-pigmented basil, UV-B exposure resulted in a reduction of secondary metabolite levels. In contrast, UV-C radiation, applied at a lower cumulative dose of 6.008 kJ m–2, stimulated the accumulation of phenolic compounds in the green-leaf cultivar but notably impaired the photosynthetic apparatus, restricted plant growth and decreased score on consumers’ sensory tests. These findings are critical for advancing UV light supplementation to produce functionally enhanced plants.
Keywords:
basil
; indoor farming
; spectrum supplementation
; ultraviolet light
; antioxidant potential
; functional foods
; nutritional quality
; phytochemicals
; sensory properties
1. Introduction
Traditional open-field farming faces numerous challenges today, including climate change, land degradation, and decreasing availability of arable land and freshwater [1]. These factors complicate the production of high-quality food for a rising global population. As a result, there is growing interest in controlled-environment agriculture, such as vertical farms and indoor-growing modules [2]. Indoor farming (IF) involves cultivating plants inside buildings, often without soil, using nutrient solutions, controlled temperature and humidity, and artificial lighting (AL). This method offers several advantages, including biosecurity, pest and drought mitigation, and year-round crop production while reducing transportation costs associated with conventional farming [1,3].
Moreover, in most cases, AL systems with non-saturating light intensity are sufficient for indoor plant production, with light quality being more critical than quantity [4]. This is especially true for LED-based systems, which can reduce energy consumption and minimize the carbon footprint of IF systems [5]. On the other hand, plants grown in open fields are naturally exposed to the full sunlight spectrum, including harmful UV radiation [6] and consequently evolved various defence mechanisms, such as the synthesis of secondary metabolites (SM) [7] and other antioxidants [8]. These metabolites accumulate primarily in the epidermal layers and act as natural sunscreens, protecting the underlying tissues [9].
The UV spectrum (100–400 nm) is divided into three sub-regions: UV-A (315–400 nm), UV-B (280–315 nm), and UV-C (100–280 nm) [10]. Plant responses to UV light involve specific photoreceptors, such as cryptochromes (CRYs), which respond to blue light and UV-A, and UV Resistance Locus 8 (UVR8), which responds to UV-B [11]. The mechanisms underlying plant responses to UV-C are still being studied but are often linked to the generation of reactive oxygen species (ROS), which affect the redox balance in cells [12]. The primary regulator of plant responses to UV exposure is the transcription factor HY5 (elongated hypocotyl 5), which accumulates in response to UV light and promotes the synthesis of SMs, particularly phenolic compounds [12,13,14,15]. Additionally, UV radiation enhances the expression and activity of enzymes involved in ascorbic acid (AsA) recycling [8].
Because of these effects, UV treatment is considered a powerful tool for biofortifying crops with functional phytochemicals and improving the antioxidant capacity of leafy vegetables [16,17]. Among these phytochemicals, polyphenols are known for their anti-mutagenic and anti-carcinogenic properties [18], as natural antioxidants and ROS scavengers. The main classes of polyphenolic compounds in plants include flavonoids, phenolic acids, lignans, and stilbenes [19]. Flavonoids, the most abundant polyphenols in food, are further classified into chalcones, flavanones, flavonols, flavones, isoflavones, proanthocyanidins, and anthocyanins, which are glycosylated anthocyanidins [14].
Our previous studies demonstrated that UV-A exposure increased total phenolics (TPC) and flavonoid content (TFC) in lettuce and basil, especially in green-leaf cultivars [20]. UV-B exposure proved to be an efficient method for biofortifying lettuce with TPC, TFC, anthocyanins (ANT), carotenoids, and ascorbic acid (AsA) [21]. In this study, we aimed to evaluate the effectiveness of short-term supplementation of the artificial red-green-blue (RGB) LED spectrum with UV-B (311 nm) and UV-C (254 nm) light, in enhancing the antioxidant potential of basil (Ocimum basilicum L.) microgreens. We analyzed two cultivars, Sweet Large (green leaves) and Dark Opal (purple leaves), grown in controlled-environment chambers under the RGB spectrum with daily-increased doses of UV light applied shortly before harvest. The effects of UV exposure were assessed by monitoring photosynthetic activity using chlorophyll a fluorescence, as well as measuring photosynthetic pigments, protein levels, and lipid peroxidation rates. Our findings revealed that UV-B exposure significantly increased TFC, ANT and AsA levels in green-leaf basil, while also enhancing AsA content in the dark-leaf cultivar, without negatively affecting photosynthetic activity or plant morphology, when applied at a cumulative dose (CD) of 15.622 kJ m–2. In contrast, despite the shorter exposure to UV-C radiation (CD of 6.008 kJ m–2), its application markedly reduced photochemical efficiency and controlled energy quenching in the green-leaf (SL) basil. UV-C-treated plants also presented growth retardation and a decreased score on consumers’ sensory tests. Moreover, UV-C treatment was significantly less effective at promoting secondary metabolite (SM) and AsA accumulation in the SL cultivar compared to UV-B exposure, yet it was more effective at enhancing TFC and ANT, as well as the total antioxidant capacity (TAC) in the DO cultivar. This study offers important insights into the potential of UV-B and UV-C supplementation in standard RGB lighting systems, which typically lack UV components, to improve the quality of leafy plant products.
2. Results
2.1. Antioxidant Capacity in Response to Supplemental UV-B or UV-C Light
2.1.1. Total Phenolic Content
The estimated total phenolic content (TPC) is expressed as µg of gallic acid equivalents per mg of fresh weight (FW) (Figure 1). The analysis revealed that green-leaf basil contained 14% less phenolic content under the control RGB spectrum (Figure 1a) than purple-leaf basil (Figure 1b). In addition, short-term exposure to supplemental UV-B did not affect TPC levels in the Sweet Large (SL) cultivar and induced a 4% decrease in TPC in the Dark Opal (DO) cultivar. In contrast, UV-C treatment stimulated TPC accumulation in the SL by approximately 9% and decreased its level by 6% in the DO cultivar.
2.1.2. Total Flavonoid Content
The total flavonoid content (TFC) is expressed as µg of rutin equivalents per mg of FW (Figure 2). Results show that the DO cultivar is characterized by significantly higher flavonoid content than SL, as under the control RGB spectrum, TFC was at least 2.8 times higher in the DO than in the SL cultivar. Additionally, UV-B light supplementation led to a nearly 3.5-fold increase in TFC in SL (Figure 2a), while in the DO cultivar, TFC decreased by 30% after UV-B treatment (Figure 2b). UV-C exposure negatively impacted TFC in the SL cultivar, reducing it by 16% compared to the RGB group (Figure 2a). However, no significant changes were observed in the DO cultivar following UV-C exposure (Figure 2b).
2.1.3. Anthocyanin Level
Anthocyanins (ANT), a subclass of flavonoids, are prominent compounds naturally occurring as glycosides in pigmented plant organs. As expected, the purple-leaf DO basil exhibited more than 60 times higher ANT levels under the control spectrum compared to the green-leaf SL cultivar (Figure 3). UV-B supplementation increased the ANT pool in the SL cultivar by 15% (Figure 3a), still however ANT level was significantly lower than that noted for DO cultivar. Similarly to the TPC and TFC, the ANT in DO also decreased after UV-B exposure (Figure 3b) by 13%. In the case of UV-C treatment, it enhanced ANT accumulation by 23% in SL, but had no impact on ANT level in the DO cultivar.
2.1.4. Ascorbic Acid Pool
In addition to polyphenolic secondary metabolites, we also analyzed the ascorbic acid (AsA) pool. Results included both the reduced AsA form and the total AsA level after the reduction of the oxidized form (dehydroascorbic acid, DAsA) with dithiothreitol (DTT). Under the RGB spectrum, most of the AsA in SL basil was present in its reduced form, except in plants exposed to UV-B and UV-C (Figure 4a). Moreover, in the SL cultivar the UV-B and UV-C supplementation increased the total AsA pool (AsA + DAsA) by 2.6 and 1.4 times, respectively. For the DO cultivar, plants grown under RGB showed a total AsA pool more than 30 times higher than that of SL plants (Figure 4b). Interestingly, in contrast to SL, in DO cultivar neither UV-B nor UV-C treatment changed the total AsA to initial AsA ratio (Figure 4d). At the same time, however, UV-B light stimulated AsA level in DO cultivar by approximately 25%. Still, SL cultivar is more vulnerable to UV-B exposure than DO, as reported with increased initial and total AsA levels (Figure 4a) and enhanced AsA+DAsA/AsA ratio (Figure 4c). No changes in this ratio were observed in the DO cultivar (Figure 4d).
2.1.5. Overall Antioxidant Capacity
Total antioxidant capacity (TAC) was measured as µg of butylated hydroxytoluene (BHT) equivalents per mg of FW (Figure 5a, b), and the DPPH radical scavenging activity (Figure 5c, d), which was determined using the BHT calibration curve. Under the RGB spectrum, the green basil cultivar exhibited 6.5 times lower antioxidant capacity than the purple cultivar. UV-B exposure increased TAC in SL approximately 5 times (Figure 5a), with a corresponding 129% increase in radical scavenging activity (Figure 5c). Conversely, despite an increase in the AsA pool in DO following UV-B treatment, overall TAC dropped, likely due to lower TPC, TFC and ANT. The DPPH radical scavenging activity of 79% in DO remains, however, similar to the control level (Figure 5d). In the case of UV-C light exposure, no significant enhancement of TAC or scavenging activity in both cultivars was noted (Figure 5b, d).
Moreover, Pearson correlation analyses revealed that, in the case of green-leaf basil (Figure 6a), the identified TFC and AsA levels were significant contributors to TAC, whereas in the purple-leaf cultivar (Figure 6b), TAC was strongly correlated with TPC, TFC, and ANT. These findings demonstrate that the UV-B-induced synthesis of bioactive compounds in basil leaves is closely associated with improved antioxidant properties in the fresh leafy material. However, the mechanism through which UV-B improves TAC differs between green- and purple-leaf cultivars.
2.2. Photosynthetic Activity Under Short-Term Exposition to UV-B or UV-C Light
2.2.1. Effects of UV Light on Photosynthetic Pigments and Soluble Leaf Protein Content
Both basil cultivars exhibited similar chlorophyll a+b and carotenoid content under the RGB spectrum (Table 1 and Table 2). Short-term UV exposure resulted in a 38% and 43% reduction in chlorophyll a+b content in green and purple basil, respectively, after UV-B exposure. UV-C exposure, however, had no significant impact on chlorophyll a+b levels in either cultivar. DO plants exposed to UV-B showed a 51% decrease in carotenoids, which correlated with a 44% decrease in chlorophyll a and a 41% decrease in chlorophyll b (Table 2). In SL, UV-B caused reductions of 38% and 36% in chlorophyll a and b, respectively, along with a 30% decrease in carotenoids. The chlorophyll a/b ratio (Table 1 and Table 2) revealed no major shifts in the accessory pigments. UV-C exposure slightly increased carotenoid content in DO by 4% compared to the RGB group.
Soluble leaf protein (SLP) content was also analysed. In the SL cultivar, both UV-B and UV-C exposure increased SLP by 24% and 29%, respectively. Conversely, in DO, SLP levels decreased by 17% and 20% under UV-B and UV-C, respectively. Under RGB conditions, SLP was over 50% lower in SL compared to DO (Table 1 and Table 2).
2.2.2. Effects of UV Light on RuBisCO Abundance
The electrophoretic separation of SLP, followed by densitometric analysis of RuBisCO large (LSU) and small (SSU) subunits, revealed that UV light altered RuBisCO accumulation. In SL, UV-B reduced LSU by 6%, while SSU increased 2.5-fold. Under UV-C, LSU decreased by 25%, with SSU increasing slightly (Figure 7a, c). In contrast, UV-B exposure in DO increased LSU and SSU by 29% and 46%, respectively, while UV-C reduced LSU by 16% and SSU by 2% (Figure 7b, c).
2.2.3. Effects of UV Light on Photosynthetic Efficiency of PSII
To assess the impact of prolonged UV exposure, photosynthetic activity was monitored using chlorophyll a fluorescence kinetics. UV-B exposure did not significantly impact on the maximum quantum efficiency of photosystem II (Fv/Fm) in either cultivar (Figure 8a and Figure 9a). However, in SL, UV-B caused a temporary decrease in the effective quantum yield of PSII photochemistry (ΦPSII) by Day 3, followed by an increase in non-photochemical quenching (ΦNPQ) (Figure 8b, c). Both values returned to control levels by Day 4, indicating acclimation. In contrast, UV-C exposure negatively affected photosynthetic activity, with greater sensitivity observed in SL. While DO has acclimated after Day 3 (Figure 9), SL showed sustained reductions in photochemical efficiency and protective heat dissipation mechanisms (Figure 8e).
2.2.4. Effects of UV Light on Lipid Peroxidation
Lipid peroxidation, measured via TBARS assays, indicated increased oxidative stress in SL after UV-C exposure, with a 47% rise in TBARS levels (Figure 10a). Conversely, UV-B reduced TBARS formation by 28% in SL. In DO, both UV-B and UV-C reduced TBARS levels by 47% and 29%, respectively, relative to RGB controls (Figure 10b). Notably, DO showed 118 times higher TBARS levels under RGB compared to SL.
2.2.5. Effects of UV Light on Plant Morphology and Sensory Properties
The morphological impact of UV-C was evident in both cultivars, with growth inhibition and leaf damage, including necrotic lesions along leaf edges, observed in SL (Figure 11) and DO (Figure 12).
In addition, consumer sensory testing revealed that supplementing the RGB spectrum with UV-B light slightly decreased the perceived sweetness and increased the bitterness of SL basil leaves. The sweetness rating dropped from 2.9 (±0.74) to 2.6 (±0.7), while the bitterness rating rose from 3.4 (±0.7) to 3.9 (±0.57) (Figure 13a). For DO basil, the RGB control samples were perceived as less sweet and more bitter compared to SL (Figure 13b).
However, UV-B treatment had only a minimal impact on sweetness and bitterness scores for DO basil. Despite these modest changes, the overall assessment of UV-B-treated basil improved, with scores increasing from 3.7 to 4.2 for SL and from 3.4 to 3.7 for the DO cultivar. This improvement is likely attributed to enhanced appearance, crispness, or aftertaste. In contrast, UV-C exposure significantly lowered overall ratings by 38% for SL and 44% for DO, with the most pronounced decreases observed in the appearance category (Figure 13a, b).
3. Discussion
3.1. Efficiency of RGB Spectrum Supplementation With UV-B or UV-C Light on Antioxidant Capacity, Morphology and Sensory Properties of Basil Cultivars
The consumption of fruits and vegetables is closely linked to disease prevention due to the antioxidant activity of plant secondary metabolites [17]. However, the expansion of indoor farming, which uses strictly controlled growing conditions, may limit the accumulation of health-promoting compounds, as they typically form in response to abiotic stress. In this context, UV radiation is an underappreciated factor often missing from most horticultural lighting systems used in protected cultivation, such as indoor farming and greenhouses [22]. This study aims to identify an efficient, non-invasive method to enhance secondary metabolite levels and overall antioxidant properties in fresh leafy products produced with indoor farming, without a negative impact on photosynthesis, morphology or consumers' sensory attributes. To this end, we analyzed the effect of low doses of UV-B or UV-C radiation applied shortly before harvest on acyanic- (green, Sweet Large - SL) and cyanic-leaf (purple, Dark Opal - DO) cultivars of basil plants, grown in form of microgreens.
In previous works, we successfully used pre-harvest UV-A light (365 nm) supplementation to the RGB spectrum, to increase antioxidant accumulation in lettuce and basil [20] as well as the UV-B light to stimulate SM and AsA synthesis and improved overall sensory attributes of lettuce [21]. This study extends that concept by analyzing the effects of UV-B and UV-C radiation on antioxidant properties in two basil cultivars—green- and purple-leaf. Given the high-energy nature of UV light, we also investigated its impact on photosynthesis, as discussed in the following sections.
Previous research [23] showed significant induction of flavonol accumulation in leaves of green basil cultivar (O. basilicum cv. Sweet Aroma II) after low-dose UV-B exposure. Moreover, authors documented that UV-B-induced expression of chalcone synthase (CHS) and phenylalanine ammonia-lyase (PAL) genes, encoding key enzymes of the phenylpropanoid and flavonoid biosynthetic pathways, was stable and lasted, for at least, several days after UV-B exposition. Also, the study of purple-leaf basil cultivar Red Ruby [24] indicated that for dark-pigmented plants UV-C light was more effective in increasing ANT levels than UV-B light, while in the case of the Red Rubin cultivar [25] low dose of UV-B exposure (2 h day–1) also enhanced concentration of TPC and TFC. At the same time, however, other authors [26] documented that green basil (O. basilicum var. Genovese) exposed to 1–2 h day–1 of UV-B presented decreased both TPC and TFC, compared to plants grown without additional UV-B light in the spectrum.
Thus, to clarify the influence of spectrum supplementation with UV light on green and purple basil cultivars, we used a narrowband UV-B lamp, commonly used in phototherapy [27], with a dominant peak at 311 nm. A four-day progressive UV-B supplementation to the RGB background, applied directly before harvest effectively increased total TFC and ANT in the SL cultivar. In contrast, UV-B decreased all analyzed phenolics in dark-leaf basil. Interestingly, in our previous study [21], we also documented that green lettuce showed a greater response to UV-B than the reddish one, still, however in both lettuce cultivars UV-B light supplementation was able to increase phenolics content. In the case of ascorbic acid (AsA), UV-B exposure was also more effective in increasing its level in the green than purple cultivar, noted with a higher level of total AsA, presented mostly in the oxidized form. Like the previous research [28] green-leaf basil cultivars showed decreased reduced ascorbate after UV-B exposure.
Overall, in our study UV-B treatment enhanced the total antioxidant capacity of green basil extracts by approximately 5 times, while lowering its value in the purple-leaf one. A possible explanation for observed discrepancies in antioxidant accumulation is a significantly higher initial accumulation of phenolics and AsA in purple basil, acting as a protective UV-B screening shield. The high, initial level of screening pigments has been earlier postulated [28] as a key factor contributing to a slower accumulation of flavonoids, due to attenuation of the UV-B-related UVR8 signalling pathway. Thus, without stressors like UV light, green cultivars accumulate lower antioxidant levels, making them more susceptible to UV-induced synthesis of secondary metabolites [29]. Additionally, the previous study comparing purple and green basil’s abilities to screen out the visible or the UV wavelengths [30] provides evidence of a strong competition between flavonol and anthocyanins biosynthesis in acyanic- (green) and cyanic-leaf (purple) cultivars. Authors conclude that light attenuation by epidermal anthocyanins in dark-pigmented cultivars represses the biosynthesis of colorless flavonoids, as their synthesis originates from the very same intermediate substrates, i.e. dihydro-flavonols [30]. In fact, our results proved that the correlation between TFC and ANT in SL basil is negative (Figure 6), and UV-B but not UV-C light exposure targeted preferentially TFC synthesis rather than ANT. Such competition was not observed for the DO cultivar, which presents a high initial level of ANT, which weakens plant receptiveness to UV-B. In addition, we also documented a reduced carotenoid pool in both cultivars after UV-B treatment. Thus, it might be the reduced expression of methylerythritol 4-phosphate (MEP) pathway genes, such as 1-deoxy-Dxylulose-5-phosphate synthase (DXS), that are crucial drivers for isoprenoid biosynthesis [30]. Also, a similar reduction of carotenoid pool, especially β-carotene was estimated within green leaf basil (cv. Genovese) after low-dose UV-B light exposure [31].
We also analyzed short-term UV-C exposure using a low-pressure mercury lamp with a dominant peak at 254 nm. To minimize ozone generation, the lamp was equipped with a doped quartz envelope to block harmful 185 nm radiation [32,33,34]. The cumulative UV-C dose was reduced to 6.008 kJ m–2, compared to 15.622 kJ m–2 for UV-B. In the green cultivar, UV-C exposure significantly increased TPC and ANT levels, as well as the total AsA. At the same time, UV-C reduced TFC and slightly carotenoid pool, thus TAC showed no change compared to the control. In the dark-pigmented cultivar, UV-C exposure reduced TPC and AsA, while increasing the carotenoid content, leading to lower TAC. Although UV-C has been shown to promote carotenoid and flavonoid biosynthesis in other crops, such as red bell peppers [35] and tatsoi [36], it had mixed effects in basil, suggesting that responses to UV-C are highly cultivar-dependent. Moreover, in the case of UV-C light previous research [37,38] suggests that its supplementation is more effective in increasing bioactive metabolites profile and antioxidant potential when applied in in vitro cultures.
The differences in UV-B and UV-C efficiency in promoting antioxidant synthesis and their effects exerted on plant health stem from their distinct modes of action. UV-B triggers the monomerization of UVR8 dimers, which accumulate in the nucleus and prevent the degradation of the HY5 transcription factor, leading to flavonoid biosynthesis through the upregulation of key genes like CHS [13]. Conversely, UV-C is predominantly perceived through changes in the plant’s redox state, inducing ROS production through the mitochondrial electron transport chain and NADPH oxidase, affecting phenolic biosynthesis and AsA metabolism by activation of L-galactono-1,4-lactone dehydrogenase (GalDH) [39]. It is also worth noting, that besides the increased pool of antioxidants, the overall consumers assessment of UV-B-treated leafy samples was also increased. In the case of UV-C, we noted sort of negative morphological changes, such as leaf glazing and necrotic spots, resulting in reduced overall scores of consumers’s blind test.
3.2. Condition of Photosynthetic Apparatus in Response to UV-B or UV-C Supplementation to the RGB Spectrum
The adverse effects of UV radiation on the structure and functioning of the photosynthetic apparatus (PA) are well-documented [40]. While UV-A radiation can either damage or mitigate the condition of PA [41], the harmful effects of higher-energies UV regions, UV-B and especially UV-C are typically considered detrimental to photosynthetic efficiency. UV-B radiation has been shown to reduce plastoquinone (PQ) levels and impair its function in the PSII complex. Crucial sites of UV-B light disruptive action are oxygen-evolving complex with the Mn cluster, D1/D2 reaction centre proteins of PSII, the reduction in total chlorophyll level and impairment of CO2 fixation due to lowered Rubisco content and/or activity, and the inactivation of ATP synthase [40,42]. Still, low dose of UV-B exposure do not always result in severe damage, and the photosynthetic apparatus can effectively recover. Studies on different corn hybrids have demonstrated significant variation in resistance to UV-B, with photosynthesis changes serving as an indicator of a plant’s tolerance to UV-B stress [43]. Additionally, our previous analyses of lettuce cultivars [21] proved that low dose of UV-B light supplementation exerted no negative impact on PA condition. When applied progressively, UV-B light dosage induces the synthesis of UV-absorbing pigments, such as flavonoids, that enhance the PA's resistance to stress [21,44].
At the same time, however, significantly reduced levels of chlorophyll a and b, as well as the carotenoids were noted for both basil cultivars in UV-B groups (Table 1 and Table 2). Similar results were observed in previous research [45], which analysed the effect of UV-B on photosynthesis parameters in green-leaf basil. Authors documented that the effect of UV-B radiation was decreased net photosynthesis presumably due to impairment of the photosystem II, diminished Rubisco activity and regeneration as well as the damaged structures of the thylakoid membrane. On the other hand, in the present study, the reduced photosynthetic pigment level did not correlated with lowered photosynthetic activity measured within chlorophyll a fluorescence parameters (Figure 8 and Figure 9). Thus it might be postulated, that UV-B light-driven enhanced synthesis of flavonoids and/or ANT, strongly attenuates light, especially in the blue/green part of the spectrum, crucial for MEP pathway induction [30].
In contrast, UV-C radiation has an undeniably harmful effect on photosynthesis, primarily due to its higher-energy photons, which cause the destruction, rather than mere impairment of PA structures [40]. However, the exact mechanisms behind UV-C-induced photosynthetic damage remain unclear. It is postulated that UV-C action is related to disruption of the integrity of thylakoids, leading their fusion and starch accumulation. UV-C wavelengths between 254 and 262 nm, employed in this study, are particularly effective at damaging DNA and proteins and inhibiting mitochondrial and chloroplast activity by generating ROS [44]. Previous research [46] on lettuce linked UV-C's damaging effects to PQ degradation, observed via fluorescence induction curves. Similarly, in this study, we recorded an immediate drop in photosynthetic activity especially in green-leaf basil after UV-C exposure. However, in contrast to the results of previously tested lettuce cultivars [21], both basil plants show generally higher resistance to low-dose UV-C light.
Research on chlorophyll fluorescence parameters [47] has shown that Arabidopsis thaliana exposed to low-dose UV-C exhibited reductions in Fv/Fm, ΦPSII, and NPQ, similar to the green-leaf (SL) basil cultivar tested here, as well as the in previously tested lettuce cultivars [21]. Interestingly, previous research [47] showed that phototropins (phot1 and phot2) are implicated in UV-C-induced foliar cell death. UV-C treatment suppresses the expression of PHOT1 and PHOT2 while light-harvesting complex genes (LHCB1.1, LHCB2.1, LHCB2.2, and LHCB2.4) are upregulated, possibly due to blocked phototropin-dependent signalling. This might explain the increased soluble leaf protein (SLP) and SSU in the SL cultivar under RGB+UV-B and RGB+UV-C conditions. Additionally, both UV-B and UV-C exposure have been shown to increase soluble protein content in Tetrastigma hemsleyanum leaves [48].
Based on these findings, we conclude that the DO cultivar due to a higher initial level of UV-C-absorbing phytochemicals [49] and significantly greater AsA level, compared to SL, is less susceptible to both the positive (i.e., secondary metabolite accumulation) and the negative effects (i.e., impairment of PA function, lipid peroxidation) of UV-C exposition. Similar to these results, a previous study [50] also documented that dark-pigmented basil, exposed to UV-B or UV-C light for up to 30 days presented relatively low alterations of chlorophyll and antioxidants. Moreover, it has been documented [51] that exogenous AsA application in pea seedlings protected PSII centres in the grana and stroma lamellae, primarily by stabilizing the Mn cluster rather than directly increasing ROS scavenging activity. This finding is consistent with our results, as increased AsA levels in DO did not correlate with DPPH scavenging rates.
In conclusion, our findings align with previous studies [20,21,22,52], demonstrating that UV-C light induces phytochemical accumulation, particularly in green leaf cultivars, while also causing negative morphological changes and inhibits plant growth. Thus, pre-harvest UV-C application to improve the nutraceutical properties of ready-to-eat leafy vegetables is limited. However, UV-C may be an effective postharvest tool, especially for less vulnerable crops like grains. For instance, UV-C irradiation has been shown to effectively control fungi and reduce mycotoxins in stored rice [14].
4. Materials and Methods
4.1. Plant Material, Growth Conditions and Light Treatment
Microgreens basil (Ocimum basilicum L.) cultivars with green (cv. Sweet Large, SL) and purple leaves (cv. Dark Opal, DO) were sown in P9 containers (9 × 9 × 10 cm) filled with a substrate composed of peat, perlite, and an N:P:K ratio of 9:5:10 (pH = 6.0–6.5). The containers were divided into groups and transferred to environmentally controlled growth chambers. The plants were cultivated for 20 consecutive days (20 DAS, days after sowing) under LED RhenacM12 lamps (PXM, Podleze, Poland) providing 200 µmol m–2 s–1 of the RGB spectrum (R:G:B; 661 : 633 : 520 : 434 nm) applied solely (control, Figure 14a) or under RGB spectrum supplemented 4 days prior to harvest with increasing doses of UV-B (311 nm, PL-S 9W/01/2P 1CT/6X10BOX, Philips Lighting, Eindhoven, The Netherlands, Figure 14b) or UV-C (254 nm, TUV PL-S 9W/2P 1CT/6X10BOX, Philips Lighting, Figure 14c), align with the schedule presented in Table 3.
The RGB treatment served as the control group. Light composition and photosynthetic photon flux density (PPFD) were monitored daily using a calibrated spectroradiometer GL SPECTIS 5.0 Touch (GL Optic Lichtmesstechnik GmbH, Weilheim/Teck, Germany). The containers with plants were turned in twice a day. The photoperiod was 16/8 h (day/night; day 6.00 am–10.00 pm), the average air temperature was maintained at 23/20 °C (day/night), relative air humidity was kept at 50–55% and 420±10 µmol mol–1 of CO2. The plants were watered with tap water when necessary and fertilized once a week with 1% (w/v) fertilizer (N:P:K = 9:9:27; Substral Scotts, Warszawa, Poland). Ten plants (two repetitions with five plants per light condition) were grown with each kind of light treatment.
4.2. Estimation of Total Phenolic Content with Folin–Ciocalteu Assay
Estimation of total phenolic content (TPC) was conducted, as described earlier [53]. In brief, 100 mg of fresh weight (FW) leaf tissue was placed in tubes with 1.0 ml of methanol. Samples, kept in dim light, were vortexed for 20 s and incubated for 30 min at 60 °C with inversion every 10 min to improve extraction. Then, the sample mixture was centrifuged at 10,000× g for 2 min, and then the supernatant was carefully collected without disturbing the plant tissue, transferred to a new tube, and mixed once again for 15 s. Then 100 µl of each extract, cooled down to room temperature (RT), was mixed with 200 µl 10% (v/v) Folin–Ciocalteu reagent (F-C) and vortexed twice for 10 s. Then 800 µl of 700 mM Na2CO3 was added, vortexed twice for 10 s, and incubated for 30 min at 40 °C, protected from light. After incubation mixture was centrifuged at 10,000× g for 1 min and transferred to a 96-well microplate with 200 µl per well. For TPC determination the absorbance (Abs) at 765 nm was estimated with a microplate spectrophotometer (Mobi, MicroDigital Co., Ltd., Seongnam, Republic of Korea with six replicates. The standard curve with gallic acid (0–200 nmol) was used to estimate nanomoles of phenolic compounds (gallic acid equivalents) in a sample.
4.3. Estimation of Total Flavonoid Content
The total flavonoid (TFC) assay [54] with modification was applied. The 60 µl of methanol extract obtained previously for TPC assay was mixed with 680 µl of 30% (v/v) methanol: water and 30 µl of 0.5 M NaNO2, vortexed for 20 s and incubated at RT for 3 min without light. Then 30 µl of 0.3 M AlCl3 × 6H2O was added to each sample, vortexed for 20 s and incubated at RT for 3 min, and then mixed with 200 µl of 1 M NaOH, vortexed and left for the next 40 min at RT without light. After incubation, samples were mixed, shortly centrifugated (5000× g for 1 min) and 200 µl aliquot of each sample were transferred to 96-well microplate. For TFC determination the Abs at 506 nm was estimated with a microplate spectrophotometer with six replicates. The flavonoid content in the sample extracts was quantified using calibration curves of flavonoid standards of rutin.
4.4. The Ascorbate/Dehydroascorbate (AsA/DAsA) Ratio Estimation
Ascorbic acid (AsA) was determined by the bipyridyl method [55]. The ascorbate/dehydroascorbate (AsA/DAsA) ratio is an indicator of the stress level in plants. The method involves the extraction and determination of AsA and DAsA. The assay is based on the reduction of Fe3+ to Fe2+ by AsA and the spectrometric determination of Fe2+ in complex with 2,2’-bipyridyl. DAsA is reduced to AsA by pre-incubation of the sample with dithiothreitol (DTT) dissolved in 0.2 M phosphate buffer (Na2HPO4/NaH2PO4) at pH = 7.4. The excess DTT has been removed using N-ethylmaleimide (NEM, Sigma), and the total AsA concentration is determined using the 2,2’-bipyridyl method. The DAsA concentration is assessed from the difference between the total and initial AsA concentrations.
In brief, 500 mg of plant samples were homogenized into a fine powder in a mortar placed on ice with the addition of 1.5 ml of 6% TCA. The homogenate was transferred to a 2 ml tube and centrifuged for 5 min at 15,000× g (4 °C). Supernatant was transferred to tube and immediately analyzed for AsA and DAsA presence. Absorbance was read at 525 nm. L-ascorbic acid solutions in concentrations of 0, 0.06, 0.125, 0.25, 0.5, and 1.0 µM dissolved in 6% (w/v) TCA were used to determine the calibration curve for AsA. The analysis was performed in six replicates for each treatment.
4.5. Anthocyanins Assay
The levels of anthocyanins (ANT) were measured, as described earlier [56]. Plant tissue (200 mg) was extracted with 1 ml methanol: HCl (99: 1, v/v) at 4°C. The samples Abs was spectrophotometrically measured at 530 and 657 nm with six replicates, and the relative anthocyanins levels [AU g–1 FW] were determined using Equation (1):
4.6. Antioxidant Activity by DPPH Assay
The antioxidant activity of each plant extract was measured by the 1,1-diphenyl-2-picrylhydrazil (DPPH) scavenging assay according to the previous study [57]. For DPPH assay the 60 µl of plant methanol extract obtained previously for TPC assay was mixed with 904 µl of methanol and 576 µl of 0.125 mM DPPH in methanol, vortexed for 20 s and incubated for 30 min at 37 °C. Using a microplate spectrophotometer, the Abs of each sample was measured at 517 nm with six replicates. To determine sample radical scavenging activity, the calibration curve with a synthetic antioxidant - butylated hydroxytoluene (BHT) (0–400 µg per ml) and 0.125 mM DPPH was plotted. The following formula was used to calculate the percentage of DPPH scavenging activity (2):
* control states for DPPH mixture incubate with 0 µg BHT solution.
4.7. Photosynthetic Pigments Determination
The concentrations of chlorophyll a and b and total carotenoids were measured spectrophotometrically, after being dissolved in dimethyl sulfoxide (DMSO). Pigments were extracted from approximately 20 mg of leaf tissue in 1.0 ml DMSO. Samples, kept in dim light, were vortexed for 1 min, then capped and incubated for 3 h at 65 °C with inversion every 10 min to improve extraction. Then the sample mixture was centrifuged at 10,000× g for 5 min, and the supernatant was carefully collected and transferred to a new tube. Pigments determination was carried according to the previous assay [58] at 480, 649, and 665 nm, with formulas suitable for 1 nm resolution. The assay was performed in six replicates for each treatment.
4.8. Leaf Soluble Protein Level and Densitometric Analysis of RuBisCO Subunits
Soluble leaf proteins (SLP) were extracted with an alkaline lysis method according to the previous procedure [59]. Plant material was incubated for 10 min at 90 °C in 500 µl of alkaline lysis buffer (0.1 M NaOH, 0.05 M EDTA, 2% SDS, 2% β-mercaptoethanol). After cooling to RT, 5 µl of 4 M acetic acid was added. The tubes were then vortexed and incubated again for a maximum of 10 minutes at 90 °C. The obtained supernatant was used to assess protein content using a NanoDrop 2000 spectrophotometer (Thermo Fisher Scientific, Waltham, United States) at a wavelength of 280 nm.
Then calculated amount of each extract mixed with Laemmli Sample Buffer (Bio-Rad, Hercules, USA) was loaded onto precast 4–20% gradient TGX polyacrylamide gels (Bio-Rad) and run with a constant voltage of 200 V for 20 min. Three replicates of each treatment were analyzed. Gels were stained with Bio-Safe™ Coomassie Stain (CBB, Bio-Rad). The quantification of the protein bands of the CBB stained gels was made using densitometric analysis (ImageJ v.1.52, National Institutes of Health, Maryland, Bethesda, MD, USA). The relative amount of RuBisCO subunits was calculated using as a maximum the value measured in RGB control plants [60].
4.9. Measurement of Chlorophyll Fluorescence (ChF) Induction Kinetics
ChF induction kinetics of control and UV-treated basil leaves was performed using pulse amplitude modulated (PAM) fluorometer (Maxi IMAGING-PAM M-Series, Walz, Effeltrich, Germany). The minimal fluorescence level (Fo) with all PSII reaction centers open was measured by the measuring modulated blue light (λ = 450 nm, 0.01 μmol m−2 s−1). The maximal fluorescence level (Fm) with all PSII reaction centers closed was determined by a 0.8 s saturating pulse at 2700 μmol m−2 s−1 in 30 min dark-adapted leaves. Then, the leaf was continuously illuminated with blue actinic light (186 μmol m−2 s−1). The maximum quantum yield of PSII (Fv/Fm), actual photochemical efficiency of PSII (ΦPSII), the quantum yield of regulated energy dissipation in PSII (ΦNPQ) and non-regulated energy dissipation in PSII (ΦNO), non-photochemical energy quenching (NPQ) and electron transport rate in PSII (ETR) were measured, every other day after UV light exposition. All analyses were conducted between 8.00 am and 10.00 pm.
4.10. Measurement of Lipid Peroxidation Rate
The level of oxidative damage to membranes in response to UV-treatment was estimated indirectly with an assessment of byproducts of lipid peroxidation reacted with thiobarbituric acid (TBA) and among them malondialdehyde (MDA) content. The assay was in accordance with the previous procedure [61]. In brief, 200 mg of leaf tissue was homogenized in 1 ml of methanol and incubated at 60°C for 30 min. After centrifugation at 10,000 × g for 5 min, 300 µl of each extract was mixed with 600 µl TCA-BHT-TBA mixture with 0,18 M, 65,5 µM and 45 mM, respectively. Mixed tubes were incubated for 5 min at 95 °C. After centrifugation at 10,000 × g for 1 min, the Abs of supernatants was measured at 532 nm and values corresponding to non-specific absorption at 450 nm and a correction factor for non-specific turbidity at 600 nm. The MDA concentration [μmol g–1 FW] determined on a fresh weight basis was calculated according to previous research [60] with the following formula (3):
4.11. Sensory Analysis
The sensory parameters of the fresh (raw) leaf samples of basil: appearance, sweetness, bitterness, crispness, aftertaste, and overall assessment were scored on a scale of 0–5 (where 5 is maximal, 3—neutral, and 0—the least scored) by 10 untrained consumers, aged 25–65 years (equal gender ratio) in accordance with the previous procedure [62]. The leaf samples were randomly selected, and the principle of “sample blinding” was applied to minimize bias among consumers.
4.12. Models for Data Fitting and Statistical Analysis
The fitting of experimental data of DPPH inhibition by BHT used for DPPH radical scavenging activity rate was performed using OriginPro version 2024 (OriginLab Corporation, Northampton, MA, USA).
Statistical analyses were performed using Statistica 13.3 software (StatSoft Inc., Oklahoma, OK, USA). The normal distribution of variables was verified using the Shapiro–Wilk test, and the equality of variances was evaluated using Levene’s test. One-way ANOVA and post hoc Tukey’s HSD tests were employed to analyze the differences between the investigated groups. The data are presented as means with standard deviation (±SD). Statistical significance was determined at the 0.05 level (p = 0.05).
Pearson correlation analysis was performed using OriginPro version 2024b (OriginLab Corporation, Northampton, MA, USA) at p = 0.05 (*), 0.01 (**), or 0.001 (***).
5. Conclusions
The results demonstrate that short-term, low-dose UV-B supplementation (4 days, total 3.75 h) to a red-green-blue light spectrum effectively induces the accumulation of health-promoting phytochemicals, including flavonoids, anthocyanins and ascorbic acid while enhancing significantly overall antioxidant capacity and radical scavenging activity of green microgreens basil’s extract (Sweet Large type). In contrast, the purple-leaf cultivar (Dark Opal type) showed a more limited response to UV-B, likely due to its higher initial concentration of protective compounds. Analyses also confirmed that a cumulative UV-B dose of 15.622 kJ m–2 had no adverse effects on photosynthetic activity or morphology in either cultivar. Conversely, UV-C supplementation, though applied at lower doses (CD = 6.008 kJ m–2), was effective in increasing antioxidant levels only in the green-leaf cultivar. However, its use for basil biofortification is not recommended due to the adverse morphological effects observed in both cultivars, including leaf glazing, bronzing, and curling, which significantly reduce product quality. The dark-pigmented cultivar turned out to be less vulnerable to UV-C exposure, exhibiting better protection of the photosynthetic apparatus but consistently only minor activation of phytochemical synthesis. Overall, this study offers valuable insights for optimizing indoor lighting systems, which often lack UV-emitting lamps, especially in the UV-B range.
Author Contributions
Conceptualization, E.S. and M.T.; formal analysis, I.P.; methodology, I.P., E.S. and M.T.; data curation, I.P.; writing—original draft preparation, I.P., E.S. and M.T.; writing—review and editing, M.T., I.P., E.S., J.S and P.W. All authors have read and agreed to the published version of the manuscript.
Funding
This research was funded by the Polish Ministry of Science and Higher Education (Grant No. SUPB.RN.25. M.T., E.S.), the Polish Agency for Restructuring and Modernization of Agriculture (Grant No. DDD.6509.00044.2022.13, M.T., E.S.) and RID/SP/0015/2024/01 (M.T., E.S., P.W., J.S.).
Institutional Review Board Statement
Not applicable.
Informed Consent Statement
Not applicable.
Data Availability Statement
The data presented in this study are available on request from the corresponding author. The data are not publicly available due to the strict management of various data and technical resources within the research teams.
Conflicts of Interest
The authors declare no conflicts of interest.
References
- Engler, N.; Krarti, M. Review of energy efficiency in controlled environment agriculture. Renew. Sustain. Energy Rev. 2021, 141, 110786. [Google Scholar] [CrossRef]
- Amitrano, C.; Chirico, G.B.; De Pascale, S.; Rouphael, Y.; De Micco, V. Crop management in controlled environment agriculture (CEA) systems using predictive mathematical models. Sensors 2020, 20, 3110. [Google Scholar] [CrossRef]
- Gnauer, C.; Pichler, H.; Schmittner, C.; Tauber, M.; Christl, K.; Knapitsch, J.; Parapatits, M. A recommendation for suitable technologies for an indoor farming framework. Elektrotech. Informationstechnik 2020, 137, 370–374. [Google Scholar] [CrossRef]
- Trojak, M.; Skowron, E. Light quality-dependent regulation of non-photochemical quenching in tomato plants. Biology 2021, 10, 721. [Google Scholar] [CrossRef]
- Blom, T.; Jenkins, A.; Pulselli, R.M.; Van den Dobbelsteen, A.A.J.F. The embodied carbon emissions of lettuce production in vertical farming, greenhouse horticulture, and open-field farming in the Netherlands. J. Clean. Prod. 2022, 377, 134443. [Google Scholar] [CrossRef]
- Surjadinata, B.B.; Jacobo-Velázquez, D.A.; Cisneros-Zevallos, L. UVA, UVB and UVC light enhances the biosynthesis of phenolic antioxidants in fresh-cut carrot through a synergistic effect with wounding. Molecules 2017, 22, 668. [Google Scholar] [CrossRef]
- Brazaityte, A.; Virsile, A.; Jankauskiene, J.; Sakalauskiene, S.; Samuoliene, G.; Sirtautas, R.; Novičkovas, A.; Dabašinskas, L.; Miliauskienė, J.; Vaštakaitė, V.; Bagdonavičienė, A.; Duchovskis, P. Effect of supplemental UV-A irradiation in solid-state lighting on the growth and phytochemical content of microgreens. Int. Agrophys. 2015, 29, 13–22. [Google Scholar] [CrossRef]
- Liu, S.; Yu, L.; Liu, L.; Yang, A.; Huang, X.; Zhu, A.; Zhou, H. Effects of ultraviolet-B radiation on the regulation of ascorbic acid accumulation and metabolism in lettuce. Horticulturae 2023, 9, 200. [Google Scholar] [CrossRef]
- Takshak, S.; Agrawal, S.B. Defense potential of secondary metabolites in medicinal plants under UV-B stress. J. Photochem. Photobiol. B 2019, 193, 51–88. [Google Scholar] [CrossRef]
- Darré, M.; Vicente, A.R.; Cisneros-Zevallos, L.; Artés-Hernández, F. Postharvest ultraviolet radiation in fruit and vegetables: Applications and factors modulating its efficacy on bioactive compounds and microbial growth. Foods 2022, 11, 653. [Google Scholar] [CrossRef]
- D’Amico-Damião, V; Carvalho, R.F. Cryptochrome-related abiotic stress responses in plants. Front. Plant. Sci. 2018, 9, 431291. [CrossRef]
- Artés-Hernández, F.; Castillejo, N.; Martínez-Zamora, L. UV and visible spectrum led lighting as abiotic elicitors of bioactive compounds in sprouts, microgreens, and baby leaves—A comprehensive review including their mode of action. Foods 2022, 11, 265. [Google Scholar] [CrossRef] [PubMed]
- Vanhaelewyn, L.; Van Der Straeten, D.; De Coninck, B.; Vandenbussche, F. Ultraviolet radiation from a plant perspective: The plant-microorganism context. Front. Plant. Sci. 2020, 11, 597642. [Google Scholar] [CrossRef]
- Ferreyra, M.L.F.; Serra, P.; Casati, P. Recent advances on the roles of flavonoids as plant protective molecules after UV and high light exposure. Physiol. Plant. 2021, 173, 736–749. [Google Scholar] [CrossRef]
- Xiao, Y.; Chu, L.; Zhang, Y.; Bian, Y.; Xiao, J.; Xu, D. HY5: A pivotal regulator of light-dependent development in higher plants. Front. Plant. Sci. 2022, 12, 800989. [Google Scholar] [CrossRef] [PubMed]
- Goto, E.; Hayashi, K.; Furuyama, S.; Hikosaka, S.; Ishigami, Y. Effect of UV light on phytochemical accumulation and expression of anthocyanin biosynthesis genes in red leaf lettuce. Acta Hortic. 2016, 1134, 179–186. [Google Scholar] [CrossRef]
- Jacobo-Velázquez, D.A.; Moreira-Rodríguez, M.; Benavides, J. UVA and UVB radiation as innovative tools to biofortify horticultural crops with nutraceuticals. Horticulturae 2022, 8, 387. [Google Scholar] [CrossRef]
- Cetin, E.S. Induction of secondary metabolite production by UV-C radiation in Vitis vinifera L. Öküzgözü callus cultures. Biol. Res. 2014, 47, 1–7. [Google Scholar] [CrossRef]
- Rosales, T.K.O.; Fabi, J.P. Valorization of polyphenolic compounds from food industry by-products for application in polysaccharide-based nanoparticles. Front. Nutr. 2023, 10, 1144677. [Google Scholar] [CrossRef]
- Pacak, I.; Trojak, M.; Skowron, E. The use of UV-A radiation for biofortification of lettuce and basil plants with antioxidant phenolic and flavonoid compounds. Folia Biol. Oecol. 2024, 18, 110–121. [Google Scholar] [CrossRef]
- Skowron, E.; Trojak, M.; Pacak, I. Effects of UV-B and UV-C Spectrum Supplementation on the Antioxidant Properties and Photosynthetic Activity of Lettuce Cultivars. Int. J. Mol. Sci. 2024, 25, 9298. [Google Scholar] [CrossRef] [PubMed]
- Weiland, M.; Weßler, C.F.; Filler, T.; Glaab, J.; Lobo Ploch, N.; Winterwerber, U. , Wiesner-Reinhold, M.; Schreiner, M.; Neugart, S. A comparison of consistent UV treatment versus inconsistent UV treatment in horticultural production of lettuce. Photochem. Photobiol. Sci. 2023, 22, 1611–1624. [Google Scholar] [CrossRef]
- Qian, M.; Kalbina, I.; Rosenqvist, E.; Jansen, M.A.; Strid, Å. Supplementary UV-A and UV-B radiation differentially regulate morphology in Ocimum basilicum. Photochem. Photobiol. Sci. 2023, 22, 2219–2230. [Google Scholar] [CrossRef]
- Semenova, N.A.; Smirnov, A.A.; Ivanitskikh, A.S.; Izmailov, A.Y.; Dorokhov, A.S.; Proshkin, Y.A.; Yanykin, D.V.; Sarimov, R.R.; Gudkov, S.V.; Chilingaryan, N.O. Impact of ultraviolet radiation on the pigment content and essential oil accumulation in sweet basil (Ocimum basilicum L.). Appl. Sci. 2022, 12, 7190. [Google Scholar] [CrossRef]
- Dou, H.; Niu, G.; Gu, M. Pre-harvest UV-B radiation and photosynthetic photon flux density interactively affect plant photosynthesis, growth, and secondary metabolites accumulation in basil (Ocimum basilicum) plants. Agronomy 2019, 9, 434. [Google Scholar] [CrossRef]
- Santin, M.; Becagli, M.; Sciampagna, M.C.; Mannucci, A.; Ranieri, A.; Castagna, A. Integrative effect of UV-B and some organic amendments on growth, phenolic and flavonoid compounds, and antioxidant activity of basil (Ocimum basilicum L.) plants. Horticulturae 2023, 9, 894. [Google Scholar] [CrossRef]
- Addison, R.; Weatherhead, S.C.; Pawitri, A.; Smith, G.R.; Rider, A.; Grantham, H.J.; Cockell, S.J.; Reynolds, N.J. Therapeutic wavelengths of ultraviolet B radiation activate apoptotic, circadian rhythm, redox signalling and key canonical pathways in psoriatic epidermis. Redox Biol. 2021, 41, 101924. [Google Scholar] [CrossRef]
- Milić Komić, S.; Živanović, B.; Dumanović, J.; Kolarž, P.; Sedlarević Zorić, A.; Morina, F.; Vidocić, M.; Veljović Jovanović, S. Differential antioxidant response to supplemental UV-B irradiation and sunlight in three basil varieties. Int. J. Mol. Sci. 2023, 24, 15350. [Google Scholar] [CrossRef]
- Wong, C.E.; Teo, Z.W.N.; Shen, L.; Yu, H. Seeing the lights for leafy greens in indoor vertical farming. Trends Food Sci. Technol. 2020, 106, 48–63. [Google Scholar] [CrossRef]
- Tattini, M.; Sebastiani, F.; Brunetti, C.; Fini, A.; Torre, S.; Gori, A.; Centritto, M.; Ferrini, F.; Landi, M.; Guidi, L. Dissecting molecular and physiological response mechanisms to high solar radiation in cyanic and acyanic leaves: a case study on red and green basil. J. Exp. Bot. 2017, 68, 2425–2437. [Google Scholar] [CrossRef]
- Mosadegh, H.; Trivellini, A.; Lucchesini, M.; Ferrante, A.; Maggini, R.; Vernieri, P.; Mensuali Sodi, A. UV-B physiological changes under conditions of distress and eustress in sweet basil. Plants 2019, 8, 396. [Google Scholar] [CrossRef] [PubMed]
- Otake, M.; Okamoto Yoshiyama, K.; Yamaguchi, H.; Hidema, J. 222 nm ultraviolet radiation C causes more severe damage to guard cells and epidermal cells of Arabidopsis plants than does 254 nm ultraviolet radiation. Photochem. Photobiol. Sci. 2021, 20, 1675–1683. [Google Scholar] [CrossRef]
- Claus, H. Ozone generation by ultraviolet lamps. Photochem. Photobiol. 2021, 97, 471–476. [Google Scholar] [CrossRef]
- Yadav, P.; Mina, U. Ozone stress responsive gene database (OSRGD ver. 1.1): A literature curated database for insight into plants' response to ozone stress. Plant Gene 2022, 31, 100368. [Google Scholar] [CrossRef]
- Castillejo, N.; Martínez-Zamora, L.; Artés-Hernández, F. Postharvest UV radiation enhanced biosynthesis of flavonoids and carotenes in bell peppers. Postharvest Biol. Technol. 2022, 184, 111774. [Google Scholar] [CrossRef]
- Tomás-Callejas, A.; Otón, M.; Artés, F.; Artés-Hernández, F. Combined effect of UV-C pretreatment and high oxygen packaging for keeping the quality of fresh-cut Tatsoi baby leaves. Innov. Food Sci. Emerg. Technol. 2012, 14, 115–121. [Google Scholar] [CrossRef]
- Nazir, M.; Asad Ullah, M.; Mumtaz, S.; Siddiquah, A.; Shah, M.; Drouet, S.; Hano, C.; Abbasi, B.H. Interactive effect of melatonin and UV-C on phenylpropanoid metabolite production and antioxidant potential in callus cultures of purple basil (Ocimum basilicum L. var purpurascens). Molecules 2020, 25, 1072. [Google Scholar] [CrossRef]
- Abbasi, B.H. , Khan, T., Khurshid, R., Nadeem, M., Drouet, S., Hano, C. UV-C mediated accumulation of pharmacologically significant phytochemicals under light regimes in in vitro culture of Fagonia indica (L.). Sci. Rep. 2021, 11, 679. [Google Scholar] [CrossRef]
- Rabelo, M.C.; Bang, W.Y.; Nair, V.; Alves, R.E.; Jacobo-Velázquez, D.A.; Sreedharan, S.; Alcântara de Miranda, M.R.; Cisneros-Zevallos, L. UVC light modulates vitamin C and phenolic biosynthesis in acerola fruit: Role of increased mitochondria activity and ROS production. Sci. Rep. 2020, 10, 21972. [Google Scholar] [CrossRef]
- Vass, I.; Szilárd, A.; Sicora, C. Adverse effects of UV-B light on the structure and function of the photosynthetic apparatus In Handbook of Photosynthesis, 2nd ed.; Pessarakli, M., Ed.; CRC Press: Boca Raton, FL, USA, 2005; pp. 827–843. [Google Scholar]
- Štroch, M.; Materová, Z.; Vrábl, D.; Karlický, V.; Šigut, L.; Nezval, J.; Špunda, V. Protective effect of UV-A radiation during acclimation of the photosynthetic apparatus to UV-B treatment. Plant Physiol. Biochem. 2015, 96, 90–96. [Google Scholar] [CrossRef]
- Kataria, S.; Jajoo, A.; Guruprasad, K.N. Impact of increasing Ultraviolet-B (UV-B) radiation on photosynthetic processes. J. Photochem. Photobiol. B 2014, 137, 55–66. [Google Scholar] [CrossRef]
- Jovanić, B.R.; Radenković, B.; Despotović-Zrakić, M.; Bogdanović, Z.; Barać, D. Effect of UV-B radiation on chlorophyll fluorescence, photosynthetic activity and relative chlorophyll content of five different corn hybrids. J. Photochem. Photobiol. 2022, 10, 100115. [Google Scholar] [CrossRef]
- Kosobryukhov, A.; Khudyakova, A.; Kreslavski, V. Impact of UV radiation on photosynthetic apparatus: Adaptive and damaging mechanisms. In Plant Ecophysiology and Adaptation under Climate Change: Mechanisms and Perspectives I; Spinger: Berlin, Germany, 2020; pp. 555–576. [Google Scholar] [CrossRef]
- Barickman, T.C.; Brazel, S.R.; Sehgal, A.; Walne, C.H.; Reddy, K.R. Daily UV-B treatments and elevated CO2 increases pigment concentrations and net photosynthesis of basil (Ocimum basilicum L.). Technol. Hortic. 2022, 2, 1–7. [Google Scholar] [CrossRef]
- Urban, L.; Charles, F.; de Miranda, M.R.A.; Aarrouf, J. Understanding the physiological effects of UV-C light and exploiting its agronomic potential before and after harvest. Plant Physiol. Biochem. 2016, 105, 1–11. [Google Scholar] [CrossRef] [PubMed]
- Rusaczonek, A.; Czarnocka, W.; Willems, P.; Sujkowska-Rybkowska, M.; Van Breusegem, F.; Karpiński, S. Phototropin 1 and 2 influence photosynthesis, UV-C induced photooxidative stress responses, and cell death. Cells 2021, 10, 200. [Google Scholar] [CrossRef]
- Bai, Y.; Gu, Y.; Liu, S.; Jiang, L.; Han, M.; Geng, D. Flavonoids metabolism and physiological response to ultraviolet treatments in Tetrastigma hemsleyanum Diels et Gilg. Front. Plant Sci. 2022, 13, 926197. [Google Scholar] [CrossRef]
- Bijlsma, J.; de Bruijn, W.J.; Velikov, K.P.; Vincken, J.P. Unravelling discolouration caused by iron-flavonoid interactions: Complexation, oxidation, and formation of networks. Food Chem. 2022, 370, 131292. [Google Scholar] [CrossRef]
- Proshkin, Y.A.; Smirnov, A.A.; Semenova, N.A.; Dorokhov, A.S.; Burynin, D.A.; Ivanitskikh, A.S.; Panchenko, V.A. Assessment of ultraviolet impact on main pigment content in purple basil (Ocimum basilicum L.) by the spectrometric method and hyperspectral images analysis. Appl. Sci. 2021, 11, 8804. [Google Scholar] [CrossRef]
- Dobrikova, A.G.; Krasteva, V.; Apostolova, E.L. Damage and protection of the photosynthetic apparatus from UV-B radiation. I. Effect of ascorbate. J. Plant Physiol. 2013, 170, 251–257. [Google Scholar] [CrossRef]
- Martínez-Romero, D.; Guillén, F.; Pérez-Aguilar, H.; Castillo, S.; Serrano, M.; Zapata, P.J.; Valero, D. Is it possible to increase the aloin content of Aloe vera by the use of ultraviolet light? J. Agric. Food Chem. 2013, 61, 2165–2170. [Google Scholar] [CrossRef]
- Ainsworth, E.A.; Gillespie, K.M. Estimation of total phenolic content and other oxidation substrates in plant tissues using Folin–Ciocalteu reagent. Nat. Protoc. 2007, 2, 875–877. [Google Scholar] [CrossRef] [PubMed]
- Shraim, A.M.; Ahmed, T.A.; Rahman, M.M.; Hijji, Y.M. Determination of total flavonoid content by aluminum chloride assay: A critical evaluation. LWT 2021, 150, 111932. [Google Scholar] [CrossRef]
- Kampfenkel, K.; Vanmontagu, M.; Inzé, D. Extraction and determination of ascorbate and dehydroascorbate from plant tissue. Anal. Biochem. 1995, 225, 165–167. [Google Scholar] [CrossRef] [PubMed]
- Laby, R.J.; Kincaid, M.S.; Kim, D.; Gibson, S.I. The Arabidopsis sugar-insensitive mutants sis4 and sis5 are defective in abscisic acid synthesis and response. Plant J. 2000, 23, 587–596. [Google Scholar] [CrossRef]
- Mehmood, A.; Javid, S.; Khan, M.F.; Ahmad, K.S.; Mustafa, A. In vitro total phenolics, total flavonoids, antioxidant and antibacterial activities of selected medicinal plants using different solvent systems. BMC Chem. 2022, 16, 1–10. [Google Scholar] [CrossRef]
- Wellburn, A.R. The spectral determination of chlorophylls a and b, as well as total carotenoids, using various solvents with spectrophotometers of different resolution. J. Plant Physiol. 1994, 144, 307–313. [Google Scholar] [CrossRef]
- Tsugama, D.; Liu, S.; Takano, T. A rapid chemical method for lysing Arabidopsis cells for protein analysis. Plant Methods 2011, 7, 1–7. [Google Scholar] [CrossRef] [PubMed]
- Skowron, E.; Trojak, M. Effect of exogenously-applied abscisic acid, putrescine and hydrogen peroxide on drought tolerance of barley. Biologia 2021, 76, 453–468. [Google Scholar] [CrossRef]
- Hodges, D.M.; DeLong, J.M.; Forney, C.F.; Prange, R.K. Improving the thiobarbituric acid-reactive-substances assay for estimating lipid peroxidation in plant tissues containing anthocyanin and other interfering compounds. Planta 1999, 207, 604–611. [Google Scholar] [CrossRef]
- Laužikė, K.; Viršilė, A.; Samuolienė, G.; Sutulienė, R.; Brazaitytė, A. UV-A for Tailoring the Nutritional Value and Sensory Properties of Leafy Vegetables. Horticulturae 2023, 9, 551. [Google Scholar] [CrossRef]
Figure 1.
Total phenolic content (TPC) of control (RGB), UV-B treated (RGB+UV-B) or UV-C treated (RGB+UV-C) plants of microgreens basil (Ocimum basilicum L.) cultivar with (a) green (cv. Sweet Large) and (b) purple leaf (cv. Dark Opal) at 20 DAS (days after sowing), estimated as µg gallic acid equivalents per mg of fresh weight (FW). Each bar represents the average ± SD of six independent measurements (n = 6). Different letters (a, b) indicate significant differences between treatments at p = 0.05 with a Tukey’s HSD test.
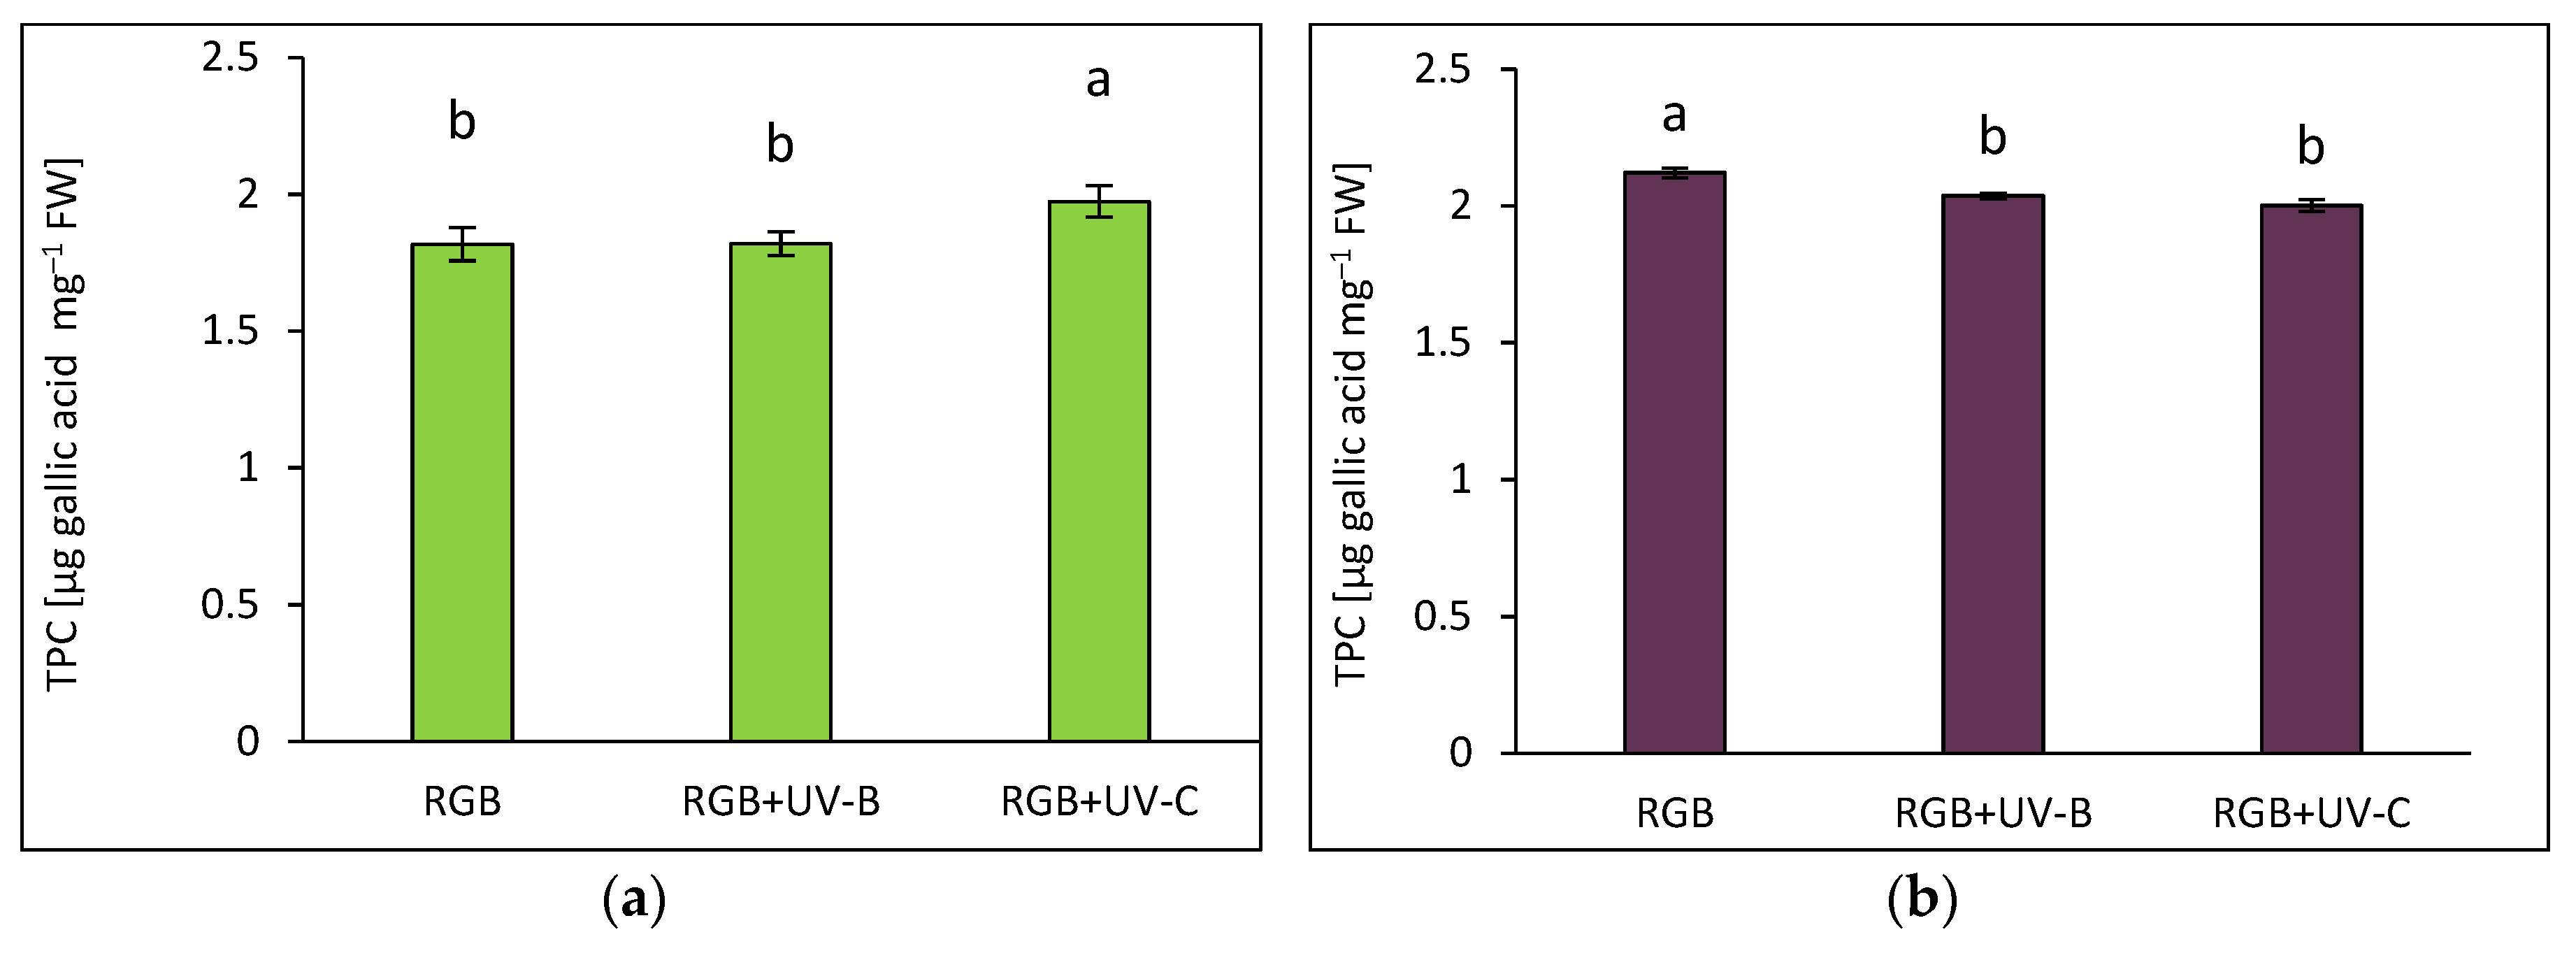
Figure 2.
Total flavonoid content (TFC) of control (RGB), UV-B treated (RGB+UV-B) or UV-C treated (RGB+UV-C) plants of microgreens basil (Ocimum basilicum L.) cultivar with (a) green (cv. Sweet Large) and (b) purple leaf (cv. Dark Opal) at 20 DAS (days after sowing), estimated as µg rutin equivalents per mg of fresh weight (FW). Each bar represents the average ± SD of six independent measurements (n = 6). Different letters (a–c) indicate significant differences between treatments at p = 0.05 with a Tukey’s HSD test.
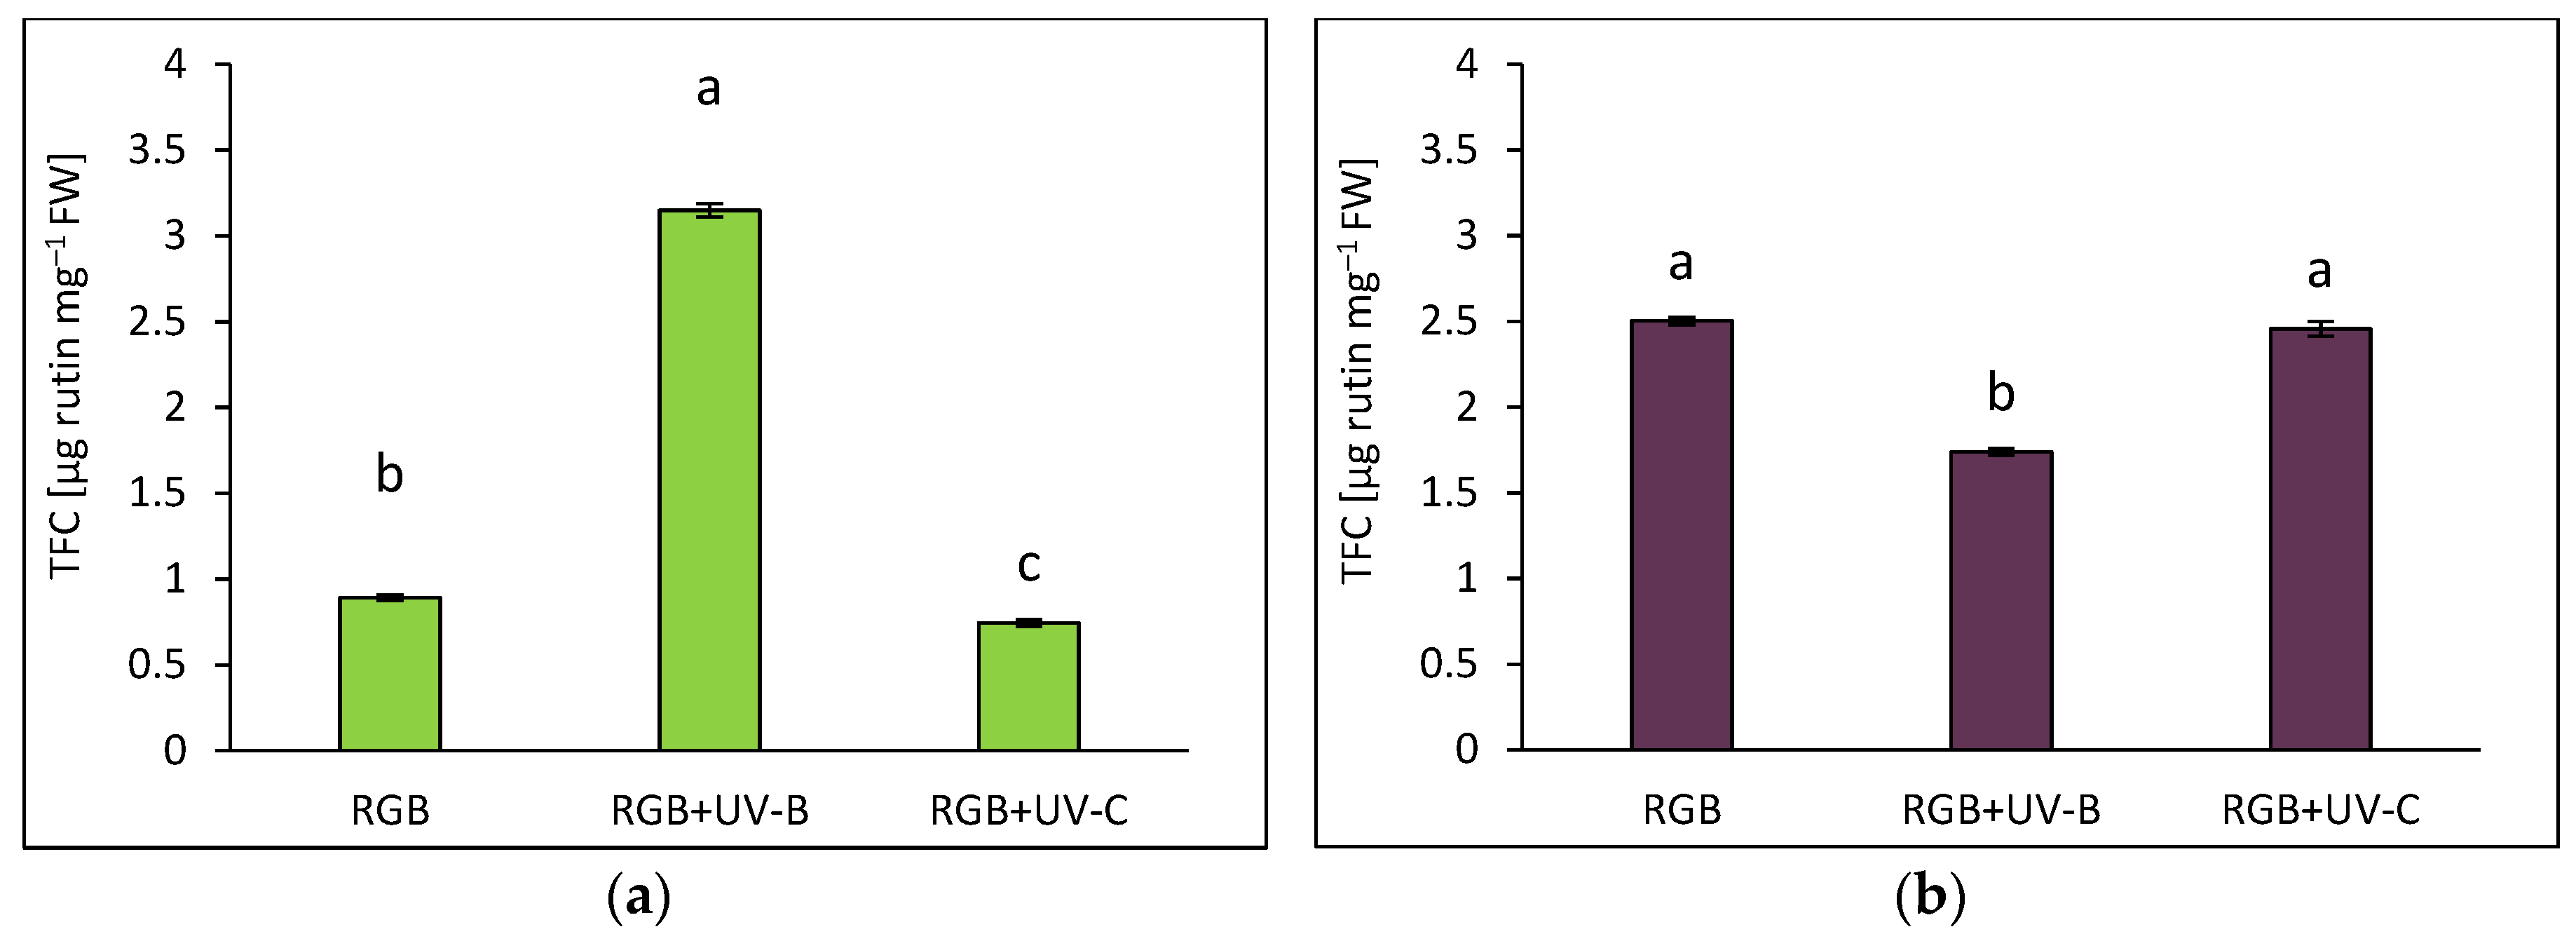
Figure 3.
Anthocyanins (ANT) concentration of control (RGB), UV-B treated (RGB+UV-B) or UV-C treated (RGB+UV-C) plants of microgreens basil (Ocimum basilicum L.) cultivar with (a) green (cv. Sweet Large) and (b) purple leaf (cv. Dark Opal) at 20 DAS (days after sowing), estimated as arbitrary unit (AU) per g of fresh weight (FW). Each bar represents the average ± SD of six independent measurements (n = 6). Different letters (a, b) indicate significant differences between treatments at p = 0.05 with a Tukey’s HSD test.
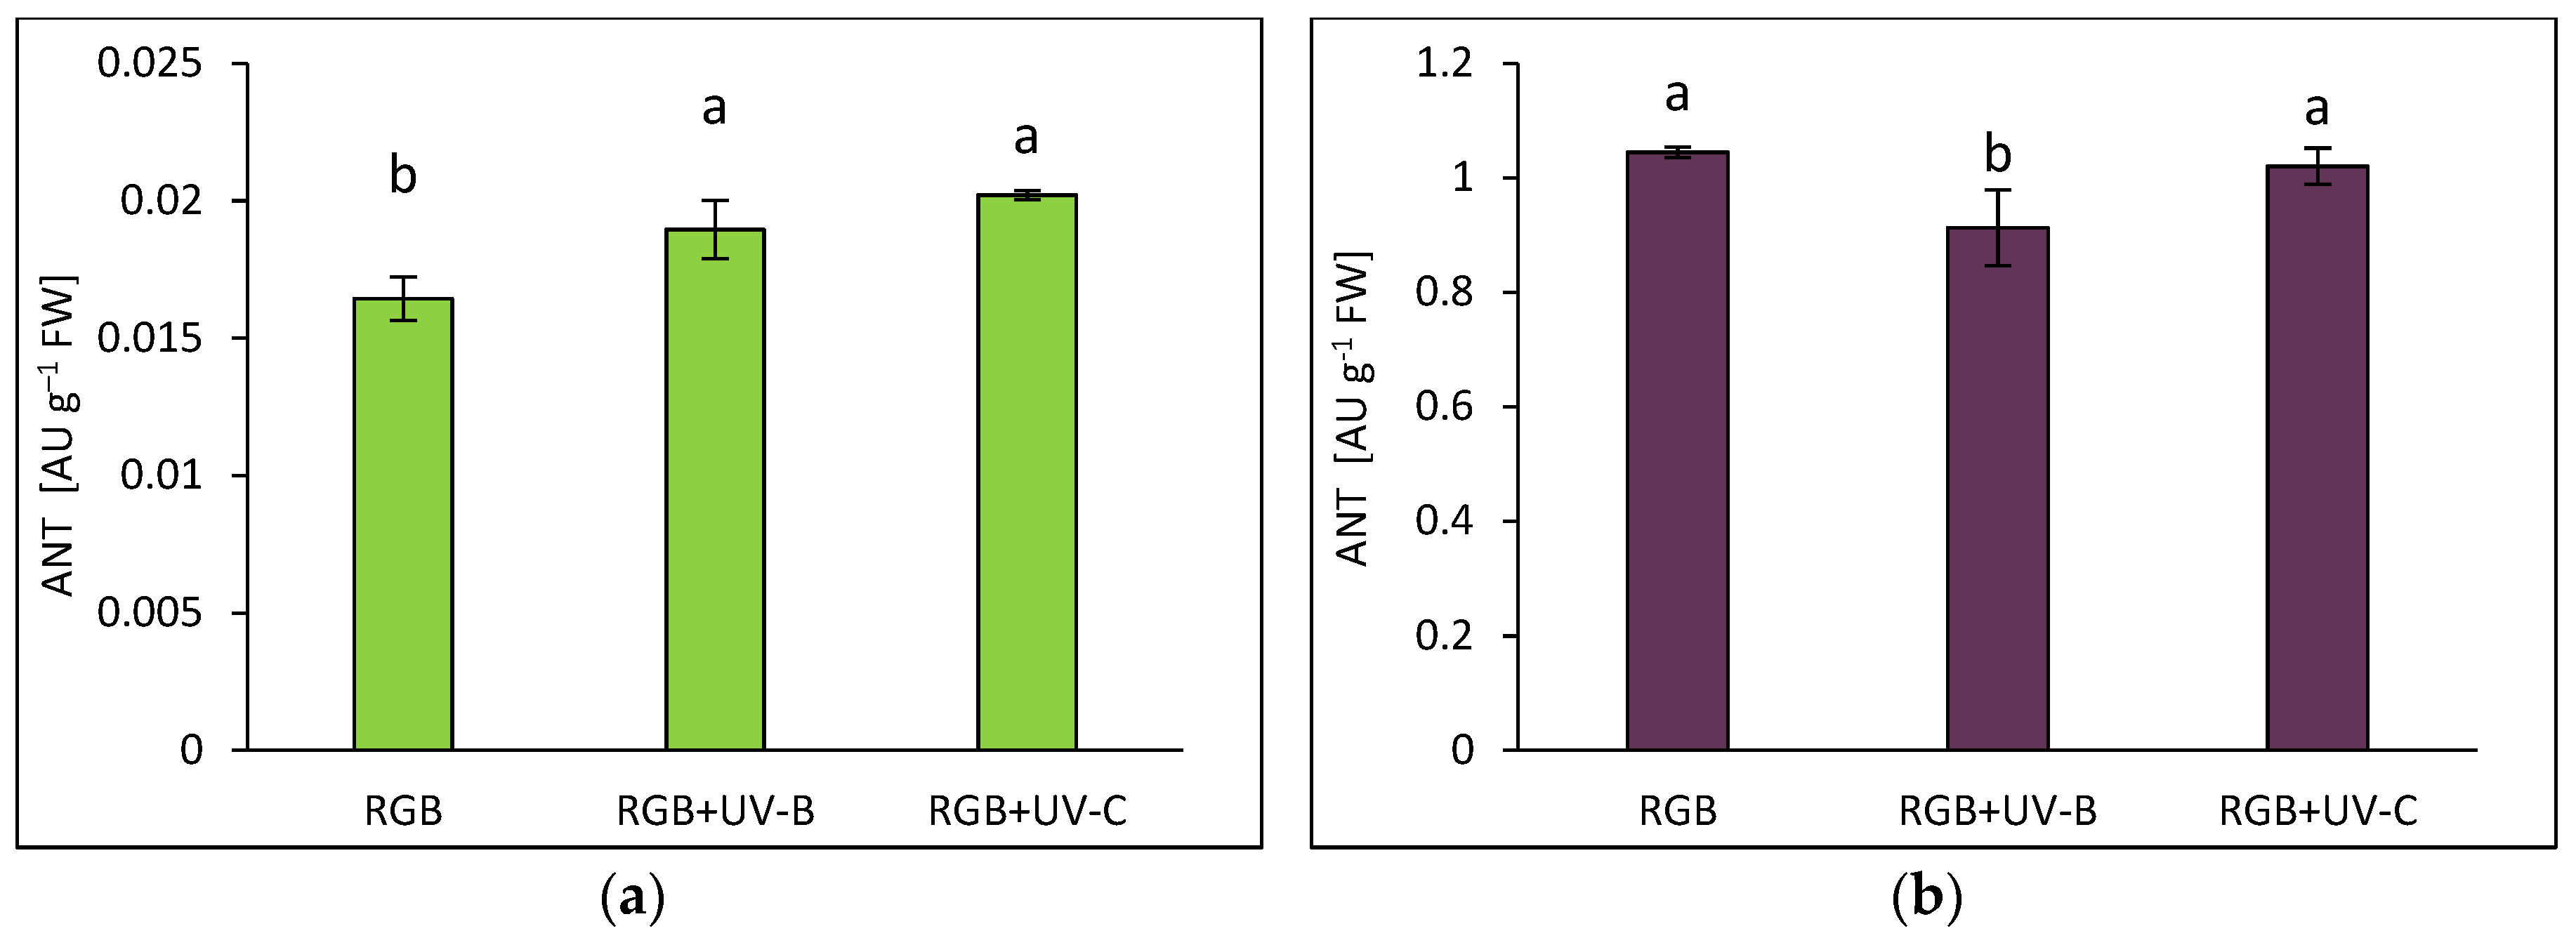
Figure 4.
Initial ascorbic acid (AsA) level, total AsA pool (AsA+DAsA) and total AsA to initial AsA ratio (AsA+DAsA/AsA) of control (RGB), UV-B treated (RGB+UV-B) or UV-C treated (RGB+UV-C) plants of microgreens basil (Ocimum basilicum L.) cultivar with (a, c) green (cv. Sweet Large) and (b, d) purple leaf (cv. Dark Opal) at 20 DAS (days after sowing). Initial AsA was estimated directly in a sample by bipyridyl method, while the total AsA pool was assessed after additional reduction of dehydroascorbic acid (DAsA) with dithiothreitol (DTT). Each bar represents the average ± SD of six independent measurements (n = 6). Different letters (a–e) indicate significant differences between treatments at p = 0.05 with a Tukey’s HSD test.
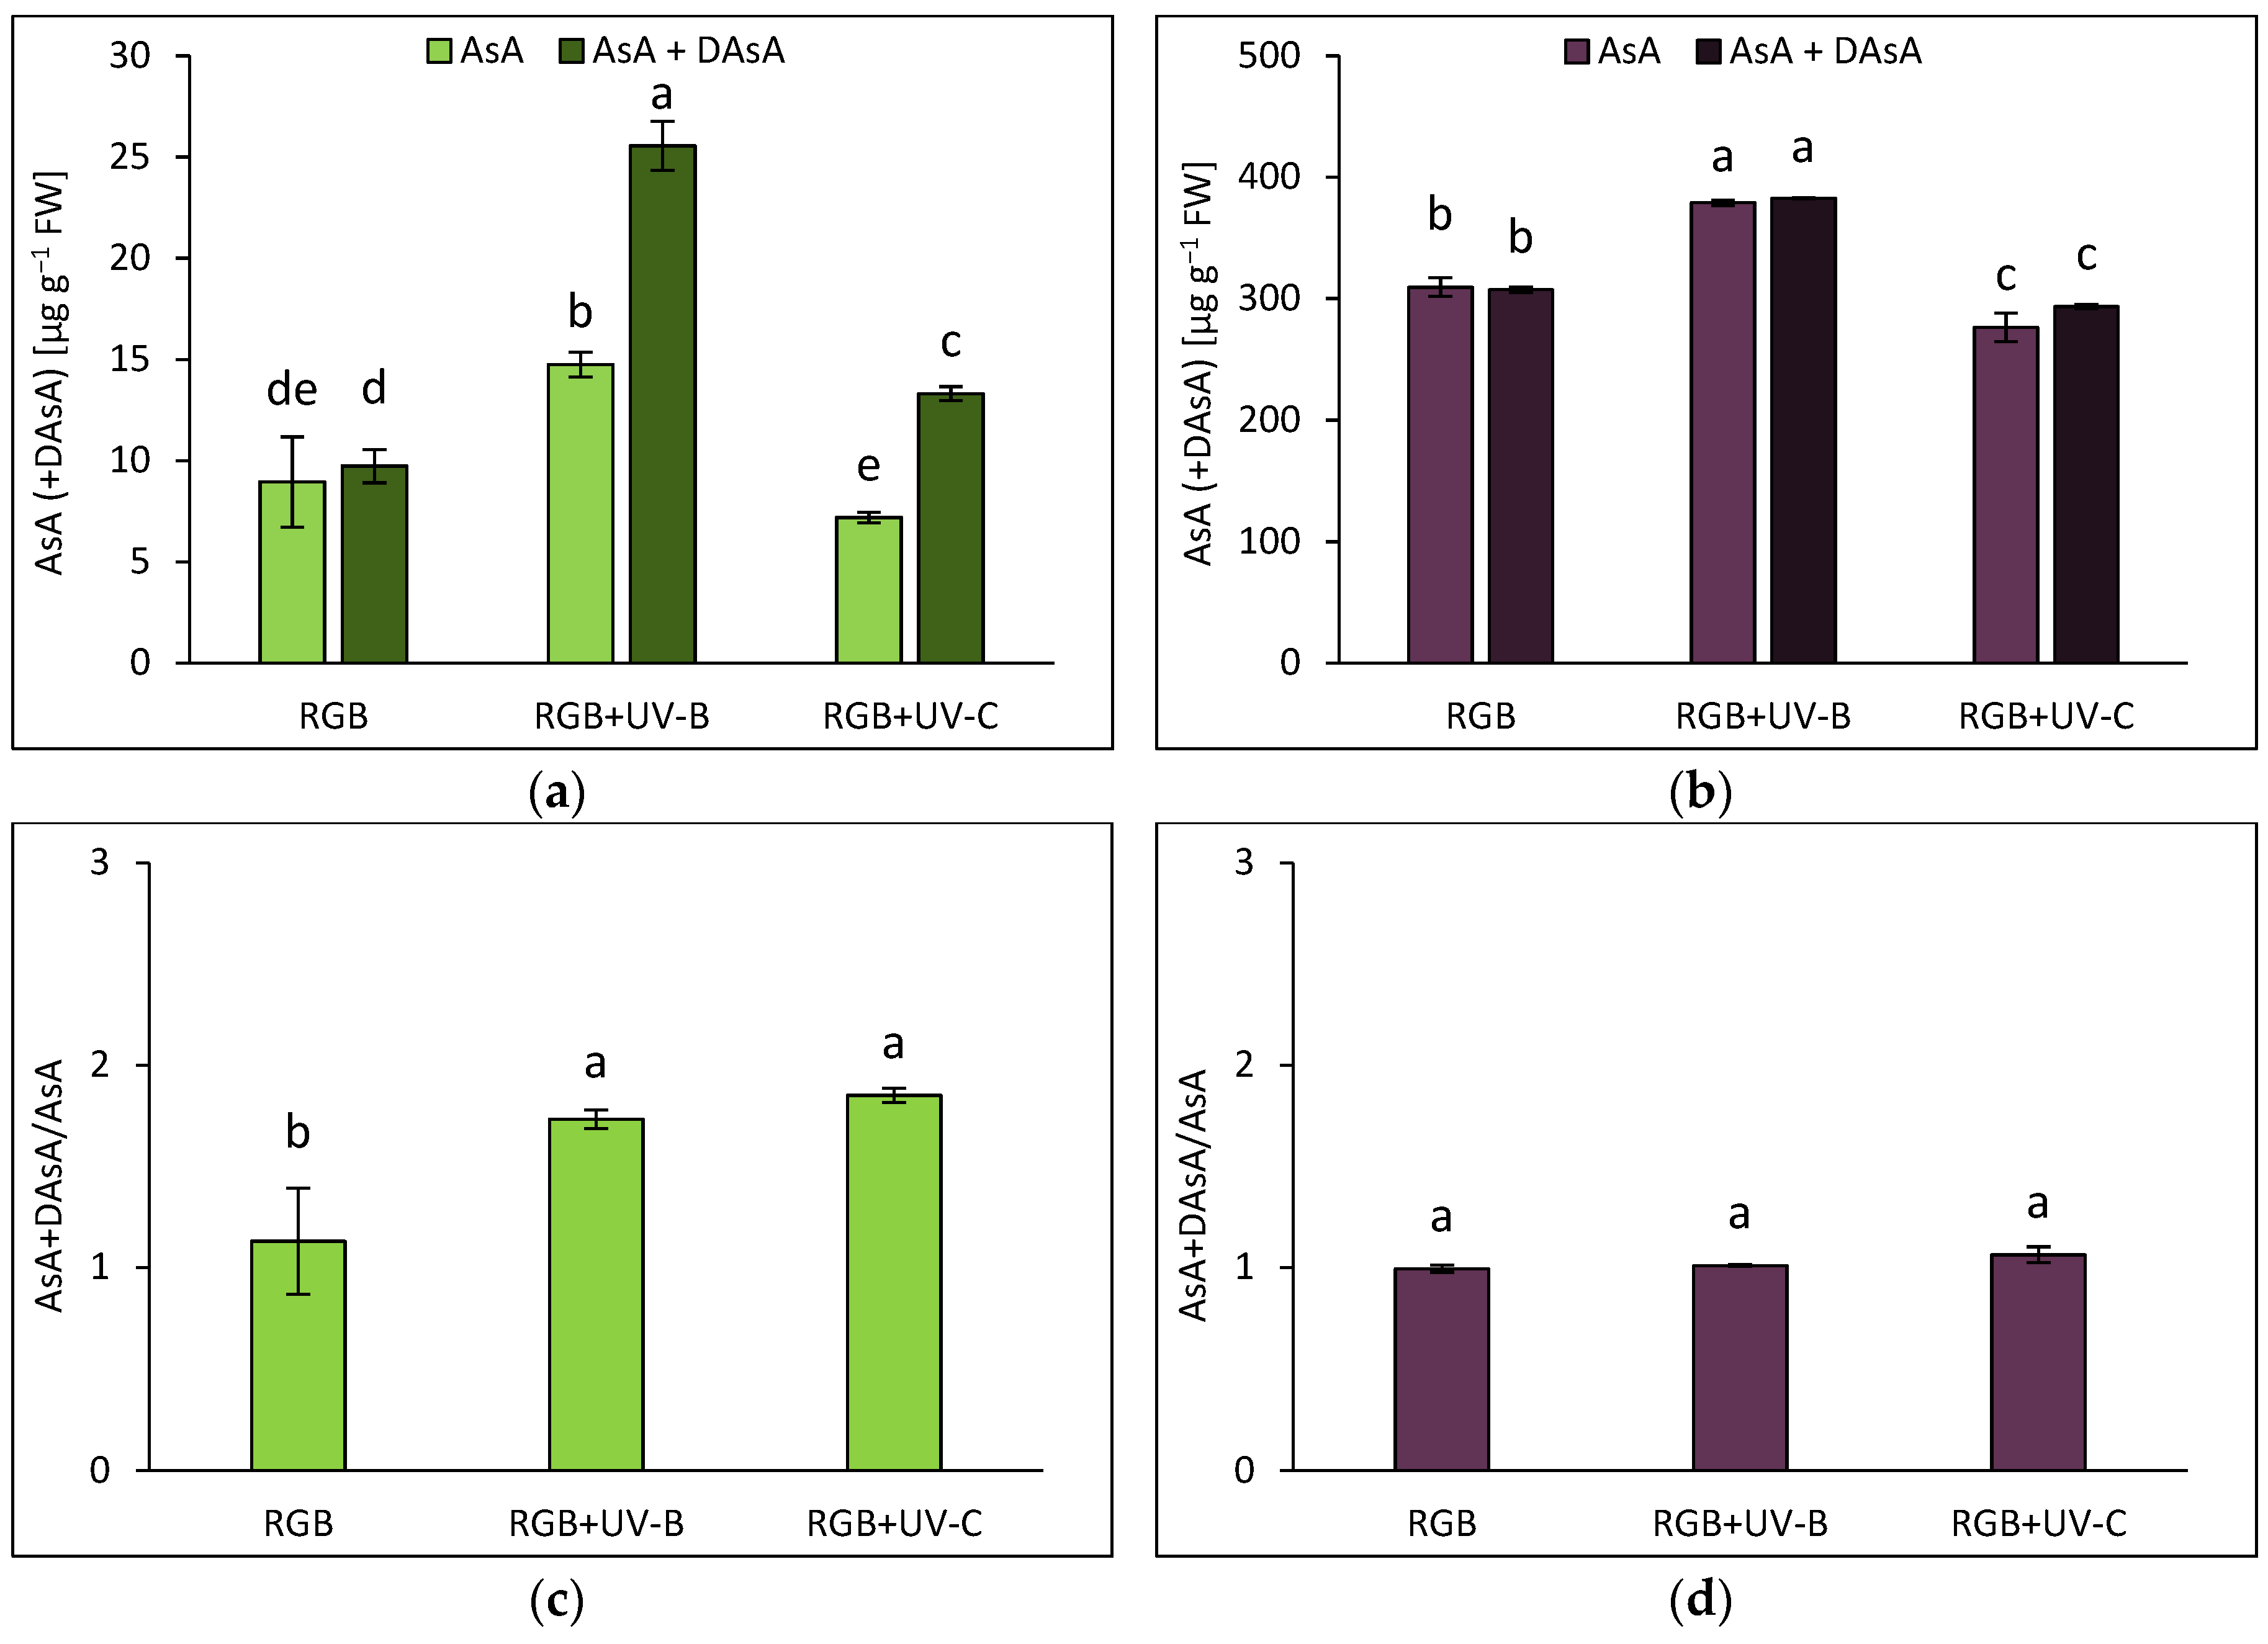
Figure 5.
The total antioxidant capacity (a, b) and DPPH radical scavenging activity rate (c, d) of control (RGB), UV-B treated (RGB+UV-B) or UV-C treated (RGB+UV-C) plants of microgreens basil (Ocimum basilicum L.) cultivar with (a, c) green (cv. Sweet Large) and (b, d) purple leaf (cv. Dark Opal) at 20 DAS (days after sowing), estimated as µg BHT equivalents per mg of fresh weight (FW). Each bar represents the average ± SD of six independent measurements (n = 6). Different letters (a–c) indicate significant differences between treatments at p = 0.05 with a Tukey’s HSD test.
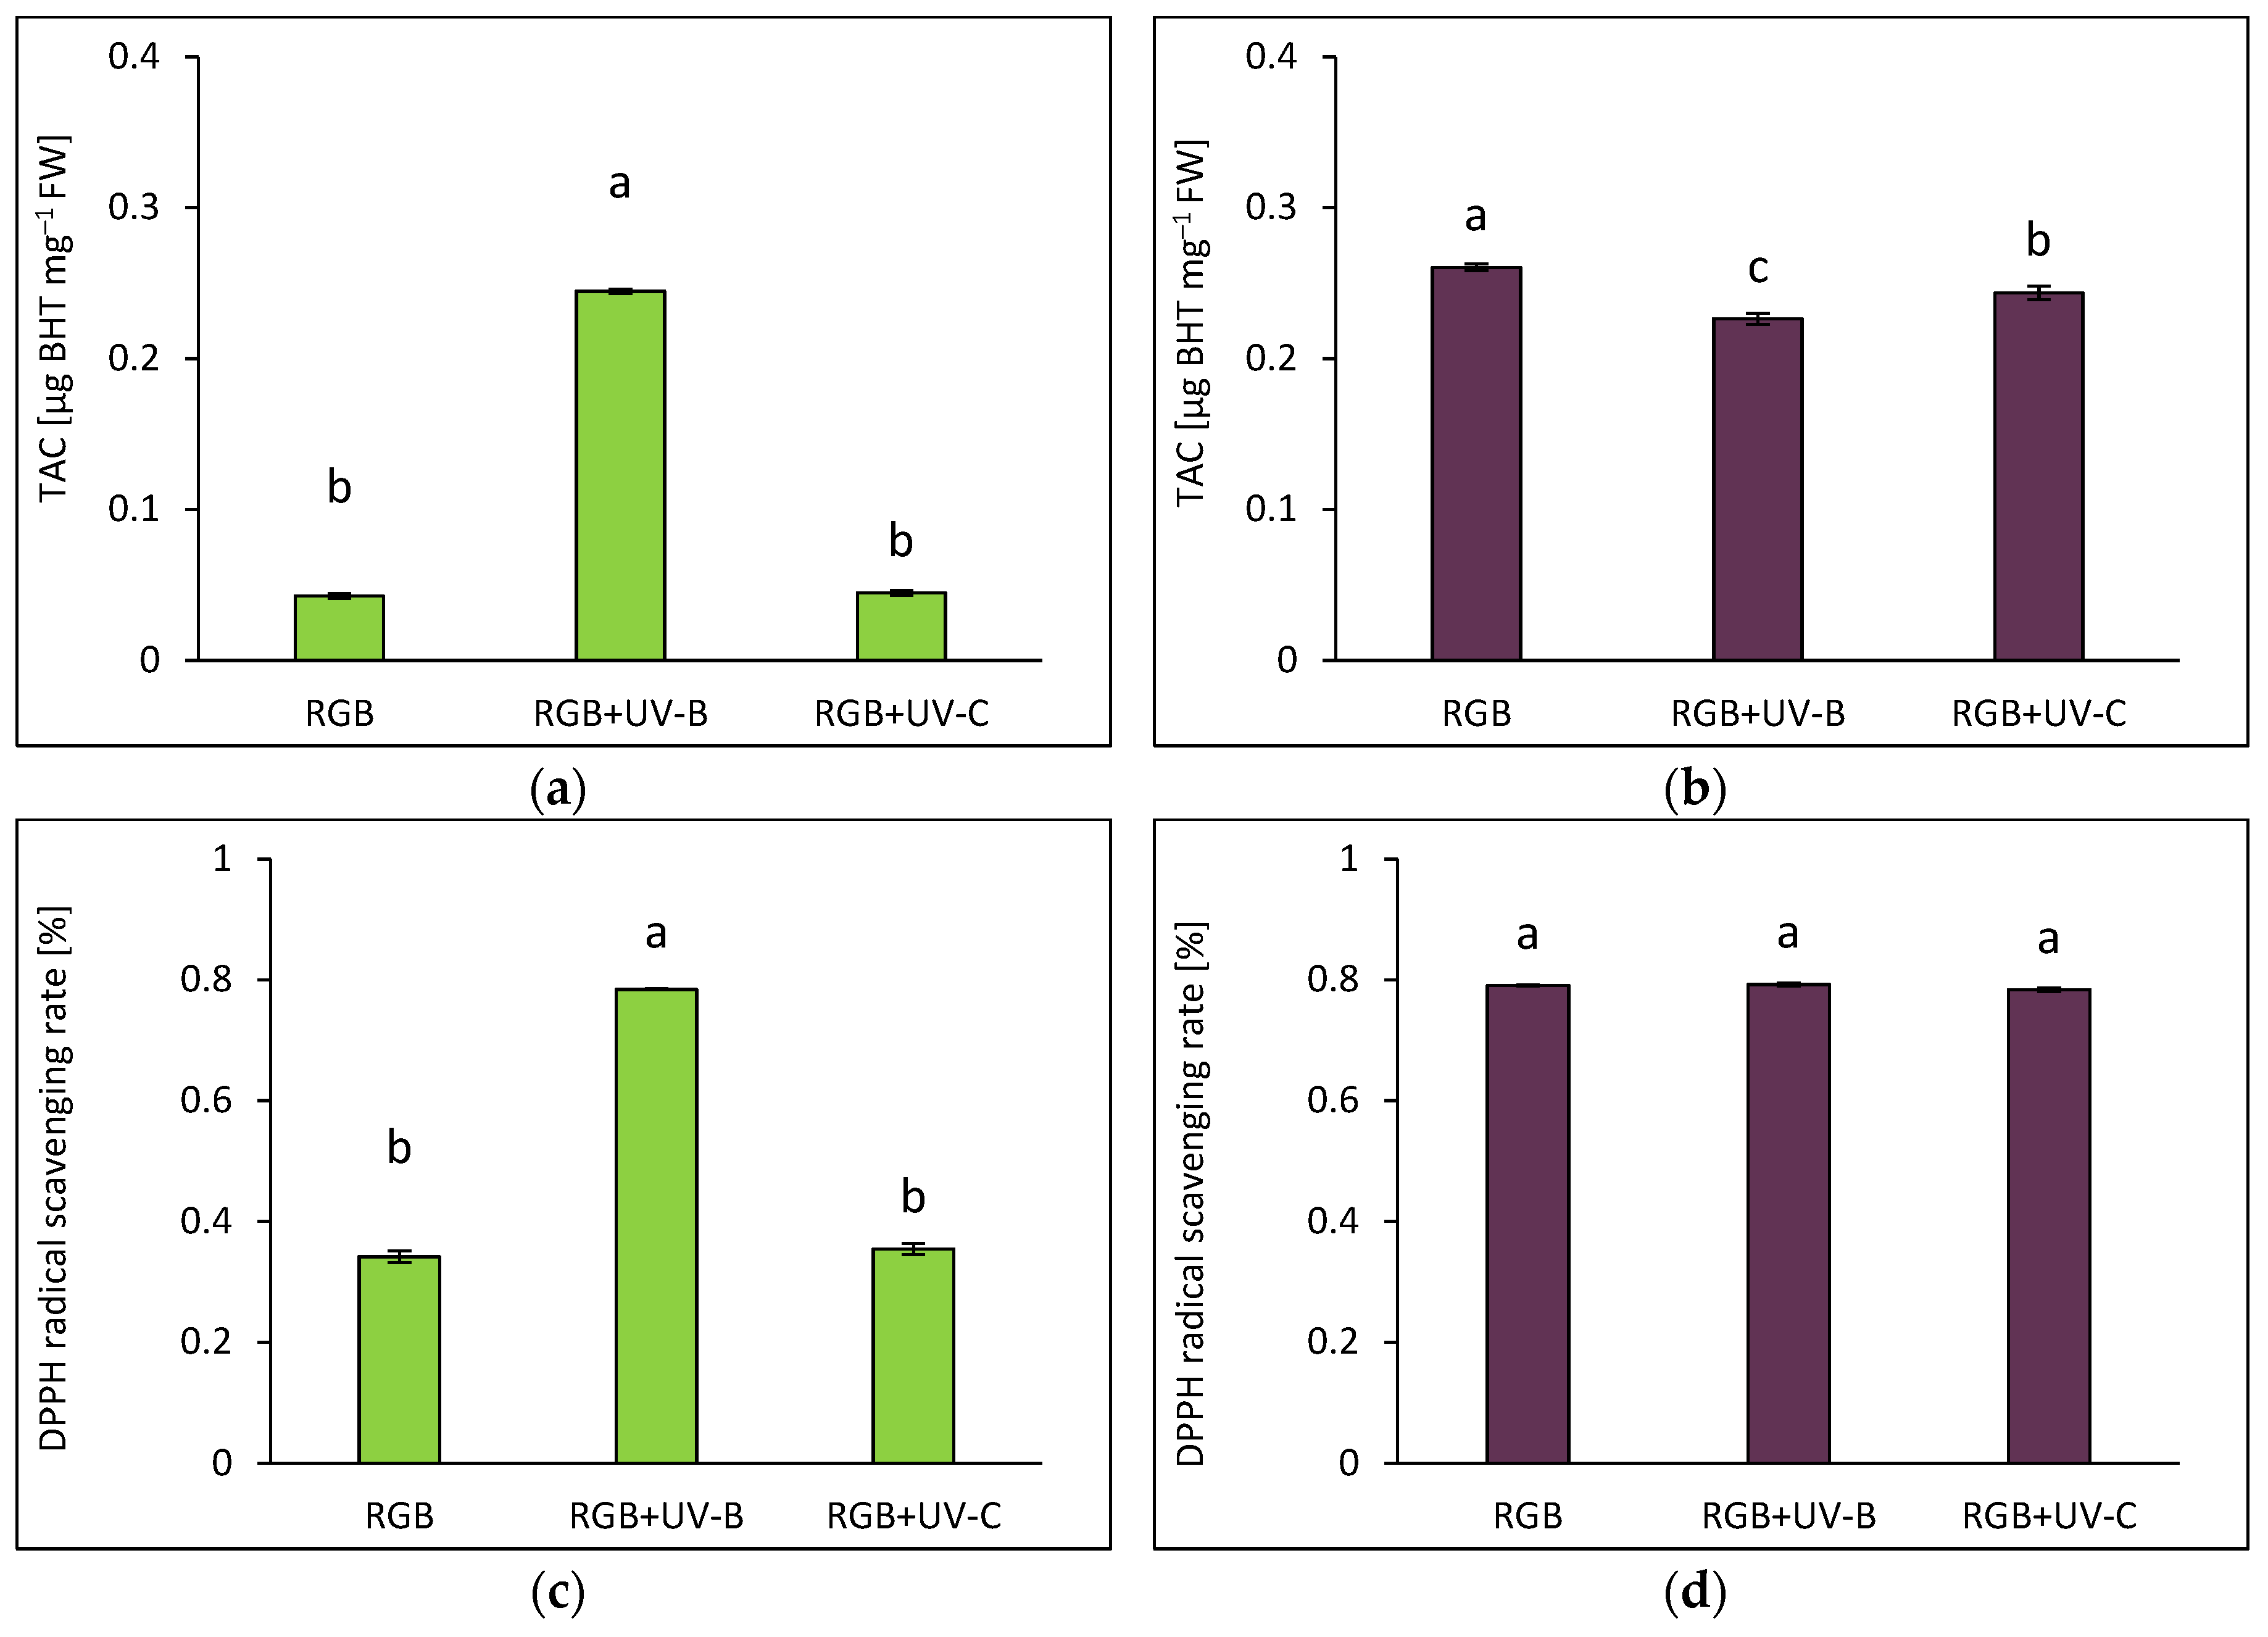
Figure 6.
Heat map illustrating the Pearson’s correlation between total phenolic content (TPC), total flavonoid content (TFC), anthocyanins (ANT), initial ascorbic acid (AsA) level, total AsA pool (AsA+DAsA) and total antioxidant capacity (TAC) noted for control (RGB), UV-B treated (RGB+UV-B) or UV-C treated (RGB+UV-C) plants of microgreens basil (Ocimum basilicum L.) cultivar with (a) green (cv. Sweet Large) and (b) purple leaf (cv. Dark Opal) at 20 DAS (days after sowing). The heat map shows positive (red) and negative (blue) correlations among parameters. Each circle represents the correlation estimated of six independent measurements (n = 6) of each treatment (RGB, RGB+UV-B, and RGB+UV-C). The size of the circles is related to Pearson's correlation coefficient. Asterisks indicate significant differences between parameters at p = 0.05 (*), 0.01 (**), or 0.001 (***) performed with Pearson correlation analysis.
Figure 7.
Densitometric analysis of RuBisCO large (LSU) and small (SSU) subunit of control (RGB), UV-B treated (RGB+UV-B) or UV-C treated (RGB+UV-C) plants of microgreens basil (Ocimum basilicum L.) cultivar with (a) green leaf (cv. Sweet Large) or (b) purple leaf (cv. Dark Opal) after short-term (1-4 day) progressive exposition to UV light at 20 DAS (days after sowing). Beneath (c) the LSU (53 kDa) or SSU (14 kDa) protein bands of leaf proteins resolved in a 4–20% TGX polyacrylamide gel and visualized with Coomassie Stain. The relative amounts (%) of RuBisCO subunits were normalized to RGB control. Bars represent the average ± SD of three independent measurements (n = 3). Different letters (a–c for LSU or a'–c' for SSU) indicate significant differences between treatments at p = 0.05 with a Tukey’s HSD test.
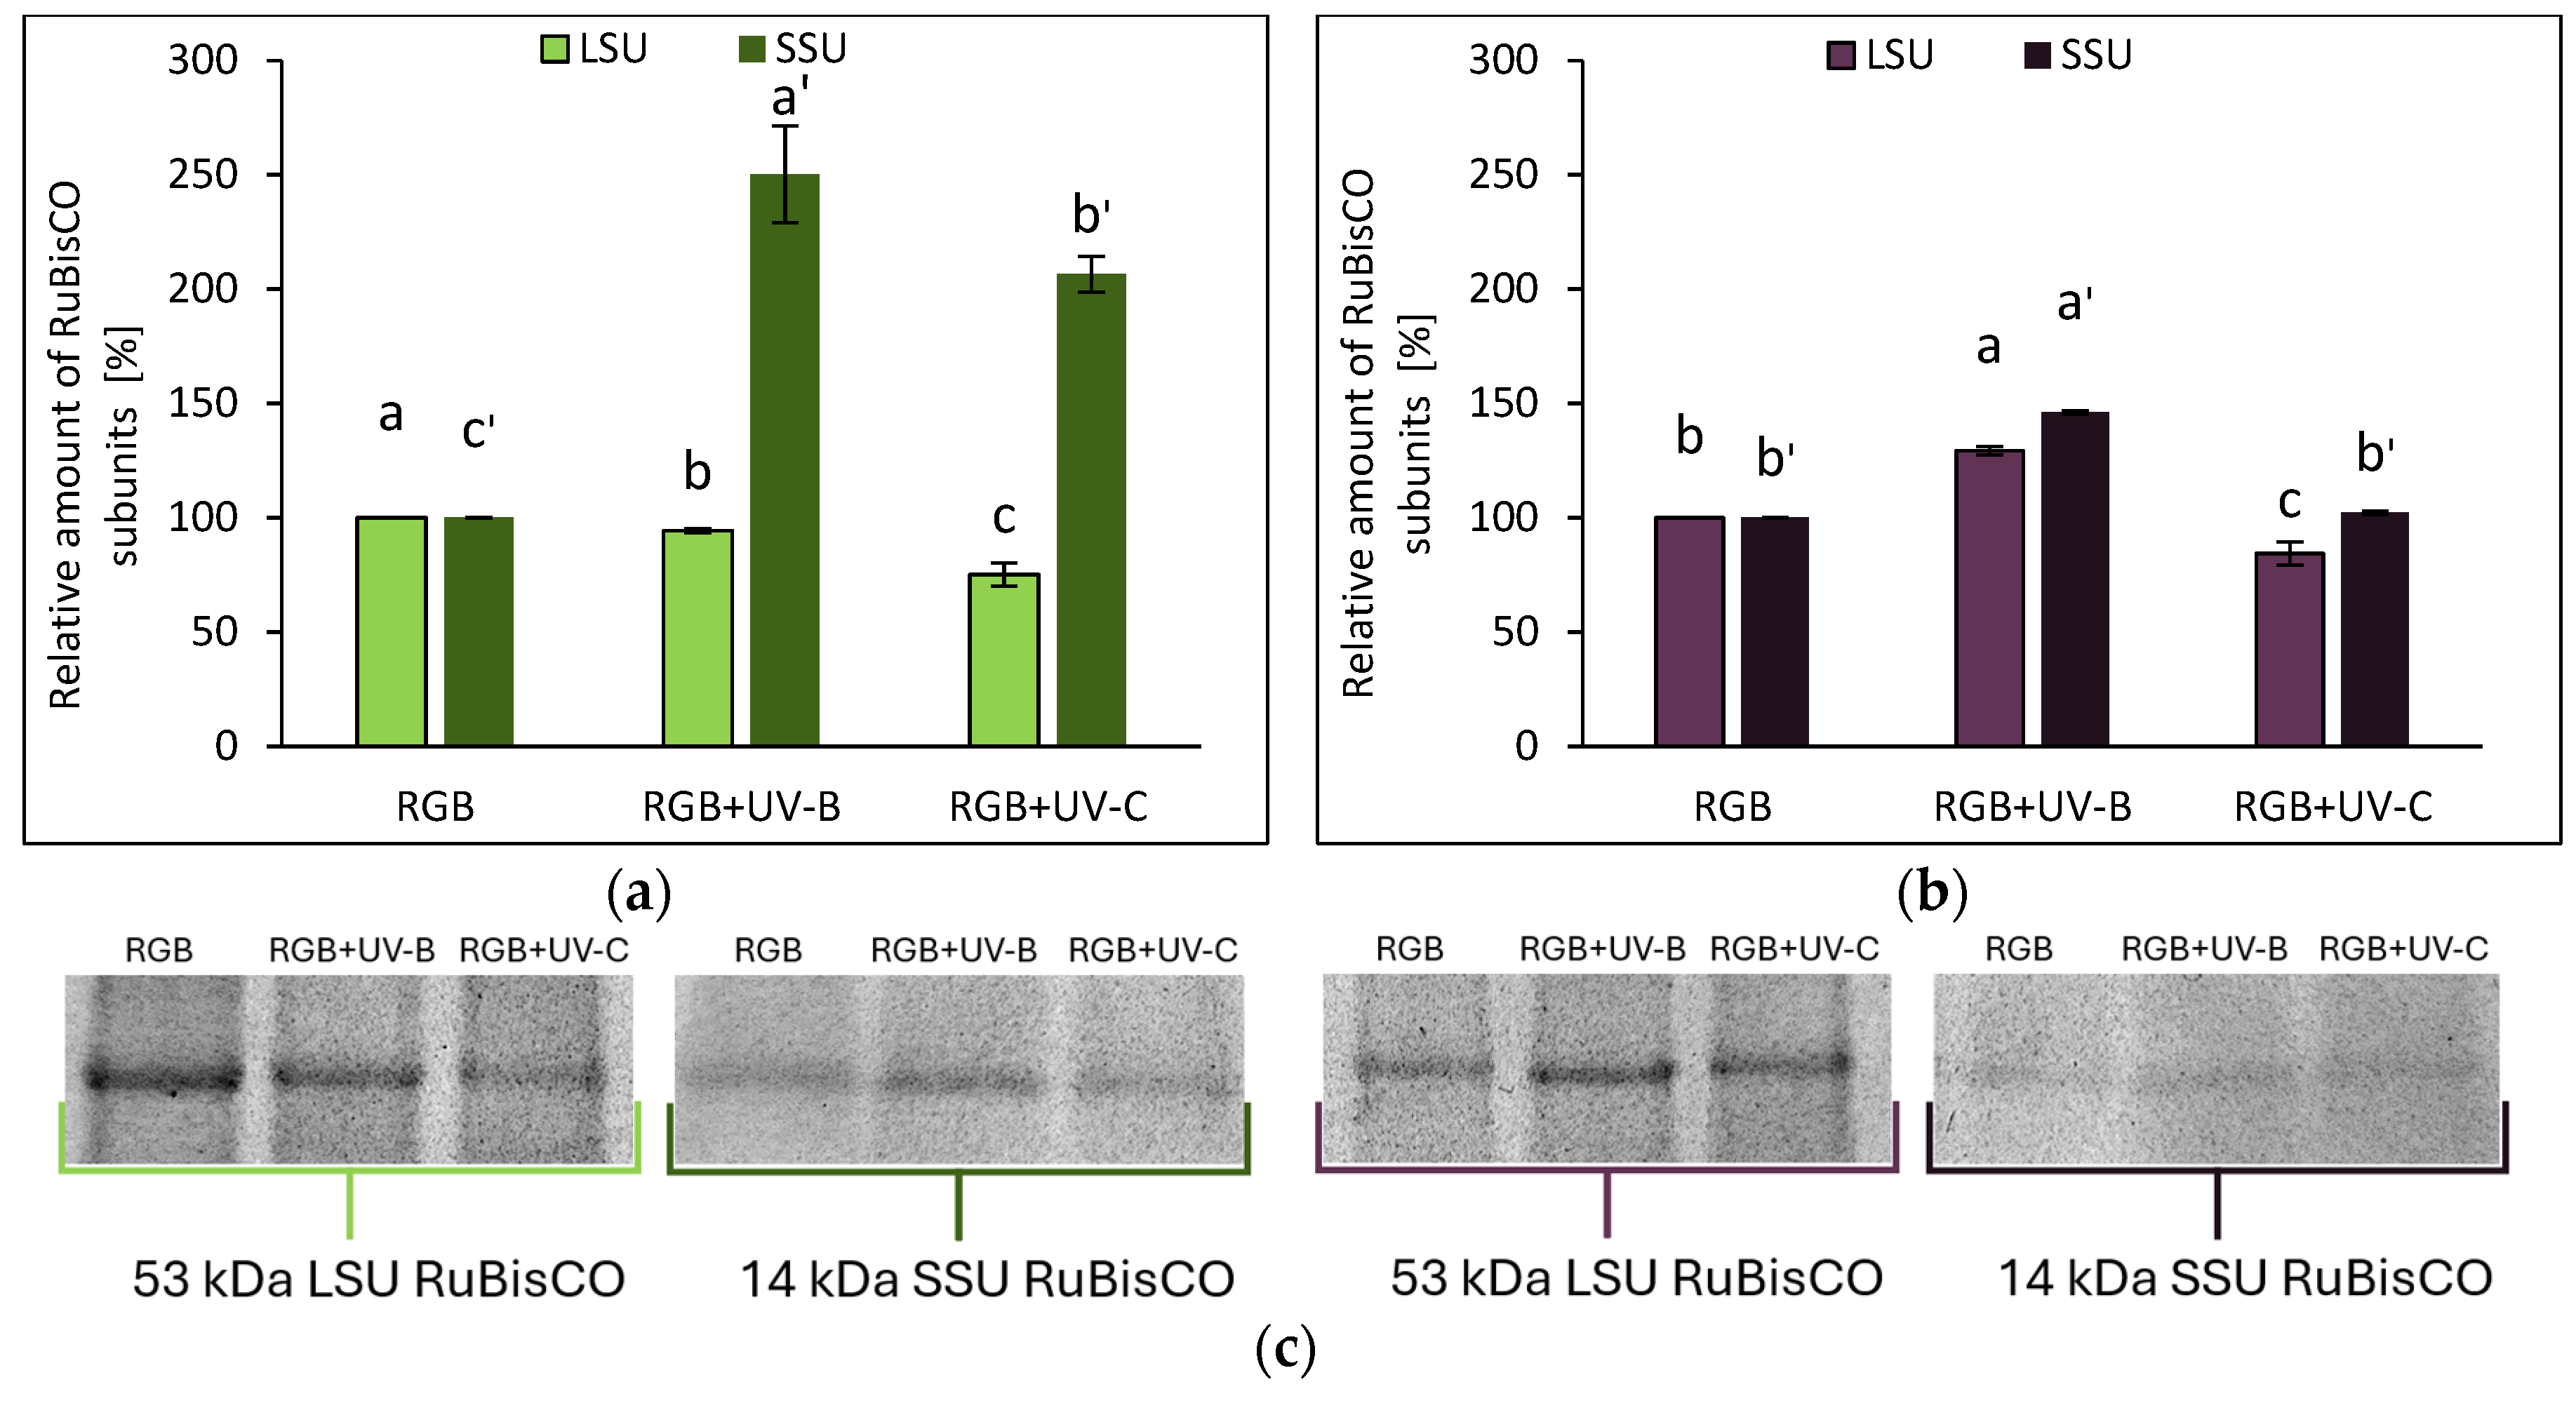
Figure 8.
Chlorophyll a fluorescence analysis of control (RGB), UV-B treated (RGB+UV-B) or UV-C treated (RGB+UV-C) plants of microgreens basil (Ocimum basilicum L.) cultivar with green leaf (cv. Sweet Large) after short-term (1-4 day) progressive exposition to UV light. (a) the maximum quantum yield of PSII photochemistry (Fv/Fm), (b) effective quantum yield of PSII photochemistry (ΦPSII), (c) quantum yield of regulated (ΦNPQ) and (d) non-regulated energy dissipation (ΦNO), (e) non-photochemical quenching (NPQ) and (f) electron transport rate (ETR). The analyses were carried out with 55 μmol m–2 s–1 of blue (450 nm) actinic light. Each data point represents the average ± SD of six independent measurements (n = 6). Different letters (a, b) indicate significant differences between treatments at p = 0.05 with a Tukey’s HSD test.
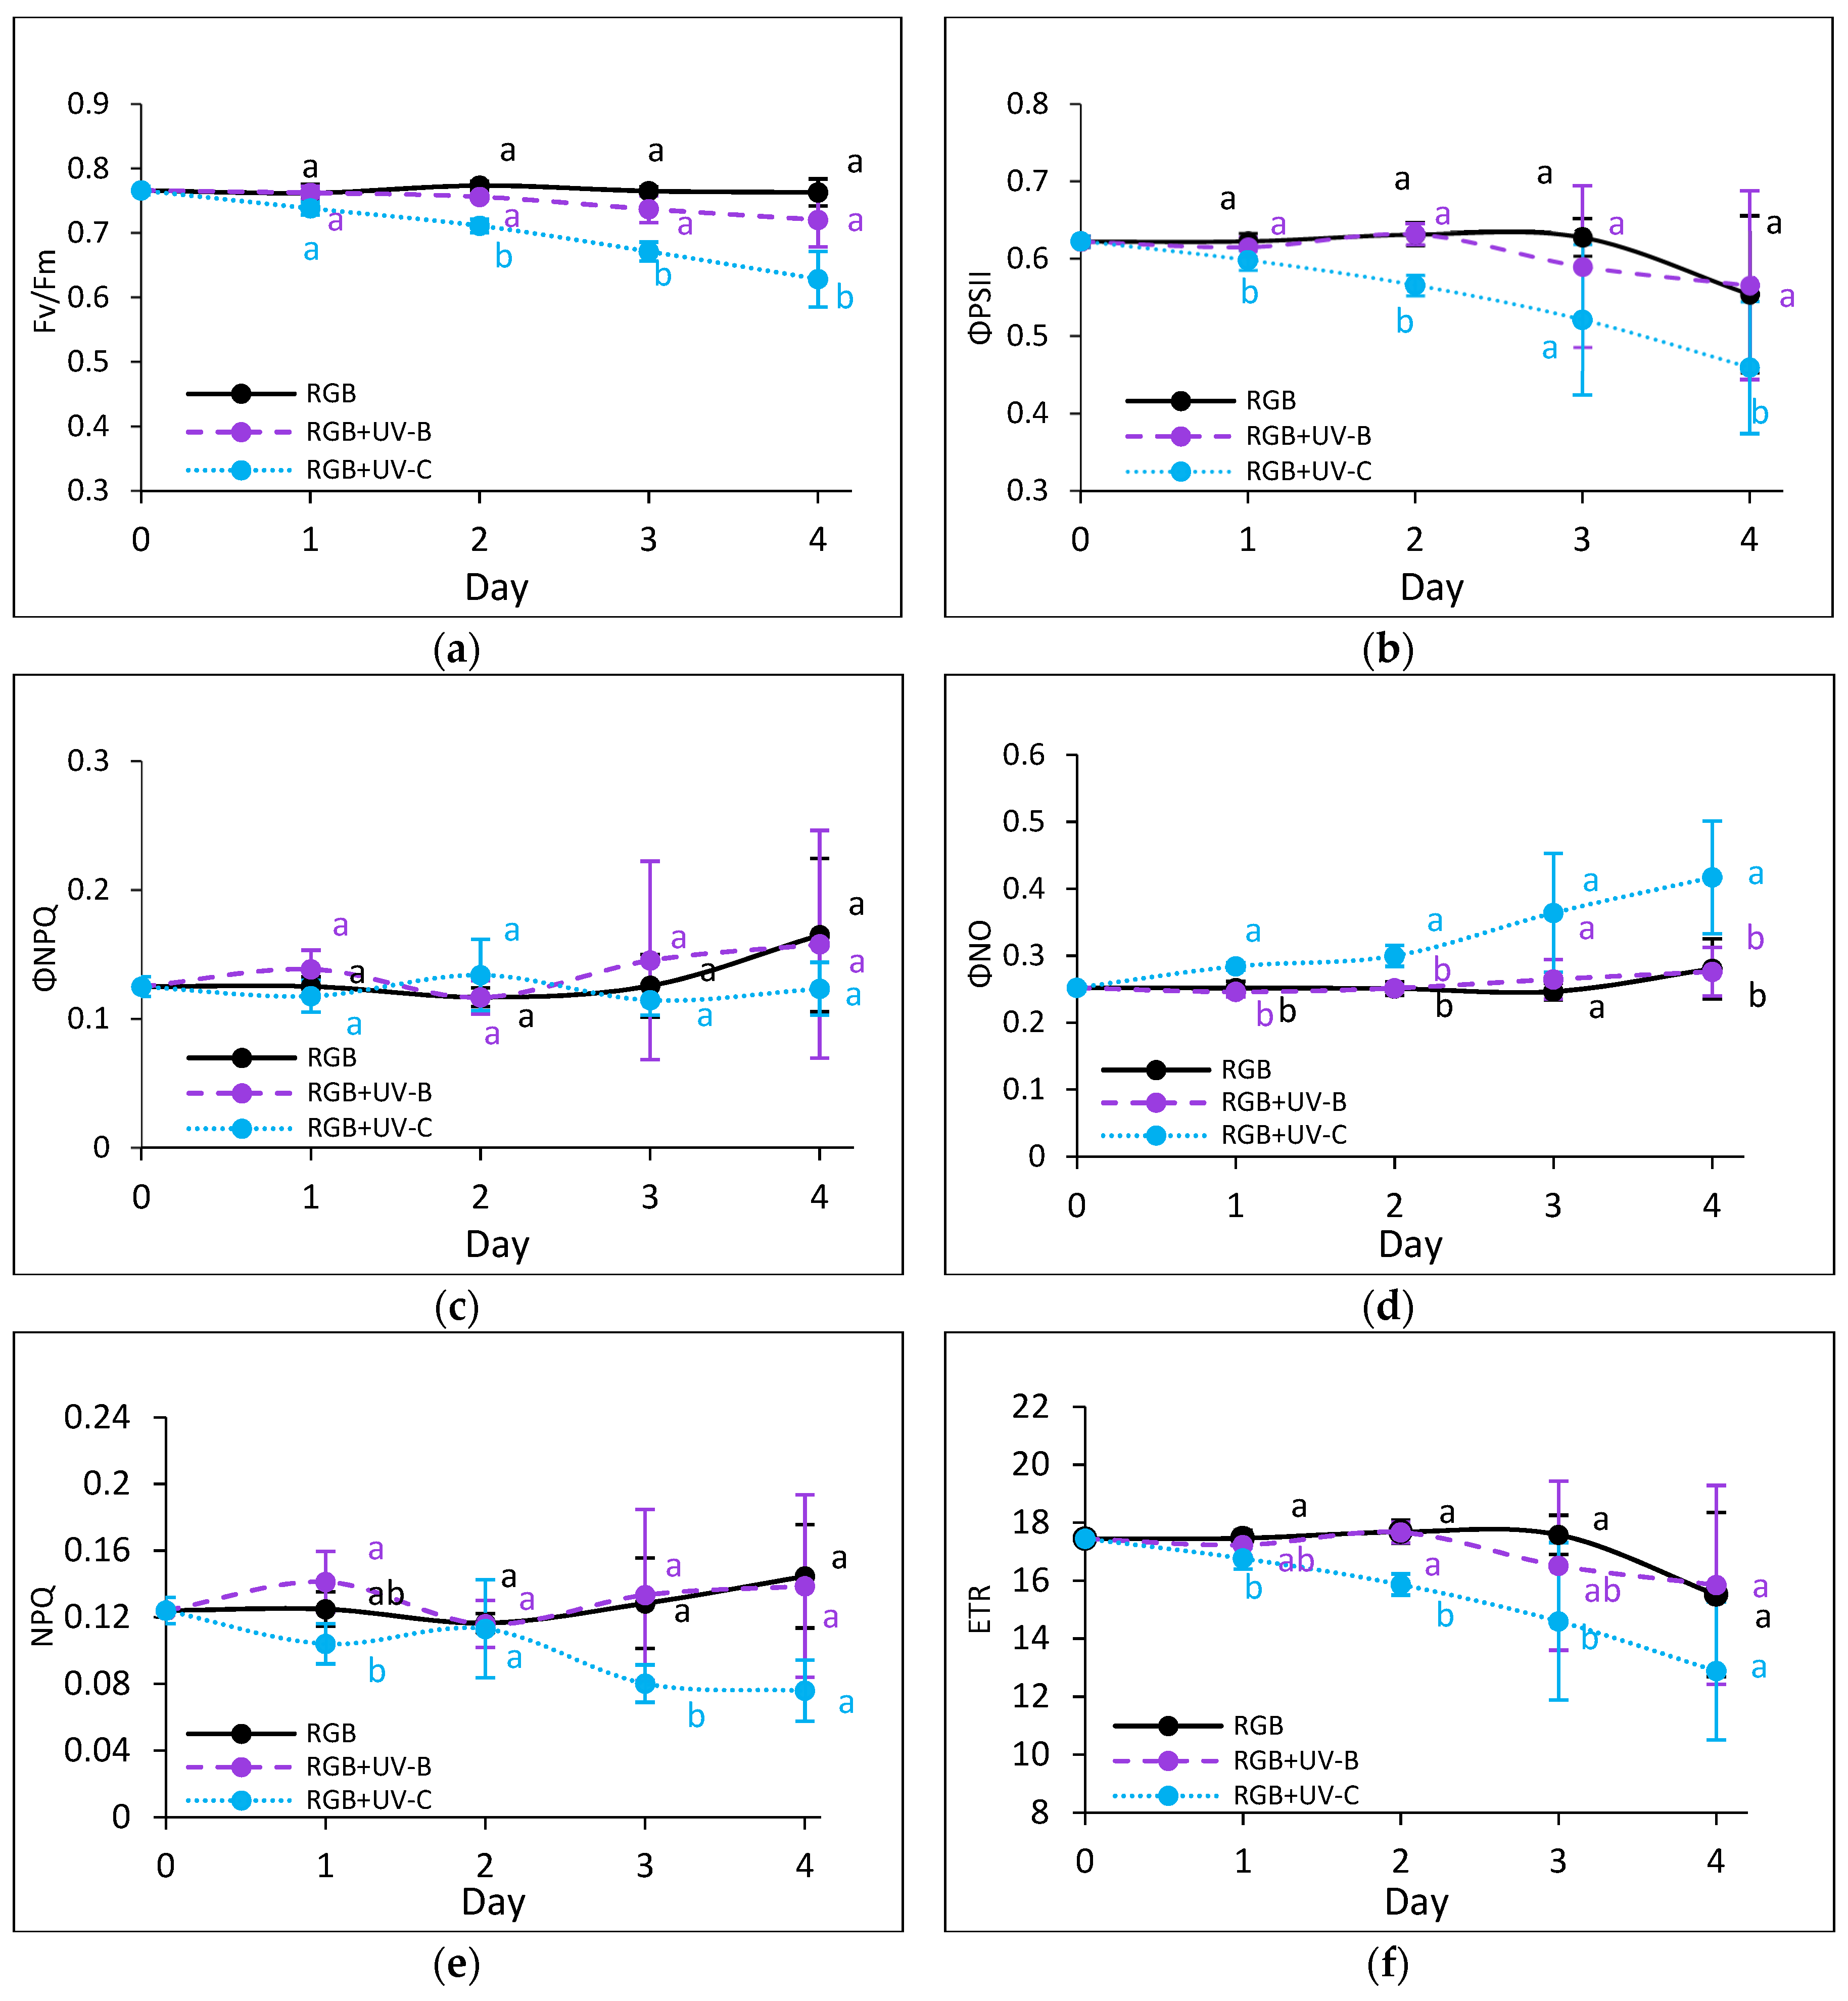
Figure 9.
Chlorophyll a fluorescence analysis of control (RGB), UV-B treated (RGB+UV-B) or UV-C treated (RGB+UV-C) plants of microgreens basil (Ocimum basilicum L.) cultivar with purple leaf (cv. Dark Opal) after short-term (1-4 day) progressive exposition to UV light. (a) the maximum quantum yield of PSII photochemistry (Fv/Fm), (b) effective quantum yield of PSII photochemistry (ΦPSII), (c) quantum yield of regulated (ΦNPQ) and (d) non-regulated energy dissipation (ΦNO), (e) non-photochemical quenching (NPQ) and (f) electron transport rate (ETR). The analyses were conducted with 55 μmol m–2 s–1 of blue (450 nm) actinic light. Each data point represents the average ± SD of six independent measurements (n = 6). Different letters (a, b) indicate significant differences between treatments at p = 0.05 with a Tukey’s HSD test.
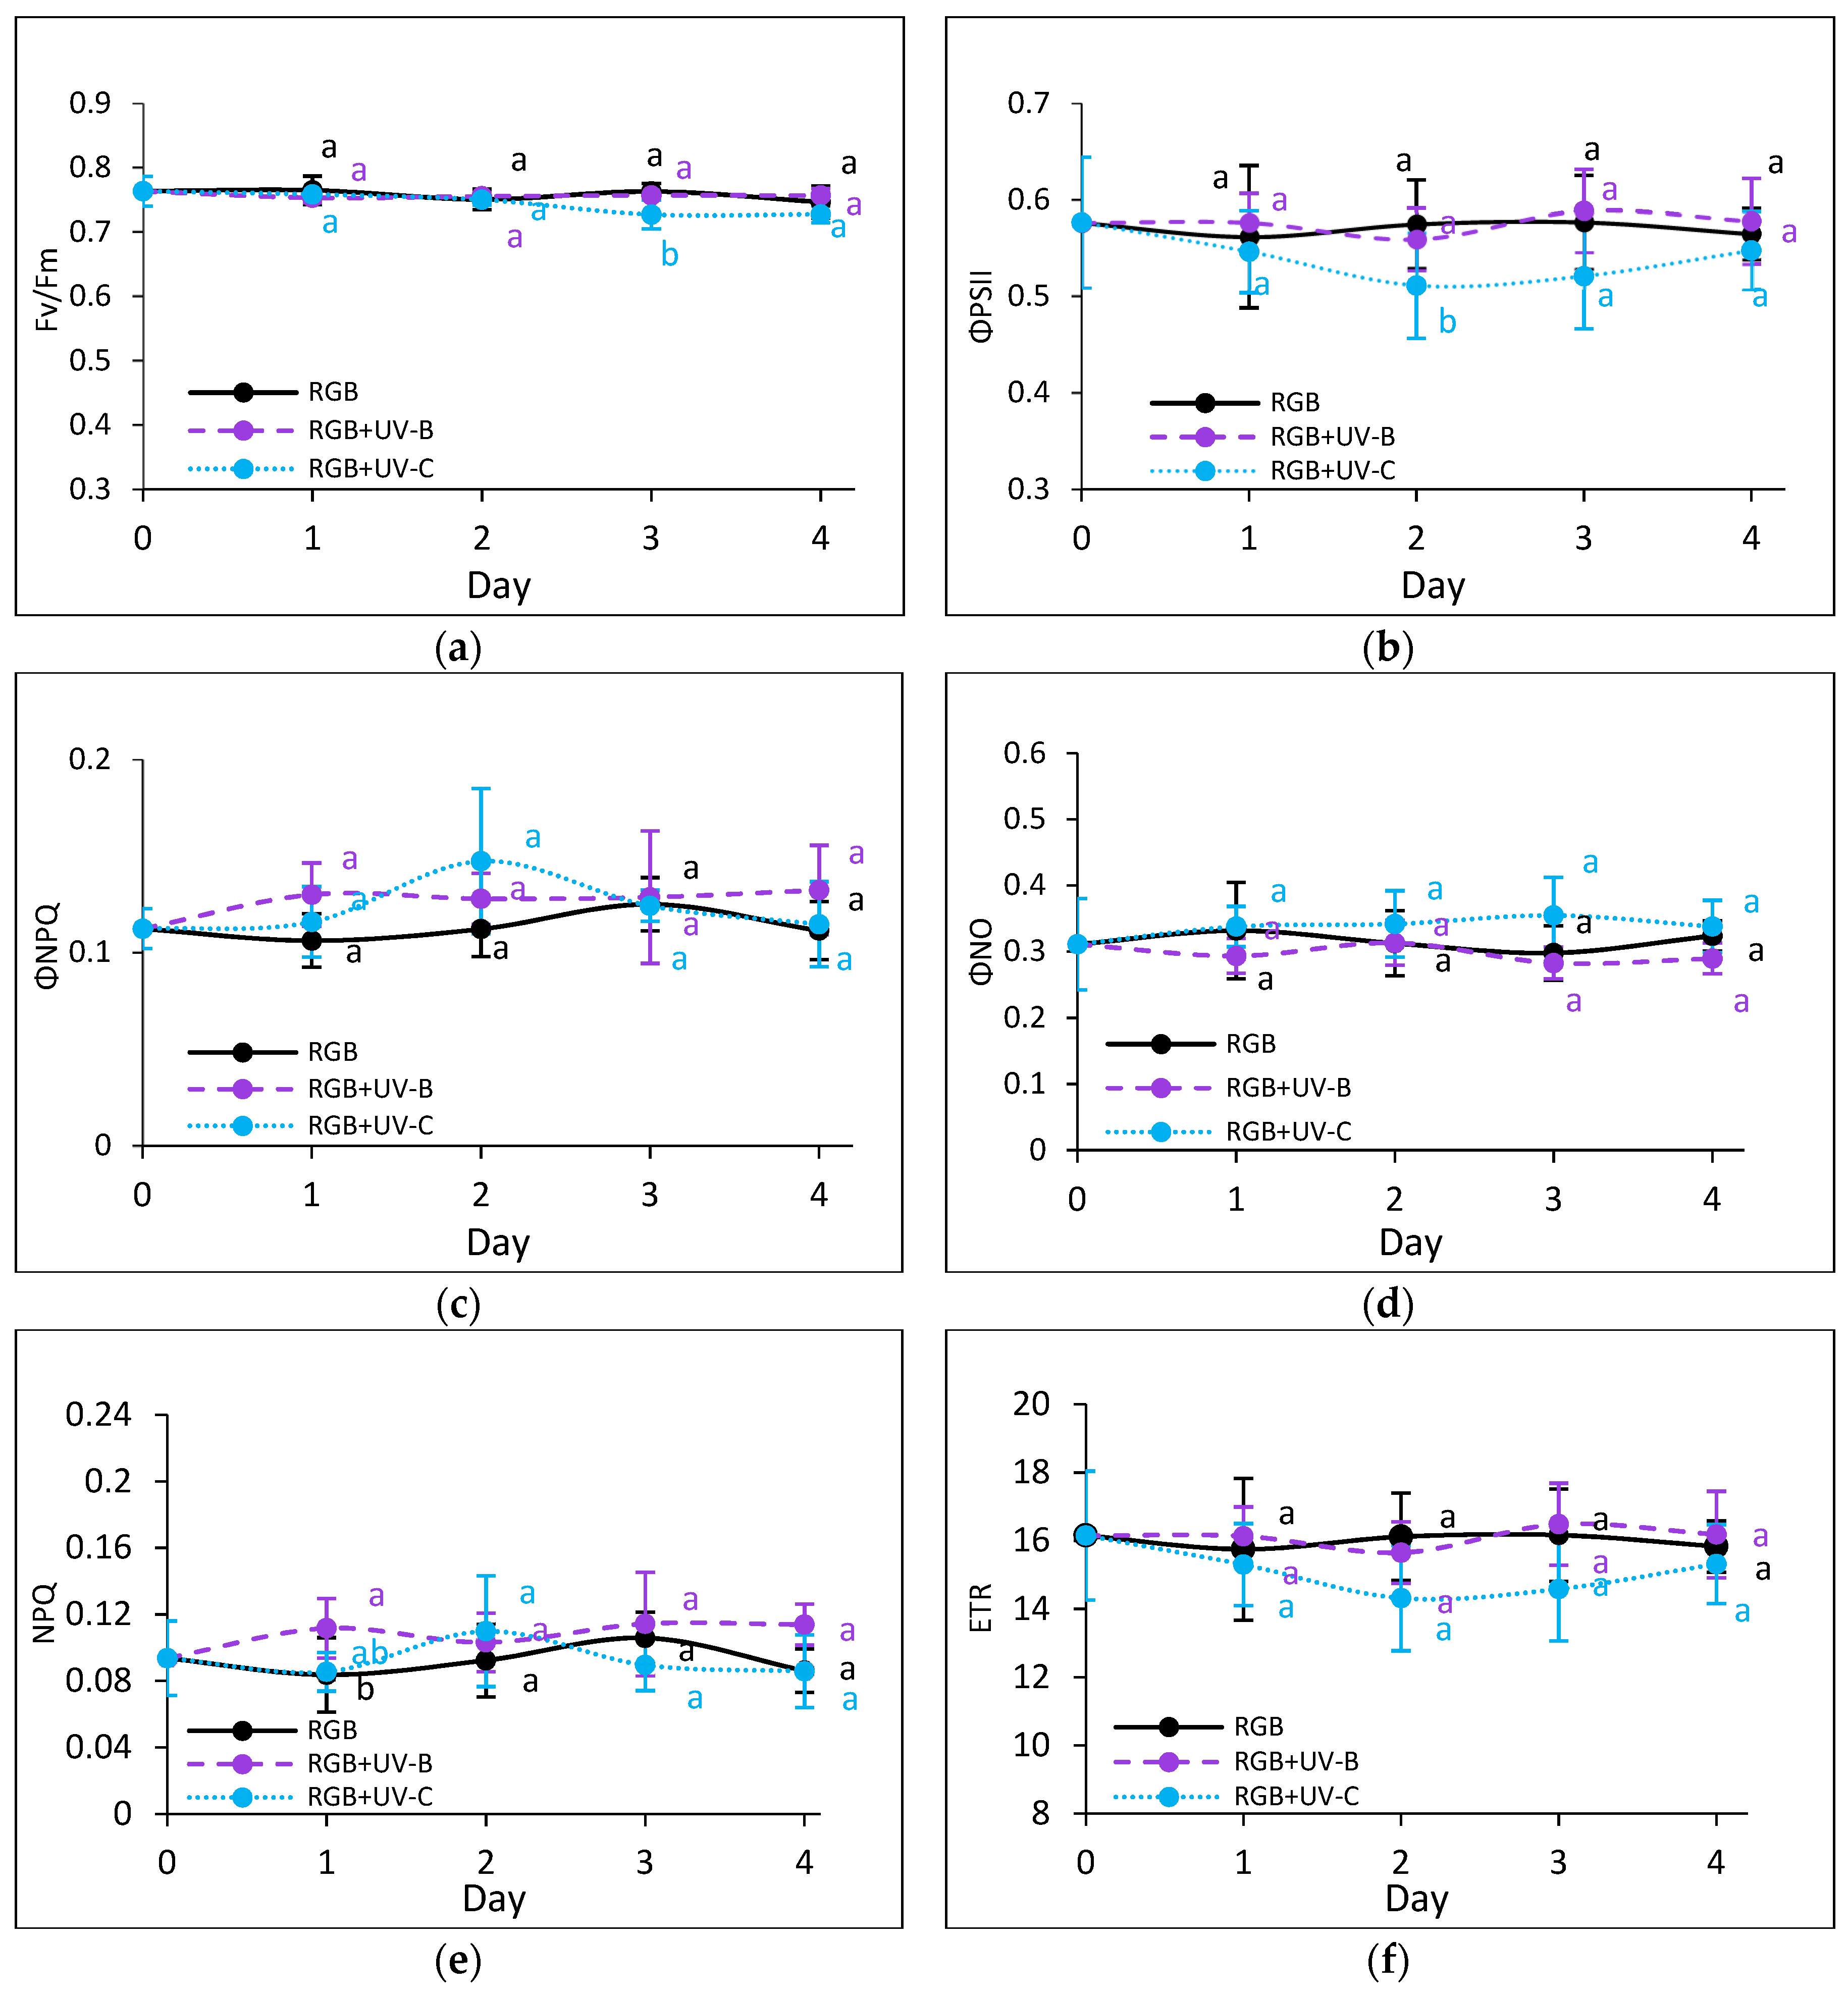
Figure 10.
The rate of lipid peroxidation assessed with thiobarbituric acid reactive substances (TBARS) level of control (RGB), UV-B treated (RGB+UV-B) or UV-C treated (RGB+UV-C) plants of microgreens basil (Ocimum basilicum L.) cultivars with (a) green (cv. Sweet Large) and (b) purple leaf (cv. Dark Opal) at 20 DAS (days after sowing), estimated with TBARS assay. Each bar represents the average ± SD of six independent measurements (n = 6). Different letters (a–c) indicate significant differences between treatments at p = 0.05 with a Tukey’s HSD test.
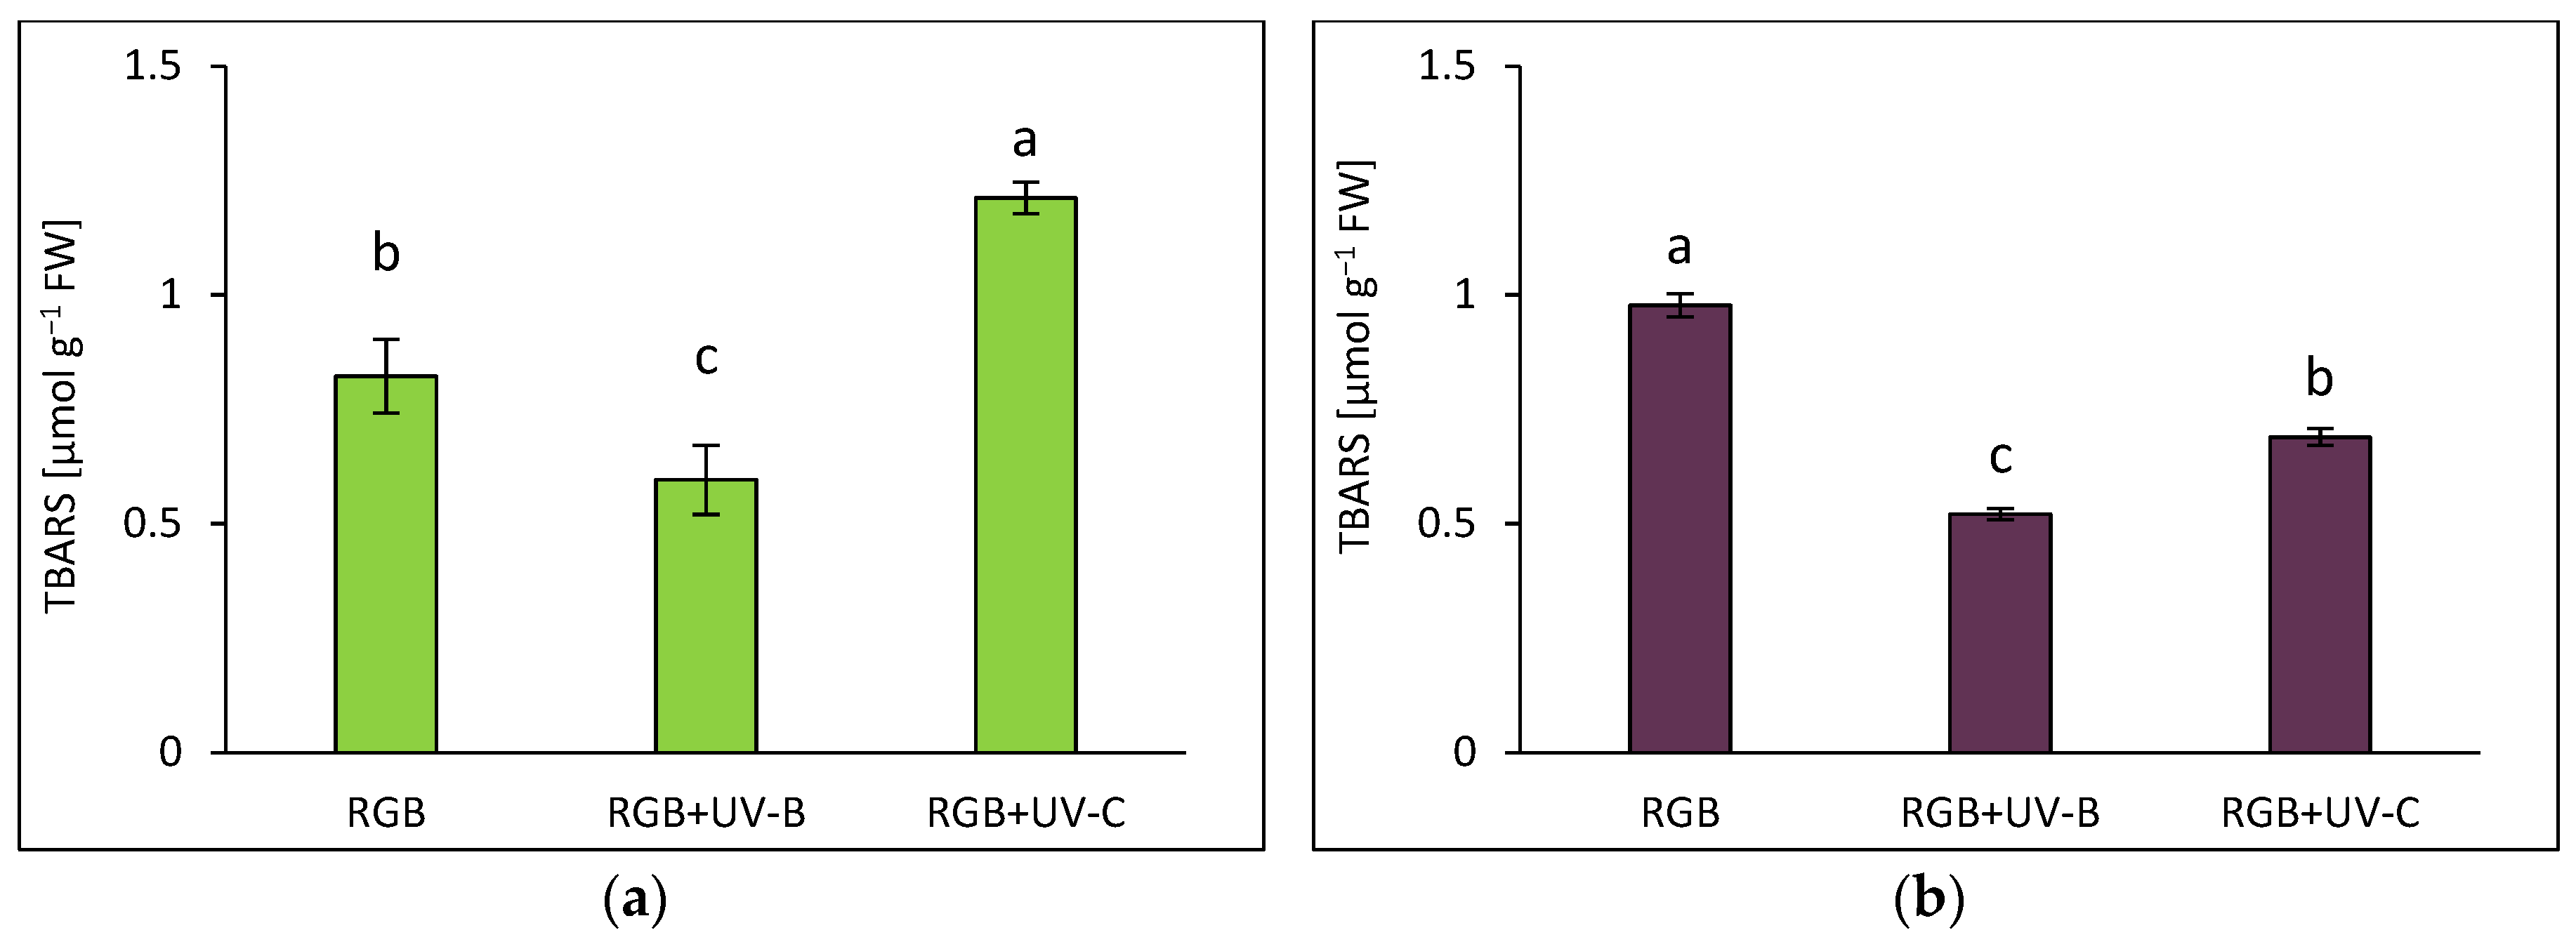
Figure 11.
Morphology of 20-DAS plants of microgreens basil (Ocimum basilicum L.) cultivar with green leaf (cv. Sweet Large, SL) grown under (a) RGB (C, control), (b) RGB+UV-B (UV-B supplemented, 311 nm) spectrum (c) RGB+UV-C (UV-C supplemented, 254 nm) spectrum.
Figure 11.
Morphology of 20-DAS plants of microgreens basil (Ocimum basilicum L.) cultivar with green leaf (cv. Sweet Large, SL) grown under (a) RGB (C, control), (b) RGB+UV-B (UV-B supplemented, 311 nm) spectrum (c) RGB+UV-C (UV-C supplemented, 254 nm) spectrum.
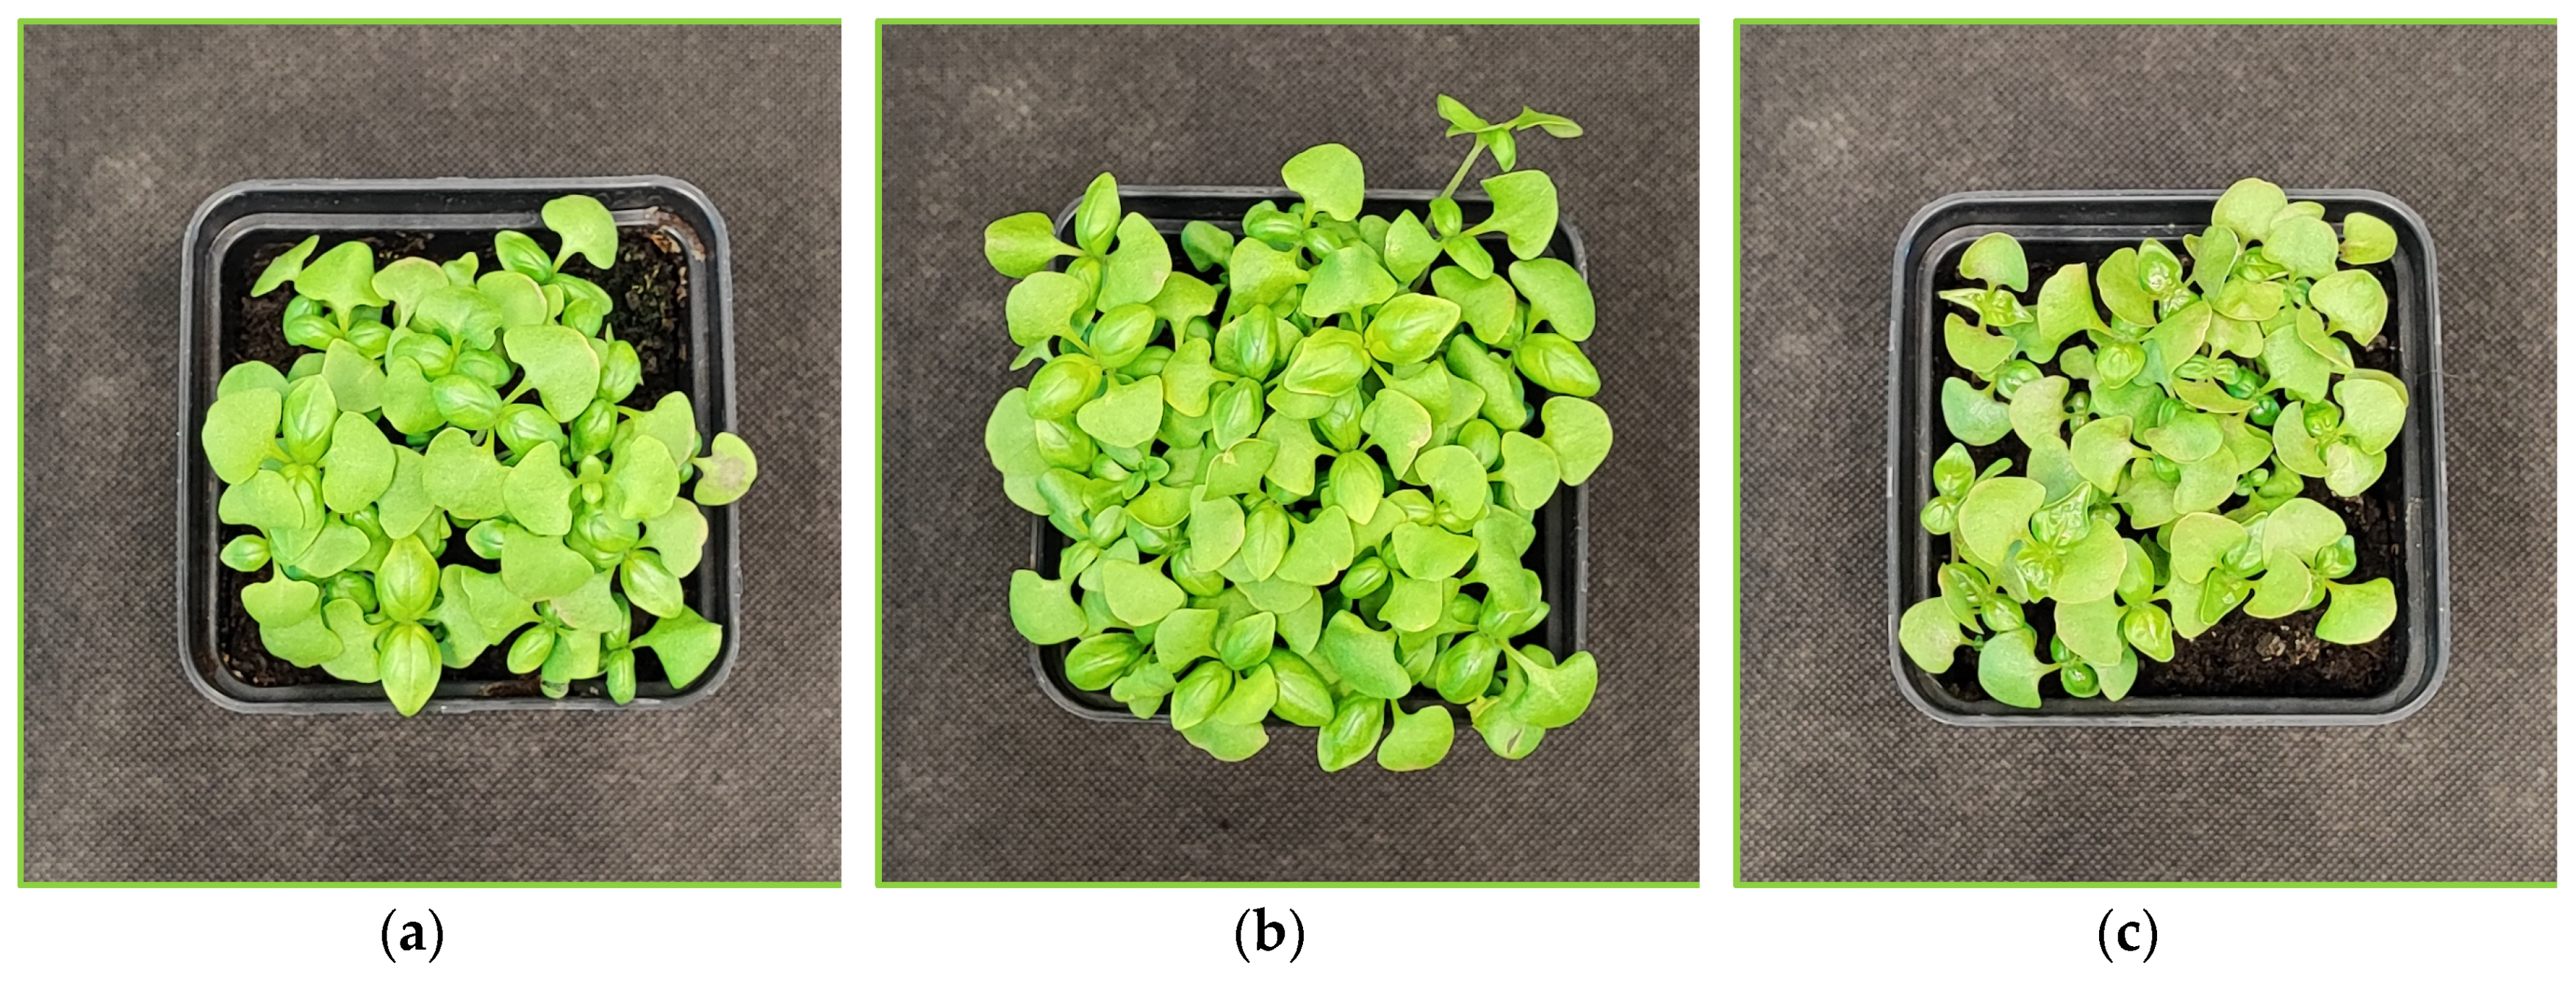
Figure 12.
Morphology of 20-DAS plants of microgreens basil (Ocimum basilicum L.) cultivar with purple leaf (cv. Dark Opal, DO) grown under (a) RGB (C, control), (b) RGB+UV-B (UV-B supplemented, 311 nm) spectrum (c) RGB+UV-C (UV-C supplemented, 254 nm) spectrum.
Figure 12.
Morphology of 20-DAS plants of microgreens basil (Ocimum basilicum L.) cultivar with purple leaf (cv. Dark Opal, DO) grown under (a) RGB (C, control), (b) RGB+UV-B (UV-B supplemented, 311 nm) spectrum (c) RGB+UV-C (UV-C supplemented, 254 nm) spectrum.
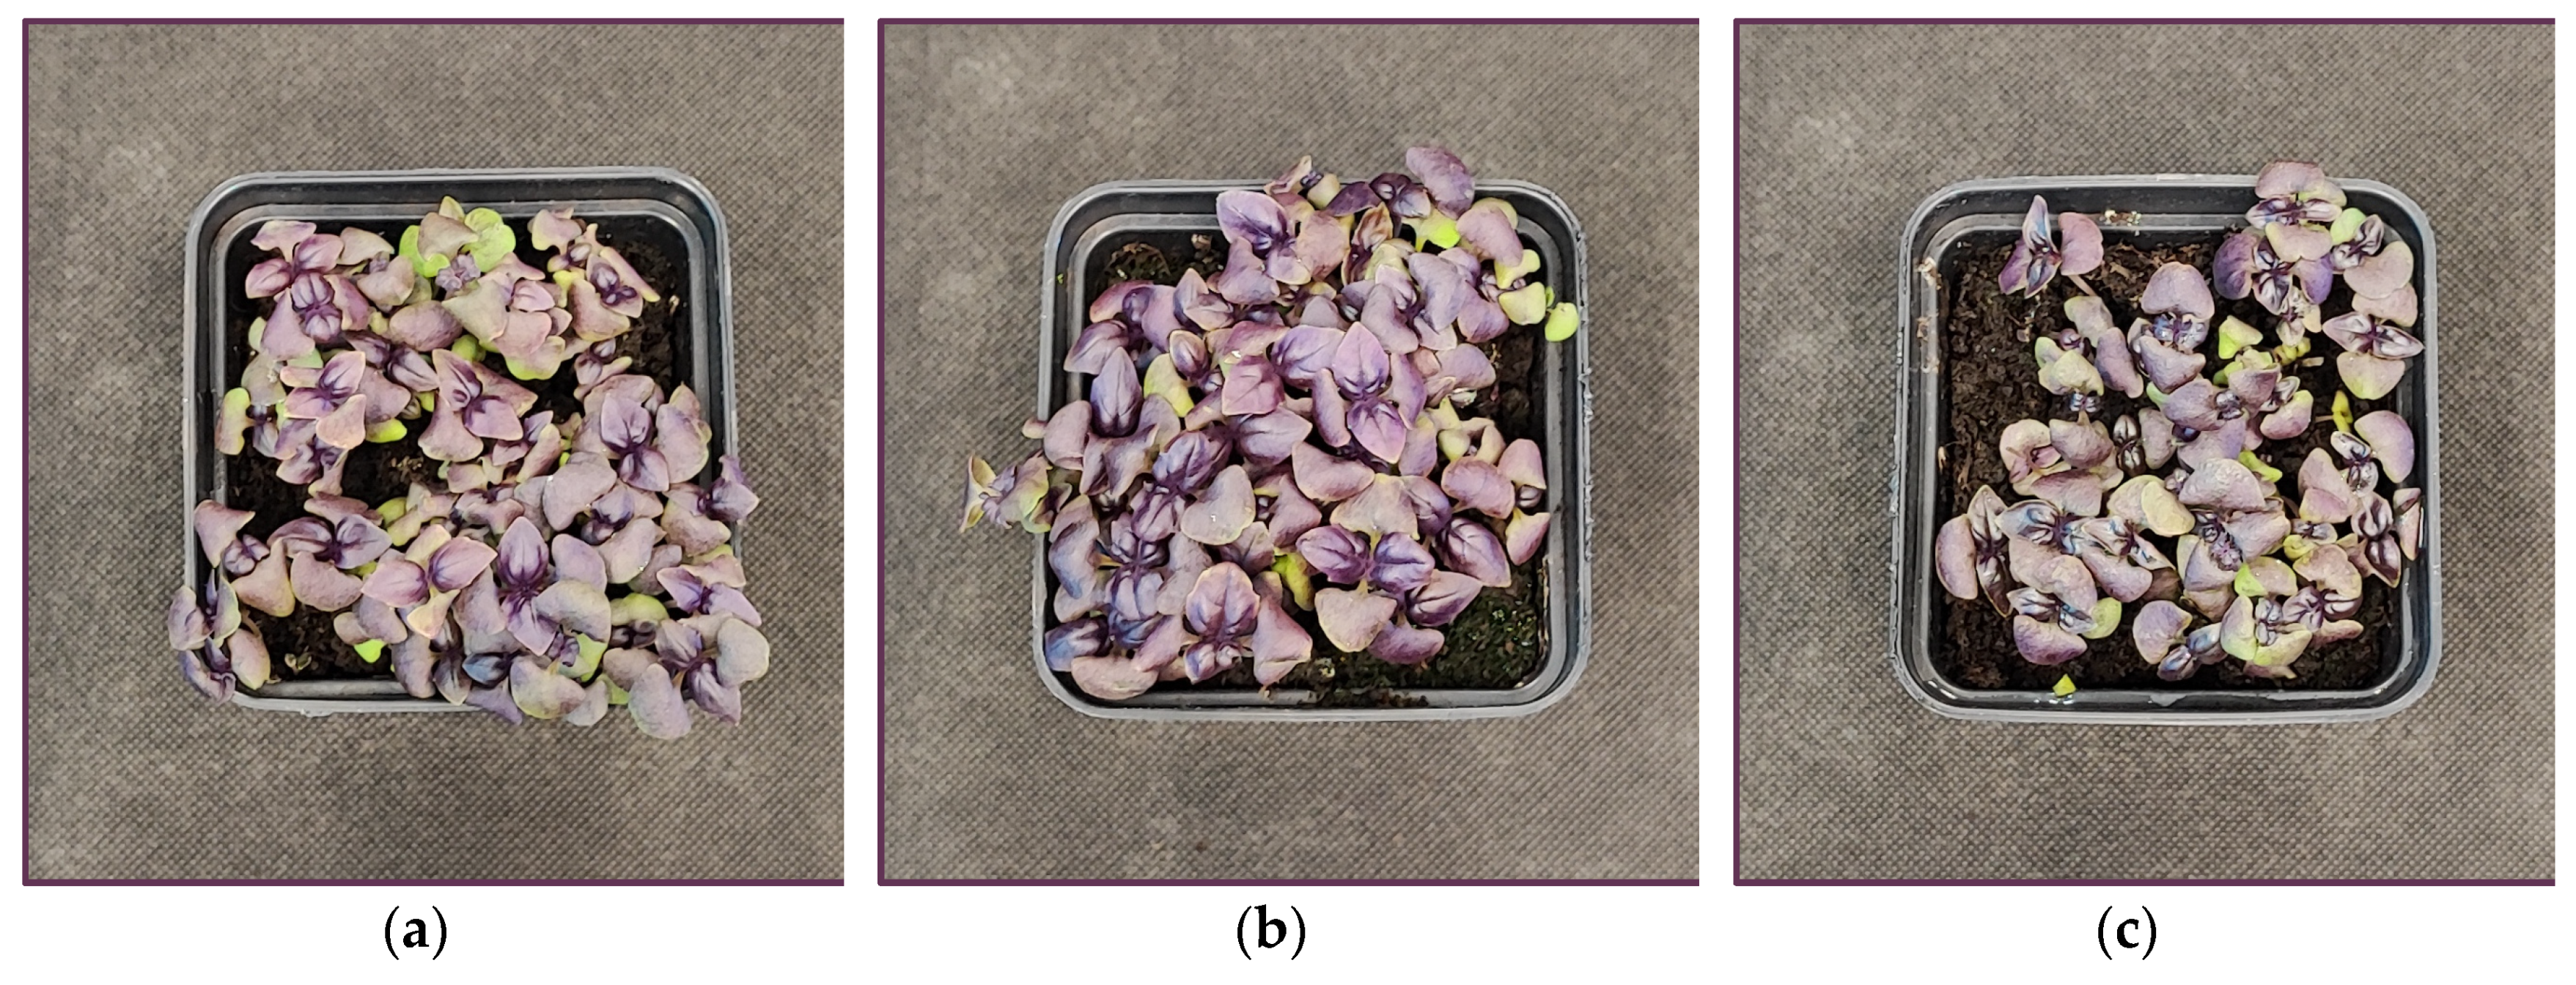
Figure 13.
Sensory attributes of leaf samples of 20-DAS plants of microgreens basil (Ocimum basilicum L.) cultivar with (a) green (cv. Sweet Large, SL) or (b) purple leaf (cv. Dark Opal, DO) grown under RGB (C, control), RGB + UV-B (UV-B supplemented, 311 nm), or RGB + UV-C (UV-C supplemented, 254 nm) spectrum. The attributes of the blinded fresh leaf samples: appearance, sweetness, bitterness, crispness, aftertaste and overall assessment were scored at a scale of 0–5 (where 5 is maximal, 3—neutral, and 0—is the least score) by 10 untrained consumers, aged 25–65 years (equal gender ratio). Each data point represents the average of ten independent tests (n = 10).
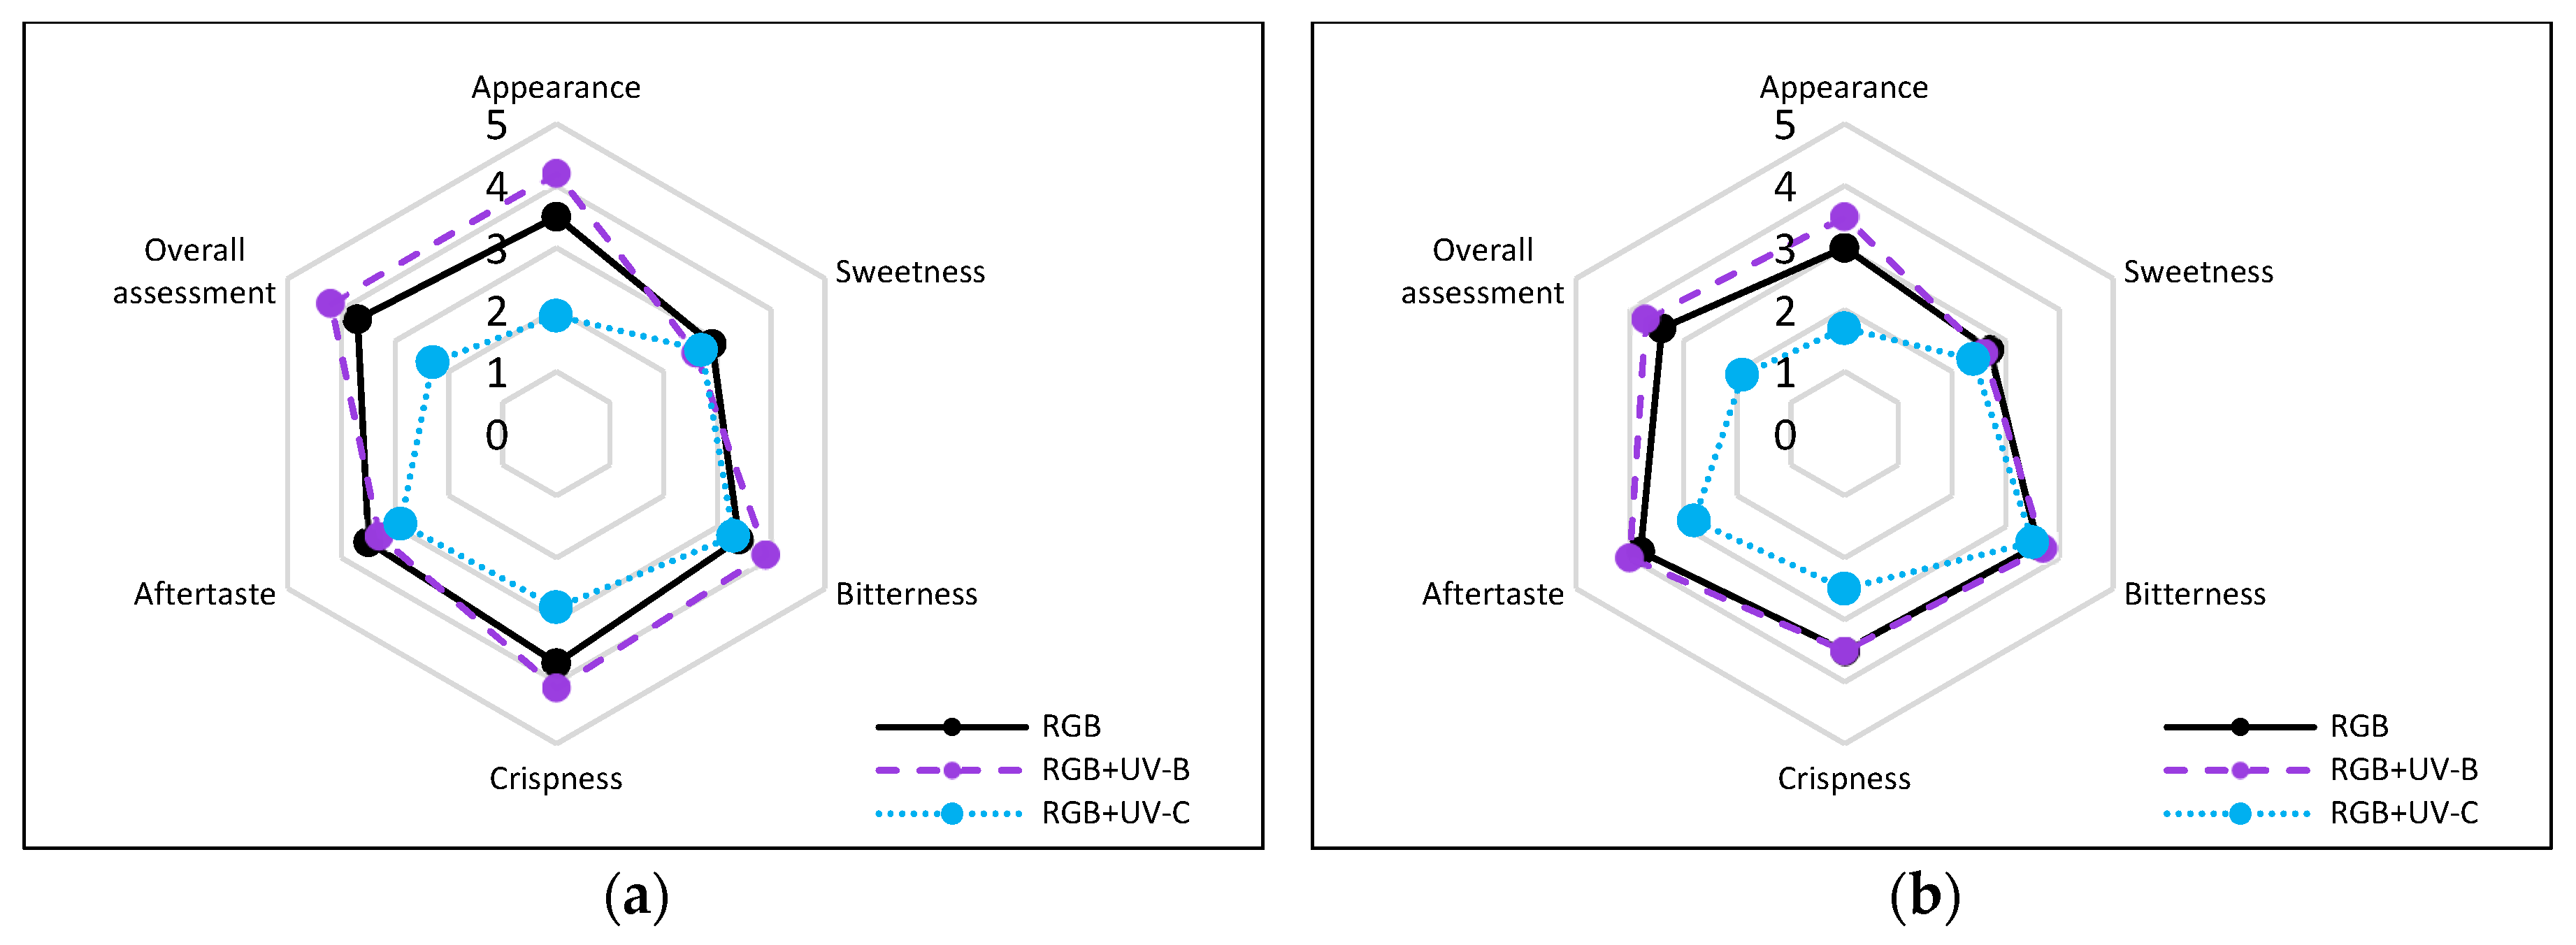
Figure 14.
The light spectra of lamps were recorded with a spectroradiometer at four locations and then averaged. All plants tested were grown at 200 µmol m–2 s–1 of RGB (red–green–blue) spectrum (R:G:B; 661 : 633 : 520 : 434 nm) solely (a, control) for 20 days or under RGB spectrum supplemented 4 days prior to harvest with increasing doses of UV-B (311 nm) (b) or UV-C (254 nm) (c).
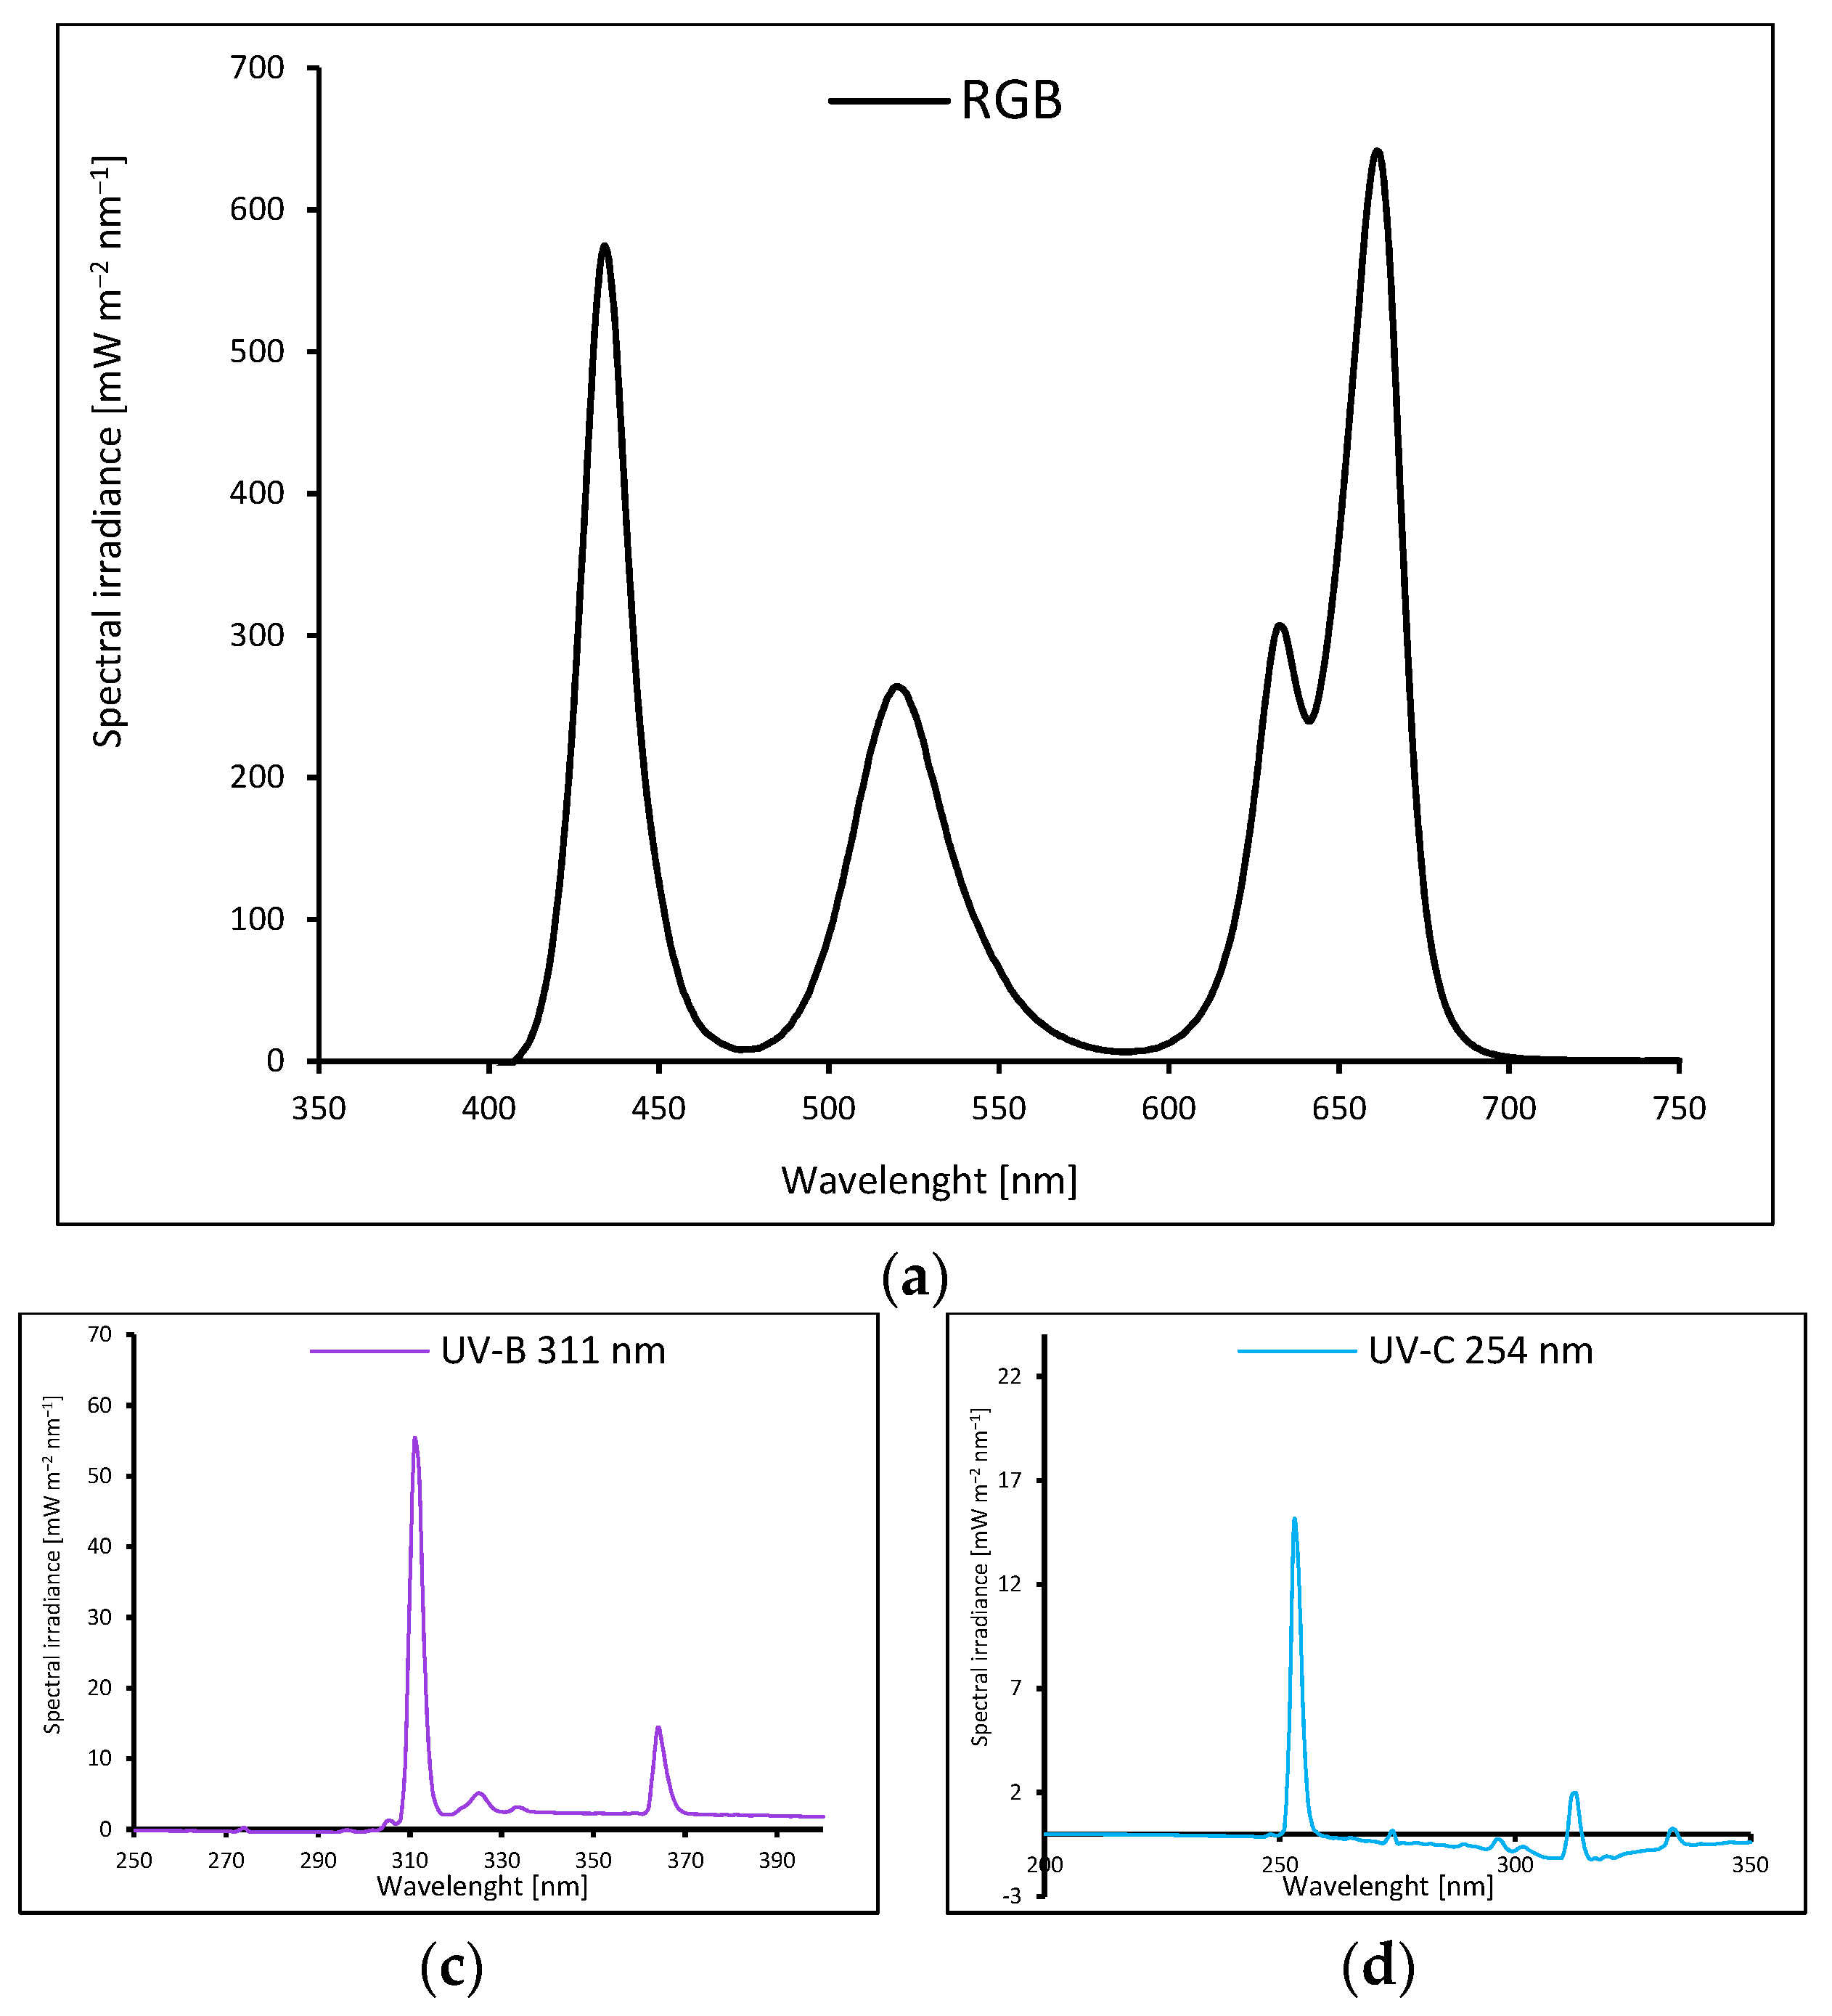

Table 1.
The abundance of photosynthetic pigments extracted with DMSO, the accumulation of soluble protein content (SLP) in leaves of microgreens basil (Ocimum basilicum L.) cv. Sweet Large under different light conditions.
Table 1.
The abundance of photosynthetic pigments extracted with DMSO, the accumulation of soluble protein content (SLP) in leaves of microgreens basil (Ocimum basilicum L.) cv. Sweet Large under different light conditions.
| Parameter | Treatment | ||
|---|---|---|---|
| RGB | RGB+UV-B | RGB+UV-C | |
| Chlorophyll a+b [mg g–1 FW] | 1.405 ± 0.013a | 0.878 ± 0.006b | 1.423 ± 0.005a |
| Chlorophyll a [mg g–1 FW] | 1.000 ± 0.010a | 0.617 ± 0.004c | 0.991 ± 0.004b |
| Chlorophyll b [mg g–1 FW] | 0.405 ± 0.003b | 0.261 ± 0.002c | 0.432 ± 0.002a |
| Chlorophyll a/b | 2.470 ± 0.006a | 2.364 ± 0.011b | 2.295 ± 0.012c |
| Carotenoids [mg g–1 FW] | 0.161 ± 0.001a | 0.113 ± 0.000c | 0.144 ± 0.001b |
| Chlorophyll a+b/Carotenoids | 8.732 ± 0.006b | 7.799 ± 0.034c | 9.905 ± 0.054a |
| Soluble leaf proteins [mg g–1 FW] | 60.32 ± 0.83c | 74.52 ± 0.33b | 78.09 ± 0.90a |
The presented values are means of six (or four for SLP) replicates ± SD. Different letters (a–c) in the same row indicate significant differences between treatments at p = 0.05 with a Tukey’s HSD test. FW - fresh weight.
Table 2.
The abundance of photosynthetic pigments extracted with DMSO, the accumulation of soluble protein content (SLP) in leaves of microgreens basil (Ocimum basilicum L.) cv. Dark Opal under different light conditions.
Table 2.
The abundance of photosynthetic pigments extracted with DMSO, the accumulation of soluble protein content (SLP) in leaves of microgreens basil (Ocimum basilicum L.) cv. Dark Opal under different light conditions.
| Parameter | Treatment | ||
|---|---|---|---|
| RGB | RGB+UV-B | RGB+UV-C | |
| Chlorophyll a+b [mg g–1 FW] | 1.384 ± 0.008b | 0.786 ± 0.003c | 1.419 ± 0.007a |
| Chlorophyll a [mg g–1 FW] | 0.939 ± 0.006b | 0.526 ± 0.002c | 0.966 ± 0.005a |
| Chlorophyll b [mg g–1 FW] | 0.444 ± 0.003b | 0.261 ± 0.001c | 0.453 ± 0.003a |
| Chlorophyll a/b | 2.115 ± 0.003b | 2.015 ± 0.005c | 2.132 ± 0.009a |
| Carotenoids [mg g–1 FW] | 0.181 ± 0.001b | 0.089 ± 0.001c | 0.188 ± 0.001a |
| Chlorophyll a+b/Carotenoids | 7.646 ± 0.026b | 8.805 ± 0.025a | 7.553 ± 0.037c |
| Soluble leaf proteins [mg g–1 FW] |
127.74 ± 0.67a | 109.36 ± 0.22b | 106.26 ± 0.86c |
The presented values are means of six (or four for SLP) replicates ± SD. Different letters (a–c) in the same row indicate significant differences between treatments at p = 0.05 with a Tukey’s HSD test. FW - fresh weight.
Table 3.
The schedule of supplemental UV-B and UV-C light treatment.
| Treatment, Wavelength Peak (nm) | Daily Time Exposure (min), Diurnal Time | Total Time (h) | Total Irradiance (W m−2) |
Irradiance (PAR) (W m−2) |
Cumulative Dose (kJ m−2) |
|||
|---|---|---|---|---|---|---|---|---|
| Day 1 | Day 2 | Day 3 | Day 4 | |||||
| UV-B, 311 |
15 12.00–12.15 pm |
30 12.00–12.30 pm |
60 12.00–13.00 pm |
120 12.00–14.00 pm |
3.75 | 1.1572 | 0.253 | 15.622 |
| UV-C, 254 | 7,5 12.00–12.08 pm |
15 12.00–12.15 pm |
30 12.00–12.30 pm |
60 12.00–13.00 pm |
1.875 | 0.8901 | 0.177 | 6.008 |
UV-B states for ultraviolet B light; UV-C states for ultraviolet C light; PAR states for photosynthetically active radiation.
Disclaimer/Publisher’s Note: The statements, opinions and data contained in all publications are solely those of the individual author(s) and contributor(s) and not of MDPI and/or the editor(s). MDPI and/or the editor(s) disclaim responsibility for any injury to people or property resulting from any ideas, methods, instructions or products referred to in the content. |
© 2024 by the authors. Licensee MDPI, Basel, Switzerland. This article is an open access article distributed under the terms and conditions of the Creative Commons Attribution (CC BY) license (http://creativecommons.org/licenses/by/4.0/).
Copyright: This open access article is published under a Creative Commons CC BY 4.0 license, which permit the free download, distribution, and reuse, provided that the author and preprint are cited in any reuse.


