
Submitted:
24 July 2025
Posted:
25 July 2025
You are already at the latest version
Abstract
Controlled-release urea (CRU) offers potential for improving nitrogen use efficiency (NUE) in intensive maize systems, but comprehensive evaluations of its agronomic, physiological, and environmental impacts remain limited. Through a two-year field experiment in the North China Plain comparing three CRU types (polymer/sulfur-coated PSCU, thermosetting polymer-coated TCU, and polymer-coated PCU) with conventional urea at five N rates (0-280 kg N ha–1), we demonstrate that CRU at 180 kg N ha–1 maintained high maize yields (13.9 Mg ha–1) while reducing N inputs by 12-19% and improving NUE by 37.6%, with TCU showing superior performance. The significant increase in Pn by 7.9–32.7% and Ci by 20.6–40.0% under CRU during the silking and milking stages. The CRU treatments also sustained optimal levels of hormones, N metabolism enzymes, sucrase and urease activities. Compared to common urea, life cycle assessment indicates that CRU has achieved a 47.5% reduction in reactive nitrogen losses, primarily due to lower ammonia volatilization and nitrate leaching. Additionally, when compared to common urea, CRU has resulted in a 18.7% decrease in greenhouse gas emissions. Economically, CRU outperformed common urea, with TCU providing the highest net benefit through yield stability and labor savings. These findings establish TCU at 180 kg N ha–1 as an optimal strategy for sustainable intensification of maize production in the NCP, balancing productivity, profitability and environmental protection.
Keywords:
controlled-release urea
; physiology
; soil nitrogen retention
; environmental sustainability
1. Introduction
Maize (Zea mays L.) is one of the primary food crops and plays a crucial role in ensuring food security in China [1]. To achieve high yields, excessive nitrogen (N) fertilizer exceeding crop demand are frequently applied in the intensive crop production of the North China Plain (NCP) [2]. This practice not only elevates production costs but also triggers significant environmental degradation, including soil acidification, reduced microbial diversity [3,4], and increased reactive N (Nr) pollution [5]. A fundamental challenge driving these issues is the temporal mismatch between the rapid N release of conventional urea and the phased N demand of maize [6], leading to both agronomic inefficiency and ecological damage.
Controlled-release urea (CRU), employing polymer coatings (PSCU, PCU) or thermosetting materials (TCU) [7,8], offers a promising solution by synchronizing N availability with critical maize growth stages. Notably, CRU can maintain yields even at application rates 30% lower than conventional urea [9], often enhancing plant growth vigor [10]. More importantly, CRU provides a more continuous N supply, moderating soil urease activity compared to the sharp fluctuations induced by conventional urea [11], thereby potentially enhancing soil N retention. This capacity of CRU to coordinate maize N physiology with soil N retention processes is central to its benefits. However, determining the optimal CRU rate for yield maximization in the NCP’s cinnamon soils and elucidating the underlying physiological mechanisms, particularly regarding hormonal regulation and source-sink relationships, remain key research gaps.
In the NCP, intensive precipitation combined with excessive urea application commonly leads to substantial nitrate (NO₃⁻-N) leaching, reducing nitrogen use efficiency (NUE) and threatening groundwater quality [12,13]. CRU has demonstrated potential to mitigate multiple Nr loss pathways, including reduced NO₃⁻-N leaching [14], NH₃ volatilization [15], and N₂O emissions [16], supporting its recommendation for environmental risk reduction [17]. Nevertheless, reported effectiveness can vary [18,19], and crucially, most studies focus on single loss pathways. A comprehensive assessment of integrated Nr losses and greenhouse gas (GHG) emissions across the soil-plant-atmosphere continuum under CRU management is lacking. Life-cycle assessment (LCA) is a valuable tool for identifying optimal strategies that minimize environmental impacts, yet its application to evaluate CRU’s holistic environmental performance requires further investigation to inform policy and practice.
Therefore, to bridge these knowledge gaps and advance the pathway for balancing high maize yield and environmental sustainability, a consecutive two-year field experiment was conducted in the NCP’s cinnamon soils. This study compared common urea with three types of CRUs applied at three N rates. The specific objectives were: (1) To investigate the responses of photosynthetic characteristics, plant hormone dynamics, N metabolism enzymes, and soil enzyme activity to different N sources and rates, elucidating their synergistic effects and physiological coordination in enhancing yield and NUE; (2) To comprehensively evaluate Nr losses (leaching, volatilization, denitrification) and GHG emissions, alongside economic benefits, to establish optimal N management strategies that balance agronomic productivity with environmental sustainability.
2. Materials and Methods
2.1. Experiment site
The field experiment was conducted during the growing seasons of 2019 and 2020 (mid-June to early October) at the Zhangqiu Experimental Station of the Shandong Academy of Agricultural Sciences in Jinan City, Shandong Province, China (36°43′N, 117°32′E). The experimental area is situated in a warm-temperate, sub-humid continental monsoon zone with cold winters and hot summers. It is a representative site for agricultural production in the NCP, with a double cropping system of winter wheat-summer maize. Daily mean temperature, solar radiation, and precipitation during the two growing seasons were presented in Figure 1. Accumulated growing degree days with a base temperature of 10 °C during the two growing seasons were 1649 °C in 2019 and 1571 °C in 2020 and total precipitation was 755 mm in 2019 and 461 mm in 2020. In addition, 50 mm of irrigation were applied after sowing each year. The characteristics for the initial top soil layer (0–20 cm) were as follows: soil pH (1:2.5 w/v in water) 8.0, organic matter content 13.8 g kg–1, total soil N 0.62 g kg–1, available phosphorus (Olsen P) 35.0 mg kg–1, available potassium (NH4OAc-K) 117.0 mg kg–1.
2.2. Experiment design and crop management
The maize cultivar used in this study was Denghai605. All treatments had an equal plant density of 75000 plants ha–1 with a row spacing of 60 cm and a plant spacing of 22.2 cm. The study used a completely random design with three replicates (33.6 m2 plot−1). Five N application rates, as urea, were used as follows: 0, 126, 180, 234, 280 kg N ha−1, recorded as N0, N126, N180, N234 and N280, respectively. Generally, N180 was the optimal N rate based on local yield levels and expert recommendations. N126 and N234 were representative of 70% and 130% of the optimal rate (N180), respectively. N application was split as twice with 40% of total N being applied as the base fertilizer while the remaining 60% was split-applied as the topdressing at 10-leaf stage. N280 treatment was set to correspond with the local farmer’s N management, with a preplanting application of 187 kg N ha−1 and the topdressing of 93 kg N ha−1 at 10-leaf stage. Based on the established optimal N rate (180 kg N ha–1), three kinds of CRU including PSCU (≥35% N), TCU (≥44% N) and PCU (≥43% N) were applied with one-off application as basal fertilizer. The three used CRUs had two-month release longevity and was provided by Kingenta Ecological Engineering Group Co., Ltd. (Linshu, Shandong, China). In addition, 60 kg of P2O5 ha−1 (in the form of superphosphate) and 90 kg of K2O ha−1 (in the form of potassium sulphate) were applied. All the fertilizers were broadcast and then incorporated into the upper 0–15 cm of the soil by rotary tillage before sowing. After the fertilizers were applied, the field plots were immediately irrigated. The irrigation rate was based on the soil water content.
2.3. Measurements and calculation of evaluation indicators
2.3.1. Plant and soil sampling
At maturity, two rows of plants in the middle of each plot were harvested to determine the grain yield (at 14% moisture). Sub-samples of three-plant samples were collected and separated into grain and straw samples. All samples were oven-dried at 75 °C to determine the dry weight. Plant samples were ground with a stainless-steel grinder (RT-02B, Taiwan, China). N concentration in samples was determined using a CN analyzer (vario Macro cube, Elementar, Hanau, Germany). During the harvest period, 0–20 cm soil layer was used to analyze physical and chemical properties.
2.3.2. Physiological characteristics and soil enemy activities measurements
Photosynthetic parameters including net photosynthetic rate (Pn), transpiration rate (Tr), stomatal conductance (gs), and intercellular CO2 concentration (Ci) were measured using a portable LI-6400 photosynthesis system (LI-COR Inc., Lincoln, NE, United States) at 09:00-11:00 on a fine day. The ear leaves at silking and milking stage were selected for measurement in 2020. The photosynthetically active radiation, temperature, and CO2 concentration during measurement collection were set at 600 µmol m−2 s−1, 25 °C, and 380 µmol mol−1, respectively. In addition, leaf samples were taken randomly at silking and milking stage for each treatment in 2020 to determine different hormones contents, including salicylic acid (SA), gibberellic acid (GA3), indoleacetic acid (IAA), and abscisic acid (ABA). Four ear leaves each treatment were collected, and kept at -20 °C until their biochemical analyses were performed. Analyses were performed by the Plant Hormone Quantifying Service (IBMCP-UPV) in a Thermo Scientific™ Q Exactive™ Hybrid Quadrupole-Orbitrap Mass Spectrometer (LC-MS/MS HR). Frozen samples taken at silking were used to determine nitrate reductase (NR), glutamine synthetase (GS), glutamate oxaloacetate transaminase (GOT), and glutamate pyruvate transaminase (GPT) activity by enzyme immunoassay kits [20]. Soil samples were collected from a depth of 0–20 cm at maturity stage, which were kept at -20°C until analyses were performed. Soil urease was determined by sodium phenol-sodium hypochlorite colorimetric method.
2.3.3. N release rate of CRU
Fertilizer bag-burying method was adopted to determine the N release rate of CRU [21]. The N fertilizers (PSCU, TCU and PCU) were weighed to about 10.0 g and packed into 100 mu nylon mesh bags (12 cm×8 cm in length) and sealed by plastic sealing machine. On the first day after sowing, these bags were buried in a depth of 15 cm soil layer and taken out regularly (4 bags of each fertilizer each time). The bags were rinsed in the laboratory with distilled water, then placed in the oven at 60 °C to a constant weight. The loss of weight was assumed as the release rate of CRU.
2.3.4. Reactive nitrogen losses and GHG emission calculations
The Nr losses were divided into three sources: N leaching, NH3 volatilization and N2O emission. The total Nr losses were estimated according to Zhang et al. [8] as follows:
N leaching = 18.9 + 0.35 × N rate (Urea)
N leaching = 25.0 + 0.19 × N rate (CRU)
N2O emission = 0.50 + 0.0117 × N rate (Urea)
N2O emission = 0.14 + 0.0076 × N rate (CRU)
NH3 volatilization =5.3 + 0.088 × N rate (Urea)
NH3 volatilization =5.3 + 0.043 × N rate (CRU)
Nr losses = N leaching+N2O emission + NH3 volatilization
The total GHG emissions, including CO2, CH4 and N2O during the whole life cycle of crop production, consisted of three components: those during N fertilizer application, including direct and indirect N2O emissions, which can be calculated based on the empirical Nr losses model mentioned above; those during N fertilizer production and transportation; and those during the production and transportation of P and K fertilizers and pesticides to the farm gate, and diesel fuel use in farming operations such as sowing, tillage and harvesting [17,22]. The 100-year global warming potentials of CH4 and N2O are 25 and 298 times the intensity of CO2 on a mass basis, respectively [23]. The GHG emissions were calculated using the following equations:
GHG emissions = GHGN + Total N2O × 44/28 × 298 + GHGothers
Total N2O = N2O direct +1% × NH3 volatilization +2.5% × N leaching
GHGN represents agricultural N fertilizer input. GHGothers represents the GHG emission potential of per kg of agricultural material input produced and transported, as shown in Table S1. Application rates of agricultural materials input, as shown in Table S2.
System boundaries were defined as the periods of the life cycle from the production of inputs (such as fertilizers and pesticides), delivery of the inputs to the farm gates, farming operations and the crop harvesting period. Using the emission factors for all agricultural inputs, we calculated total global warming potential per unit area, expressed as kilograms of kg CO2 eq ha–1, and the GHG intensity, expressed as kg CO2 eq Mg–1 grain.
2.3.5. Economic benefits evaluation
Economic benefits were evaluated throughout the maize growing season based on crop production and gross returns gained from selling maize. Material and machinery costs were all taken into account, and all input costs were determined according to local market prices. Material costs included the cost of seed, fertilizers, pesticides, herbicides, and irrigation. The ecological costs were calculated with equations as follows [24]:
Ecological costs = CGHG + Ceu + Cacid = (CO2 × 0.0204) +(1.12 × NO3+ 0.24 × NH3+0.0018 × N) + (1.87 × NH3+0.021 × N)
Where CGHG, Ceu and Cacid were the costs of GHG emission damage, water eutrophication damage and soil acidification damage [25].
2.4. Statistical analysis
The data for 2019 and 2020 were subjected to an analysis of variance (ANOVA) using the General Linear Model procedure (GLM) in SPSS 21.0 (IBM, 2012). Maize grain yield response curves to the N application rate were generated in SPSS. Three response models (quadratic, quadratic-with plateau, and linear-with-plateau) were evaluated, the linear-with-plateau model produced the best fit. Differences were compared using Duncan’s multiple range tests (DMRT) at the 0.05 probability level.
3. Results
3.1. N Release Curves of Controlled-Release Urea
The N cumulative release curve of CRU exhibited an “inverted-L” shaped (Figure 2). More than 40.0% of N was released in the first 30 d after being buried in soil, followed by a period of constant release, and ended with a reduced N-release stage. The total N released until harvest stage achieved more than 80% for TCU and PCU in both years, but only 73.0% in 2019 and 69.9% in 2020 for PSCU (Figure 2). The N release rate of PSCU before six-leave stage (V6) was faster than that of TCU and PCU, and slower than that of TCU and PCU after silking stage.
3.2. Maize yield response to N management
When N fertilizer was applied in form of urea, the responses of maize grain yield to increased N application rates were similar in 2019 and 2020, and a linear-with-plateau model fit the data well (Figure 3). The minimum N rates required to achieve the maximum grain yield were 221 kg N ha–1 in 2019 and 216 kg N ha–1 in 2020. The calculated maximum grain yield achieved 10.73 Mg ha–1 in 2019 and 13.30 Mg ha–1 in 2020. The actual grain yield peaked with N234 treatment (10.97 Mg ha–1 in 2019 and 13.39 Mg ha–1 in 2020), which were very close to the calculated maximum grain yield.
Furthermore, compared with the no N application, the grain yield was significantly increased by 36.0% and 38.0% with N234 treatment in 2019 and 2020, respectively. However, with further increasing N supply from N234 to N280, grain yield was not significantly increased in both years (Figure 3). Compared with N234 to N280, the three reduced-rate CRU treatments with N application rate of 180 kg N ha–1 (PSCU, TCU and PCU) showed no a significant effect on grain yield (Figure 3). Among the three types of CRUs, the grain yield was the highest with TCU treatment, which were 10.7 Mg ha–1 and 13.9 Mg ha–1 in 2019 and 2020, respectively.
3.3. Maize N uptake and economic benefits response to N management
Compared with N234 and N280, the NUE of the three CRU fertilizers (PSCU, TCU and PCU) increased by 33.1%, 44.9% and 39.4%, and the PFPN increased by 37.3%, 45.4% and 39.3% in both years. Among all three types of CRUs tested, TCU exhibited the highest NUE and PFPN (Table 1). Compared to the N0 treatment, the net profit significantly increased by 55.8% and 44.8% with N234 and N280 treatments in 2019 and 2020, respectively (Table 2). In comparison to N234 and N280, the net profits of the three CRU fertilizers (PSCU, TCU and PCU) increased by 4.5%, 12.6%, and 3.7% in both years, respectively. Among all treatments, TCU exhibited the highest net profit when compared to both common urea and CRU fertilizer treatments.
3.4. Physiological characteristics response to N management
Leaf Photosynthetic Parameters
In comparison with no N supply, the N234 and N280 led to a significant augmentation in Ci and Tr during the silking stage, with average increments of 95.8% and 113.2% in 2020, respectively (Figure 4). Compared with the N234 and N280, the TCU treatment increased the Pn by 7.9%, and the PCU treatment increased the Ci by 27.2%. During the milking period, relative to the N0 treatment, the application of common urea has a relatively smaller impact on photosynthetic indicators. In comparison with the N234 and N280, the PCU treatment increased Pn and Ci by 32.7% and 20.6%, respectively, the TCU treatment enhanced Ci by 35.4%.
Enzyme activity
Different N fertilizer treatments can significantly affect the NR, GOT and GPT activities in ear leaves (Figure 5). In comparison with no N supply, the N234 and N280 led to a significant augmentation in NR and GPT activities in ear leaves, with average increments of 6.3% and 22.4% in 2020, respectively. However, the three CRU treatments had a less pronounced effect on these enzyme activities compared to N234 and N280 in 2020.
Hormone
In comparison with no N supply, the N234 and N280 led to an increase in SA during the silking stage, with average increments of 71.2% and 22.6% in 2020, respectively (Figure 6). In contrast to N234 and N280, the GA₃ levels associated with the three CRU fertilizers (PSCU, TCU, and PCU) increased by 22.4%, 27.2%, and 14.0%, respectively. During the milking period, relative to the treatment N0, common urea exhibited a relatively minor effect on hormone content. However, when compared to N234 and N280 treatments, TCU application significantly enhanced GA₃ content by 17.9% in 2020. The IAA levels for PSCU, TCU, and PCU increased by 32.1%, 22.4%, and 25.7%, respectively. Furthermore, when comparing PSCU, TCU, and PCU treatments with N234 and N280 applications led to increases in ABA content of 37.8%, 30.9%, and 12.2%.
3.5. Soil physical-chemical proprieties response to N management
Compared to the N0 treatment, both N234 and N280 exhibited a relatively minor impact on soil enzyme activity in 2020 (Figure 7). In contrast, TCU increased sucrase activity by 10.8% when compared to N234 and N280. The three CRU treatments enhanced urease activity by 18.3%, 35.8%, and 13.3%, respectively. Notably, CAT activity remained unaffected by N fertilization, irrespective of the nitrogen source or application rate.
Soil pH experienced a significant decrease of 3.6% in the N234 and PCU treatments; other treatments also showed a decreasing trend but without statistical significance in 2020 (Table 3). When compared to the N0 treatment, the N234 and N280 applications significantly increased alkali-hydrolyzed N content by 57.6% and 40.4%, respectively. Additionally, relative to N234 and N280, alkali-hydrolyzed N content exhibited only minor variations with the three CRUs applied. In terms of soil organic matter impact from common urea application versus no N supply, it was observed that the effect of common urea was comparatively smaller. Furthermore, CRUs significantly enhanced soil organic matter content by 23.7% when compared to common urea applications. However, no significant differences were observed in the effects of the three CRUs on soil organic matter.
3.6. Reactive N losses and GHG emission affected by N management
Compared to the N0 treatment, the N234 and N280 treatments significantly increased Nr losses by 4.3 and 5.1 times in both years, respectively (Figure 8). When compared to the N234 and N280 treatments, CRUs effectively reduced Nr losses by 47.5% across PSCU, TCU, and PCU applications. However, no significant differences were observed among the three CRUs treatments regarding Nr losses. In fertilized plots, Nr losses primarily stemmed from nitrogen fertilizer application; with leaching being the largest contributor (77–80%), followed by NH3 volatilization (18–21%). N2O emission accounted for a very small percentage (<2%) of N losses.
In comparison to the N0 treatment, GHG emissions were significantly elevated by 1.2 times and 1.6 times for the N234 and N280 treatments in both years, respectively (Figure 8). When compared to the N234 and N280 treatments, CRUs effectively reduced GHG emissions by an average of 18.7% across PSCU, TCU, and PCU applications. However, no significant differences were observed among the three CRUs treatments regarding GHG emissions. The production and transportation of nitrogen fertilizer accounted for a substantial portion of GHG emissions (29–33%) followed by other sources contributing between 25% and 80%, while N fertilizer application contributed between 20% and 43% within fertilized plots. Under the N0 treatment condition, other sources emerged as the predominant contributor to GHG emissions, representing approximately 80%.
3.7. Reactive N losses and GHG emissions affected by N management
Compared to the N0 treatment, the N234 and N280 treatments significantly increased Nr losses intensity by 2.7 and 3.5 times in both years, respectively (Figure 9). In comparison to the N234 and N280 treatments, CRUs notably reduced Nr losses intensity by 45.5 % across PSCU, TCU, and PCU treatments. However, no significant differences were observed in Nr losses intensity among the three CRUs treatments.
Compared to the N0 treatment, the N234 and N280 treatments significantly increased GHG emissions intensities by 1.0 and 1.3 times in both years, respectively (Figure 9). In comparison to the N234 and N280 treatments, CRUs notably reduced GHG emissions intensities by 27.0% across PSCU, TCU, and PCU treatments. However, no significant differences were observed in GHG emissions intensities among the three CRUs treatments. The slight improvement of the GHG emissions intensities in TCU was attributed to the decreased GHG emissions and the increased grain yield.
4. Discussion
4.1. Effects of CRU and common urea on maize yield and N uptake
Maize grain yield under common urea application followed a linear-plateau response, reaching a critical threshold at 234 kg N ha–1 (N234) (Figure 3). This pattern exemplifies the "law of diminishing returns" in agronomy, where physiological and edaphic constraints limit yield gains beyond optimal N input [26], likely reflecting the crop’s maximum capacity to convert absorbed N into grain biomass. Crucially, CRU treatments achieved yields comparable to common urea while reducing N application rates by 12–19% (180 kg N ha–1 vs. 207–222 kg N ha–1 plateau rates reported in prior NCP studies) [27,28]. Notably, the TCU treatment yielded the highest among all. This superior performance was underpinned by a 39.1% higher NUE for CRU compared to common urea (Table 2), demonstrating CRU’s capacity to better coordinate N supply with crop demand.
CRU exhibits an initial rapid release within the first month post-application, providing sufficient N during the seedling stage when uptake demand begins to rise, while minimizing early-season losses through controlled availability [29]. The superior cumulative N release of TCU and PCU (>80% by harvest) compared to PSCU (70–73%) suggests better synchronization of nutrient supply with crop demand. This enhanced synchronization, particularly sustained N availability during critical post-silking grain filling, is essential for yield optimization [4]. The incomplete release from PSCU likely resulted in insufficient late-season N availability, constraining its yield potential despite adequate early supply [27,30]. TCU’s release kinetics appear optimal for coordinating nutrient supply with the maize N uptake pattern.
4.2. Plant physiological and soil enzyme activities response to N management
CRU application significantly enhanced photosynthetic efficiency during reproductive stages. The significant increase in Pn by 7.9–32.7% and Ci by 20.6–40.0% under three types of CRUs during the silking and milking stages (Figure 5), highlighting the critical role of synchronized N supply in sustaining carbon assimilation [27,31]. Unlike common urea, which suffers from rapid hydrolysis and early-season N losses, CRU’s biphasic release profile ensures sustained N availability during reproductive phases [32], maintaining chlorophyll content and Rubisco activity, increasing light energy conversion efficiency [10]. Consequently, elevated Pn increased photoassimilate production, while optimized N delivery during grain filling strengthened sink capacity, synergistically enhancing both NUE and yield [33,34].
At the optimal N rate (180 kg N ha–1), CRU elicited coordinated improvements in both N assimilation and hormonal regulation, surpassing common urea [35]. Application of CRU demonstrated dual physiological benefits by simultaneously enhancing key N metabolism enzymes (NR, GPT, and GOT) and maintaining elevated hormone levels (GA₃, IAA, and ABA) (Figs. 5 and 6). The stable N supply from CRU ensured: continuous NR activity for efficient N reduction; stable transaminase function for uninterrupted amino acid and protein synthesis, vital for growth [36,37]; and sustained substrate availability stimulating GA₃ biosynthesis. GA₃ promotes cell division and elongation and can upregulate photosynthetic genes [38], further enhancing carbon fixation. The observed hormonal synergy (elevated GA₃ with maintained ABA) provides a physiological mechanism for the consistent yield and NUE benefits across both study years. These results confirm that CRU effectively coordinates whole-plant physiology, optimizing N assimilation, hormone dynamics, and ultimately, source-sink relationships.
Soil enzyme activities (sucrase and urease) serve as key indicators of microbial functional capacity and nutrient cycling [39]. CRU treatments, particularly TCU, maintained significantly higher sucrase and urease activities compared to common urea (Figure 7), consistent with meta-analyses [40]. This enhancement is attributed to CRU’s slow-release characteristics [41], which provide a more stable N substrate flow. TCU may offer superior stability and temperature resistance, ensuring steadier release, and their coating properties might foster microenvironments conducive to enzyme-substrate interactions [42]. Elevated enzyme activities promote nutrient cycling and transformation. Furthermore, the associated improvement in soil organic matter content benefits soil structure, enhancing water/air infiltration and retention, thus creating a favorable environment for both soil microorganisms and plant roots [40,43]. CRU coordinating soil N retention and microbial function to foster a healthier rhizosphere, ultimately supports improved plant growth, yield, and NUE.
4.3. Reactive N losses and GHG emission response to N management
Using established empirical models [8,17] and LCA methods [44], the total Nr losses and intensity were estimated. CRU application significantly mitigated total Nr losses by 47.5% compared to common urea, with no significant differences observed among the three CRU types. This substantial reduction stemmed primarily from diminished N leaching (27.1%) and NH₃ volatilization (39.4%), aligning with findings by Chen et al. [17]. Polymer/sulfur coatings delay urea dissolution, reducing sudden spikes in soil NH₄⁺/NH₃ concentrations that drive volatilization [8]. Moreover, gradual N supply matches crop uptake, minimizing NO₃⁻ accumulation and leaching risks [9,45]. Although TCU optimized N availability for uptake (yielding highest), all CRUs were equally effective in preventing Nr losses. Under field conditions, environmental factors (temperature, humidity, soil pH) may diminish characteristic differences among coating materials. Crucially, all CRU coatings delay urea hydrolysis, resulting in NH₄⁺ release rates generally lower than both crop uptake and soil adsorption capacities [46], leading to significantly reduced NH₃ emissions irrespective of coating type [47,48]). This demonstrates CRU’s inherent capacity to coordinate N release with soil retention processes and plant uptake, minimizing environmental losses.
CRU production and transportation emitted more GHGs than common urea (an additional 0.72 kg CO₂ eq per kg N) [8]. However, during the field application phase, CRU significantly reduced direct N₂O emissions. This reduction was substantial enough to fully offset the higher production/transport emissions, resulting in lower total GHG emissions and emission intensity for CRU at the optimal rate (Figs. 6 and 7). When combined with similar or higher grain yields, CRU achieved comparable or lower GHG emissions per unit yield [49]. Results confirm that N fertilizer production and application are major GHG sources, underscoring the importance of reducing N rates to minimize the carbon footprint [50,51]. CRU’s ability to maintain yields with lower N rates is therefore key to its net GHG mitigation benefit.
Although direct microbial community analysis was not conducted, the observed N dynamics strongly suggest that CRU’s controlled release significantly modulated soil microbiome function. The gradual N release pattern, particularly characteristic of TCU, likely suppressed Nitrosomonas-dominated ammonia-oxidizing bacteria (AOB) communities [52]. This is evidenced by the 47.5% reduction in N₂O emissions compared to urea and aligns with metagenomic studies showing moderate NH₄⁺ availability favors K-strategist Nitrosospira over r-strategist Nitrosomonas [52]. Concurrently, the 35.8% increase in urease activity under TCU (Figure 7) indicates stimulation of ureolytic microbes (e.g., Bacillus subtilis, Pseudomonas stutzeri), known for high-affinity urease systems under moderate N conditions [42]. These inferred microbial shifts, driven by CRU’s coordinated N release, contribute to enhanced NUE by promoting organic N mineralization while reducing gaseous and leaching losses.
Economically, CRU adoption, particularly TCU, offered compelling advantages despite a 20-40% higher initial cost than urea. TCU generated 12.6% greater net profits, primarily through: (1) maintaining yield stability (13.9 Mg ha⁻1) with 12-19% less N input, and (2) reducing labor requirements by 50% due to single basal application. This labor saving is especially significant given China’s rapid agricultural urbanization, where rural labor costs have risen by 8.3% annually since 2015. When coupled with emerging carbon credit schemes for N₂O mitigation, these trends position TCU as an ecologically and economically superior N management strategy for intensive maize systems, effectively coordinating productivity, environmental protection, and farm profitability.
5. Conclusions
This study demonstrates that CRU, particularly TCU, established an ecologically optimized N management regime for maize production in the cinnamon soils of the NCP. The major findings were: (1) CRU achieved maize yields comparable to common urea while reducing application rates by 12–19% (180 kg N ha⁻1) and significantly enhancing NUE; (2) CRU significantly boosted photosynthetic capacity via sustained Rubisco activity, enhanced key N assimilation enzyme activities (NR, GPT, GOT), and maintained optimal levels of critical plant hormones, optimizing source-sink relationships; (3) CRU reduced the Nr losses and GHG emission, while simultaneously enhancing urease activity and soil organic matter content, fostering a more stable soil-plant N cycle. These improvements were achieved while maintaining 12.6% higher net profits compared to conventional urea, primarily through yield stability and labor savings from single application. The thermosetting polymer coating of TCU proved particularly effective in cinnamon soils, demonstrating optimal N release kinetics that balanced crop demand with environmental protection. These findings position TCU as a cornerstone technology for sustainable intensification of maize production systems.
Supplementary Materials
The following supporting information can be downloaded at the website of this paper posted on Preprints.org.
Author Contributions
Conceptualization, H.Y. and S.S.; methodology, M.H.; software, Z.W.; validation, Y.X., Q.L. and C.G.; formal analysis, J.S.; investigation, M.H.; resources, M.H.; data curation, B.L.; writing—original draft preparation, W.XY.; writing—review and editing, Y.X.; visualization, K.L.; supervision, K.L.; project administration, Y.X.; funding acquisition, Y.X. All authors have read and agreed to the published version of the manuscript.
Funding
This research was supported by the, National Key Research and Development Program of China (2021YFD1901003, 2017YFD0301005), the Innovative Talent Introduction and Innovation Project of Shandong Academy of Agricultural Sciences (CXGC2025C02) and the project of Science and Technology commissioners in Shandong Province (2022DXAL0125).
Institutional Review Board Statement
Not applicable.
Data Availability Statement
Dataset available upon request from the authors.
Conflicts of Interest
The authors declare no confficts of interest.
References
- Zhang, G.G.; Liu, S.J.; Wang, X.Y.; Wang, X.F.; Zhang, Y.; Zhao, D.H.; Wen, X.X.; Han, J.; Liao, Y.C. Mixed application of controlled-release urea and normal urea can improve crop productivity and reduce the carbon footprint under straw return in winter wheat-summer maize cropping system. Eur. J. Agron. 2023, 151, 127002. [Google Scholar] [CrossRef]
- Feng, X.J.; Zhan, X.M.; Han, X.R.; Chen, K.; Peng, J.; Wang, X.X.; Shang, D.Y. Slow-release nitrogen fertiliser suitable for one-time fertilisation of spring maize in Northeast China. Plant Soil Environ. 2021, 67, 164–172. [Google Scholar] [CrossRef]
- Rocha, K.F.; de Souza, M.; Almeida, D.S.; Chadwick, D.R.; Jones, D.L.; Mooney, S.J.; Rosolem, C.A. Cover crops affect the partial nitrogen balance in a maize forage cropping system. Geoderma. 2020, 360, 114000. [Google Scholar] [CrossRef]
- Wang, X.; Xiang, Y.Z.; Guo, J.J.; Tang, Z.J.; Zhao, S.T.; Wang, H.; Li, Z.J.; Zhang, F.C. Coupling effect analysis of drip irrigation and mixed slow-release nitrogen fertilizer on yield and physiological characteristics of winter wheat in Guanzhong area. Field Crops Res. 2023, 302, 109103. [Google Scholar] [CrossRef]
- Rosolem, C.A.; Ritz, K. , Cantarella, H. ; Galdos, M.V.; Hawkesford, M.J.; Whalley, W.R.; Mooney, S.J. Chapter five-enhanced plant rooting and crop system management for improved N use efficiency. Adv. Agron. 2017, 146, 205–239. [Google Scholar]
- Zheng, W.K.; Wan, Y.S.; Li, Y.C.; Liu, Z.G.; Chen, J.Q.; Zhou, H.Y.; Gao, Y.X. , Chen, B.C., Zhang, M., 2020. Developing water and nitrogen budgets of a wheat-maize rotation system using auto-weighing lysimeters: effects of blended application of controlled-release and un-coated urea. Environ. Pollut. 263, 114383.
- Azeem, B.; KuShaari, K.; Man, Z.B.; Basit, A.; Thanh, T.H. Review on materials and methods to produce controlled release coated urea fertilizer. J. Contr. Release. 2014, 181, 11–21. [Google Scholar] [CrossRef] [PubMed]
- Zhang, W.S.; Liang, Z.Y.; He, X.M.; Wang, X.Z.; Shi, X.J.; Zou, C.Q.; Chen, X.P. The effects of controlled release urea on maize productivity and reactive nitrogen losses: a meta-analysis. Environ. Pollut. 2019, 246, 559–565. [Google Scholar] [CrossRef] [PubMed]
- Geng, J.B.; Chen, J.Q.; Sun, Y.B.; Zheng, W.K.; Tian, X.F.; Yang, Y.C.; Li, C.L.; Zhang, M. Controlled-release urea improved nitrogen use efficiency and yield of wheat and corn. Agron. J. 2016, 108, 1666–1673. [Google Scholar] [CrossRef]
- Zhao, B.; Dong, S.T.; Zhang, J.W.; Liu, P. Effects of controlled-release fertilizer on nitrogen use efficiency in summer maize. PLOS ONE. 2013, 8, 70569. [Google Scholar]
- Guo, X.; Li, G.H.; Ding, X.P.; Zhang, J.W.; Ren, B.Z.; Liu, P.; Zhang, S.G.; Zhao, B. Response of leaf senescence, photosynthetic characteristics, and yield of summer maize to controlled-release urea-based application depth. Agronomy. 2022, 12, 687. [Google Scholar] [CrossRef]
- Zhou, Z.J.; Andersen, M.N.; Plauborg, F. Radiation interception and radiation use efficiency of potato affected by different N fertigation and irrigation regimes. Eur. J. Agr. 2016, 81, 129–137. [Google Scholar] [CrossRef]
- Fernandez, J.A.; Debruin, J.; Messina, C.D.; Ciampitti, I.A. Late-season nitrogen fertilization on maize yield: a meta-analysis. Field Crops Res. 2020, 247, 107586. [Google Scholar] [CrossRef]
- Shaviv, A. Advances in controlled-release fertilizers. Adv. Agron. 2001, 71, 1–49. [Google Scholar]
- Li, G.; Zhao, B.; Dong, S.; Zhang, J.; Liu, P.; Vyn, T.J. Interactive effects of water and controlled release urea on nitrogen metabolism, accumulation, translocation, and yield in summer maize. The Science of Nature. 2017, 104, 1–12. [Google Scholar] [CrossRef] [PubMed]
- Maaz, T.M.; Sapkota, T.B.; Eagle, A.J.; Kantar, M.B.; Bruulsema, T.W.; Majumdar, K. Meta-analysis of yield and nitrous oxide outcomes for nitrogen management in agriculture. Glob. Chang Biol. 2021, 27, 2343–2360. [Google Scholar] [CrossRef] [PubMed]
- Cui, Z.L.; Yue, S.C.; Wang, G.L.; Zhang, F.S.; Chen, X.P. In-season root-zone N management for mitigating greenhouse gas emission and reactive N losses in intensive wheat production. Environ. Sci. Technol. 2013, 47, 6015–6022. [Google Scholar] [CrossRef] [PubMed]
- Wang, X. Effect of nitrogen application patterns on variation of soil nitrate-N and of grain yield of wheat and maize. Henan Agricultural University. 2011, p45–58. [Google Scholar]
- Chen, X.P.; Cui, Z.; Fan, M.; Vitousek, P.; Zhao, M.; Ma, W.; Wang, Z.; Zhang, W.; Yan, X.; Yang, J.; Deng, X.; Gao, Q.; Zhang, Q.; Guo, S.; Ren, J.; Li, S.; Ye, Y.; Wang, Z.; Huang, J.; Tang, Q.; Sun, Y.; Peng, X.; Zhang, J.; He, M.; Zhu, Y.; Xue, J.; Wang, G.; Wu, L.; An, N.; Wu, L.; Ma, L.; Zhang, W.; Zhang, F. Producing more grain with lower environmental costs. Nature. 2014, 514, 486–491. [Google Scholar] [CrossRef] [PubMed]
- Kuai, J.; Li, X.L.; Ji, J.L.; Li, Z.; Xie, Y.; Wang, B.; Zhou, G.S. Response of leaf carbon metabolism and dry matter accumulation to density and row spacing in two Rapeseed (Brassica napus L.) genotypes with differing plant architectures. Crop J. 2022, 10, 680–691. [Google Scholar] [CrossRef]
- Guo, J.J.; Fan, J.L.; Zhang, F.C.; Yan, S.C.; Zheng, J.; Wu, Y.; Li, J.; Wang, Y.L.; Sun, X.; Liu, X.Q.; Xiang, Y.Z.; Li, Z.J. Blending urea and slow-release nitrogen fertilizer increases dryland maize yield and nitrogen use efficiency while mitigating ammonia volatilization. Sci. Total Environ. 2021, 790, 148058. [Google Scholar] [CrossRef] [PubMed]
- Zhang, L.; Liang, Z.Y.; Hu, Y.C. ; Urs, Schmidhalter. ; Zhang, W.S.; Ruan, S.Y.; Chen, X.P. Integrated assessment of agronomic, environmental and ecosystem economic benefits of blending use of controlled-release and common urea in wheat production. J. Clean. Prod. 2021, 287, 125572. [Google Scholar]
- Forster, P.; Ramaswamy, V.; Artaxo, P. Changes in atmospheric constituents and in radiative forcing. In: Climate Change 2007: The Physical Science Basis. Contribution of Working Group I to the Fourth Assessment Report of the Intergovernmental Panel on Climate Change (eds Solomon S, Qin D, Manning M, Chen Z, Marquis M Averyt KB, Tignor M, Miller HL). 2007, pp. 129–234. Cambridge University Press, Cambridge, UK and New York, NY, USA.
- Yin, M.H.; Li, Y.N.; Xu, Y.B. Comparative effects of nitrogen application on growth and nitrogen use in a winter wheat/summer maize rotation system. J. Inter. Agr. 2017, 16, 2062–2072. [Google Scholar] [CrossRef]
- Xia, Y.; Yan, X. Comparison of statistical models for predicting cost effective nitrogen rate at rice wheat cropping systems. Soil Sci. Plant Nutr. 2011, 57, 320–330. [Google Scholar] [CrossRef]
- Sadras, V.O.; Hayman, P.T.; Rodriguez, D.; Monjardino, M.; Bielich, M.; Unkovich, M.; Mudge, B.; Wang, E. Interactions between water and nitrogen in Australian cropping systems: physiological, agronomic, economic, breeding and modelling perspectives Crop and Pasture Science. 2016; 67, 1019–1053. [Google Scholar]
- Chen, X.P.; Cui, Z.L.; Vitousek, P.M.; Cassman, K.G.; Matson, P.A.; Bai, J.S. Integrated soil-crop system management for food security. Proc. Natl. Acad. Sci. USA. 2011, 108, 6399–6404. [Google Scholar] [CrossRef] [PubMed]
- Guo, J.M.; Wang, Y.H.; Fang, T.L.; Chen, X.P.; Cui, Z.L. Design corn management strategies for high yield and high nitrogen use efficiency. Agron.J. 2016, 108, 1–8. [Google Scholar] [CrossRef]
- Akiyama, H.; Yan, X.Y.; Yagi, K. Evaluation of effectiveness of enhanced efficiency fertilizers as mitigation options for N2O and NO emissions from agricultural soils: meta-analysis. Global Change Biol. 2010, 16, 1837–1846. [Google Scholar] [CrossRef]
- Li, G.; Cheng, G.; Lu, W.; Lu, D. Differences of yield and nitrogen use efficiency under different applications of slow-release fertilizer in spring maize. J. Integr. Agr. 2021, 20, 554–564. [Google Scholar] [CrossRef]
- Su, W.N.; Ahmad, S.; Ahmad, I.; Han, Q.F. Nitrogen fertilization affects maize grain yield through regulating nitrogen uptake, radiation and water use efficiency, photosynthesis and root distribution. PeerJ. 2020, 8, 10291. [Google Scholar] [CrossRef] [PubMed]
- Wang, J.; Wen, X.F.; Zhang, X.Y.; Li, S.G.; Zhang, D.Y. Co-regulation of photosynthetic capacity by nitrogen, phosphorus and magnesium in a subtropical Karst forest in China. Sci. Rep. 2018, 8, 7406. [Google Scholar] [CrossRef] [PubMed]
- Liu, C.; Sun, Y.; Wu, G.; Wang, X.; Yuan, M.; Wang, J.; He, W.; Chen, F.; LeCocq, K.; Wang, L.; Liu, Y. Amendment with controlled release urea increases leaf morpho-physiological traits, grain yield and NUE in a double-cropping rice system in southern China. J. Sci. Food Agric. 2023, 103, 1692–1703. [Google Scholar] [CrossRef] [PubMed]
- Li, H.; Zhu, Y.; Wang, G.F.; Liu, R.R.; Huang, D.; Song, M.M.; Zhang, Y.H.; Wang, H.; Wang, Y.C.; Shao, R.X.; Guo, J.M.; Yang, Q.H. Maize yield increased by matching canopy light and nitrogen distribution via controlled-release urea /urea adjustment. Field Crops Res. 2024, 308, 109284. [Google Scholar] [CrossRef]
- Tang, C.; Han, M.; Yang, X.; Shen, T.; Gao, Y.; Wang, Y.; Li, Y.C. Gene expression, enzyme activity, nitrogen use efficiency, and yield of rice affected by controlled-release nitrogen. ACS omega. 2023, 8, 23772–23781. [Google Scholar] [CrossRef] [PubMed]
- Li, P.F.; Lu, J.W.; Hou, W.F.; Pan, Y.H.; Wang, Y.; Khan, M.R.; Ren, T.; Cong, R.H.; Li, X. K. Reducing nitrogen losses through ammonia volatilization and surface runoff to improve apparent nitrogen recovery of double cropping of late rice using controlled release urea. Environ. Sci. Pollut. Res. 2017, 24, 11722–11733. [Google Scholar] [CrossRef] [PubMed]
- Jiang, Z.R.; Chen, Q.L.; Liu, D.; Tao, W.K.; Gao, S.; Li, J.Q.; Lin, C.H.; Zhu, M.C.; Ding, Y.F.; Li, W.W.; Li, G.H.; Sakr, S.; Xue, L.H. Application of slow-controlled release fertilizer coordinates the carbon flow in carbon-nitrogen metabolism to effect rice quality. BMC Plant Biol. 2024, 24, 621. [Google Scholar] [CrossRef] [PubMed]
- Zhang, J.Y.; Cun, Z.; Chen, J.W. Photosynthetic performance and photosynthesis-related gene expression coordinated in a shade-tolerant species Panax notoginseng under nitrogen regimes. BMC Plant Biol. 2020, 20, 273. [Google Scholar] [CrossRef] [PubMed]
- Chaparro, J.M.; Sheflin, A.M.; Manter, D.K.; Vivanco, J.M. Manipulating the soil microbiome to increase soil health and plant fertility. Biol. Fert. Soils. 2012, 48, 489–499. [Google Scholar] [CrossRef]
- Chen, H. , Li, D.J., Zhao, J., Xiao, K.C., Wang, K.L., 2018. Effects of nitrogen addition on activities of soil nitrogen acquisition enzymes: a meta-analysis. Agr. Ecosyst. Environ. 252, 126–131.
- Ma, Q.; Wang, M.Y.; Zheng, G.L.; Yao, Y.; Tao, R.R.; Zhu, M.; Ding, J.F.; Li, C.Y.; Guo, W. S.; Zhu, X.K. Twice-split application of controlled-release nitrogen fertilizer met the nitrogen demand of winter wheat. Field Crop Res. 2021, 267, 108163. [Google Scholar] [CrossRef]
- Shu, X.; He, J.; Zhou, Z.; Xia, L.; Hu, Y.; Zhang, Y. Organic amendments enhance soil microbial diversity, microbial functionality and crop yields: A meta-analysis. Sci. Total Enviro. 2022, 829, 154627. [Google Scholar] [CrossRef] [PubMed]
- Ma, Q.; Qian, Y.S.; Yu, Q.Q.; Cao, Y.F.; Tao, R.G.; Zhu, M.; Ding, J.F.; Li, C.Y.; Guo, W.S.; Zhu, X.K. Controlled-release nitrogen fertilizer application mitigated N losses and modified microbial community while improving wheat yield and N use efficiency. Agr. Ecosyst. Environ. 2023, 349, 108445. [Google Scholar] [CrossRef]
- Audsley, E. Harmonisation of environmental life cycle assessment for agriculture. Final Report. 1997, Concerted Action MR3-CT94-2028.
- Guo, J.; Wang, Y.; Blaylock, A.D.; Chen, X. Mixture of controlled release and normal urea to optimize nitrogen management for high-yielding (> 15Mg ha–1) maize. Field Crop Res. 2017, 204, 23–30. [Google Scholar] [CrossRef]
- Ying, H.; Ye, Y.L.; Cui, Z.L.; Chen, X.P. Managing nitrogen for sustainable wheat production. J. Clean. Prod. 2017, 162, 1308–1316. [Google Scholar] [CrossRef]
- Halvorson, A.D.; Del Grosso, S.J.; Jantalia, C.P. Nitrogen source effects on soil nitrous oxide emission from strip-till corn. J. Environ. Qual. 2011, 40, 1775–1786. [Google Scholar] [CrossRef] [PubMed]
- Lu, Y.; Song, F. Effects of different coated controlled-release urea on soil ammonia volatilization in farmland. Acta Ecol. 2011, 31, 7133–7140. [Google Scholar]
- Wang, Z.B.; Zhang, H.L.; Lu, X.H.; Wang, M.; Chu, Q.Q.; Wen, X.Y.; Chen, F. Lowering carbon footprint of winter wheat by improving management practices in North China Plain. J. Clean. Prod. 2016, 112, 149–157. [Google Scholar] [CrossRef]
- Grassini, P.; Cassman, K.G. High-yield maize with large net energy yield and small global warming intensity. P. Natl. Acad. Sci. USA. 2012, 109, 1074–1079. [Google Scholar] [CrossRef] [PubMed]
- Huang, J.; Chen, Y.; Sui, P.; Gao, W. Estimation of net greenhouse gas balance using crop- and soil-based approaches: two case studies. Sci. Total Environ. 2013, 456, 299–306. [Google Scholar] [CrossRef] [PubMed]
- Luo, J.; Liao, G.; Banerjee, S. K.; Gu, S.; Liang, J.; Guo, X. Long-term organic fertilization promotes the resilience of soil multifunctionality driven by bacterial communities. Soil Biol. Biochem. 2022, 177, 108922. [Google Scholar] [CrossRef]
Figure 1.
Daily mean temperature, solar radiation and precipitation during the maize growing seasons in 2019 and 2020 at Longshan site of Shandong Academy of Agricultural Sciences (36°43′N, 117°32′E), Shandong province, China.
Figure 1.
Daily mean temperature, solar radiation and precipitation during the maize growing seasons in 2019 and 2020 at Longshan site of Shandong Academy of Agricultural Sciences (36°43′N, 117°32′E), Shandong province, China.
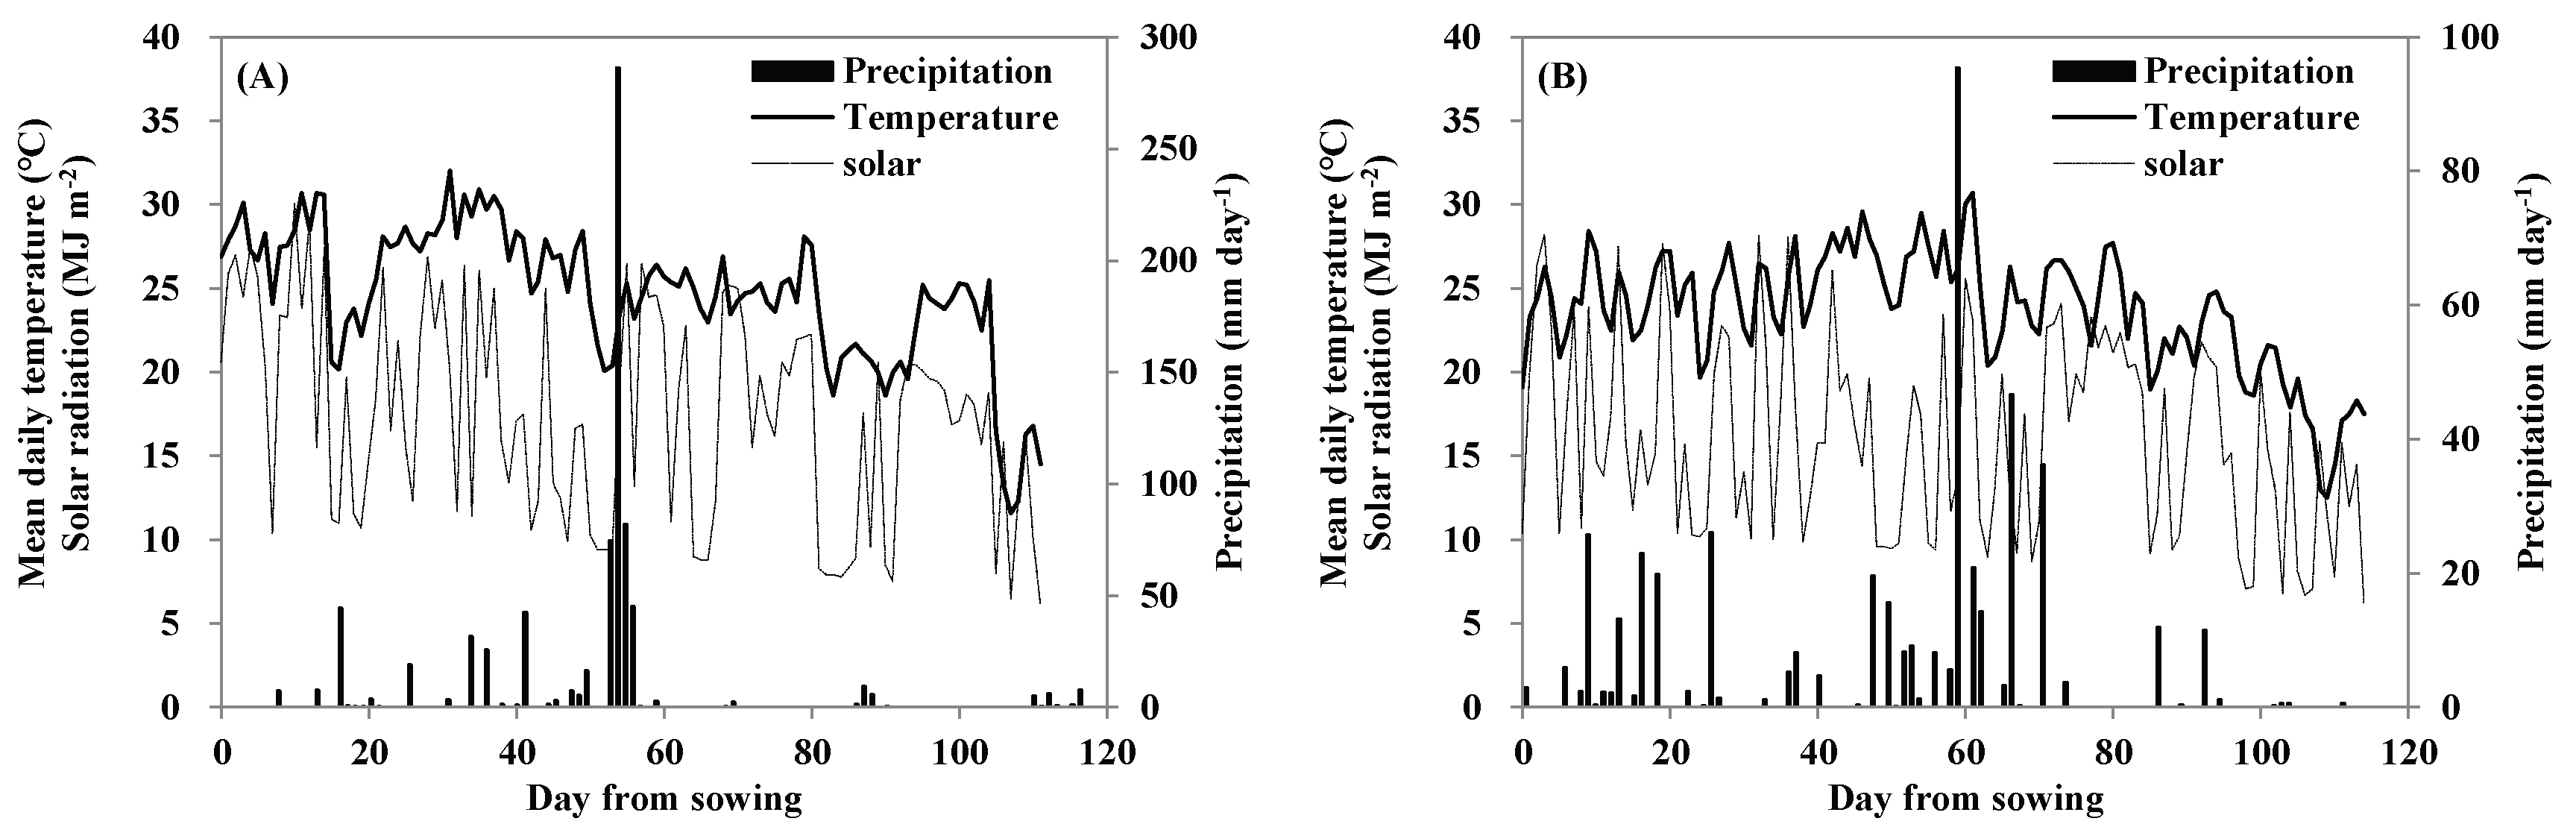
Figure 2.
N release rate and accumulative release rate of CRU under field conditions in 2019 (A) and 2020 (B). PSCU-internal: the time interval release rate of polymer-sulfur coated urea, TCU-internal: the time interval release rate of thermosetting polymer coated urea, PCU-internal: the time interval release rate of polymer coated urea, PSCU-accumulative: the accumulative release rate of polymer-sulfur coated urea, TCU-accumulative: the accumulative release rate of thermosetting polymer coated urea, PCU-accumulative: the accumulative release rate of polymer coated urea.
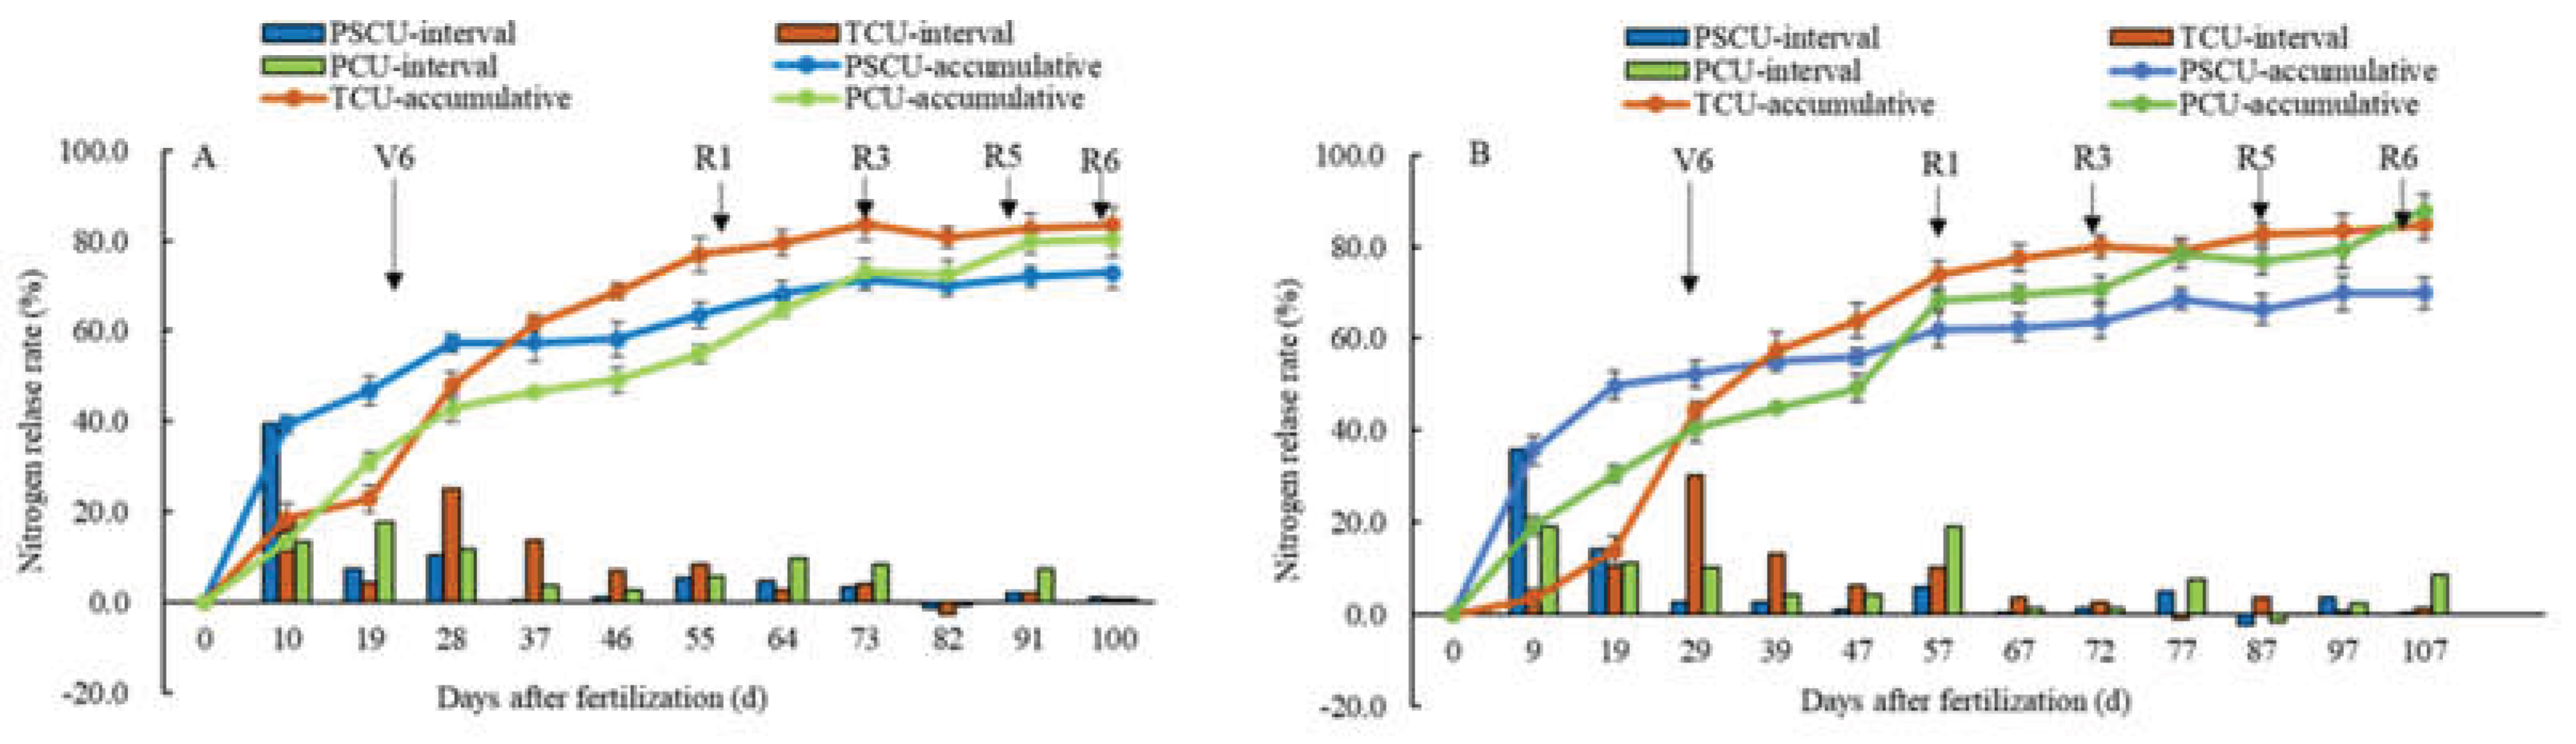
Figure 3.
Maize grain yield under different N treatments in 2019 and 2020. Different letters in each column within given treatment indicate that the means differ significantly (p<0.05).
Figure 3.
Maize grain yield under different N treatments in 2019 and 2020. Different letters in each column within given treatment indicate that the means differ significantly (p<0.05).
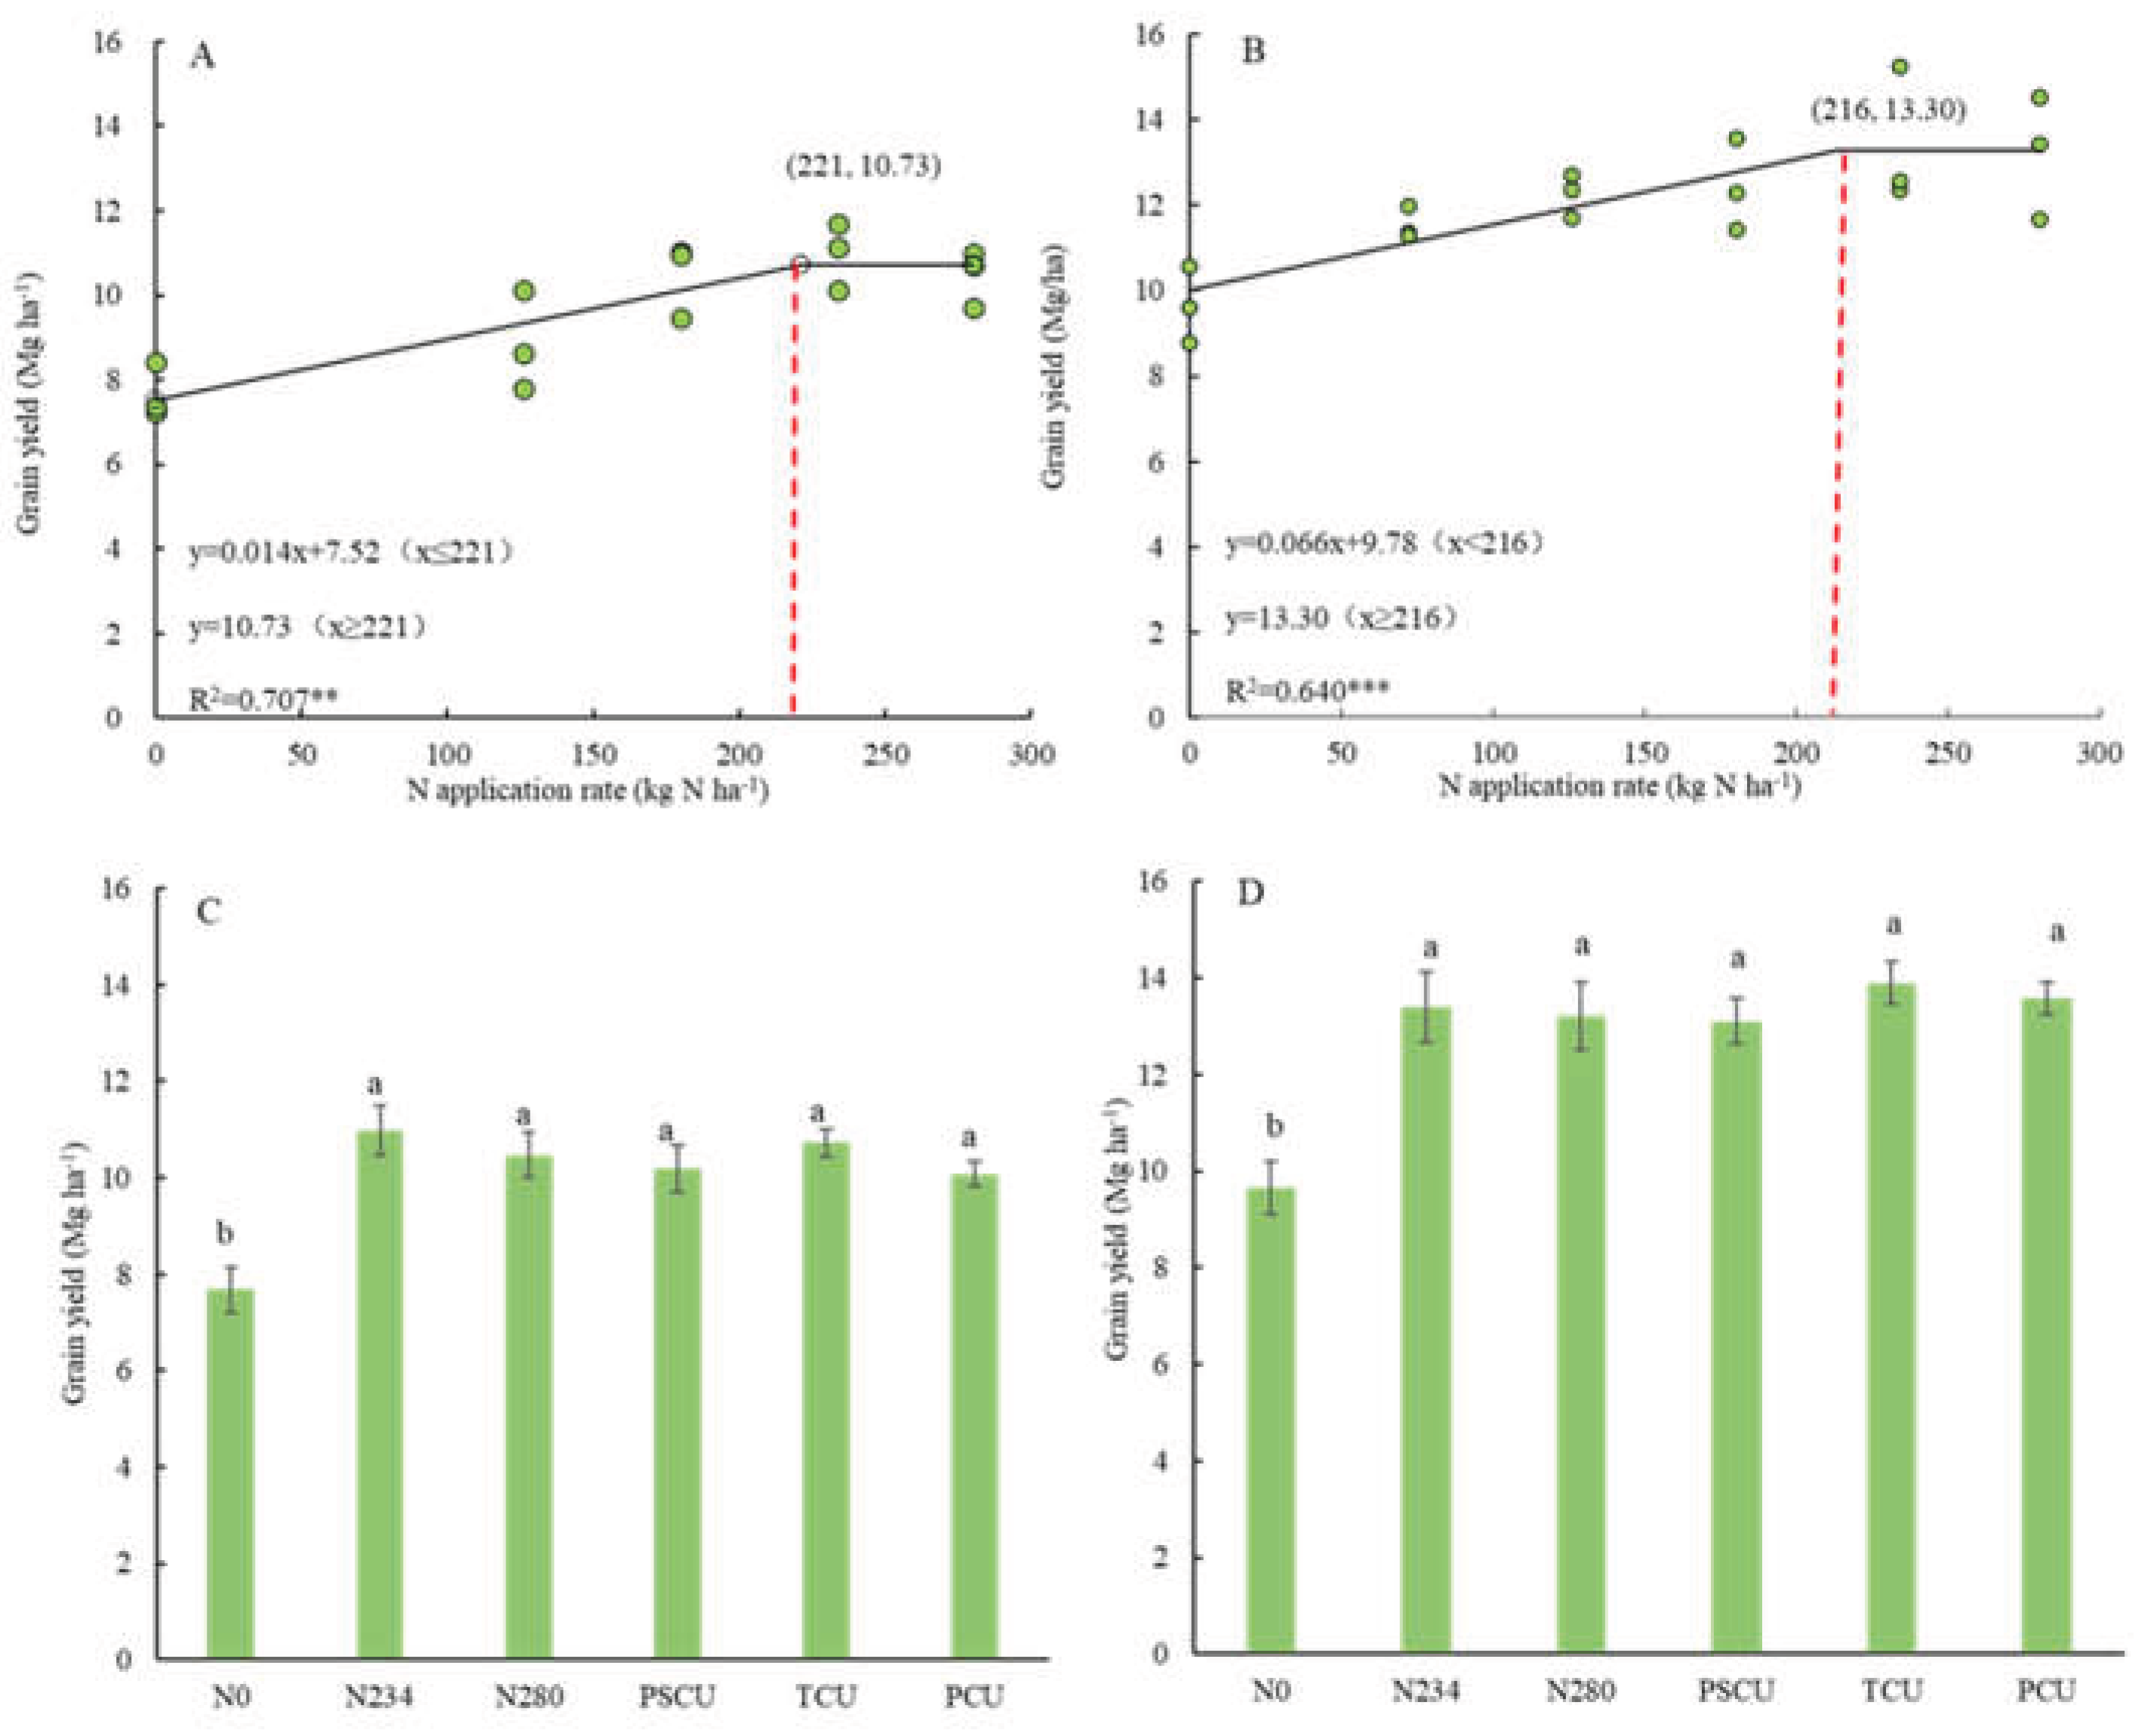
Figure 4.
Leaf photosynthetic parameters including Tr (A), Pn (B), Ci (C) and gs (D) of newly developed leaf under different N treatments in 2020. Error bars represent the standard error of the mean (n = 4). Significant differences at P < 0.05 are shown with different letters. Pn, photosynthetic rate; Ci, intercellular CO2 concentration; gs, conductance to H2O; Tr, transpiration rate.
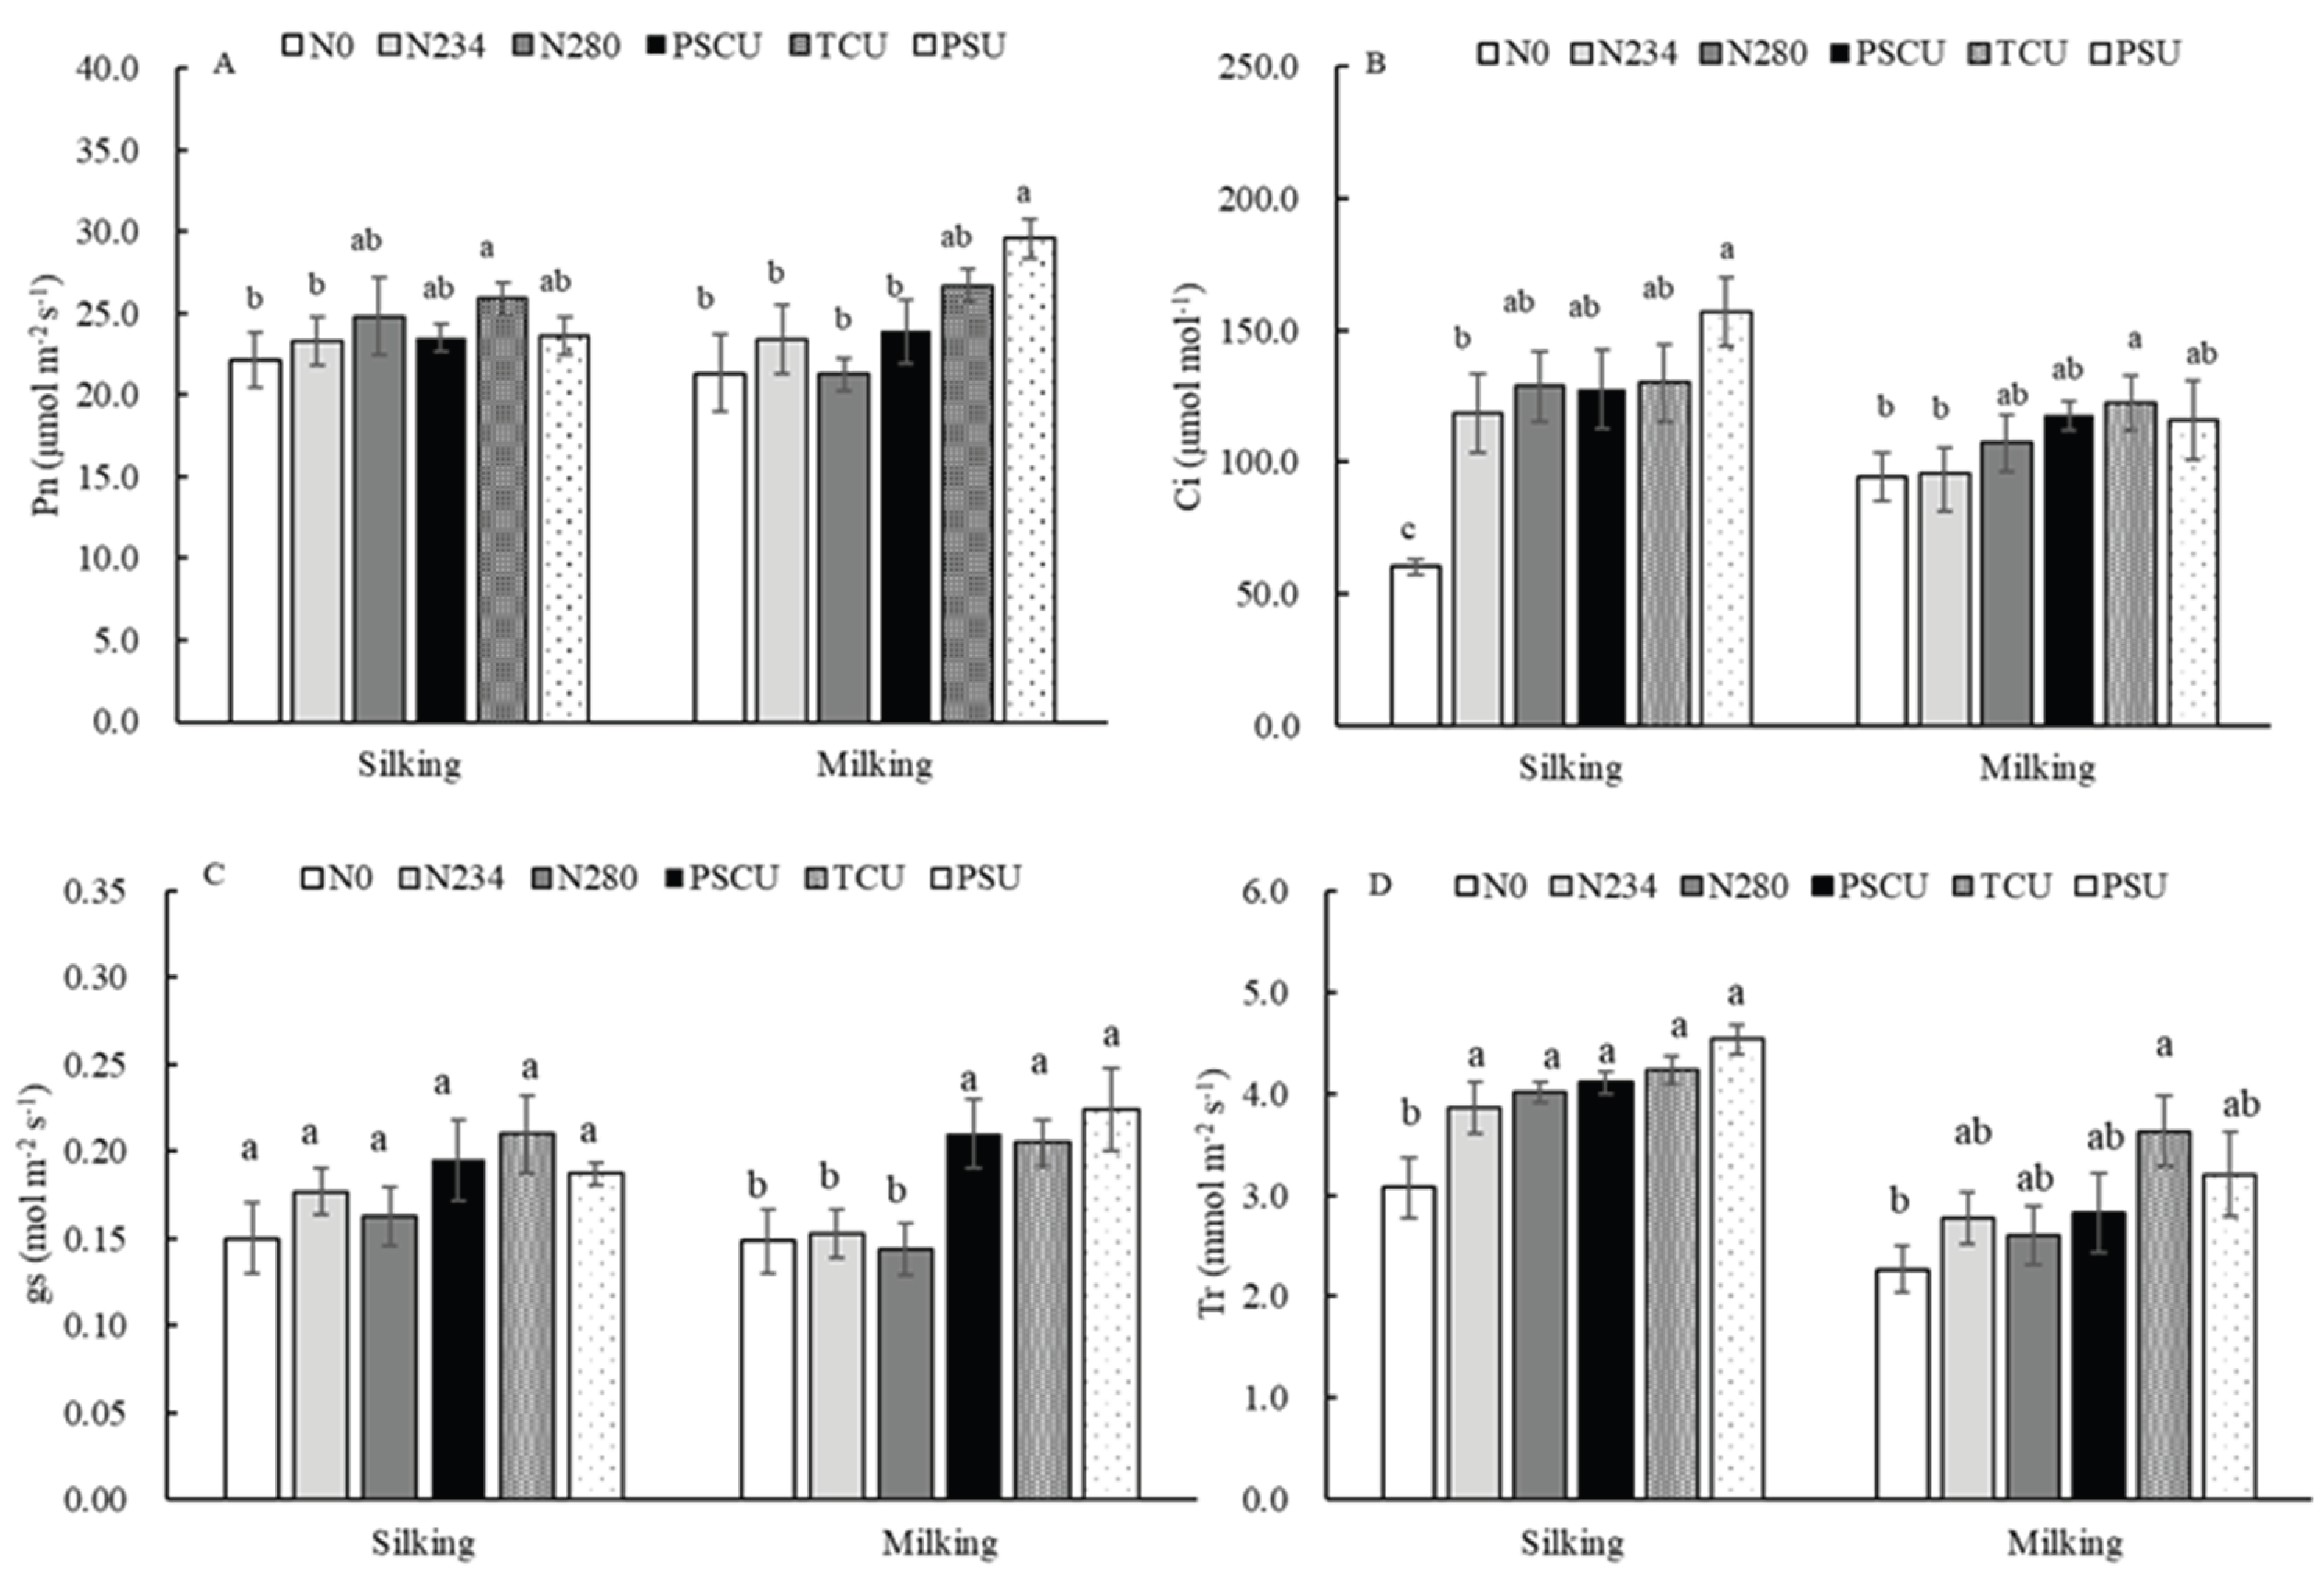
Figure 5.
Enzyme activities related to nitrogen metabolism in ear leaves including Nr (A), GS (B), GOT (C) and GPT (D) under different N treatments in 2020. Error bars represent the standard error of the mean (n=4). Significant differences at P < 0.05 are shown with different letters. NR, Nitrate Reductase; GS, glutamine synthetase; GOT, glutamate oxaloacetate transaminase; GPT, glutamate pyruvate transaminase.
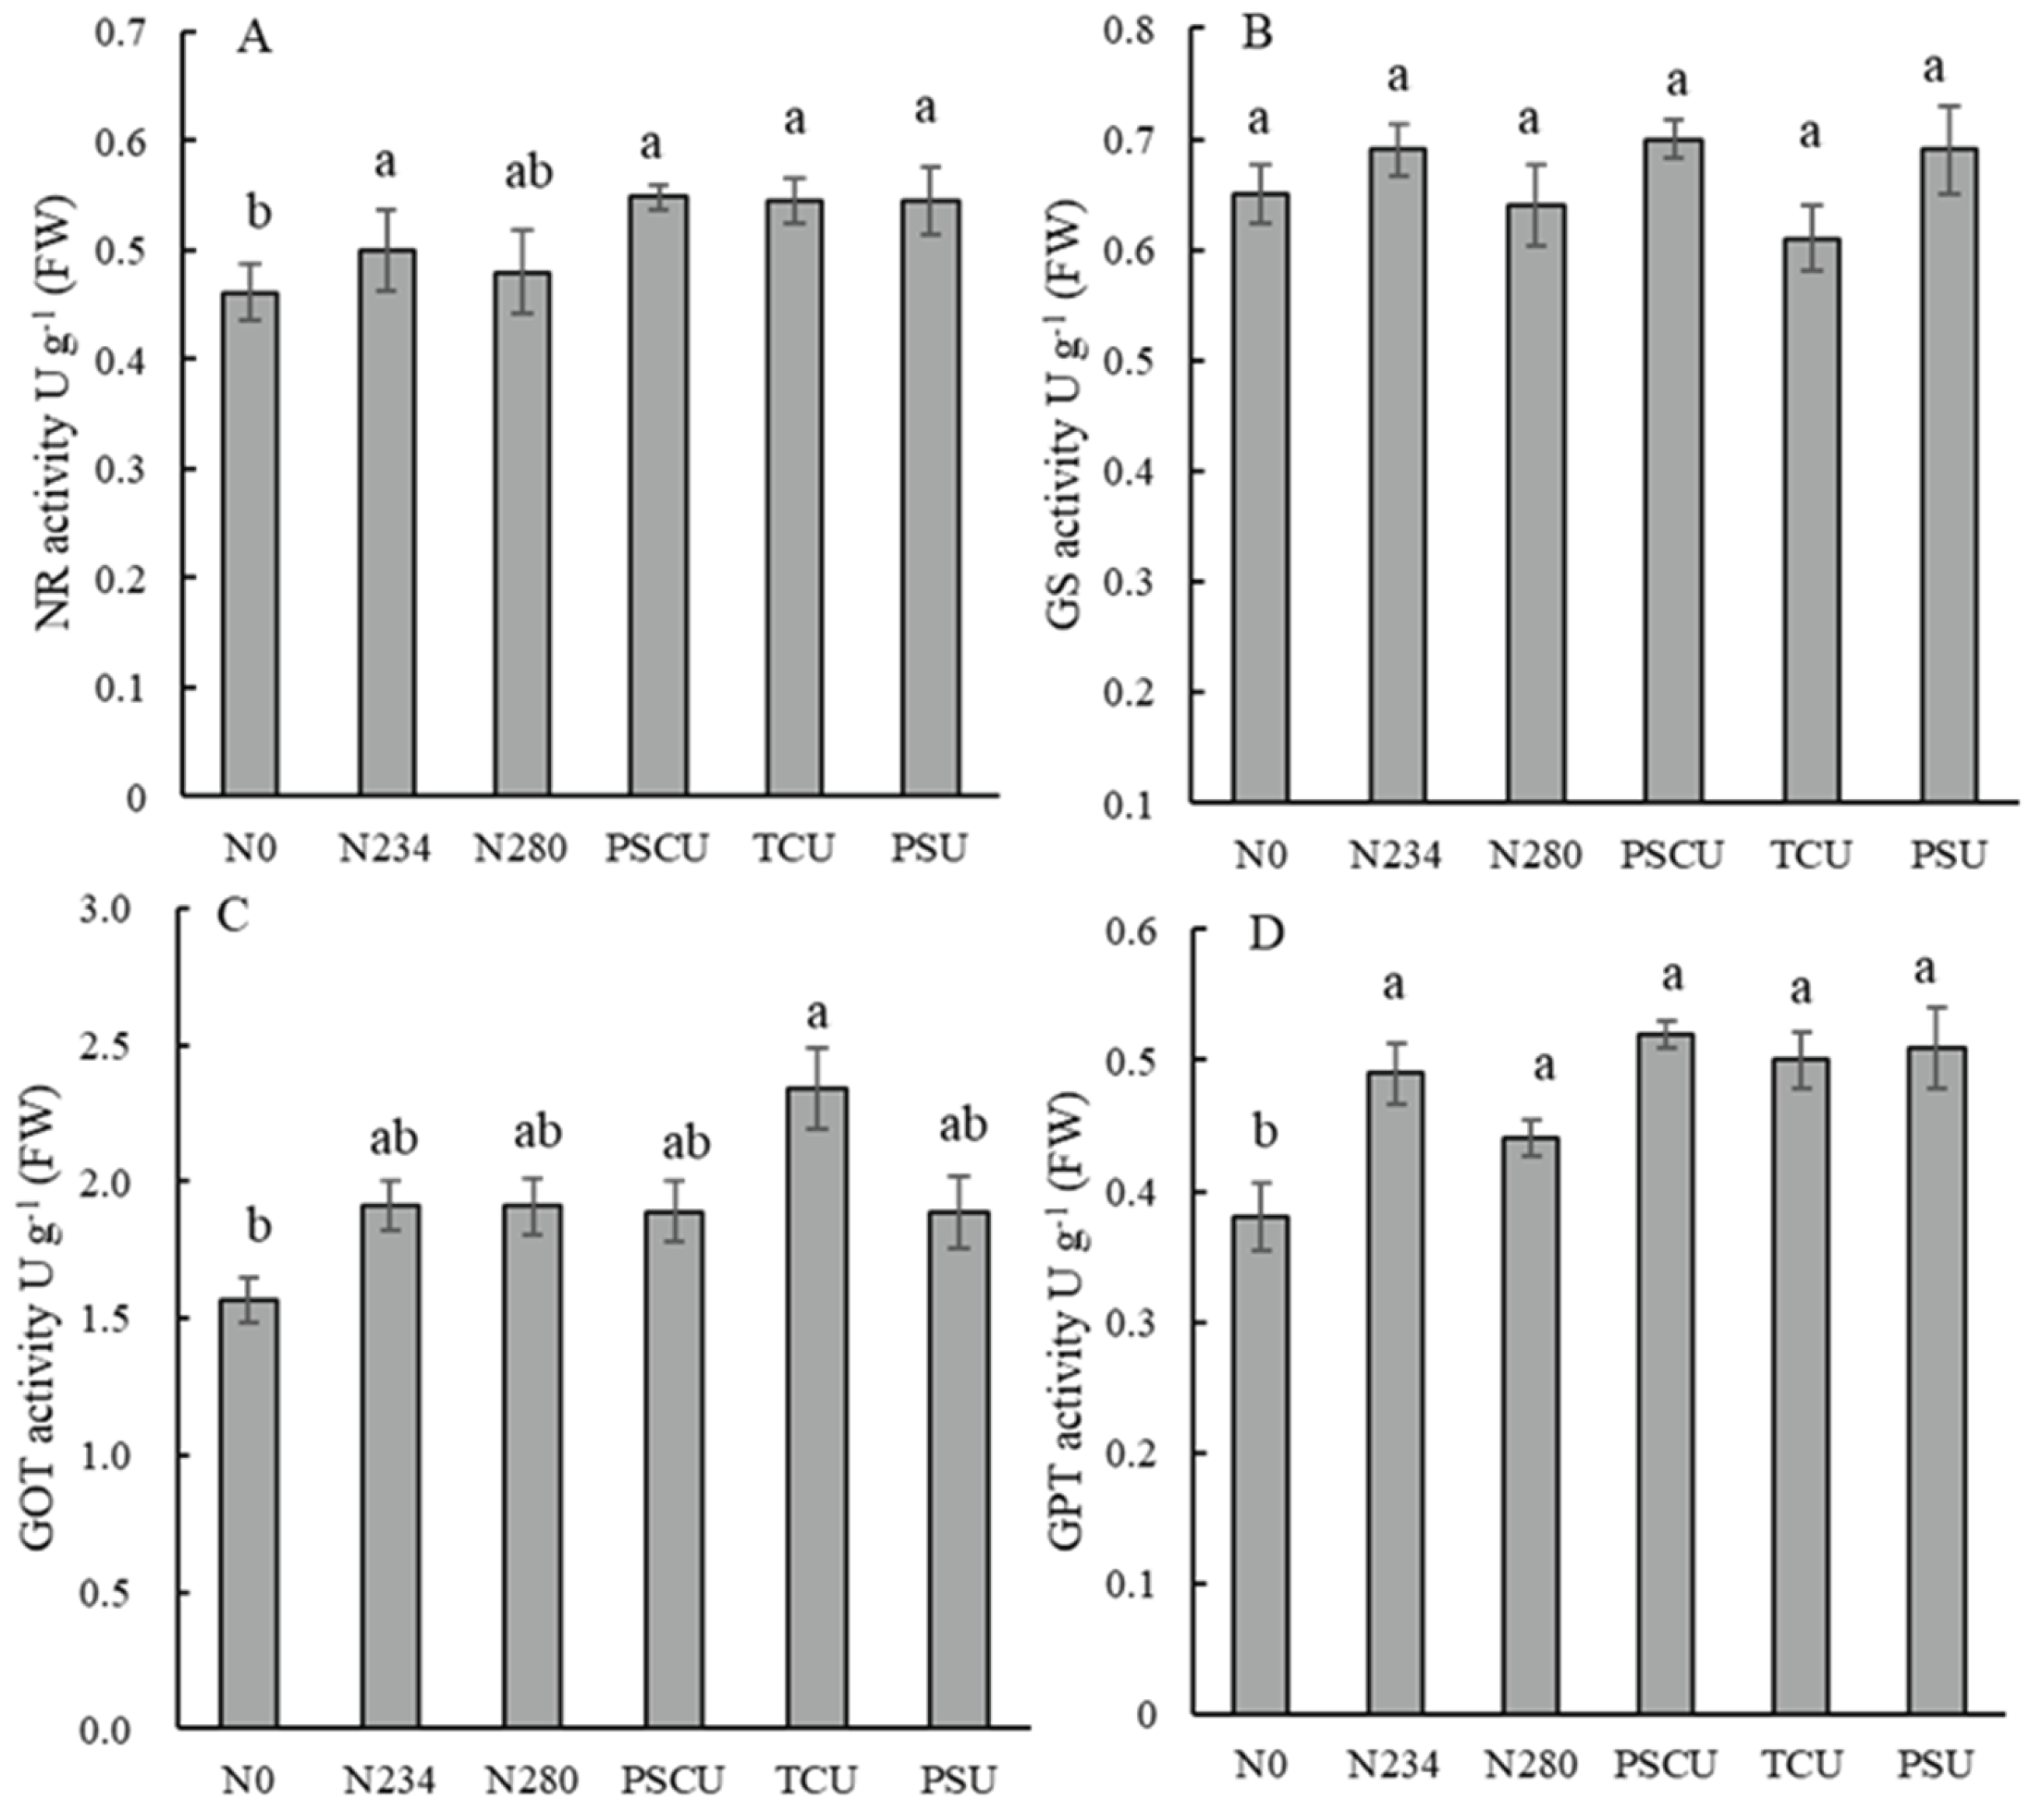
Figure 6.
Hormone activity comparison between the applied fertilizer treatments (CRU and common urea) compared to the control (no fertilizer applied) in the field experiment in 2020. The quantified hormones were salicylic acid (SA), gibberellic acid (GA3), indoleacetic acid (IAA), and abscisic acid (ABA). Error bars represent the standard error of the mean (n = 4). Different letters in each column within given treatment indicate that the means differ significantly (p<0.05).
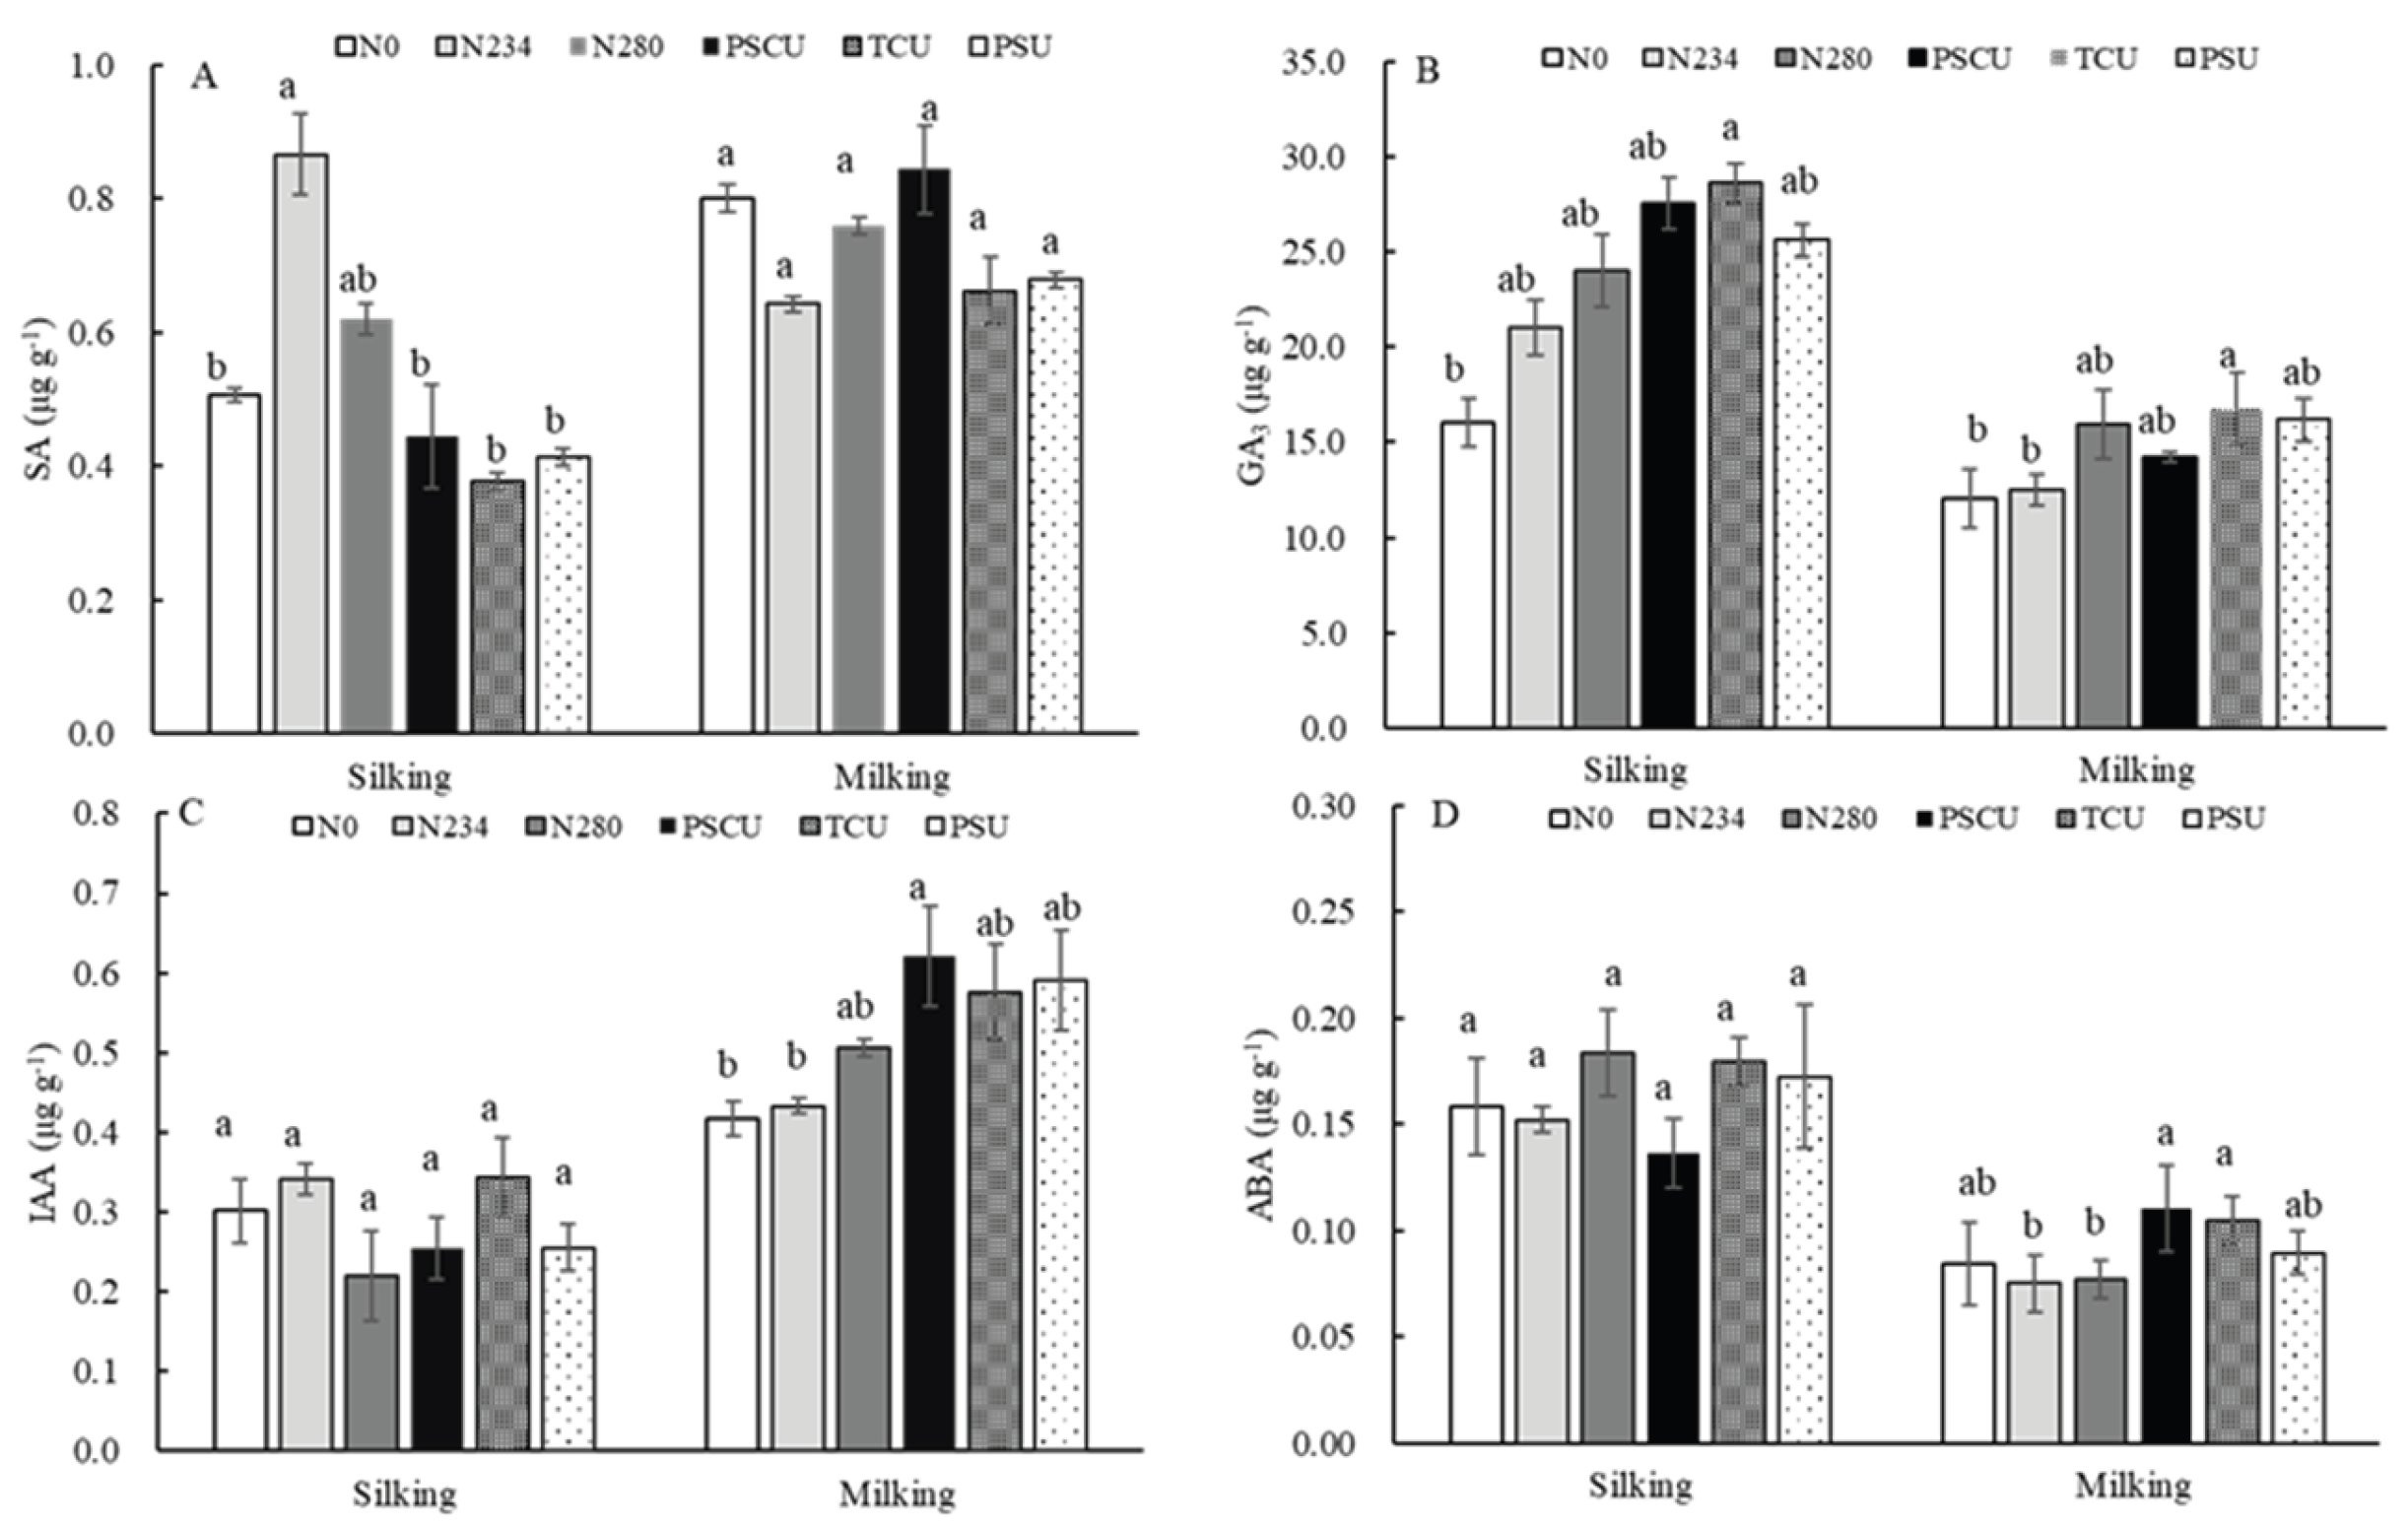
Figure 7.
Figure 7. Soil enemy activities of newly developed leaf under different N treatments in 2020. Error bars represent the standard error of the mean (n = 4). Significant differences at P < 0.05 are shown with different letters.
Figure 7.
Figure 7. Soil enemy activities of newly developed leaf under different N treatments in 2020. Error bars represent the standard error of the mean (n = 4). Significant differences at P < 0.05 are shown with different letters.
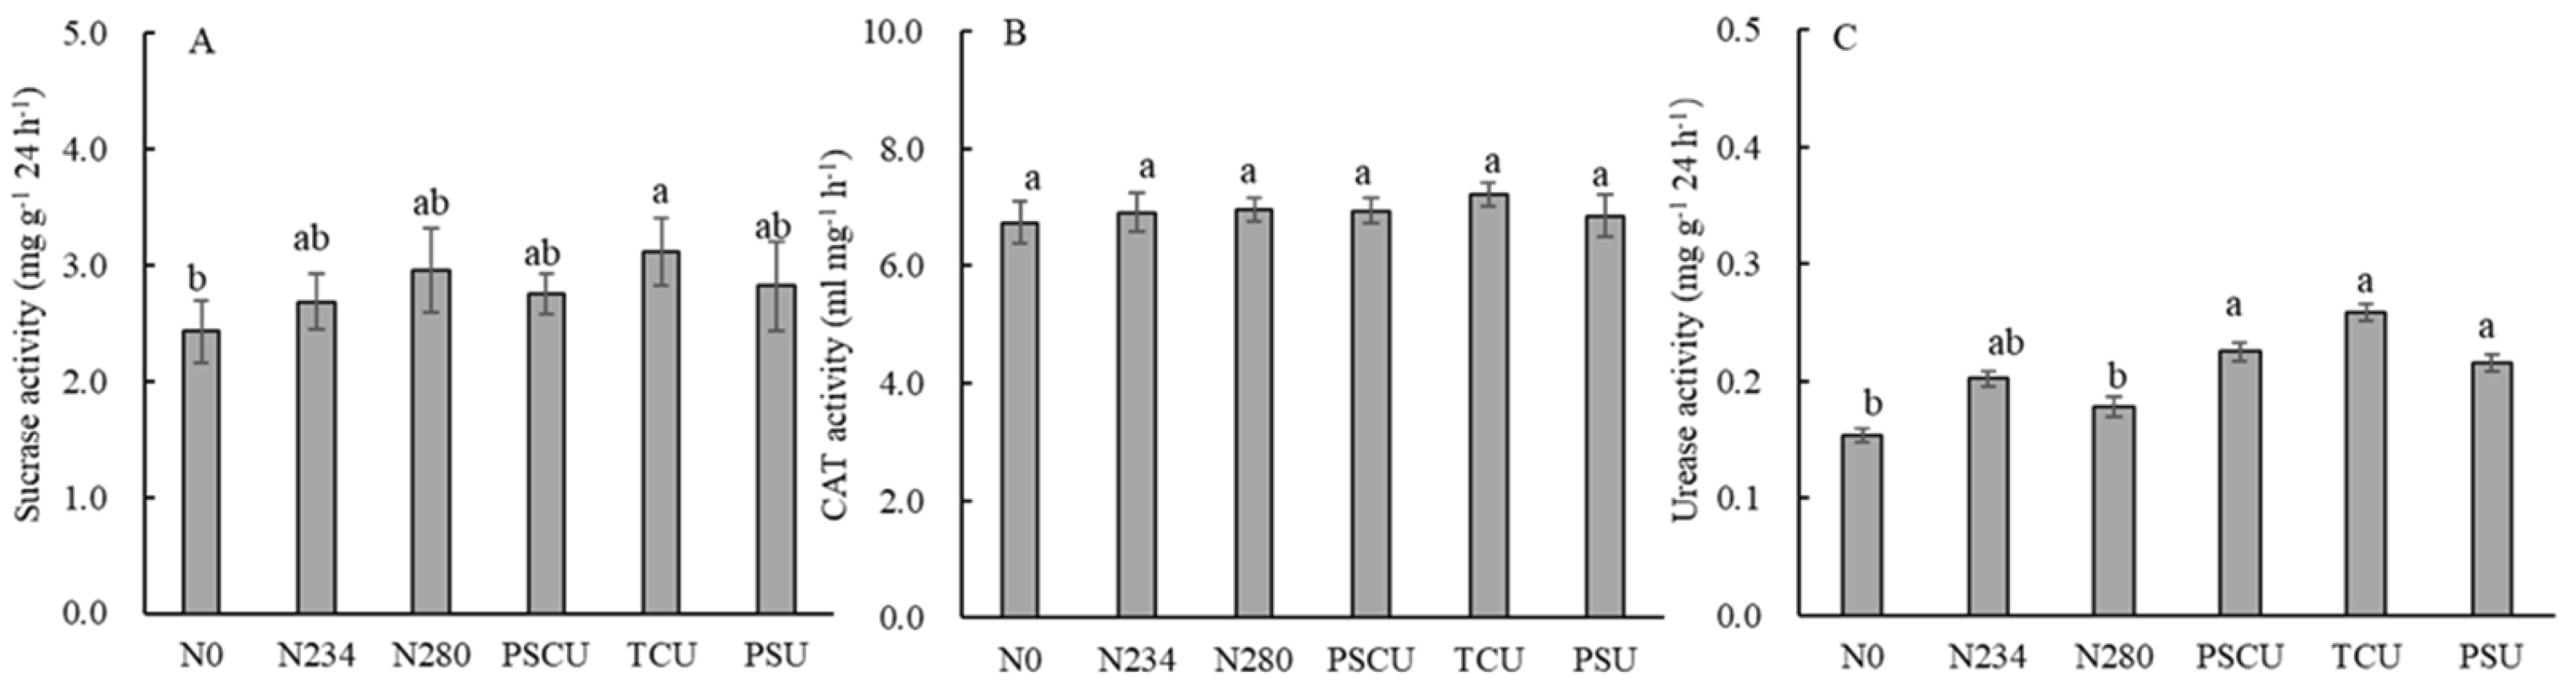
Figure 8.
Reactive N losses and GHG emission in maize production as affected by N treatments. A, reactive nitrogen losses include N2O emission, nitrogen leaching, and NH3 volatilization. B, GHG emissions include those from nitrogen fertilizer application, nitrogen fertilizer production and transportation and other sources (phosphorus and potassium fertilizer; crop management).
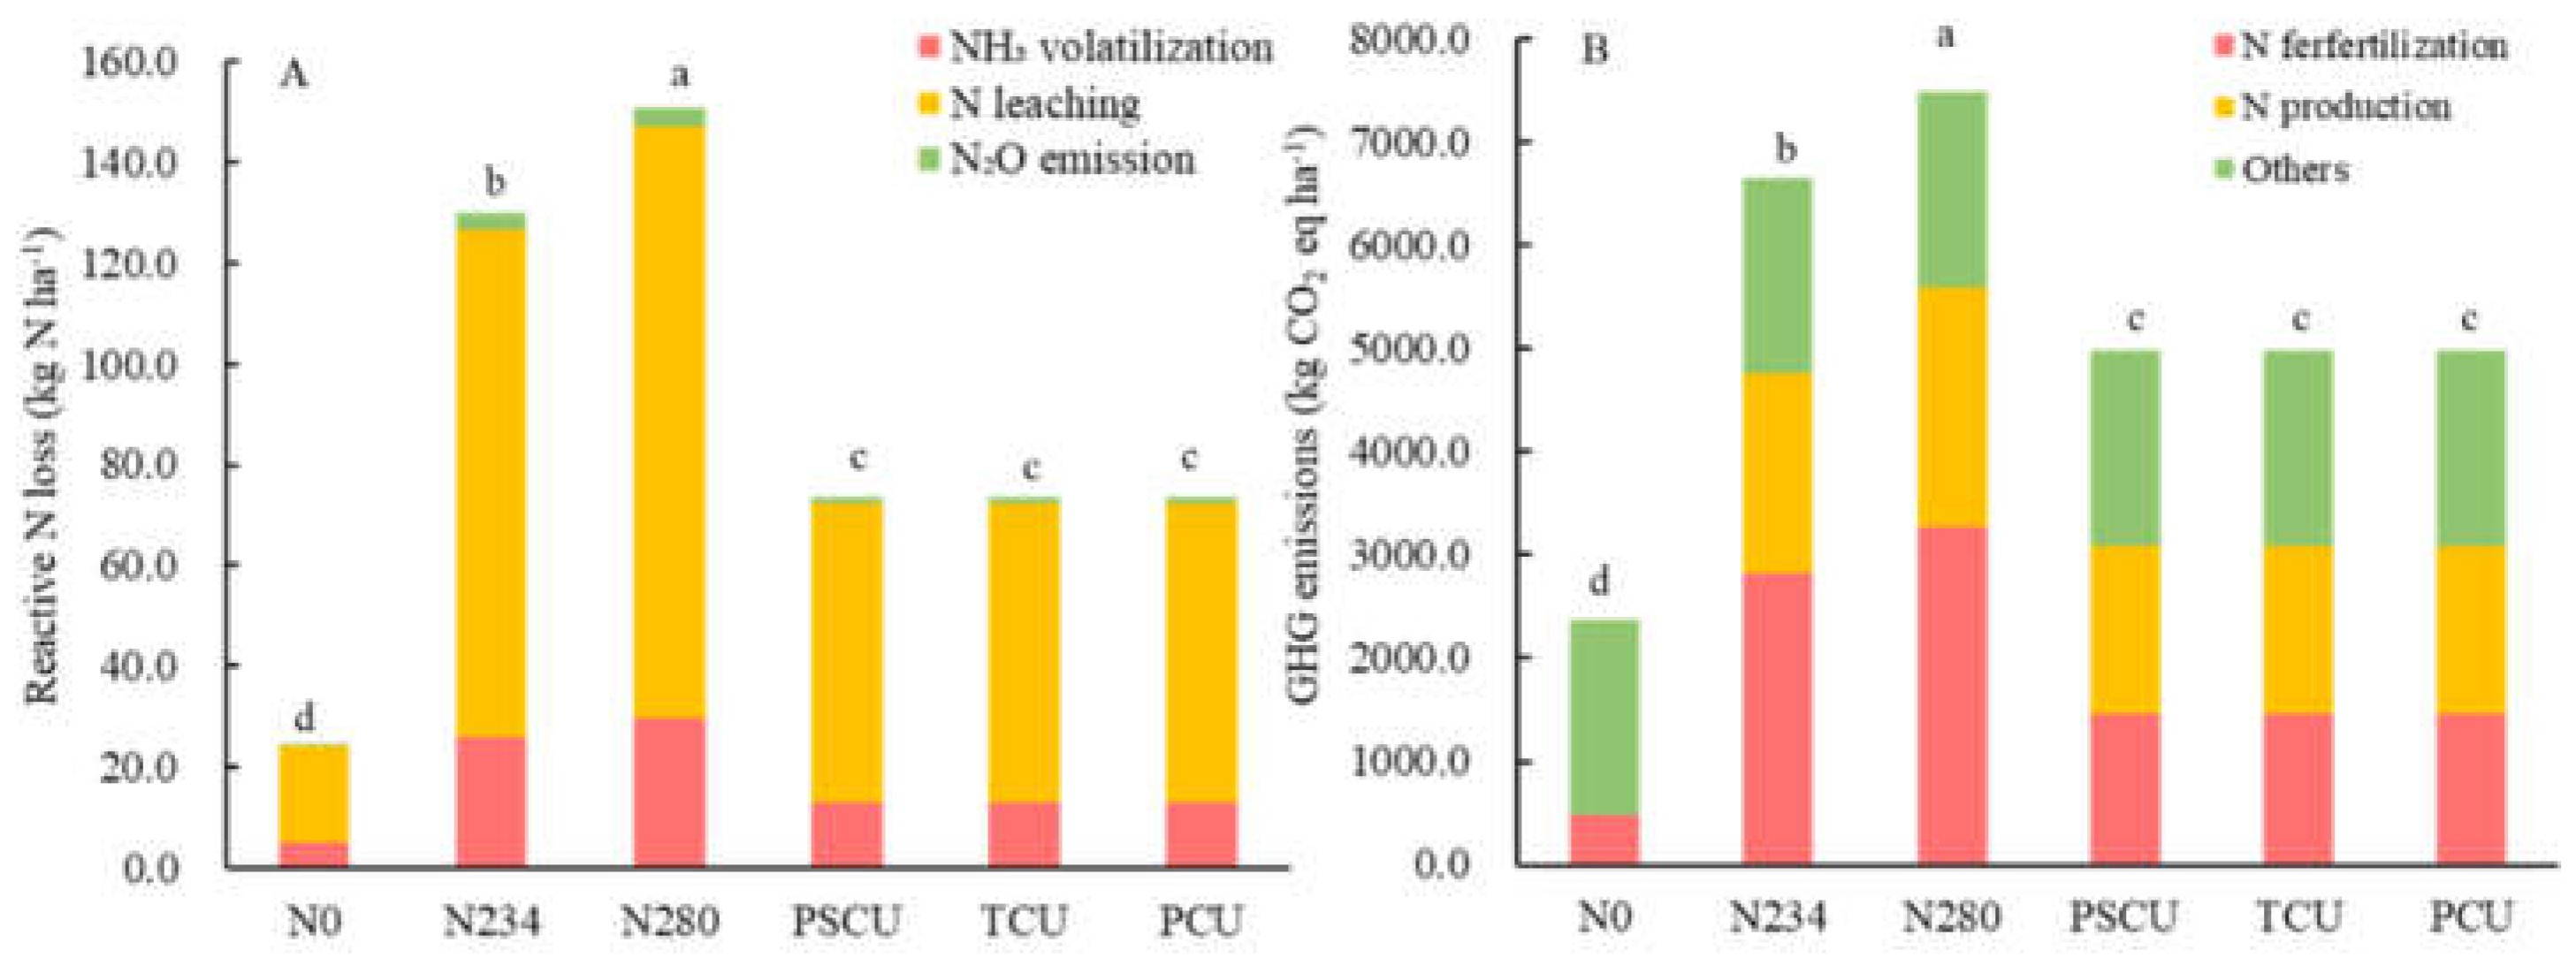
Figure 9.
Reactive N losses and GHG emission intensity in maize production as affected by N treatments in 2019 (A and C) and 2020 (B and D). A and C, Reactive nitrogen losses include N2O emission, nitrogen leaching, and NH3 volatilization and nitrogen runoff. B and D, GHG emissions include those from nitrogen fertilizer application, nitrogen fertilizer production and transportation and other sources (phosphorus and potassium fertilizer; crop management).
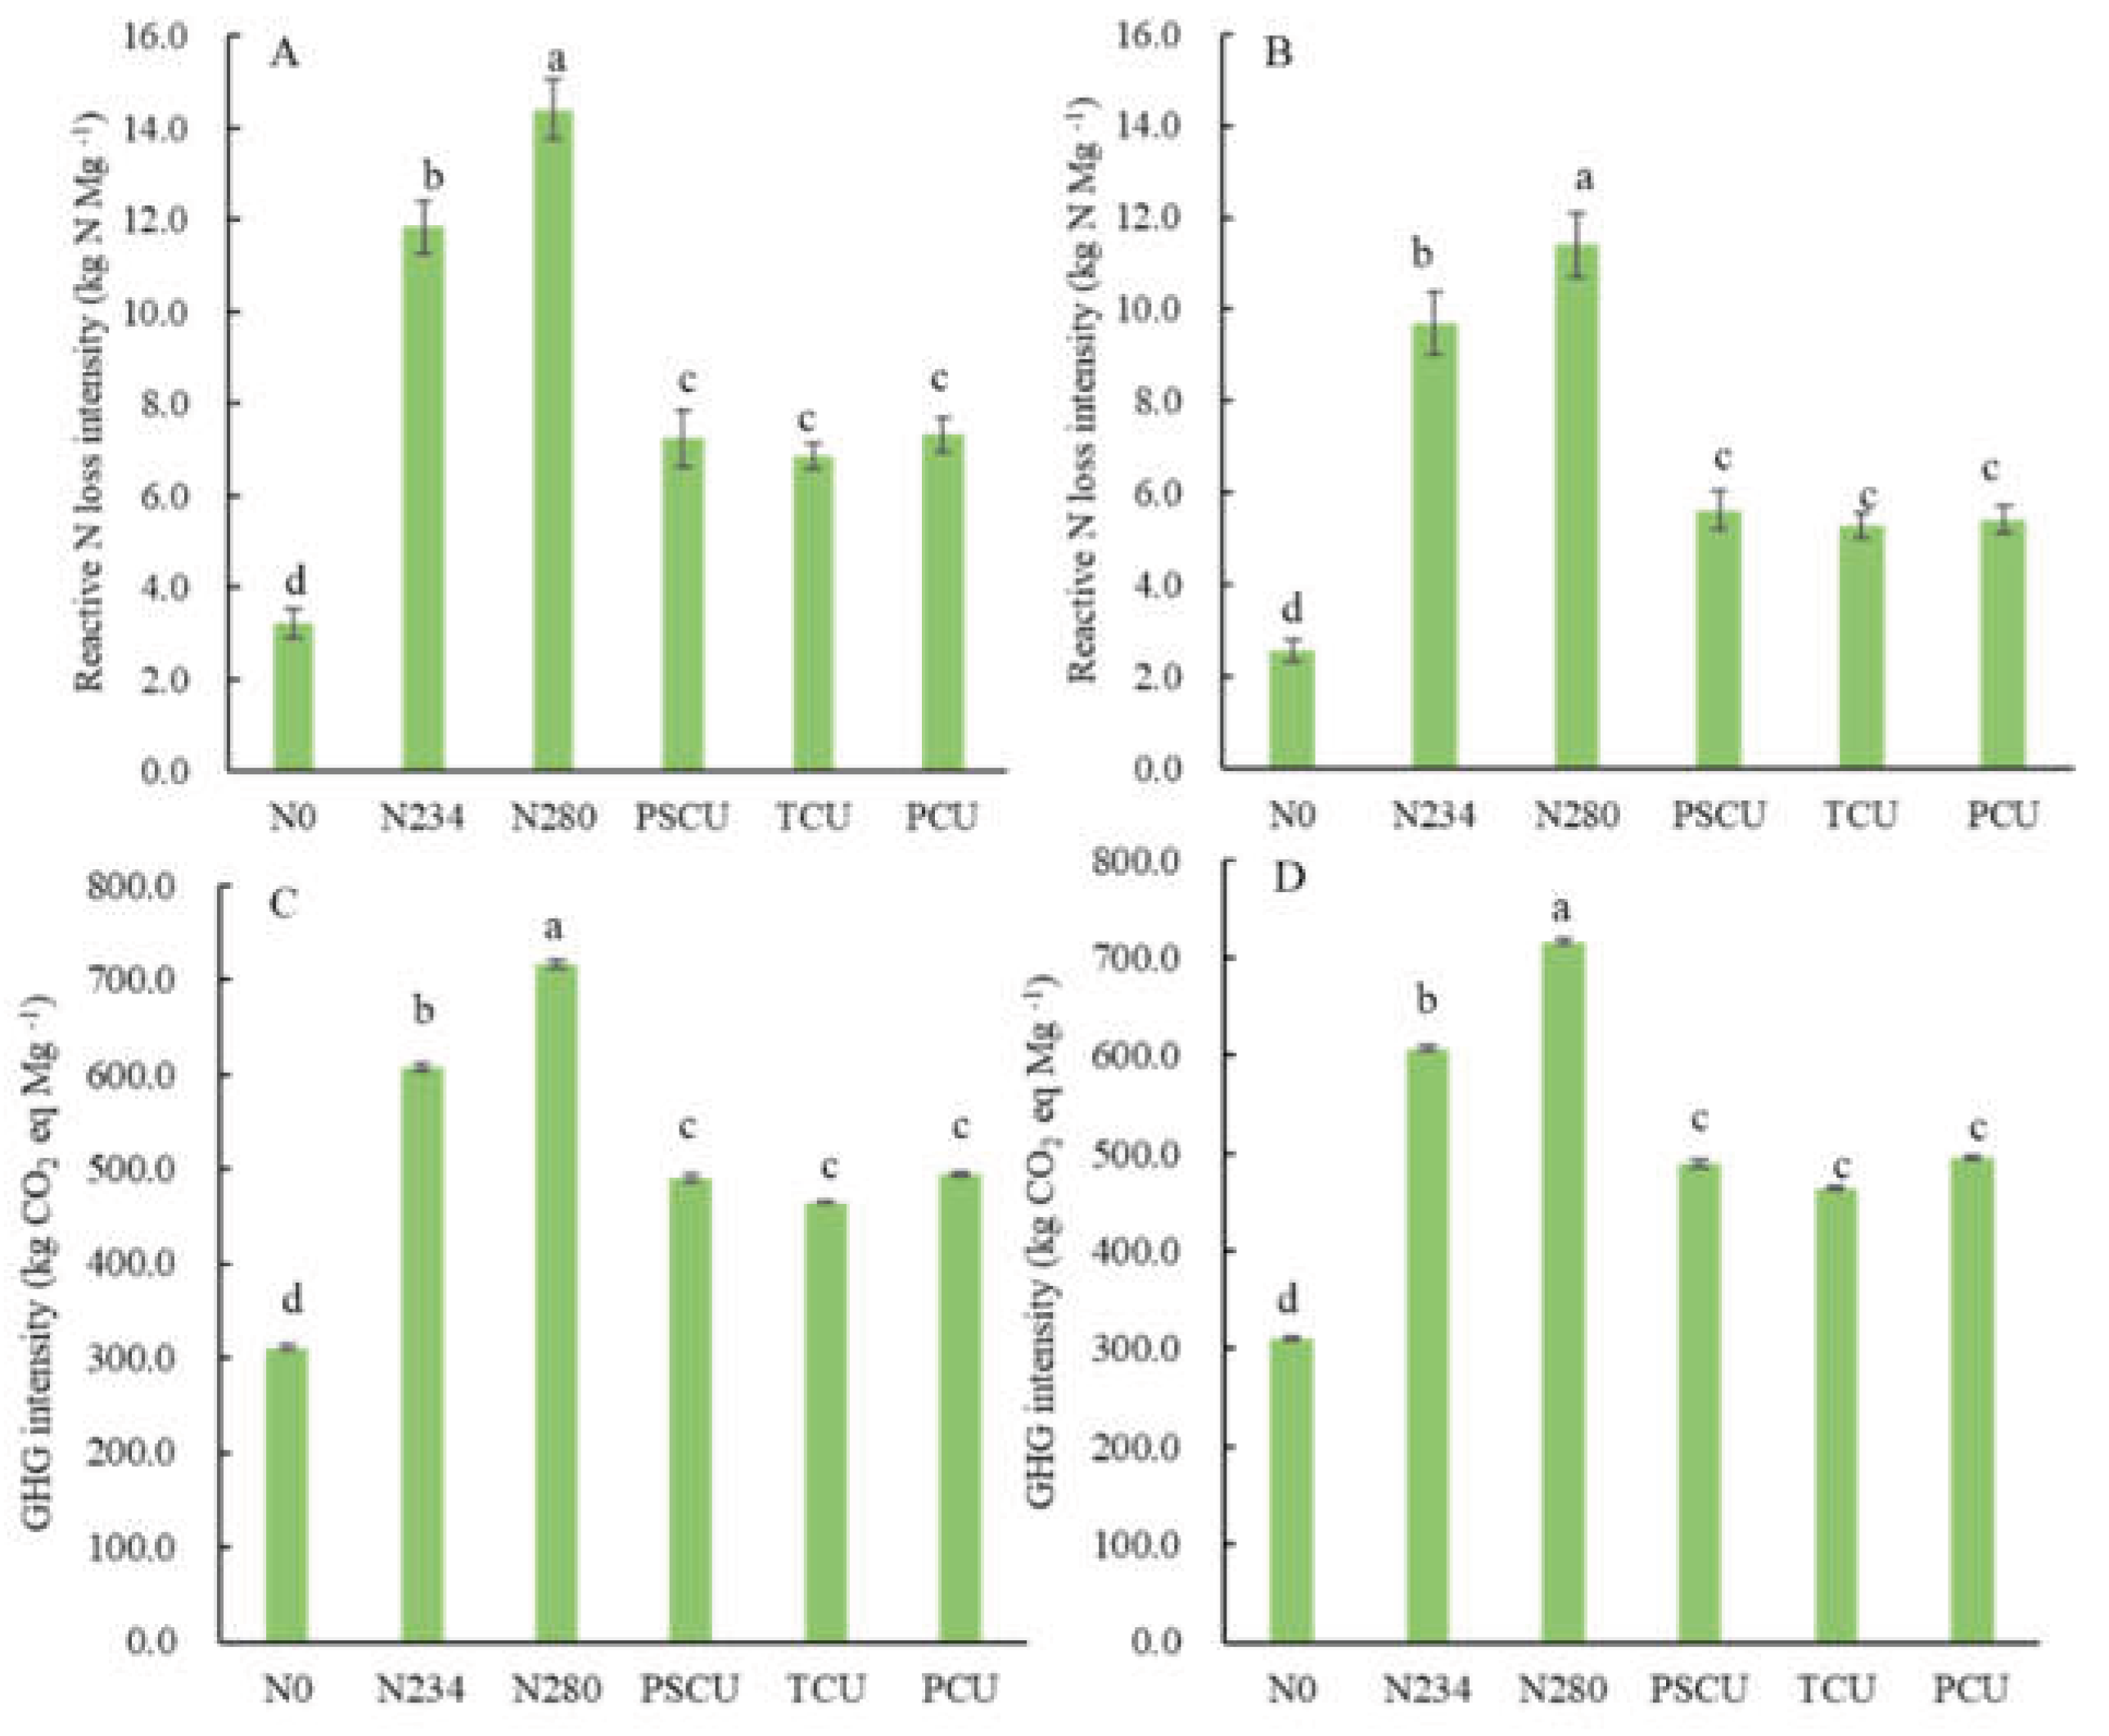

Table 1.
Maize aboveground N uptake and economic benefits under different N treatments in 2019 - 2020.
Table 1.
Maize aboveground N uptake and economic benefits under different N treatments in 2019 - 2020.
| Year | N treatment | GNC | SNC | GNU | SNU | Total N uptake | NHI | PFPN | NUE |
|---|---|---|---|---|---|---|---|---|---|
| (g kg–1) | (g kg–1) | (kg ha–1) | (kg ha–1) | (kg ha–1) | (%) | (kg kg-1) | (%) | ||
| 2019 | N0 | 10.58c | 6.93b | 70.1b | 45.4b | 115.4b | 60.9a | – | – |
| N234 | 13.32ab | 8.42a | 125.4a | 70.5a | 195.9a | 64.1a | 46.9b | 34.4ab | |
| N280 | 13.07ab | 8.81a | 117.7a | 76.8a | 194.5a | 60.8a | 37.4c | 28.2b | |
| PSCU | 13.04ab | 8.72a | 114.3a | 77.7a | 192.0a | 59.9a | 56.5a | 42.5ab | |
| TCU | 12.98c | 8.96a | 119.8a | 84.9a | 204.6a | 58.5a | 59.6a | 49.6a | |
| PCU | 14.06a | 8.50a | 121.8a | 75.4a | 197.2a | 61.8a | 56.0a | 45.4ab | |
| 2020 | N0 | 9.30b | 6.90c | 77.2b | 48.6b | 125.7b | 61.4a | – | – |
| N234 | 13.46a | 11.49a | 152.1a | 132.7a | 284.8a | 53.7a | 56.2b | 72.4ab | |
| N280 | 14.13a | 10.50ab | 161.0a | 120.6a | 281.6a | 57.0a | 47.2c | 59.3b | |
| PSCU | 13.70a | 9.90ab | 154.1a | 111.2a | 265.2a | 58.4a | 72.7a | 83.2ab | |
| TCU | 13.60a | 9.47b | 162.7a | 108.3a | 271.1a | 60.0a | 77.2a | 86.5a | |
| PCU | 13.67a | 9.73b | 159.6a | 114.5a | 274.1a | 58.4a | 75.4a | 88.1a | |
| Source of variance | ☐ | ☐ | ☐ | ☐ | ☐ | ☐ | ☐ | ☐ | |
| Year (Y) | ns | *** | *** | *** | *** | * | *** | *** | |
| N treatment (N) | *** | *** | *** | *** | *** | ns | *** | ** | |
| N*Y | * | ns | ns | ns | ns | ns | ns | ns | |
GNC: grain N concentration; SNC: straw N concentration; GNU: grain N uptake; SNC: straw N uptake; NHI: N harvest index. PFPN: partial factor productivity from applied nitrogen. NUE: N use efficiency. Different letters in each column within given treatment indicate that the means differ significantly (p<0.05). ns: non-significant at the 0.05 probability level; * significant at the 0.05 probability level; ** significant at the 0.01 probability level.
Table 2.
Annual total revenue, cost and net profit of corn production with different N management treatments in 2019-2020.
Table 2.
Annual total revenue, cost and net profit of corn production with different N management treatments in 2019-2020.
| Year | Treatment | Total revenue | Fertilizer cost | Top dressing cost | Other costs | Ecological costs | Net profit |
|---|---|---|---|---|---|---|---|
| ($ ha-1) | |||||||
| 2019 | N0 | 2526.0 | 125.4 | 0.0 | 628.5 | 81.0 | 1062.5 b |
| N234 | 3612.4 | 260.2 | 47.0 | 628.5 | 308.8 | 1739.4 a | |
| N280 | 3447.3 | 286.7 | 47.0 | 628.5 | 353.6 | 1503.0 a | |
| PSCU | 3315.5 | 298.0 | 0.0 | 628.5 | 199.7 | 1560.8 a | |
| TCU | 3531.7 | 293.4 | 0.0 | 628.5 | 199.7 | 1781.5 a | |
| PCU | 3349.9 | 253.0 | 0.0 | 628.5 | 199.7 | 1640.3 a | |
| 2020 | N0 | 3176.6 | 125.4 | 0.0 | 628.5 | 81.0 | 1713.2 b |
| N234 | 4406.7 | 260.2 | 47.0 | 628.5 | 308.8 | 2533.7 a | |
| N280 | 4347.5 | 286.7 | 47.0 | 628.5 | 353.6 | 2403.1 a | |
| PSCU | 4468.9 | 298.0 | 0.0 | 628.5 | 199.7 | 2714.2 a | |
| TCU | 4572.9 | 293.4 | 0.0 | 628.5 | 199.7 | 2822.7 a | |
| PCU | 4309.7 | 253.0 | 0.0 | 628.5 | 199.7 | 2600.0 a | |
Other costs include machinery, irrigation, pesticide, seeds. Net profit = Total revenue - fertilizer cost - top dressing cost - other costs - ecological costs.
Table 3.
Soil physical and chemical Properties under different N treatments in 2020.
| N treatment | pH | Total N | Total P | Total K | Alkaline hydrolysis | Available P | Available K | Organic matter |
|---|---|---|---|---|---|---|---|---|
| (g kg–1) | (g kg–1) | (g kg–1) | of N (mg kg–1) | (mg kg–1) | (mg kg–1) | (mg kg–1) | ||
| N0 | 7.80 a | 0.94 a | 0.73 a | 25.65 a | 47.02 b | 34.58 a | 170.33 a | 18.24 b |
| N234 | 7.52 b | 1.07 a | 0.78 a | 26.43 a | 74.11 a | 31.42 a | 162.00 a | 17.63 b |
| N280 | 7.54 ab | 0.90 a | 0.83 a | 26.00 a | 66.00 a | 35.08 a | 141.33 a | 18.78 b |
| PSCU | 7.55 ab | 1.11 a | 0.85 a | 26.60 a | 71.82 a | 46.50 a | 151.33 a | 21.47 a |
| TCU | 7.66 ab | 1.17 a | 0.90 a | 26.93 a | 68.06 a | 40.92 a | 142.33 a | 23.15 a |
| PCU | 7.52 b | 1.13 a | 0.78 a | 26.31 a | 58.49 ab | 49.75 a | 133.33 a | 22.92 a |
Disclaimer/Publisher’s Note: The statements, opinions and data contained in all publications are solely those of the individual author(s) and contributor(s) and not of MDPI and/or the editor(s). MDPI and/or the editor(s) disclaim responsibility for any injury to people or property resulting from any ideas, methods, instructions or products referred to in the content. |
© 2025 by the authors. Licensee MDPI, Basel, Switzerland. This article is an open access article distributed under the terms and conditions of the Creative Commons Attribution (CC BY) license (http://creativecommons.org/licenses/by/4.0/).
Copyright: This open access article is published under a Creative Commons CC BY 4.0 license, which permit the free download, distribution, and reuse, provided that the author and preprint are cited in any reuse.


