
Submitted:
09 April 2025
Posted:
10 April 2025
You are already at the latest version
Abstract
Maize (corn) (Zea mays L.)) yield is influenced by complex factors including abiotic and biotic stress and inconsistent nutrient use effi-ciency that challenge optimal yield. Standard management recommendations often fall short, prompting interest in intensive manage-ment strategies within an Adaptive Corn Management System (ACMS). To investigate this, we employed an addition/omission tech-nique within a randomized complete block design (RCBD) to compare standard maize management recommendations with an inten-sive management protocol aimed at identifying yield-limiting factors. Our intensive management approach combined early-season bi-ostimulant applications with mid-season supplementation of phosphorus (P), potassium (K), and nitrogen (N) at the V7 stage, followed by foliar fungicides and additional foliar N at the R1 stage. Field trials spanned five Virginia locations over 2022 and 2023 under both ir-rigated and non-irrigated conditions, yielding ten site-years of data. Analysis via ANOVA in JMP® Version 18 with Dunnett’s test re-vealed that the intensive management approach significantly increased grain yield in 3 of 10 experiments. Under non-irrigated condi-tions, the intensive management practices averaged 5.9% higher yield than the standard management check. We observed a higher re-sponse to irrigation in standard management check (34%) than in intensive management check (8.9%). Site-specific irrigation impacts ranged from 14% to 61%. Results emphasize site-specific input recommendations for yield enhancement.
Keywords:
Adaptive Maize Management Systems (ACMS)
; Irrigation
; Standard Management
; Intensive Management
1. Introduction
With the global population projected to exceed 9.8 billion by 2050, agricultural production and efficiency needs to increase to meet the demand for food and fuel [1,2,3]. Two main strategies have historically been employed to increase productivity and efficiency: intensification boosting yield per unit area through increased inputs, particularly fertilizers, irrigating drylands, and novel technologies and extensification involving cultivating more land [3,4,5,6,7]. The latter is less sustainable and is characterized by environmental footprints and is less resilient against pressure of increasing population on land [5,7]. Recent research interests have increasingly focused on intensification as a sustainable strategy, with an emphasis on identifying and addressing yield gaps and yield-limiting factors, especially in grain crops of maize (Zea mays L), wheat (Triticum aestivum), and rice (Oryza sativa), [4,5,8,9]. Maize is one of the intensively managed crops in the United States, covering an approximately 39.1 million hectares, supporting food, fuels, and other industrial purposes. However, the yield of maize is highly variable due to input inefficiencies and weather-related factors leaving a significant gap between its actual and potential yields [8,10]. This gap is particularly pronounced in Virginia, where the average maize yield of 6.8 tons ha-1 is well below the record yield of 15.91 tons ha-1 achieved in 2023, National Corn Growers Association yield contest [11]. Research indicates that yield variability is primarily driven by environmental factors, as well as static recommendations that do not account for changes in the environment [8,9,10,12].
In Virginia, especially on the east coast VA, where soil is largely sandy with lower CEC, the applied N, P, K, and sulfur (S) fertilizers are susceptible to losses into the environment especially with increasing precipitation [12,13]. Among these nutrients N is number one yield limiting factor for maize, which is demanded in the greatest quantity throughout the maize plant growth cycle and severely limiting nutrient in the U.S. Maize Belt [14,15,16]. Weather impacts reduce the available nutrients, and according to [12] up to 11 to 36 kg ha-1 of the principally applied pre-plant or side dressing rates may be lost in incidents when heavy rain coincides with nutrient applications. [17] in a farmer communication bulletin suggested that supplementing with few dozes of about 11 to 35 kg ha-1 of N, K, and S during such periods in the season can replace the lost nutrients. Consistent with [8,9,18] this research suggests that synchronizing nutrient availability with crop demand achievable through split applications via several side dressing and foliar application can correct season deficiency.
Beyond nitrogen, phosphorus (P) is indispensable in maize production, as it achieves the highest harvest index among all nutrients yet remains the least available in the soils [19,20,21]. Phosphorus is the most yield-limiting nutrient, especially in cold soils early in the season that is necessary for early growth[19]. Although most soils in VA (approximately 58%) test high for P, many sites observe early season deficiencies, and some sites respond to P applications [22,23,24]. Other secondary nutrients such as sulfur also play pivotal roles in maize yield. Sulfur deficiency has been increasingly reported in the U.S. Maize Belt due to reduced atmospheric deposition, higher maize grain yields, diminished tillage intensity and increased adoption of sustainable agriculture [25,26]. Seasonal sulfur depletion due to weather events can be corrected by timely supplementation to protect yields from losses [12,17]
Apart from nutrient limitations, maize is vulnerable to several foliar fungal diseases such as gray leaf spot (Cercospora zeae-maydis), northern leaf blight (Exserohilum turcicum), southern rust (Puccinia polysora), and eyespot (Aureobasidium zeae) [27,28,29]. These diseases compromise yield especially in high rainfall regions like Virginia by reducing the plant’s photosynthetic area and weakening stalk strength, leading to lodging and reduced harvestability [27]. Over the past, systemic foliar fungicides application in maize have been given attention to maize, and especially the quinone-outside inhibitors (strobilurin fungicides) due to their additional physiological impacts on maize. These fungicides not only control a broad spectrum of fungal pathogens [29,30] but have also been shown to boost yields even when disease symptoms are not apparent, possibly by enhancing photosynthetic capacity and reducing grain development [29,30,31].
In In the United States, standard maize management typically involves applying approximately one-third of total nitrogen required for the season at or near planting, with the remainder often applied at a fixed pre-determined rate during side-dressing normally at about V4-V6 maize growth stages, [8,12,32]. This static approach assumes normal growing season conditions and does not account for any deviations from the known normal, and there are limited additional tools to guide in-season management to counteract yield losses. Although adaptive practices such as irrigation, fungicides, biostimulants and supplementation of nutrients in the season to correct deficiency can advance yield, their adoption remains low. This static yield-driven recommendations Morris, et al. [32] described it as trial-and-error approaches in crop management. Moreover, recent research aimed at identifying factors often examines these variables in isolation, overlooking the combined effects that arise when multiple factors are applied together. Consequently, farmers lack the necessary insights to effectively implement intensive management practices and enhance their operations within Adaptive Corn Management Systems (ACMS).
To address these challenges, we employed a randomized block design utilizing an omission technique, [33] comparing two management approaches: “standard” management approach based on standard extension recommendations such as Virginia Cooperative Extension (VCE)) for the case of Virginia, and an “intensive” approach incorporating comprehensive management suggestions hypothesized to advance yield. Five distinct treatments were evaluated under each of these strategies, serving as either “additions” when individual treatments are added singly at each level to standard management protocol, or “omissions”: when individual treatments are omitted from the intensive management protocol at each level. This methodology facilitated the evaluation of both individual and combined effects of treatments under standard management approach and intensification approach, allowing for a comparison between standard and intensive management strategies. The study aimed to assess the effectiveness of both practices in improving maize yields and identifying yield-limiting factors crucial for advancing yield in a new management suggestion under ACMS.
2. Materials and Methods
2.1. Study Site Characterization
Over the 2022 and 2023 growing seasons, ten investigations were executed across diverse Virginia sites. In 2022, experiments took place at Blacksburg, New Kent, and Mt. Holly; in 2023, research continued at Mt. Holly and expanded to Suffolk at Tidewater Agricultural Research and Extension Center (TAREC). Before planting, composite soil samples were collected by combining fifteen cores taken from a 15-cm depth taken across the site. These composite soil samples were analyzed for routine parameters pH (1:1), cation exchange capacity (CEC1:1), and extractable nutrients via the Mehlich-1 method (Table 1). The soil types at the experimental sites varied and were delineated as follows. At the Blacksburg site, soils were classified as Braddock and Unison silt loams (Fine, mixed, semiactive, mesic Typic Hapludalt). The Mt. Holly site, soils were described as State fine sandy loam (Fine-loamy, mixed, semiactive, thermic Typic Hapludult). At the New Kent site, soils comprised of Teetotums loam and the Nervarc-Remlik complex, while at the TAREC site, soils were characterized as loamy sand (Fine-loamy, siliceous, semiactive, thermic Typic Hapludult). These sites also varied in tillage practices as well as cropping rotations. The three sites of New Kent, Mt. Holly and Blacksburg sites were managed without tillage, while TAREC was managed by strip-tillage. In terms of rotation, New Kent maize followed soybeans and had a mixed cover crop of rye and hairy vetch terminated before planting. The Blacksburg site was managed with continuous maize with barley cover crops terminated before planting, while Mt. Holly and TAREC sites reestablished fields on the previous season’s soybean and cotton stubble, respectively.
2.2. Site Characterization
Weather during the growing season varied across the site’s years (2022-2023). Specifically, the weather at Blacksburg site was characterized by consistently lower rainfall (0-10 mm) of daily rainfall for the largest part of the growing season except the notable peaks exceeding 50 mm in late September to October (Figure 1a). The Mt. Holly site in 2022 experienced more erratic rainfall patterns, with substantial spikes above 100 mm of daily rainfall occurring in May to June which were periods of fertilizer applications increasing susceptibility to nutrient losses. July to August had consistently lower but uniform peaks of daily average precipitation throughout the season (Figure 1b). Like the Blacksburg site, the New Kent in 2022 received consistently moderate rainfall rarely surpassing 20 mm of daily rainfall but regular, with only two peaks in 40 to 50 mm during May and July which are critical periods for nutrient uptake (Figure 2). At the TAREC location, the end of April to May 5 was completely dry and no rainfall, as well as May 24 to May 29 and May 29 to June 12 periods.The site also experienced 3 heavy peaks of daily rainfall between 50 and 60 in June which was the period for additional fertilizer applications and July which was the period for supplemental foliar nitrogen applications. Mt. Holly 2023 also saw heavy rainfall events, exceeding 50 mm in April, June, and July, which were periods of nutrients application and according to [13], that may reduce the availability of applied nutrients (Figure 3b).
Temperature patterns were also distinctive across these sites. Blacksburg 2022 experienced maximum temperatures reaching 30°C, with a relatively moderate range during the season, potentially reducing extreme heat stress but still impacting nutrient uptake (Figure 1a). Mt. Holly 2022 showed greater fluctuation, with temperatures varying between 25°C and 35°C (Figure 1b). New Kent 2022 had similar temperature ranges, between 25°C and 35°C, but combined with lower daily average rainfall, which likely exacerbated water and nutrient stress (Figure 2). In Mt. Holly 2023, like TAREC site in the same year experienced maximum temperatures consistently hovering between 30°C and 35°C with some days clocking above 35 °C which likely increased heat stress risks, and high evapotranspiration, and affected nutrient availability, uptake efficiency and efficacy of biostimulants (Figure 3a-b).
2.3. Experimental Details
Experimental plots were established at a uniform width of 3.05 m, each containing four maize rows of 0.91 meters. At the Suffolk location, plots were 10.7 meters in length, whereas plots at other sites were 9.14 meters long. In eight trials, the corn hybrid Progeny 9714® (Progeny Ag Products) which was a 114-day maturing maize hybrid was planted, while two experiments in 2023 at Suffolk used the 115-day maturity DeKalb 65-20® hybrid (Bayer Crop Science, Research Triangle Park, USA). Planting was timed based on optimal weather and soil conditions: in 2022, planting occurred on May 5 (Blacksburg), April 21 (Mt. Holly in 2022), and May 4 (New Kent), and in 2023 on April 18 (Suffolk) and April 21 (Mt. Holly in 2023).
2.4. Experimental Design and Treatments
The experiment was implemented using an addition/omission technique in RCBD to compare the intensive approach, against standard grower practice in the region [33]. For specific information on the maize standard input recommendations in Virginia, visit the detailed Virginia Agronomy Handbook which is updated regularly [34,35]. The standard management approach involved planting high-yield hybrid cultivars at seeding rates of 65,000-75,000 seeds ha-1, customized to each site’s yield potential. Then standard rates for N, P, K, and other nutrients were applied according to the site-specific yield goal (considering site’s yield potential, soil types, and soil test results). Specifically, nitrogen (N) was split into two parts: one-third at planting and the remaining two-thirds at the V4-V6 growth stages. For other nutrients (P, K and S), these were applied preplant, which marked the standard management approach for all the study sites that functioned as a foundation for the study. Standard nutrient application rates varied by sites and environmental conditions as well as the site-specific yield goals. At Blacksburg, both irrigated and non-irrigated plots received 211 kg ha-1 of nitrogen (N), 109 kg ha-1 of phosphorus (P), and 109 kg ha-1 of potassium (K). At Mt. Holly, N was consistently applied at 211 kg ha-1 across both irrigation regimes; however, P and K rates varied by irrigation status, with non-irrigated plots receiving 78 kg ha-1 of P and 111 kg ha-1 of K, while irrigated plots received lower fertilizer rates at 67 kg ha-1 of P and 39 kg ha-1 of K. At New Kent site, N was applied at 185 kg ha-1, while both P and K were applied at 44 kg ha-1 for both irrigated and non-irrigated.
Following the implementation of standard recommendations described above, which functioned as the “standard management check,” the standard management treatments were applied as indicated in Table 2. Specifically, each of the five (5) strategies were added singly to the standard management check at each level resulting in five treatment combinations comparable to the standard management protocol (Table 2). Intensive management incorporated all five (5) inputs together. For comparison, each of the five strategies were removed (“omission”) singly at each level resulting in five (5) treatment combinations different by one treatment which was omitted and are comparable to intensive management (Table 2).
These treatments were added as follows: The early season biostimulants (+Biologicals) were applied from a branded product (Biopath®) sourced from Response Inc (Raleigh, NC, USA). The biostimulants were mixed at a rate of 1,235 ml ha-1 and applied foliar at V4. To supplement the nutrients availability, an additional nitrogen (+Sidedress N) at 45 kg ha-1 and additional phosphorus (P) and potassium (K) (+P and K) at 56 kg ha-1 were applied from granular sources of urea, monoammonium phosphate, and muriate of potash for N, P, and K respectively by broadcasting at V6 maize stage. This was followed by application of an additional foliar nitrogen (+CoRon®) late in the season from a branded nitrogen product “CoRon®.” This was mixed at a rate of 2.5 L ha-1 to supply 22.5 kg ha-1. During this time, foliar fungicide (Headline®) (+Headline®) is a quinone-outside inhibitors (strobilurin fungicides) were applied in a separate tank at 251 ml of a product ha-1 to protect the crop from any possible fungal diseases.
Each of these arrangements at each location featured both irrigated and non-irrigated experiments. Each of the irrigated and non-irrigated studies were established side-by-side at 3 locations, except at Mt. Holly location where the irrigated and non-irrigated studies were at a separate location due to the logistics involved in installation of irrigation system. At all sites, meteorological data were sourced from the nearby Weather Stem stations managed by the College of Agriculture and Life Sciences, Virginia Tech (https://vt-arec.weatherstem.com/data). The site’s meteorological characteristics guided the irrigation scheduling.
2.4. Data Collection and Analysis
Grain yield was determined by harvesting the two central rows of each experimental plot using a Massey Ferguson 8XP combine (Massey Ferguson Corporation, Duluth, GA, USA) equipped with a HarvestMaster Classic Graingauge (HarvestMaster, Logan, UT, USA). The raw yield data were standardized to 15.5% moisture and expressed in kg ha-1. Initially, data from all site-years across various locations were pooled and analyzed using analysis of variance (ANOVA) in JMP® Version 18 (SAS Institute Inc., Cary, NC). Dunnett’s test was employed to compare each treatment against its respective control [36]. In this analysis, year and location were treated as random effects, while treatments and environment (irrigation status) were considered fixed factors, capturing both main effects and interactions. Due to significant variability observed across years and locations, a final analysis was conducted separately for each environment (irrigation status) to better elucidate treatment effects within each management level (standard and intensive). For treatment comparisons, separate ANOVAs followed by Dunnett’s test at a 90% confidence level were performed. Specifically, standard management treatments were compared to the standard management check, and intensive management treatments were compared to the intensive management check.
3. Results
Effect of Irrigation, Management Levels, and Treatments on Grain Yield
Averaged across all sites and years, irrigation consistently enhanced yields relative to non-irrigated conditions, although the magnitude varied by management strategy (Table 3 and Table 4). Under the intensive management check, irrigation boosted yields ranging from -6 at Blacksburg to 38% at Mt. Holly in 2022 growing season averaging 8.9%. For standard management check, irrigation response was higher with grain yield enhancement ranging from 14% at Mt. Holly in 2023 to 61% at TAREC averaging 34% (Table 3). These findings highlight the critical benefits of tailoring management strategies to site-specific challenge. Given that TAREC had an early drought which coincided with early season nutrient application, irrigation during that critical period increased nutrient uptake, enhanced plant cooling and photosynthesis resulted in greater yield compared to non-irrigated.
A comparison of standard and intensive management check treatments revealed that statistically significant differences were infrequently observed, occurring in only three out of ten experiments. Specifically, two of these significant findings emerged from non-irrigated intensive management checks, while only one was observed under the standard irrigated check. On average, the intensification strategy (intensive management check) produced a 5.9% yield gain compared to standard management checks in non-irrigated conditions; however, this advantage was rarely detected under irrigated conditions (Table 3 and Table 4).
Under the standard management, the addition of supplemental nitrogen (+Sidedress N) through sidedress exhibited a significant influence at three of the of 10 sites with two of them showing lower yields compared to standard check (†Standard management check) while the other two treatments (+Headline®, +P and K) each had positively significant impact at two of 10 sites with only one showing higher yield than the standard management check. The +Biological treatment was effective only at the Suffolk non-irrigated site, where it raised yield from 8,685 kg ha⁻¹ in the standard check to 14,238 kg ha⁻¹, while +P and K, and +Sidedress N their addition at TAREC under non-irrigated conditions in 2023 enhanced yield from 8,685 kg ha-1 to 15,545, and 13,659 kg ha⁻¹ respectively. Additionally, when fungicides (+Headline) were added into the irrigated conditions at TAREC, yield increased from 13,692 to 16,122 kg ha-1 (Table 3). The lower yields observed with additional nitrogen may be attributed to nutrient imbalances that compromise grain development, a finding consistent with Subedi and Ma [37], confirming yield variation due to nitrogen imbalance that enhances vegetative growth at the expense of yield.
Under intensive management strategies, fewer statistically significant treatment effects emerged. With exception of phosphorus and potassium (-P and K) which when removed from intensive protocols diminished yields at the Blacksburg non-irrigated site, yet not limiting to yields at Suffolk under irrigation. The rest of biological (-Biological) and sidelining sidedress nitrogen (-Sidedress N) when removed from the intensive management checks resulted in yielded notable improvements at Suffolk. Notably, yields increased from 14,645 reaching 16,226 kg ha⁻¹ and from 12,810 to 16,337 kg ha⁻¹ when biological and -Sidedress N inputs were excluded. Pre-plant soil analyses (Table 2) revealed high baseline nutrient levels at some sites, indicating limited responsiveness to further nutrient additions [38,39]. Biological amendments, recognized for alleviating physiological stress and boosting nutrient uptake [39,40], may account for the increased yields under non-irrigated conditions with biological application and the improvements observed when such inputs were omitted under irrigated conditions at Suffolk in 2023.
Averaged across sites (Table 4), yield improvements ranged from 71% observed when sidedress N was omitted from irrigated intensive treatments at Blacksburg to 179% when +Sidedress N was added to standard non-irrigated strategies at Suffolk in 2023. The effects of treatments averaged across site-years under irrigated conditions, the effects of addition of treatments from standard management check ranged from averaged 91% when +P and K were added to 99% when +Biological were added. Conversely under the intensive management strategies, the impact ranged from 95% when extra sidedress N (-Sidedress N) were removed to 102% when the biological products (-Biological) were removed. Under non-irrigated settings, average treatment effects spanned from 102% with foliar N (+CoRon) application to 119% with extra sidedress N (+Sidedress N) under standard management, while under intensive management approach, the effect ranged from 95% with phosphorus and potassium (-P and K) to 103% with biological (-Biological) when omitted (Table 4). These results indicate the critical importance of accurately identifying yield-limiting factors and tailoring management strategies accordingly.
4. Discussion
The findings of this study underscore the critical role of irrigation in enhancing maize yields across various agricultural landscapes, particularly under the Adaptive Maize Management Systems (ACMS). The findings also highlight the need for site specific management rather than a static recommendation. The consistent yield improvements linked to irrigation, but with great variability by site with impacts ranging from -6 to 61% with the greatest impacts observed under standard management practices, highlight the significance of site-specific water management in optimizing crop production [15]. This is due to the variability in the environmental and soil conditions that required different management to improve nutrient availability, alleviate stress and improve growth [10], illustrating necessity of irrigation for maintaining agricultural sustainability, especially in areas prone to drought. Additionally, the study revealed that the effects of management strategies such as standard versus intensive significantly influenced yield outcomes variably with 5.9% more yield under intensive than standard further showing the portential of intensification in increasing food and fuels. The intensification strategy enhanced nutrient availability by correcting deficiencies that happen in the season from nutrient losses, which is common in sandy soil under heavy rainfall conditions as explained by [12]. In this context, the standard management strategy yielded a more substantial response to irrigation, which aligns with findings from [41] that show conventional practices outperform more intensive strategies in certain environments. This disparity suggests that while intensive management could incorporate a broader array of treatments and costs, its possibility of increasing yield upon specific environmental conditions and crop requirements, further indicating the need for site-specific conditions.
The importance of tailored nutrient management strategies is further illuminated by the results. Notably, the variable impact of supplemental nitrogen and fungicides emphasizes the need for site-specific applications. Excessive nitrogen can lead to imbalances that detract from reproductive growth, [37] due to shift in growth dynamics toward vegetation at the expense of grain development. The study’s observation of inconsistent treatment effects across different sites also speaks to the complexity of agricultural ecosystems. Factors such as soil nutrient levels, weather variability, and local farming practices can significantly influence treatment efficacy and the variability across environmental conditions involved in this experiment explains the variability observed on treatments [15,29,42]. For example, the variability in weather noted in Figures 1a to 3a-b) explains the response of treatments such as fungicides and biostimulants during the period of early droughts at TAREC and influence of moisture on disease development in irrigated studies.
5. Conclusions
Irrigation has consistently proven to boost maize yields across different sites and years, highlighting its crucial role within Adaptive Corn Management Systems (ACMS). The effects of individual treatment strategies were infrequently observed, with specific site responses uncovering limitations in the current static management guidelines. Notably, no treatment combination exhibited reliable consistent synergistic effects across all experimental locations. These results emphasize the importance of dynamic, site-specific management practices in optimizing maize yields, as some sites experienced an increase while others saw reductions depending on the addition or omission of certain treatments. For example, results demonstrated that irrigation into standard management practice suggestions could increase yields by up to 61%, with an average improvement of 34%. Conversely, irrigating the intensive management strategy resulted in an average gain of just 8.9%, demonstrating the capacity of irrigation to drive yield higher and further showcasing that the environmental conditions were the number one factor influencing yield. At the TAREC site, incorporating supplemental sidedress nitrogen boosted yields from 8,685 kg ha⁻¹ to 15,545 kg ha⁻¹. Similarly, in Suffolk, the application of a biological treatment elevated yields from 8,685 kg ha⁻¹ to 14,238 kg ha⁻¹ under non-irrigated conditions. Interestingly, in intensive trials at Suffolk, the exclusion of biological inputs and sidedress nitrogen led to yields surpassing 16,200 kg ha⁻¹. These varying yield responses indicate that conventional, yield-focused recommendations fail to address the complex, season-long losses, and nutrient imbalances prevalent in diverse agricultural environments. The findings of this study emphasized site-specific management, and irrigation in advancing yield of corn under variable environmental conditions.
Data availability
All the data and supporting materials for this study are available on paper and the referred materials for the methods and the studies that were conducted.
Conflict of Interest
No conflicts of interest. This research was conducted following the established research ethical standards, and no funders, industry or collaborative relationships that would affect the outcomes of this study.
Abbreviations
The following abbreviations are used in this manuscript:
| ACMS | Adaptive Maize Management Systems |
| CEC | Cation exchange capacity |
| VCE | Virginia Cooperative Extension |
| TAREC | Tidewater Agricultural Research and Extension Center |
References
- UNESCO. ““World Population Prospects”.” United Nations. (accessed March 4, 2025).
- D. Hemathilake and D. Gunathilake, “Agricultural productivity and food supply to meet increased demands,” in Future foods: Elsevier, 2022, pp. 539-553.
- J. A. Burney, S. J. Davis, and D. B. Lobell, “Greenhouse gas mitigation by agricultural intensification,” Proceedings of the national Academy of Sciences, vol. 107, no. 26, pp. 12052-12057, 2010. [CrossRef]
- J. Pretty and Z. P. Bharucha, “Sustainable intensification in agricultural systems,” Annals of botany, vol. 114, no. 8, pp. 1571-1596, 2014. [CrossRef]
- K. G. Cassman, “Ecological intensification of cereal production systems: yield potential, soil quality, and precision agriculture,” Proceedings of the National Academy of Sciences, vol. 96, no. 11, pp. 5952-5959, 1999.
- K. G. Cassman, A. Dobermann, and D. T. Walters, “Agroecosystems, nitrogen-use efficiency, and nitrogen management,” AMBIO: A Journal of the Human Environment, vol. 31, no. 2, pp. 132-140, 2002.
- J. A. Foley et al., “Solutions for a cultivated planet,” Nature, vol. 478, no. 7369, pp. 337-342, 2011. [CrossRef]
- M. L. Ruffo, L. F. Gentry, A. S. Henninger, J. R. Seebauer, and F. E. Below, “Evaluating management factor contributions to reduce corn yield gaps,” Agronomy Journal, vol. 107, no. 2, pp. 495-505, 2015. [CrossRef]
- N. D. Mueller, J. S. Gerber, M. Johnston, D. K. Ray, N. Ramankutty, and J. A. Foley, “Closing yield gaps through nutrient and water management,” Nature, vol. 490, no. 7419, pp. 254-257, 2012. [CrossRef]
- L. S. Rathore, M. Kumar, R. T. McNider, N. Magliocca, and W. Ellenburg, “Contrasting corn acreage trends in the Midwest and Southeast: The role of yield, climate, economics, and irrigation,” Journal of Agriculture and Food Research, vol. 18, p. 101373, 2024.
- NCGA. “The 60th Annual Yield Contest.” (accessed 20, 2025).
- M. S. Reiter, W. H. Frame, and W. E. Thomason, “Consider Your Whole System: Nitrogen and Sulfur Leaching Potential in Virginia,” 2018.
- W Hunter Frame. “Excess rains and leaching of nitrogen, potassium and sulfur https://blogs.ext.vt.edu/ag-pest-advisory/files/2015/07/Excess-rains-and-leaching-of-nitrogen.pdf.” (accessed 20, 2025).
- I. A. Ciampitti and T. J. Vyn, “Physiological perspectives of changes over time in maize yield dependency on nitrogen uptake and associated nitrogen efficiencies: A review,” Field Crops Research, vol. 133, pp. 48-67, 2012. [CrossRef]
- C. J. Ransom et al., “Improving publicly available corn nitrogen rate recommendation tools with soil and weather measurements,” Agronomy Journal, vol. 113, no. 2, pp. 2068-2090, 2021. [CrossRef]
- D. Barker and J. Sawyer, “Variable rate nitrogen management in corn: Response in two crop rotations,” Journal of Soil and Water Conservation, vol. 72, no. 3, pp. 183-190, 2017. [CrossRef]
- W. H. Frame, “Excess rains and leaching of nitrogen, potassium and sulfur https://blogs.ext.vt.edu/ag-pest-advisory/files/2015/07/Excess-rains-and-leaching-of-nitrogen.pdf,” 2024.
- N. K. Fageria and V. C. Baligar, “Enhancing nitrogen use efficiency in crop plants,” Advances in agronomy, vol. 88, pp. 97-185, 2005. [CrossRef]
- I. Holford, “Soil phosphorus: its measurement, and its uptake by plants,” Soil Research, vol. 35, no. 2, pp. 227-240, 1997.
- J. L. Kovar and N. Claassen, “Soil-root interactions and phosphorus nutrition of plants,” Phosphorus: agriculture and the environment, vol. 46, pp. 379-414, 2005.
- E. Truog, “The determination of the readily available phosphorus of soils 1,” Agronomy Journal, vol. 22, no. 10, pp. 874-882, 1930.
- A. N. Sharpley, “Dependence of runoff phosphorus on extractable soil phosphorus,” Wiley Online Library, 0047-2425, 1995.
- S. Donohue and S. Heckendorn, “Soil test recommendations for Virginia,” Virginia Cooperative Extension Service Publ, vol. 834, pp. 23-27, 1994.
- M. M. Alley, M. E. Martz, P. H. Davis, and J. Hammons, “Nitrogen and phosphorus fertilization of corn,” 2009.
- J. Camberato, S. Casteel, and K. Steinke, “Sulfur deficiency in corn, soybean, alfalfa, and wheat,” ed: Purdue University Extension. https://www. extension. purdue. edu/extmedia/AY …, 2022.
- K. Steinke, J. Rutan, and L. Thurgood, “Corn response to nitrogen at multiple sulfur rates,” Agronomy Journal, vol. 107, no. 4, pp. 1347-1354, 2015. [CrossRef]
- D. S. Mueller et al., “Corn yield loss estimates due to diseases in the United States and Ontario, Canada, from 2016 to 2019,” Plant Health Progress, vol. 21, no. 4, pp. 238-247, 2020.
- J. M. Ward, E. L. Stromberg, D. C. Nowell, and F. W. Nutter Jr, “Gray leaf spot: a disease of global importance in maize production,” Plant disease, vol. 83, no. 10, pp. 884-895, 1999. [CrossRef]
- K. A. Wise et al., “Meta-analysis of yield response of foliar fungicide-treated hybrid corn in the United States and Ontario, Canada,” PLoS One, vol. 14, no. 6, p. e0217510, 2019. [CrossRef]
- K. Wise and D. Mueller, “Are fungicides no longer just for fungi? An analysis of foliar fungicide use in corn,” APSnet Features. doi, vol. 10, 2011. [CrossRef]
- K. Wise, “Fungicide efficacy for control of corn diseases,” Crop Prot Network, 2018.
- T. F. Morris et al., “Strengths and limitations of nitrogen rate recommendations for corn and opportunities for improvement,” Agronomy Journal, vol. 110, no. 1, pp. 1-37, 2018. [CrossRef]
- A. Ades, N. Welton, and G. Lu, “Introduction to mixed treatment comparisons,” Bristol: MRC Health Services Research Collaboration, 2007.
- A. Abaye et al., “Virginia Cooperative Extension Agronomy Handbook 2023,” 2023.
- E. Bendfeldt, “Agronomy Handbook 2023: Part VII. Soil Health Management,” 2023.
- K. T. Klasson, “A Non-iterative Approximation for Critical Value for Dunnett’s Test,” ARS USDA, Southern Re-gional Research Center. https://www. ars. usda. gov/ARSUserFiles/60540520/CriticalValuesForDunnett. pdf, 2023.
- K. Subedi and B. Ma, “Assessment of some major yield-limiting factors on maize production in a humid temperate environment,” Field crops research, vol. 110, no. 1, pp. 21-26, 2009. [CrossRef]
- D. Franzen et al., “Performance of Selected Commercially Available Asymbiotic N-fixing Products in the North Central Region. North Dakota State University,” ed, 2024.
- H. Naseem and A. Bano, “Role of plant growth-promoting rhizobacteria and their exopolysaccharide in drought tolerance of maize,” Journal of Plant Interactions, vol. 9, no. 1, pp. 689-701, 2014. [CrossRef]
- C. Sible and F. Below, “Role of Biologicals in Enhancing Nutrient Efficiency in Corn and Soybean,” Crops & Soils, vol. 56, no. 2, pp. 13-19, 2023. [CrossRef]
- K. J. Mahoney, J. H. Klapwyk, G. A. Stewart, W. S. Jay, and D. C. Hooker, “Agronomic management strategies to reduce the yield loss associated with spring harvested corn in Ontario,” American Journal of Plant Sciences, vol. 6, no. 02, p. 372, 2015. [CrossRef]
- C. Bradley and K. Ames, “Effect of foliar fungicides on corn with simulated hail damage,” Plant Disease, vol. 94, no. 1, pp. 83-86, 2010. [CrossRef]
Figure 1.
Monthly rainfall totals (mm) and temperatures (°c) recorded during the 2022 field trial period: (a) Minimum, and Maximum daily temperatures, and average daily precipitation at Blacksburg site; (b) Minimum, and Maximum daily temperatures, and average daily precipitation at Mt. Holly 2022 site.
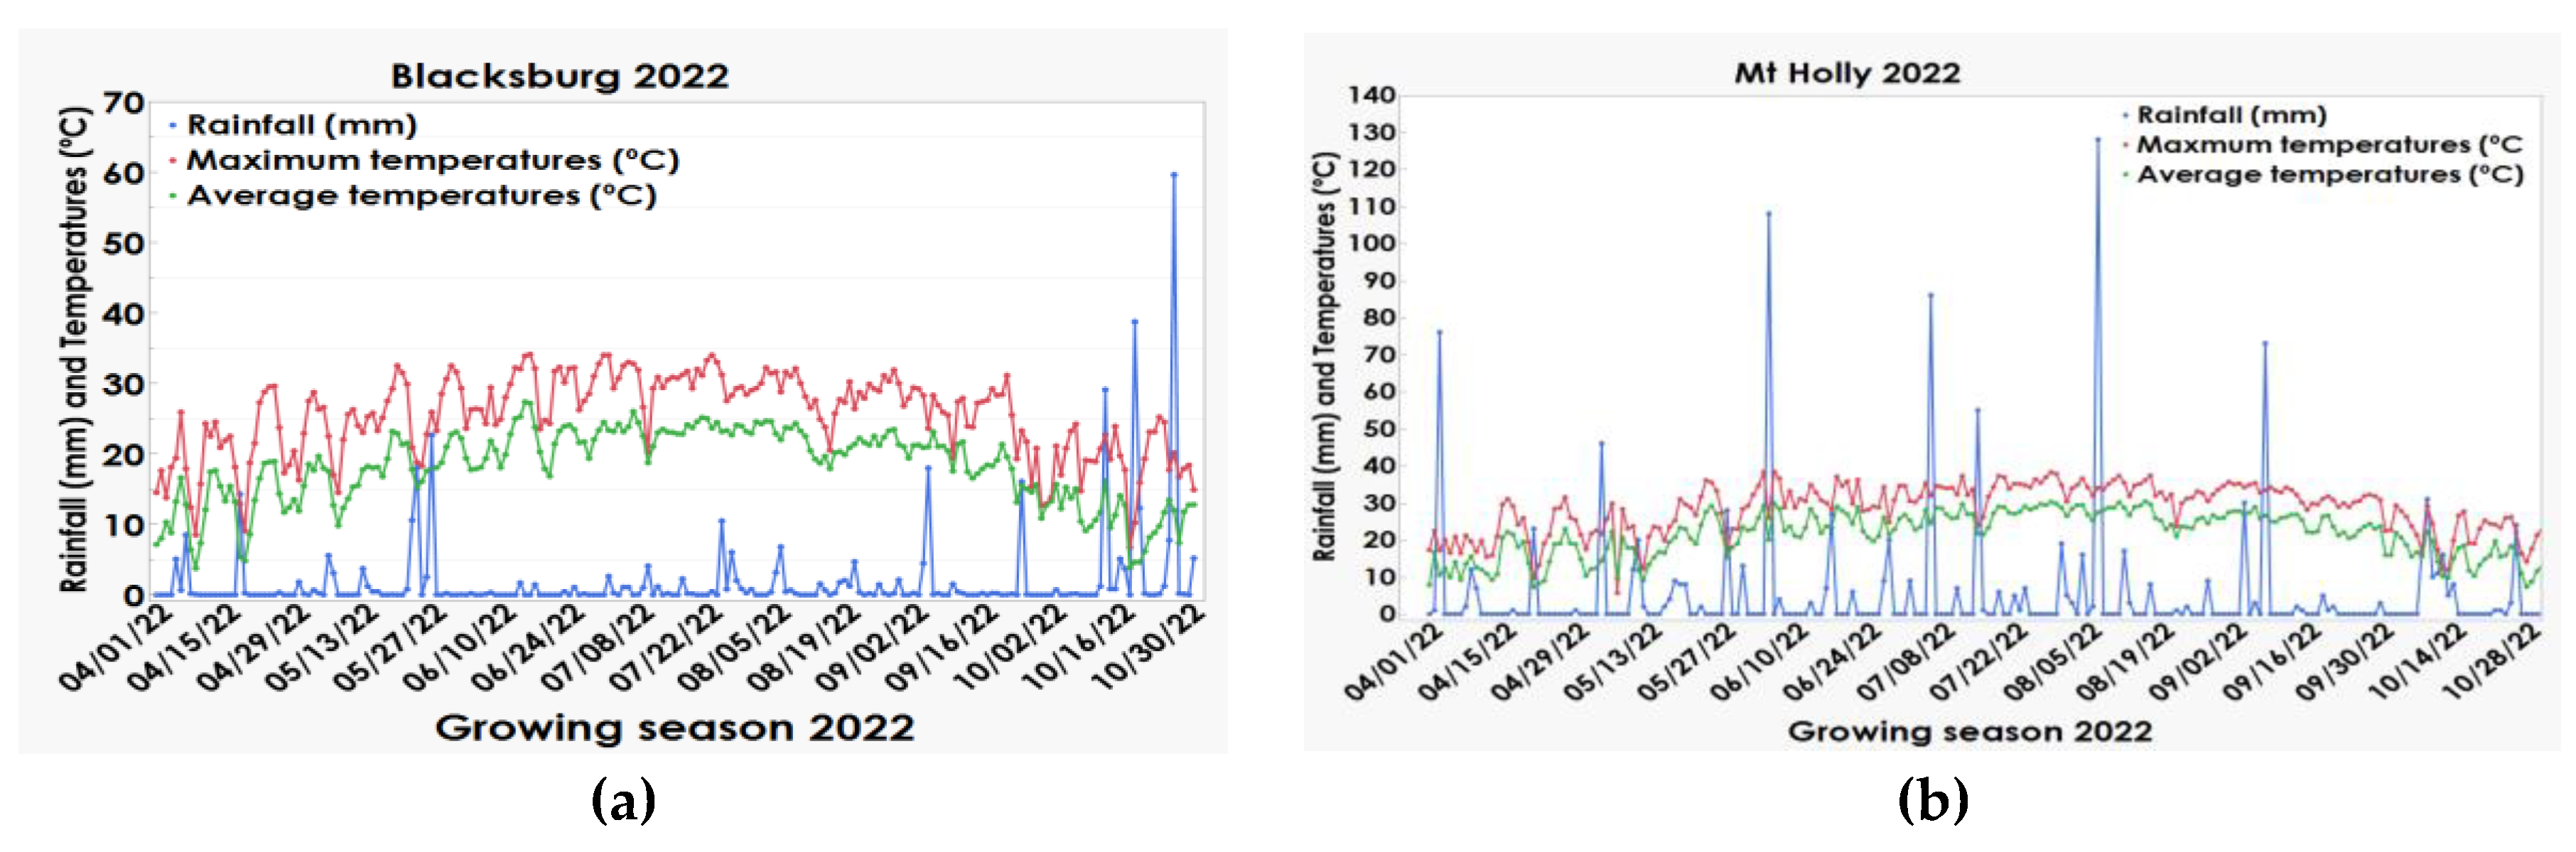
Figure 2.
Monthly rainfall totals (mm) and temperatures (°c) recorded during the 2022 field trial period: Displaying the Minimum, and Maximum daily temperatures, and average daily precipitation at New Kent site.
Figure 2.
Monthly rainfall totals (mm) and temperatures (°c) recorded during the 2022 field trial period: Displaying the Minimum, and Maximum daily temperatures, and average daily precipitation at New Kent site.
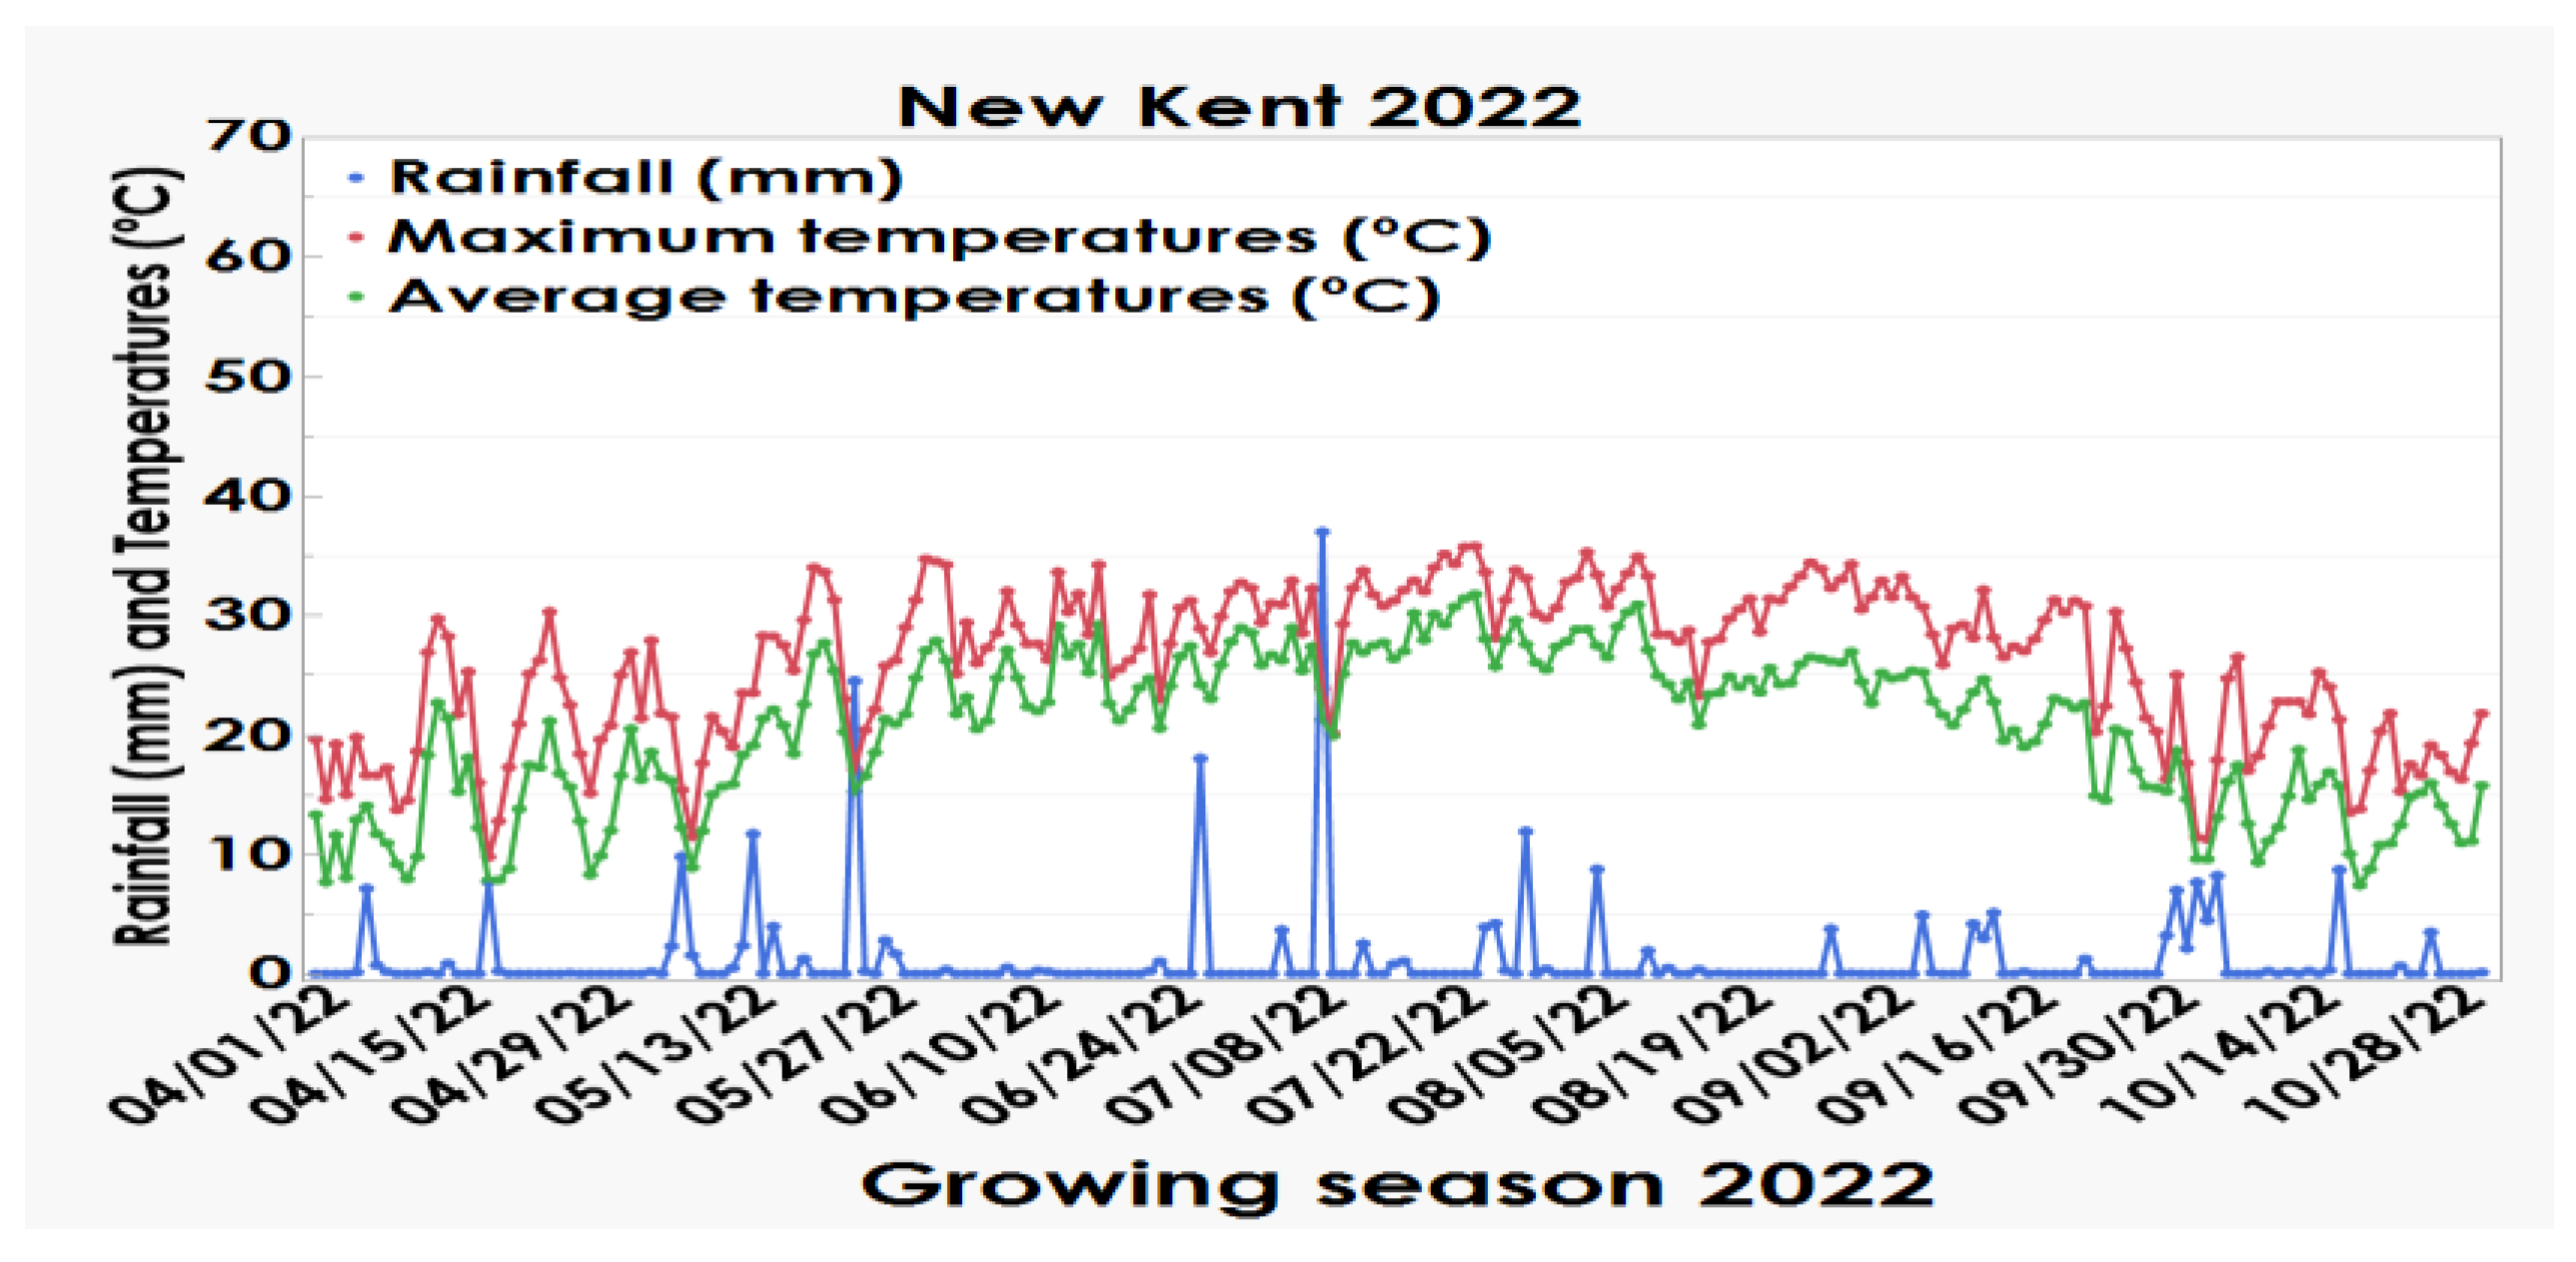
Figure 3.
Monthly rainfall totals (mm) and average temperatures (°c) recorded during the 2023 field trial periods: (a) Minimum, and Maximum daily temperatures, and average daily precipitation at TAREC site; (b) Minimum, and Maximum daily temperatures, and average daily precipitation at Mt. Holly 2023 site.
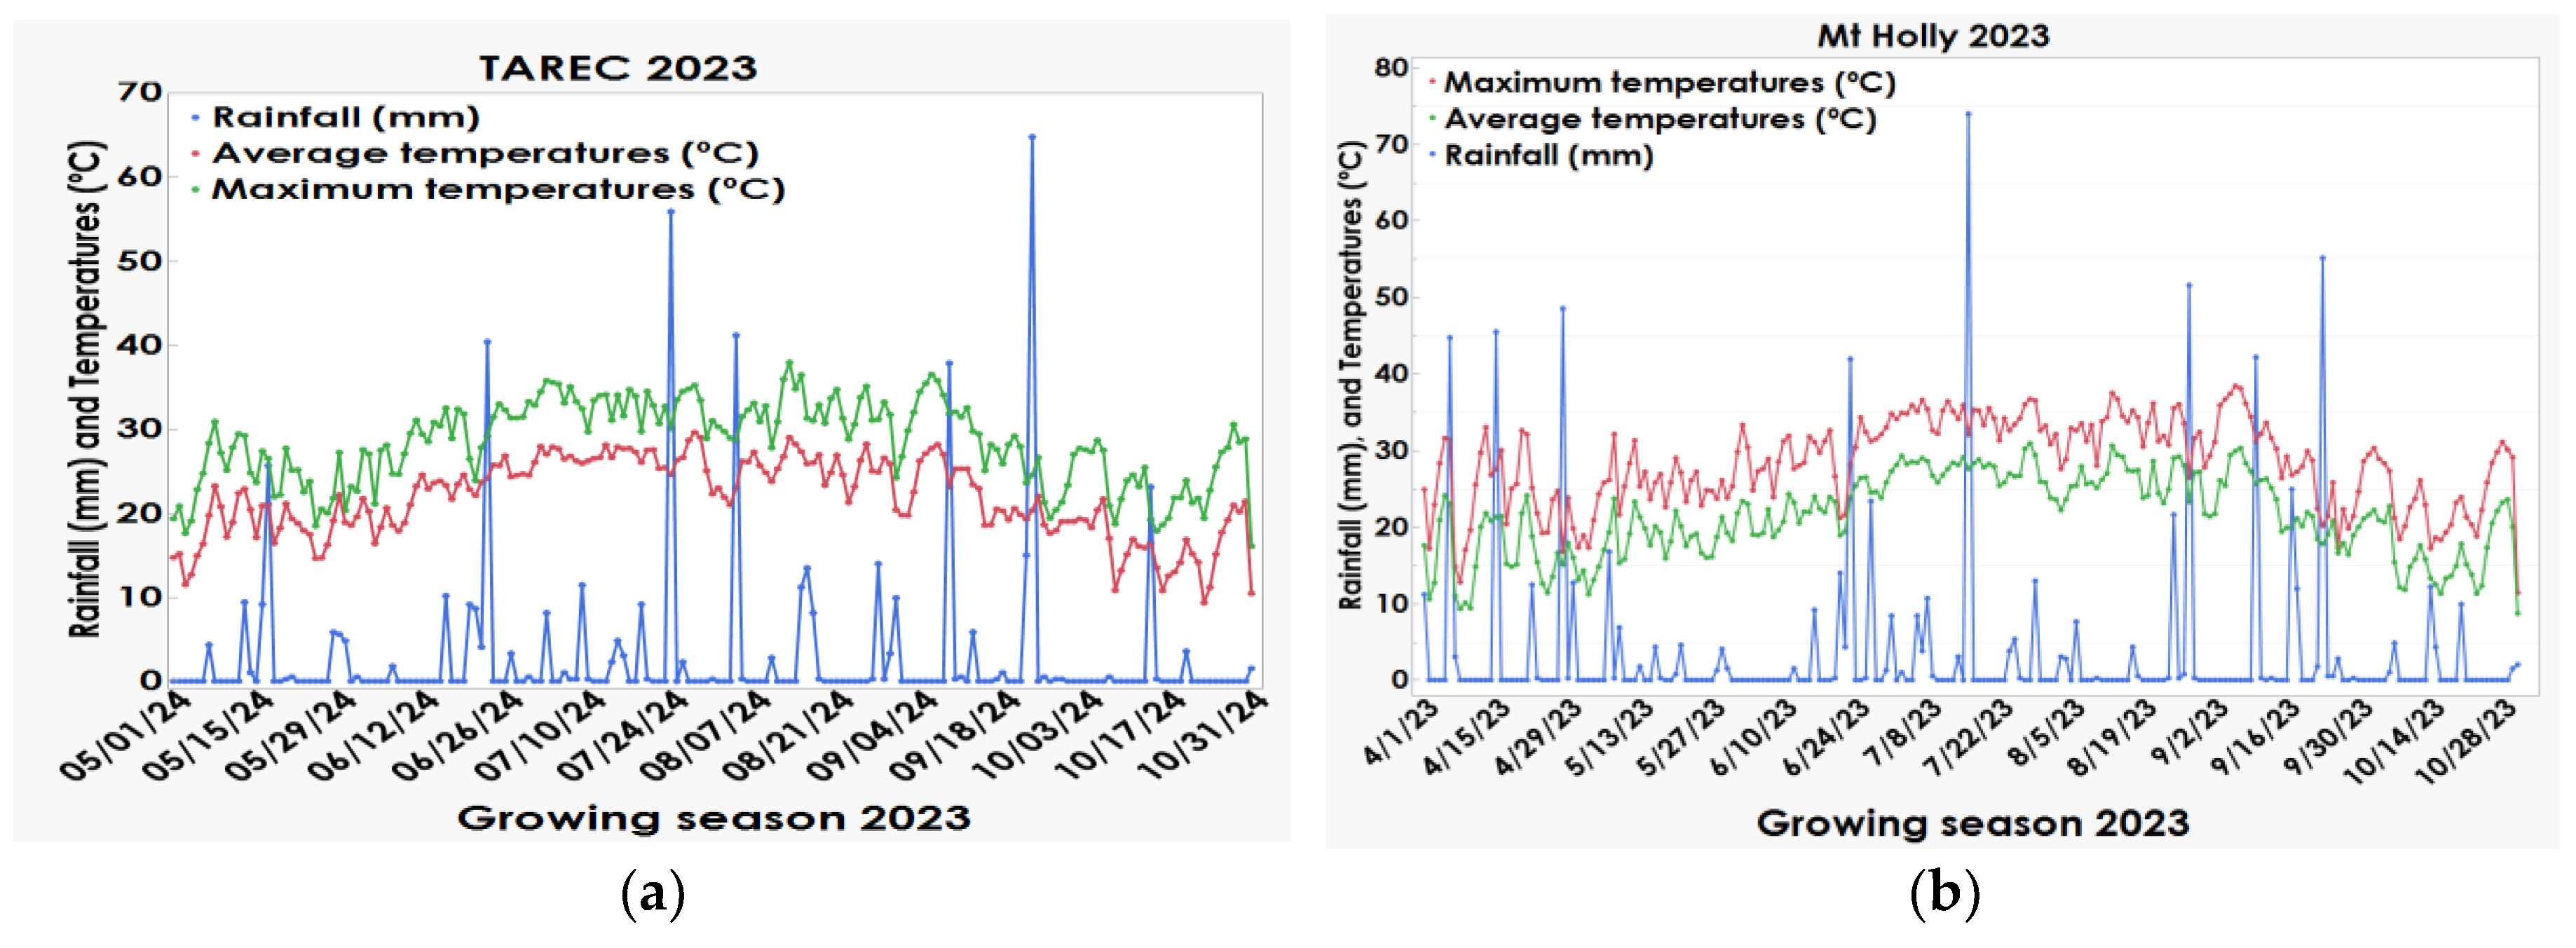

Table 1.
Soil chemical characteristics of experimental sites at Blacksburg, Mt Holly, New Kent, and Suffolk VA, irrigated and non-irrigated studies in 2022 to 2023.
Table 1.
Soil chemical characteristics of experimental sites at Blacksburg, Mt Holly, New Kent, and Suffolk VA, irrigated and non-irrigated studies in 2022 to 2023.
| Location | Year | P | K | Ca | Mg | pH† | Est CEC‡ |
| ....................... kg ha-1 ................. | 1:1 | meq/100g | |||||
| Blacksburg irrigated and non-irrigated | 2022 | 69 | 289 | 1283 | 312 | 6.1 | 6.0 |
| Mt Holly non-irrigated | 2022 | 72 | 149 | 1129 | 301 | 6.8 | 3.9 |
| New Kent irrigated | 2022 | 38 | 129 | 731 | 133 | 5.5 | 3.6 |
| New Kent non-irrigated | 2022 | 61 | 121 | 867 | 169 | 5.6 | 4.1 |
| Mt Holly irrigated | 2022 | 74 | 164 | 563 | 107 | 5.0 | 4.3 |
| Mt Holly non-irrigated | 2023 | 58 | 214 | 696 | 173 | 6.3 | 3.0 |
| Mt Holly irrigated | 2023 | 54 | 161 | 1031 | 217 | 6.3 | 3.7 |
| Suffolk irrigated and non-irrigated | 2023 | 56 | 82 | 665 | 74 | 6.6 | 1.9 |
‡Cation exchange capacity. †Soil pH measure from the 1:1 water to soil.
Table 2.
Overview of Omission Treatments in Standard, and Intensive Management Approaches Implemented at All Study Sites 2022-2023.
Table 2.
Overview of Omission Treatments in Standard, and Intensive Management Approaches Implemented at All Study Sites 2022-2023.
| Treatments | +P and K | +Sidedress N | +CoRon® | +Headline® | +Biological |
| Management level | Standard management (One treatment added at a time into standard management check) | ||||
| †Standard management check | NO | NO | NO | NO | NO |
| +P and K | ✓ | NO | NO | NO | NO |
| +Sidedress N | NO | ✓ | NO | NO | NO |
| +CoRon® | NO | NO | ✓ | NO | NO |
| +Headline® | NO | NO | NO | ✓ | NO |
| +Biological | NO | NO | NO | NO | ✓ |
| Intensive management (One treatment taken off at a time from Intensive management check) | |||||
| ‡Intensive management check | ✓ | ✓ | ✓ | ✓ | ✓ |
| -P and K | NO | ✓ | ✓ | ✓ | ✓ |
| -Sidedress N | ✓ | NO | ✓ | ✓ | ✓ |
| -CoRon® | ✓ | ✓ | NO | ✓ | ✓ |
| -Headline® | ✓ | ✓ | ✓ | NO | ✓ |
| -Biological | ✓ | ✓ | ✓ | ✓ | NO |
Symbols: = Standard management check, ‡ = Intensive management check, NO = The treatment not added. ✓ = Treatment was added. Treatment key: +P and K = additional 56 kg ha-1 P and K, +Sidedress N = additional sidedress with N 45 kg ha-1 applied at V6, +CoRon® = Foliar N from a branded nitrogen product CoRon® at 22.5 kg ha-1 applied at R1 maize stage, +Headline® = Foliar fungicides (headline®) applied at label rate at R1 maize growth stage. †Standard management check = VCE maize management recommendations applied before the other standard management treatments tested. ‡Intensive management check = A management package that includes all hypothesized factors to advance maize yield.
Table 3.
Effect of intensive management input and omission on maize grain yield, Blacksburg, New Kent, and Mt. Holly, 2022; and Mt. Holly and Tidewater, 2023.
Table 3.
Effect of intensive management input and omission on maize grain yield, Blacksburg, New Kent, and Mt. Holly, 2022; and Mt. Holly and Tidewater, 2023.
| Year | --------------------------------------------2022-------------------------------------- | -----------------------------2023------------------ | ||||||||||||||||||||||||||
| Location | Blacksburg | New Kent | Mt Holly | Mt Holly | Suffolk | |||||||||||||||||||||||
| Irrigation Status | Irrigated | Non-Irrigated | Irrigated | Non-Irrigated | Irrigated | Non-Irrigated | Irrigated | Non-Irrigated | Irrigated | Non-Irrigated | ||||||||||||||||||
| Standard management compared to the †Standard management check | ||||||||||||||||||||||||||||
| Management level | ------------------------------------------------------------------- Grain yield, kg ha-1 ----------------------------------------------------------------------------------------------------------------------------------------------------------------------------------------------- | |||||||||||||||||||||||||||
| +Biological | 10354 | 11111 | 19188 | 15233 | 13201 | 9750 | 15472 | 11527 | 15454 | 14238* | ||||||||||||||||||
| +CoRon® | 8755* | 7900 | 17834 | 16902 | 14194 | 9441 | 15455 | 13790 | 14262 | 10109 | ||||||||||||||||||
| +Headline® | 10113 | 7936 | 18445 | 16263 | 13847 | 9666 | 14300* | 11786 | 16122* | 11692 | ||||||||||||||||||
| +P and K | 9374 | 9729 | 16317 | 18022 | 12696 | 9845 | 14144* | 12693 | 14651 | 13659* | ||||||||||||||||||
| +Sidedress N | 8233* | 9166 | 18923 | 16855 | 13464 | 10285 | 14718* | 13245 | 14204 | 15545* | ||||||||||||||||||
| †Standard management check | 11195 | 8149 | 18202 | 15751 | 13789 | 9832 | 16624 | 14529 | 13962 | 8685 | ||||||||||||||||||
| Intensive management Compared to the ‡Intensive management check | ||||||||||||||||||||||||||||
| Management level | ------------------------------------------------------------------- Grain yield, kg ha-1 ------------------------------------------- | |||||||||||||||||||||||||||
| -Biological | 9207 | 11513 | 18770 | 16086 | 13665 | 10145 | 13411 | 12706 | 16226* | 12810 | ||||||||||||||||||
| -CoRon® | 10768 | 11240 | 17963 | 16675 | 13542 | 8584 | 13266 | 12711 | 15531 | 12839 | ||||||||||||||||||
| -Headline® | 10115 | 9161 | 18212 | 16398 | 12826 | 10345 | 12800 | 13093 | 15522 | 11610 | ||||||||||||||||||
| -P and K | 9461 | 7702* | 17744 | 17287 | 12488 | 9131 | 13182 | 13311 | 16337* | 12071 | ||||||||||||||||||
| -Sidedress N | 7337 | 9031 | 18743 | 15859 | 12570 | 9711 | 13186 | 13569 | 16023 | 14639* | ||||||||||||||||||
| ‡Intensive management check | 10286 | 10944 | 18138 | 18743 | 13029 | 9437 | 13373 | 13179 | 14645 | 12810 | ||||||||||||||||||
| Management level | ||||||||||||||||||||||||||||
| ‡Intensive management check | 10286 | 10944 | 18138 | 18743 | 13029 | 9437 | 13373 | 13179 | 14645 | 12810 | ||||||||||||||||||
| †Standard management check | 11195 | 8149 | 18202 | 15751 | 13789 | 9832 | 16624 | 14529 | 13962 | 8685 | ||||||||||||||||||
| P-value | 0.608 | 0.051 | 0.944 | 0.004 | 0.343 | 0.694 | 0.041 | 0.233 | 0.334 | 0.357 | ||||||||||||||||||
| Irrigation impact, % | ||||||||||||||||||||||||||||
| Intensive management check | -6% | -3% | 38% | 1.5% | 14% | |||||||||||||||||||||||
| Standard management check | 37% | 16% | 40% | 14% | 61% | |||||||||||||||||||||||
Acronyms: †=Standard management check, ‡Intensive management check, + = Standard treatments, - = Intensive treatments. *Means followed by an asterisk (*) are statistically significant at P≤ 0.10.
Table 4.
Relative yield of standard and intensive management practices at Blacksburg (2022), New Kent (2022), Mt. Holly (2022), Mt. Holly (2023), and Tidewater, 2023.
Table 4.
Relative yield of standard and intensive management practices at Blacksburg (2022), New Kent (2022), Mt. Holly (2022), Mt. Holly (2023), and Tidewater, 2023.
| Irrigation | -----------------------------Irrigated---------------------------- | ---------------------------Non-irrigated------------------------- | |||||||||||
| Year | -----------2022----------- | ---------2023------- | -----------2022----------- | ---------2023------ | |||||||||
| Site | Blacksburg | New Kent | Mt Holly | Mt Holly | Tidewater | Avg | Blacksburg | New Kent | Mt Holly | Mt Holly | Tidewater | Avg | |
| Standard management compared to the †Standard management check, % | |||||||||||||
| +Biological | 92 | 105 | 96 | 93 | 104 | 98 | 136 | 97 | 99 | 79 | 164 | 115 | |
| +CoRon® | 78 | 98 | 103 | 93 | 102 | 95 | 97 | 107 | 96 | 95 | 116 | 102 | |
| +Headline® | 90 | 101 | 100 | 86 | 115 | 99 | 97 | 103 | 98 | 81 | 135 | 103 | |
| +P and K | 84 | 90 | 92 | 85 | 105 | 91 | 119 | 114 | 100 | 87 | 157 | 116 | |
| +Sidedress N | 74 | 104 | 98 | 89 | 102 | 93 | 112 | 107 | 105 | 91 | 179 | 119 | |
| Mean | 95 | 111 | |||||||||||
| Intensive management compared to ‡Intensive management check % | |||||||||||||
| -Biological | 90 | 98 | 105 | 100 | 111 | 101 | 105 | 86 | 108 | 96 | 120 | 103 | |
| -CoRon® | 105 | 94 | 104 | 99 | 106 | 102 | 103 | 89 | 91 | 96 | 120 | 100 | |
| -Headline® | 98 | 95 | 98 | 96 | 106 | 99 | 84 | 87 | 110 | 99 | 108 | 98 | |
| -P and K | 92 | 93 | 96 | 99 | 112 | 98 | 70 | 92 | 97 | 101 | 113 | 95 | |
| -Sidedress N | 71 | 98 | 96 | 99 | 109 | 95 | 83 | 85 | 103 | 103 | 137 | 102 | |
| Mean | 99 | 100 | |||||||||||
Comparison of the †standard management check with “standard management,”, and ‡intensive management check with “intensive management”. Mean relative impact of treatments and their check were calculated by dividing the treatment mean by the highest means multiplied by 100%. Acronyms: Avg=Average.
Disclaimer/Publisher’s Note: The statements, opinions and data contained in all publications are solely those of the individual author(s) and contributor(s) and not of MDPI and/or the editor(s). MDPI and/or the editor(s) disclaim responsibility for any injury to people or property resulting from any ideas, methods, instructions or products referred to in the content. |
© 2025 by the authors. Licensee MDPI, Basel, Switzerland. This article is an open access article distributed under the terms and conditions of the Creative Commons Attribution (CC BY) license (http://creativecommons.org/licenses/by/4.0/).
Copyright: This open access article is published under a Creative Commons CC BY 4.0 license, which permit the free download, distribution, and reuse, provided that the author and preprint are cited in any reuse.


