
Submitted:
24 July 2025
Posted:
24 July 2025
You are already at the latest version
Abstract
Autophagy plays a multifaceted role in cancer, acting as a tumor suppressor in early stages while promoting survival in advanced disease. In ovarian cancer, the regulatory landscape of autophagy, particularly the role of long non-coding RNAs (lncRNAs), remains poorly defined. Here, we identify the lncRNA ZFAS1 as a key modulator of autophagy under starvation-induced conditions in high-grade serous ovarian cancer (HGSOC). Transcriptomic and functional analyses reveal consistent upregulation of ZFAS1 during autophagy induction. Silencing ZFAS1 disrupts autophagic flux, leading to the accumulation of p62 and LC3, indicative of impaired autophagy clearance. Mechanistically, ZFAS1 suppresses miR302, thereby enhancing BNIP3L expression, a known mitophagy regulator that promotes mitochondrial clearance and survival un-der metabolic stress. Clinical dataset analyses confirm a significant correlation be-tween ZFAS1 overexpression, BNIP3L upregulation, and poor survival outcomes in ovarian cancer patients. While autophagy exerts tumor-suppressive effects in some in-stances, our data reveals a context-specific lncRNA-mediated mechanism by which autophagy supports tumor survival. These findings define a novel ZFAS1-miR302-BNIP3L axis and highlight ZFAS1 as a potential target for disrupting autophagy-dependent resistance in ovarian cancer.
Keywords:
ZFAS1
; autophagy
; ovarian cancer
; lncRNA
; miR-302
; BNIP3L
; mitophagy
1. Introduction
Autophagy is a highly conserved catabolic process that enables cells to recycle intracellular components and maintain homeostasis under stress [1]. In cancer, however, autophagy plays a paradoxical role: it mitigates genomic instability during early transformation stages but promotes tumor survival in advanced disease by supporting metabolic adaptation and stress resistance [2]. These contrasting functions are particularly evident in high-grade serous ovarian cancer (HGSOC), a disease characterized by profound metabolic stress, chemoresistance, and recurrence [3]. Understanding the molecular regulators of autophagy is critical for identifying potential therapeutic targets, particularly in ovarian cancer, one of the most lethal gynecological malignancies with poor survival outcomes [4].
Long non-coding RNAs (lncRNAs), transcripts longer than 200 nucleotides without protein-coding potential, have emerged as key regulators of cancer pathobiology [5]. LncRNAs modulate diverse cellular processes by functioning as scaffolds, decoys, or sponges for microRNAs (miRNAs), and by interacting with chromatin-modifying complexes [6]. While their roles in tumor proliferation, immune evasion, and therapy resistance are well-documented, their contribution to autophagy regulation remains largely unexplored [7]. Although recent studies suggest that lncRNAs can either promote or inhibit autophagy, the underlying mechanisms are still being elucidated [8].
Given the dual role of autophagy in ovarian cancer progression [9], it can be reasoned that specific lncRNAs may either promote or suppress tumor growth depending on the cellular context and mode of autophagy activation. In the present study, we examined starvation-induced autophagy to identify lncRNA-dependent survival mechanisms under metabolic stress. Through lncRNA profiling and functional interrogation, we identified ZFAS1 as a robustly upregulated lncRNA in both established ovarian cancer cell lines and patient-derived models following autophagy induction.
Our data indicate that ZFAS1 suppresses the expression of miR302, a family of miRNAs known to negatively regulate autophagy, thereby enhancing the levels of BNIP3L/NIX, a critical mitophagy regulator involved in mitochondrial turnover and cellular adaptation to metabolic stress. Furthermore, the clinical relevance of this regulatory axis is supported by the analysis of ovarian cancer patient datasets, where the increased expression of both ZFAS1 and BNIP3L/NIX correlates with poor patient outcomes. These findings suggest that ZFAS1 promotes a survival-enhancing form of autophagy and may contribute to tumor adaptation and therapeutic resistance.
By defining the ZFAS1–miR302–BNIP3L regulatory axis, this study reveals a novel mechanism through which lncRNAs orchestrate autophagy as a stress-adaptive process in ovarian cancer. In addition to providing insight into the contextual heterogeneity of autophagy, our results highlight the ZFAS1–BNIP3L/NIX axis as a promising target for therapeutic intervention.
2. Materials and Methods
2.1. Cell Culture
High-grade serous ovarian cancer (HGSOC) cell lines TYK-nu, Kuramochi, OVCAR5, and OVCAR8, along with patient-derived ovarian cancer cells (Pz1-4), were maintained under standard conditions. OVCAR5, OVCAR8, and Kuramochi cells were cultured in RPMI 1640 medium supplemented with 10% fetal bovine serum (FBS) and 1% penicillin-streptomycin (P/S). TYK-nu cells were maintained in Minimum Essential Medium (MEM) supplemented with 10% FBS and 1% P/S.
Patient-derived ovarian cancer cells (Pz1-4) were cultured in a 1:1 mixture of MCDB 105 and DMEM with the same supplements. All cells were incubated at 37°C in a humidified atmosphere containing 5% CO₂. Cell line authentication and mycoplasma testing were conducted routinely at the Center of Biomedical Research Excellence Cell line Authentication Research Core, Stephenson Cancer Center [10].
Patient-derived cells (Pz1-4) from ascites samples were isolated at Stephenson Cancer Center, OUHSC, USA with appropriate ethical approvals and patient consent using established protocols [11]. Cells are from four unidentified samples collected as part of the Stephenson Cancer Center (SCC) tissue bio-repository program (IRB#2555). The study was approved by the OUHSC Office of Human Research Participant Protection (HRPP) Institutional Review Board (IRB) and samples were collected with the informed consent from the patients. Patient derived cell line Pz1, Pz2, Pz3, and Pz4 were isolated from the ascites samples of patients at the Stephenson Cancer Center, University of Oklahoma Health Science Center, Oklahoma City, OK, USA. The ascites-derived ovarian cancer cells were maintained in MCDB:DMEM (1:1) supplemented with 10% FBS and 50 µg/mL streptomycin. For serum-starvation, the above media without serum was supplemented with 0.1% BSA Fraction V, heat-shock, fatty acid ultra-free (Roche, Indianapolis, IN), 50 U/mL penicillin, and 50 µg/mL streptomycin (Mediatech).
2.2. Autophagy Modulation
Autophagy was induced using Earle’s Balanced Salt Solution (EBSS) for 6 hours. Chloroquine (ClQ, 30 μM) was used to block the fusion of autophagosome with lysosomes.
2.3. Immunofluorescence Microscopy
TYK-nu cells were plated at a density of 5 × 10³ cells/well in 96-well optical plates. The cells were allowed to adhere and grow. After reaching the appropriate confluence, the cells were treated with EBSS for 6 hours in the absence/presence of 30 µM ClQ. At the end of the treatment, the cells were washed with PBS one time and then fixed with methanol for 20 minutes while rocking. Cells were washed again with PBS and then permeabilized with 0.2% Triton X-100-PBS for 10 minutes and then washed thrice with PBS. After washing, cells were exposed to blocking solution (composed by 1% BSA in PBS) for 30 minutes at room temperature while rocking. After blocking, cells were washed with PBS and then incubated overnight at 4°C with the primary antibodies’ solution (anti-LC3 (1:1000, cod. L7543, Merck) and anti-LAMP1 (1:1000, cod. 555798, BD Biosciences) prepared in 1%-BSA-PBS) while rocking. The following day, the primary antibodies mixture was removed, and the cells were washed thrice with PBS for 5 minutes each. Next, the cells were stained with dye-conjugated secondary antibodies mixture (prepared in 1%-BSA-PBS) for 1 hour at room temperature while rocking and covered with aluminum foil. After, the cells were washed thrice with PBS and then stained with DAPI for 5 minutes. The cells were washed thrice with PBS for 5 minutes each wash and then acquired at the Operetta CLS fluorescence imaging station (Perkin Elmer) at 63x magnification.
2.4. ZFAS1 Knockdown
SiRNA oligonucleotides for ZFAS1 (Lincode SMARTpool human ZFAS1, Dharmacon™, R-034485-00-0005) and non-targeting control (Dharmacon™, D-001206-13-05) were transfected into ovarian cancer cells at a final concentration of 10 μM using Lipofectamine RNAiMAX (Thermo Fisher Scientific) according to the manufacturer’s protocol. OVCAR8, OVCAR5, and TYK-nu cells were seeded in 6-well plates at a density of 3 × 10⁵ cells per well, while Kuramochi cells were seeded at a density of 4 × 10⁵ cells per well. Cells were incubated with the transfection complexes for 48 hours. For the final 6 hours of incubation, cells were washed with PBS and treated with either complete medium or EBSS as indicated.
2.5. Western Blot Analysis
Protein quantification, followed by SDS-PAGE and immunoblotting with specific antibodies were performed as previously described [10]. Briefly, cells were lysed in RIPA buffer supplemented with protease and phosphatase inhibitors. 25 μg of protein were separated by SDS-PAGE and transferred onto PVDF membranes. Transferred membranes were blocked with 5% non-fat milk in TBST for 1 hour at room temperature and then incubated overnight at 4°C with primary antibodies against LC3-I/II (1:1000; cod. L7543, Sigma Aldrich), p62 (1:500; cod. 8025S, Cell Signaling), BNIP3L (1:1000; cod. 12396, Cell Signaling), and GAPDH (1:2000; cod. 97166S, Cell Signaling). Images were developed using either Kodak Image Station 4000 MM (Kodak) or Bio-Rad ChemiDoc MP Imaging System (Bio-Rad). Densitometric analysis was performed using ImageJ software, and GAPDH was used as a loading control.
2.6. RNA Isolation and qRT-PCR
Total RNA was extracted using RNeasy Mini Kit (Qiagen) according to manufacturer's instructions. cDNA was synthesized using iScript cDNA Synthesis Kit (Bio-Rad). Quantitative PCR for miRNAs was conducted using the miRCURY LNA miRNA PCR Assay Panel (Qiagen, YCA25430) with LNA-enhanced primers, while ZFAS1 expression was quantified using the RT² lncRNA qPCR Assay for Human ZFAS1 (Qiagen, LPH01402A-200). GAPDH amplification utilized custom primers (forward: 5′-GAC CTG ACC TGC CGT CTA-3′; reverse: 5′-GGA GTG GGT GTC GCT GT -3′). All reactions were performed in triplicate with SsoAdvanced Universal SYBR Green Supermix (Bio-Rad) on a CFX96 Real-Time' PCR System (Bio-Rad), applying thermal cycling conditions per manufacturers’ recommendations.
2.7. Bioinformatics and Clinical Dataset Analysis
Publicly available gene expression datasets (GSE27651, GSE101108, GSE9899) were retrieved from the NCBI Gene Expression Omnibus (GEO) database [12] and preprocessed using the R statistical software (http://www.r-project.org/). Bioconductor limma package (v3.60.6) for background correction and quantile normalization. Differential expression analysis was performed with DESeq2 (v1.44.0) using a threshold of |log2 fold change| >1 and adjusted p-value < 0.05. For Gene Set Enrichment Analysis (GSEA), ranked gene lists were analyzed using the fgsea package (v1.30.0) in R. Parameters included 10,000 permutations, a minimum gene set size of 15, and significance thresholds of normalized enrichment score (NES) > 1.5 and false discovery rate (FDR) < 0.1. Survival analysis was conducted via the KM Plotter platform (https://kmplot.com/) using ovarian cancer RNA-seq data [13]. All analyses were performed in R 4.4.1 with visualization using ggplot2 (v3.5.1).
The overall survival (OS) and disease-free survival (DFS) analyses based on ZFAS1 expression in ovarian cancer (OV) patients were performed using the TCGA dataset exclusively via the GEPIA web server [14]. Patients were divided into high and low expression groups according to the median ZFAS1 expression level, and Kaplan–Meier survival curves were generated along with hazard ratios and log-rank p-values to evaluate the prognostic significance.
2.8. Statistical Analysis
Data are expressed as mean ± SEM from at least three independent experiments. Statistical analysis was performed by GraphPad Prism 10 statistics software (GraphPad Software). Statistical significance was determined using Student’s t-test or one-way ANOVA (p < 0.05 considered significant).
3. Results
3.1. Establishing the Autophagy Model System Using EBSS and Chloroquine
To investigate the role of ZFAS1 in autophagy regulation, we utilized the autophagy model system using Earle’s Balanced Salt Solution (EBSS) and chloroquine (ClQ) in ovarian cancer cells [15]. EBSS induces autophagy by mimicking nutrient deprivation, promoting autophagosome formation, whereas ClQ inhibits autophagic flux by preventing lysosomal degradation.
To validate this system, we treated TYK-nu, Kuramochi, OVCAR5, and OVCAR8 ovarian cancer cell lines with EBSS, ClQ (30 μM), or both for 6 hours, followed by immunofluorescence microscopy and Western blot analysis to assess key autophagy markers. In immunofluorescence studies, LC3 (red) was used to visualize autophagosomes, while LAMP1 (green) labeled lysosomes, with DAPI counterstaining marking the nuclei (Figure 1A). Under control conditions, cells exhibited low basal levels of LC3 puncta, indicative of minimal autophagic activity. ClQ treatment led to a notable increase in LC3 puncta, reflecting the amount of neo-formed autophagosomes accumulated due to blocked lysosomal degradation. Co-localization of LC3 and LAMP1 was observed, further confirming that ClQ effectively disrupted autophagosome clearance. In contrast, EBSS treatment significantly enhanced LC3 puncta formation, suggesting active autophagosome synthesis in response to nutrient deprivation. The combination of EBSS and ClQ produced the most pronounced LC3 accumulation, consistent with enhanced autophagosome formation by EBSS and concurrent inhibition of autophagic degradation by ClQ, thereby validating the dynamic modulation of autophagic flux in this system.
To further quantify autophagy induction, we performed Western blot analysis of p62 and LC3 expression across TYK-nu, Kuramochi, OVCAR5, and OVCAR8 ovarian cancer cell lines, as well as in four patient-derived ovarian cancer samples (Pz1-4) (Figure 1B,C). In ClQ-treated cells, p62 levels increased, and the LC3-II/I ratio increased compared to controls, confirming the expected blockade of autophagic degradation. Conversely, EBSS treatment reduced p62 levels while increasing the LC3-II/I ratio, indicating successful autophagy activation. When both EBSS and ClQ were combined, we observed accumulation of LC3-II with the highest LC3-II/I ratio and intermediate p62 levels compared to single treatments, demonstrating simultaneous induction of autophagy by EBSS and inhibition of autophagic flux by ClQ.
These findings were consistent in patient-derived ovarian cancer samples (Pz1-4), confirming that the EBSS and ClQ model is applicable to both established ovarian cancer cell lines and primary tumor-derived cells. Taken together, these results establish a robust autophagy model system that allows for precise dissection of lncRNA-mediated regulation of autophagy in ovarian cancer.
3.2. Identification of Autophagy-Related lncRNAs in Ovarian Cancer Cells
To identify long non-coding RNAs (lncRNAs) potentially involved in autophagy regulation in ovarian cancer, we performed a lncRNA expression screening in TYK-nu ovarian cancer cells under autophagy-inducing conditions. Cells were treated with EBSS for 6 hours, and total RNA was extracted for lncRNA profiling using a PCR array. The results were visualized as a heat map (Figure 2A), where expression changes of 89 lncRNAs were analyzed. The heat map revealed distinct expression patterns, with some lncRNAs exhibiting upregulation and others showing downregulation in response to autophagy induction. With the cut-off value of more than 2-fold increase in the expression levels, our analysis identified eight lncRNAs, namely, ZFAS1, LUCAT1, HIF1A-AS2, GAS5, MIR7-3HG, KRASP1, LINC00152, and PVT1. (Figure 2B). To validate these findings, we carried out qRT-PCR analysis to confirm the RNA expression levels of the eight lncRNAs in TYK-nu cells subjected to EBSS-induced autophagy (Figure 2C). The qRT-PCR results corroborated the PCR array data, showing a significant increase in the expression of ZFAS1, LUCAT1, HIF1A-AS2, GAS5, MIR7-3HG, KRASP1, LINC00152, and PVT1 in TYK-nu cells following EBSS-induced autophagy.
3.3. Identification of ZFAS1 as a Consensus Autophagy-Associated lncRNA in HGSOC Cells
Having validated the autophagy-induced upregulation of multiple lncRNAs in TYK-nu cells, we next sought to assess whether these candidate lncRNAs exhibited consistent expression across a broader panel of HGSOC cell lines. To this end, we examined the expression of the eight lncRNAs; GAS5, HIF1A-AS2, LUCAT1, MIR7-3HG, KRASP1, ZFAS1, LINC00152, and PVT1, in a panel of HGSCOC cells including TYK-nu, Kuramochi, OVCAR5, and OVCAR8 following EBSS-induced autophagy along with control groups. qRT-PCR analysis revealed heterogeneous expression patterns among the selected lncRNAs across different cell lines. While several lncRNAs exhibited variable upregulation, ZFAS1 was the only lncRNA that displayed consistent and robust upregulation across all tested HGSOC cell lines (Figure 3). This suggests that ZFAS1 is a conserved autophagy-associated lncRNA in ovarian cancer. Given its consistent induction in multiple cell lines, ZFAS1 appears to be the common lncRNA following autophagy induction in HGSOC cells. These findings suggest that ZFAS1 may play a critical role in autophagy regulation, warranting further investigation into its functional significance in ovarian cancer autophagy.
3.4. Functional Analysis of ZFAS1 in Autophagy Regulation
We next investigated the functional role of ZFAS1 in autophagy regulation using siRNA-mediated knockdown across multiple ovarian cancer cell lines. To assess the impact of ZFAS1 depletion, we examined the expression of autophagy markers p62 and LC3 under both basal and EBSS-induced autophagy conditions. Western blot analysis in TYK-nu cells revealed that ZFAS1 knockdown led to an accumulation of both p62 and LC3-I, particularly under EBSS treatment, indicating a potential disruption in autophagic flux (Figure 4A, left panel). The increase in p62 levels suggests impaired degradation of autophagic cargo, while the accumulation of LC3-I indicates a block in the early step of the autophagy process, with reduced autophagosome maturation.
To confirm the efficiency of ZFAS1 knockdown, we performed qRT-PCR analysis, which demonstrated that ZFAS1 expression was significantly reduced following siRNA transfection (Figure 4A, right panel). Under control conditions, EBSS treatment led to an increase in ZFAS1 expression, but in ZFAS1-silenced cells, its expression remained low even after EBSS treatment, with only a slight induction observed. This pattern of autophagy marker modulation and ZFAS1 expression suppression was consistently observed in three additional ovarian cancer cell lines—OVCAR5, Kuramochi, and OVCAR8 (Figure 4B–D). In all cases, ZFAS1 depletion resulted in increased p62 accumulation and altered LC3-I levels, further supporting the role of ZFAS1 as a positive regulator of autophagy. The conserved response across multiple ovarian cancer cell lines suggests that ZFAS1 is functionally involved in autophagy regulation in a broad cellular context.
These findings indicate that ZFAS1 is required for proper autophagic flux, and its depletion leads to autophagy dysregulation, reinforcing its potential role as a key modulator of autophagy in ovarian cancer.
3.5. ZFAS1 Regulates the expression of miR302 Family of miRNAs
To investigate the mechanism by which ZFAS1 regulates autophagy, we carried out a comprehensive miRNA expression analysis following ZFAS1 knockdown in ovarian cancer cells. Given that lncRNAs frequently regulate cellular processes through miRNA interactions [16], we hypothesized that ZFAS1 may modulate miRNAs involved in autophagy regulation.
Using a miRNA PCR array, we profiled differentially expressed miRNAs in ZFAS1-silenced Kuramochi cells and identified several miRNAs that were significantly upregulated compared to control cells (Figure 5A). Among these, the miR302 family exhibited the most robust and consistent upregulation, suggesting a potential functional link between ZFAS1 and miR302 in EBSS-induced autophagy.
To validate these findings, we performed qRT-PCR analysis to quantify the expression of individual miR302 family members (miR302a-3p, miR302a-5p, miR302b-3p, and miR302c-3p) in TYK-nu cells following ZFAS1 knockdown (Figure 5B). The results confirmed that ZFAS1 depletion significantly increased all miR302 family members, particularly under EBSS-induced autophagy conditions, where their expression was further elevated.
These findings indicate that ZFAS1 functions as a negative regulator of the miR302 family, and its depletion leads to miR302 upregulation, potentially modulating autophagy-related pathways. Given that miR302 family members have been implicated in autophagy inhibition [17,18,19], their increased expression following ZFAS1 knockdown suggests a mechanistic link between ZFAS1 and autophagy regulation via miRNA modulation.
3.6. ZFAS1 is Associated with BNIP3 Expression and Autophagy-Related Pathways
Next, we explored how miR302b-3p might influence autophagy-related pathways. It has been shown previously that miR302b-3p inhibits autophagy in different cell types through multiple targets [17,20]. Using publicly available miRNA target prediction databases, our screening for 302b-3p-targeting autophagy-related genes identified Bcl-2 interacting protein 3 (BNIP3) as a putative miR302b-3p target, along with other autophagy-related genes [21]. It has also been shown that miRNA302 cluster inhibits BNIP3L/Nix expression, although in a different cellular and functional context [22]. Interestingly, BNIP3L/Nix, has been shown to play a critical role in inducing autophagy, especially mitophagy [23]. In addition, BNIP3 has been shown to promote tumor growth breast cancer through an autophagy-dependent pathway [24].
Based on these findings, we reasoned that ZFAS1 regulates mitophagy component of autophagy by modulating the expression levels of BNIP3 via miR302b-3p. To determine, we examined the broader impact of ZFAS1 on autophagy-associated pathways in ovarian cancer patient datasets. First, to determine whether ZFAS1 expression has clinical significance in ovarian cancer, we performed a survival analysis using Kaplan-Meier curves from The Cancer Genome Atlas (TCGA) dataset. Patients with high ZFAS1 expression exhibited significantly shorter overall survival (HR = 1.4, p = 0.0053) and reduced disease-free survival (HR = 1.3, p = 0.027) compared to patients with low ZFAS1 expression (Figure 6A,B). These findings suggest that ZFAS1 may serve as a potential prognostic marker in ovarian cancer and that its role in autophagy may contribute to tumor progression and therapy resistance.
To further elucidate the functional relevance of ZFAS1, we carried out GSEA analysis of differentially expressed genes between ZFAS1-high and ZFAS1-low patient tumors in the GSE27651 dataset. Based on ZFAS1 expression levels, patients were stratified into low (n=13) and high (n=13) expression groups using quantile split and differential gene expression was analyzed between ZFAS1-high and ZFAS1-low groups (Figure 6C) Gene Set Enrichment Analysis (GSEA) of these differentially expressed genes showed significant enrichment of the ‘autophagy of mitochondrion (GO:0000422)’ gene set in the ZFAS1-high group (Figure 6D). This analysis revealed a significant enrichment of autophagy-related gene signatures, including pathways involved in mitophagy, lysosomal function, and mitochondrial quality control (Figure 6D). Among the mitophagy-related genes, BNIP3L showed consistent positive correlation with ZFAS1 expression across multiple independent datasets. Analysis of GSE27651 revealed a 2-fold increase in BNIP3L expression in the ZFAS1-high group compared to the ZFAS1-low group. This trend was further validated in two additional datasets, with GSE101108 and GSE9899 showing 10% and 17% increases in BNIP3L expression, respectively, in ZFAS1-high groups (Figure 6E). These findings suggest a potential regulatory relationship between ZFAS1 and mitophagy-related pathways in ovarian cancer.
Consistent with prior findings that BNIP3L is regulated by miR302b-3p [22], our GSEA analysis demonstrated a strong positive correlation between ZFAS1 and BNIP3L expression across multiple independent datasets. In GSE27651, BNIP3L expression was 2-fold higher in ZFAS1-high tumors compared to ZFAS1-low tumors. This trend was further validated in GSE101108 and GSE9899, where BNIP3L levels were elevated by 10% and 17%, respectively, in ZFAS1-high tumors (Figure 6E). These findings support a ZFAS1-miR302b-3p-BNIP3L regulatory axis in ovarian cancer, where ZFAS1 suppresses miR302b-3p expression, thereby maintaining BNIP3L levels and promoting autophagy. To experimentally validate the relationship between ZFAS1 and BNIP3, we examined BNIP3 expression levels following ZFAS1 knockdown. Western blot analysis revealed a significant reduction in BNIP3 protein levels in ZFAS1-silenced ovarian cancer cells, suggesting that ZFAS1 positively regulates BNIP3 expression (Figure 6F).
Together, these results suggest that ZFAS1 suppresses miR302b-3p, which in turn relieves repression on BNIP3L, promoting its expression and supporting the mitophagic component of autophagy in ovarian cancer cells.
4. Discussion
LncRNAs have emerged as critical regulators of cancer biology, yet their involvement in autophagy remains largely unexplored. Using a well-defined autophagy model system, we demonstrate that ZFAS1 is consistently upregulated in ovarian cancer cells undergoing autophagy induction and functions as a positive regulator of autophagic flux. Our findings highlight ZFAS1 as a conserved autophagy-associated lncRNA that is consistently upregulated in multiple ovarian cancer cell lines under nutrient deprivation. Functional studies demonstrate that ZFAS1 knockdown disrupts autophagic flux, as evidenced by the accumulation of p62 and altered LC3 processing across multiple ovarian cancer cell models. These results establish ZFAS1 as a functionally relevant autophagy modulator in ovarian cancer, reinforcing its potential role in tumor cell adaptation to stress. Interestingly, our findings regarding ZFAS1's role in autophagy regulation align with several recent studies in different disease contexts. In rheumatoid arthritis, ZFAS1 silencing was shown to suppress autophagy, as evidenced by reduced LC3-II and increased p62 levels [22]. Similarly, in myocardial injury, ZFAS1 was found to promote autophagy through the miR-383-5p/ATG10 axis [25].
Our results suggest the potential role of ZFAS1-miR302b-3p-BNIP3L axis in regulating autophagy-related pathways in HGSOC. By identifying miR302b-3p as a downstream target of ZFAS1, our study provides mechanistic insights into how ZFAS1 regulates autophagy.
A similar mechanism was reported for the lncRNA PVT1, which increased autophagy-mediated chemoresistance to cisplatin in non-small lung cancer cells by sponging miR-216b that targets BECLIN1 mRNA [26]. In our study, PVT1 was upregulated to some extent only in starving OVCAR5 and TYK-nu cells. Though we did not check whether miR-216b and the BECLIN-1 expression were also affected, one cannot exclude that this axis also contributed to the induction of autophagy. However, we show here that ZFAS1 silencing was sufficient to impair starvation-induced autophagy.
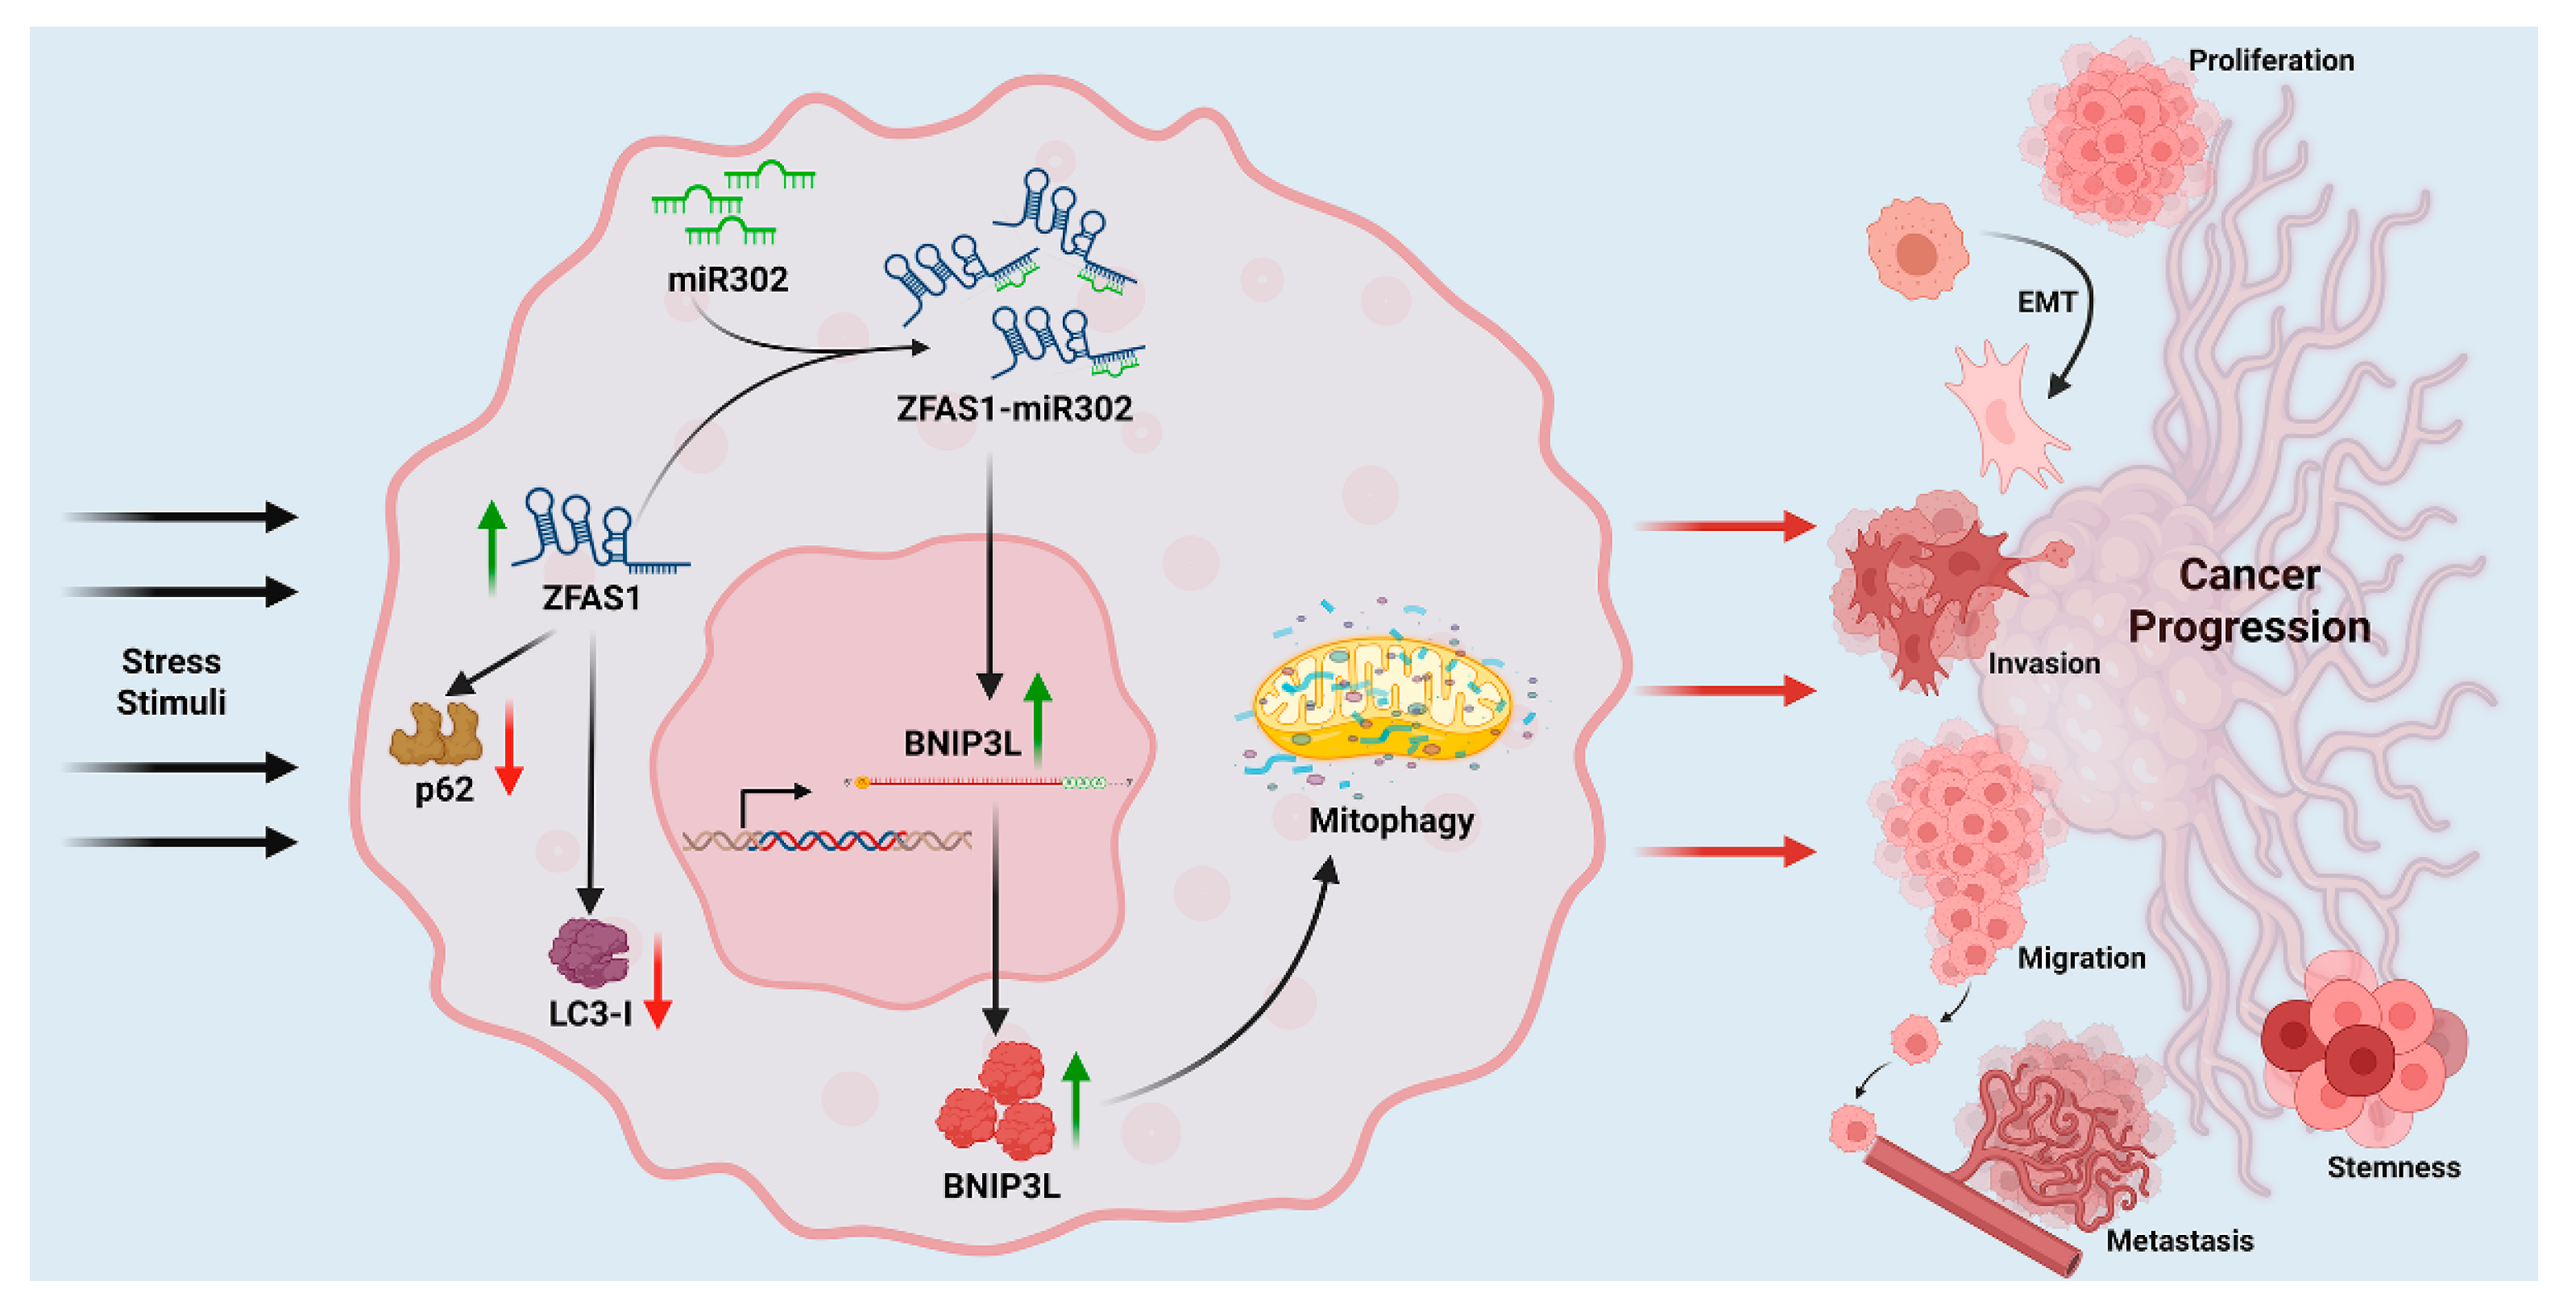
The upregulation of miR302b-3p upon ZFAS1 depletion and the corresponding downregulation of BNIP3L, a known autophagy and mitophagy regulator [23], suggest a functional axis linking lncRNA, miRNA, and autophagy regulation. Gene Set Enrichment Analysis (GSEA) from patient datasets further supports this regulatory network, revealing a positive correlation between ZFAS1 and BNIP3L expression in ovarian cancer tumors. These findings position ZFAS1 as an upstream regulator of autophagy, where it suppresses miR302b-3p to maintain BNIP3L expression, thereby facilitating autophagy and mitophagy. Mechanistically, our results indicate a paradigm in which ZFAS1 functions as an upstream regulator of autophagy and mitophagy via the suppression of miR302 and consequent upregulation of BNIP3L. This axis supports stress adaptation and promotes malignant traits that drive cancer progression (Figure 7). The schematic summarizes this regulatory cascade and its implications in ovarian cancer progression.
A key question that arises from our findings is how ZFAS1 suppresses miR302b-3p expression. While lncRNAs can act as competitive endogenous RNAs (ceRNAs) by sponging miRNAs, ZFAS1 does not contain canonical miR302b-3p binding sites, suggesting an alternative regulatory mechanism. One possibility is that ZFAS1 may interact with transcriptional repressors or epigenetic modifiers to suppress miR302b-3p transcription [27]. Previous studies have shown that ZFAS1 interacts with PRC2 (Polycomb Repressive Complex 2) and other chromatin-modifying proteins [28], raising the possibility that ZFAS1 could recruit similar repressor complexes to miR302b-3p promoter regions, thereby downregulating its transcription. Additionally, ZFAS1 may act as a molecular scaffold, facilitating the recruitment of RNA-binding proteins that modulate miRNA stability or degradation [29]. Future studies should investigate whether ZFAS1-mediated chromatin remodeling or RNA-protein interactions contribute to the suppression of miR302b-3p in ovarian cancer cells.
Our results also demonstrate that miR302b-3p upregulation upon ZFAS1 depletion leads to reduced BNIP3L expression, but the precise mechanism through which miR302b-3p regulates BNIP3L remains to be elucidated. Given that BNIP3L has been validated as a direct miR302b-3p target in prior studies [22], one likely explanation is that miR302b-3p binds to the 3' UTR of BNIP3L mRNA, leading to post-transcriptional repression and decreased protein translation. In addition, miR302b-3p may indirectly suppress BNIP3L by targeting upstream transcriptional activators of BNIP3L, thereby reducing its expression at the transcriptional level.
5. Conclusions
The role of autophagy in ovarian cancer is complex, acting as both a tumor-suppressive and tumor-promoting mechanism depending on the disease stage and tumor microenvironment [30,31,32]. In advanced HGSOC, autophagy is often exploited as a pro-survival strategy under metabolic and therapeutic stress, contributing to chemoresistance and tumor dormancy [31]. The results presented here provide new insights into lncRNA-mediated regulation of autophagy and highlight ZFAS1 as a potential therapeutic target for disrupting autophagy-dependent survival mechanisms in ovarian cancer. Our findings suggest that ZFAS1-mediated autophagy regulation may contribute to these adaptive mechanisms in HGSOC. By maintaining BNIP3L expression and promoting autophagic flux, ZFAS1 may facilitate metabolic plasticity in ovarian cancer cells, enabling survival under nutrient-deprived or stressed conditions. These findings align with prior studies implicating BNIP3L in mitophagy-driven chemoresistance [33,34,35], raising the possibility that ZFAS1 inhibition could serve as a therapeutic strategy to disrupt autophagy-dependent survival pathways in ovarian cancer. As a limitation of the present study, we acknowledge that while our data provides experimental validation of ZFAS1-dependent miR302b-3p and BNIP3 regulation, further functional studies are required to define the precise mechanism through which ZFAS1-miR302b-3p axis regulates BNIP3 in ovarian cancer autophagy.
Author Contributions
Conceptualization, D.N.D. and C.I.; Bioinformatics, J.L. and R.N.; Validation, C.S. and A.F.; Formal analysis, C.S., J.L., R.N., and J.H.H.; Investigation, C.S. and A.F.; Writing—original draft preparation, J.L. and D.N.D.; Visualization, C.S., J.L., R.N., and J.H.H.; Supervision, D.N.D. and C.I. All authors have read and agreed to the published version of the manuscript.
Funding
This research was partially supported by the Department of Defense Ovarian Cancer Research Program Award (grant no. W81XWH-22-1-0415). Tissue pathology and IHC services were provided by the research cores supported by the National Institute of General Medical Sciences P30 (grant no. P30GM154635) and The National Cancer Institute of the National Institutes of Health (grant no. P30CA225520).
Institutional Review Board Statement
The study was conducted in accordance with the Declaration of Helsinki and approved by the OUHSC Office of Human Research Participant Protection (HRPP) Institutional Review Board (IRB) of Stephenson Cancer Center (SCC) tissue bio-repository program (IRB#2555) of the University of Oklahoma Health Science Center, Oklahoma City, OK, USA.
Informed Consent Statement
Informed consent was obtained from all subjects involved in the study.
Data Availability Statement
The data presented in this study are available in the public domains: NCBI Gene Expression Omnibus (GEO) database at [https://www.ncbi.nlm.nih.gov/geo/] reference number [12], KM Plotter platform at [https://kmplot.com/] reference number [13], and GEPIA web server at [https://gepia.cancer-pku.cn/] reference number [14]. The original contributions presented in this study are included in the article. Further inquiries can be directed to the corresponding authors.
Acknowledgments
C.S. was recipient of a fellowship awarded by the Rotary Foundation Distretto 2031 (Rotary Club Torino Nord Est (Italy) in partnership with the Rotary Club Oklahoma City (OK, US)). The work was partially supported by the Department of Defense Ovarian Cancer Research Program Award (grant no. W81XWH-22-1-0415). Tissue pathology and IHC services were provided by the research cores supported by the National Institute of General Medical Sciences P30 (grant no. P30GM154635) and The National Cancer Institute of the National Institutes of Health (grant no. P30CA225520).
Conflicts of Interest
The authors declare no conflicts of interest.
References
- Gómez-Virgilio L, Silva-Lucero MD, Flores-Morelos DS, Gallardo-Nieto J, Lopez-Toledo G, Abarca-Fernandez AM, Zacapala-Gómez AE, Luna-Muñoz J, Montiel-Sosa F, Soto-Rojas LO et al: Autophagy: A Key Regulator of Homeostasis and Disease: An Overview of Molecular Mechanisms and Modulators. Cells 2022, 11(15).
- Verma AK, Bharti PS, Rafat S, Bhatt D, Goyal Y, Pandey KK, Ranjan S, Almatroodi SA, Alsahli MA, Rahmani AH et al: Autophagy Paradox of Cancer: Role, Regulation, and Duality. Oxid Med Cell Longev 2021, 2021:8832541.
- Qi G, Ma H, Li Y, Peng J, Chen J, Kong B: TTK inhibition increases cisplatin sensitivity in high-grade serous ovarian carcinoma through the mTOR/autophagy pathway. Cell Death & Disease 2021, 12(12):1135.
- Nokhostin F, Azadehrah M, Azadehrah M: The multifaced role and therapeutic regulation of autophagy in ovarian cancer. Clin Transl Oncol 2023, 25(5):1207-1217.
- Chi Y, Wang D, Wang J, Yu W, Yang J: Long Non-Coding RNA in the Pathogenesis of Cancers. Cells 2019, 8(9).
- Qian Y, Shi L, Luo Z: Long Non-coding RNAs in Cancer: Implications for Diagnosis, Prognosis, and Therapy. Frontiers in Medicine 2020, Volume 7 - 2020.
- Liu Z-y, Tang J-m, Yang M-q, Yang Z-h, Xia J-z: The role of LncRNA-mediated autophagy in cancer progression. Frontiers in Cell and Developmental Biology 2024, Volume 12 - 2024.
- Vidoni C, Vallino L, Ferraresi A, Secomandi E, Salwa A, Chinthakindi M, Galetto A, Dhanasekaran DN, Isidoro C: Epigenetic control of autophagy in women's tumors: role of non-coding RNAs. Journal of Cancer Metastasis and Treatment 2021, 7:4.
- Li G, Gong J, Cao S, Wu Z, Cheng D, Zhu J, Huang X, Tang J, Yuan Y, Cai W et al: The Non-Coding RNAs Inducing Drug Resistance in Ovarian Cancer: A New Perspective for Understanding Drug Resistance. Frontiers in Oncology 2021, Volume 11 - 2021.
- Ha JH, Radhakrishnan R, Nadhan R, Gomathinayagam R, Jayaraman M, Yan M, Kashyap S, Fung K-M, Xu C, Bhattacharya R et al: Deciphering a GPCR-lncrna-miRNA nexus: Identification of an aberrant therapeutic target in ovarian cancer. Cancer Letters 2024, 591:216891.
- Radhakrishnan R, Ha JH, Jayaraman M, Liu J, Moxley KM, Isidoro C, Sood AK, Song YS, Dhanasekaran DN: Ovarian cancer cell-derived lysophosphatidic acid induces glycolytic shift and cancer-associated fibroblast-phenotype in normal and peritumoral fibroblasts. Cancer Letters 2019, 442:464-474.
- Barrett T, Wilhite SE, Ledoux P, Evangelista C, Kim IF, Tomashevsky M, Marshall KA, Phillippy KH, Sherman PM, Holko M et al: NCBI GEO: archive for functional genomics data sets—update. Nucleic Acids Research 2012, 41(D1):D991-D995.
- Győrffy B: Discovery and ranking of the most robust prognostic biomarkers in serous ovarian cancer. GeroScience 2023, 45(3):1889-1898.
- Tang Z, Li C, Kang B, Gao G, Li C, Zhang Z: GEPIA: a web server for cancer and normal gene expression profiling and interactive analyses. Nucleic Acids Research 2017, 45(W1):W98-W102.
- Ferraresi A, Titone R, Follo C, Castiglioni A, Chiorino G, Dhanasekaran DN, Isidoro C: The protein restriction mimetic Resveratrol is an autophagy inducer stronger than amino acid starvation in ovarian cancer cells. Mol Carcinog 2017, 56(12):2681-2691.
- Statello L, Guo C-J, Chen L-L, Huarte M: Gene regulation by long non-coding RNAs and its biological functions. Nature Reviews Molecular Cell Biology 2021, 22(2):96-118.
- Chang CC, Tsou SH, Chen WJ, Ho YJ, Hung HC, Liu GY, Singh SK, Li HH, Lin CL: miR-302 Attenuates Mutant Huntingtin-Induced Cytotoxicity through Restoration of Autophagy and Insulin Sensitivity. Int J Mol Sci 2021, 22(16).
- He Q, Li L: MicroRNA-302a enhances 5-fluorouracil sensitivity in HepG2 cells by increasing AKT/ULK1-dependent autophagy-mediated apoptosis. Oncologie 2023, 26(2):211-220.
- Ren P, Wu K, Chen M, Huang Q, Luo Z, Wang Y: MiR-302c-3p regulates autophagy and apoptosis in ovarian granulosa cells via the LATS2/YAP axis in chickens. Theriogenology 2024, 229:100-107.
- Cao Y, Li J, Qiu S, Ni S, Duan Y: LncRNA XIST facilitates hypertrophy of ligamentum flavum by activating VEGFA-mediated autophagy through sponging miR-302b-3p. Biology Direct 2023, 18(1):25.
- Huang T, Pu Q, Zhou C, Lin P, Gao P, Zhang X, Chu Y, Yue B, Wu M: MicroRNA-302/367 Cluster Impacts Host Antimicrobial Defense via Regulation of Mitophagic Response Against Pseudomonas aeruginosa Infection. Front Immunol 2020, 11:569173.
- Zhang Z, Hong Y, Xiang D, Zhu P, Wu E, Li W, Mosenson J, Wu WS: MicroRNA-302/367 cluster governs hESC self-renewal by dually regulating cell cycle and apoptosis pathways. Stem Cell Reports 2015, 4(4):645-657.
- Li Y, Zheng W, Lu Y, Zheng Y, Pan L, Wu X, Yuan Y, Shen Z, Ma S, Zhang X et al: BNIP3L/NIX-mediated mitophagy: molecular mechanisms and implications for human disease. Cell Death & Disease 2021, 13(1):14.
- Zhang G, Xu Z, Yu M, Gao H: Bcl-2 interacting protein 3 (BNIP3) promotes tumor growth in breast cancer under hypoxic conditions through an autophagy-dependent pathway. Bioengineered 2022, 13(3):6280-6292.
- Liu M, Zhang Y, Li Y, Shi T, Yan Y: LncRNA Zfas1 boosts cell apoptosis and autophagy in myocardial injury induced by hypoxia via miR-383-5p/ATG10 axis. Heliyon 2024, 10(3):e24578.
- Chen L, Han X, Hu Z, Chen L: The PVT1/miR-216b/Beclin-1 regulates cisplatin sensitivity of NSCLC cells via modulating autophagy and apoptosis. Cancer Chemotherapy and Pharmacology 2019, 83(5):921-931.
- Chen W, Zhai L, Liu H, Li Y, Zhang Q, Xu D, Fan W: Downregulation of lncRNA ZFAS1 inhibits the hallmarks of thyroid carcinoma via the regulation of miR-302-3p on cyclin D1. Mol Med Rep 2021, 23(1).
- Feng B, Liu J, Wang E, Su Z, Chakrabarti S: Endothelial derived miRNA-9 mediated cardiac fibrosis in diabetes and its regulation by ZFAS1. PLOS ONE 2022, 17(10):e0276076.
- Singh RK, Mandal S, Mohanta A, Yadav R, Kumar RR, Khatkar R, Uttam V, Sharma U, Rana MK, Jain M et al: The regulatory role of ZFAS1/miRNAs/mRNAs axis in cancer: a systematic review. Oncol Res 2025, 33(3):591-604.
- Zhan L, Zhang Y, Wang W, Song E, Fan Y, Li J, Wei B: Autophagy as an emerging therapy target for ovarian carcinoma. Oncotarget 2016, 7(50):83476-83487.
- Ferraresi A, Girone C, Esposito A, Vidoni C, Vallino L, Secomandi E, Dhanasekaran DN, Isidoro C: How Autophagy Shapes the Tumor Microenvironment in Ovarian Cancer. Frontiers in Oncology 2020, Volume 10 - 2020.
- Chavez-Dominguez R, Perez-Medina M, Lopez-Gonzalez JS, Galicia-Velasco M, Aguilar-Cazares D: The Double-Edge Sword of Autophagy in Cancer: From Tumor Suppression to Pro-tumor Activity. Frontiers in Oncology 2020, Volume 10 - 2020.
- Dong Y, Zhang X: Targeting cellular mitophagy as a strategy for human cancers. Front Cell Dev Biol 2024, 12:1431968.
- Vianello C, Cocetta V, Catanzaro D, Dorn GW, De Milito A, Rizzolio F, Canzonieri V, Cecchin E, Roncato R, Toffoli G et al: Cisplatin resistance can be curtailed by blunting Bnip3-mediated mitochondrial autophagy. Cell Death & Disease 2022, 13(4):398.
- Mauro-Lizcano M, Sotgia F, Lisanti MP: Mitophagy and cancer: role of BNIP3/BNIP3L as energetic drivers of stemness features, ATP production, proliferation, and cell migration. Aging (Albany NY) 2024, 16(11):9334-9349.
Figure 1.
ClQ and EBSS modulate Autophagy in Ovarian Cancer Cells. (A) Representative immunofluorescence images of TYK-nu ovarian cancer cells treated for 6 hours with chloroquine (ClQ), Earle's Balanced Salt Solution (EBSS), or a combination of EBSS and ClQ. Cells were immunostained for LC3 (red) to visualize autophagosomes and LAMP1 (green) to mark lysosomes. Nuclei were counterstained with DAPI (blue). Images were captured using a confocal microscope. (B) Western blot analysis of p62 and LC3 (I/II isoforms) in four ovarian cancer cell lines (TYK-nu, Kuramochi, OVCAR5, and OVCAR8) and (C) patient-derived ovarian cancer cells (Pz1-4). GAPDH serves as a loading control.
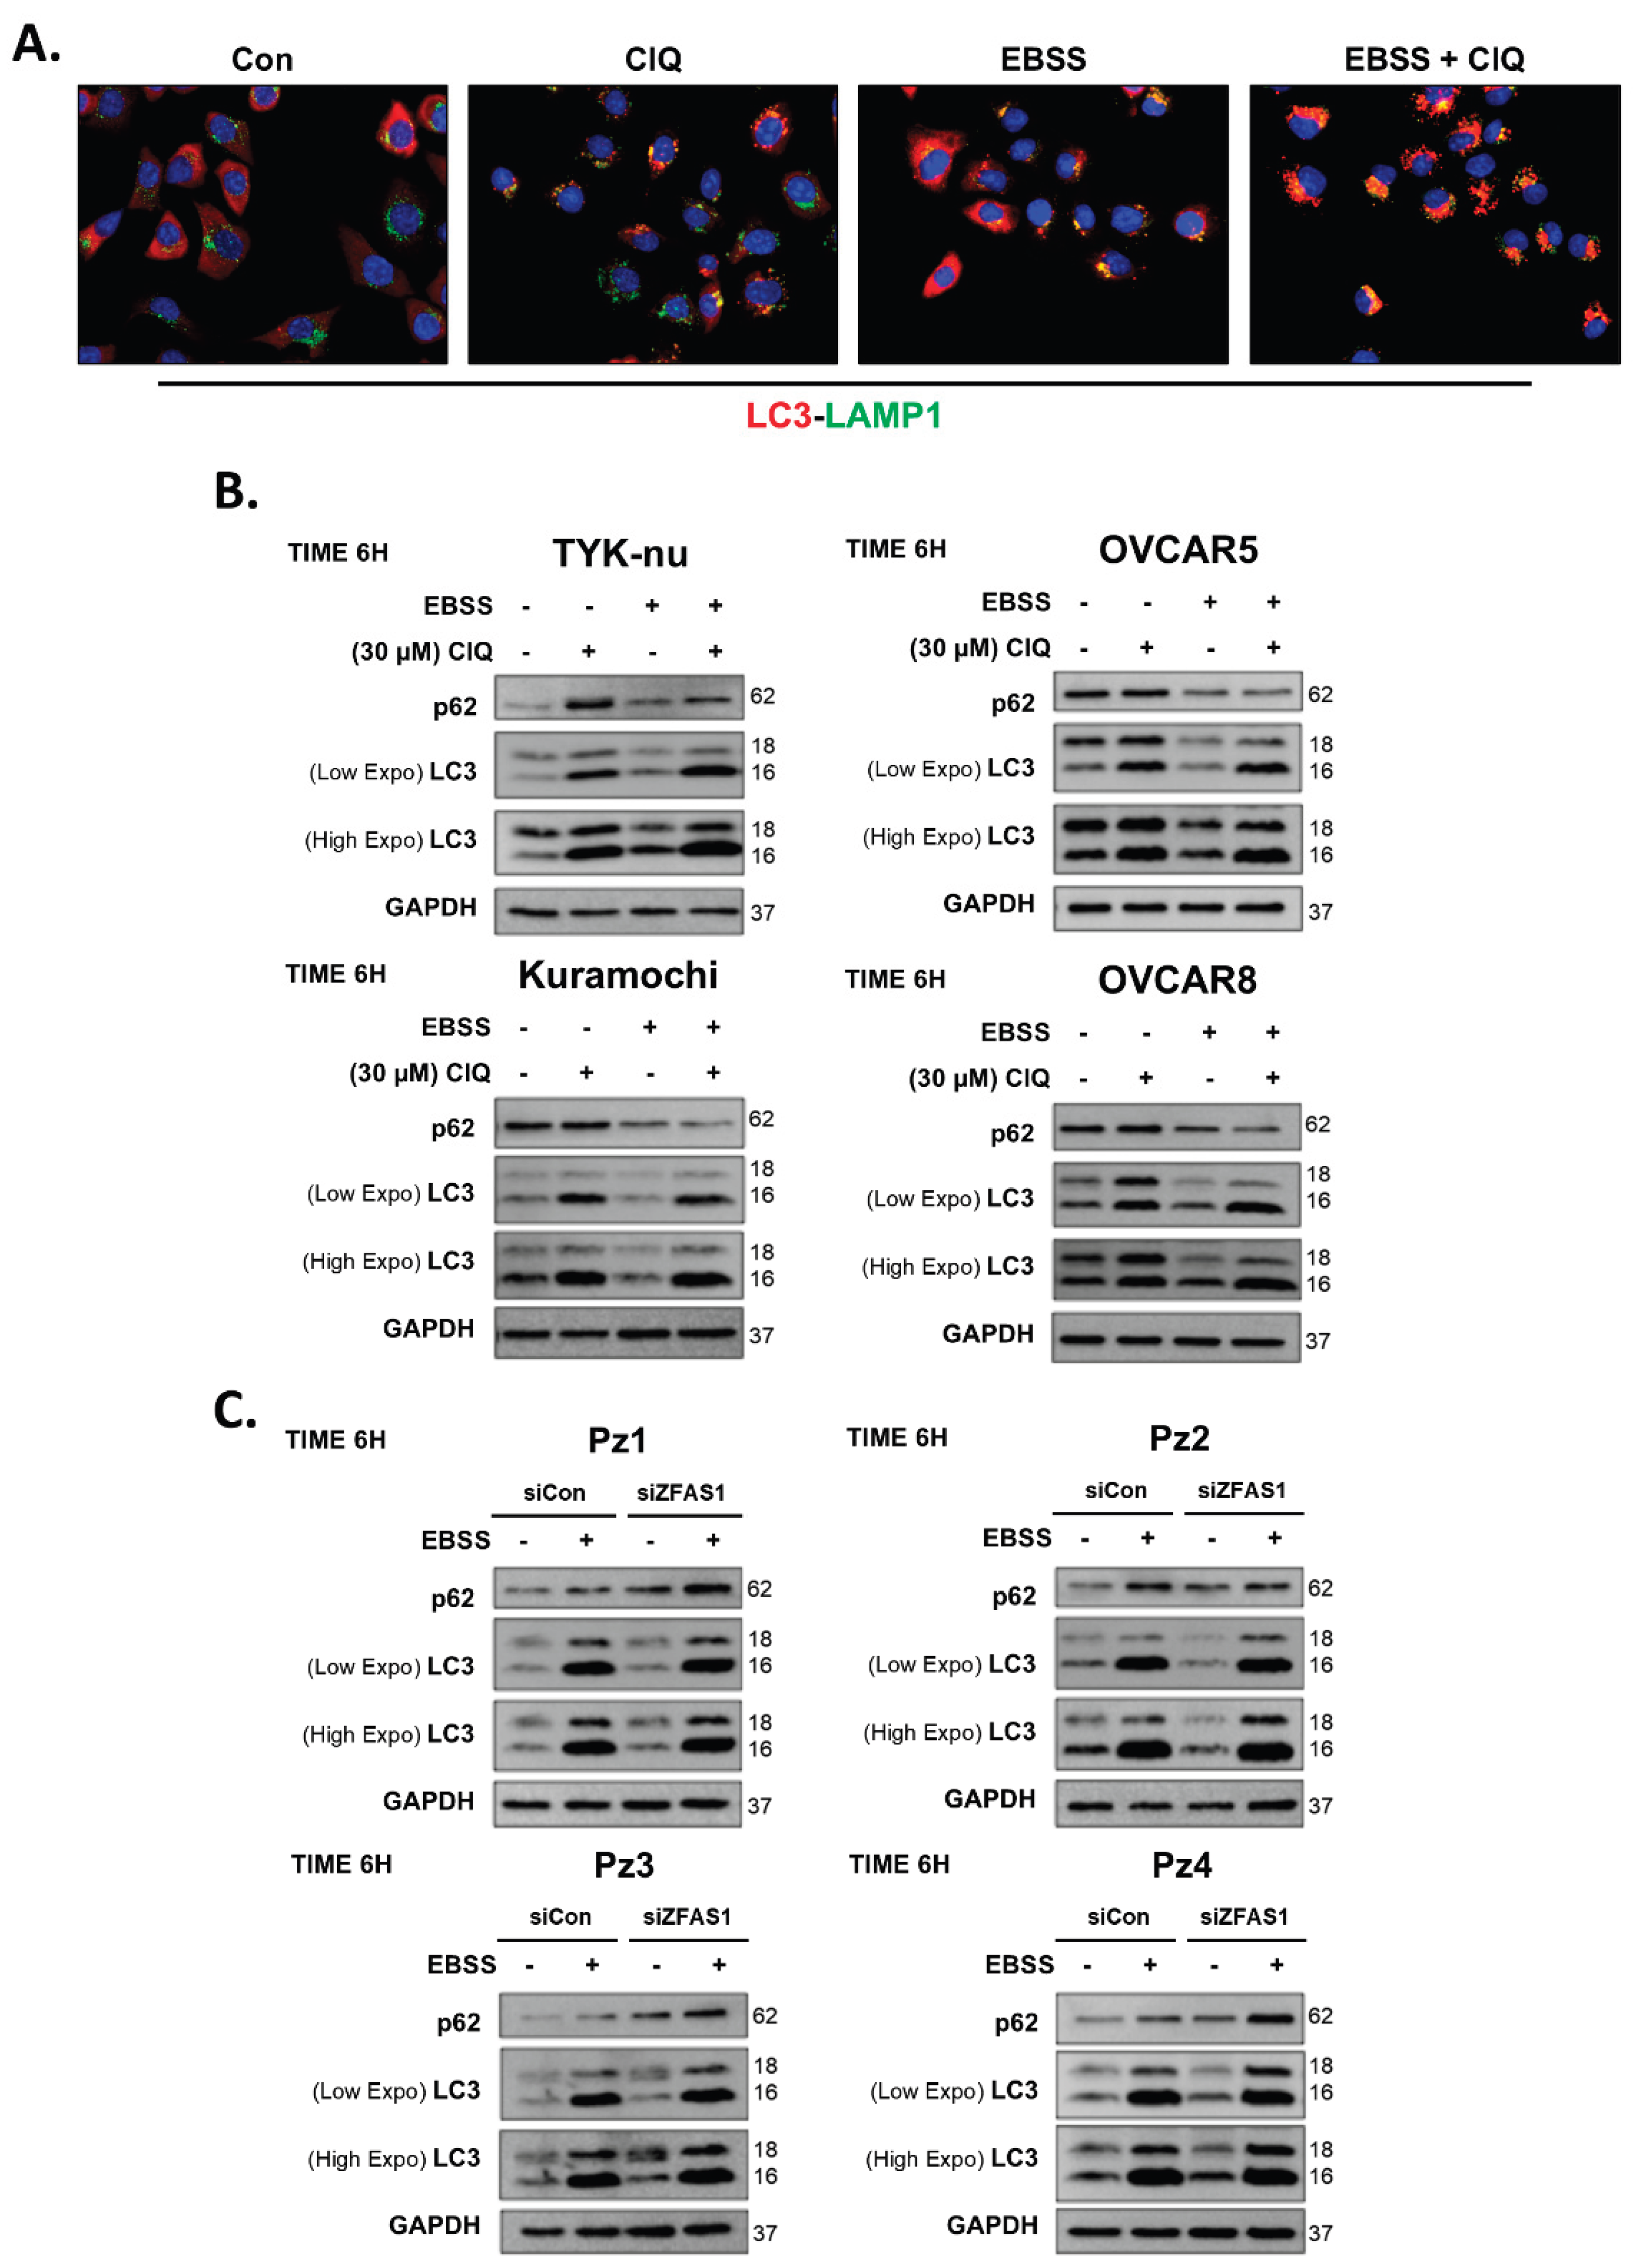
Figure 2.
Identification of autophagy-related lncRNAs in ovarian cancer cells. (A) Heatmap of lncRNA expression changes in TYK-nu cells following autophagy induction with EBSS for 6 hours. The heatmap displays log2-transformed fold changes of 89 lncRNAs, with red indicating upregulation and green indicating downregulation in autophagy condition. (B) Table listing lncRNAs with fold change ≥ 1.8 in response to EBSS-induced autophagy, as identified from the PCR array screening. (C) Validation of selected lncRNAs by qRT-PCR in TYK-nu cells following EBSS-induced autophagy. The graph shows relative expression levels of GAS5, HIF1A-AS2, LUCAT1, MIR7-3HG, KRASP1, ZFAS1, LINC00152, and PVT1. Data are presented as mean ± SEM from three independent experiments. *p < 0.05, **p < 0.01, ***p < 0.001 compared to control.
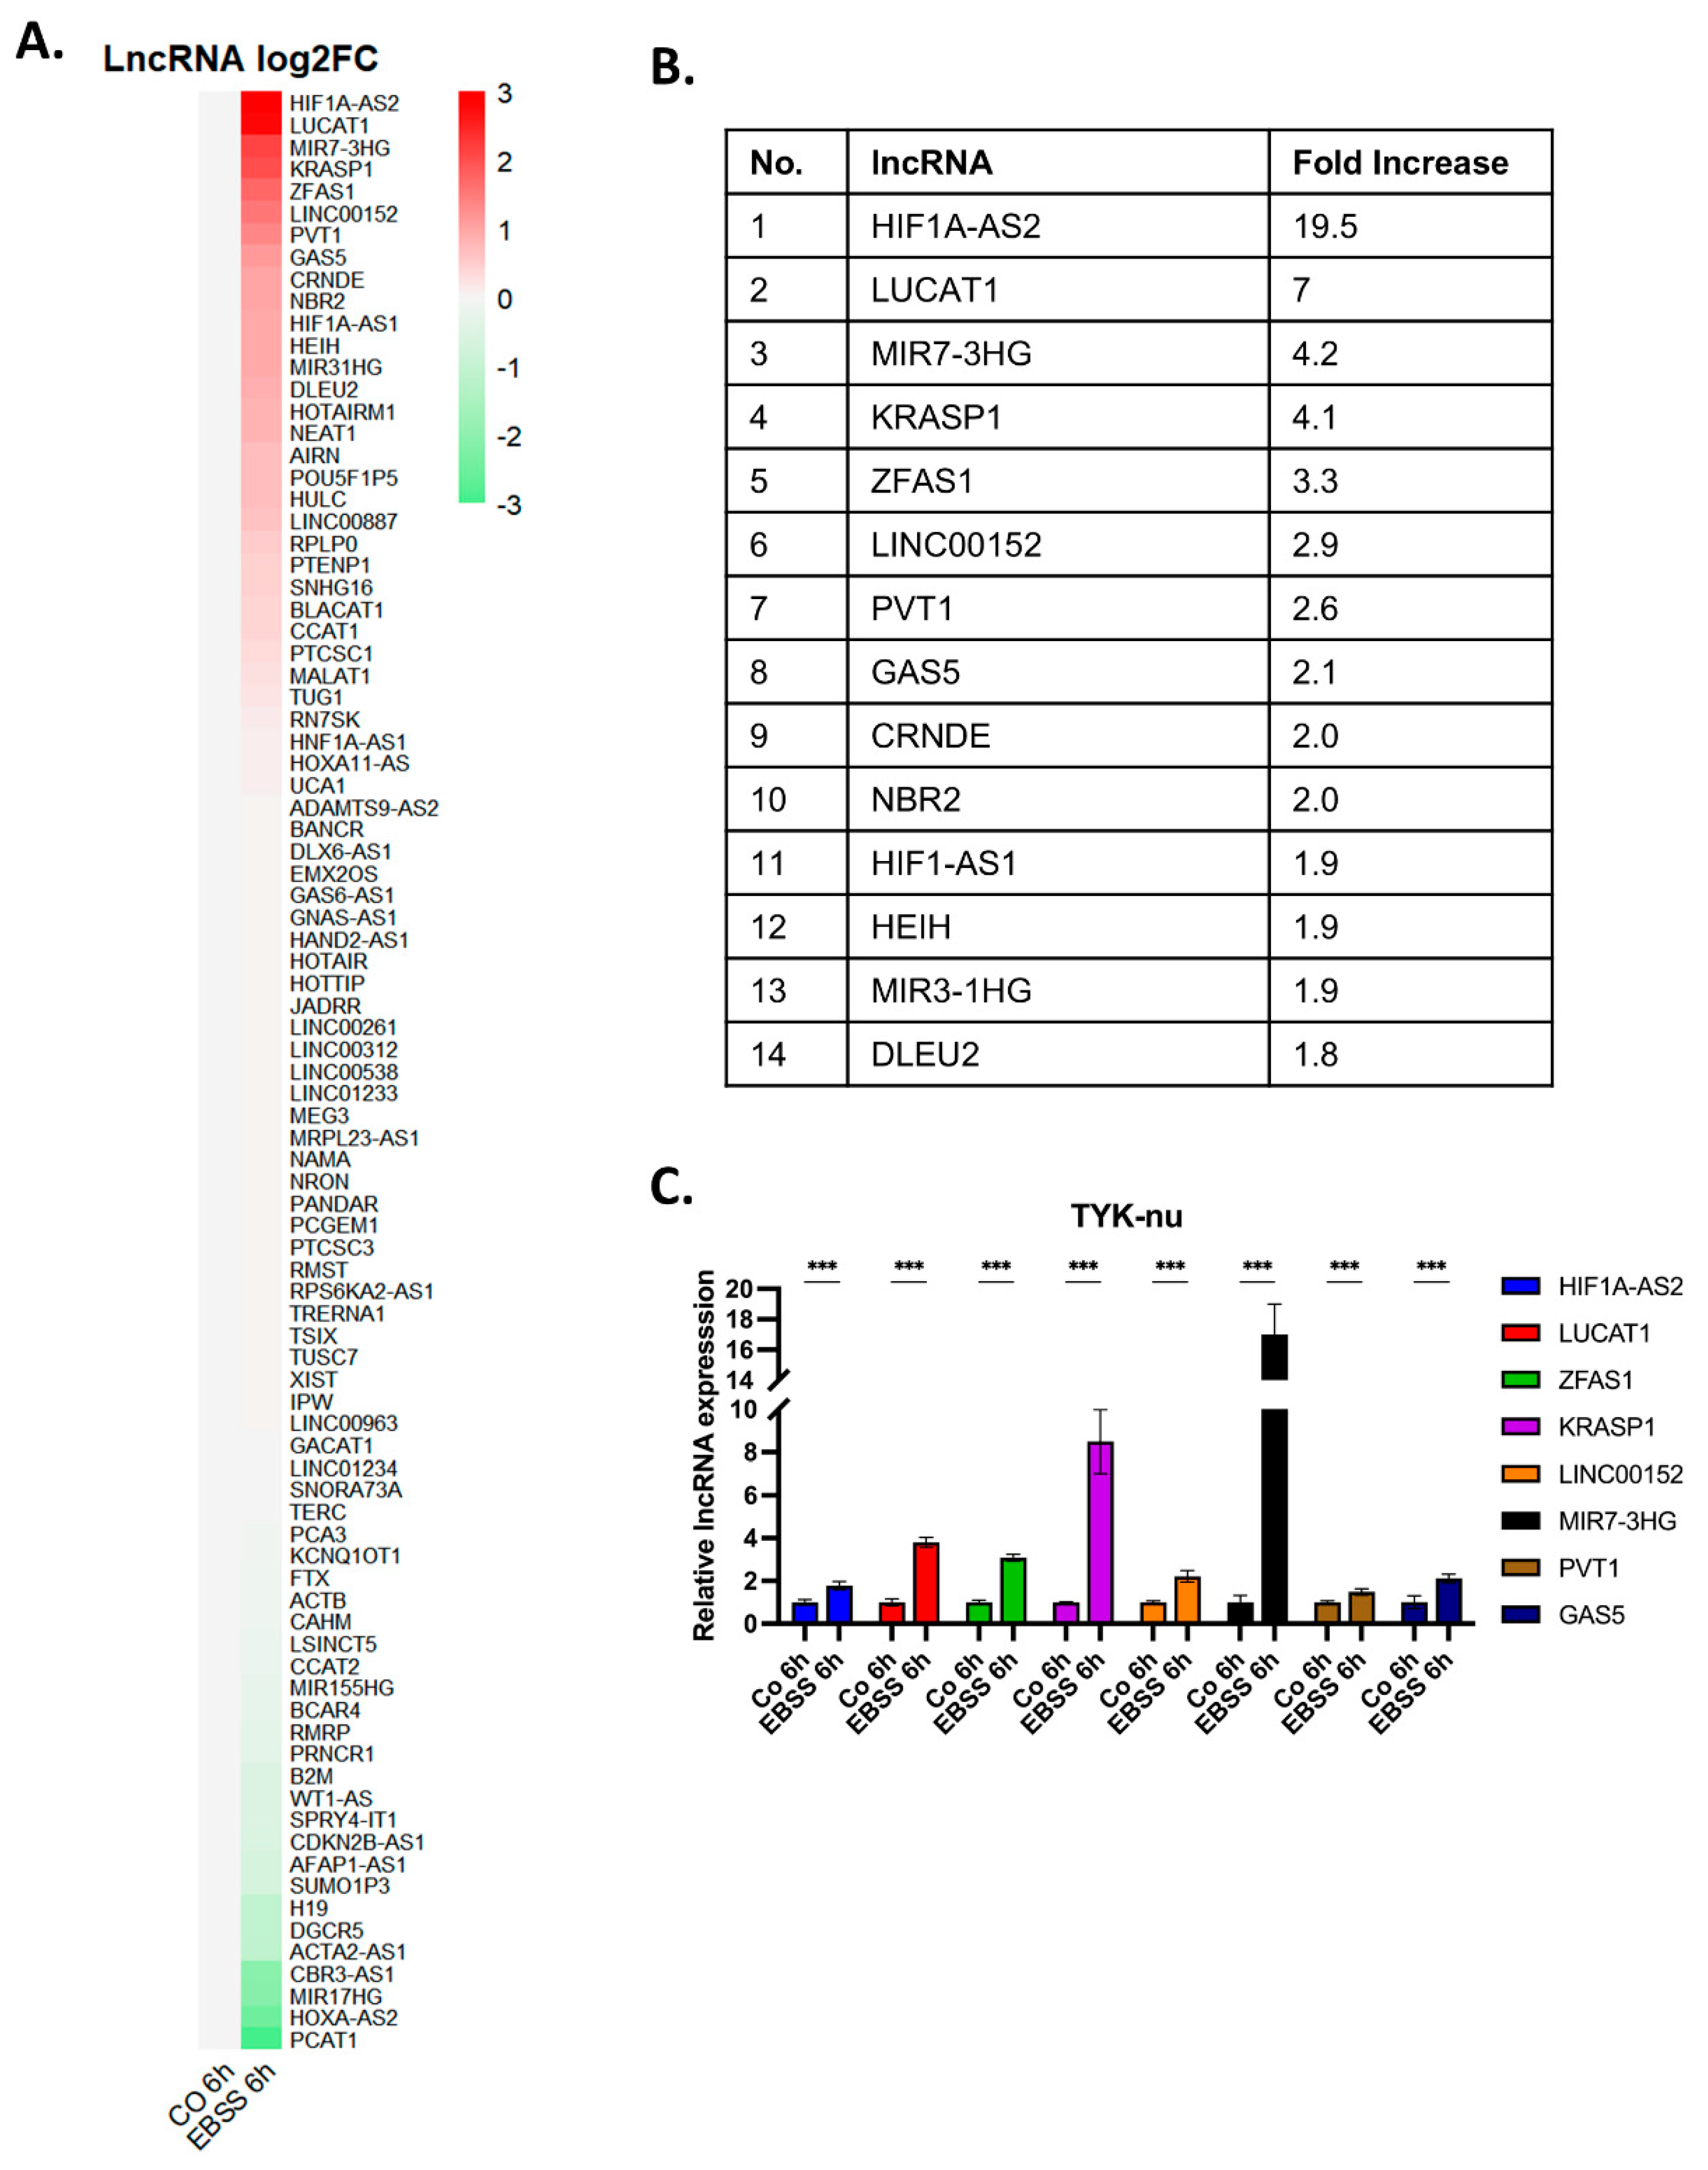
Figure 3.
Expression analysis of autophagy-related lncRNAs in ovarian cancer cell lines. Expression levels of (A) GAS5, (B) HIF1A-AS2, (C) LUCAT1, (D) MIR7-3HG, (E) KRASP1, (F) LINC00152, (G) PVT1, and (H) ZFAS1 analyzed by qRT-PCR in four high-grade serous ovarian cancer cell lines under control conditions and after 6h EBSS treatment. Data are presented as relative expression normalized to control conditions. Mean ± SEM, n=3, *p < 0.05, **p < 0.01, ***p < 0.001, ****p < 0.0001.
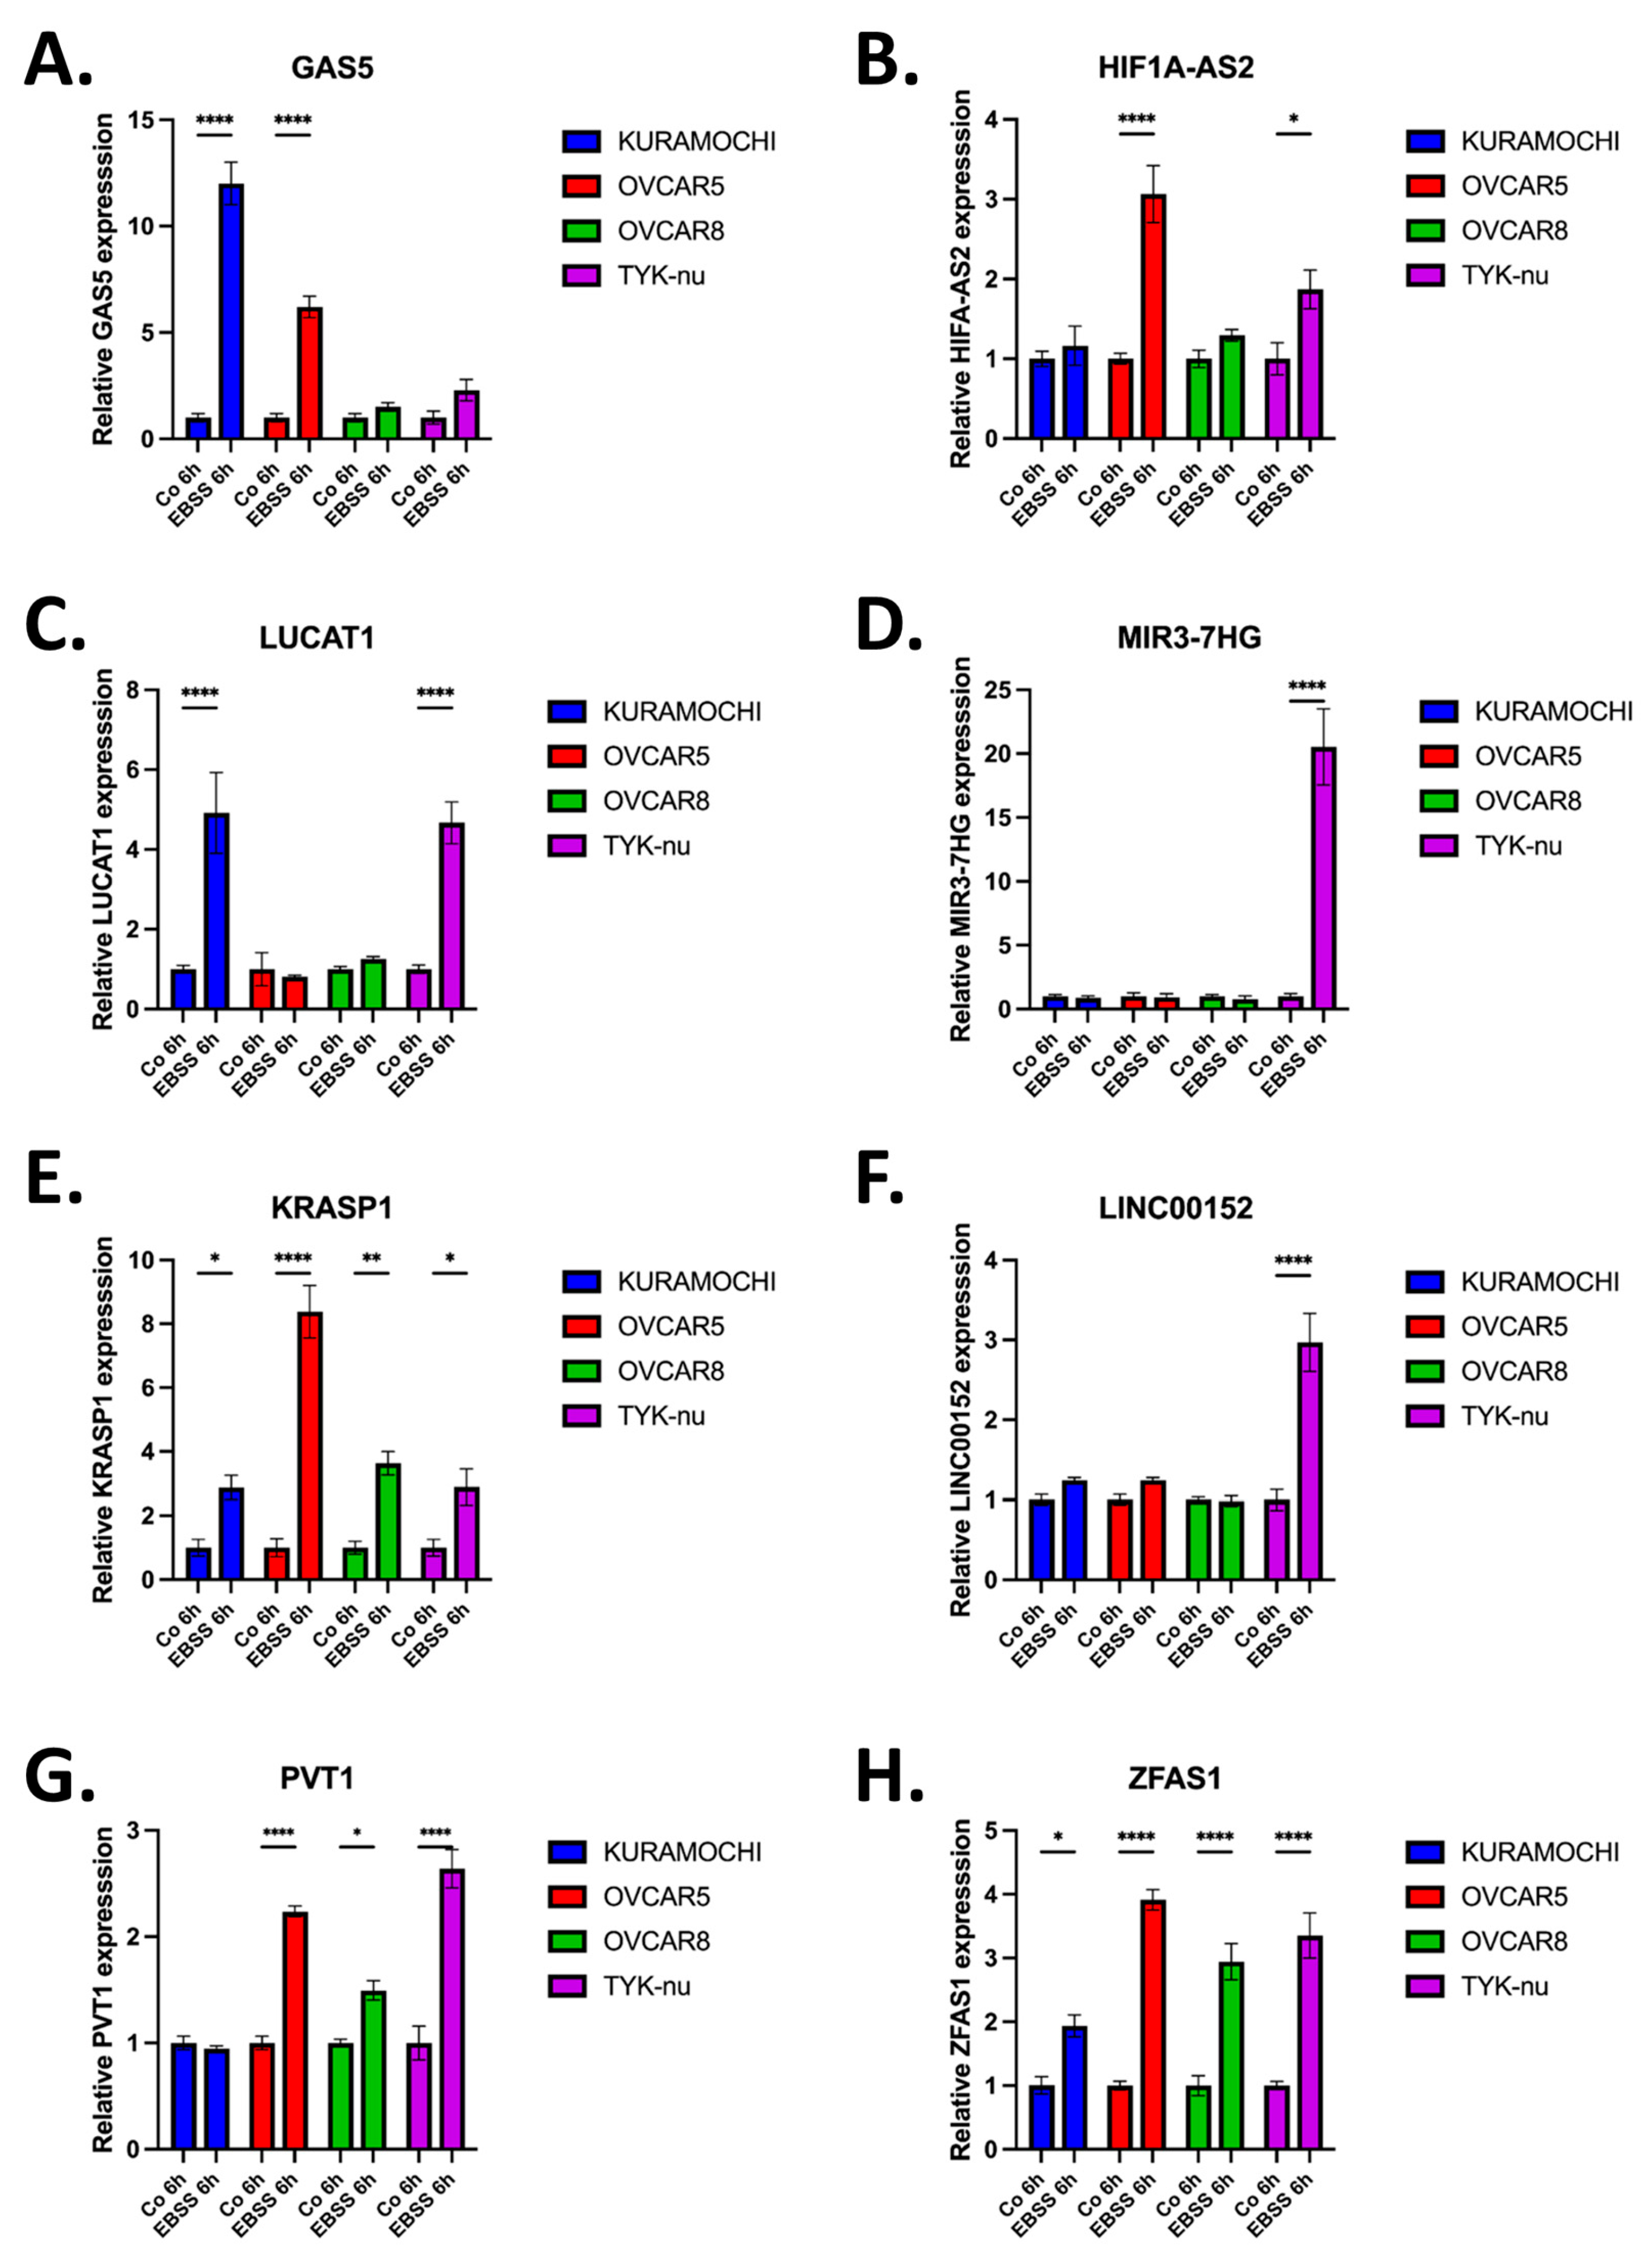
Figure 4.
Effect of ZFAS1 silencing on autophagy markers and ZFAS1 expression in ovarian cancer cell lines. (A-D) Left panels: Western blot analysis of autophagy markers p62 and LC3 in (A) TYK-nu, (B) OVCAR5, (C) Kuramochi, and (D) OVCAR8 cells transfected with control siRNA (siCON) or ZFAS1 siRNA (siZFAS1) under control or EBSS treatment conditions (6 h). GAPDH serves as loading control. Right panels: qRT-PCR analysis of ZFAS1 expression under the same conditions. C.M.: complete media. Data are presented as mean ± SEM, n=3, *p < 0.05, **p < 0.01, ***p < 0.001.
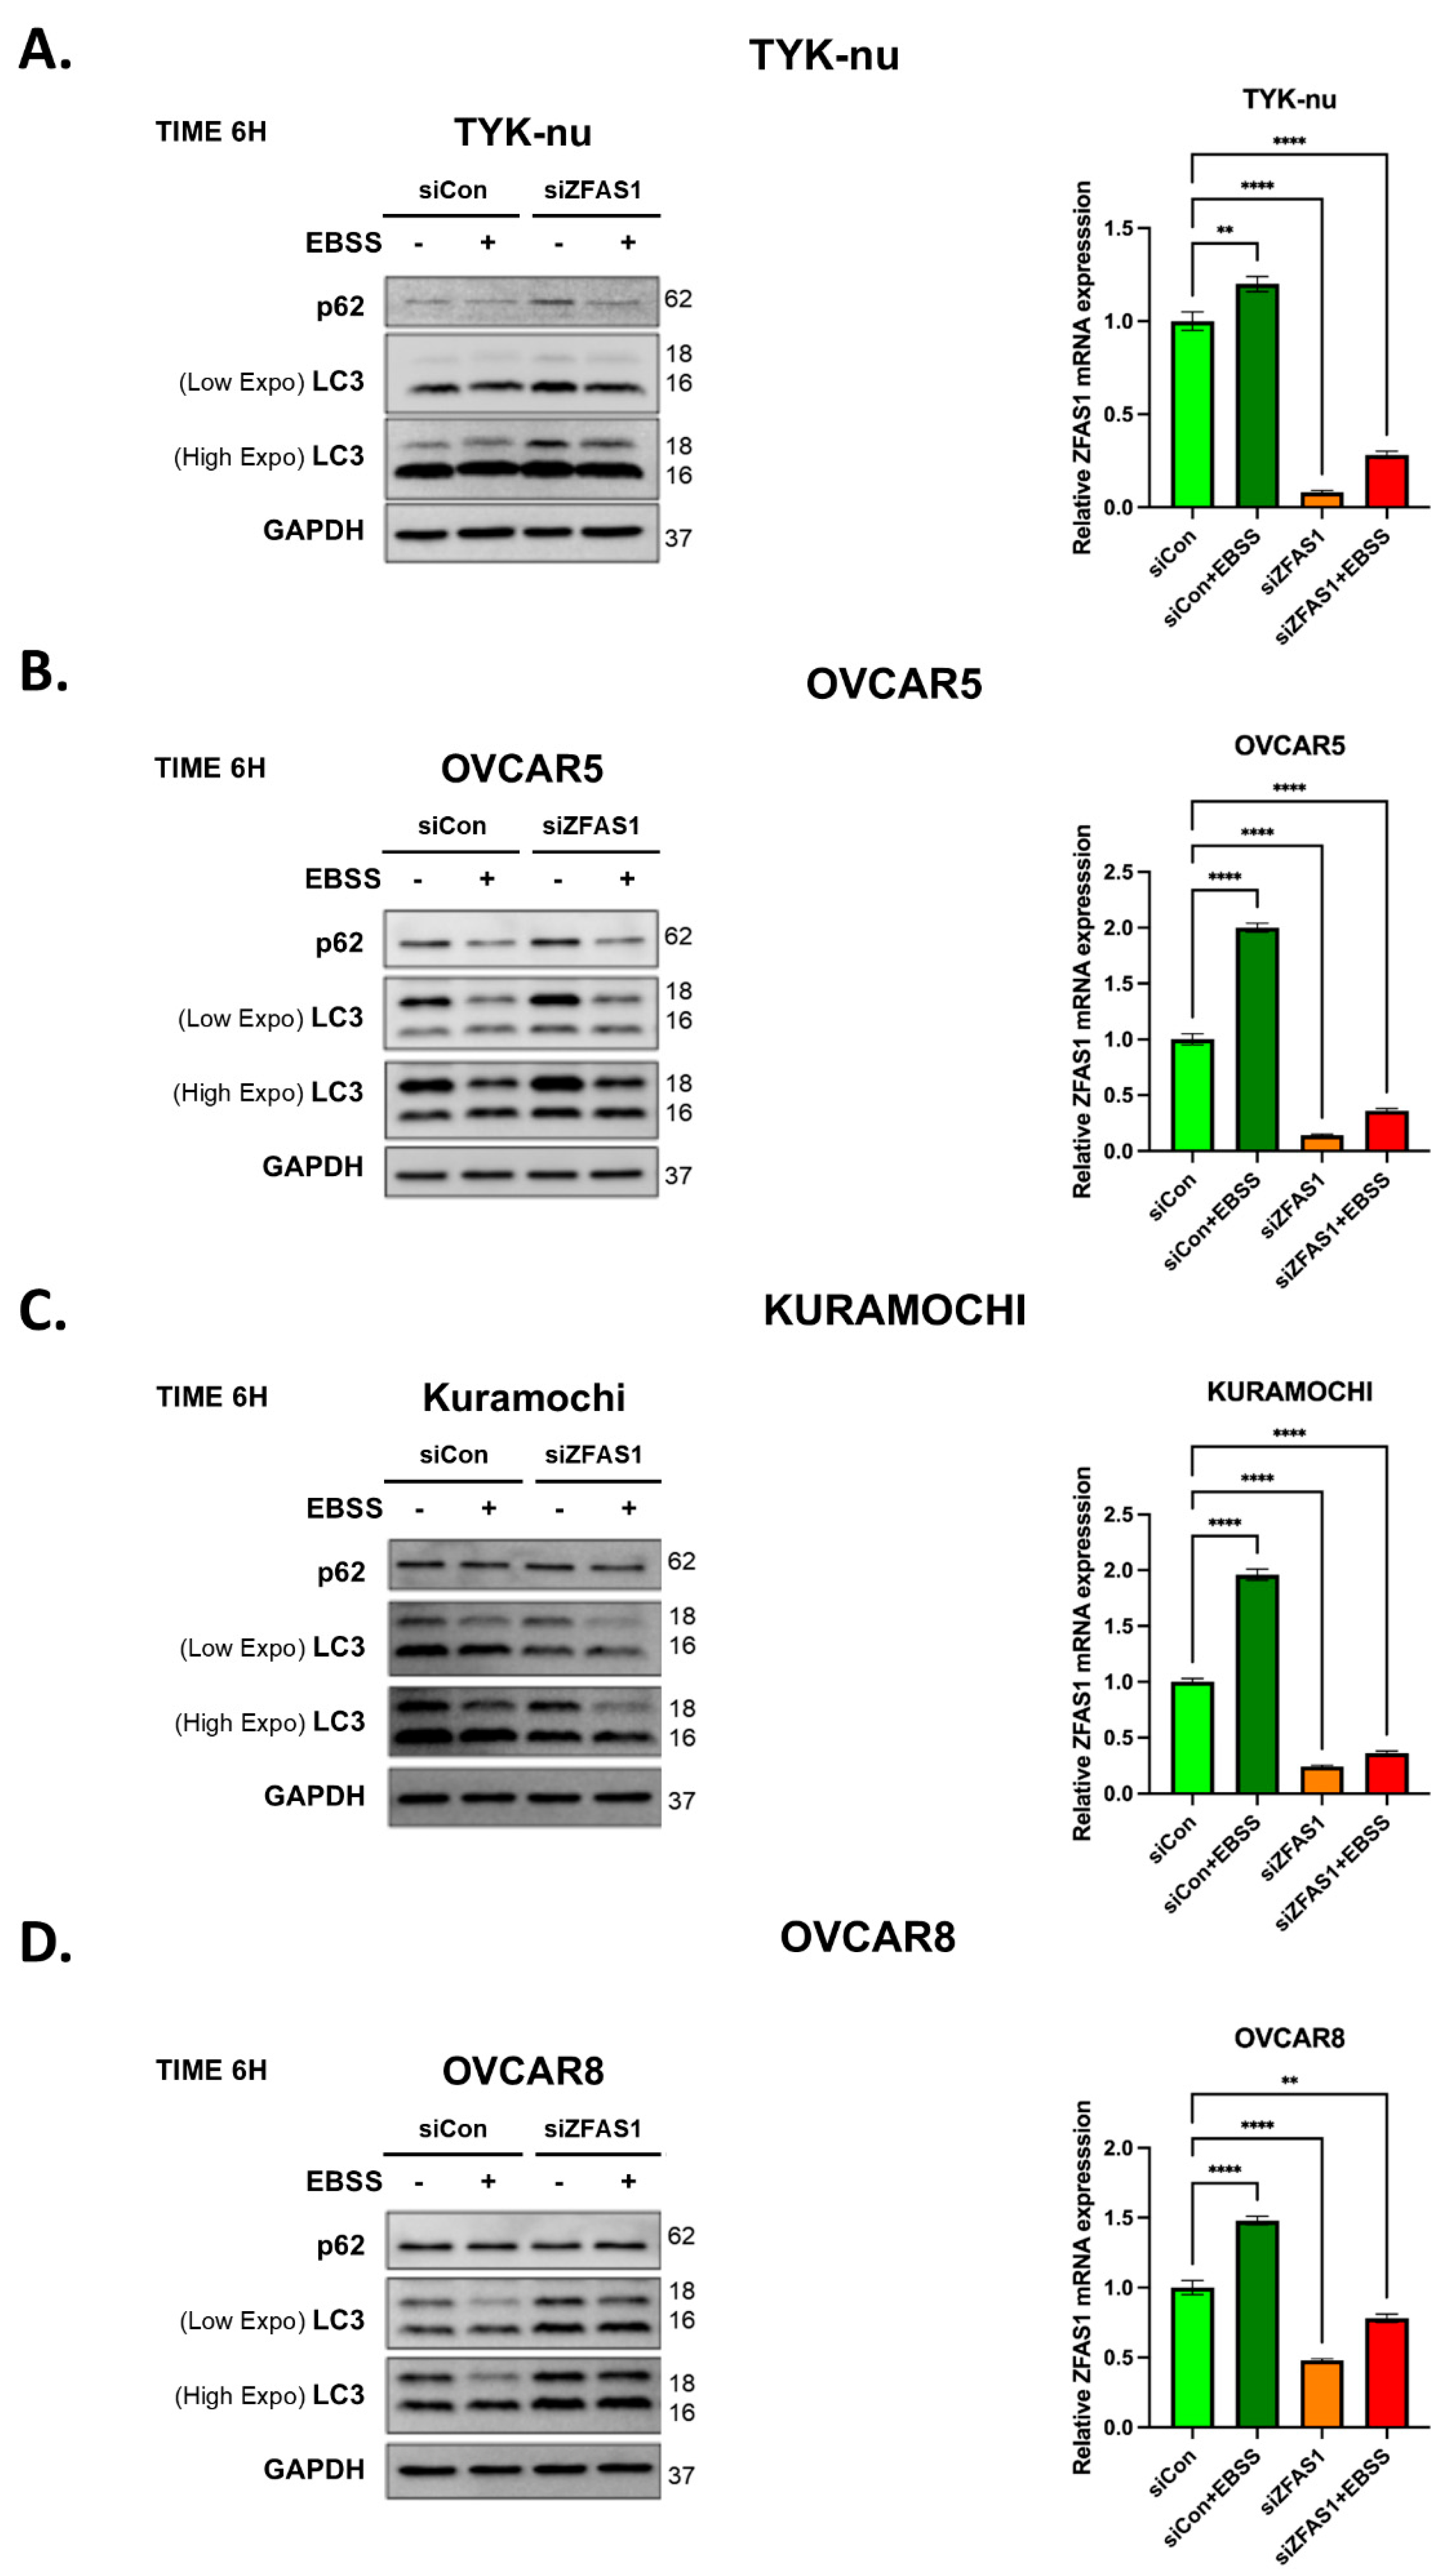
Figure 5.
ZFAS1 regulates miR302 family expression. (A) Table summarizing miRNAs with > 2-fold increase in expression following ZFAS1 silencing in Kuramochi cells, as determined by miScript miRNA PCR array analysis. (B) Expression analysis of ZFAS1 and miR302 family members (hsa-miR302a-3p, hsa-miR302a-5p, hsa-miR302b-3p, and hsa-miR302c-3p) and ZFAS1 in TYK-nu cells under different conditions (siCON, siCON+EBSS, siZFAS1, siZFAS1+EBSS) using qRT-PCR. Data are presented as mean ± SEM, n=3. ***p < 0.001, ****p < 0.0001 compared to siCON.
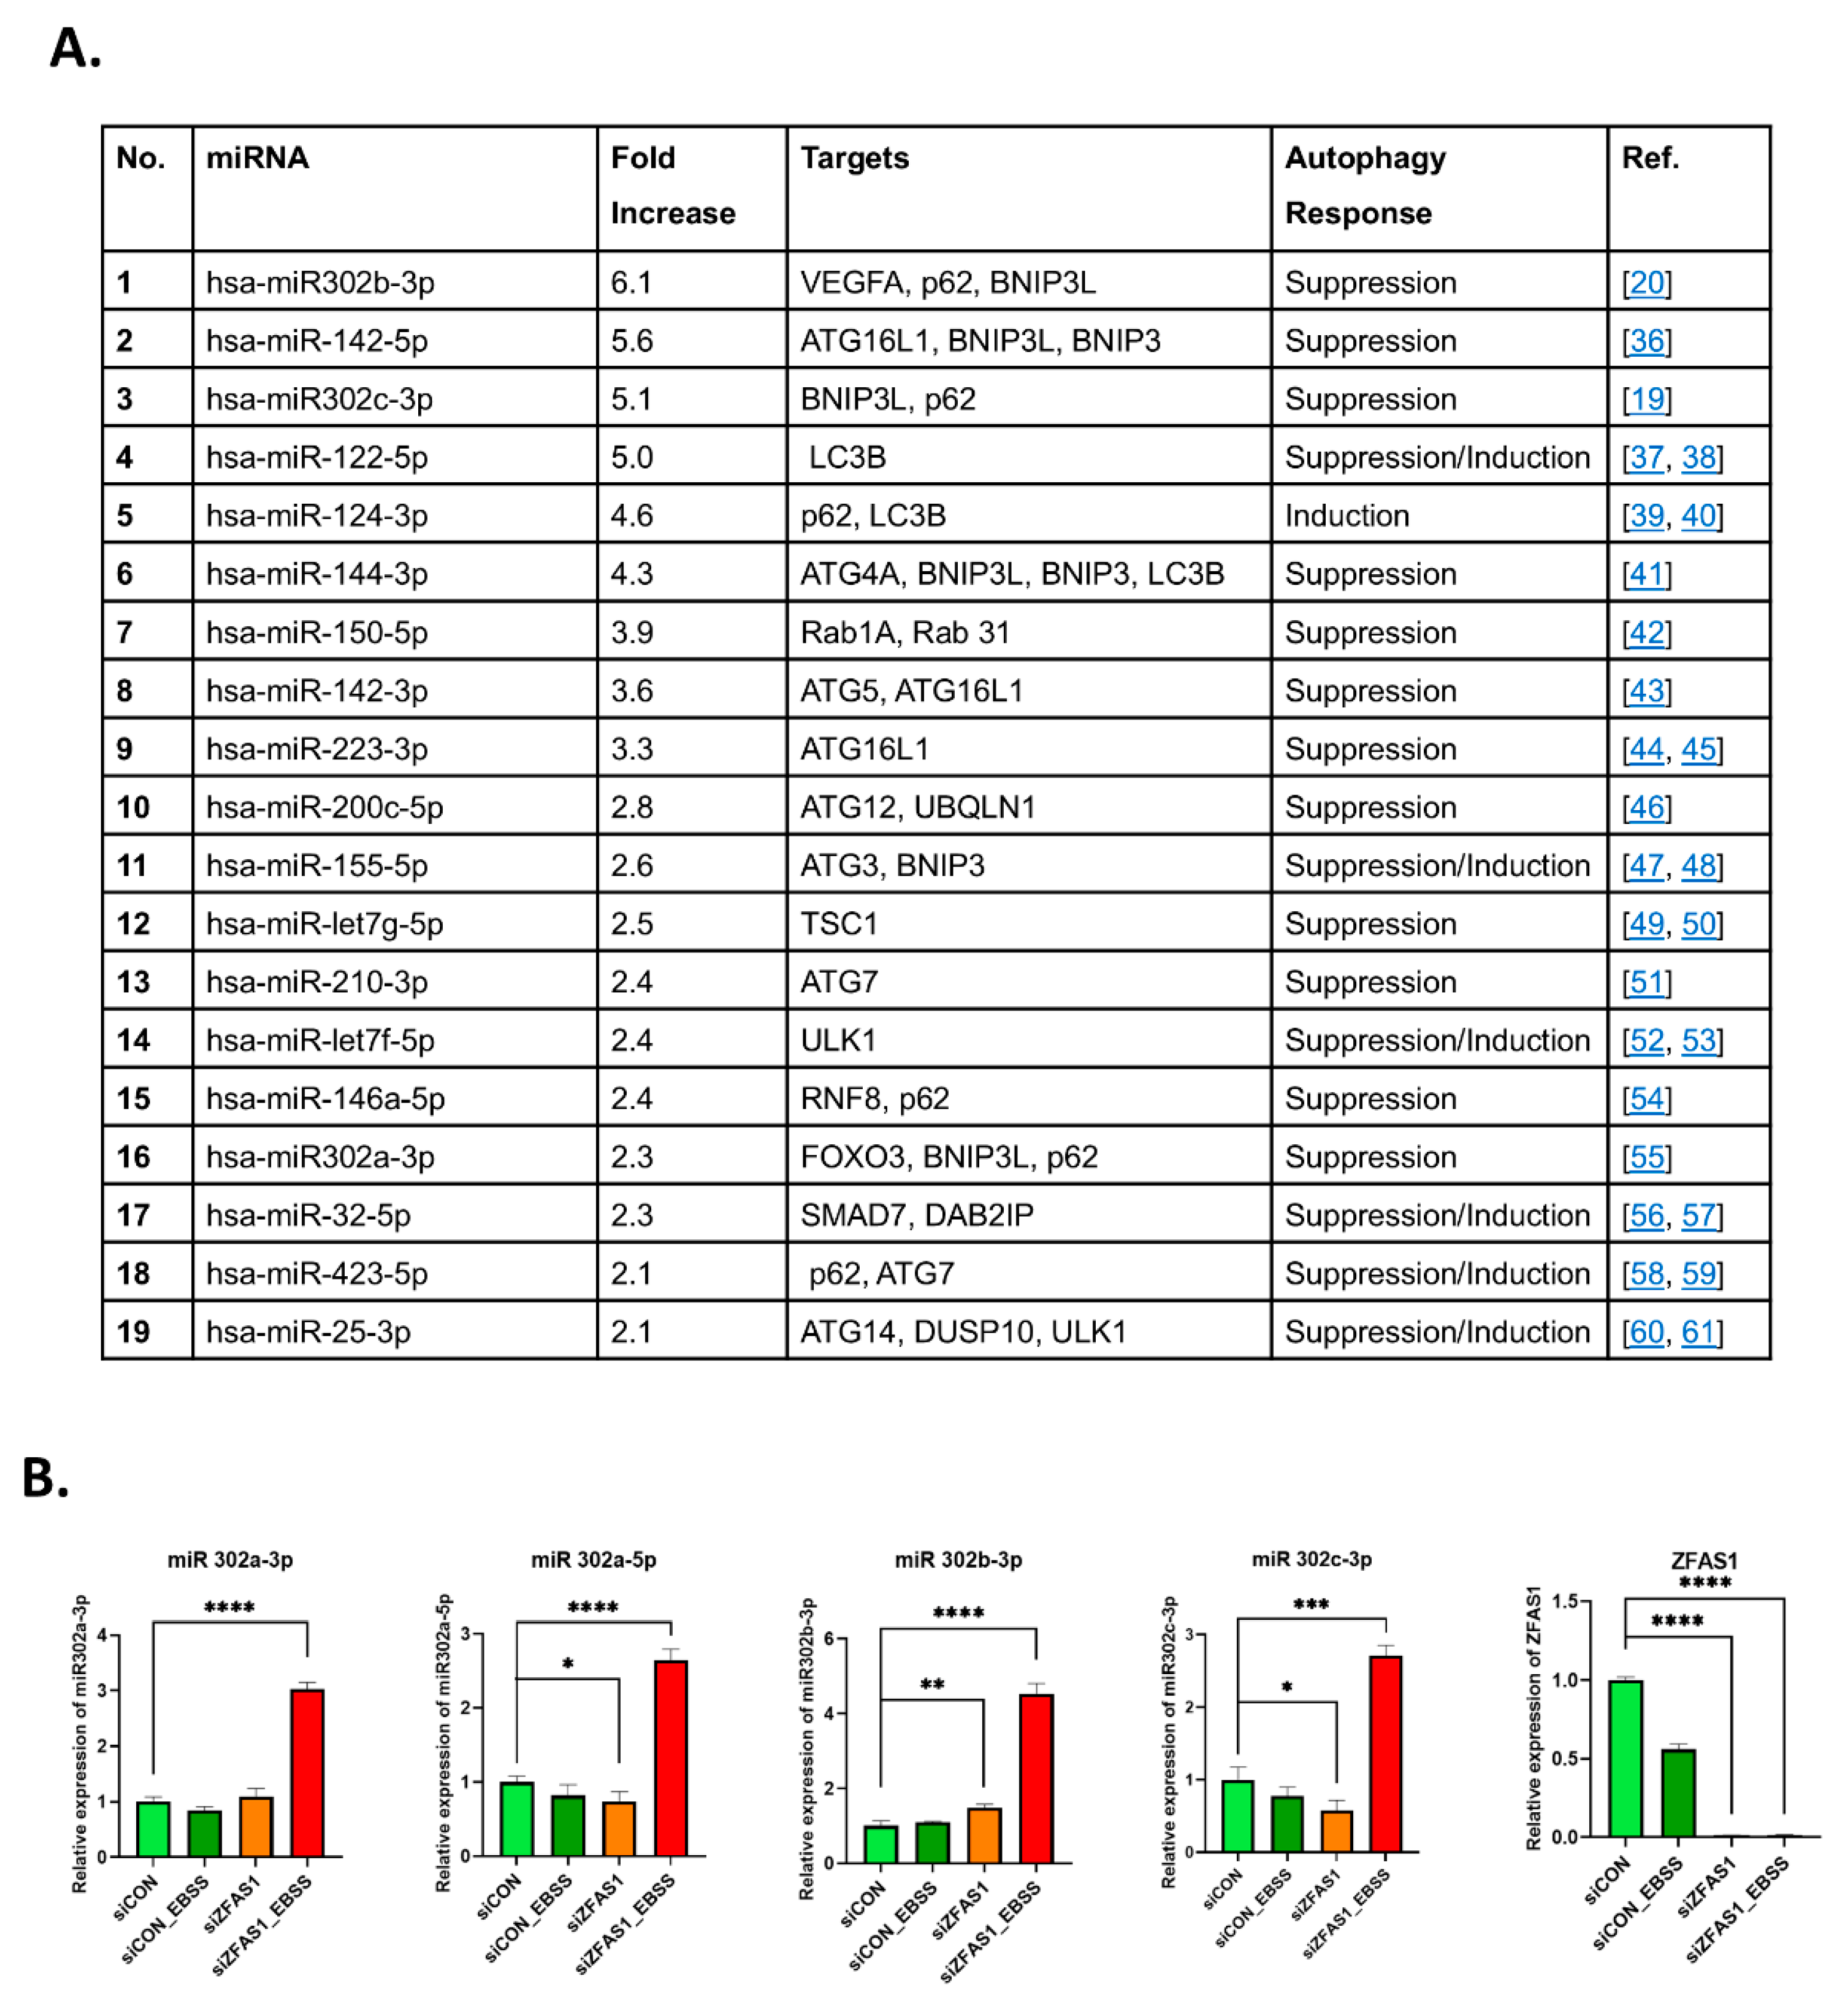
Figure 6.
Clinical significance and molecular correlates of ZFAS1 in ovarian cancer. (A-B) Kaplan-Meier analysis of (A) overall survival and (B) disease-free survival in TCGA ovarian cancer patients stratified by ZFAS1 expression. (C) GSEA plot showing enrichment of autophagy of mitochondrion gene set in ZFAS1-high group from GSE27651 (NES=1.679, p=0.0003). (D) BNIP3L expression levels in ZFAS1-low versus ZFAS1-high groups across three independent datasets: GSE101108, GSE9899 and GSE27651. (E) Western blot analysis (left) shows BNIP3L protein levels in TYK-nu and OVCAR5 after ZFAS1 knockdown by siRNA transfection, compared to control (siNC). GAPDH was used as a loading control. The right panel presents quantitative PCR data confirming the knockdown of ZFAS1 mRNA in the same cell lines following siZFAS1 transfection. Data are represented as mean ± SEM from at least three independent experiments; significance determined by Student’s t-test. **p<0.01, ***p<0.001.
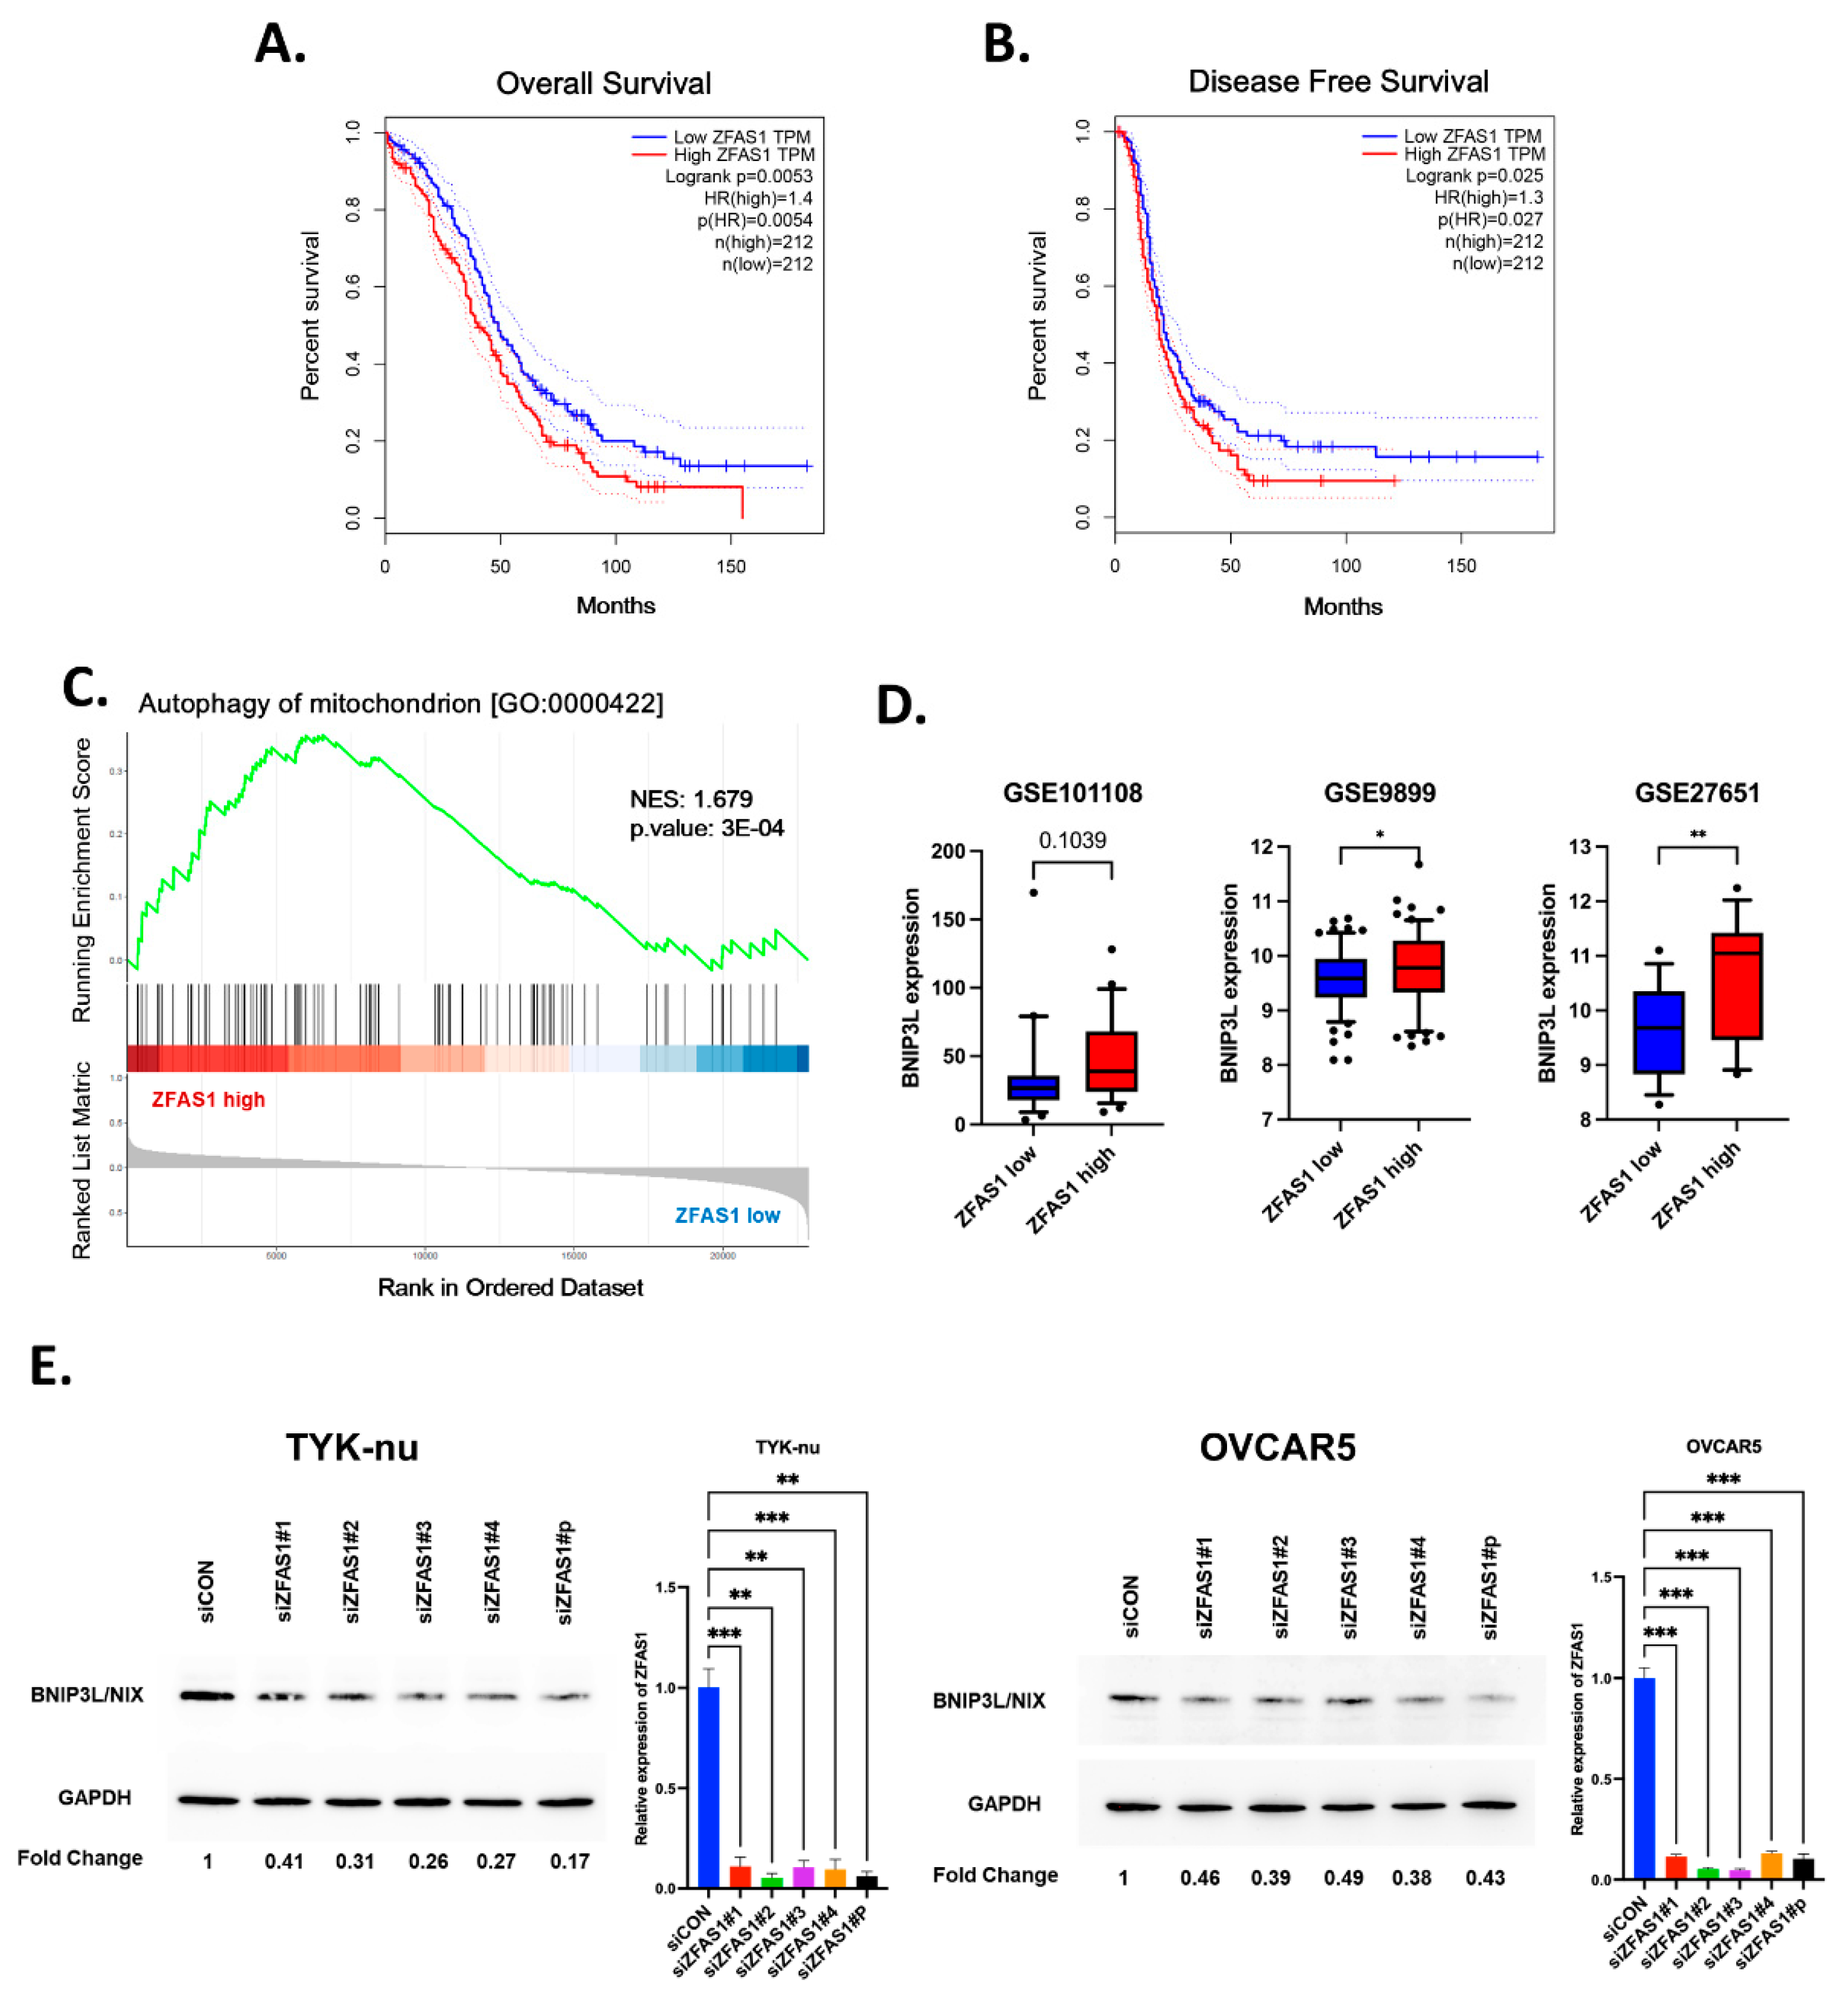
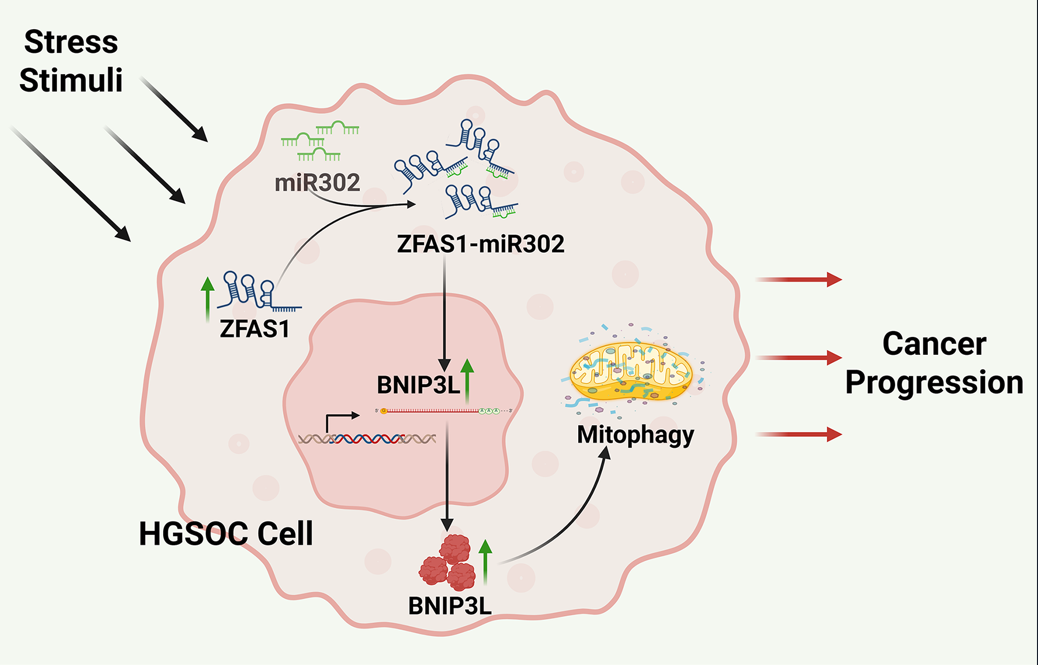
Figure 7.
ZFAS1–miR302–BNIP3L–Autophagy Axis and Ovarian Cancer Progression. Under metabolic stress, ZFAS1 is upregulated and suppresses miR302 expression, thereby relieving its inhibitory effect on BNIP3L. The resulting upregulation of BNIP3L enhances mitophagy—a key component of autophagy—facilitating cellular survival and adaptation. This ZFAS1–miR302–BNIP3L–autophagy axis promotes major hallmarks of ovarian cancer progression, including proliferation, epithelial–mesenchymal transition (EMT), invasion, migration, metastasis, and stemness.
Disclaimer/Publisher’s Note: The statements, opinions and data contained in all publications are solely those of the individual author(s) and contributor(s) and not of MDPI and/or the editor(s). MDPI and/or the editor(s) disclaim responsibility for any injury to people or property resulting from any ideas, methods, instructions or products referred to in the content. |
© 2025 by the authors. Licensee MDPI, Basel, Switzerland. This article is an open access article distributed under the terms and conditions of the Creative Commons Attribution (CC BY) license (http://creativecommons.org/licenses/by/4.0/).
Copyright: This open access article is published under a Creative Commons CC BY 4.0 license, which permit the free download, distribution, and reuse, provided that the author and preprint are cited in any reuse.


