
Submitted:
07 August 2025
Posted:
08 August 2025
You are already at the latest version
Abstract
Background/Objectives: Epithelial ovarian cancer (EOC) is often diagnosed at advanced stages, with metastasis driven by spheroid dissemination within the peritoneal cavity. We previously demonstrated that autophagy supports spheroid cell survival and suggest that it contributes to chemoresistance. Unc-51-like autophagy activating kinase 1 (ULK1), a key regulator of autophagy, has emerged as a promising therapeutic target. Here, we eval-uated the effects of ULK1 inhibition via MRT68921, alone and in combination with afatinib—a tyrosine kinase inhibitor (TKI) known to induce pro-survival autophagy—in EOC.
Methods: High-grade serous (HGSOC) and ovarian clear cell carcinoma (OCCC) cell lines were cultured under ad-herent and spheroid conditions. Immunoblotting confirmed on-target effects and modulation of autophagy. Autophagic flux was assessed using mCherry-eGFP-LC3 reporter assays. We assessed 96 dose combinations of MRT68921 and afatinib using drug combination matrices, with synergy evaluated via Synergy Finder. Promising combinations were evaluated across multiple EOC spheroid models and patient ascites-derived organoids.
Results: MRT68921 inhibited ULK1 activity and reduced autophagic flux in a con-text-dependent manner while afatinib alone induced autophagy. Their combination produced synergistic effects at select concentrations, impairing spheroid reattachment and viability. However, MRT68921 alone significantly reduced viability across multiple EOC models, including patient ascites-derived organoids.
Conclusions: This study is the first to evaluate the combined effects of MRT68921 and afatinib in EOC. Our findings support ULK1 inhibition as a therapeutic strategy with potential enhanced efficacy when combined with afatinib. These results warrant further preclinical investigation to explore the translational potential of ULK1-targeted therapies alone and in combination with TKIs.
Keywords:
ovarian cancer
; spheroids
; organoids
; ULK1
; autophagy
; MRT68921
; afatinib
Introduction
Epithelial ovarian cancer (EOC) ranks as the third most common gynecological cancer worldwide, bearing the highest mortality rate among such cancers in the developed world [1]. Many EOC patients are diagnosed at an advanced stage and chemoresistant disease is common, both factors contributing to a five-year survival rate of roughly 50% [2]. EOC comprises multiple histologies, with high-grade serous ovarian cancer (HGSOC) being the most common and lethal. Patients with HGSOC often respond initially to chemotherapy; however, recurrence with chemoresistant disease is common [3]. Ovarian clear cell carcinoma (OCCC) is a rarer histotype, accounting for approximately 10% of EOC cases, and is particularly difficult to treat due to poor responsiveness to conventional platinum-based chemotherapy [4,5]. Notably, effective strategies for treating chemoresistance for both histotypes disease remain elusive, underscoring the importance of investigating novel therapeutic strategies to improve patient outcomes.
A common feature of advanced EOC is the accumulation of fluid in the peritoneal cavity known as malignant ascites [6] . Within the ascites fluid, multicellular aggregates of EOC cells, known as spheroids, are present and thought to contribute to metastasis [7,8,9] . Their enhanced adhesive and invasive capacities allow them to attach to distant sites and form secondary lesions on many surfaces throughout the peritoneal cavity. Many studies in cell culture models have shown that EOC spheroids undergo adaptive metabolic reprogramming that contributes to disease progression and chemoresistance [10,11]. Our group has shown that compared to adherent cells, EOC spheroids exhibit a dormant phenotype driven by cellular quiescence, activated stress metabolism, and macroautophagy activation [12,13,14,15,16,17]. Importantly, these mechanisms of dormancy may contribute to the therapeutic challenges of treating spheroids, as chemotherapy is typically more effective against highly proliferative cells.
Macroautophagy (herein referred to as autophagy) is an evolutionarily conserved process that promotes cell survival under starvation-like conditions through the degradation and recycling of intracellular components [18]. Cancer cells often exploit autophagy to survive nutrient-deprived and hypoxic conditions, thus potentiating disease progression. We found that EOC spheroids potently activate autophagy, which in our system is modulated through calcium/calmodulin-dependent protein kinase kinase 2 (CAMKK2) – AMP-activated protein kinase (AMPK) activation and downregulation of protein kinase B (AKT) signaling [12,15]. Further, we have shown that autophagy activation is required to maintain EOC spheroid integrity and viability in suspension [16]. Beyond EOC, autophagy has been implicated as a key mechanism promoting tumour cell dormancy during metastasis and chemotherapy in various cancer types [18,19] prompting us to further investigate its role and therapeutic potential in EOC.
Autophagy activation is regulated by the autophagy initiation complex (AIC), which is comprised of FAK family-interacting protein of 200kDa (FIP200), autophagy-related protein 13 homolog (ATG13), autophagy-related protein 101 (ATG101), and unc-51-like autophagy activating kinase 1 (ULK1) or its homologue ULK2 [20]. Despite similarities between ULK1 and ULK2, studies have found that ULK1 is the dominant kinase regulating autophagy [20,21]. ULK1 is a serine-threonine kinase that acts as the enzymatic component of the AIC. Canonically, ULK1 is activated via AMPK phosphorylation under nutrient deprivation [22]. Conversely, ULK1 is inhibited by mechanistic target of rapamycin complex 1 (mTORC1) phosphorylation under nutrient-rich conditions. Our group has shown that HGSOC spheroids have increased ULK1 protein expression correlating with increased autophagy activation [16]. Given ULK1 is a crucial regulator of autophagy, we have investigated its therapeutic potential using MRT68921, a competitive ATP-binding site inhibitor shown to block ULK1 and ULK2 in vitro kinase activity in the low nanomolar range [23]. We have validated that MRT68921 reduces ULK1 kinase activity and autophagic flux in HGSOC spheroids and robustly decreases HGSOC spheroid viability [16]. These results indicate that ULK1 inhibition has promising therapeutic potential that warrants further investigation in the broader context of EOC histotypes while exploring potential combination with other anticancer agents.
The PI3K-AKT-mTOR pathway is crucial in regulating many cellular functions including cell growth, survival, and metabolism [24]. In both normal and cancer cells, this pathway is intimately linked to autophagy since ULK1 is negatively regulated through phosphorylation by mTORC1 leading to autophagy suppression [20]. In many cancers, including HGSOC and OCCC histotypes of EOC, mutations or amplifications in components of the PI3K-AKT-mTOR pathway result in constitutive AKT activation [24]. Several early-phase clinical trials have evaluated PI3K-AKT-mTOR pathway inhibitors in EOC; however, none have advanced to late-phase clinical trials [25].
Afatinib (BIBW2992) is a second-generation tyrosine kinase inhibitor (TKI) that acts to irreversibly inhibit the ErbB family including the epidermal growth factor receptor (EGFR) [26,27]. Notably, these receptors act upstream of the PI3K-AKT-mTOR pathway, and their inhibition inactivates the pathway while indirectly promoting autophagy by relieving mTORC1-mediated suppression of ULK1 [20,26,28,29]. Given the links between afatinib, the PI3K-AKT-mTOR pathway, and autophagy, studies have explored the combination of afatinib with autophagy inhibitors. In pancreatic ductal adenocarcinoma (PDAC), non-small cell lung cancer (NSCLC), and head and neck squamous cell carcinoma (HNSCC), it has been demonstrated that afatinib anti-cancer effects are enhanced when combined with autophagy inhibition [29,30,31,32]. However, little work has been done exploring TKIs and this phenomenon in EOC.
In this study, we demonstrate that MRT68921 successfully inhibits ULK1 and autophagy in multiple cell lines representing two aggressive EOC histotypes, HGSOC and OCCC, leading to reduced cell viability. Consistent with findings in other cancers, afatinib induced autophagy in these HGSOC and OCCC cell lines. We evaluated the effect of combining afatinib and MRT68921, identifying potential synergistic combinations through drug-dose combination matrices. Combination treatment impaired spheroid reattachment and viability, however these effects were primarily driven by ULK1 inhibition. These findings were corroborated in HGOSC patient ascites-derived organoids, where variability among samples offers preliminary insight into this treatment strategy in the context of interpatient tumour heterogeneity. Together, these results offer the potential of combining ULK1 and tyrosine kinase inhibition as a promising therapeutic approach in EOC.
2. Materials and Methods
Cell Culture
OVCAR8, HeyA8, mCherry-eGFP-LC3B OVCAR8, and mCherry-eGFP-LC3B HeyA8 cells were cultured in Roswell Park Memorial Institute medium (RPMI)-1640 (#350-700 CL, Wisent (Saint-Jean-Baptiste, QC, CA)) supplemented with 10% fetal bovine serum (FBS). iOvCa195, iOvCa198, iOvCa256, TOV-21G, ES2, OVCAR3, OVCAR4, COV318, COV362, 105C, and OV207 cells were cultured in Dulbecco’s modified Eagle medium (DMEM) /F12 (#11320033, Thermo Fisher Scientific, Waltham, MA, USA) supplemented with 10% FBS. iOvCa195, iOvCa198, and iOvCa256 ascites-derived cell lines were generated and established by Dr. Gabriel DiMattia using culture methods as previously described [34].OVCAR8 and HeyA8 cell lines were obtained from the American Type Culture Collection (ATCC); TOV-21G cell line was provided by Dr. Anne-Marie Mes-Masson (University of Montreal, Montreal, QC, Canada); ES2 cell line was provided by Dr. Barbara Vanderhyden (University of Ottawa, Ottawa, ON, Canada); the OVCAR3 and OVCAR4 cell lines were provided by Dr. James Koropatnick (Western University, London, ON, Canada); the COV318 and COV362 cell lines were provided by Dr. Zia Khan (Western University, London, ON, Canada); the 105C cell line was obtained from Dr. Hal Hirte (McMaster University, Hamilton, ON, Canada) and further characterized by us [34]. Cells in adherent culture were maintained on tissue culture-treated polystyrene (Sarstedt, Newton, NC, USA). Cells in spheroid culture were maintained in Ultra-Low Attachment (ULA; Corning, NY, USA) plates to allow spontaneous spheroid formation via aggregation. Cell lines were authenticated using short tandem repeat (STR) analysis performed at the Centre for Applied Genomics (TCGA; The Hospital for Sick Children, Toronto, ON, Canada) and confirmed negative for mycoplasma (ATCC, 30-1012K). All cells were maintained under standard conditions at 37°C with 5% CO2.
Antibodies and Reagents
Antibodies against p-Beclin1 Ser30 (#54101; 1:1000), Beclin1 (#3738; 1:1000), ULK1 (#8054; 1:1000), LC3 (#2775; 1:1000), SQSTM1/p62 (#5114; 1:1000), p-AKT Ser473 (#9271; 1:1000), AKT (#9272; 1:1000), p-mTOR Ser2448 (#2971; 1:1000), mTOR (#2983; 1:1000), p-p70S6K Thr389 (#9234; 1:1000), p70S6K (#2708; 1:1000), EGFR (#2232; 1:1000) and, cleaved PARP (#9541; 1:1000) were purchased from Cell Signalling Technology (Danvers, MA, USA). Antibodies against actin (A2066; 1:10000) and vinculin (V9264; 1:10000) were purchased from Millipore Sigma (Burlington, MA, USA). Horseradish peroxidase (HRP)-conjugated antibodies against rabbit IgG (NA934; 1:10000) and mouse IgG (NA931; 1:10000) were purchased from Cytiva (Malborough, MA, USA). All antibodies were diluted in tris-buffered saline-Tween 20 (TBST) containing 5% bovine serum albumin (BSA). alamarBlue cell viability reagent (DAL1025; 1:100) and Trypan Blue Solution (15250061) were purchased from Thermo Fisher Scientific (Waltham, MA, USA). MRT68921 (5mM in DMSO) was purchased from Selleckchem (#S7949, Houston, TX, USA) and stored at -20°C. Afatinib (5mM in DMSO) was purchased from Tocris (#6812, Bristol, UK) and stored at -20°C. Paclitaxel (5mM in DMSO) was purchased from Cayman Chemical Company (#10461, Ann Arbor, MI, USA) and stored at -20°C. Carboplatin (27mM in saline) was received from the Verspeeten Family Cancer Centre (London, ON, Canada) and stored at 4°C.
Generation of mCherry-eGFP-LC3B Cell Lines
Lipofectamine (#18324012, Thermo Fisher Scientific, Waltham, MA, USA)-mediated transfection was performed on OVCAR8 and HeyA8 cell lines, enabling transfection of the mCherry-eGFP-LC3B reporter (autoR) plasmid (#22418, Addgene, Watertown, MA, USA). To select cells with successful plasmid integration, cells were grown in complete medium containing G-418 (#10131035, Thermo Fisher Scientific, Waltham, MA, USA) for two weeks. Following selection, cells were grown in complete medium without G-418 for an additional four weeks. Double-positive cells (GFP+/ mCherry+) were sorted using fluorescence-activated cell sorting (FACS) at the Robarts Research Institute, Western University (London, ON, Canada).
Fluorescent Image Analysis
Time course fluorescence images of OVCAR8-autoR and HeyA8-autoR spheroids (mCherry and eGFP channels) were captured using an IncuCyte S3 live cell analysis instrument using exposure times of 400 ms and 300 ms, respectively. Analyses of mCherry/EGFP fluorescence ratio were then conducted using a modified version of Spatial Profiling of Ratiometric Trends in Spheroids (SPoRTS), the automated ratiometric image analysis platform we published recently [35]. Briefly, this version of SPoRTS maintains the same frameworks for image processing, thresholding, and data aggregation as the original, but the spatial component has been removed. Modified SPoRTS was used to calculate mCherry/eGFP ratios based on total spheroid fluorescence from the respective channels (i.e., total mCherry fluorescence divided by total eGFP fluorescence). The modified version of SPoRTS used in this study is available alongside the original at https://github.com/mjborrelli/SPoRTS.
Preparation of Whole-Cell Protein Lysates
Adherent cells were seeded at a density of 700,000 cells per 60 mm dish, while spheroids were seeded at a density of 500,000 cells per well in a 6-well ULA dish. To collect adherent cell lysates, the medium was aspirated, and cells were washed with 5 mL of cold phosphate-buffered saline (PBS) before being scraped into 100 μL of modified radioimmunoprecipitation assay (RIPA) buffer [50 mM HEPES (pH 7.4), 150 mM NaCl, 10% glycerol, 1.5 mM MgCl2, 1 mM EGTA, 1% Triton X-100, 0.1% sodium dodecyl sulfate (SDS), 1% sodium deoxycholate, 10 mM sodium pyrophosphate, 10 mM sodium fluoride, 1 mM sodium orthovanadate, 1× SIGMAFAST protease inhibitor cocktail (#S8820; Sigma), 10 mM β-glycerophosphate, and 1 mM phenylmethylsulfonyl fluoride (PMSF)]. Spheroids were collected by transferring the cell suspension from the wells of the 6-well ULA plate to a conical tube kept on ice. The tubes were centrifuged at 600 × g for 5 minutes at 4°C, the medium was aspirated, and cell pellets were washed with 10 mL of ice-cold PBS. The centrifugation and aspiration steps were repeated, and the final cell pellets were resuspended in 100 μL of modified RIPA buffer. All cell lysates were subjected to one freeze-thaw cycle and then clarified by centrifugation at 21,100 × g for 20 minutes at 4°C. Protein concentrations in the supernatants were determined using the Bradford Protein Assay Dye Reagent (#5000006, Bio-Rad, Hercules, CA, USA).
Immunoblot Analysis
Immunoblotting was performed using the Bio-Rad Mini-PROTEAN II Electrophoresis System following the manufacturer’s instructions. Protein samples (30 μg) were loaded onto 8% or 12% SDS-polyacrylamide gels and subjected to electrophoresis. Proteins were subsequently transferred to polyvinylidene fluoride (PVDF) membranes (Thermo Fisher Scientific, 88518, Waltham, MA, USA). Membrane blocking and washing steps were carried out in TBST containing either 5% BSA or 5% skim milk, depending on the antibody requirements. Membranes were incubated with primary antibodies overnight at 4°C. Secondary antibodies, diluted in 5% BSA, were applied for 1 hour at room temperature. Enhanced chemiluminescence detection was performed using the Luminata Forte HRP substrate (#WBLUF0100, Millipore Sigma, Burlington, MA, USA), and the resulting chemiluminescence was captured using the Bio-Rad ChemiDoc system. Densitometry analysis was conducted with Bio-Rad Image Lab software version 6.0.1.
alamarBlue Viability Assay and IC50 Curve Generation
Cells were seeded in 96-well dishes at a density of 2,000 cells/ 100 μL in each well. Adherent cells were treated 24 hours after seeding, early spheroids were treated at the time of seeding and late spheroids were treated 72 hours after seeding. Under all conditions, cells were treated with 12 concentrations of MRT68921 ranging from 0.01 – 100 μM. After 72 hours of treatment, 100 μL of diluted alamarBlue reagent (1:10 in media) was added to each well. Absorbance was measured at 570 and 600 nm using the BioTek Synergy H1 plate reader (Agilent Technologies) after 4 hours of incubation with alamarBlue reagent for adherent culture and after 24 hours for spheroid culture. To determine the half-maximal inhibitory concentration (IC50) value of MRT68921 in HGSOC and OCCC cell lines, the alamarBlue absorbance reading of each concentration was normalized to the reading of DMSO control, represented by 100% viability. The normalized data was analyzed in GraphPad Prism 9.5.1 using the non-linear regression (curve fit) analysis tool.
Synergy Finder Analysis
Cells were seeded at a density of 2,000 cells/ 100 μL in each well of 96-well dishes. Both adherent and spheroid cells were treated 24 hours after seeding with 96 combinations of either MRT68921 and carboplatin or MRT68921 and afatinib. After 72 hours of treatment, cells were incubated with 100 μL of diluted alamarBlue reagent (1:10 in media). The same protocol was followed as above to generate IC50 curves. Normalized data was organized into table format as outlined by the Synergy Finder User Manual (available at https://synergyfinder.fimm.fi/synergy/synfin_docs/). The table was uploaded to the Synergy Finder website for analysis using the Bliss Synergy Score (BSS) model [36].
Trypan Blue Exclusion Cell Counting
Spheroids were seeded into 24-well ULA plates at a density of 25,000 cells/ mL (OVCAR8, HeyA8, and ES2) or 50,000 cells/ mL (TOV-21G). After 24 hours, spheroids were treated with either DMSO, 0.25 μM MRT68921, 4 μM MRT68921, 0.125 μM afatinib, 0.25 μM MRT68921 + 0.125 μM afatinib, or 4 μM MRT68921 + 0.125 μM afatinib. After 72 hours of treatment, spheroids were collected into microcentrifuge tubes and pelleted by centrifugation (500xg for 6 min). The medium was aspirated, and the pellet was washed in 500 μL of PBS before being pelleted by centrifugation. PBS was aspirated and pellets were incubated at 37ºC for 30 min in 50 μL of Trypsin/EDTA. Before counting, 50 μL of FBS was added to stop trypsin-mediated digestion. Subsequently, 50 μL of Trypan Blue dye was added and gently mixed by pipetting. Cell counting was performed using a TC10 Automated Cell Counter (Bio-Rad, Hercules, CA, USA).
Spheroids Reattachment Assay
Cells were seeded in 24-well ULA plates at a density of 25,000 cells in 1 mL per well (OVCAR8 and HeyA8) or 50,000 cells in 1 mL per well (TOV-21G and ES2). After 24 hours, cells were treated for 72 hours with either DMSO, 4 μM MRT68921, 0.125 μM afatinib, or 4 μM MRT68921 + 0.125 μM afatinib. Spheroids were then transferred to 24-well tissue culture-treated polystyrene plates to allow attachment. Once spheroids had visibly adhered to the dish they were then fixed and stained with Hema3 (# 23-123869, ThermoFisher Scientific, Waltham, MA, USA).
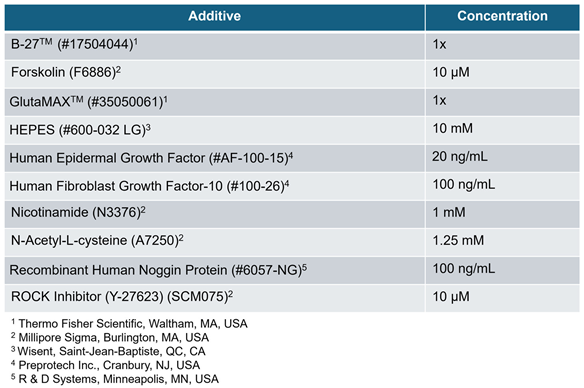
Organoid Culture
HGSC patient-derived iOvCa cell lines were seeded at a density of 5,000 cells/well and resuspended in 10 mL of Cultrex Basement Membrane Extract (BME) PathClear Type 2 (#3532-010-02, R&D Systems, Minneapolis, MN, USA) as droplets on 96-well tissue culture-treated polystyrene plates. The droplets were overlaid with Advanced DMEM/F-12 (#12634010, Thermo Fisher Scientific, Waltham, MA, USA) supplemented with additional media components as outlined in Table 1. Organoids were treated 72 hours after seeding with either DMSO, 0.25 μM MRT68921, 4 μM MRT68921, 0.125 μM afatinib, 0.25 μM MRT68921 + 0.125 μM afatinib, or 4 μM MRT68921 + 0.125 μM afatinib. After 72 hours of treatment, organoids were incubated with 100 μL of diluted alamarBlue reagent (1:10 in media). Absorbance was measured at 570 and 600 nm using the BioTek Synergy H1 plate reader (Agilent Technologies) after 24 hours.
Microscopy
Phase contrast images of early and late spheroids treated with MRT68921 and fluorescent images of OVCAR8- and HeyA8 autoR spheroids treated with MRT68921 were captured using the Incuctye S3 Live-Cell Analysis System (Sartorius, Götten, Germany). The fluorescent images were captured at acquisition times of 300 ms and 400 ms for the green and red channels, respectively. Images of Hema3 stained reattached spheroids were captured using the Axio Zoom V16 microscope (Zeiss, Oberkochen, Germany).
Statistical Analysis
Statistical analyses were performed using GraphPad Prism 9.0.1 (GraphPad Software). Statistical tests performed include one-way and two-way ANOVA followed by Tukey’s multiple comparisons test and unpaired t-tests. Specific analysis details for each experiment are described in the respective figure legends.
3. Results
3.1. MRT68921 Inhibits ULK1 Activity in EOC Cell Lines
To date, our group remains the first and only to investigate MRT68921 in the context of EOC [16]. Previously, we demonstrated that MRT68921 inhibits ULK1 kinase activity in HGSOC spheroids but not in FT190 EOC precursor spheroids. Here, we sought to determine whether MRT68921 similarly suppresses ULK1 kinase activity in OCCC and additional HGSOC cell lines. Given that ULK1 expression and autophagy activation are upregulated in EOC spheroids compared to adherent culture, we also investigated whether MRT68921 differentially affects ULK1 activity between adherent and spheroid cultures [12,15,16].
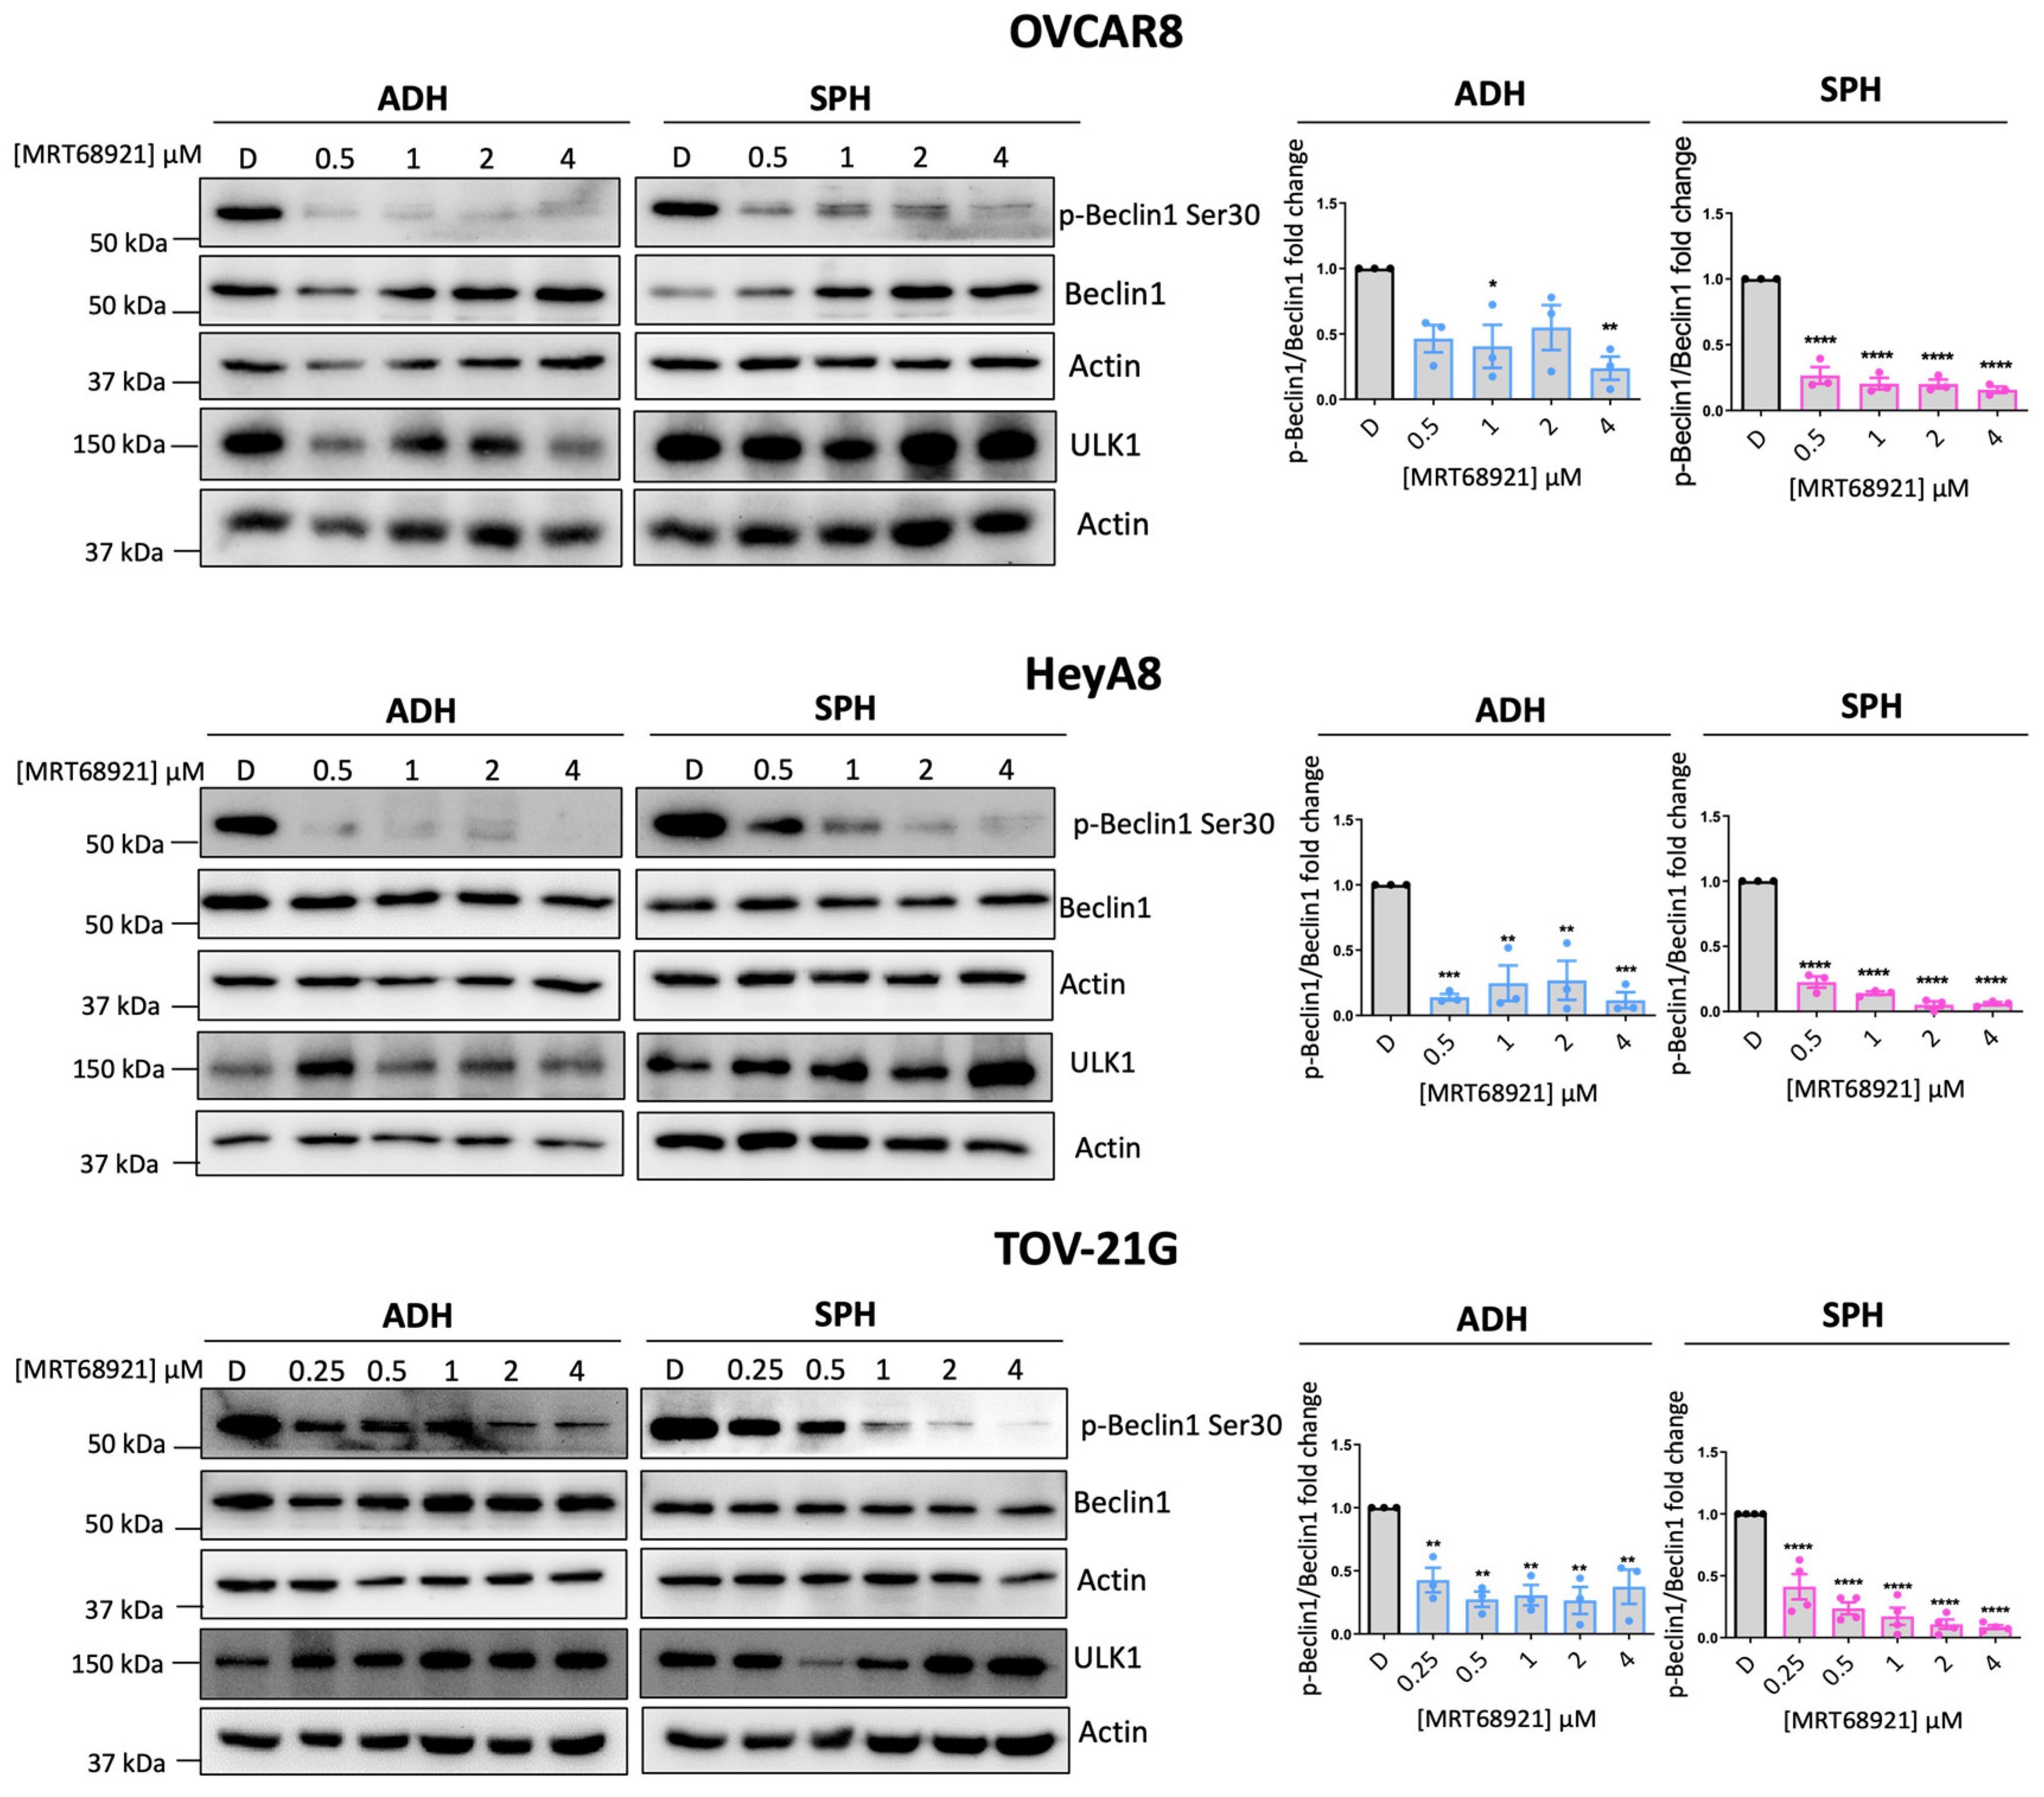
To this end, we treated EOC cell lines representing HGSOC (OVCAR8), OCCC (TOV-21G), and the poorly differentiated HeyA8 line under adherent and spheroid conditions with MRT68921. ULK1 kinase activity was assessed by measuring Beclin-1 phosphorylation at Ser30 (p-Beclin1) [37,38,39] via western blotting (Figure 1).
In OVCAR8 spheroids, MRT68921 markedly reduced p-Beclin1 levels across all tested concentrations. However, under adherent conditions, a significant reduction in p-Beclin1 was observed only at 1 µM and 4 µM. In contrast, both HeyA8 and TOV-21G cells exhibited a consistent reduction in p-Beclin1 at all concentrations under both adherent and spheroid conditions. These findings confirm that MRT68921 effectively inhibits ULK1 activity at low micromolar concentrations across EOC histotypes, independent of culture conditions. We also confirmed that a single dose of 1 μM MRT68921 maintains ULK1 inhibition over a 96-hour treatment period (Supplementary Figure S1).
Figure 1.
MRT68921 inhibits ULK1 activity in EOC cell lines. Representative immunoblots and corresponding densitometric analyses of OVCAR8 (n = 3), HeyA8 (n = 3), and TOV-21G (n = 4) cells treated with the indicated concentrations of MRT68921 under adherent (ADH) and spheroid (SPH) culture conditions. Cells were seeded 24 hours prior to treatment and harvested after 24 hours of drug exposure. Densitometric values are presented as mean fold-change relative to DMSO-treated controls (D) ± SEM. Statistical analysis was performed using one-way ANOVA followed by Tukey’s post hoc test (*p < 0.05, **p < 0.01, ***p < 0.001, ****p < 0.0001).
3.2. Variable Potency of MRT68921 on Autophagy Inhibition in EOC Spheroids
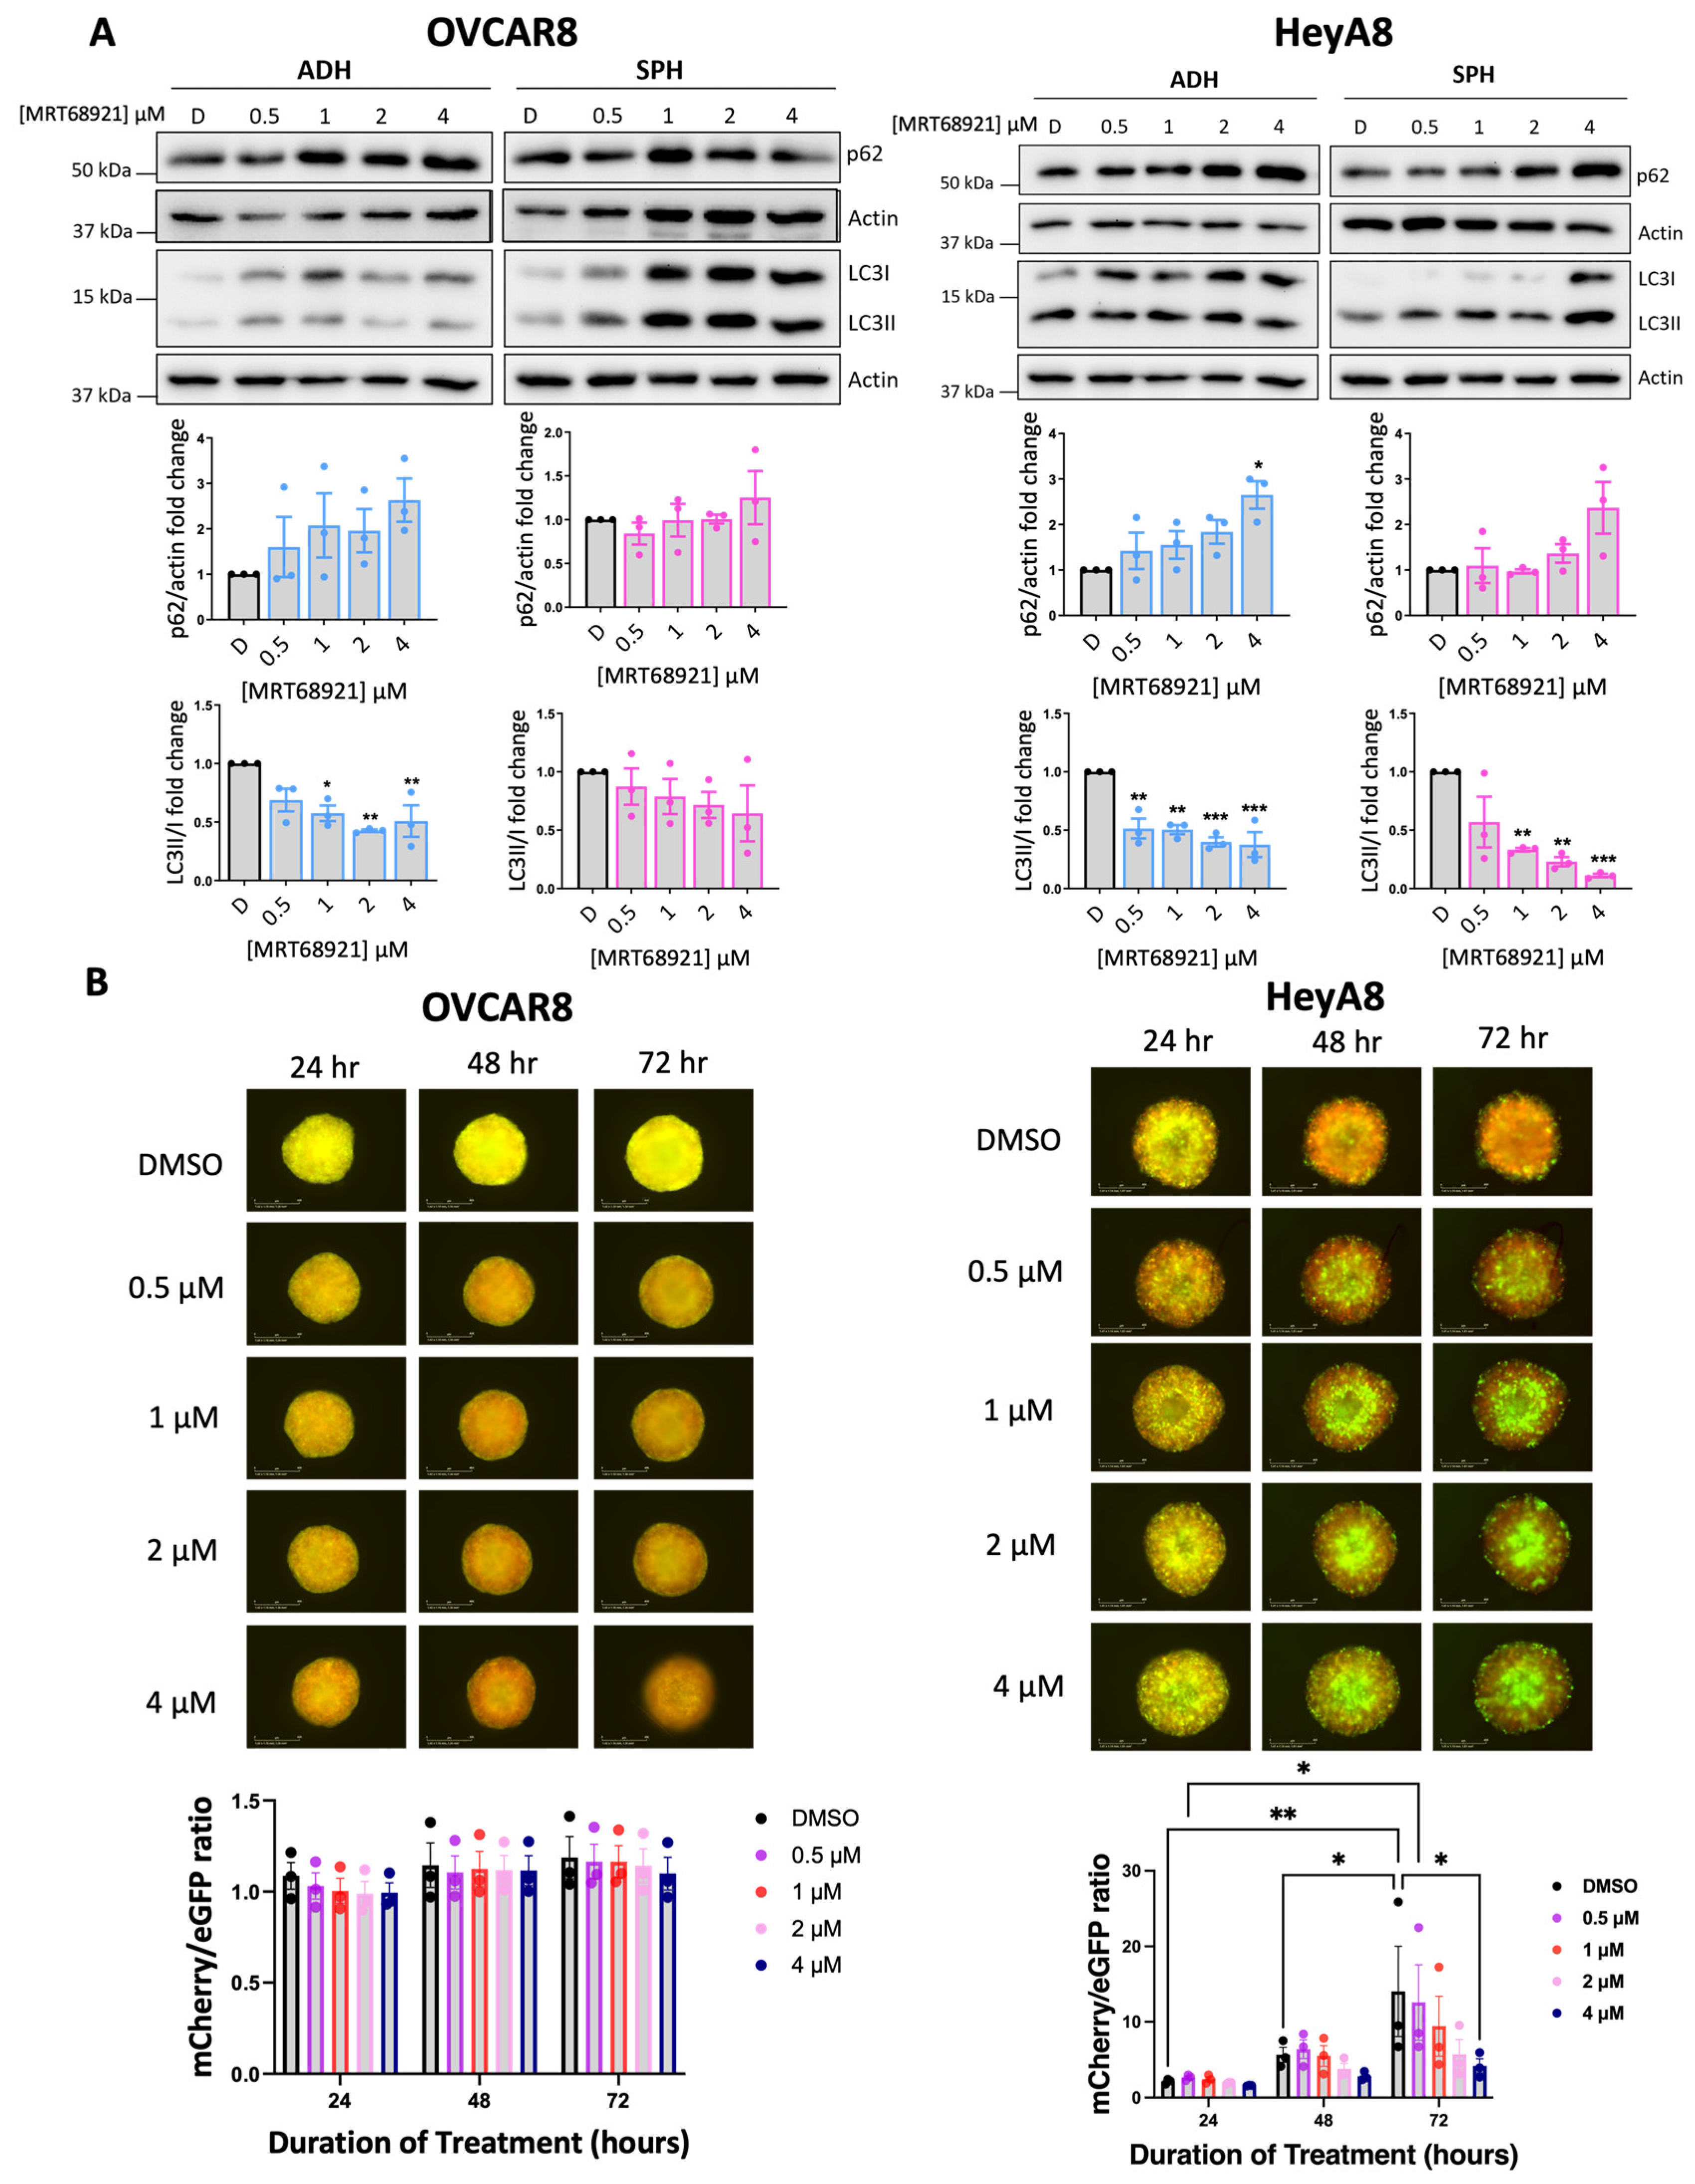
Given ULK1’s canonical role as a key regulator of autophagy, we evaluated the impact of ULK1 inhibition via MRT68921 on autophagic activity. To this end, we assessed microtubule-associated protein 1 light chain 3 (LC3) processing (LC3II/I ratio) and sequestosome 1 (p62) expression as established markers of autophagy [40,41] via immunoblotting (Figure 2A). In HeyA8 cells, MRT68921 treatment reduced the LC3II/I ratio under both adherent and spheroid conditions. Similarly, in OVCAR8 adherent cells, MRT68921 treatment decreased the LC3II/I ratio; however, in OVCAR8 spheroids, no reduction in LC3II/I ratio was observed. In support of autophagy suppression, p62 levels increased in HeyA8 adherent cells treated with 4 µM MRT68921. Notably, p62 expression remained unchanged in OVCAR8 cells, further highlighting cell line–specific differences in the autophagic response to ULK1 inhibition via MRT68921.
To further explore the dose-dependent and temporal effects of MRT68921 on autophagic flux in live spheroids, we utilized OVCAR8 and HeyA8 cell lines transfected with the mCherry-eGFP-LC3B reporter (autoR; Figure 2B). This reporter exploits the differential stability of mCherry and eGFP fluorescent proteins in the lysosome, where mCherry remains stable while eGFP is degraded, allowing for quantification of mCherry/eGFP fluorescence ratios as an indication of autophagic flux [41,42]. Consistent with the lack of LC3II/I and p62 changes in MRT68921-treated OVCAR8-autoR spheroids, the mCherry/eGFP ratio remained unchanged over 72 hours of MRT68921 treatment at all tested concentrations. However, in HeyA8-autoR spheroids, treatment with 4 µM MRT68921 resulted in a significant reduction in autophagic flux by 72 hours. As expected, DMSO-treated control spheroids exhibited a progressive increase in autophagic flux at 48 and 72 hours. These results support a dose-dependent suppression of autophagy by MRT68921 in this model, yet its effects may vary by cell line, culture conditions, and drug concentration.
Figure 2.
MRT68921 impairs autophagy in EOC cell lines. A) Representative immunoblots and corresponding densitometric analyses of autophagy markers in OVCAR8 and HeyA8 cells (n = 3) treated with the indicated concentrations of MRT68921 under adherent (ADH) and spheroid (SPH) culture conditions. Cells were seeded 24 hours prior to 24-hour drug treatment. Densitometric values are expressed as mean fold change relative to DMSO-treated control (D) ± SEM. Statistical significance was assessed using one-way ANOVA with Tukey’s post hoc test (*p < 0.05, **p < 0.01, ***p < 0.001). B) Representative fluorescence images of OVCAR8-autoR and HeyA8-autoR spheroids treated with MRT68921 at the indicated concentrations. Spheroids were treated 24 hours post-seeding, and images were acquired at the indicated time points; time stamp reflects the duration of drug exposure. Autophagic flux was quantified based on the mCherry/eGFP fluorescence ratio and is presented as mean ± SEM (n = 3); statistical analysis was performed using two-way ANOVA followed by Tukey’s multiple comparisons test (*p < 0.05, **p < 0.01). Scale bars represent 400 μm.
3.3. EOC Spheroids Exhibit Reduced Sensitivity to MRT68921 Relative to Adherent Cells
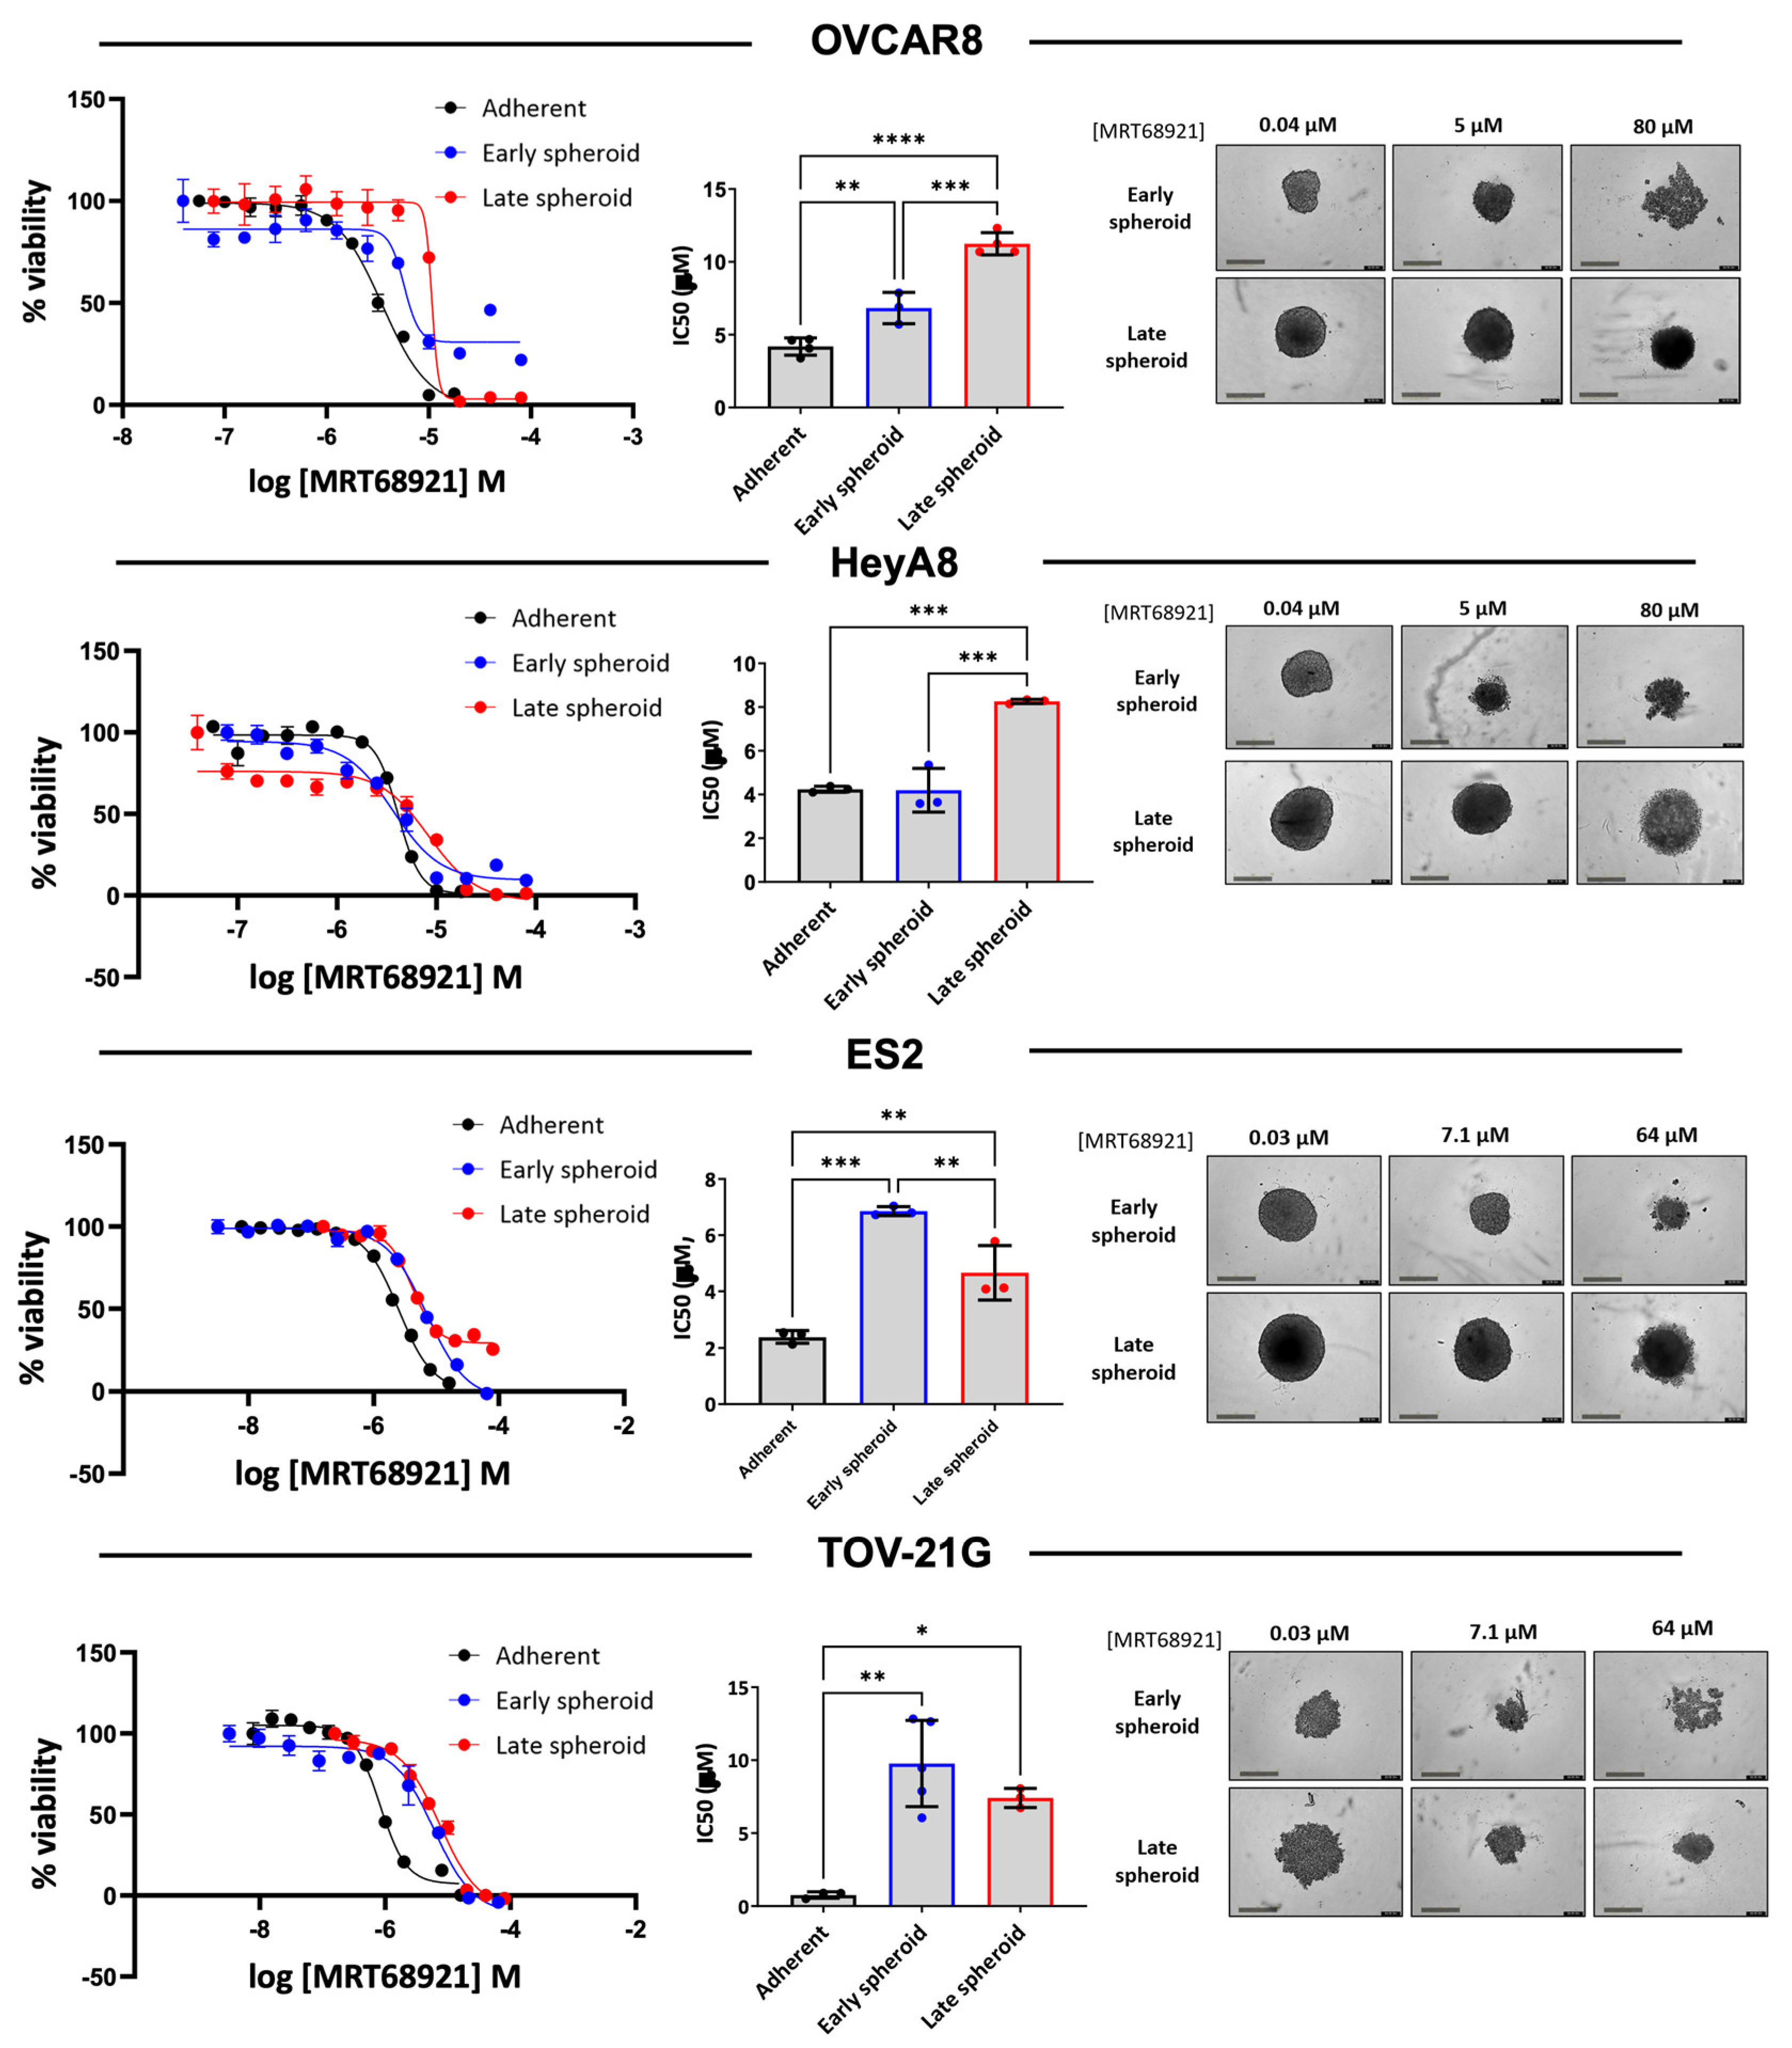
Since we observed differences in autophagy modulation among EOC cell lines in response to MRT68921, we expanded the number of cell lines representing HGSOC and OCCC histotypes and determined sensitivity on cell viability by generating dose-response curves and calculating IC50 values (Supplementary Table S1). Among the ten cell lines assessed in adherent culture, IC50 values ranged from 0.760 to 4.242 µM, with most cell lines exhibiting sensitivities within a narrow range. Notably, TOV-21G and 105C, two OCCC cell lines, displayed the greatest sensitivity to MRT68921, with IC50 values of 0.760 µM and 1.285 µM, respectively.
Given that EOC spheroids activate autophagy to promote cell survival in an ULK1-dependent manner [14,16], we next assessed the impact of MRT68921 on spheroid viability, comparing sensitivity during early spheroid formation and in established spheroids. Dose-response curves were generated for spheroids treated at the time of seeding (early spheroids) and spheroids treated 72 hours post-seeding (late spheroids) as compared with adherent culture (Figure 3).
In OVCAR8, ES2, and TOV-21G cell lines, adherent IC50 values were significantly lower than those observed for early or late spheroids, indicating reduced sensitivity in spheroid culture conditions. Among OCCC cell lines, ES2 and TOV-21G spheroids were less sensitive to MRT68921 in the early stages of spheroid formation but exhibited increased sensitivity as late spheroids. In contrast, OVCAR8 spheroids displayed the opposite trend, with early spheroids exhibiting greater MRT68921 sensitivity than late spheroids. HeyA8 spheroids exhibited comparable IC50 values between adherent and early spheroid conditions, however late spheroids displayed reduced sensitivity to MRT68921.
Figure 3.
EOC cell lines are more sensitive to MRT68921 under adherent conditions compared to spheroids. Representative dose–response curves for MRT68921 OVCAR8 (n=3), HeyA8 (n=3), and TOV-21G (n=4) cell lines cultured under adherent (black), early spheroid (blue), and late spheroid (red) conditions. Adherent cells were treated 24 hours post-seeding. Early spheroids were treated at the time of seeding, whereas late spheroids were treated 72 hours after seeding. In all conditions, treatment was maintained for 72 hours, followed by alamarBlue viability assays. Absorbance readings were used as an indirect measure of cell viability and normalized to DMSO-treated controls to calculate percent viability. Bar graphs display mean IC50 values ± SEM for each cell line across culture conditions; statistical significance was determined using one-way ANOVA followed by Tukey’s multiple comparisons test (*p < 0.05, **p < 0.01, ***p < 0.001, ****p < 0.0001). Representative phase-contrast images are shown for spheroids treated with low, medium, and high concentrations of MRT68921. Scale bar = 400 μm.
3.4. Afatinib Induces Autophagy in EOC Cell Lines
To further enhance the sensitivity of EOC spheroids to MRT68921 given its potential limited efficacy as a single agent, we explored rational combination strategies. Our previous work demonstrated that AKT inhibition (Akti-1/2) synergizes with autophagy inhibitors (chloroquine and Spautin-1) [33]. Building on these findings, we hypothesized that afatinib, a TKI that acts upstream of the PI3K-AKT-mTOR pathway, could be a promising candidate. Inhibition of this pathway has been shown to relieve mTOR-mediated repression of ULK1, thereby promoting autophagy initiation [24,28,43]. Furthermore, afatinib has been reported to induce autophagy as a pro-survival mechanism in various cancer models, often contributing to resistance against TKIs [31,32,44]. Accordingly, we sought to explore afatinib in EOC, given that its role in this context remains poorly understood.
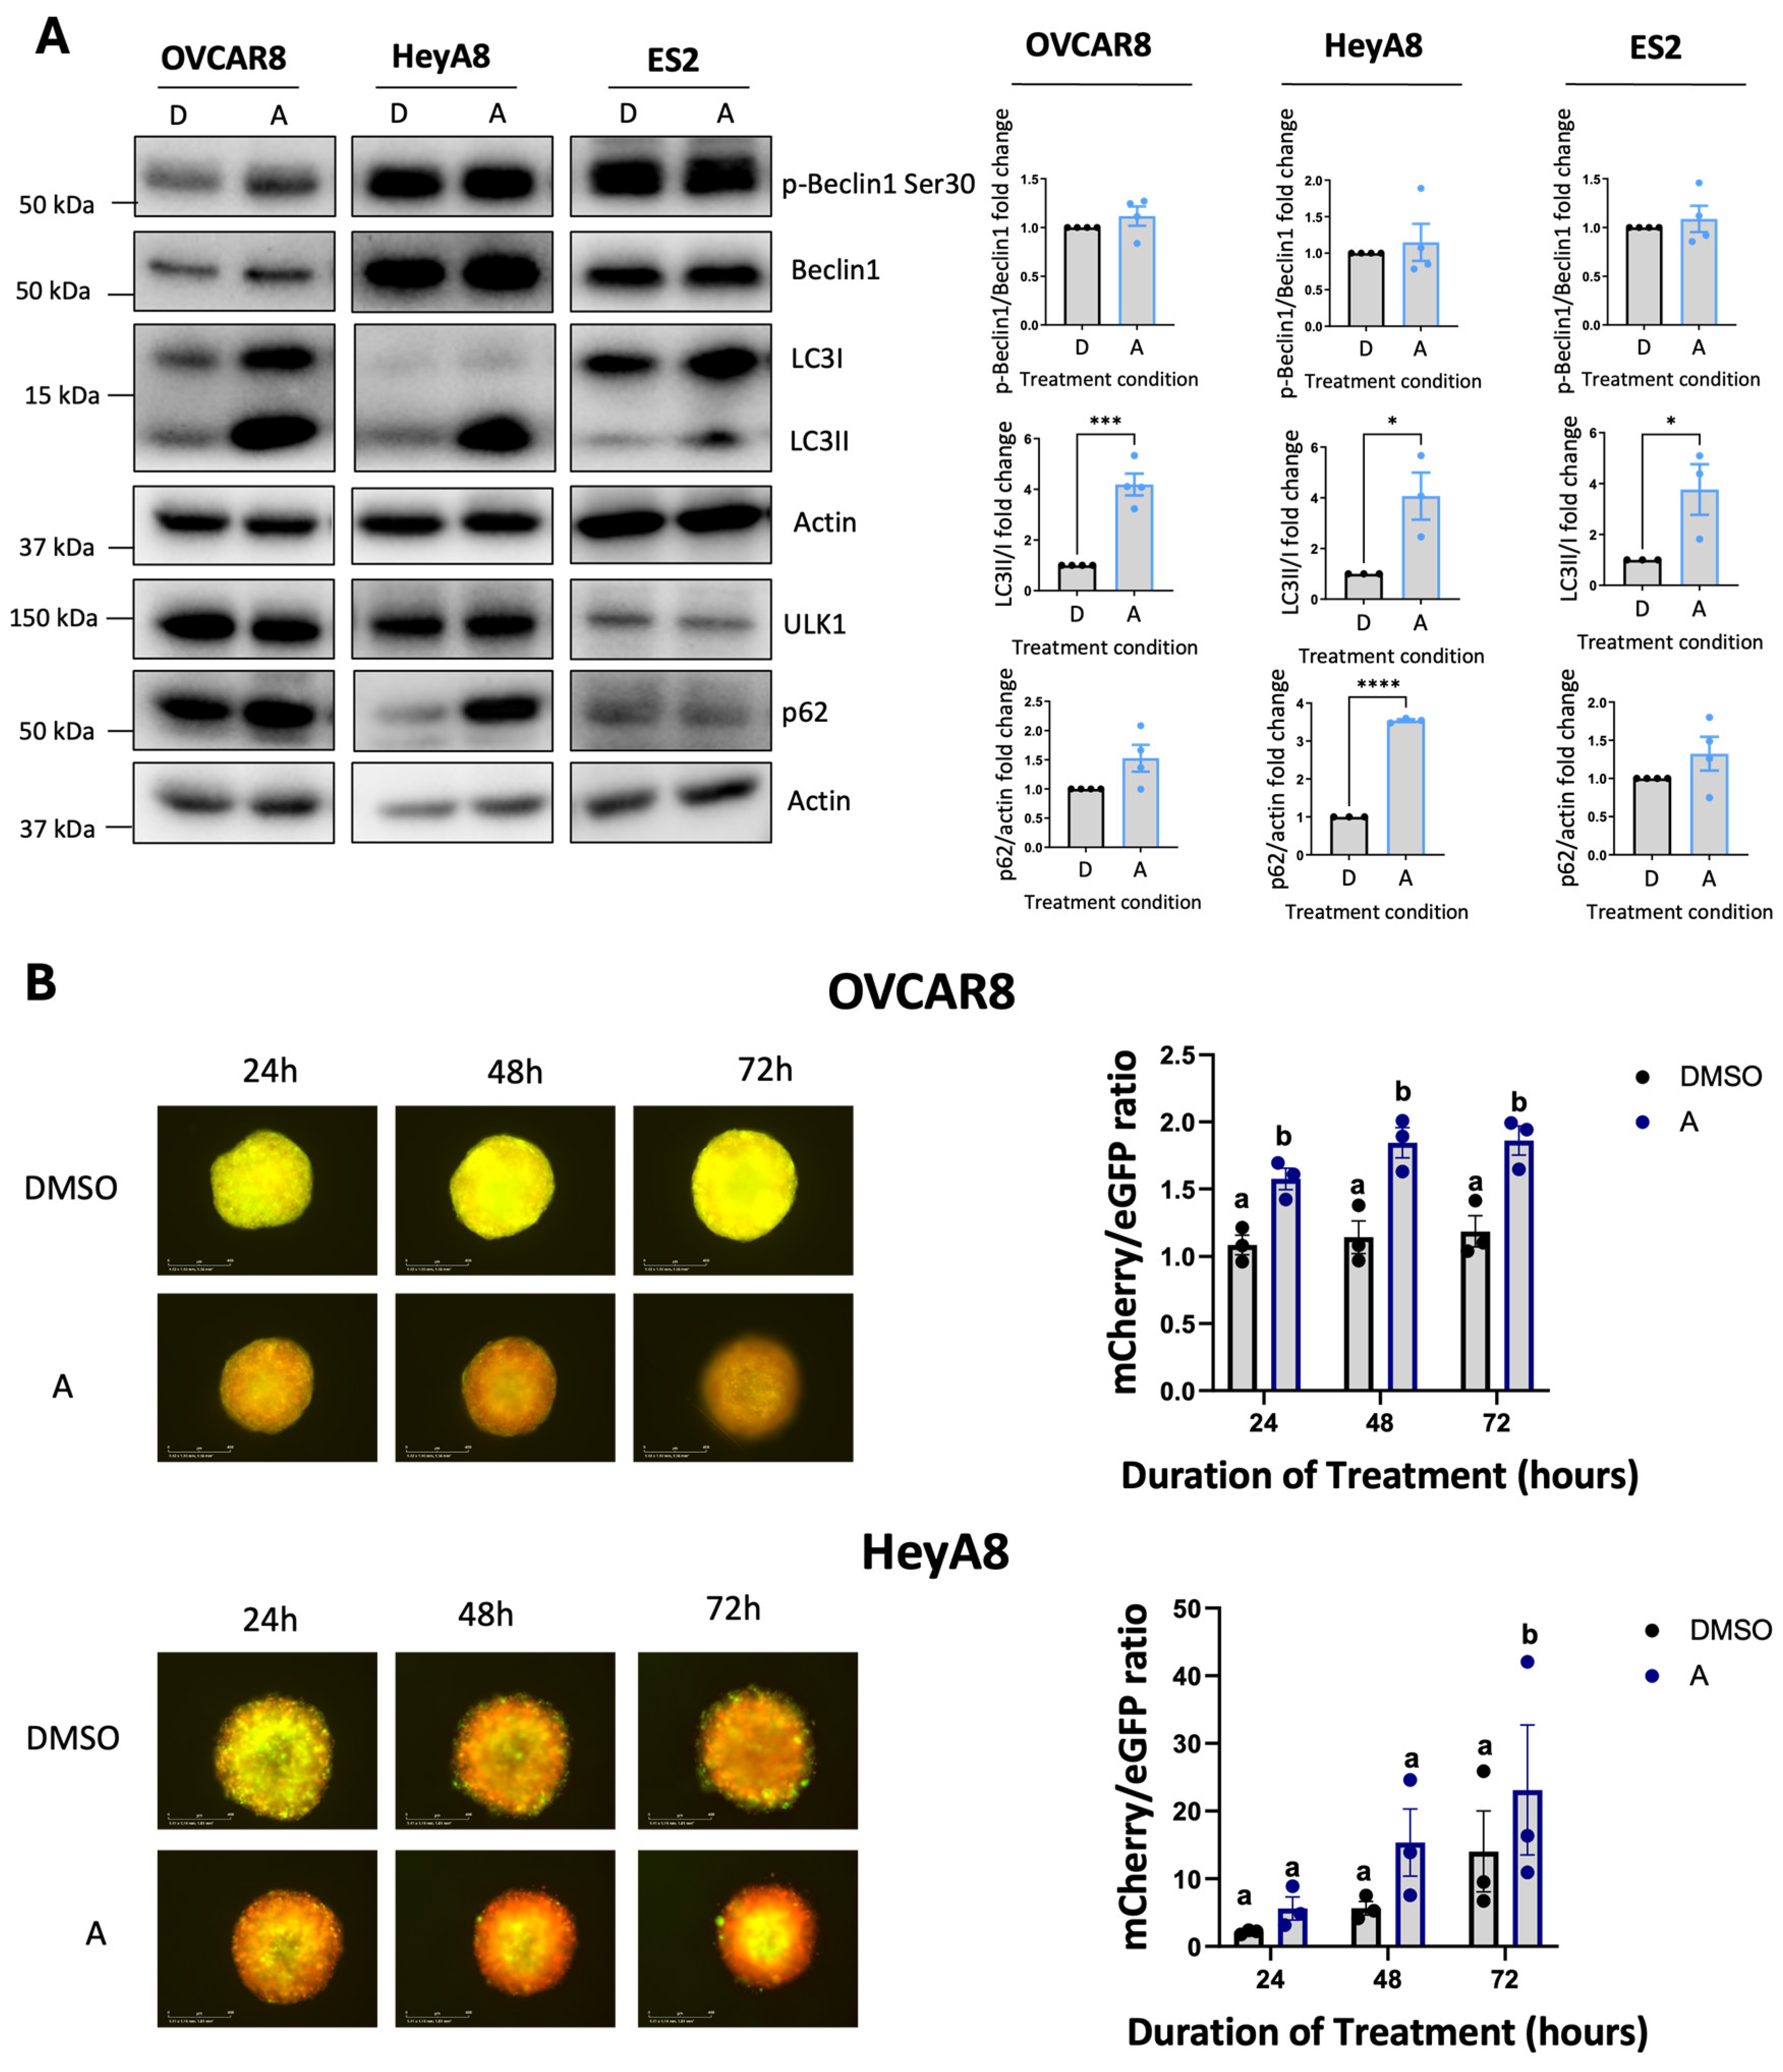
Firstly, we confirmed that afatinib modulates PI3K-AKT-mTOR signaling in EOC cell lines via immunoblotting (Supplemental Figure S2). To investigate whether this modulation resulted in autophagy induction in EOC cell lines, we performed immunoblotting on lysates collected from adherent cells treated with 4 μM afatinib (Figure 4A). Across all cell lines examined, afatinib treatment resulted in a robust increase in the LC3II/I ratio, a hallmark of autophagosome formation, despite no significant changes in the ULK1 substrate p-Beclin1 Ser30.
To assess whether afatinib treatment enhances autophagic flux, we quantified fluorescence of OVCAR8- and HeyA8-autoR spheroids treated with afatinib (Figure 4B). In OVCAR8-autoR spheroids, 4 μM of afatinib significantly increased autophagic flux at all time points, whereas HeyA8-autoR spheroids displayed increased autophagic flux after 72 hours of treatment.
Figure 4.
Afatinib induces autophagy in EOC cell lines. A) Representative immunoblots and densitometric analyses of HeyA8, OVCAR8, and ES2 cells treated with 4 μM afatinib for 24 hours under adherent culture conditions. Cells were seeded and allowed to adhere for 24 hours prior to treatment. Densitometric values are presented as mean fold change relative to DMSO-treated controls ± SEM (n = 4). Statistical significance was assessed using unpaired t-tests (*p < 0.05, **p < 0.01, ***p < 0.001, ****p < 0.0001). B) Representative fluorescence images of OVCAR8- and HeyA8-autoR spheroids treated with 4 μM afatinib, starting 24 hours post-seeding. Timepoints indicate the duration of treatment. Autophagic flux was assessed using the mCherry/eGFP ratio and is presented as mean ± SEM (n = 3); statistical analysis performed by one-way ANOVA with Tukey’s multiple comparisons test (p ≤ 0.05). Scale bars represent 400 μm.
3.5. Potential Synergy Between MRT68921 and Afatinib in Reducing EOC Cell Viability
Previous studies have demonstrated that autophagy suppression enhances afatinib-induced cytotoxicity across multiple cancer models [29,31,32,44]. Based on these findings and our results showing that afatinib induces autophagy in EOC cell lines, we hypothesized that ULK1 and autophagy inhibition via MRT68921 may similarly enhance afatinib efficacy in EOC cell lines.
To test this, we performed drug combination matrix assays, evaluating 96 unique concentration combinations of MRT68921 and afatinib in OVCAR8 and HeyA8 cells under both adherent and spheroid conditions. Using Synergy Finder, we calculated the BSS for each unique combination based on multi-dose and multi-drug combination response data [36,45].
When averaged across all 96 drug combinations, BSS for both cell lines and culture conditions were within the additive range (i.e., -10 < BSS < 10; Figure 5). However, distinct regions of synergy were observed within the heat maps, particularly at medium to high concentrations of MRT68921 combined with low concentrations of afatinib. Within these regions, individual combination synergy scores ≥20 were identified, corresponding to a ≥20% response beyond what is mathematically expected [36,45].
3.6. Combined MRT68921 and Afatinib Treatment Affects ULK1 Activity and Autophagy
Based on the Synergy Finder analysis, we pursued specific drug combinations that implied potential synergy for further molecular analysis. We selected 4 μM MRT68921 + 0.125 μM afatinib alongside 0.25 μM MRT68921 + 0.125 μM afatinib. Since 4 μM and 0.25 μM of MRT68921 had similar effects on reducing p-Beclin1 expression (Figure 1, Supplemental Figure S3), we directly compared these low and high doses of MRT68921 when combined with afatinib.
Given that afatinib and MRT68921 exert opposing effects on autophagy, we first examined the molecular consequences of their combination in OVCAR8 and HeyA8 spheroids using immunoblotting (Figure 6A). In OVCAR8 spheroids, treatment with 0.125 μM afatinib alone maintained p-Beclin1 Ser30 levels comparable to the DMSO control. However, these levels were reduced when afatinib was combined with 4 μM MRT68921. As expected, MRT68921 alone at both tested concentrations decreased p-Beclin1 expression. Despite these effects on this ULK1-specific substrate, autophagy markers LC3-II/I and p62 remained largely unchanged across all conditions. In contrast, HeyA8 spheroids showed a reduction in p-Beclin1 following treatment with 4 μM MRT68921, either alone or in combination with afatinib. Interestingly, afatinib alone increased the LC3-II/I ratio in HeyA8 spheroids, but this effect was abolished when co-treated with MRT68921 at either concentration.
We next evaluated autophagic flux using OVCAR8- and HeyA8-autoR cell lines (Figure 6B). In OVCAR8-autoR spheroids, neither combination significantly altered autophagic flux, consistent with the lack of changes observed in LC3II/I and p62 expression (Figure 6A). However, in HeyA8 spheroids, 0.125 μM afatinib induced autophagic flux when combined with 0.25 μM MRT68921, as indicated by an increased red-to-green fluorescence ratio at 72 hours. Notably, this effect was abolished when MRT68921 was increased to 4 μM, suggesting that higher concentrations of MRT68921 suppress afatinib-induced autophagy.
3.7. MRT68921 and Afatinib Combination Treatment Impairs Spheroid Viability and Reattachment
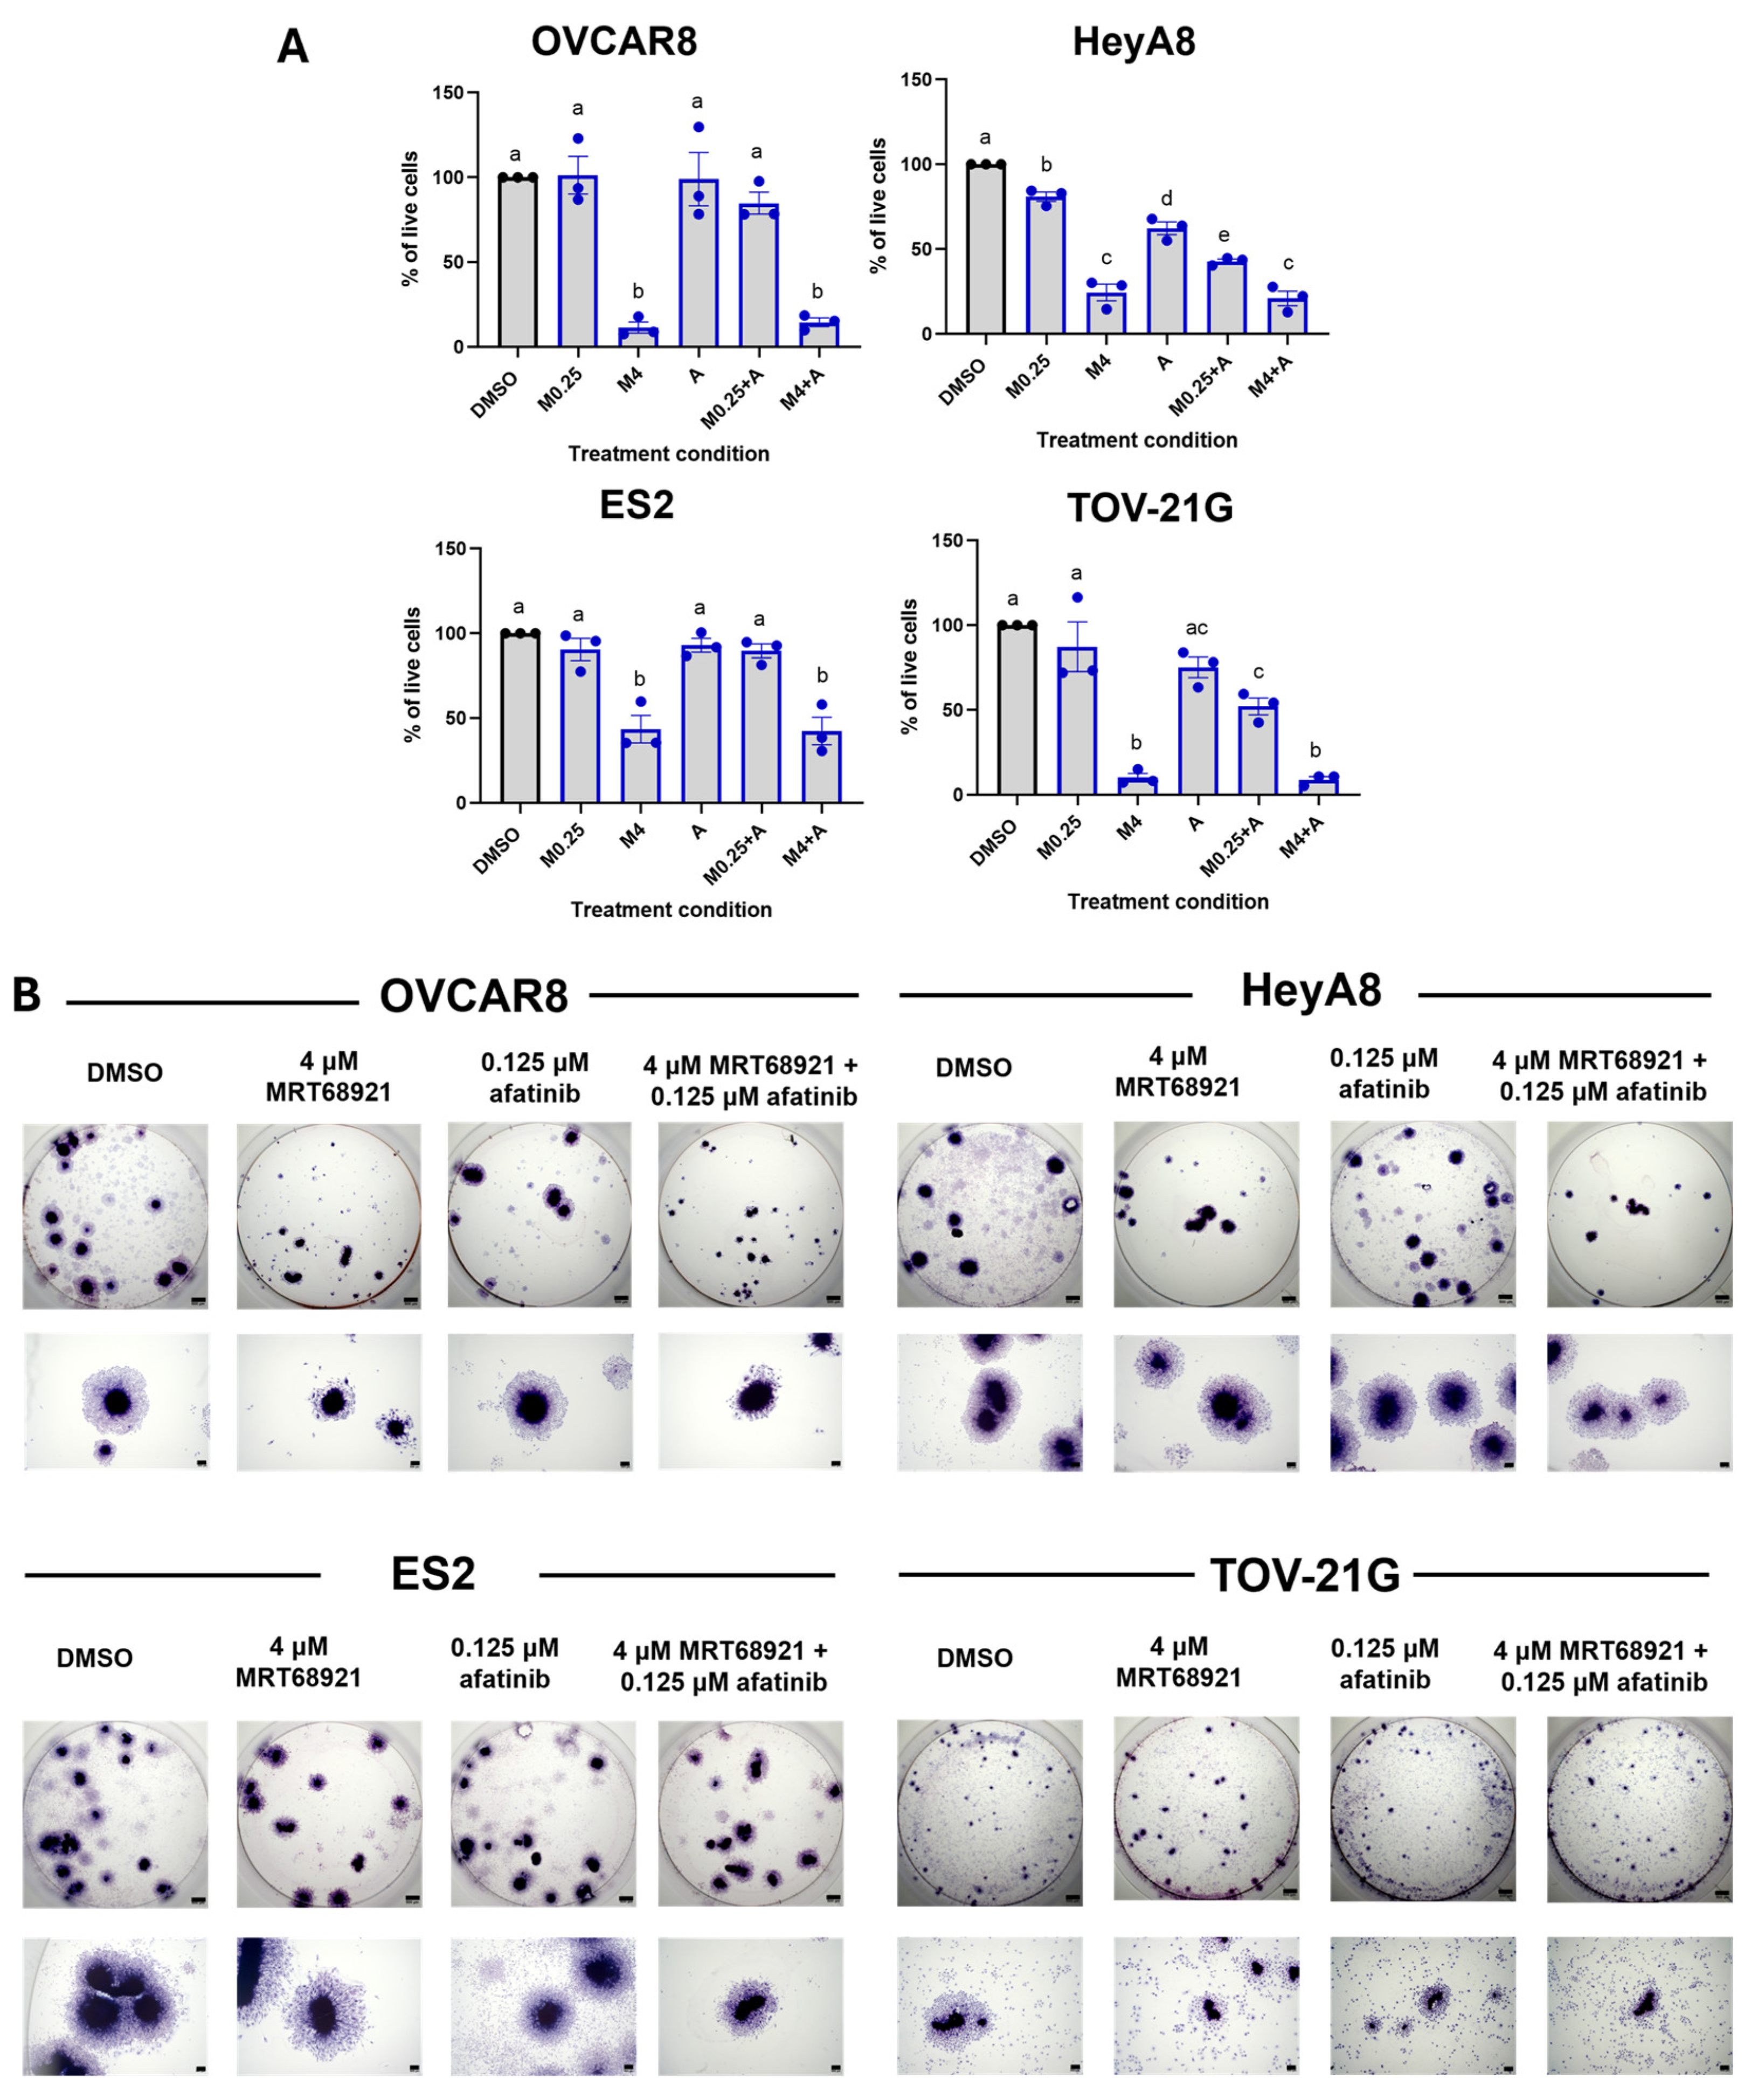
Building on our observation of synergy between MRT68921 and afatinib at specific concentrations (Figure 5), we next assessed their combined effect on spheroid cell viability. Given that most HGSOC and OCCC cell lines exhibited comparable sensitivity to MRT68921 (Supplementary Table S1), we sought to determine whether the identified synergistic combinations produced consistent effects across additional cell lines under spheroid conditions. Accordingly, we treated OVCAR8, HeyA8, ES2, and TOV-21G spheroids with either 0.25 μM or 4 μM MRT68921 ± 0.125 μM afatinib and assessed viability after 72 hours (Figure 7A).
Trypan Blue Exclusion cell counting revealed reduced viability across all spheroid models following treatment with MRT68921 and afatinib. In HeyA8 and TOV-21G spheroids, the combination of 0.25 μM MRT68921 and 0.125 μM afatinib resulted in greater viability reduction compared to either agent alone, consistent with synergy predictions. Notably, treatment with 4 μM MRT68921, either alone or in combination with afatinib, produced the most pronounced effects, reducing spheroid viability by over 70% in OVCAR8, HeyA8, and TOV-21G cell lines, and by approximately 60% in ES2 spheroids.
To further evaluate the functional consequences of combined MRT68921 and afatinib treatment, we performed spheroid reattachment assays, which offer insight into mechanisms controlling the transition from dormancy to a proliferative state [8,12,46]. Following 72 hours of treatment, spheroids were transferred to adherent conditions and stained with Hema3 to visualize reattachment and cellular outgrowth (Figure 7B). Consistent with Trypan Blue viability data, 4 μM MRT68921 alone or in combination with 0.125 μM afatinib markedly impaired spheroid reattachment across all cell lines. This suggests that ULK1 inhibition alone compromises spheroid cell viability and, consequently, their ability to reattach to a solid substratum.
Although Synergy Finder analysis identified synergistic interactions between MRT68921 and afatinib at select concentrations, ULK1 inhibition via MRT68921 yielded the most pronounced effect on spheroid viability and reattachment across all tested cell lines.
Figure 7.
Combined MRT68921 and afatinib treatment impairs spheroid viability and reattachment. A) Trypan Blue exclusion cell counting was performed on EOC spheroids following 72-hour treatment with either 0.25 μM MRT68921 (M0.25) or 4 μM MRT68921 (M4) ± 0.125 μM afatinib (A). Data are presented as mean fold-change in percent viability normalized to DMSO control ± SEM (n = 3). Statistical analysis was performed using one-way ANOVA followed by Tukey’s multiple comparisons test. B) Representative images of Hema3-stained spheroids following a 72-hour drug treatment and subsequent transfer to 24-well tissue culture plastic dishes for reattachment. Individual well and high-power images show qualitative differences in spheroid morphology and reattachment capacity across treatment conditions (n = 4). Scale bars represent 500 μm.
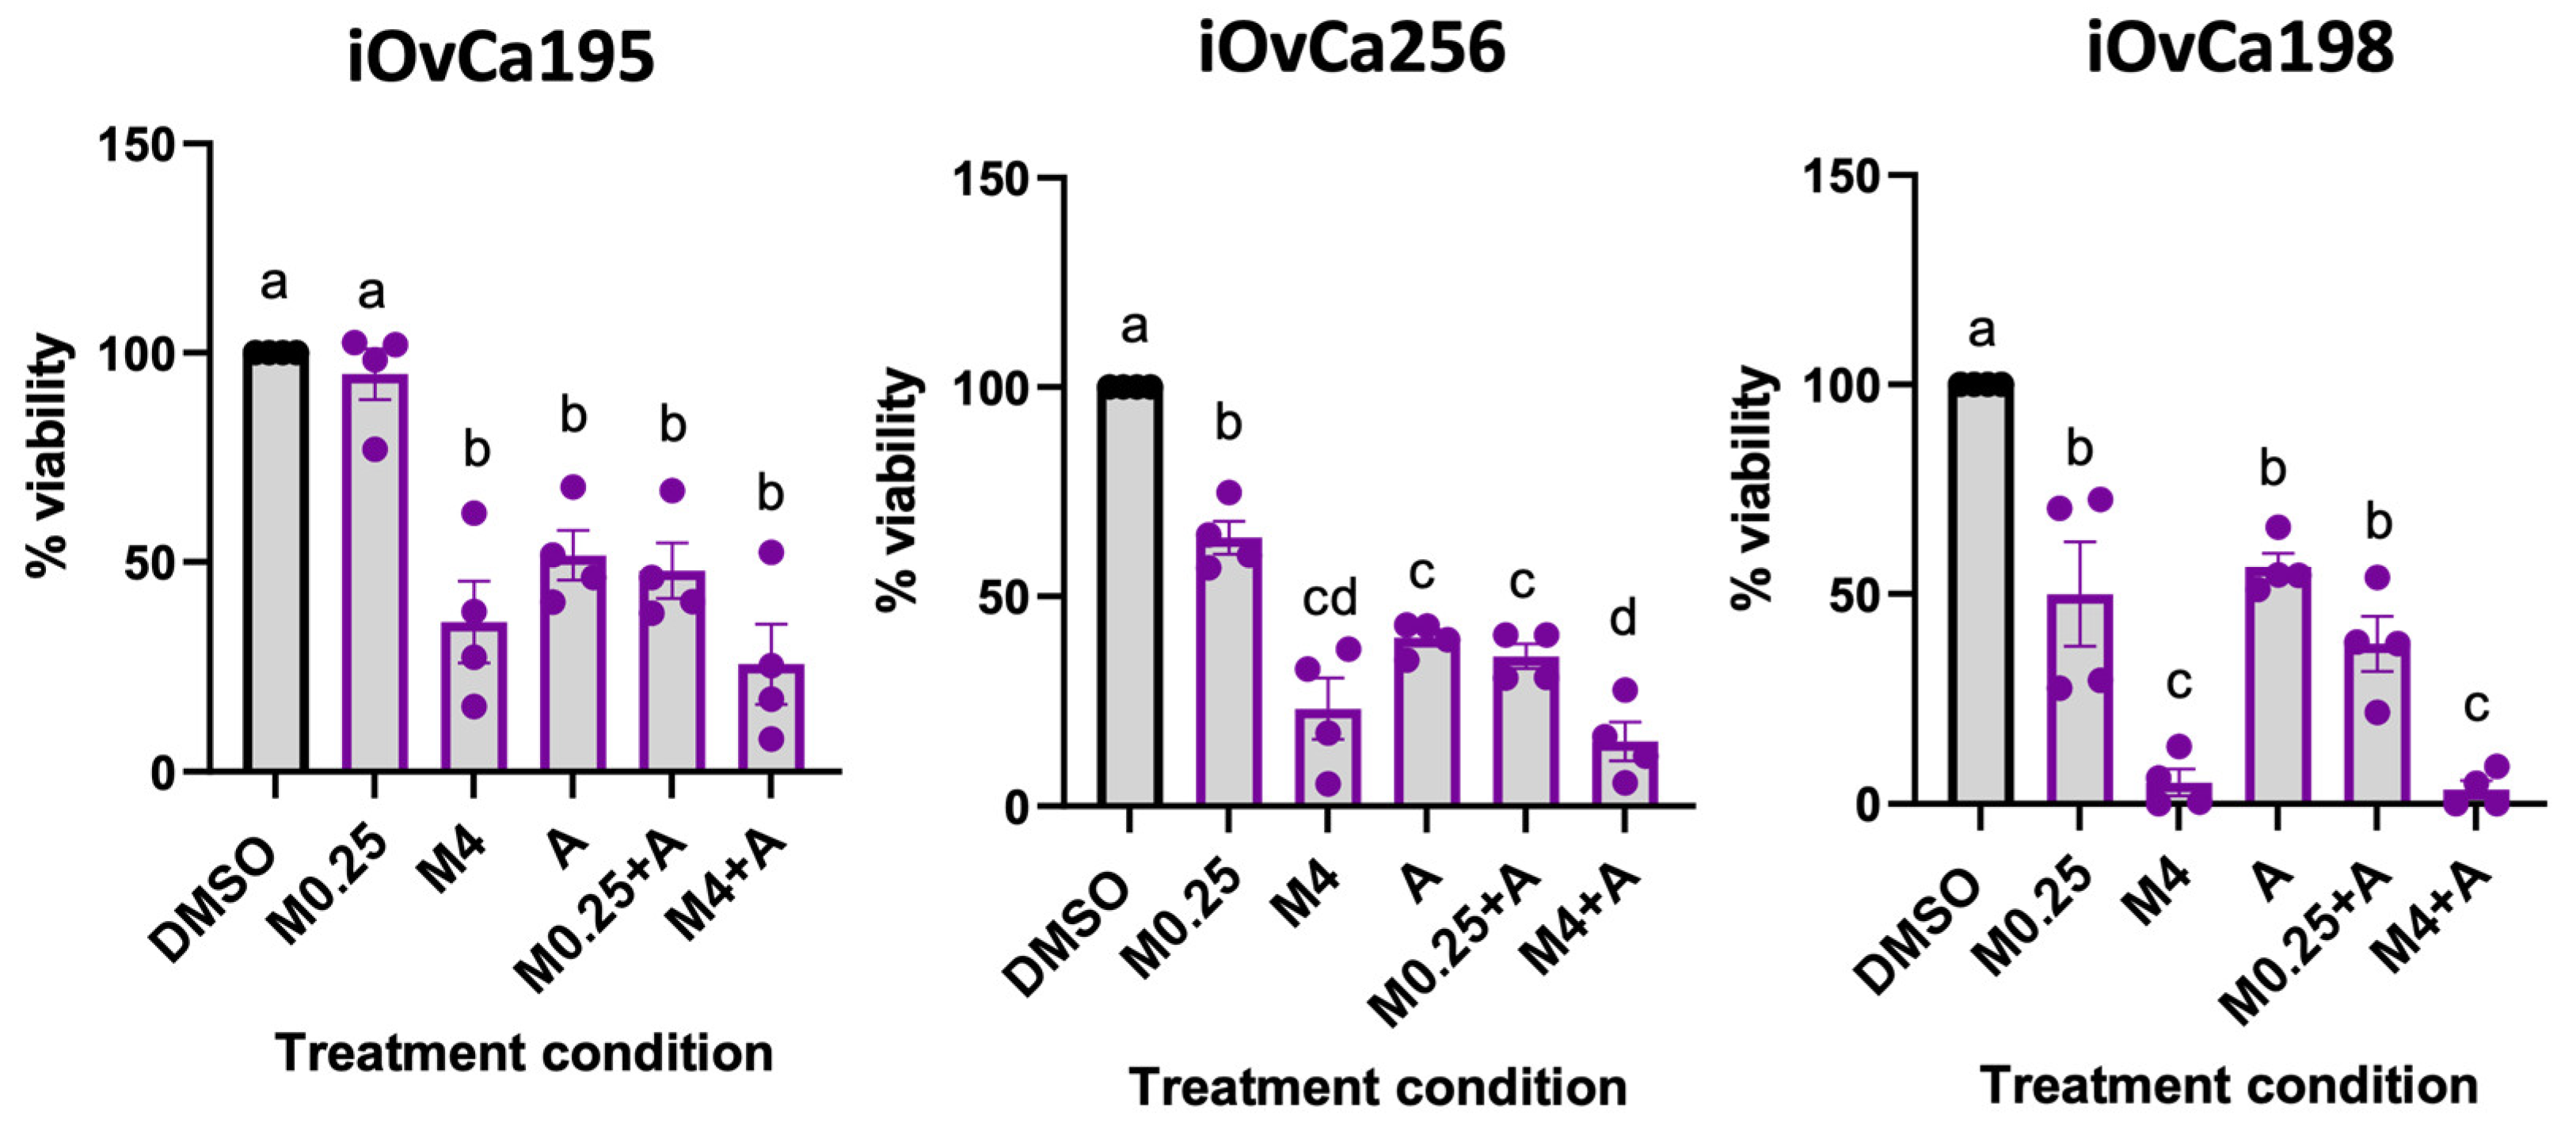
3.8. MRT68921 and Afatinib Combination Treatment Impairs Ascites-Derived Organoid Viability
To extend our findings from spheroid models of EOC metastasis, we next evaluated combined MRT68921 and afatinib treatment effects in patient-derived ascites organoids. Organoids are increasingly recognized as powerful in vitro tools for therapeutic testing due to their ability to recapitulate patient tumour heterogeneity and architecture [47,48,49,50]. We leveraged ascites-derived HGSOC organoids generated from our iOvCa cell lines, which represent samples from patients with diverse treatment histories, molecular profiles, and therapeutic responses [51]. Organoids were established for 7 days, then treated for 72 hours, and viability was assessed using the alamarBlue assay (Figure 8).
iOvCa195 and iOvCa256 organoids exhibited similar sensitivity across all treatment conditions, except for 0.25 μM MRT68921, which did not reduce the viability of iOvCa195 organoids. In contrast, iOvCa198 organoids demonstrated a pronounced response to MRT68921, with 4 μM MRT68921 alone or in combination with 0.125 μM afatinib reducing viability by over 80%. Notably, afatinib did not further enhance the effects of 4 μM MRT68921, likely due to the strong response elicited by MRT68921 alone.
Interestingly, all iOvCa organoids demonstrated greater sensitivity to MRT68921 and afatinib compared to established spheroid models, with viability reduced by at least 50% in many treatment conditions.
Figure 8.
Effect of combined MRT68921 and afatinib treatment on patient ascites-derived organoids. Patient ascites-derived organoids were seeded and allowed to mature for 72 hours prior to 72-hour treatment with either 0.25 μM MRT68921 (M0.25) or 4 μM MRT68921 (M4) ± 0.125 μM afatinib (A). Cell viability was assessed using the alamarBlue assay and expressed as percent viability relative to DMSO-treated controls ± SEM (n = 4). Statistical analysis was performed using one-way ANOVA followed by Tukey’s multiple comparisons test (p ≤ 0.05).
4. Discussion
EOC remains a highly lethal malignancy due to its propensity for peritoneal dissemination, late-stage detection, and chemoresistance [52,53]. Autophagy has emerged as a critical survival mechanism in EOC, particularly in response to metabolic stress and therapy-induced cytotoxicity [14,19,54]. Previously, we demonstrated that EOC spheroids induce autophagy in an ULK1-dependent manner and that autophagy supports spheroid cell survival, making it a compelling therapeutic target [14,16]. We were the first to investigate ULK1-targeted inhibition in EOC using MRT68921 [16]. Here, we expand upon those findings by showing that MRT68921 effectively disrupts autophagy and reduces both spheroid and organoid viability in HGSOC and OCCC cell lines. Additionally, we establish that afatinib, a widely studied TKI, induces autophagy in EOC cells and spheroids, prompting us to evaluate its potential in combination with MRT68921. While MRT68921 and afatinib exhibited synergy at select concentrations, MRT68921 alone had the most pronounced effects on reducing cell viability, spheroid reattachment, and organoid survival. These findings enhance our understanding of ULK1-targeting strategies in EOC and highlight their translational potential.
Our previous work demonstrated the effectiveness of MRT68921 exclusively in HGSOC [16]. Recognizing the heterogeneity across EOC histotypes, we expanded these findings by including additional HGSOC cell lines and OCCC cell lines, given the latter’s poor response to conventional combination chemotherapy [4,5]. Here, we showed that MRT68921 effectively inhibits ULK1 activity in both HGSOC and OCCC, as evidenced by near-complete loss of p-Beclin1 Ser30, a direct ULK1 substrate [37,38,39]. Given the canonical role of ULK1 in autophagy initiation, it is unsurprising that ULK1 inhibition reduced autophagic flux in HeyA8 spheroids. However, OVCAR8 spheroids exhibited limited changes in LC3-II/I ratio, p62 expression, and mCherry/eGFP ratio following MRT68921 treatment, suggesting heterogeneity in autophagy regulation among EOC cell lines. This is consistent with our work demonstrating that HeyA8 and OVCAR8 spheroids display distinct spatial patterns of autophagy activation (Borrelli & Shepherd, unpublished results). These differences were particularly evident when fluorescence was analyzed temporally using our newly established SPoRTS analysis pipeline [35]. Further investigation into how ULK1 inhibition affects spatially distinct autophagy activation patterns within spheroids, beyond what is captured by bulk fluorescence signal analysis, may offer valuable insights into mechanisms controlling autophagy in EOC and heterogeneity among different histotypes.
This heterogeneity is further underscored by the variable sensitivity of EOC cell lines to MRT68921. Although IC50 values of cell lines in monolayer culture were within a narrow range, no trend was observed regarding cell line sensitivity to MRT68921 during spheroid formation (early spheroids) or in maintaining spheroid viability (late spheroids). Interestingly, all cell lines exhibited greater sensitivity to MRT68921 under adherent conditions compared to suspension culture, suggesting a differential reliance on ULK1 between adherent and suspension cell states. This is consistent with our previous findings, which showed increased ULK1 protein expression in HGSOC spheroids relative to monolayer culture [16]. The reduced sensitivity of spheroids to MRT68921 may also reflect their inherent 3D architecture, which can create nutrient and oxygen gradients [55,56], potentially limiting MRT68921 penetration into the spheroid core. Indeed, prior studies comparing IC50 values between adherent and spheroid cultures have demonstrated that cytotoxic agents often exhibit reduced efficacy in spheroids due to slow diffusion rates [57]. Taken together, these findings highlight the biological complexity of 3D spheroid models and reinforce the importance of evaluating drug efficacy in systems that more closely recapitulate in vivo tumour conditions, albeit without vascularization [50].
TKIs, including afatinib, induce autophagy in various cancers, where its activation is implicated as a resistance mechanism that sustains cell survival under therapeutic stress [31,44,58,59]. Here, we demonstrate for the first time that afatinib induces autophagy in both HGSOC and OCCC cell lines, as evidenced by an increased LC3-II/I ratio and enhanced autophagic flux in OVCAR8- and HeyA8-autoR spheroids. Although we did not directly evaluate autophagy as an afatinib-induced resistance mechanism in EOC cells, future studies could investigate whether this may be implicated in EOC, particularly in spheroid models of metastasis.
Previous studies have shown that combining afatinib with autophagy inhibitors enhances its anti-cancer effects in NSCLC, HNSCC, and neuroblastoma [31,44,59]. Additionally, our group has previously demonstrated that combining AKT inhibition with autophagy blockade using chloroquine or Spautin-1 leads to synergistic reductions in EOC cell viability [33]. Building on this rationale, we evaluated the combination of afatinib with MRT68921 in EOC models. Our Synergy Finder analysis identified distinct regions of synergy, particularly at moderate to high MRT68921 concentrations combined with low afatinib concentrations. However, the overall synergy score across all 96 concentration combinations predicted an average additive effect. Notably, few studies have employed comprehensive drug combination matrices for these agents. Our approach enabled the identification of concentration-specific synergistic interactions that may have been overlooked using more limited designs.
Functional assays revealed that treatment with 4 µM MRT68921 alone significantly reduced spheroid and organoid viability, regardless of afatinib co-treatment, highlighting the potency of ULK1 inhibition as a single-agent strategy in EOC. One possible explanation for this observation may be the high dependence of EOC spheroids on ULK1 for survival, which may limit the additional benefit of TKI-induced autophagy modulation [14,15,16]. Although we demonstrated that afatinib induces autophagy in EOC cell lines, molecular analysis revealed that this effect may be independent of ULK1 activity, as afatinib treatment did not alter p-Beclin1 (Ser30). While afatinib has been reported to relieve ULK1 suppression via mTORC1 inhibition, autophagy can also be induced through AMPK-mediated phosphorylation of Beclin-1 at sites distinct from ULK1-targeted Ser30 [37,60,61]. As such, while combination strategies remain promising, they may be more advantageous in cancers with a lower threshold for ULK1 dependency.
Beyond its effects on spheroid viability, ULK1 inhibition via MRT68921 induced notable morphological changes in reattached spheroids. Spheroids treated with 4 µM MRT68921, either alone or in combination with afatinib, were smaller and exhibited reduced reattachment, particularly in OVCAR8 and HeyA8 cell lines. These findings suggest that ULK1 and autophagy play critical roles in spheroid plasticity and peritoneal metastasis, a hallmark of late-stage EOC. Targeting ULK1 may therefore represent a potential anti-metastatic strategy, warranting further investigation using additional functional assays such as mesothelial clearance or cell migration assays [62,63] to directly assess the ability of MRT68921 to impair metastatic potential. Supporting this notion, we have new evidence that ULK1 knockout in EOC cell lines impairs spheroid ability to displace a mesothelial monolayer [64], further implicating ULK1 as a key regulator of motility and metastatic capacity in EOC.
One of the most striking findings of this study was the heightened sensitivity of patient ascites-derived HGSOC organoids to MRT68921. These models better recapitulate tumour-extracellular matrix (ECM) interactions and retain the phenotypic properties of patient tumours [47,48,49,50]. Notably, MRT68921 reduced viability by over 80% in some organoids, reinforcing the therapeutic potential of ULK1 inhibition in EOC. Future studies should expand this analysis to additional patient-derived ascites lines and primary tumour organoid models to explore disease heterogeneity, identifying trends in ULK1 inhibitor sensitivity, related to genetic profiling data or specific ULK1 biomarker assays (e.g., p-Beclin1 Ser30) that could inform clinical decision-making in the future. A comprehensive approach integrating preclinical models and validating additional ULK1-targeted agents will be essential to elucidate the mechanisms underlying ULK1 dependence and to evaluate its therapeutic potential in EOC.
5. Conclusions
Overall, our findings underscore ULK1 as a promising therapeutic target in EOC. MRT68921 effectively suppresses ULK1 activity in both HGSOC and OCCC, disrupts autophagy, counteracts afatinib-induced autophagy, impairs spheroid reattachment, and demonstrates heightened efficacy in patient ascites-derived organoids. Unlike traditional autophagy inhibitors such as chloroquine, which broadly target lysosomal function [65], MRT68921 may offer a more direct and targeted approach by inhibiting autophagy at the initiation phase through ULK1. These results provide critical insights into the role of ULK1 in EOC and establish a foundation for future studies exploring ULK1-targeted agents and their potential as therapeutic strategies for EOC and other ULK1-dependent cancers.
Supplementary Materials
The following supporting information can be downloaded at the website of this paper posted on Preprints.org, Figure S1: MRT68921 inhibits ULK1 activity for at least 96 hours in EOC culture models; Table S1: MRT68921 IC50 values of EOC cell lines in adherent culture; Figure S2: Afatinib alters AKT signaling in EOC cell lines; Figure S3: MRT68921 inhibits ULK1 activity in EOC cell lines.
Author Contributions
Conceptualization, T.P.A.J. and T.G.S.; methodology, T.P.A.J., M.J.B., Y.R.V., T.G.S.; software, M.J.G.; validation, T.P.A.J.; formal analysis, T.P.A.J. and M.J.B.; investigation, T.P.A.J., E.J.T., Á.P.; resources, Y.R.V., T.G.S.; data curation, T.P.A.J., M.J.B.; writing—original draft preparation, T.P.A.J.; writing—review and editing, T.P.A.J. and T.G.S.; visualization, T.P.A.J.; supervision, T.G.S.; project administration, Y.R.V and T.G.S.; funding acquisition, T.G.S. All authors have read and agreed to the published version of the manuscript.
Funding
This research was funded by the Cancer Research Society, grant number 837782. We also acknowledge funding support from the London Health Sciences Foundation through donations to the Mary & John Knight Translational Ovarian Cancer Research Unit. T.P.A.J was supported by the Obstetrics and Gynecology Graduate Research Scholarship (OGGS) with funds from the Department of Obstetrics and Gynecology at the Schulich School of Medicine and Dentistry, Western University.
Institutional Review Board Statement
The study was conducted in accordance with the Declaration of Helsinki and approved by the Institutional Review Board of Western University (protocol #115904) approved December 4, 2024.
Informed Consent Statement
Informed consent was obtained from all subjects involved in the study.
Data Availability Statement
The original contributions presented in this study are included in the article/ supplementary material. Further inquiries can be directed to the corresponding author. The raw data supporting the conclusions of this article will be made available by the authors on request.
Acknowledgments
We would like to thank all members of the Mary & John Knight Translational Ovarian Cancer Research Unit for their support and guidance. We are very grateful to the many donors through the London Health Sciences Foundation for additional infrastructure funding, including the Leica DMI 400B inverted microscope, Bio-Rad Chemidoc, Aglient BioTek Synergy H1 multimode reader and IncuCyte S3 live-cell imaging system used in this study. We gratefully acknowledge all patients who generously donated ascites samples, enabling the establishment of cell lines used to generate organoids for this study.
Conflicts of Interest
The authors declare no conflicts of interest.
Abbreviations
The following abbreviations are used in this manuscript:
| ADH | Adherent |
| AIC | Autophagy initiation complex |
| AKT | Protein kinase B |
| AMPK | AMP-activated protein kinase |
| ATCC | American Type Culture Collection |
| ATG101 | Autophagy-related protein 101 |
| ATG13 | Autophagy-related protein 13 homolog |
| autoR | mCherry-eGFP-LC3B reporter |
| BSA | Bovine serum albumin |
| BSS | Bliss synergy score |
| CAMKK2 | Calcium/calmodulin-dependent protein kinase kinase 2 |
| DMEM | Dulbecco’s modified Eagle medium |
| ECM | Extracellular matrix |
| EGFR | Epidermal growth factor receptor |
| EOC | Epithelial ovarian cancer |
| FACS | Fluorescence-activated cell sorting |
| FBS | Fetal bovine serum |
| FIP200 | FAK family-interacting protein of 200kDa |
| HGSOC | High grade serous ovarian cancer |
| HNSCC | Head and neck squamous cell carcinoma |
| HRP | Horseradish peroxidase |
| IC50 | Half-maximal inhibitory concentration |
| LC3 | Microtubule-associated protein 1 light chain 3 |
| mTORC1 | Mammalian target of rapamycin complex 1 |
| NSCLC | Non-small cell lung cancer |
| OCCC | Ovarian clear cell carcinoma |
| p62 | Sequestosome 1 |
| PBS | Phosphate-buffered saline |
| PDAC | Pancreatic ductal adenocarcinoma |
| PMSF | Phenylmethylsulfonyl fluoride |
| PVDF | Polyvinylidene fluoride |
| RIPA | Radioimmunoprecipitation assay |
| RPMI | Roswell Park Memorial Institute medium |
| SDS | Sodium dodecyl sulfate |
| SPH | Spheroid |
| SPoRTS | Spatial Profiling of Ratiometric Trends in Spheroids |
| STR | Short tandem repeat |
| TBST | Tris-buffered saline-Tween 20 |
| TCGA | Centre for Applied Genomics |
| TKI | Tyrosine kinase inhibitor |
| ULA | Ultra-low attachment |
| ULK1 | Unc-51-like autophagy activating kinase 1 |
| ULK2 | Unc-51-like autophagy activating kinase 2 |
References
- S. Lheureux, C. Gourley, I. Vergote, and A. M. Oza, ‘Seminar Epithelial ovarian cancer’, 2019. [Online]. Available: www.thelancet.com.
- R. L. Siegel, K. D. Miller, N. S. Wagle, and A. Jemal, ‘Cancer statistics, 2023’, CA Cancer J Clin, vol. 73, no. 1, pp. 17–48, Jan. 2023. [CrossRef]
- D. D. Bowtell et al., ‘Rethinking ovarian cancer II: Reducing mortality from high-grade serous ovarian cancer’, Oct. 23, 2015, Nature Publishing Group. [CrossRef]
- C. Zhu et al., ‘Updates of pathogenesis, diagnostic and therapeutic perspectives for ovarian clear cell carcinoma’, 2021, Ivyspring International Publisher. [CrossRef]
- M. Takano, H. Tsuda, and T. Sugiyama, ‘Clear cell carcinoma of the ovary: Is there a role of histology-specific treatment?’, Journal of Experimental & Clinical Cancer Research, vol. 31, no. 1, p. 53, Dec. 2012. [CrossRef]
- H. HUANG et al., ‘Clinical significance of ascites in epithelial ovarian cancer’, Neoplasma, vol. 60, no. 05, pp. 546–552, 2013. [CrossRef]
- E. Lengyel, ‘Ovarian cancer development and metastasis’, 2010, Elsevier Inc. [CrossRef]
- K. Shield, M. L. Ackland, N. Ahmed, and G. E. Rice, ‘Multicellular spheroids in ovarian cancer metastases: Biology and pathology’, Apr. 2009. [CrossRef]
- K. L. Sodek, M. J. Ringuette, and T. J. Brown, ‘Compact spheroid formation by ovarian cancer cells is associated with contractile behavior and an invasive phenotype’, Int J Cancer, vol. 124, no. 9, pp. 2060–2070, May 2009. [CrossRef]
- J. Liao et al., ‘Ovarian cancer spheroid cells with stem cell-like properties contribute to tumor generation, metastasis and chemotherapy resistance through hypoxia-resistant metabolism’, PLoS One, vol. 9, no. 1, Jan. 2014. [CrossRef]
- S. Capellero et al., ‘Ovarian Cancer Cells in Ascites Form Aggregates That Display a Hybrid Epithelial-Mesenchymal Phenotype and Allows Survival and Proliferation of Metastasizing Cells’, Int J Mol Sci, vol. 23, no. 2, Jan. 2022. [CrossRef]
- R. J. M. Correa, T. Peart, Y. R. Valdes, G. E. Dimattia, and T. G. Shepherd, ‘Modulation of AKT activity is associated with reversible dormancy in ascites-derived epithelial ovarian cancer spheroids’, Carcinogenesis, vol. 33, no. 1, pp. 49–58, Jan. 2012. [CrossRef]
- T. Peart et al., ‘Intact LKB1 activity is required for survival of dormant ovarian cancer spheroids’. [Online]. Available: www.impactjournals.com/oncotarget.
- R. J. M. Correa, Y. R. Valdes, T. G. Shepherd, and G. E. DiMattia, ‘Beclin-1 expression is retained in high-grade serous ovarian cancer yet is not essential for autophagy induction in vitro’, J Ovarian Res, vol. 8, no. 1, Aug. 2015. [CrossRef]
- J. Laski, B. Singha, X. Wang, Y. R. Valdés, O. Collins, and T. G. Shepherd, ‘Activated CAMKKβ-AMPK signaling promotes autophagy in a spheroid model of ovarian tumour metastasis’, J Ovarian Res, vol. 13, no. 1, May 2020. [CrossRef]
- B. Singha, J. Laski, Y. Ramos Valdés, E. Liu, G. E. Dimattia, and T. G. Shepherd, ‘Inhibiting ULK1 kinase decreases autophagy and cell viability in high-grade serous ovarian cancer spheroids’, 2020. [Online]. Available: www.ajcr.us/.
- Borrelli, M. J., Buensuceso, A., Ramos Valdes, Y., Johnston, T. P. A., Haagsma, J., & Shepherd, T. G. (2025). CAMKKβ supports growth and viability of epithelial ovarian cancer in vitro and in vivo. Scientific reports, 15(1), 25913. [CrossRef]
- E. White, ‘The role for autophagy in cancer’, Jan. 02, 2015, American Society for Clinical Investigation. [CrossRef]
- C. W. Yun and S. H. Lee, ‘The roles of autophagy in cancer’, Nov. 05, 2018, MDPI AG. [CrossRef]
- M. Zachari and I. G. Ganley, ‘The mammalian ULK1 complex and autophagy initiation’, Dec. 12, 2017, Portland Press Ltd. [CrossRef]
- A. Demeter et al., ‘ULK1 and ULK2 are less redundant than previously thought: computational analysis uncovers distinct regulation and functions of these autophagy induction proteins’, Sci Rep, vol. 10, no. 1, Dec. 2020. [CrossRef]
- K. R. Parzych and D. J. Klionsky, ‘An overview of autophagy: Morphology, mechanism, and regulation’, Jan. 20, 2014. [CrossRef]
- K. J. Petherick et al., ‘Pharmacological inhibition of ULK1 kinase blocks mammalian target of rapamycin (mTOR)-dependent autophagy’, Journal of Biological Chemistry, vol. 290, no. 18, pp. 11376–11383, May 2015. [CrossRef]
- M. Martini, M. C. De Santis, L. Braccini, F. Gulluni, and E. Hirsch, ‘PI3K/AKT signaling pathway and cancer: an updated review’, Ann Med, vol. 46, no. 6, pp. 372–383, Sep. 2014. [CrossRef]
- N. Rinne et al., ‘Targeting the PI3K/AKT/mTOR pathway in epithelial ovarian cancer, therapeutic treatment options for platinum-resistant ovarian cancer’, 2021, OAE Publishing Inc. [CrossRef]
- F. Solca et al., ‘Target binding properties and cellular activity of afatinib (BIBW 2992), an irreversible ErbB family blocker’, Journal of Pharmacology and Experimental Therapeutics, vol. 343, no. 2, pp. 342–350, Nov. 2012. [CrossRef]
- S. Wind, D. Schnell, T. Ebner, M. Freiwald, and P. Stopfer, ‘Clinical Pharmacokinetics and Pharmacodynamics of Afatinib’, Mar. 01, 2017, Springer International Publishing. [CrossRef]
- P.-M. Wong, Y. Feng, J. Wang, R. Shi, and X. Jiang, ‘Regulation of autophagy by coordinated action of mTORC1 and protein phosphatase 2A’, Nat Commun, vol. 6, no. 1, p. 8048, Aug. 2015. [CrossRef]
- N. Ioannou et al., ‘Anti-tumour activity of afatinib, an irreversible ErbB family blocker, in human pancreatic tumour cells’, Br J Cancer, vol. 105, no. 10, pp. 1554–1562, Nov. 2011. [CrossRef]
- X. Liu et al., ‘Afatinib induces pro-survival autophagy and increases sensitivity to apoptosis in stem-like HNSCC cells’, Cell Death Dis, vol. 12, no. 8, Aug. 2021. [CrossRef]
- X. Hu et al., ‘Blocking autophagy improves the anti-Tumor activity of afatinib in lung adenocarcinoma with activating EGFR mutations in vitro and in vivo’, Sci Rep, vol. 7, no. 1, Dec. 2017. [CrossRef]
- X. Liu et al., ‘Afatinib down-regulates MCL-1 expression through the PERK-eIF2α-ATF4 axis and leads to apoptosis in head and neck squamous cell carcinoma.’, Am J Cancer Res, vol. 6, no. 8, pp. 1708–1719, 2016.
- R. J. M. Correa et al., ‘Combination of AKT inhibition with autophagy blockade effectively reduces ascites-derived ovarian cancer cell viability’, Carcinogenesis, vol. 35, no. 9, pp. 1951–1961, 2014. [CrossRef]
- B. Kolendowski et al., ‘Characterization of Mutational Status, Spheroid Formation, and Drug Response of a New Genomically-Stable Human Ovarian Clear Cell Carcinoma Cell Line, 105C’, Cells, vol. 9, no. 11, Nov. 2020. [CrossRef]
- M. J. Borrelli, B. Kolendowski, G. E. DiMattia, and T. G. Shepherd, ‘Spatiotemporal analysis of ratiometric biosensors in live multicellular spheroids using SPoRTS’, Cell Reports Methods, p. 100987, Feb. 2025. [CrossRef]
- A. Ianevski, A. K. Giri, and T. Aittokallio, ‘SynergyFinder 3.0: an interactive analysis and consensus interpretation of multi-drug synergies across multiple samples’, Nucleic Acids Res, vol. 50, no. W1, pp. W739–W743, Jul. 2022. [CrossRef]
- M. B. Menon and S. Dhamija, ‘Beclin 1 phosphorylation - at the center of autophagy regulation’, Oct. 12, 2018, Frontiers Media S.A. [CrossRef]
- S. Tran, W. D. Fairlie, and E. F. Lee, ‘Beclin1: Protein structure, function and regulation’, Jun. 01, 2021, MDPI. [CrossRef]
- R. C. Russell et al., ‘ULK1 induces autophagy by phosphorylating Beclin-1 and activating VPS34 lipid kinase’, Nat Cell Biol, vol. 15, no. 7, pp. 741–750, Jul. 2013. [CrossRef]
- S. Barth, D. Glick, and K. F. Macleod, ‘Autophagy: assays and artifacts’, J Pathol, vol. 221, no. 2, pp. 117–124, Jun. 2010. [CrossRef]
- D. J. Klionsky et al., ‘Guidelines for the use and interpretation of assays for monitoring autophagy (4th edition) 1’. [Online]. Available: www.tandfonline.com/journals/kaup20.
- E. N. N’Diaye, K. K. Kajihara, I. Hsieh, H. Morisaki, J. Debnath, and E. J. Brown, ‘PLIC proteins or ubiquilins regulate autophagy-dependent cell survival during nutrient starvation’, EMBO Rep, vol. 10, no. 2, pp. 173–179, 2009. [CrossRef]
- I. G. Ganley, D. H. Lam, J. Wang, X. Ding, S. Chen, and X. Jiang, ‘ULK1·ATG13·FIP200 Complex Mediates mTOR Signaling and Is Essential for Autophagy’, Journal of Biological Chemistry, vol. 284, no. 18, pp. 12297–12305, May 2009. [CrossRef]
- X. Liu et al., ‘Afatinib induces pro-survival autophagy and increases sensitivity to apoptosis in stem-like HNSCC cells’, Cell Death Dis, vol. 12, no. 8, Aug. 2021. [CrossRef]
- A. Ianevski, A. K. Giri, and T. Aittokallio, ‘SynergyFinder 2.0: Visual analytics of multi-drug combination synergies’, Nucleic Acids Res, vol. 48, no. 1, pp. W488–W493, 2021. [CrossRef]
- D. Dhaliwal and T. G. Shepherd, ‘Molecular and cellular mechanisms controlling integrin-mediated cell adhesion and tumor progression in ovarian cancer metastasis: a review’, Apr. 01, 2022, Springer Science and Business Media B.V. [CrossRef]
- E. Tomas and T. G. Shepherd, ‘Insights into high-grade serous carcinoma pathobiology using three-dimensional culture model systems’, Dec. 01, 2023, BioMed Central Ltd. [CrossRef]
- M. Bleijs, M. van de Wetering, H. Clevers, and J. Drost, ‘Xenograft and organoid model systems in cancer research’, EMBO J, vol. 38, no. 15, Aug. 2019. [CrossRef]
- Z. Heydari et al., ‘Organoids: a novel modality in disease modeling’, Dec. 01, 2021, Springer. [CrossRef]
- V. Tadić, W. Zhang, and A. Brozovic, ‘The high-grade serous ovarian cancer metastasis and chemoresistance in 3D models’, Jan. 01, 2024, Elsevier B.V. [CrossRef]
- E. J. Tomas et al., ‘Exploiting Cancer Dormancy Signaling Mechanisms in Epithelial Ovarian Cancer Through Spheroid and Organoid Analysis’, Cells, vol. 14, no. 2, Jan. 2025. [CrossRef]
- S. Lheureux, M. Braunstein, and A. M. Oza, ‘Epithelial ovarian cancer: Evolution of management in the era of precision medicine’, CA Cancer J Clin, vol. 69, no. 4, pp. 280–304, Jul. 2019. [CrossRef]
- S. Vaughan et al., ‘Rethinking ovarian cancer: Recommendations for improving outcomes’, Oct. 2011. [CrossRef]
- F. Ren, J. Shen, H. Shi, F. J. Hornicek, Q. Kan, and Z. Duan, ‘Novel mechanisms and approaches to overcome multidrug resistance in the treatment of ovarian cancer’, Biochimica et Biophysica Acta (BBA) - Reviews on Cancer, vol. 1866, no. 2, pp. 266–275, Dec. 2016. [CrossRef]
- L. E. Jamieson, D. J. Harrison, and C. J. Campbell, ‘Chemical analysis of multicellular tumour spheroids’, Analyst, vol. 140, no. 12, pp. 3910–3920, 2015. [CrossRef]
- E. Sokolova et al., ‘Penetration efficiency of antitumor agents in ovarian cancer spheroids: The case of recombinant targeted toxin DARPin-LoPE and the chemotherapy drug, doxorubicin’, Pharmaceutics, vol. 11, no. 5, May 2019. [CrossRef]
- C. Berrouet, N. Dorilas, K. A. Rejniak, and N. Tuncer, ‘Comparison of Drug Inhibitory Effects (IC 50) in Monolayer and Spheroid Cultures’, Bull Math Biol, vol. 82, no. 6, Jun. 2020. [CrossRef]
- A. J. Van der Wekken, A. Saber, T. J. N. Hiltermann, K. Kok, A. van den Berg, and H. J. M. Groen, ‘Resistance mechanisms after tyrosine kinase inhibitors afatinib and crizotinib in non-small cell lung cancer, a review of the literature’, Apr. 01, 2016, Elsevier Ireland Ltd. [CrossRef]
- S. Aveic et al., ‘Autophagy inhibition improves the cytotoxic effects of receptor tyrosine kinase inhibitors’, Cancer Cell Int, vol. 18, no. 1, Apr. 2018. [CrossRef]
- D. Heras-Sandoval, J. M. Pérez-Rojas, J. Hernández-Damián, and J. Pedraza-Chaverri, ‘The role of PI3K/AKT/mTOR pathway in the modulation of autophagy and the clearance of protein aggregates in neurodegeneration’, Cell Signal, vol. 26, no. 12, pp. 2694–2701, Dec. 2014. [CrossRef]
- C. Fung, X. Chen, J. R. Grandis, and U. Duvvuri, ‘EGFR tyrosine kinase inhibition induces autophagy in cancer cells’, Cancer Biol Ther, vol. 13, no. 14, pp. 1417–1424, Dec. 2012. [CrossRef]
- R. A. Davidowitz, M. P. Iwanicki, and J. S. Brugge, ‘In vitro mesothelial clearance assay that models the early steps of ovarian cancer metastasis’, Journal of Visualized Experiments, no. 60, Feb. 2012. [CrossRef]
- J. Pijuan et al., ‘In vitro cell migration, invasion, and adhesion assays: From cell imaging to data analysis’, Front Cell Dev Biol, vol. 7, no. JUN, 2019. [CrossRef]
- J. Webb et al., ‘ULK1 promotes metastatic progression in epithelial ovarian cancer’, Apr. 2025. [CrossRef]
- K. P. Collins, S. Witta, J. W. Coy, Y. Pang, and D. L. Gustafson, ‘Lysosomal Biogenesis and Implications for Hydroxychloroquine Disposition.’, J Pharmacol Exp Ther, vol. 376, no. 2, pp. 294–305, Feb. 2021. [CrossRef]
Figure 5.
SynergyFinder analysis of MRT68921 and afatinib combination treatment in EOC cell lines. Bliss synergy scores (BSS) are presented as mean ± SEM (n = 3). Heat maps display the average synergy scores from biological replicates, where red indicates synergistic interaction (BSS > 10), white represents additive effects (−10 < BSS < 10), and green indicates antagonism (BSS < −10). Regions enclosed by dashed-lined boxes represent areas with the greatest degree of synergy. OVCAR8 and HeyA8 cells were seeded 24 hours prior to 72-hour combination treatment with afatinib and MRT68921, using a matrix of concentrations ranging from 0 to 16 μM. Cell viability was assessed using alamarBlue as an indirect measure of viability.
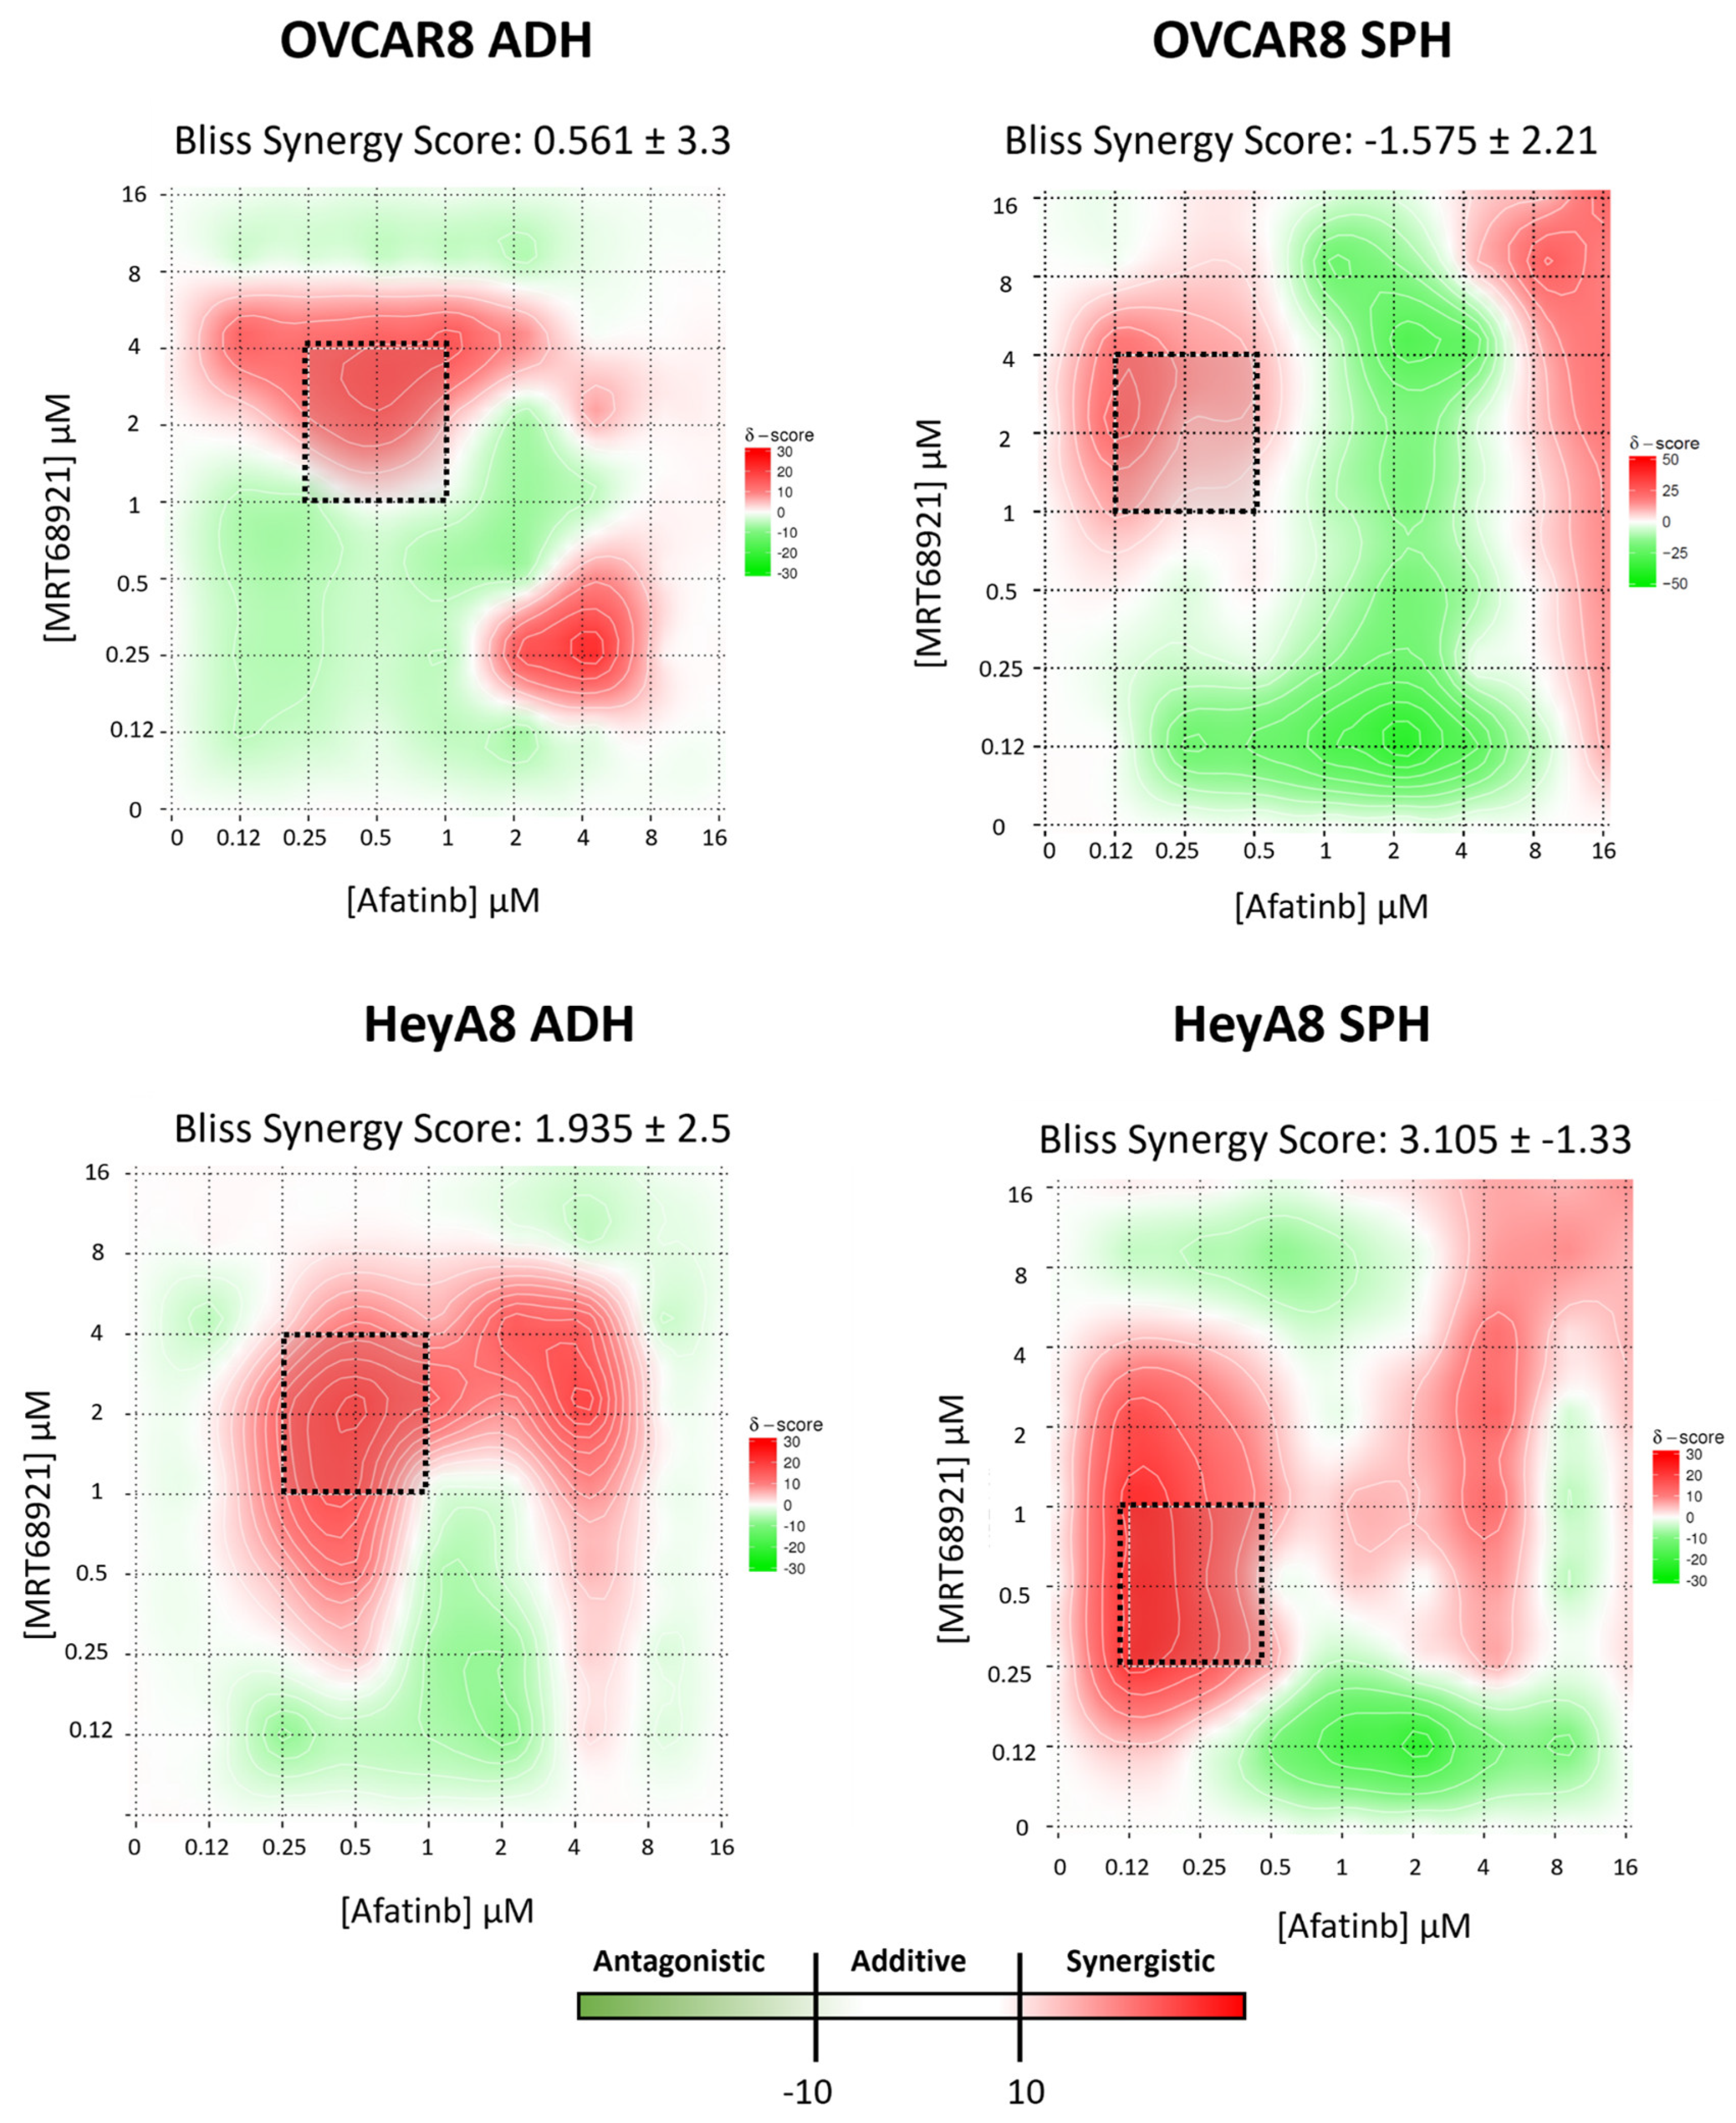
Figure 6.
Combined MRT68921 and afatinib treatment modulates ULK1 activity and autophagy in EOC spheroids. A) Representative immunoblots and densitometric analyses of OVCAR8 (n = 4) and HeyA8 (n = 3) spheroids treated either 0.25 μM (M0.25) or 4 μM (M4) of MRT68921 and 0.125 μM afatinib (A) for 24 hours. Spheroids were seeded 24 hours prior to drug treatment. Densitometric values are expressed as mean fold-change relative to DMSO-treated controls ± SEM. Statistical analysis was performed using one-way ANOVA followed by Tukey’s multiple comparisons test (*p < 0.05, **p < 0.01). B) Representative fluorescence images of OVCAR8-autoR and HeyA8-autoR spheroids treated with the indicated concentrations of MRT68921 and afatinib, beginning 24 hours after seeding. Timepoints indicate the duration of treatment. Scale bars represent 400 μm. Autophagic flux was quantified based on the mCherry/eGFP fluorescence ratio and is presented as mean ± SEM (n = 3); statistical analysis was performed using two-way ANOVA followed by Tukey’s multiple comparisons test (p ≤ 0.05).
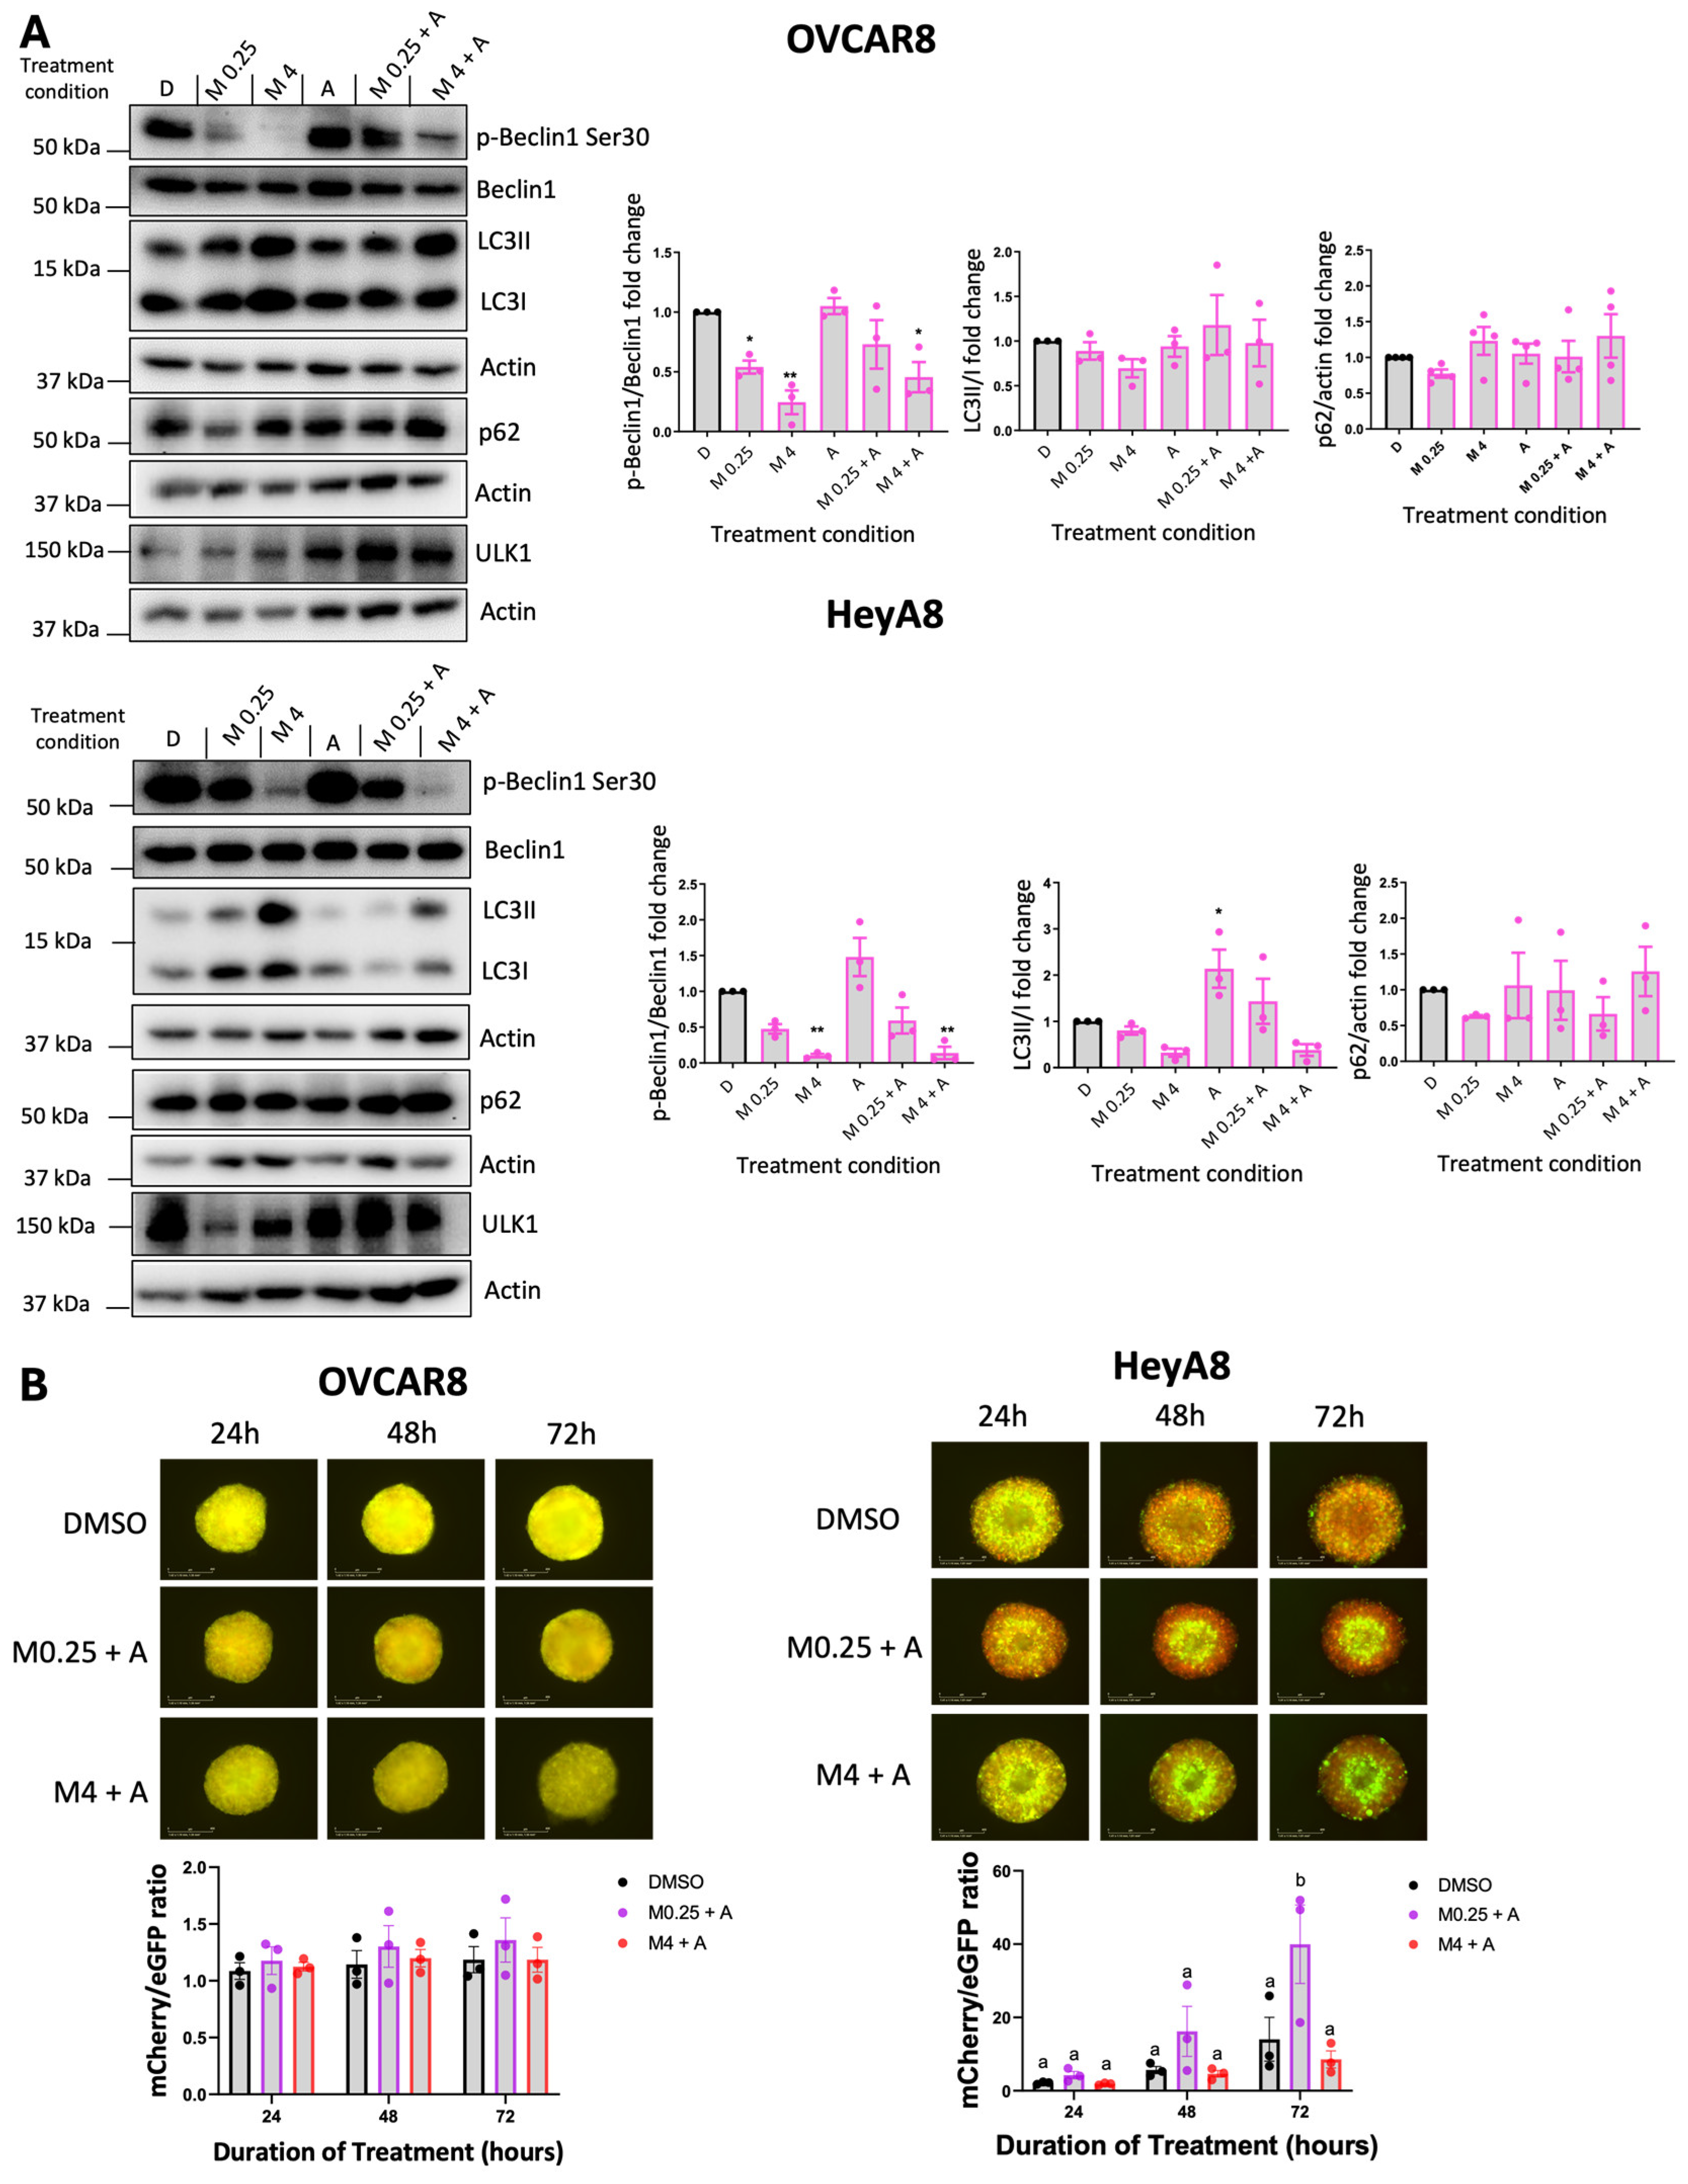

Table 1.
Advanced DMEM/F-12 media additives for organoid culture.
Disclaimer/Publisher’s Note: The statements, opinions and data contained in all publications are solely those of the individual author(s) and contributor(s) and not of MDPI and/or the editor(s). MDPI and/or the editor(s) disclaim responsibility for any injury to people or property resulting from any ideas, methods, instructions or products referred to in the content. |
© 2025 by the authors. Licensee MDPI, Basel, Switzerland. This article is an open access article distributed under the terms and conditions of the Creative Commons Attribution (CC BY) license (http://creativecommons.org/licenses/by/4.0/).
Copyright: This open access article is published under a Creative Commons CC BY 4.0 license, which permit the free download, distribution, and reuse, provided that the author and preprint are cited in any reuse.


