Preprint
Article

This version is not peer-reviewed.

Exploiting Cancer Dormancy Signaling Mechanisms in Epithelial Ovarian Cancer Through Spheroid and Organoid Analysis

A peer-reviewed article of this preprint also exists.

Submitted:

19 December 2024

Posted:

20 December 2024

You are already at the latest version

Abstract

Epithelial ovarian cancer (EOC) exhibits a unique mode of metastasis, involving spheroid formation in the peritoneum. Our research on EOC spheroid cell biology has provided valuable insights into the signalling plasticity associated with metastasis. We speculate that EOC cells modify their biology between tumor and spheroid states during cancer dormancy, although the specific mechanisms underlying this transition remain unknown. Here, we present novel findings from direct comparisons between cultured EOC spheroids and organoids. Our results indicated that AMP-activated protein kinase (AMPK) activity was significantly upregulated and protein kinase B (Akt) was down-regulated in iOvCa spheroids compared to organoids, suggesting a clear differential phenotype. Through a comprehensive RNA sequencing analysis, we further supported these phenotypic differences and highlighted the significance of cell cycle regulation in organoids. By inhibiting the G2/M checkpoint via kinase inhibitors, we confirmed that this pathway is essential for organoids. Interestingly, our results suggest that specifically targeting aurora kinase A (AURKA) may represent a promising therapeutic strategy since our cells were equally sensitive to Alisertib treatment as both spheroids and or-ganoids. Our findings emphasize the importance of studying cellular adaptations of EOC cells, as there may be different therapeutic targets depending on the step of EOC disease progression.

Keywords: 
;  ;  ;  ;  ;  ;  

1. Introduction

Epithelial ovarian cancer (EOC) is one of the most lethal forms of gynaecological malignancy, with a survival rate of less than 30% for late-stage presentation and due to recurrence of chemo resistant disease [1]. The most common type of EOC is high-grade serous ovarian cancer (HGSOC), which is often diagnosed at an advanced stage [2,3]. HGSOC originates from the fallopian tube epithelium, where cells acquire an inactivating TP53 mutation, resulting in further genomic instability and increased invasiveness [4,5]. This leads to the formation of serous tubal intraepithelial carcinoma (STIC) lesions that can seed on the ovary for tumor formation [6]. These malignant tumor cells can detach and aggregate into heterogeneous clusters known as spheroids within the peritoneal cavity [7]. As these spheroids transit within the peritoneal fluid, or malignant ascites, they can adhere to the mesothelial surface and form secondary tumors. Numerous studies have shown that cells undergo changes in their pathobiology as they adapt from a tumor state to a spheroid state [8,9,10,11,12,13]. This process can be described as cancer dormancy, which explains the clinical problem of cancer recurrence from underlying minimal disease that has evaded chemotherapy [14,15]. Nonetheless, it is currently not well understood in the context of EOC metastasis.
Researchers have used three-dimensional (3D) in vitro culture model systems to investigate the specific cellular and molecular biology of EOC cells during disease progression. Spheroids have been extensively studied using suspension cultures with Ultra-Low Attachment (ULA) plates or hanging droplet methods in order to understand the mechanisms of cell survival [16]. This includes the activation of intracellular signaling pathways that induce cancer dormancy, such as cellular quiescence, cell adhesion, epithelial-mesenchymal transition (EMT), stem-like phenotype, bioenergetic stress response, and autophagy [12,13,17,18,19,20,21,22,23,24,25,26,27,28,29]. As cells transition from an adherent to spheroid culture, AMP-activated protein kinase (AMPK) activity is induced in response to cell bioenergetic stress, and protein kinase B (Akt) activity is reduced to decrease cell proliferation [20,23,24,25,26,30,31]. The process of cancer dormancy can be inhibited by targeting these specific proteins in HGSOC cells, leading to cell death within spheroids. Thus, researchers focus on discovering novel targeted agents to effectively eradicate dormant residual disease that may be evading chemotherapy-induced killing.
Several advancements have been made in 3D culture model systems, which have been integrated into current EOC studies. One such model is patient-derived organoids (PDOs) which is very effective in replicating tumors ex vivo [32,33,34]. Using an extracellular matrix (ECM) reagent, cells from dissociated tumors can proliferate into a 3D structure that reproduces the cell-cell and cell-matrix interactions observed in vivo. With respect to EOC, various groups have made significant contributions to the development of PDOs and validated their ability to reproduce the patient-specific characteristics of original tumors [35,36,37,38]. As a result, PDOs have been harnessed for high-throughput drug testing of many targeted agents and for investigating potential mechanisms of platinum and/or Poly ADP-ribose polymerase (PARP) inhibitor resistance in patients [39,40,41,42]. Consequently, it is critical to incorporate 3D organoids into current research to comprehend the biology of HGSOC tumors and distinguish it from spheroid biology.
In this study, we characterized the spheroid model system against the organoid model system using several new patient ascites-derived HGSOC cell lines to explore the underlying cellular pathobiology during disease progression. Our results indicate that EOC cells have differential expression patterns between spheroids and organoids, which validates our previous studies comparing adherent to spheroid cultures. We observed altered AMPK activity and Akt signaling when comparing adherent, spheroid and organoid cultures. Although, spheroid and organoid assessments may provide a more accurate understanding of biological switching behaviours as cells transition from tumors to spheroids and back to tumor structures as metastatic lesions. This was highlighted with a transcriptomic analysis that confirmed a dormancy phenotype in spheroids and an importance of cell cycle checkpoint regulation in organoids. Overall, our results provided potentially new mechanistic discoveries that could be targeted therapeutically for EOC.

2. Materials and Methods

2.1. Cell Lines

The following HGSOC established cell lines were used for analysis and purchased from ATCC (Cedarlane, Burlington, ON, Canada): OVCAR8, OVCAR4 and OVCAR3 (Table 1). HGSOC patient ascites-derived immortalized cell lines were used: iOvCa182, iOvCa195, iOvCa198, iOvCa246, iOvCa256, iOvCa398 and iOvCa411 (Table 1). iOvCa cell lines were derived from malignant ascites fluid collected during debulking surgery and continuously passaged on T-75 flasks (Sarstedt, Newton, NC, USA) until immortalized [43]. Patient consent for clinical specimens from which these cell lines were derived was obtained according to our institution research ethics board approved protocol (#115904). Cells were maintained at 37°C and a CO2 concentration of 5% in adherent cultures on tissue culture-treated polystyrene plates (Sarstedt, Newton, NC, USA) with 10% foetal bovine serum (FBS) (Wisent, Saint-Jean-Baptiste, QC, Canada) in either RPMI-1640 (Gibco), for OVCAR8 and OVCAR3 cell lines, or DMEM/F-12 (Gibco), for OVCAR4 and iOvCa cell lines. All cell lines were confirmed to be HGSOC based on their marker expression of PAX8 and p53 (Figure S1A,B; Table 1). All cell lines were validated by STR analysis and tested for mycoplasma routinely (with details on product or service provider).

2.2. 3D Spheroid Culture

Cells were seeded at 5x10⁵ or 1x10⁶ cells/well in suspension using 6-well ULA plates (Corning, NY, USA) and supplemented with their corresponding media (RPMI-1640 or DMEM/F12 with 10% FBS). Spheroids were collected after 3 days in culture.

2.3. 3D Organoid Culture

Cells were seeded at 2.5 x10⁵ or 5 x10⁵ cells/well and resuspended in 50uL of Cultrex Basement Membrane Extract (BME) PathClear Type 2 (Cedarlane, Burlington, ON, Canada) as droplets on 24-well tissue culture-treated polystyrene plates (Sarstedt, Newton, NC, USA). The droplets were overlaid with an EOC organoid specific media that contains Advanced DMEM/F-12 (Invitrogen, Waltham, MA, USA) supplemented with B-27™ (Invitrogen, Waltham, MA, USA), Forskolin (Cedarlane, Burlington, ON, Canada), GlutaMAX™ (Invitrogen, Waltham, MA, USA), HEPES (Wisent, Saint-Jean-Baptiste, QC, Canada), Human EGF (Peprotech Inc., Cranbury, NJ, USA), Human FGF-10 (Peprotech Inc., Cranbury, NJ, USA), Nicotinamide (MilliporeSigma, Oakville, ON, Canada), N-Acetyl-L-cysteine (MilliporeSigma, Oakville, ON, Canada), Recombinant Human Noggin (R&D Systems, Toronto, ON, Canada) and Y-27632 dihydrochloride (MilliporeSigma, Oakville, ON, Canada) (Formula provided in Table S1). After 21 days in culture, organoids were released from Cultrex BME by dissolving the matrix dome in 500µL of Cell Recovery Solution (Corning, NY, USA) incubated on ice for 1.5-2 hours.

2.4. Organoid Growth Analysis

Cells were seeded at 5 x10⁴ cells/well in 50µL of Cultrex BME on a 24-well tissue culture plate (Corning, NY, USA). For manual analysis, brightfield images were taken at the 21-day endpoint using a Leica DMI4000B inverted microscope (Teaneck NJ, USA). ImageJ Software was used to manually outline each organoid structure to quantify organoid number (count/well or image) and average organoid area (µm2). For automated analysis, the Incucyte® S3 System (Sartorius, Oakville, ON, Canada) was used to capture brightfield images at 12-hour increments over 21 days. The Incucyte® Organoid Analysis Software (Sartorius, Oakville, ON, Canada) was used to automatically outline each organoid structure to quantify the total organoid area per image or well (µm2), organoid number, organoid darkness, and organoid eccentricity.

2.5. Antibodies

The following primary antibodies from Cell Signaling Technologies (Whitby, ON, Canada) were utilized at 1:1000 dilution: phosphorylated AMPKα at T172 (2535), AMPKα (5832), phosphorylated Akt at S473 (4060), Akt (9272), AURKA (14475), phosphorylated cdc2 at Y15 (CDK1, 4539), cdc2 (CDK1, 9116), phosphorylated cdc25C at S216 (4901), cdc25C (4688), phosphorylated γH2A.X at S139 (9718), cleaved PARP (9541), p53 (2527), PCNA (2586), PLK1 (4513) and WEE1 (13084). Antibodies for vinculin (V9264, 1:40,000), and actin (A2066, 1:20,000) were purchased from MilliporeSigma (Oakville, ON, Canada). The antibody for PAX8 (10336-1-AP, 1:500) was purchased from Proteintech (Rosemont, IL, USA). The HRP-conjugated secondary antibodies used were anti-rabbit IgG (NA934V, 1:10,000), anti-mouse IgG (NA931V, 1:10,000) or anti-rabbit FITC (F9887, 1:300) from MilliporeSigma (Oakville, ON, Canada).

2.6. Protein Isolation

Adherent cells at 80% confluency were washed with PBS and scraped into a modified radioimmunoprecipitation assay (RIPA) lysis buffer solution. Spheroids and organoids were collected into 15mL or 50 mL tubes, washed with cold PBS, spun down and then lysed using the same lysis buffer. Cells were stored at -80°C until the next day and then lysed with vortexing every 5 min. Lysates were centrifuged (21,000g, 4°C, 20 min) and supernatant was collected for protein analysis.

2.7. Immunoblotting

Protein lysates were prepared at 15-30μg per sample being mixed with modified RIPA buffer and resolved on 8-12% polyacrylamide SDS gels by electrophoresis at 100 volts and 120 volts each for 1 hour (total 2 hour running time) in running buffer. Proteins were transferred to a PDVF membrane (Bio-Rad, Mississauga, ON, Canada) for 1 hour at 100 volts in transfer buffer. Membranes were blocked with 5% skim milk or BSA in Tris-buffered saline-Tween 20 (TBST) for 1 hour at room temperature. The protein-specific primary antibodies were diluted in 5% BSA + TBST, except for p53 and cdc2 which used 5% skim milk + TBST, and incubated overnight at 4°C with gentle agitation. Membranes were incubated for 1 hour at room temperature with a secondary antibody in 5% BSA + TBST. Protein detection was achieved through a chemiluminescence reagent and imaging was performed using the Chemidoc™ MP 7 System (Bio-Rad, Mississauga, ON, Canada). Densitometric analyses were performed using ImageLab™ 6.1 Software (Bio-Rad, Mississauga, ON, Canada).

2.8. Hematoxylin & Eosin Staining

Intact spheroids and organoids were washed with cold PBS and then fixed with 10% Formalin for 15 minutes. The pellets were resuspended in 3% agarose in PBS, polymerized at 4 °C overnight, then placed into cassettes and processed through graded alcohols to paraffin. The embedded pellets in paraffin blocks were cut at 5µm sections onto charged slides (Thermo Fisher Scientific, Mississauga, ON, Canada) and H&E staining was performed. Images of H&E-stained sections were captured using an Aperio ScanScope slide scanner (Leica, Teaneck NJ, USA).

2.9. Immunohistochemistry

Previously archived formalin-fixed, paraffin-embedded blocks were sectioned at a thickness of 5 μm. Immunohistochemical staining for Antigen Kiel 67 (Ki67) with hematoxylin counterstaining was completed. Sectioning and staining were performed by the Molecular Pathology Core Facility at Robarts Research Institute (London, Ontario, Canada). Images of IHC stained sections were captured using an Aperio ScanScope slide scanner (Leica, Teaneck NJ, USA). Images of individual stained sections were exported using the ImageScope software package (Leica, Teaneck NJ, USA). Using ImageJ Software, the imaged slides were analyzed for staining intensity. Nuclei were masked using the Trainable Weka Segmentation plugin, and masked regions were counted using a minimum area of 100 and maximum area of 1000 pixels2. Each pixel was graded based on the staining intensity as high positive (0-60), positive (60-120), low positive (120-180) and negative (>180) groups.

2.10. Immunofluorescence

Intact spheroids and organoids were collected into 50mL conical tubes and allowed to settle passively. Using Cryomatrix (Thermo Fisher Scientific, Mississauga, ON, Canada), pellets were embedded in a 15x15x5mm disposable base mold (Thermo Fisher Scientific, Mississauga, ON, Canada). Blocks were cryosectioned at 7µm onto charged slides and tissues were fixed using 4% Neutral Buffered Formalin (Thermo Fisher Scientific, Mississauga, ON, Canada), permeabilized with 0.1% Triton-X100 in PBS and blocked with 5% BSA in 0.1% Triton-X100 PBS. Primary antibodies were diluted in blocking solution and incubated overnight at 4°C. Secondary antibody was diluted in blocking solution and incubated for 1 hour at room temperature. Alexa Fluor Phalloidin (Thermo Fisher Scientific, Mississauga, ON, Canada) at 1:40 dilution was incubated for 1 hour, then slides were mounted using VectaShield (Vector Laboratories, Newark, CA, USA) containing a 1:1000 dilution of DAPI (MilliporeSigma, Oakville, ON, Canada). Fluorescent images were captured using the Olympus AX70 upright microscope and ImagePro image capture software.

2.11. RNA Isolation

Spheroids and organoids were collected into 15mL or 50 mL tubes, washed with cold PBS, and pelleted. RNEasy Spin Column Kit (Qiagen, Toronto, ON, Canada) was used to isolate RNA and genomic DNA being removed by RNase-free DNaseI (Qiagen, Toronto, ON, Canada) both using the manufacturer’s instructions. RNA concentration, A260/280, and A260/230 were measured using the NanoDrop Microvolume Spectrophotometer (Thermo Fisher Scientific, Mississauga, ON, Canada).

2.12. Transcriptomic Analysis

For RNA sequencing analysis, isolated RNA from iOvCa spheroid and organoids (n=7) were collected in duplicate and sent to the London Regional Genomics Centre at Robarts Research Institute for library preparation. RNA quality was first confirmed using Agilent 2100 Bioanalyzer and sequencing was performed on an Illumina NextSeq using High Output 75 cycle sequencing kits. Raw sequencing reads were uploaded to the Galaxy platform and tested for quality using FastQC and MultiQC to measure the per base sequence quality, GC content, N content, overrepresented sequences, and adapter content. Reads were mapped to the human genome (hg38) using HISAT2. Differential gene expression was determined using DESeq2. Pathway analysis was performed by gene set enrichment analysis (GSEA) using all gene set collections from the Molecular Signatures Database, with focus on the Cancer Hallmark gene set.

2.13. Quantitative Reverse Transcription-(qRT)-PCR

Complementary DNA (cDNA) was generated from total RNA using the HighCapacity cDNA Reverse Transcriptase Kit (Thermo Fisher Scientific, Mississauga, ON, Canada) according to the manufacturer’s instructions. Reactions were completed using 1μg of RNA while using the MyCycler thermocycler (Bio-Rad, Mississauga, ON, Canada) with the following cycles: 25°C for 10 min, 37°C for 120 min, 85°C for 5 min, 4°C until sample retrieval. qRT-PCR was performed using the Brilliant II SYBR Green Master Mix (Agilent Technologies) according to the manufacturer’s instructions. Reactions were performed using a QuantStudio3 RT-PCR system (Thermo Fisher Scientific, Mississauga, ON, Canada) and data analysis using the QuantStudio Design and Analysis Software with the 2-ΔΔCT method for relative fold-change calculations. Primers were purchased from Invitrogen (Waltham, MA, USA) (Table S1).

2.14. Kinase Inhibitor Treatments

Adavosertib (10mM), Alisertib (20mM) and Volasertib (10mM) were purchased from Cedarlane (Burlington, ON, Canada) and reconstituted in dimethylsulfoxide (DMSO) and stored at -20°C until use. Adherent cells were seeded at 2x10⁴-6x10⁴ cells/well on 96-well standard tissue culture plates and treated 24 hours after plating for dose response curves. For spheroids and organoids, cells were seeded at 5 x10⁴ cells/well in 96-well round bottom ULA plates and in 10µL of Cultrex® BME on 96-well standard tissue culture plates with their corresponding media types and left for 3 days. Cells were treated with a 3-fold serial dilution of Adavosertib (0.001-10µM), Alisertib (0.01-100µM) or Volasertib (0.001-10 µM) for 72 hours. An alamarBlue™ assay (Thermo Fisher Scientific, Mississauga, ON, Canada) was completed for cell viability and raw data was normalized to DMSO or lowest drug concentration as the control.

2.15. Statistical Analysis

Graphs were generated using GraphPad Prism 10 (GraphPad Software, San Diego, CA, USA) and most data was expressed as mean±SEM. Student’s t-test or two-way ANOVA with a multiple comparisons test was performed, with results being considered significant at p<0.05. Specific details on graphs, statistical tests and significance values are provided in each figure legend.

3. Results

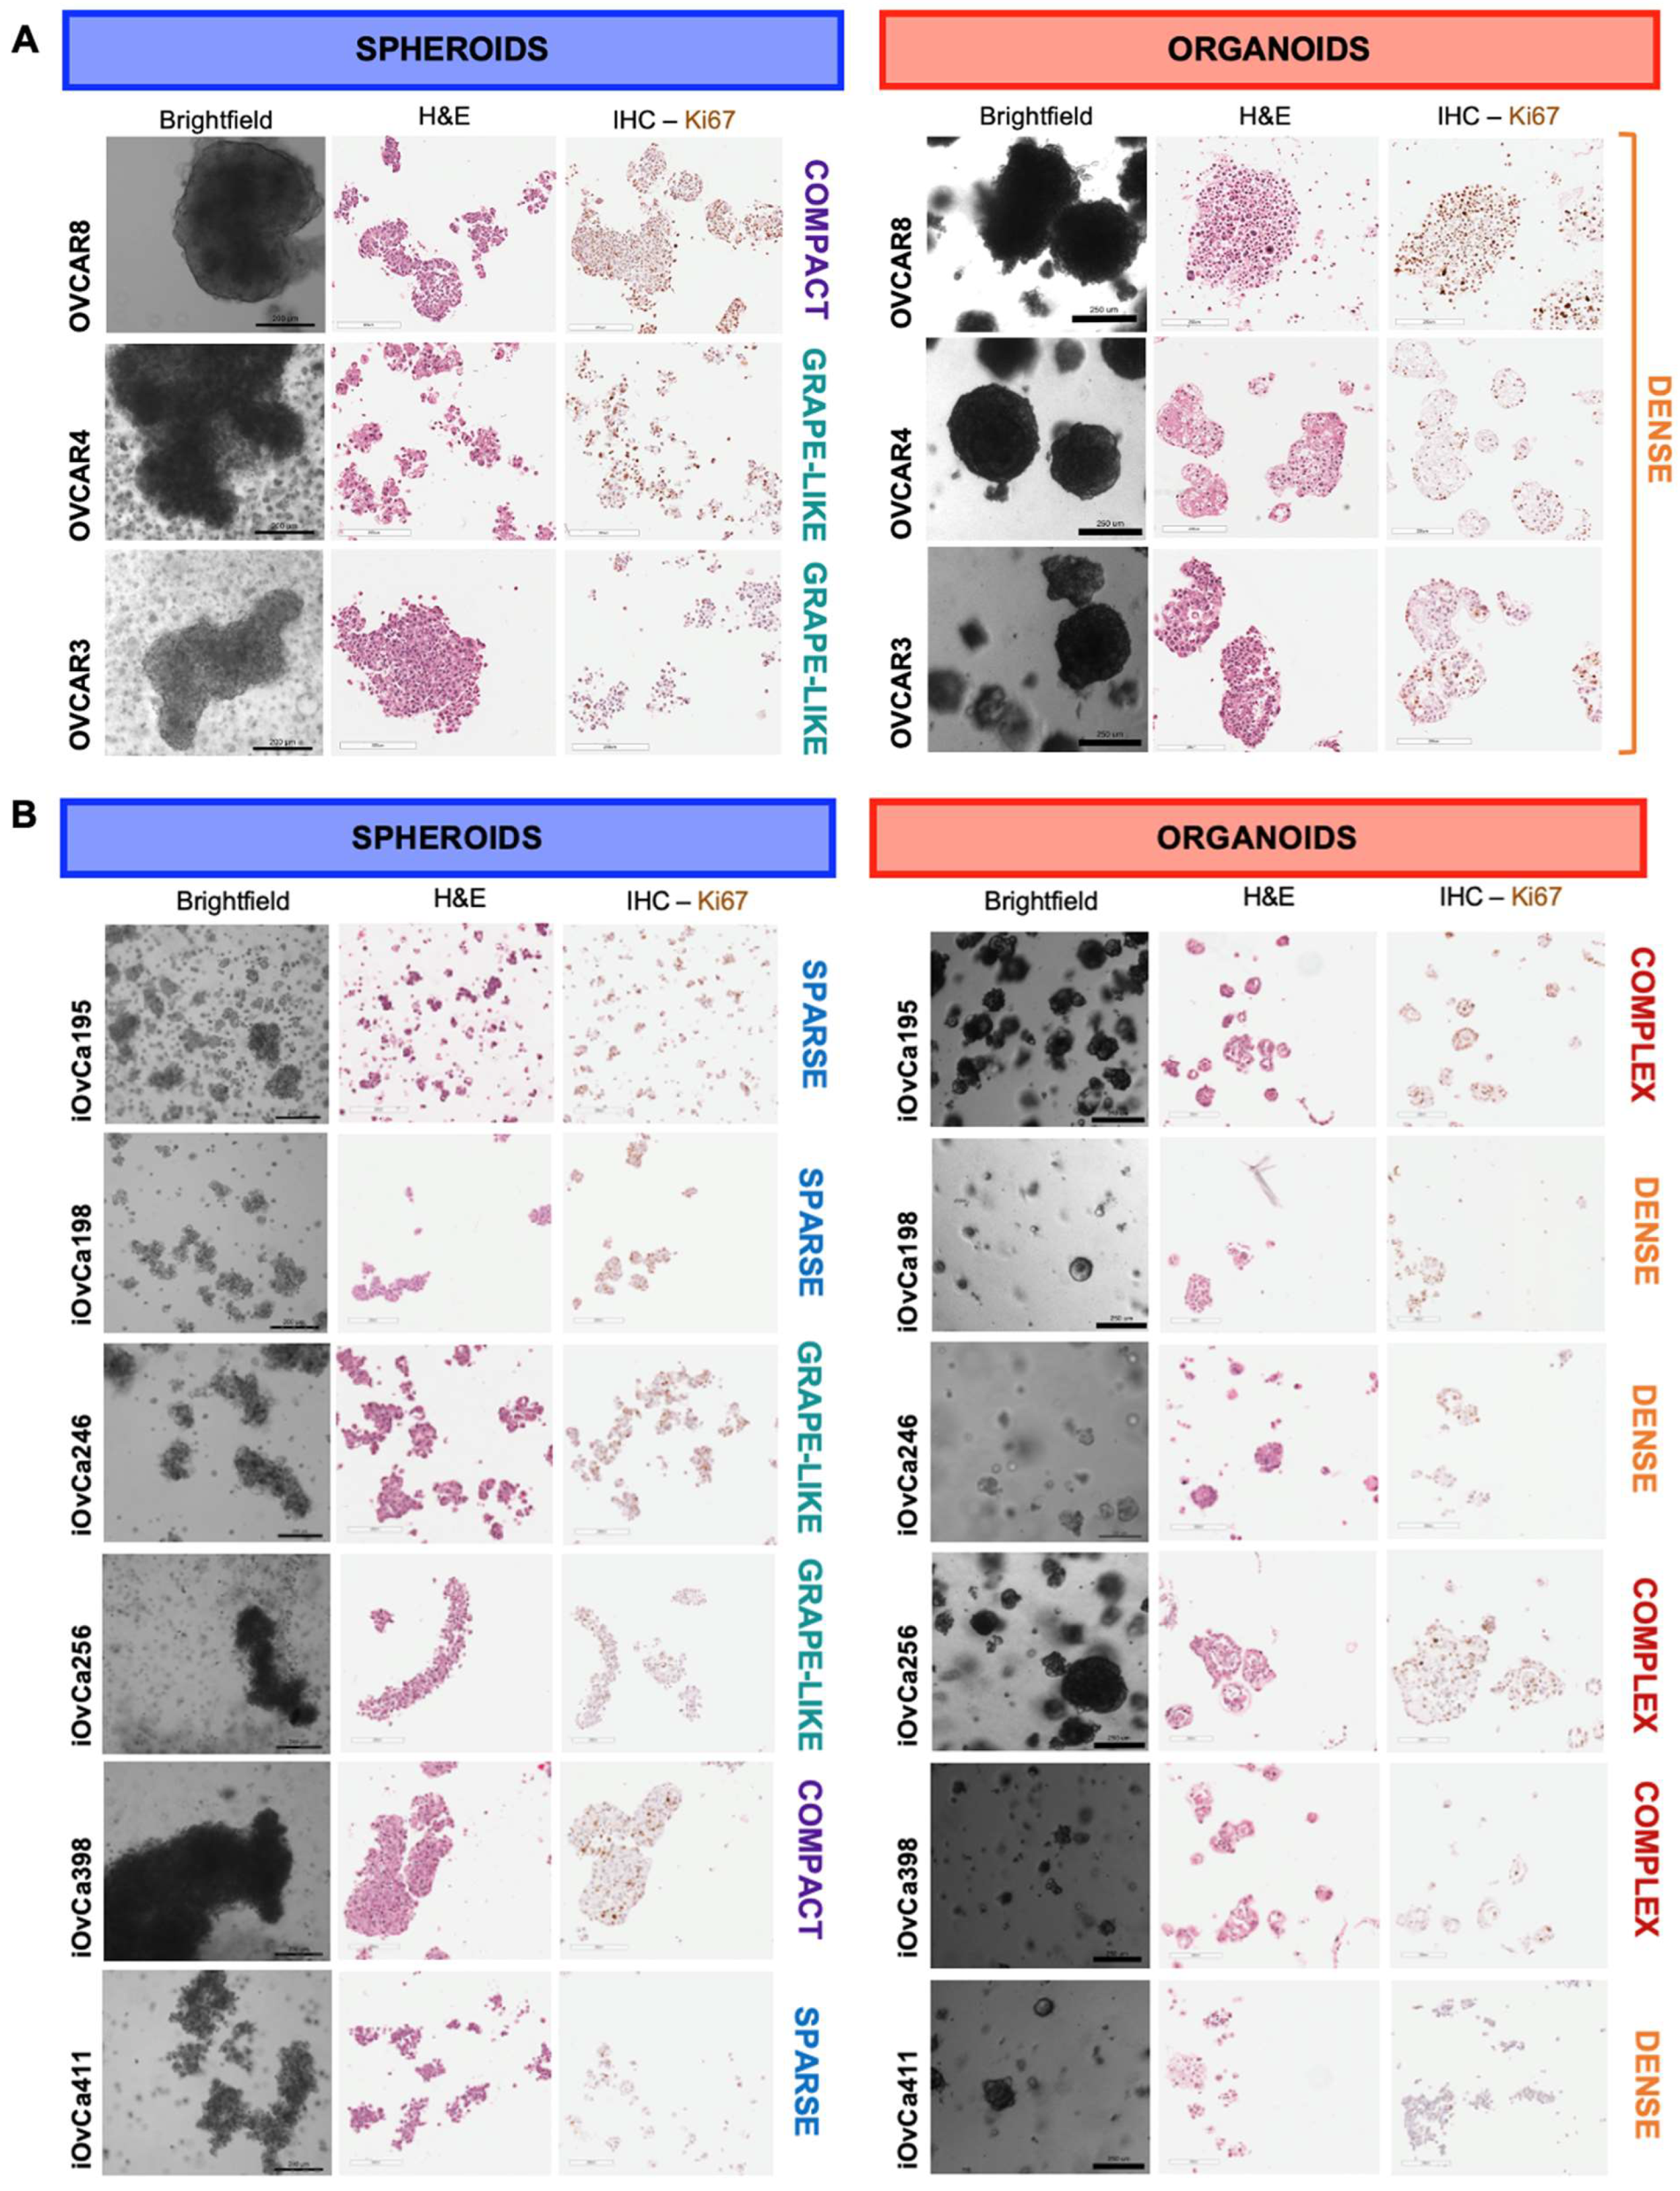
3.1. HGSOC cell lines showed distinct spheroid and organoid morphologies

To validate our culture systems for model development, three established HGSOC cell lines (i.e. OVCAR3, OVCAR4 and OVCAR8) were grown as spheroids on ULA plates and as organoids in Cultrex© BME with an EOC organoid specific media (Table S1). This was important in developing the appropriate culture conditions for the organoid model system in comparison to our suspension spheroid model. Brightfield imaging, as well as hematoxylin & eosin (H&E) staining on sections was conducted for these OVCAR cells lines for a morphological analysis of individual structures (Figure 1A). We characterized the spheroid morphologies based on the density of cellular aggregation as compact, grape-like or sparse clusters [12,20,23]. As expected, OVCAR8 cells formed large, compact spheroids, whereas OVCAR4 and OVCAR3 cells formed large, grape-like clusters as observed previously when studying HGSOC spheroid formation (Figure 1A). Comparatively, we characterized organoids as dense structures that appeared solid or complex structures that appeared as a disorganized mixture of cystic formations and cell clumps [34,44]. All the OVCAR cell lines formed similarly large, dense organoids. This uniform morphology was unexpected to other studies on EOC PDOs indicating a lack of heterogeneity within these established cell lines.
Thus, we incorporated our own patient ascites-derived immortalized cell lines (iOvCa) into this analysis. These cell lines were developed from patient ascites samples and passaged on standard tissue culture plates until immortalization as previously described [43]. Identical methods were conducted using six iOvCa cell lines after being cultured in these two model systems (Figure 1B). This was important to establish how these particular cells appear, grow and behave within these models as they have not been widely used in our previous research. Initially, we noted that the iOvCa spheroids and organoids appeared very heterogeneous with varying sizes and morphologies as seen in the brightfield and H&E-stained images (Figure 1B). Using the same categorizations above, the iOvCa398 cells appeared as compact spheroids, and the iOvCa246 and iOvCa256 cells adopted a grape-like structure. The remaining three cell lines (i.e. iOvCa195, iOvCa198 and iOvCa411) formed sparse clusters with abundant cellular debris indicating some cell death during spheroid formation [45,46]. Again the iOvCa organoids varied, where half of the cell lines appeared as dense (i.e. iOvCa198, iOvCa246, and iOvCa411) and the other half appeared complex with a sporadic mix of dense and cystic structures (i.e. iOvCa195, iOvCa256, and iOvCa398). In addition, iOvCa256 and iOvCa398 organoids appeared to have necrotic cores as seen upon H&E staining (Figure 1B). Overall, the spheroid and organoid morphologies largely varied, where the iOvCa cell lines better portrayed HGSOC heterogeneity than the OVCAR cell lines, and the organoids better resemble PDOs as published. Hence, we focused our analyses on the iOvCa cell lines moving forward.

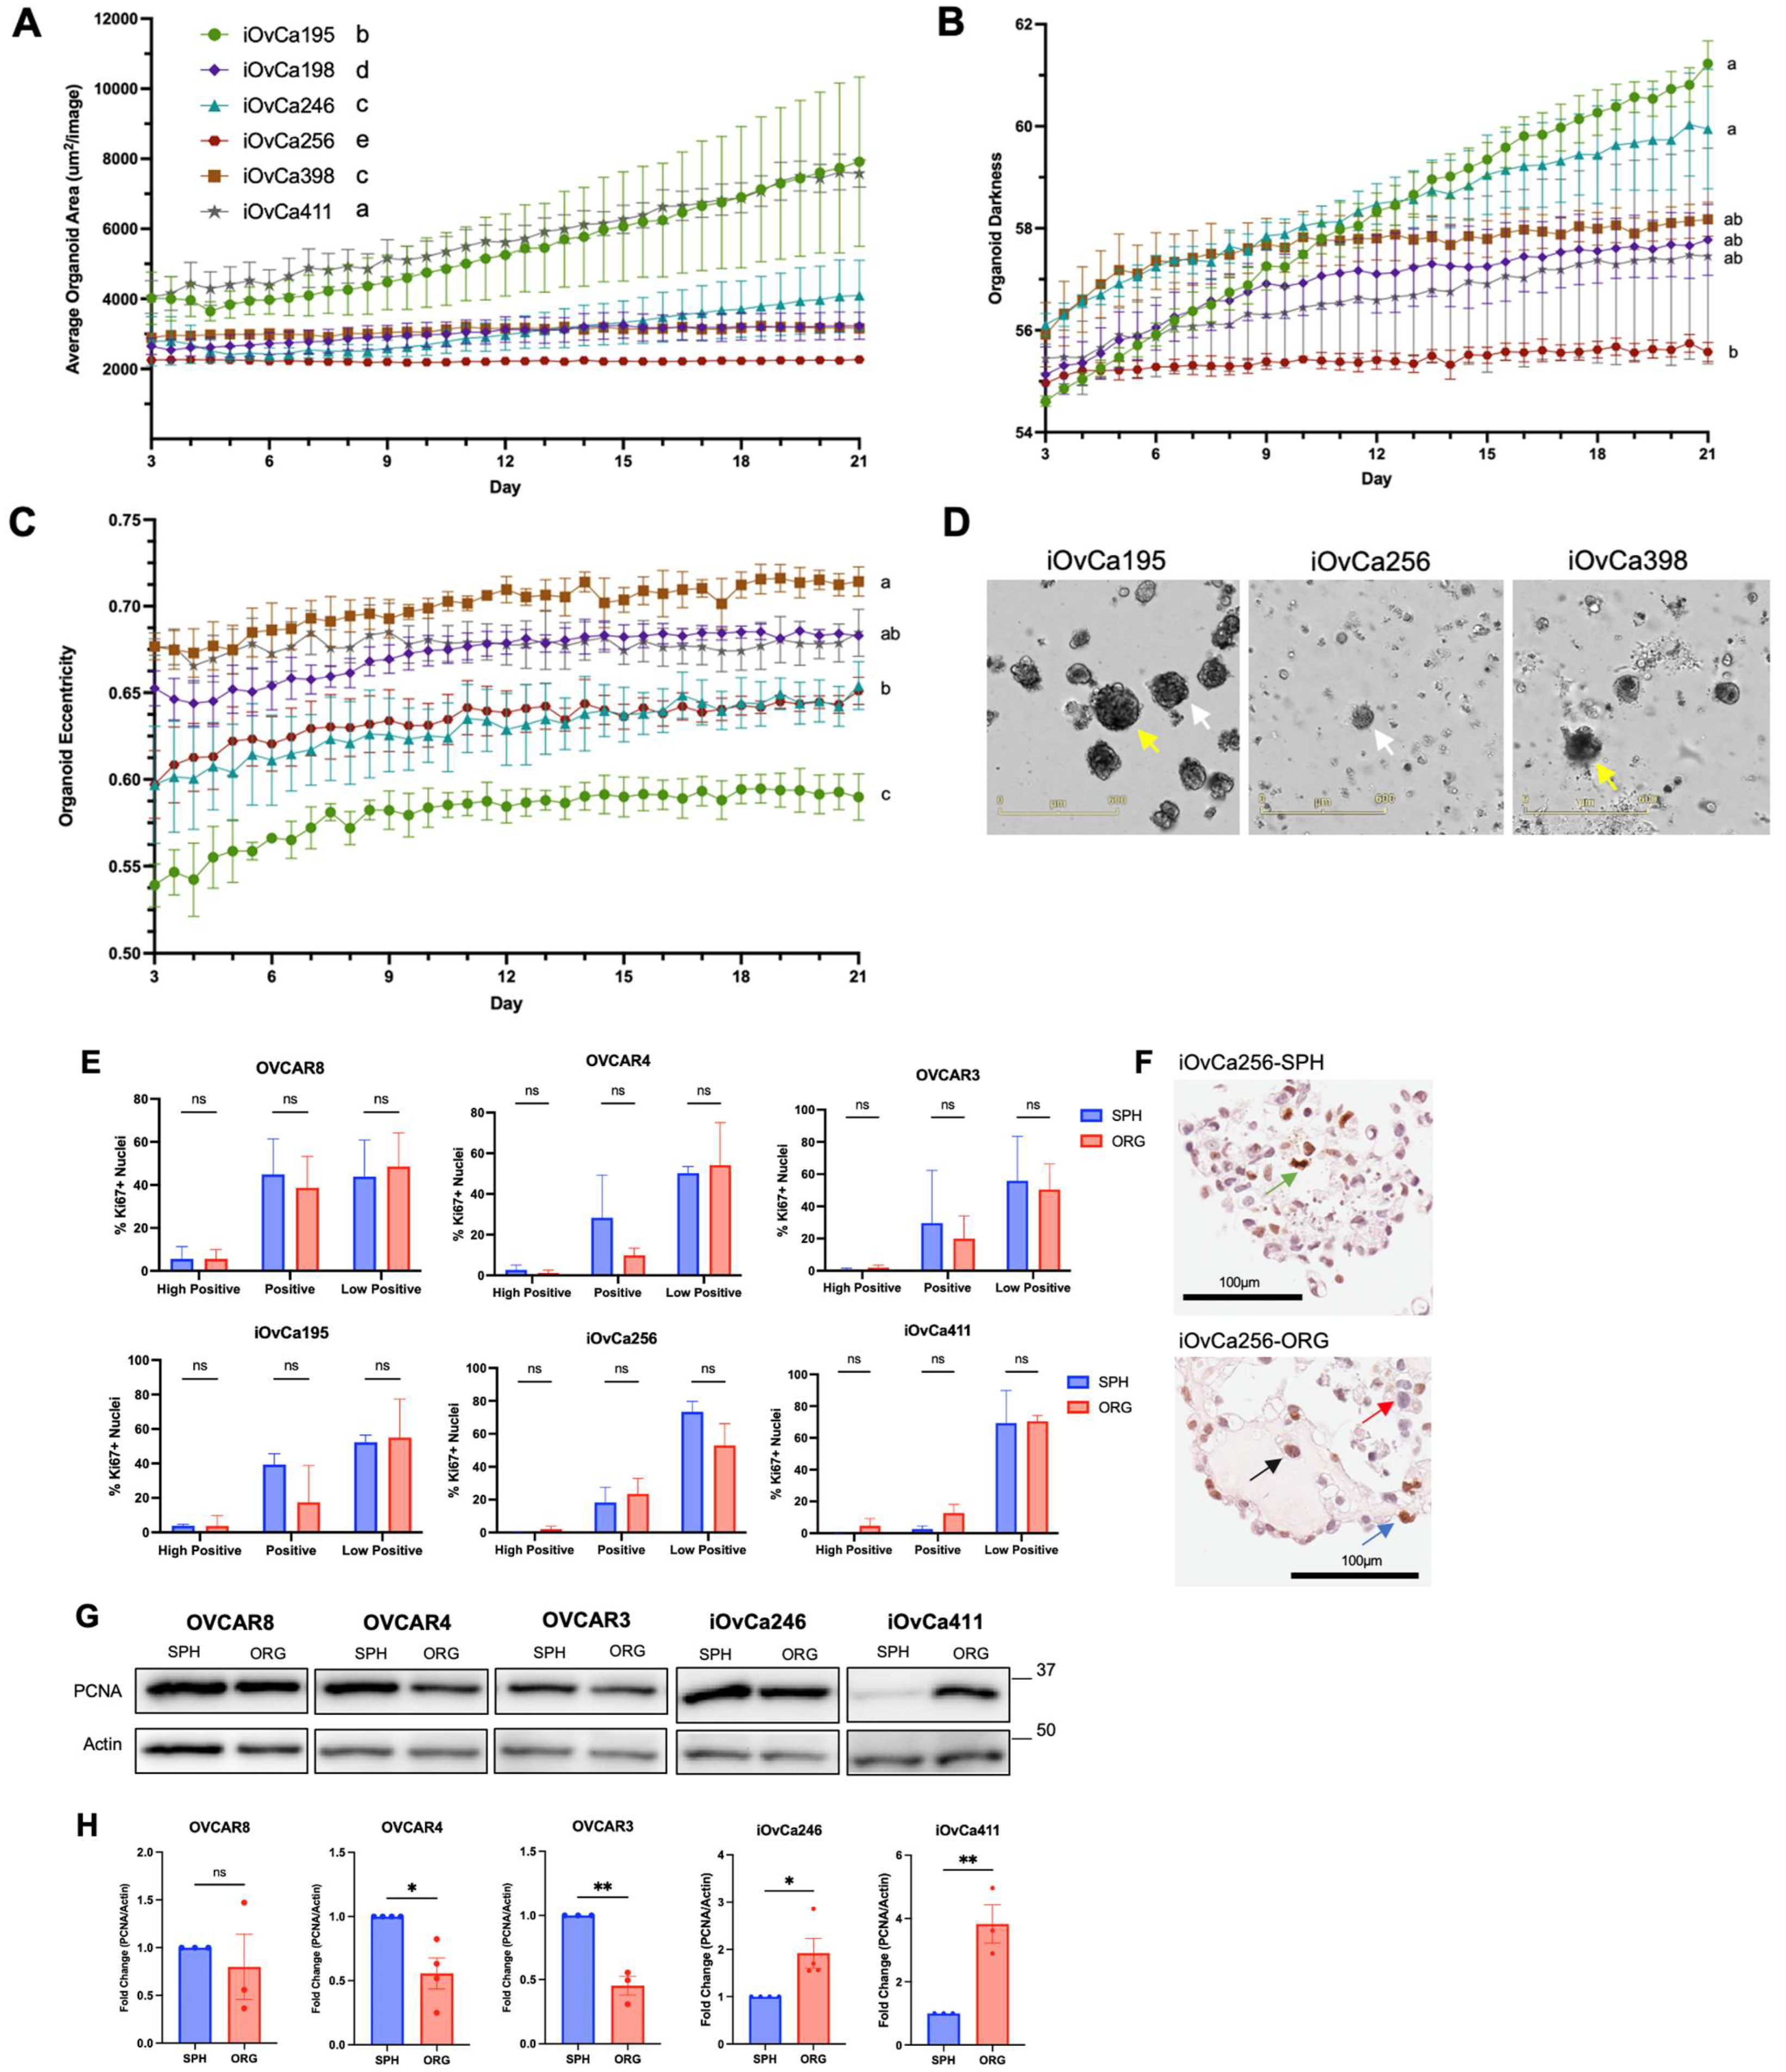
3.2. HGSOC organoid varying growth dynamics relate to morphology

Since our previous 3D models using spheroids in suspension have showed a dormancy phenotype in comparison to 2D adherent culture, we wanted to determine whether spheroids differ to organoids in a similar manner. As well, organoids have become a popular model system in cancer research, and it is imperative to understand organoid growth dynamics in the context of EOC which is not well known. The results showed that the iOvCa cell lines demonstrated great heterogeneity with organoid growth. The iOvCa195 cells formed the most organoids and iOvCa198 cells formed the least after 3 weeks of culture (Figure S2A). The largest organoids were greater than 20,000µm2 in individual organoid area (i.e. iOvCa246), the smallest were less than 5000µm2 (i.e. iOvCa198, iOvCa398, and iOvCa411) and the rest had an organoid size in between 10,000-15,000µm2 in area (i.e. iOvCa195 and iOvCa256) (Figure S2B). Although when observing growth over time, total organoid number often reached a maximum by day 3 in culture indicating that the capacity to form an organoid was established by that time point (Figure S2E). As predicted, total organoid area had a steady increase from Day 1 for iOvCa195, iOvCa246 and iOvCa411 cells, yet the other three cell lines plateaued after day 3-6 in culture (Figure S2F). Furthermore, we calculated average organoid area, based on organoid number and total organoid area measurements, which was a more accurate demonstration of each cell line having its own unique linear growth rate (Figure 2A; Video S1). Of note, the iOvCa195 and iOvCa411 lines had the greatest increase in average organoid area over time. All iOvCa growth rates, based on a simple linear regression analysis, were significantly different from each other, except for iOvCa246 and iOvCa398 which both have a similar morphology. Moreover, we incorporated organoid darkness and organoid eccentricity characteristics as another way to quantify HGSOC organoid morphology. Organoid darkness gradually increased over time in each cell line, with significantly different endpoint values. Correlating these values to morphology, iOvCa246 organoids had the second high darkness value (59.9±1.2) which could indicate a dense morphology; in contrast, iOvCa256 organoids had the lowest value (55.6±0.2) in conjunction with a complex morphology and necrotic centre (white arrows; Figure 2B,D). However, the other four cell lines had inconsistent darkness values that did not match their designed morphology. Eccentricity of iOvCa organoids also gradually increased over time for each cell line, indicating that the organoids become more irregularly shaped as they grow (Figure 3E). The cell lines were grouped based on their endpoint organoid eccentricity values to categorize them into two shapes, where a value greater than 0.6 had an irregular shape like iOvCa398 organoids with the highest value of 0.714±0.008 or regular with a value of less than 0.6 like iOvCa195 organoids with the lowest value of 0.590±0.013 (yellow arrows; Figure 3E,F). Taken together, there is clear heterogeneity in iOvCa organoid growth characteristics that can easily be quantified through various methods. In contrast, the OVCAR cell lines had the largest organoids based on number and size after 3 weeks of growth (Figure S2A-C). With growth over time, the OVCAR cell lines had no significant differences with organoid number, total organoid area, and average organoid area (Figure S3A-C). However, OVCAR4 did have a higher darkness value which is apparent in the brightfield images (Figure S3D,F). Based on the organoid growth characteristics, this indicates that the OVCAR cells lines are not an accurate representative model for observing the heterogeneity seen in HGSOC.
To gain more knowledge on the 3D structure of spheroids and organoids, quantification of Ki67 immunohistochemistry (IHC) was completed to assess cell proliferation. Ki67 staining was grouped based on pixel intensity as high positive (0-60), positive (60-120) and low positive (120-180). Unexpectedly, there were no significant differences in Ki67-positive (Ki67+) nuclei between spheroids and organoids in the different Ki67 staining intensity groups (Figure 2E,F). To further validate these findings, immunoblots were conducted for proliferative cell nuclear antigen (PCNA). The results showed that iOvCa246 and iOvCa411 organoids had higher PCNA protein levels than their spheroids (Figure 2G,H). Although, the remaining iOvCa cell lines showed no significant differences in PCNA levels, matching the Ki67 staining data (Figure S2G,H). Interestingly, the OVCAR4 and OVCAR3 spheroids had higher PCNA protein levels than their organoids (Figure 2G,H). Again, reaffirming their deviation from patient associated HGSOC phenotypes. Overall, these results using two standard cell proliferation markers indicate that there are very little differences between spheroids and organoids in their proliferation status.

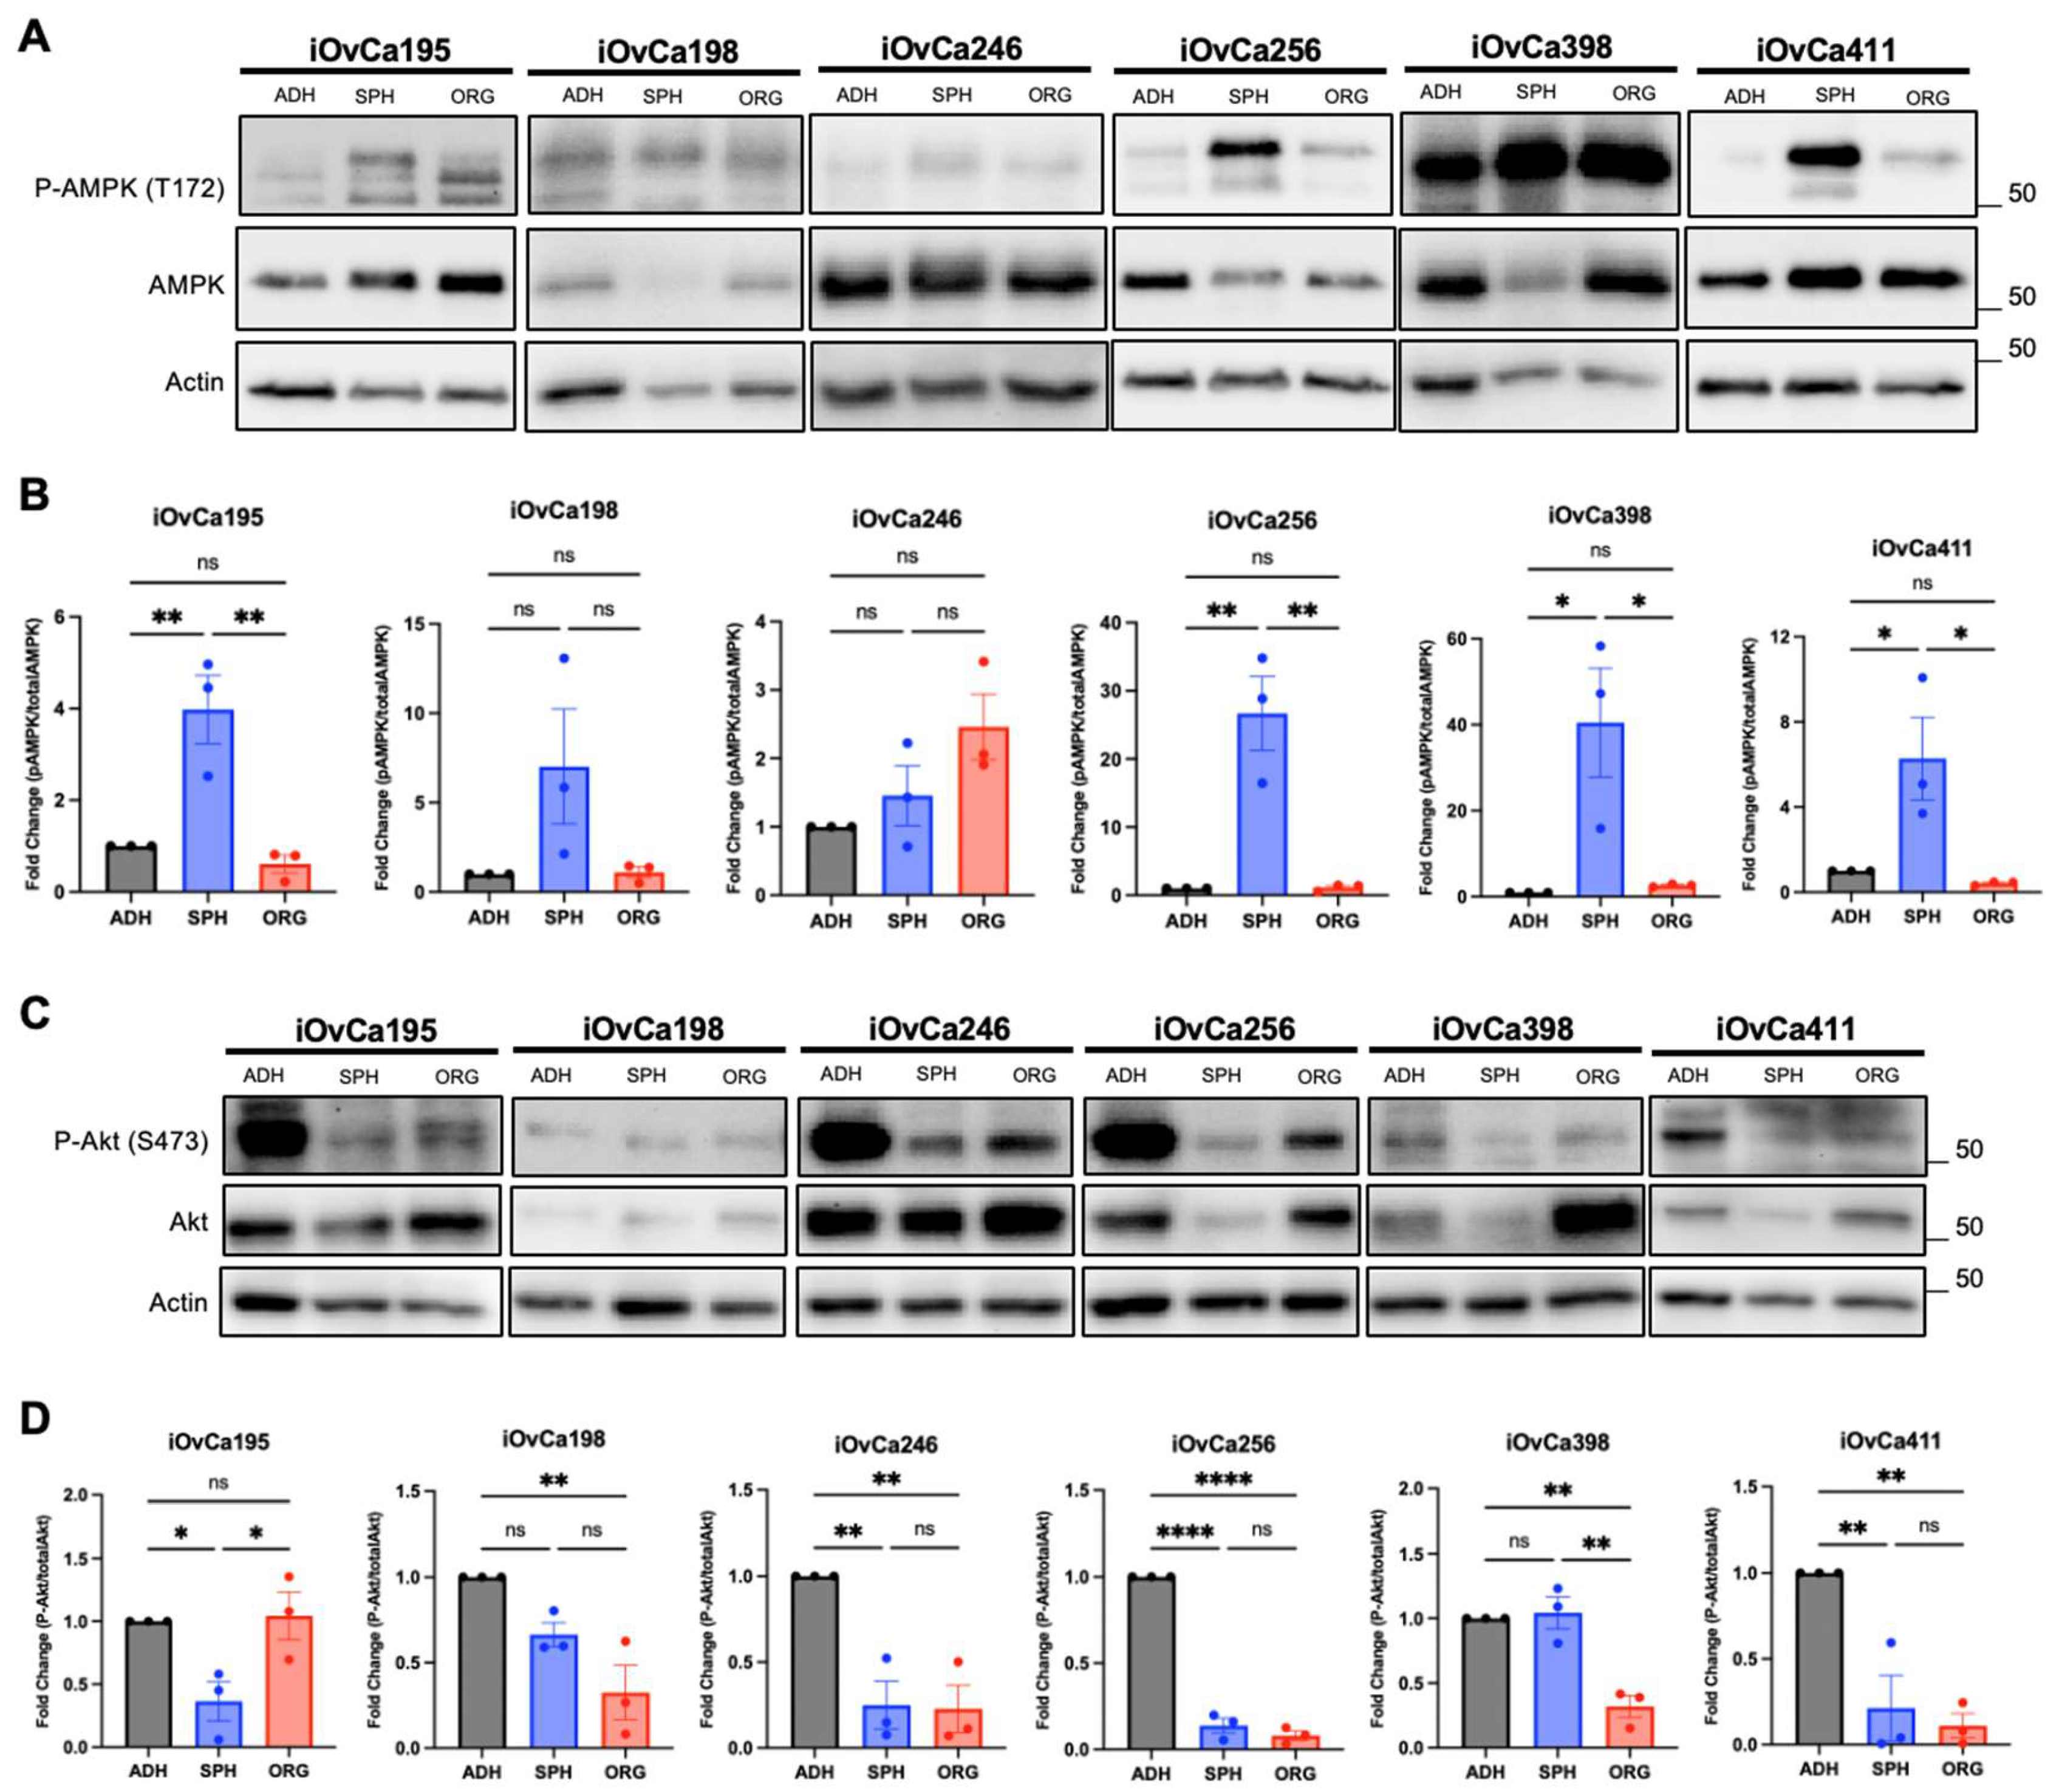
3.3. Altered AMPK and Akt signaling in HGSOC spheroids and organoids indicates biological switching

Previously, we determined the pathways involved in spheroid formation, including cellular quiescence, bioenergetic stress and autophagy, that indicated a switch to dormancy [15,16]. However, we only have knowledge on the molecular differences between adherent and spheroid models and have not assessed these pathways in organoids. As of now, it is not clear whether organoids may differ from spheroids in terms of proliferation and growth. Thus, we observed AMPK, a known kinase that is highly active during the bioenergetic stress response and is required for cell survival during spheroid formation [23,24]. The iOvCa cell lines showed >4-fold increase in phosphorylated-AMPK (P-AMPK) levels at T172 in spheroids compared to adherent and organoid cultures (Figure 3A,B). The exceptions were iOvCa198 and iOvCa246 cells with no significant difference in levels of P-AMPK in all culture conditions, but iOvCa198 cells seem to follow a similar trend with potentially higher levels in spheroids. To address whether differences in culture media composition may contribute to signaling changes, particularly with the additional supplements in the EOC organoid specific media, we cultured spheroids in this media to assess AMPK protein levels. Indeed, we observed similar P-AMPK protein levels between spheroids grown in each media indicating at least this difference in culture conditions has no effect on AMPK pathway activity (Figure S4). This suggests that AMPK is important during spheroid formation in a majority of iOvCa cell lines and not necessarily for organoid growth. Conversely, we saw a dramatic increase (>10-fold) in P-AMPK levels in the OVCAR8 and OVCAR4 organoids compared to adherent cultures, while still having high levels in spheroids (Figure S3G,H). As well, OVCAR3 cells had no significant differences between any culture models, similar iOvCa198 cells. This reiterates that the iOvCa cell lines better demonstrate HGSOC molecular signaling changes.
Next, we interrogated the phosphorylation status of Akt, a prominent kinase downregulated during spheroid formation as cells switch from a proliferative phenotype to a quiescent or dormant phenotype [20,25,26]. As predicted, there was a significant decrease in phosphorylated-Akt (P-Akt) at S473 in most iOvCa cell lines from adherent to spheroid cultures, except in iOvCa198 and iOvCa398 lines which had similar levels (Figure 3C,D). Interestingly, iOvCa195 cells showed no significant difference in P-Akt in organoids compared to adherent cultures, while the rest had decreased levels in organoid cultures. As well, only iOvCa195 and iOvCa398 cell lines showed significant differences between their spheroid and organoid P-Akt levels but with opposites trends (Figure 3C,D). Similarly, the OVCAR cell lines all showed decreased P-Akt levels from adherent to spheroid cultures, but varying levels in organoids (Figure S3I,J). OVCAR8 and OVCAR3 levels showed similar spheroid and organoids levels, while OVCAR4 organoids were higher organoid P-Akt to both adherent and spheroid levels. In conclusion, these results display the different molecular signaling activity between our HGSOC spheroids and organoids and demonstrate the potential of HGSOC cells to transition their cell signaling behaviors depending on their 3D culture state. Based on the above results, there is a lack of consistency in the differences between spheroid and organoid molecular signaling activity in terms of dormant to proliferative switching. Therefore, a comprehensive transcriptomic analysis may better elucidate the underlying biology of HGSOC spheroids and organoids.

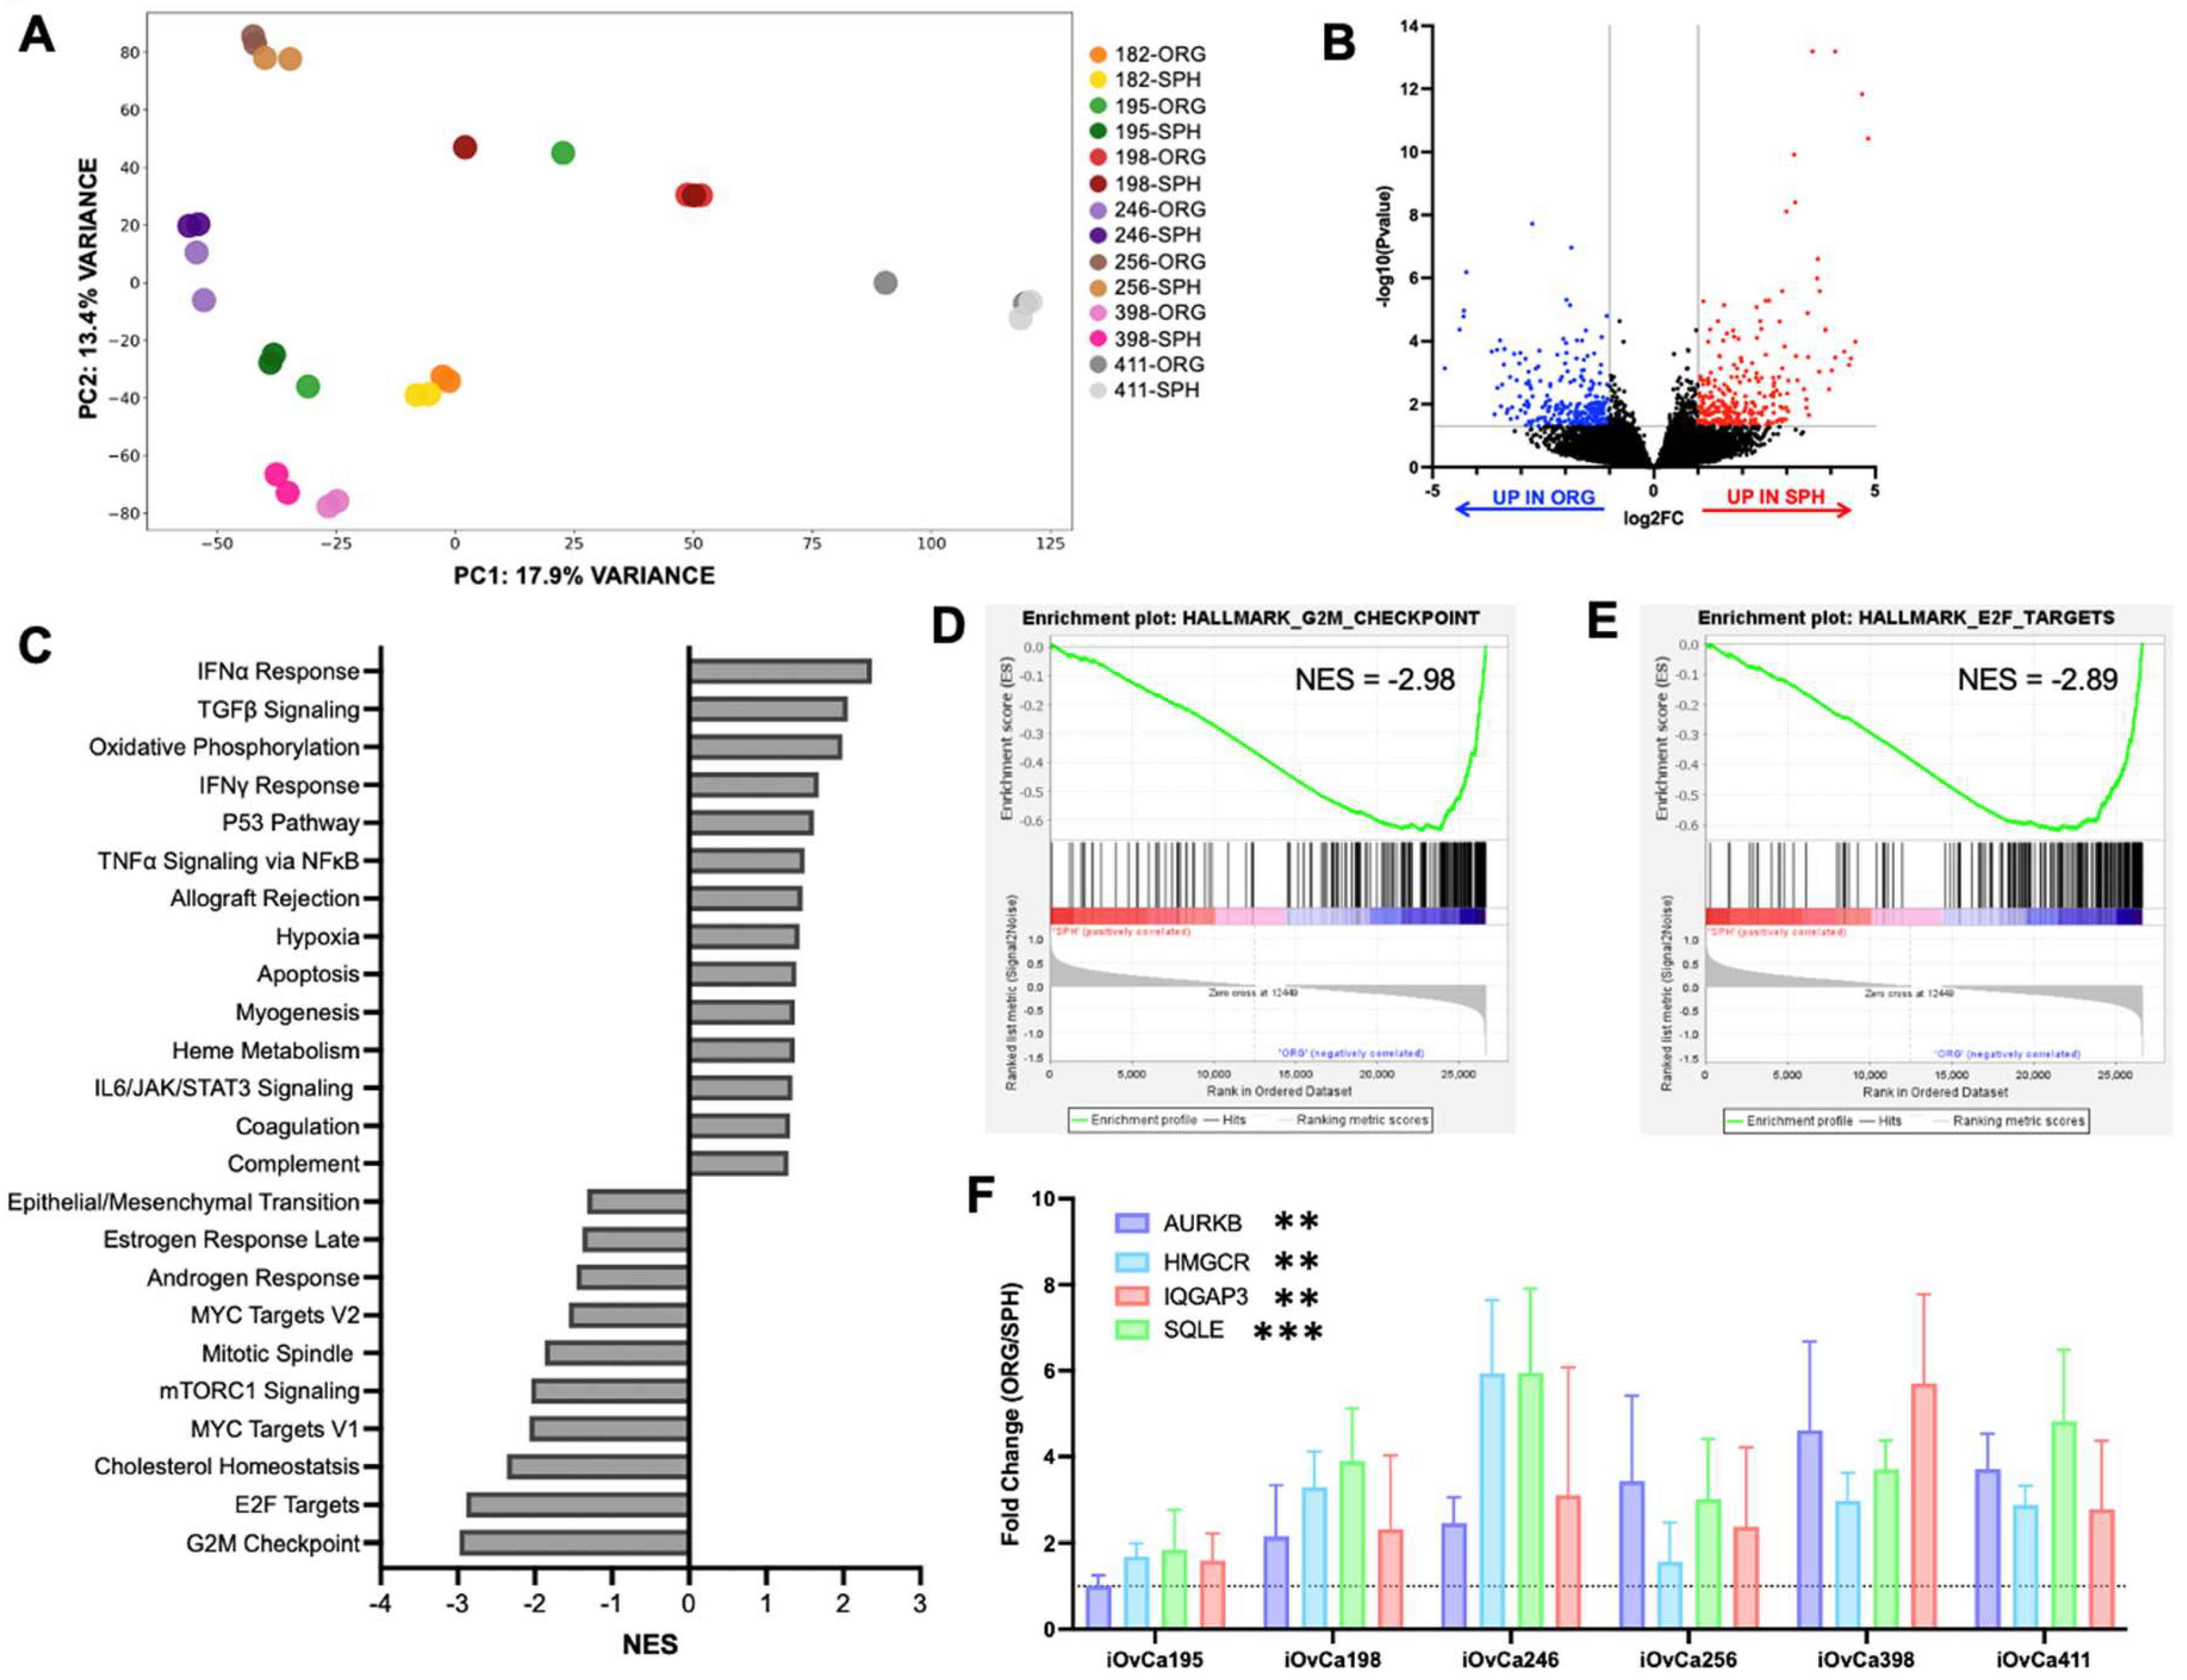
3.4. Differential gene expression between HGSOC spheroids and organoids

We postulate there are likely many different intracellular signaling programs altered in spheroids and organoids that could control their growth and morphology beyond those interrogated previously. Hence, we conducted bulk RNA-sequencing analysis on spheroids and organoids using seven iOvCa cell lines. Principal component analysis (PCA) revealed clustering based on cell line rather that culture condition, with only a few single sample outliers seen in iOvCa195-ORG, iOvCa198-SPH and iOvCa411-ORG samples (Figure 4A). This most likely reflects that each cell line recapitulates the original patient source and associated genotype. Differential gene expression analysis was also conducted to identify the top upregulated genes in spheroids and in organoids across all cell lines (Figure 4B). There were similar number of genes significantly expressed in each model where 265 were upregulated in organoids in comparison to 280 upregulated in spheroids. Based on this differential expression, gene set enrichment analysis (GSEA) was completed to identify significantly elevated pathways in the Cancer Hallmarks Collection (Figure 4C). We found fourteen pathways up in spheroids and ten pathways up in organoids (FDR<0.05). Based on our previous work on HGSOC spheroid formation in comparison to adherent cultures, we anticipated to see similarly regulated pathways in our iOvCa spheroids. This was confirmed with TGFβ signaling and oxidative phosphorylation Cancer Hallmark pathways being in the top 3 elevated pathways in spheroids [21,47,48].
Since we have copious knowledge on the intercellular signaling changes that occur in spheroids, we pursued the pathways identified in organoids as our interrogations into pathway analysis is more limited. More specifically, we chose G2/M checkpoint and E2F target pathways because their normalized enrichment scores were the highest of -2.98 and -2.89, respectively (Figure 4D,E). This was intriguing as these cancer hallmark pathways are both involved in cell cycle regulation, which we speculate is crucial for actively growing organoids, even though we noted little difference in cell proliferation in previous data [49,50,51]. To further characterize these pathways, validation of the RNA-sequencing results was conducted with genes relevant to the G2/M checkpoint pathway (i.e. AURKB, HMGCR, and SQLE) and E2F target pathway (i.e. AURKB and IQGAP). Based on transcript expression, there is a clear significant increase in gene expression from spheroids to organoids for nearly all cell lines (log2FC<-1) indicating these pathways may be important for cell growth in organoids (Figure 4F).

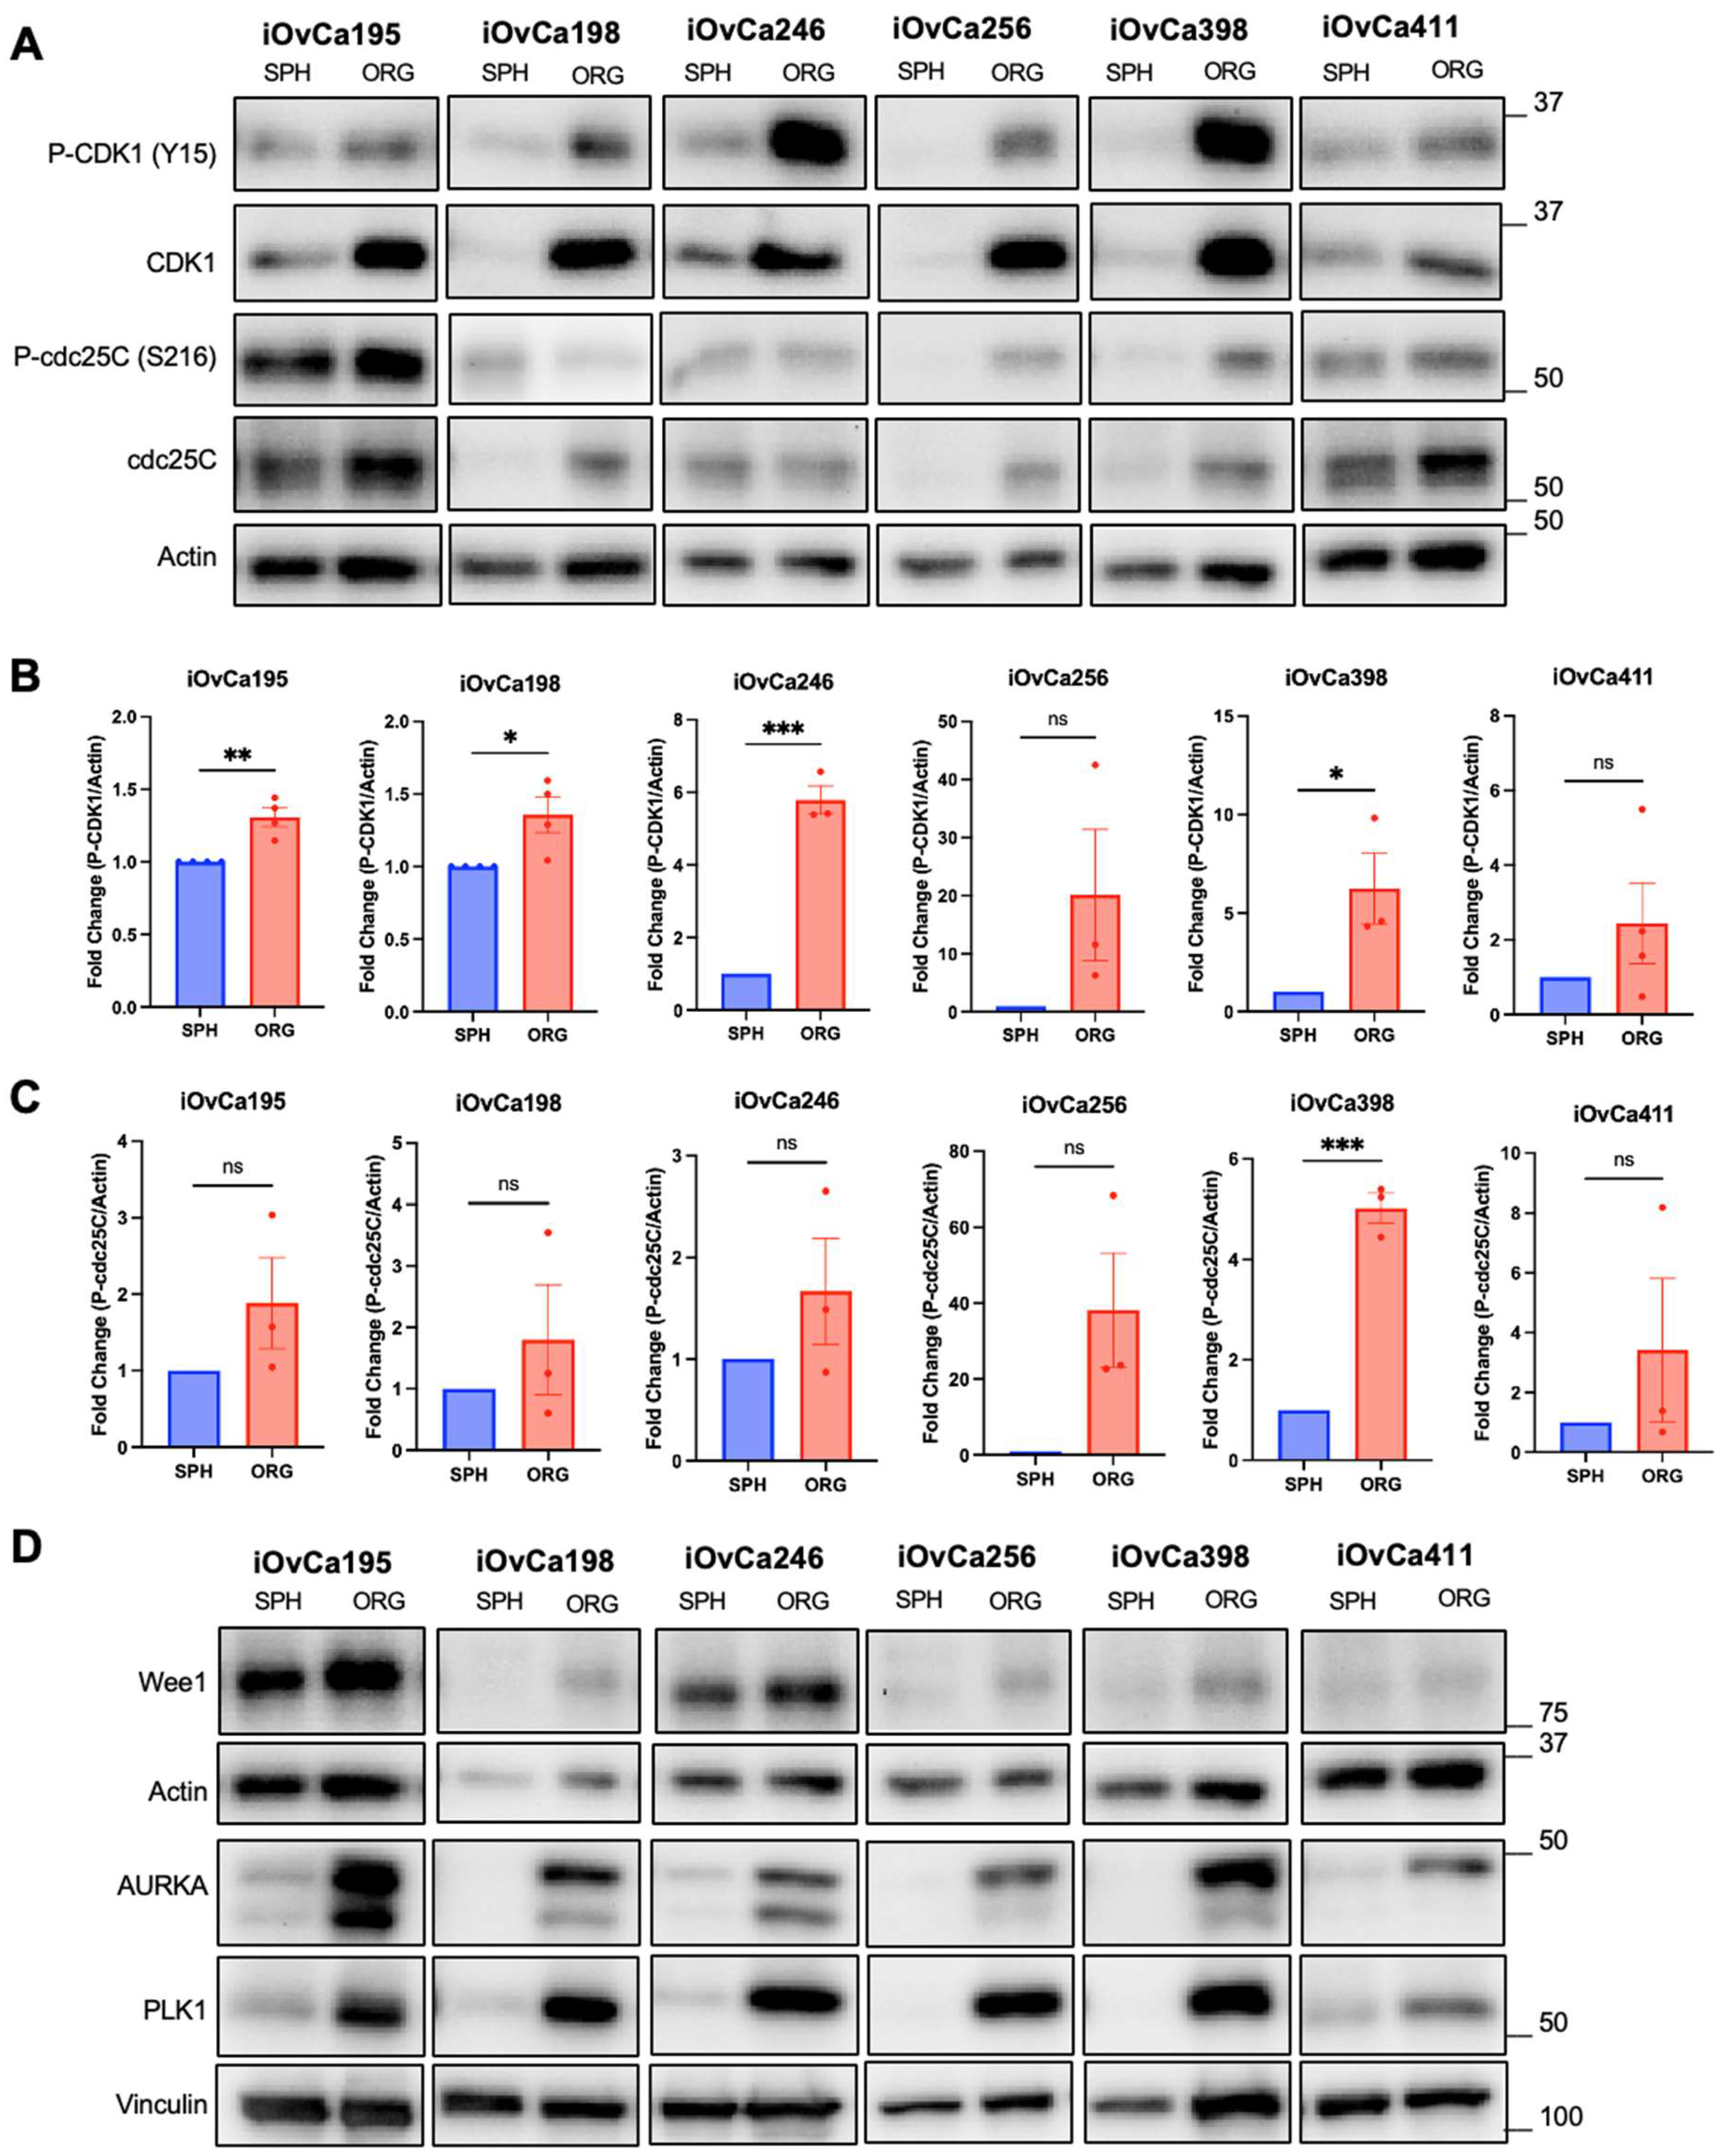
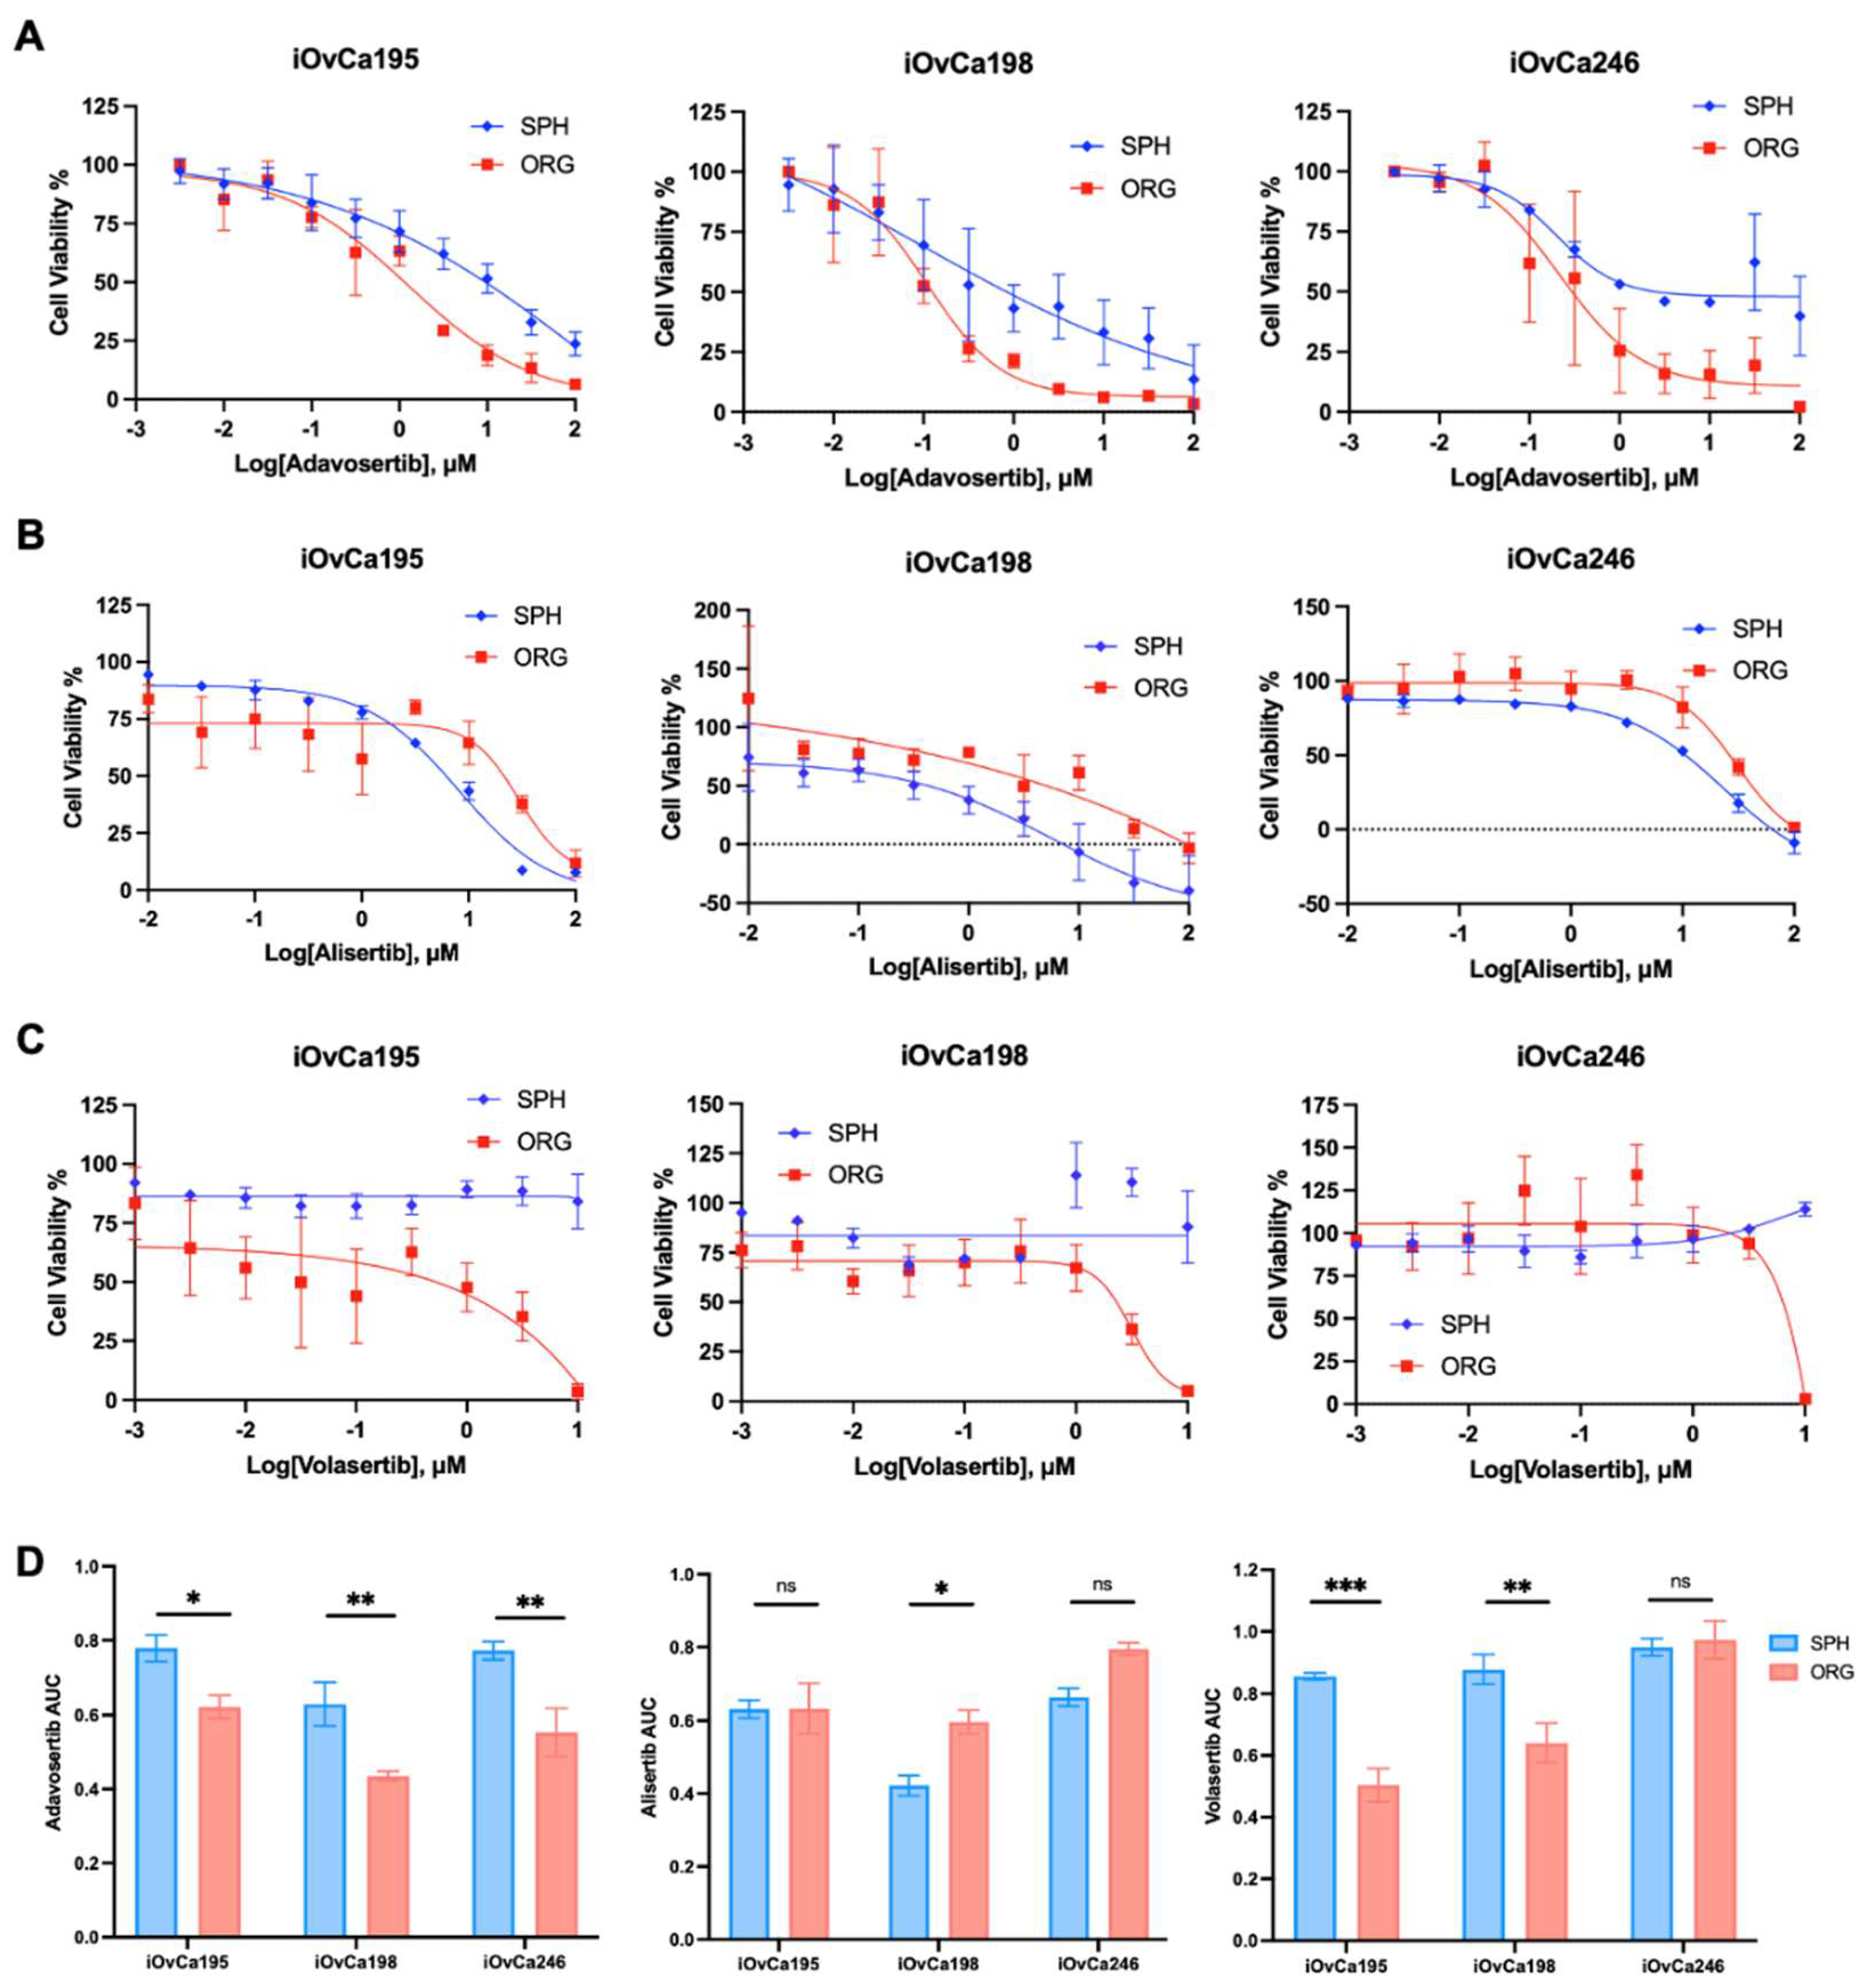
3.5. G2/M checkpoint is a key regulatory pathway in HGSOC organoids

To confirm the G2/M checkpoint pathway is important for organoid growth rather than spheroid cell survival, we first assessed the activity of key proteins involved in this pathway. At the G2/M checkpoint, cell division cycle 25C (cdc25C) is phosphorylated at S216 to sequester it, preventing transition into mitosis [52,53]. When the cells are ready to progress into mitosis, active cdc25C dephosphorylates cyclin-dependent kinase 1 (CDK1) at Y15 so that it can bind to Cyclin B1 for activation of mitosis. Thus, we determined the baseline levels of phosphorylated-CDK1 (P-CDK1) and phosphorylated-cdc25C (P-cdc25C) in the iOvCa cell lines to indicate proper G2/M checkpoint regulation. The results demonstrated significantly higher levels (>1.25-fold) of P-CDK1 in organoids compared to spheroids, except in iOvCa256 and iOvCa411 lines (Figure 6A,B). In contrast, only one cell line (i.e. iOvCa398) had increased P-cdc25C levels in organoids as compared with spheroids, and the remaining cell lines had a similar trend yet without a significant difference (Figure 6A,C). As well, we assessed the expression levels of other proteins involved in directly regulating the activity of cdc25C and CDK1, including aurora kinase A (AURKA), polo-like kinase 1 (PLK1) and Mitosis inhibitor protein kinase Wee1 (Wee1). The iOvCa cell lines seem to have relatively similar levels of Wee1 between spheroids and organoids, yet very high levels of AURKA and PLK1 in organoids compared to spheroids (Figure 6D). Therefore, a higher expression of these proteins in organoids indicates elevated G2/M checkpoint cell cycle regulation.
To determine if cells within organoids rely on G2/M checkpoint for cell survival more than within spheroids, we chose to selectively inhibit three regulatory proteins in this pathway (i.e. AURKA, PLK1, Wee1). Blocking CDK1 activity was accomplished with the Wee1 inhibitor, Adavosertib, while impeding cdc25C activity was accomplished with either an AURKA inhibitor, Alisertib, or a PLK1 inhibitor, Volasertib [54,55,56]. All these inhibitors have already shown anti-tumor effects in preclinical experiments and have ongoing Phase I/II clinical trials with ovarian cancer patients alone or in combination with chemotherapy [57,58]. We first assessed the IC50 values for each of the compounds in our lines in standard adherent culture to evaluate our results as compared with previous publications (Figure S5A). The activity of these inhibitors was validated through the accumulation of P-CDK1 and P-cdc25C with treatment of each inhibitor compared to DMSO control (Figure S5B). We also observed an increase in DNA damage marker gamma H2A histone family member X (γH2A.X) and an increase in apoptosis marker cleaved PARP under treated conditions with the lowest adherent IC50 value (Figure S5B). When comparing the spheroid and organoid dose response curves, we found that there are significantly different sensitivities to these inhibitors between model systems. Spheroids were consistently less sensitive to the Wee1 inhibitor Adavosertib than organoids in all three iOvCa cell lines that we tested (Figure 7A). Additionally, there were no cytotoxic effects on spheroids treated with the PLK1 inhibitor Volasertib as compared to organoids, except for iOvCa246 cells which showed no difference in sensitivity between spheroids and organoids (Figure 7C). However, when spheroids and organoids were treated with the AURKA inhibitor Alisertib, they either had no difference in sensitivity or showed the opposite trend with organoids being less sensitive than spheroids as observed with the iOvCa198 line (Figure 7B). To quantify and perform statistical analysis of drug sensitivities between spheroids and organoids, we used area under the curve (AUC) calculations. The AUC for Adavosertib and Volasertib shows a clear significant difference in sensitivity between organoids and spheroids, where spheroids are less sensitive (Figure 7D). Again, the AUC for Alisertib shows no significant difference in sensitivity for iOvCa195 and iOvCa246 cells, but the opposite trend for iOvCa198 cells where spheroids are more sensitive than organoids (Figure 7D). To conclude, G2/M checkpoint regulation is critical for organoid cell survival rather than spheroid cell survival in EOC. This corresponds to our previous results that indicate spheroids are more dormant and our organoids are more proliferative, and targeting this biological switch could pose as a novel therapeutic strategy for HGSOC.

4. Discussion

HGSOC is known to be a very heterogeneous disease which complicates treatment options for patients [59,60,61]. The unique biological changes that occur during the metastatic process has not been well elucidated in the context of 3D cell-cell interactions. To understand this complex biology, 3D in vitro culture model systems should be incorporated into our research protocols. Here, we employed an EOC organoid model system in conjunction with the spheroid model system. We found that HGSOC heterogeneity is very apparent with our patient ascites-derived immortalized (iOvCa) cell lines in terms of spheroid formation and organoid growth. However, there are key proteins and associated signaling pathways that are crucial for cell survival within each model system. This was demonstrated with the bioenergetic stress pathway in terms of increased P-AMPK in spheroids compared to organoids. In addition, our bulk RNA-sequencing analysis provided an extensive list of differentially regulated pathways between spheroids and organoids. One iOvCa cell line (i.e. iOvCa182) was included in our RNA sequencing data but not in our further analysis due to its difficult nature of being maintained in adherent cultures. With our downstream analysis into the G2/M checkpoint pathway, we saw increased sensitivity to G2/M checkpoint selective inhibitors in organoids compared to spheroids, except with our AURKA inhibitor Alisertib, which could pose as a new therapeutic target for HGSOC. Therefore, these biological differences should be considered when discovering new targeted treatment options for patients as they may respond differently depending on their disease progression.
In this study, we employed multiple ways to quantify organoid growth dynamics and correlate them with morphology. Organoid eccentricity is defined as the ability to bud or irregularity in 3D shape; whereas darkness is defined as the change in organoid brightness over time which could be associated with an accumulation of cells or debris within 3D structures. The H&E-stained sections best elucidate these organoid characteristics by visualizing their core. The OVCAR cell lines clearly grow more aggressive organoids with increased central cells (i.e. darkness) and active budding for irregular shaped structures (i.e. eccentricity); whereas the iOvCa cell lines grow more slowly and into round shapes, sometimes with hollow centers, as cystic-like structures. When comparing organoid to spheroid morphology, the results showed that all iOvCa cell lines had a unique ability to form spheroids and organoids. Moreover, the iOvCa cell lines demonstrated that an aggressive morphology as spheroids does not correlate with an aggressive organoid morphology and vice versa.
Additionally, these 3D morphologies complement the differing AMPK and Akt protein expression, and more importantly their activity levels, within spheroids and organoids. For example, iOvCa398 cells formed very small, complex organoids but were able to survive well as spheroids forming large, compact structures. The iOvCa398 compact spheroids correlated with an increase in P-AMPK levels, which we have previously seen as cells transition into a dormant state for metastasis [23,24,30]. In contrast, iOvCa195 cells formed medium sized complex organoids but formed very small sparse spheroids. We suspected that organoid growth would correspond to high P-Akt levels and lower levels in spheroids, which is displayed with the iOvCa195 line. We believe these influences in signaling activity may be critical for growth of organoids and dormancy in spheroids for this cell line. Although, it seems that AMPK signaling may be more influential on spheroid formation rather than Akt signaling on organoid growth. Of course, this would need to be investigated further by observing the downstream AMPK and Akt pathway proteins, such as ULK1 for macro-autophagy regulation [12,20,22,24,30,62].
With the development of the organoid model system, we have vastly expanded our ability to study the important cell biology of this disease in a 3D context. Organoids have become a popular research avenue in all cancer fields as it provides a reproducible way to observe mini tumor-like structures ex vivo [44,63]. As researchers, it is necessary to gain more insight into the 3D interactions within tumors or metastatic lesions to better eradicate HGSOC in patients. Using solely 2D models limits our understanding of cancer cells and their molecular adaptations to survive during disease progression, especially with HGSOC where it spreads vastly within the peritoneal cavity as spheroids and easily forms secondary tumors [64]. This was clearly demonstrated with our immunoblots for P-AMPK and P-Akt where organoid protein activity levels did not always correlate to adherent culture as speculated. Therefore, this study provides evidence that both the 3D spheroid and organoid model systems should be utilized for EOC research moving forward, as 2D adherent cultures are not accurate to the cellular behavior in patients.
In conjunction with previously published results, this study confirmed that there are significant changes in protein activity important for cancer dormancy pathways in HGSOC. Specifically, we provided some insight into the integral signaling pathways for cancer dormancy and biological switching behaviour in EOC. The Ki67 and PCNA quantifications revealed that the spheroids and organoids did not differ in their proliferative capacity in most cell lines. This was an unexpected result but could be due to the fact that Ki67 is expressed in all cell cycles except for G0, indicating an overabundance of Ki67 in all cells within spheroid structures prior to initiating quiescence [65]. Likewise, PCNA functions during DNA replication and repair making it critical only for S phase, indicating more than proliferation induction in cells [66]. On the other hand, our transcriptomic analysis demonstrated upregulation in G2/M checkpoint regulation, E2F Targets, and MYC targets in organoids compared to spheroids. These results confirmed that there is a difference in proliferative capacity between culture model systems, but in regard to the regulation of cell cycle checkpoints. This indicates that Ki67 and PCNA may not accurately represent the proliferation index of these 3D structures. Since the process cancer dormancy is a complex relationship between decreased proliferation, increased quiescence and resistance to apoptosis, utilizing the appropriate markers is important to understand this interplay during EOC metastasis.
In recent years, researchers have expanded their search for new HGSOC targeted therapies to include G2/M checkpoint inhibitors. By blocking the G2/M checkpoint, it forces cancer cells into premature mitosis without proper DNA repair; thus, cells accumulate DNA damage, and it triggers cell death via apoptosis [67,68,69]. Given our RNAsequencing data comparing spheroids and organoids, we speculated that each model system will have a different sensitivity to G2/M inhibition. Here, we were able to provide evidence that targeting the G2/M checkpoint pathway is effective. Adavosertib is a well-known Wee1 inhibitor that has been used to inhibit G2/M transition in many other cancers as well as HGSOC [54,70]. Volasertib is a more recently developed selective PLK1 inhibitor that had antitumor activity in platinum-resistant ovarian cancer [71]. Lastly, Alisertib is an AURKA inhibitor that is being tested on solid tumors in Phase I or II clinical trials that results in mitotic catastrophe [55,72,73,74]. Adavosertib and Volasertib clearly showed the difference in sensitivity between model systems where spheroids were less sensitive than organoids regardless of each unique cell line morphology. In contrast, Alisertib showed opposing trends with no difference in sensitivity or less sensitive organoids than spheroids.
Based on these results, we believe that targeting AURKA could be a new alternative therapy for HGSOC. This inhibitor was able to effectively kill cells within dormant spheroids, as well as cells within proliferative organoids. We speculate this is due to other downstream effects of targeting AURKA in cells or potential off target effects of Alisertib. For example, AURKA also regulates centrosome maturation, chromosomal alignment and separation, and assists with the DNA damage response [72,75,76]. Even though Alisertib is highly selective for AURKA, it may affect the activity of Aurora Kinase B but very minimally. Since HGSOC cells often have a large accumulation of genomic instability, inhibiting these processes could lead to mitotic catastrophe no matter the biological state. Of course, the full mechanism of action has not been elucidated but could be extrapolated in the future. As an extension of this, we could improve the efficacy of Alisertib in HGSOC by combining it with chemotherapeutics or other targeted agents to overcome chemoresistance or recurrence of disease.
The few limitations of this study should be considered when interpreting the results. First, the experiments were conducted using cell lines in in vitro systems, which is valuable for controlled mechanistic studies but don’t fully recapitulate the complexity of in vivo biological environments. Even though we used recently developed ascites derived patient samples, they were immortalized which can limit the translation of these findings to physiological conditions. Second, the use of spheroids and organoids introduces additional complexity due to intercellular spatial differences. These three-dimensional models, though more representative of tissue architecture than traditional monolayer cultures, exhibit gradients in oxygen concentration, nutrient availability, and cellular composition across their structure [64,77,78]. We could invoke our new technology of spatial analysis of spheroids (i.e. SPoRTS) and apply to organoids for a better understanding of these gradients throughout these 3D structures. Therefore, further studies using in vivo models or clinical samples, such as PDOs, are necessary to validate these findings and better understand their relevance in physiological and pathological contexts.

5. Conclusions

In conclusion, utilizing in vitro 3D model systems can be an effective way to better understand the biological complexities of EOC. These cumulative results directly correlate to our previous work that describes the biological changes during metastasis in the context of cancer dormancy. It is clear there are intercellular signaling changes in cells, rather than strictly morphological, that indicates a dormant phenotype in spheroids compared to a proliferative phenotype in organoids. To determine new targeted therapies and their translational applicability to patients, we provide more evidence by using 3D models with patient-derived samples in current research studies.

Supplementary Materials

The following supporting information can be downloaded at the website of this paper posted on Preprints.org. Figure S1: Confirmation of HGSOC histotype in cultured cell lines; Figure S2: Additional organoid growth measurements with proliferation analysis; Figure S3: Spheroid to organoid comparisons in established OVCAR cell lines; Figure S4: AMPK protein activity is not affected by the supplements added in EOC organoid specific media; Figure S5: G2/M checkpoint inhibitor activity levels in adherent cultures; Table S1. EOC organoid specific media formula; Table S2: Primer sets for RT-qPCR validation of RNA-sequencing results; Table S3: Summary of results; Video S1: iOvCa195 organoid growth over time at 12-hour increments.

Author Contributions

Conceptualization, E.T. and T.G.S; methodology, E.T. and Y.R.V.; software, B.K.; validation, E.T.; formal analysis, E.T. and B.K.; investigation, E.T., J.D. and Y.R.V.; resources, Y.R.V., T.G.S., and G.E.D.; data curation, E.T., B.K. and A.B.; writing—original draft preparation, E.T.; writing—review and editing, E.T. and T.G.S.; visualization, E.T.; supervision, T.G.S.; project administration, T.G.S..; funding acquisition, T.G.S. All authors have read and agreed to the published version of the manuscript.

Funding

We acknowledge funding support from the Canadian Institutes for Health Research to TGS (Grant #451405) and from the London Health Sciences Foundation through donations to the Mary & John Knight Translational Ovarian Cancer Research Unit. ET was supported by the Karen Pooley Scholarship in Ovarian Cancer Research with funds from the London Health Sciences Foundation.

Institutional Review Board Statement

The study was conducted according to the guidelines of the Declaration of Helsinki and approved by the Institutional Review Board of Western University (protocol #115904).

Informed Consent Statement

Patient consent for clinical specimens was obtained according to Western University institution research ethics board approved protocol #115904.

Data Availability Statement

The data presented in this study are available from the corresponding author upon a reasonable request.

Acknowledgments

We would like to thank all the members of the Mary & John Knight Translational Ovarian Cancer Research Unit for their support and guidance. We are very grateful to the many donors through the London Health Sciences Foundation for additional infrastructure funding, including the Leica DMI 400B inverted microscope, Bio-Rad Chemidoc, Aglient BioTek Synergy H1 multimode reader and IncuCyte S3 live-cell imaging system used in this study.

Conflicts of Interest

The authors declare no conflicts of interest for this study.

References

  1. Lheureux, S.; Gourley, C.; Vergote, I.; Oza, A.M. Epithelial Ovarian Cancer. Lancet 2019, 393, 1240–1253. [Google Scholar] [CrossRef]
  2. Labidi-Galy, S.I.; Papp, E.; Hallberg, D.; Niknafs, N.; Adleff, V.; Noe, M.; Bhattacharya, R.; Novak, M.; Jones, S.; Phallen, J.; et al. High Grade Serous Ovarian Carcinomas Originate in the Fallopian Tube. Nat Commun 2017, 8. [Google Scholar] [CrossRef]
  3. Karst, A.M.; Levanon, K.; Drapkin, R. Modeling High-Grade Serous Ovarian Carcinogenesis from the Fallopian Tube. Proc Natl Acad Sci U S A 2011, 108, 7547–7552. [Google Scholar] [CrossRef] [PubMed]
  4. Lee, S.; Zhao, L.; Rojas, C.; Bateman, N.W.; Yao, H.; Lara, O.D.; Celestino, J.; Morgan, M.B.; Nguyen, T.V.; Conrads, K.A.; et al. Molecular Analysis of Clinically Defined Subsets of High-Grade Serous Ovarian Cancer. Cell Rep 2020, 31. [Google Scholar] [CrossRef]
  5. Izar, B.; Tirosh, I.; Stover, E.H.; Wakiro, I.; Cuoco, M.S.; Alter, I.; Rodman, C.; Leeson, R.; Su, M.J.; Shah, P.; et al. A Single-Cell Landscape of High-Grade Serous Ovarian Cancer. Nat Med 2020, 26, 1271–1279. [Google Scholar] [CrossRef]
  6. Haagsma, J.; Kolendowski, B.; Buensuceso, A.; Valdes, Y.R.; DiMattia, G.E.; Shepherd, T.G. Gain-of-Function P53R175H Blocks Apoptosis in a Precursor Model of Ovarian High-Grade Serous Carcinoma. Sci Rep 2023, 13, 11424. [Google Scholar] [CrossRef] [PubMed]
  7. Goyeneche, A.; Lisio, M.A.; Fu, L.; Srinivasan, R.; Capuccino, J.V.; Gao, Z.H.; Telleria, C. The Capacity of High-Grade Serous Ovarian Cancer Cells to Form Multicellular Structures Spontaneously along Disease Progression Correlates with Their Orthotopic Tumorigenicity in Immunosuppressed Mice. Cancers (Basel) 2020, 12. [Google Scholar] [CrossRef]
  8. Das, T.; Meunier, L.; Barbe, L.; Provencher, D.; Guenat, O.; Gervais, T.; Mes-Masson, A.M. Empirical Chemosensitivity Testing in a Spheroid Model of Ovarian Cancer Using a Microfluidics-Based Multiplex Platform. Biomicrofluidics 2013, 7. [Google Scholar] [CrossRef] [PubMed]
  9. Raghavan, S.; Ward, M.R.; Rowley, K.R.; Wold, R.M.; Takayama, S.; Buckanovich, R.J.; Mehta, G. Formation of Stable Small Cell Number Three-Dimensional Ovarian Cancer Spheroids Using Hanging Drop Arrays for Preclinical Drug Sensitivity Assays. Gynecol Oncol 2015, 138, 181–189. [Google Scholar] [CrossRef] [PubMed]
  10. Liao, J.; Qian, F.; Tchabo, N.; Mhawech-Fauceglia, P.; Beck, A.; Qian, Z.; Wang, X.; Huss, W.J.; Lele, S.B.; Morrison, C.D.; et al. Ovarian Cancer Spheroid Cells with Stem Cell-like Properties Contribute to Tumor Generation, Metastasis and Chemotherapy Resistance through Hypoxia-Resistant Metabolism. PLoS One 2014, 9. [Google Scholar] [CrossRef] [PubMed]
  11. Dean, M.; Jin, V.; Bergsten, T.M.; Austin, J.R.; Lantvit, D.D.; Russo, A.; Burdette, J.E. Loss of PTEN in Fallopian Tube Epithelium Results in Multicellular Tumor Spheroid Formation and Metastasis to the Ovary. Cancers (Basel) 2019, 11. [Google Scholar] [CrossRef]
  12. Singha, B.; Laski, J.; Ramos Valdes, Y.; Liu, E.; DiMattia, G.E.; Shepherd, T.G. Inhibiting ULK1 Kinase Decreases Autophagy and Cell Viability in High-Grade Serous Ovarian Cancer Spheroids. Am J Cancer Res 2020, 10, 1384–1399. [Google Scholar] [PubMed]
  13. Fritz, J.L.; Collins, O.; Saxena, P.; Buensuceso, A.; Ramos Valdes, Y.; Francis, K.E.; Brown, K.R.; Larsen, B.; Colwill, K.; Gingras, A.-C.; et al. A Novel Role for NUAK1 in Promoting Ovarian Cancer Metastasis through Regulation of Fibronectin Production in Spheroids. Cancers (Basel) 2020, 12, 1–23. [Google Scholar] [CrossRef]
  14. Summers, M.A.; McDonald, M.M.; Croucher, P.I. Cancer Cell Dormancy in Metastasis. Cold Spring Harb Perspect Med. 2020, 10, 1–9. [Google Scholar] [CrossRef]
  15. Shepherd, T.G.; Dick, F.A. Principles of Dormancy Evident in High-Grade Serous Ovarian Cancer. Cell Div 2022, 17, 1–11. [Google Scholar] [CrossRef]
  16. Tomas, E.; Shepherd, T.G. Insights into High-Grade Serous Carcinoma Pathobiology Using Three-Dimensional Culture Model Systems. J Ovarian Res 2023, 16. [Google Scholar] [CrossRef]
  17. Sodek, K.L.; Ringuette, M.J.; Brown, T.J. Compact Spheroid Formation by Ovarian Cancer Cells Is Associated with Contractile Behavior and an Invasive Phenotype. Int J Cancer 2009, 124, 2060–2070. [Google Scholar] [CrossRef]
  18. MacDonald, J.; Ramos-Valdes, Y.; Perampalam, P.; Litovchick, L.; DiMattia, G.E.; Dick, F.A. A Systematic Analysis of Negative Growth Control Implicates the DREAM Complex in Cancer Cell Dormancy. Molecular Cancer Research 2017, 15, 371–381. [Google Scholar] [CrossRef] [PubMed]
  19. Buensuceso, A.; Fritz, J.L.; Collins, O.; Valdés, Y.R.; Borrelli, M.J.; DiMattia, G.E.; Shepherd, T.G. Loss of LKB1-NUAK1 Signalling Enhances NF-ΚB Activity in a Spheroid Model of High-Grade Serous Ovarian Cancer. Sci Rep 2022, 12. [Google Scholar] [CrossRef] [PubMed]
  20. Correa, R.J.M.; Valdes, Y.R.; Peart, T.M.; Fazio, E.N.; Bertrand, M.; McGee, J.; Préfontaine, M.; Sugimoto, A.; DiMattia, G.E.; Shepherd, T.G. Combination of AKT Inhibition with Autophagy Blockade Effectively Reduces Ascites-Derived Ovarian Cancer Cell Viability. Carcinogenesis 2014, 35, 1951–1961. [Google Scholar] [CrossRef] [PubMed]
  21. Rafehi, S.; Valdes, Y.R.; Bertrand, M.; McGee, J.; Préfontaine, M.; Sugimoto, A.; Dimattia, G.E.; Shepherd, T.G. TGFβ Signaling Regulates Epithelial-Mesenchymal Plasticity in Ovarian Cancer Ascites-Derived Spheroids. Endocr Relat Cancer 2016, 23, 147–159. [Google Scholar] [CrossRef]
  22. Peart, T.; Ramos Valdes, Y.; Correa, R.J.M.; Fazio, E.; Bertrand, M.; McGee, J.; Préfontaine, M.; Sugimoto, A.; DiMattia, G.E.; Shepherd, T.G. Intact LKB1 Activity Is Required for Survival of Dormant Ovarian Cancer Spheroids. Oncotarget 2015, 6, 22424–22438. [Google Scholar] [CrossRef]
  23. Buensuceso, A.; Ramos Valdes, Y.; DiMattia, G.E.; Shepherd, T.G. AMPK-Independent LKB1 Activity Is Required for Efficient Epithelial Ovarian Cancer Metastasis. Molecular Cancer Research 2020, 18, 488–500. [Google Scholar] [CrossRef] [PubMed]
  24. Laski, J.; Singha, B.; Wang, X.; Ramos Valdes, Y.; Collins, O.; Shepherd, T.G. Activated CAMKKβ-AMPK Signaling Promotes Autophagy in a Spheroid Model of Ovarian Tumour Metastasis. J Ovarian Res 2020, 13, 1–12. [Google Scholar] [CrossRef]
  25. Peart, T.M.; Correa, R.J.M.; Valdes, Y.R.; DiMattia, G.E.; Shepherd, T.G. BMP Signalling Controls the Malignant Potential of Ascites-Derived Human Epithelial Ovarian Cancer Spheroids via AKT Kinase Activation. Clin Exp Metastasis 2012, 29, 293–313. [Google Scholar] [CrossRef] [PubMed]
  26. Correa, R.J.M.; Peart, T.; Valdes, Y.R.; Dimattia, G.E.; Shepherd, T.G. Modulation of AKT Activity Is Associated with Reversible Dormancy in Ascites-Derived Epithelial Ovarian Cancer Spheroids. Carcinogenesis 2012, 33, 49–58. [Google Scholar] [CrossRef] [PubMed]
  27. Iwanicki, M.P.; Davidowitz, R.A.; Ng, M.R.; Besser, A.; Muranen, T.; Merritt, M.; Danuser, G.; Ince, T.; Brugge, J.S. Ovarian Cancer Spheroids Use Myosin-Generated Force to Clear the Mesothelium. Cancer Discov 2011, 1, 144–157. [Google Scholar] [CrossRef] [PubMed]
  28. Puiffe, M.L.; Le Page, C.; Filali-Mouhim, A.; Zietarska, M.; Ouellet, V.; Tonin, P.N.; Chevrette, M.; Provencher, D.M.; Mes-Masson, A.-M. Characterization of Ovarian Cancer Ascites on Cell Invasion, Proliferation, Spheroid Formation, and Gene Expression in an in Vitro Model of Epithelial Ovarian Cancer. Neoplasia 2007, 9, 820–829. [Google Scholar] [CrossRef] [PubMed]
  29. Burston, H.E.; Kent, O.A.; Communal, L.; Udaskin, M.L.; Sun, R.X.; Brown, K.R.; Jung, E.; Francis, K.E.; Rose, J. La; Lowitz, J.; et al. Inhibition of Relaxin Autocrine Signaling Confers Therapeutic Vulnerability in Ovarian Cancer. J Clin Invest 2021, 131. [Google Scholar] [CrossRef] [PubMed]
  30. Willows, R.; Sanders, M.J.; Xiao, B.; Patel, B.R.; Martin, S.R.; Read, J.; Wilson, J.R.; Hubbard, J.; Gamblin, S.J.; Carling, D. Phosphorylation of AMPK by Upstream Kinases Is Required for Activity in Mammalian Cells. Biochemical Journal 2017, 474, 3059–3073. [Google Scholar] [CrossRef] [PubMed]
  31. Endo, H.; Owada, S.; Inagaki, Y.; Shida, Y.; Tatemichi, M. Glucose Starvation Induces LKB1-AMPK-Mediated MMP-9 Expression in Cancer Cells. Sci Rep 2018, 8. [Google Scholar] [CrossRef] [PubMed]
  32. Lõhmussaar, K.; Kopper, O.; Korving, J.; Begthel, H.; Vreuls, C.P.H.; van Es, J.H.; Clevers, H. Assessing the Origin of High-Grade Serous Ovarian Cancer Using CRISPR-Modification of Mouse Organoids. Nat Commun 2020, 11. [Google Scholar] [CrossRef]
  33. de Witte, C.J.; Espejo Valle-Inclan, J.; Hami, N.; Lõhmussaar, K.; Kopper, O.; Vreuls, C.P.H.; Jonges, G.N.; van Diest, P.; Nguyen, L.; Clevers, H.; et al. Patient-Derived Ovarian Cancer Organoids Mimic Clinical Response and Exhibit Heterogeneous Inter- and Intrapatient Drug Responses. Cell Rep 2020, 31. [Google Scholar] [CrossRef] [PubMed]
  34. Kopper, O.; de Witte, C.J.; Lõhmussaar, K.; Valle-Inclan, J.E.; Hami, N.; Kester, L.; Balgobind, A.V.; Korving, J.; Proost, N.; Begthel, H.; et al. An Organoid Platform for Ovarian Cancer Captures Intra- and Interpatient Heterogeneity. Nat Med 2019, 25, 838–849. [Google Scholar] [CrossRef]
  35. Filippou, P.S.; Aleman, J.; Garreta, E.; Wang, Y.; Yang, J.; Huang, S.; Cheng, S.; Jin, Y.; Zhang, N. Application of Ovarian Cancer Organoids in Precision Medicine: Key Challenges and Current Opportunities. Front Cell Dev Biol 2021, 9. [Google Scholar] [CrossRef]
  36. Nero, C.; Vizzielli, G.; Lorusso, D.; Cesari, E.; Daniele, G.; Loverro, M.; Scambia, G.; Sette, C. Patient-Derived Organoids and High Grade Serous Ovarian Cancer: From Disease Modeling to Personalized Medicine. Journal of Experimental & Clinical Cancer Research 2021 40:1 2021, 40, 1–14. [Google Scholar] [CrossRef]
  37. Yee, C.; Dickson, K.-A.; Muntasir, M.N.; Ma, Y.; Marsh, D.J. Three-Dimensional Modelling of Ovarian Cancer: From Cell Lines to Organoids for Discovery and Personalized Medicine. Front Bioeng Biotechnol 2022, 10. [Google Scholar] [CrossRef] [PubMed]
  38. Senkowski, W.; Gall-Mas, L.; Marin Falco, M.; Li, Y.; Lavikka, K.; Kriegbaum, M.C.; Oikkonen, J.; Bulanova, D.; Pietras, E.J.; Voßgröne, K.; et al. A Platform for Efficient Establishment, Expansion and Drug Response Profiling of High-Grade Serous Ovarian Cancer Organoids. [CrossRef]
  39. Gorski, J.W.; Zhang, Z.; McCorkle, J.R.; DeJohn, J.M.; Wang, C.; Miller, R.W.; Gallion, H.H.; Dietrich, C.S.; Ueland, F.R.; Kolesar, J.M. Utilizing Patient-Derived Epithelial Ovarian Cancer Tumor Organoids to Predict Carboplatin Resistance. Biomedicines 2021, 9, 1021. [Google Scholar] [CrossRef] [PubMed]
  40. Tao, M.; Wu, X. The Role of Patient-Derived Ovarian Cancer Organoids in the Study of PARP Inhibitors Sensitivity and Resistance: From Genomic Analysis to Functional Testing. Journal of Experimental and Clinical Cancer Research 2021, 40. [Google Scholar] [CrossRef] [PubMed]
  41. Tao, M.; Sun, F.; Wang, J.; Wang, Y.; Zhu, H.; Chen, M.; Liu, L.; Liu, L.; Lin, H.; Wu, X. Developing Patient-Derived Organoids to Predict PARP Inhibitor Response and Explore Resistance Overcoming Strategies in Ovarian Cancer. Pharmacol Res 2022, 179. [Google Scholar] [CrossRef] [PubMed]
  42. Nanki, Y.; Chiyoda, T.; Hirasawa, A.; Ookubo, A.; Itoh, M.; Ueno, M.; Akahane, T.; Kameyama, K.; Yamagami, W.; Kataoka, F.; et al. Patient-Derived Ovarian Cancer Organoids Capture the Genomic Profiles of Primary Tumours Applicable for Drug Sensitivity and Resistance Testing. Sci Rep 2020, 10. [Google Scholar] [CrossRef] [PubMed]
  43. Shepherd, T.G.; Thériault, B.L.; Campbell, E.J.; Nachtigal, M.W. Primary Culture of Ovarian Surface Epithelial Cells and Ascites-Derived Ovarian Cancer Cells from Patients. Nat Protoc 2007, 1, 2643–2649. [Google Scholar] [CrossRef] [PubMed]
  44. Maenhoudt, N.; Defraye, C.; Boretto, M.; Jan, Z.; Heremans, R.; Boeckx, B.; Hermans, F.; Arijs, I.; Cox, B.; Van Nieuwenhuysen, E.; et al. Developing Organoids from Ovarian Cancer as Experimental and Preclinical Models. Stem Cell Reports 2020, 14, 717–729. [Google Scholar] [CrossRef]
  45. Burleson, K.M.; Casey, R.C.; Skubitz, K.M.; Pambuccian, S.E.; Oegema, T.R.; Skubitz, A.P.N. Ovarian Carcinoma Ascites Spheroids Adhere to Extracellular Matrix Components and Mesothelial Cell Monolayers. Gynecol Oncol 2004, 93, 170–181. [Google Scholar] [CrossRef] [PubMed]
  46. Desjardins, M.; Xie, J.; Gurler, H.; Muralidhar, G.G.; Sacks, J.D.; Burdette, J.E.; Barbolina, M.V. Versican Regulates Metastasis of Epithelial Ovarian Carcinoma Cells and Spheroids. J Ovarian Res 2014, 7. [Google Scholar] [CrossRef] [PubMed]
  47. Frederick, M.I.; Nassef, M.Z.; Borrelli, M.J.; Kuang, S.; Buensuceso, A.; More, T.; Cordes, T.; O’Donoghue, P.; Shepherd, T.G.; Hiller, K.; et al. Metabolic Adaptation in Epithelial Ovarian Cancer Metastasis. BBA - Molecular Basis of Disease 2024, 1870. [Google Scholar] [CrossRef] [PubMed]
  48. Kim, Y.S.; Gupta Vallur, P.; Jones, V.M.; Worley, B.L.; Shimko, S.; Shin, D.H.; Crawford, L.T.C.; Chen, C.W.; Aird, K.M.; Abraham, T.; et al. Context-Dependent Activation of SIRT3 Is Necessary for Anchorage-Independent Survival and Metastasis of Ovarian Cancer Cells. Oncogene 2020, 39, 1619–1633. [Google Scholar] [CrossRef]
  49. Chuang, T.C.; Shao, W.S.; Hsu, S.C.; Lee, S.L.; Kao, M.C.; Wang, V. Baicalein Induces G2/M Cell Cycle Arrest Associated with ROS Generation and CHK2 Activation in Highly Invasive Human Ovarian Cancer Cells. Molecules 2023, 28. [Google Scholar] [CrossRef] [PubMed]
  50. Zhan, L.; Zhang, Y.; Wang, W.; Song, E.; Fan, Y.; Wei, B. E2F1: A Promising Regulator in Ovarian Carcinoma. Tumor Biology 2016, 37, 2823–2831. [Google Scholar] [CrossRef]
  51. Zhou, Q.; Zhang, F.; He, Z.; Zuo, M.Z. E2F2/5/8 Serve as Potential Prognostic Biomarkers and Targets for Human Ovarian Cancer. Front Oncol 2019, 9, 161. [Google Scholar] [CrossRef] [PubMed]
  52. Lynch, K.N.; Liu, J.F.; Kesten, N.; Chow, K.H.; Shetty, A.; He, R.; Afreen, M.F.; Yuan, L.; Matulonis, U.A.; Growdon, W.B.; et al. Enhanced Efficacy of Aurora Kinase Inhibitors in G2/m Checkpoint Deficient Tp53 Mutant Uterine Carcinomas Is Linked to the Summation of Lkb1–Akt–P53 Interactions. Cancers (Basel) 2021, 13, 2195. [Google Scholar] [CrossRef]
  53. Li, J.; Lu, J.; Xu, M.; Yang, S.; Yu, T.; Zheng, C.; Huang, X.; Pan, Y.; Chen, Y.; Long, J.; et al. ODF2L Acts as a Synthetic Lethal Partner with WEE1 Inhibition in Epithelial Ovarian Cancer Models. Journal of Clinical Investigation 2023, 133. [Google Scholar] [CrossRef]
  54. Roering, P.; Siddiqui, A.; Heuser, V.D.; Potdar, S.; Mikkonen, P.; Oikkonen, J.; Li, Y.; Pikkusaari, S.; Wennerberg, K.; Hynninen, J.; et al. Effects of Wee1 Inhibitor Adavosertib on Patient-Derived High-Grade Serous Ovarian Cancer Cells Are Multiple and Independent of Homologous Recombination Status. Front Oncol 2022, 12. [Google Scholar] [CrossRef] [PubMed]
  55. Ding, Y.H.; Zhou, Z.W.; Ha, C.F.; Zhang, X.Y.; Pan, S.T.; He, Z.X.; Edelman, J.L.; Wang, D.; Yang, Y.X.; Zhang, X.; et al. Alisertib, an Aurora Kinase A Inhibitor, Induces Apoptosis and Autophagy but Inhibits Epithelial to Mesenchymal Transition in Human Epithelial Ovarian Cancer Cells. Drug Des Devel Ther 2015, 9, 425–464. [Google Scholar] [CrossRef] [PubMed]
  56. Gasimli, K.; Raab, M.; Tahmasbi Rad, M.; Kurunci-Csacsko, E.; Becker, S.; Strebhardt, K.; Sanhaji, M. Sequential Targeting of PLK1 and PARP1 Reverses the Resistance to PARP Inhibitors and Enhances Platin-Based Chemotherapy in BRCA-Deficient High-Grade Serous Ovarian Cancer with KRAS Amplification. Int J Mol Sci 2022, 23. [Google Scholar] [CrossRef]
  57. Borah, N.A.; Reddy, M.M. Aurora Kinase B Inhibition: A Potential Therapeutic Strategy for Cancer. Molecules 2021, 26. [Google Scholar] [CrossRef] [PubMed]
  58. Ngoi, N.Y.L.; Sundararajan, V.; Tan, D.S.P. Exploiting Replicative Stress in Gynecological Cancers as a Therapeutic Strategy. International Journal of Gynecologic Cancer 2020, 30, 1224–1238. [Google Scholar] [CrossRef]
  59. Kroeger, P.T.; Drapkin, R. Pathogenesis and Heterogeneity of Ovarian Cancer. Curr Opin Obstet Gynecol 2017, 29, 26–34. [Google Scholar] [CrossRef] [PubMed]
  60. Lawrenson, K.; Sproul, D.; Grun, B.; Notaridou, M.; Benjamin, E.; Jacobs, I.J.; Dafou, D.; Sims, A.H.; Gayther, S.A. Modelling Genetic and Clinical Heterogeneity in Epithelial Ovarian Cancers. Carcinogenesis 2011, 32, 1540–1549. [Google Scholar] [CrossRef]
  61. Geistlinger, L.; Oh, S.; Ramos, M.; Schiffer, L.; LaRue, R.S.; Henzler, C.M.; Munro, S.A.; Daughters, C.; Nelson, A.C.; Winterhoff, B.J.; et al. Multiomic Analysis of Subtype Evolution and Heterogeneity in High-Grade Serous Ovarian Carcinoma. Cancer Res 2021, 80, 4335–4345. [Google Scholar] [CrossRef] [PubMed]
  62. Li, N.; Huang, D.; Lu, N.; Luo, L. Role of the LKB1/AMPK Pathway in Tumor Invasion and Metastasis of Cancer Cells (Review). Oncol Rep 2015, 34, 2821–2826. [Google Scholar] [CrossRef] [PubMed]
  63. Simian, M.; Bissell, M.J. Organoids: A Historical Perspective of Thinking in Three Dimensions. Journal of Cell Biology 2017, 216, 31–40. [Google Scholar] [CrossRef] [PubMed]
  64. Brodeur, M.N.; Simeone, K.; Leclerc-Deslauniers, K.; Fleury, H.; Carmona, E.; Provencher, D.M.; Mes-Masson, A.M. Carboplatin Response in Preclinical Models for Ovarian Cancer: Comparison of 2D Monolayers, Spheroids, Ex Vivo Tumors and in Vivo Models. Sci Rep 2021, 11. [Google Scholar] [CrossRef] [PubMed]
  65. Khashaba, M.; Fawzy, M.; Abdel-Aziz, A.; Eladawei, G.; Nagib, R. Subtyping of High Grade Serous Ovarian Carcinoma: Histopathological and Immunohistochemical Approach. J Egypt Natl Canc Inst 2022, 34. [Google Scholar] [CrossRef] [PubMed]
  66. Bologna-Molina, R.; Mosqueda-Taylor, A.; Molina-Frechero, N.; Mori-Estevez, A.D.; Sánchez-Acuña, G. Comparison of the Value of PCNA and Ki-67 as Markers of Cell Proliferation in Ameloblastic Tumors. Med Oral Patol Oral Cir Bucal 2013, 18. [Google Scholar] [CrossRef]
  67. Fernando, M.; Duijf, P.H.G.; Proctor, M.; Stevenson, A.J.; Ehmann, A.; Vora, S.; Skalamera, D.; Adams, M.; Gabrielli, B. Dysregulated G2 Phase Checkpoint Recovery Pathway Reduces DNA Repair Efficiency and Increases Chromosomal Instability in a Wide Range of Tumours. Oncogenesis 2021, 10. [Google Scholar] [CrossRef] [PubMed]
  68. Zhang, T.; Zheng, S.; Liu, Y.; Li, X.; Wu, J.; Sun, Y.; Liu, G. DNA Damage Response and PD-1/PD-L1 Pathway in Ovarian Cancer. DNA Repair (Amst) 2021, 102. [Google Scholar] [CrossRef] [PubMed]
  69. Barnaba, N.; LaRocque, J.R. Targeting Cell Cycle Regulation via the G2-M Checkpoint for Synthetic Lethality in Melanoma. Cell Cycle 2021, 20, 1041–1051. [Google Scholar] [CrossRef]
  70. Chen, C.P.; Yeh, C.N.; Pan, Y.R.; Huang, W.K.; Hsiao, Y.T.; Lo, C.H.; Wu, C.E. Wee1 Inhibition by MK1775 Potentiates Gemcitabine through Accumulated Replication Stress Leading to Apoptosis in Biliary Tract Cancer. Biomedicine and Pharmacotherapy 2023, 166. [Google Scholar] [CrossRef] [PubMed]
  71. Affatato, R.; Carrassa, L.; Chilà, R.; Lupi, M.; Restelli, V.; Damia, G. Identification of PLK1 as a New Therapeutic Target in Mucinous Ovarian Carcinoma. Cancers (Basel) 2020, 12. [Google Scholar] [CrossRef]
  72. Pérez-Fidalgo, J.A.; Gambardella, V.; Pineda, B.; Burgues, O.; Piñero, O.; Cervantes, A. Aurora Kinases in Ovarian Cancer. ESMO Open 2020, 5. [Google Scholar] [CrossRef] [PubMed]
  73. Ganapathi, R.N.; Norris, E.J.; Sutker, A.P.; Klotz, K.E.; Ganapathi, M.K. Targeting Aurora A Kinase (AAK) in Platinum-Resistant High Grade Serous Ovarian Cancer. Front Oncol 2020, 10. [Google Scholar] [CrossRef] [PubMed]
  74. Manfredi, M.G.; Ecsedy, J.A.; Chakravarty, A.; Silverman, L.; Zhang, M.; Hoar, K.M.; Stroud, S.G.; Chen, W.; Shinde, V.; Huck, J.J.; et al. Characterization of Alisertib (MLN8237), an Investigational Small-Molecule Inhibitor of Aurora A Kinase Using Novel in Vivo Pharmacodynamic Assays. Clinical Cancer Research 2011, 17, 7614–7624. [Google Scholar] [CrossRef] [PubMed]
  75. Aquino-Acevedo, A.N.; Orengo-Orengo, J.A.; Cruz-Robles, M.E.; Saavedra, H.I. Mitotic Kinases Are Emerging Therapeutic Targets against Metastatic Breast Cancer. Cell Division 2024, 19. [Google Scholar] [CrossRef] [PubMed]
  76. Alkhateeb, K.J.; Crane, J.E.; Sak, M.; Jorgensen, C.J.; O’Donnell, J.P.; Zumbar, C.T.; Wozniak, J.A.; Salazar, C.R.; Parwani, A.V.; Lehman, N.L. Aurora-A Kinase Is Differentially Expressed in the Nucleus and Cytoplasm in Normal Müllerian Epithelium and Benign, Borderline and Malignant Serous Ovarian Neoplasms. Diagn Pathol 2021, 16. [Google Scholar] [CrossRef]
  77. Kim, S.; Choung, S.; Sun, R.X.; Ung, N.; Hashemi, N.; Fong, E.J.; Lau, R.; Spiller, E.; Gasho, J.; Foo, J.; et al. Comparison of Cell and Organoid-Level Analysis of Patient-Derived 3D Organoids to Evaluate Tumor Cell Growth Dynamics and Drug Response. SLAS Discovery 2020, 25, 744–754. [Google Scholar] [CrossRef] [PubMed]
  78. Cody, N. AL; Zietarska, M.; Filali-Mouhim, A.; Provencher, D.M.; Mes-Masson, A.-M.; Tonin, P.N. Influence of Monolayer, Spheroid, and Tumor Growth Conditions on Chromosome 3 Gene Expression in Tumorigenic Epithelial Ovarian Cancer Cell Lines. BMC Med Genomics 2008, 1. [Google Scholar] [CrossRef] [PubMed]
Figure 1. Morphological and histological comparisons of HGSOC cell lines cultured using 3D model systems. (A,B) Brightfield images of established cells lines and patient ascites-derived immortalized cell lines cultured as spheroids and organoids. Structures were categorized based on appearance as compact, grape-like or sparse spheroids and dense or complex organoids; indicated on the right side of each cell line associated images. Spheroids and organoids were also collected for formalin-fixed paraffin-embedding (FFPE), sectioning and staining for H&E and IHC with Ki67 proliferation marker. Scale bar is 200µm or 250µm for brightfield, and 200µm for H&E and IHC images.
Preprints 143529 g001
Figure 2. Growth analysis in relation to proliferation status of HGSOC spheroids and organoids. (A) Organoid number and total organoid area measurements were used to calculate average organoid area (μm2/image) over time. (B) Organoid darkness was measured to observe the density of cells or debris within a structure over time. (C) Organoid eccentricity was measured to observe the difference in shape over time. (D) Representative brightfield images of iOvCa195, iOvCa256 and iOvCa398 organoids at day 21, with white arrows for organoid darkness and yellow arrows for organoid eccentricity. Scale bar is 600µm. (E) The IHC sections were used to measure the percentage of Ki67 positive (Ki67+) nuclei and they were binned based on pixel intensity within ImageJ for each indicated cell line (n=2-3). (F) High magnification images of representative organoids with arrows indicating high positive (green), positive (blue), low positive (black) Ki67+ nuclei and Ki67- nuclei (red). (G) Immunoblots of PCNA were completed to confirm the proliferative index of spheroids versus organoids. (H) Relative quantification of PCNA in spheroids (SPH) and organoids (ORG). Graphs were generated using GraphPad Prism 10 demonstrating mean±SD for E and mean±SEM for A, B, C, and H. Statistical analysis for A, B and C was completed on only Day 21 data using an ordinary one-way ANOVA with Tukey’s multiple comparisons test and displayed with compact lettering; for E and H was a Student’s t test for each cell line (n≥3, *p<0.05, **<p0.01).
Preprints 143529 g002
Figure 3. Altered phosphorylation status of AMPK and Akt between culture model systems. (A,B) Relative protein expression and quantified fold change of phosphorylated AMPK at T172 (P-AMPK) to total AMPK in adherent (ADH), spheroid (SPH) and organoid (ORG) cultures. (C,D) Relative protein expression and quantified fold change of phosphorylated Akt at S473 (P-Akt) to total Akt in adherent (ADH), spheroid (SPH) and organoid (ORG) cultures. Graphs were generated using GraphPad Prism 10 demonstrating mean±SEM and a one-way ANOVA with Tukey’s multiple comparisons test for statistical analysis of each individual cell line (n=3, *p<0.05, **p<0.01, ****p<0.0001).
Preprints 143529 g003
Figure 4. Discovery-based analysis of HGSOC spheroids and organoids based on bulk RNA-sequencing results. (A) Principal component analysis plot of all samples where each colour indicates a cell line and each hue change differentiates spheroids (SPH) to organoids (ORG). (B) Differential gene expression between spheroids and organoids with the coloured dots (blue=elevated in organoids, red=elevated in spheroids) indicating significant genes. (C) Normalized enrichment scores (NES) of cancer hallmark pathways in spheroids (NES=positive) and organoids (NES=negative) (FDR<0.05). (D,E) Enrichment plots for G2M Checkpoint and E2F Targets grouped gene sets within the cancer hallmark pathways. (F) RT-qPCR validation of selected genes within the G2M Checkpoint and E2F Target hallmark sets. Graphs were generated using GraphPad Prism 10 demonstrating mean±SEM with a Student’s t test for statistical analysis (n=3, **p<0.01, ***p<0.001).
Preprints 143529 g004
Figure 5. Expression and regulation of G2M checkpoint proteins in HGSOC organoids versus spheroids. (A) Relative protein expression of phosphorylated CDK1 at Y15 (P-CDK1), total CDK1, phosphorylated cdc25C at S216 (P-cdc25C) and total cdc25C in spheroid (SPH) and organoid (ORG) cultures. (B,C) Quantified fold change of P-CDK1 and P-cdc25C to actin housekeeping protein. (D) Relative protein expression of Wee1, AURKA and PLK1. Graphs were generated using GraphPad Prism 10 demonstrating mean±SEM a Student’s t test for statistical analysis (n≥3, *p<0.05, **p<0.01, ***p<0.001).
Preprints 143529 g005
Figure 6. Varying sensitivities to G2M checkpoint small molecule inhibitors on HGSOC spheroid and organoid viability. (A,B,C) Dose response curves of a Adavosertib, Alisertib and Volasertib normalized to control in spheroid (SPH) and organoid (ORG) cultures. (D) Bar graphs of area under the curve (AUC) for each of the above dose response curves to demonstrate sensitivity between spheroids and organoids. Graphs were generated using GraphPad Prism 10 demonstrating mean±SEM with two-way ANOVA for statistical analysis (n=3-4, *p<0.05, **p<0.01, ***p<0.001).
Preprints 143529 g006
Table 1. Overview of characteristics for HGSOC established and patient ascites-derived immortalized cell lines.
Cell Line Histotype FIGO Staging CNV Status Mutations † p53 Immunoblot Signal Chemotherapy Prior to Derivation
OVCAR8 HGSC TP53 (SA) #
KRAS P121H
ERBB2 G776V
CTNNB1 E26R
Low N/A
OVCAR4 HGSC TP53 L130V # Low N/A
OVCAR3 HGSC TP53 R248Q #
PIK3R1 c.1746-2A>T (SA)
High N/A
iOvCa182 HGSC IIIB 84.74% TP53 K132R High 6 cycles of carboplatin & paclitaxel; trebananib, angiopoietin inhibitor + weekly paclitaxel for 6 months
iOvCa195 Mixed HGSC and Endometrioid IV 77.89% TP53 E171fs*61
BRCA1 Y978*
NS NONE
iOvCa198 HGSC IIIB 80.37% TP53 Q192*
PIK3CA I391M
KDR Q472H
NS 6 cycles of carboplatin & paclitaxel
iOvCa246 HGSC IIIC 81.09% TP53 c.560-2A>T (SA) NS NONE
iOvCa256 HGSC Endometrial IIIA 55.63% TP53 Y220C
KIT M541L
Low 4 cycles of carboplatin and weekly paclitaxel
iOvCa398 HGSC IC 70.88% n.d. High NONE
iOvCa411 HGSC IIIC 67.84% TP53 Y234H High 6 cycles of carboplatin & paclitaxel; 5 cycles doxorubicin; weekly taxol for 8 months; topotecan; etoposide
HGSC = high-grade serous carcinoma; Staging based on The International Federation of Gynecology and Obstetrics (FIGO) staging system; # Leroy et al 2014. Human Mutation.; † Cellosaurus for mutations in OVCAR cell lines; Mutations in iOvCa cell lines determined based on Oncogene Hotspot analysis; SA = Splice Acceptor Mutation; n.d. = Not determined; NS = no signal (refer to Supplementary Figure S1B).
Disclaimer/Publisher’s Note: The statements, opinions and data contained in all publications are solely those of the individual author(s) and contributor(s) and not of MDPI and/or the editor(s). MDPI and/or the editor(s) disclaim responsibility for any injury to people or property resulting from any ideas, methods, instructions or products referred to in the content.
Copyright: This open access article is published under a Creative Commons CC BY 4.0 license, which permit the free download, distribution, and reuse, provided that the author and preprint are cited in any reuse.
Prerpints.org logo

Preprints.org is a free preprint server supported by MDPI in Basel, Switzerland.

Subscribe

Disclaimer

Terms of Use

Privacy Policy

Privacy Settings

© 2025 MDPI (Basel, Switzerland) unless otherwise stated