1. Introduction
Cancer remains one of the foremost causes of mortality worldwide, imposing substantial burdens on healthcare infrastructures and economies [
1,
2,
3]. This challenge is particularly pronounced in malignancies such as lung cancer, where marked intratumoral heterogeneity and intrinsic drug resistance often curtail the effectiveness of conventional therapies[
4,
5,
6]. Although the introduction of novel anticancer agents and targeted therapeutics has yielded promising initial responses, most patients ultimately experience therapeutic failure due to the emergence of resistance [
7,
8,
9]. The case of sotorasib—a targeted agent against KRAS G12C mutations—is instructive, with resistance frequently arising within approximately six months, underscoring the limitations of prolonged maximum tolerated dose (MTD) strategies that inadvertently select for resistant cellular subsets [
10,
11,
12,
13].
Historically, tumor drug resistance was attributed primarily to genetic mutations and Darwinian selective pressures [
14,
15]. However, a growing body of evidence now highlights the pivotal influence of non-genetic mechanisms, including epigenetic modulation and dynamic reorganization of protein interaction networks, in engendering transient, reversible resistance states [
16,
17,
18]. These adaptive phenotypes, often linked to epithelial–mesenchymal plasticity (EMP)[
19,
20], confer enhanced migratory capacity, metastatic potential, and treatment evasion[
21,
22,
23], and are correlated with adverse clinical outcomes [
24,
25,
26,
27,
28]. Moreover, recent investigations have demonstrated that non-genetic adaptations can emerge rapidly, challenge the stability of conventional biomarkers, revert upon removal of therapeutic pressure, and coexist with genetically driven resistance pathways [
29,
30].
In response to these complexities, we developed an integrated experimental platform that couples high-fidelity single-cell isolation with three-dimensional (3D) organoid-based drug evaluation to dissect intratumoral heterogeneity at the cellular level[
31,
32,
33,
34]. By employing well-characterized lung cancer cell lines and patient-derived malignant pleural effusion (MPE) samples[
35], this platform enables precise isolation of distinct subclones to evaluate the interplay of genetic mutations (e.g., EGFR Del19 and exon 14 splice variants), phenotypic plasticity, and differential responsiveness to targeted therapies[
5,
21]. Our findings underscore the multifaceted origins of therapeutic resistance and the necessity of transcending a singular, mutation-centric focus. By providing insights into non-genetic mechanisms and their contributions to phenotypic variability, our approach can inform the rational design of precision oncology strategies and guide the development of combination therapies aimed at mitigating resistance.
This work elucidates the complexity inherent in drug resistance, highlights the importance of EMP and non-genetic plasticity, and provides a robust, clinically relevant framework for studying tumor heterogeneity. These advances may ultimately foster more individualized, effective cancer treatment paradigms and improve patient outcomes.
2. Results
2.1. Integration of Single-Cell Culture Technology for the Establishment and Preservation of Phenotypically Heterogeneous Monoclonal Cell Lines
This study established an integrated experimental platform combining single-cell isolation microchips and three-dimensional (3D) tumor spheroid cultures to examine drug-resistant A549 lung cancer cells during precision drug evaluation. By subjecting A549 cells to three consecutive rounds of cisplatin at IC50 concentrations, we induced a drug-resistant population (
Figure 1A) that underwent pronounced morphological and functional alterations, ultimately forming three distinct cellular subtypes (
Figure 1B). To dissect these subtypes—Holoclone, Meroclone, and Paraclone, concepts derived from Barrandon and Green’s keratinocyte classification—we integrated single-cell isolation techniques with long-term 3D culture. Using the CellGem
® single-cell screening microchip, individual progenitor cells were clonally expanded, enabling detailed observation of proliferation, morphology, and differentiation. After 10–14 days, clonal populations reached approximately 70–80% confluency, and some were cryopreserved for long-term storage in cell bank. (
Figure 1C). This process yielded 17 stable cell lines (
Figure S1), encompassing all three phenotypes (
Figure 1D).
By enabling systematic long-term monitoring, gene expression profiling, and functional analysis at the single-cell level, this platform provides unprecedented insights into the complexity and dynamic nature of drug resistance. Understanding how cancer cells modulate their states underscores the importance of developing precision oncology strategies that address not only the emergence of resistant clones but also their potential for phenotypic recovery.
2.2. Phenotypic Heterogeneity of Different Drug-Resistant Subclonal Cells and Their Impact on Chemotherapy Drug Sensitivity.
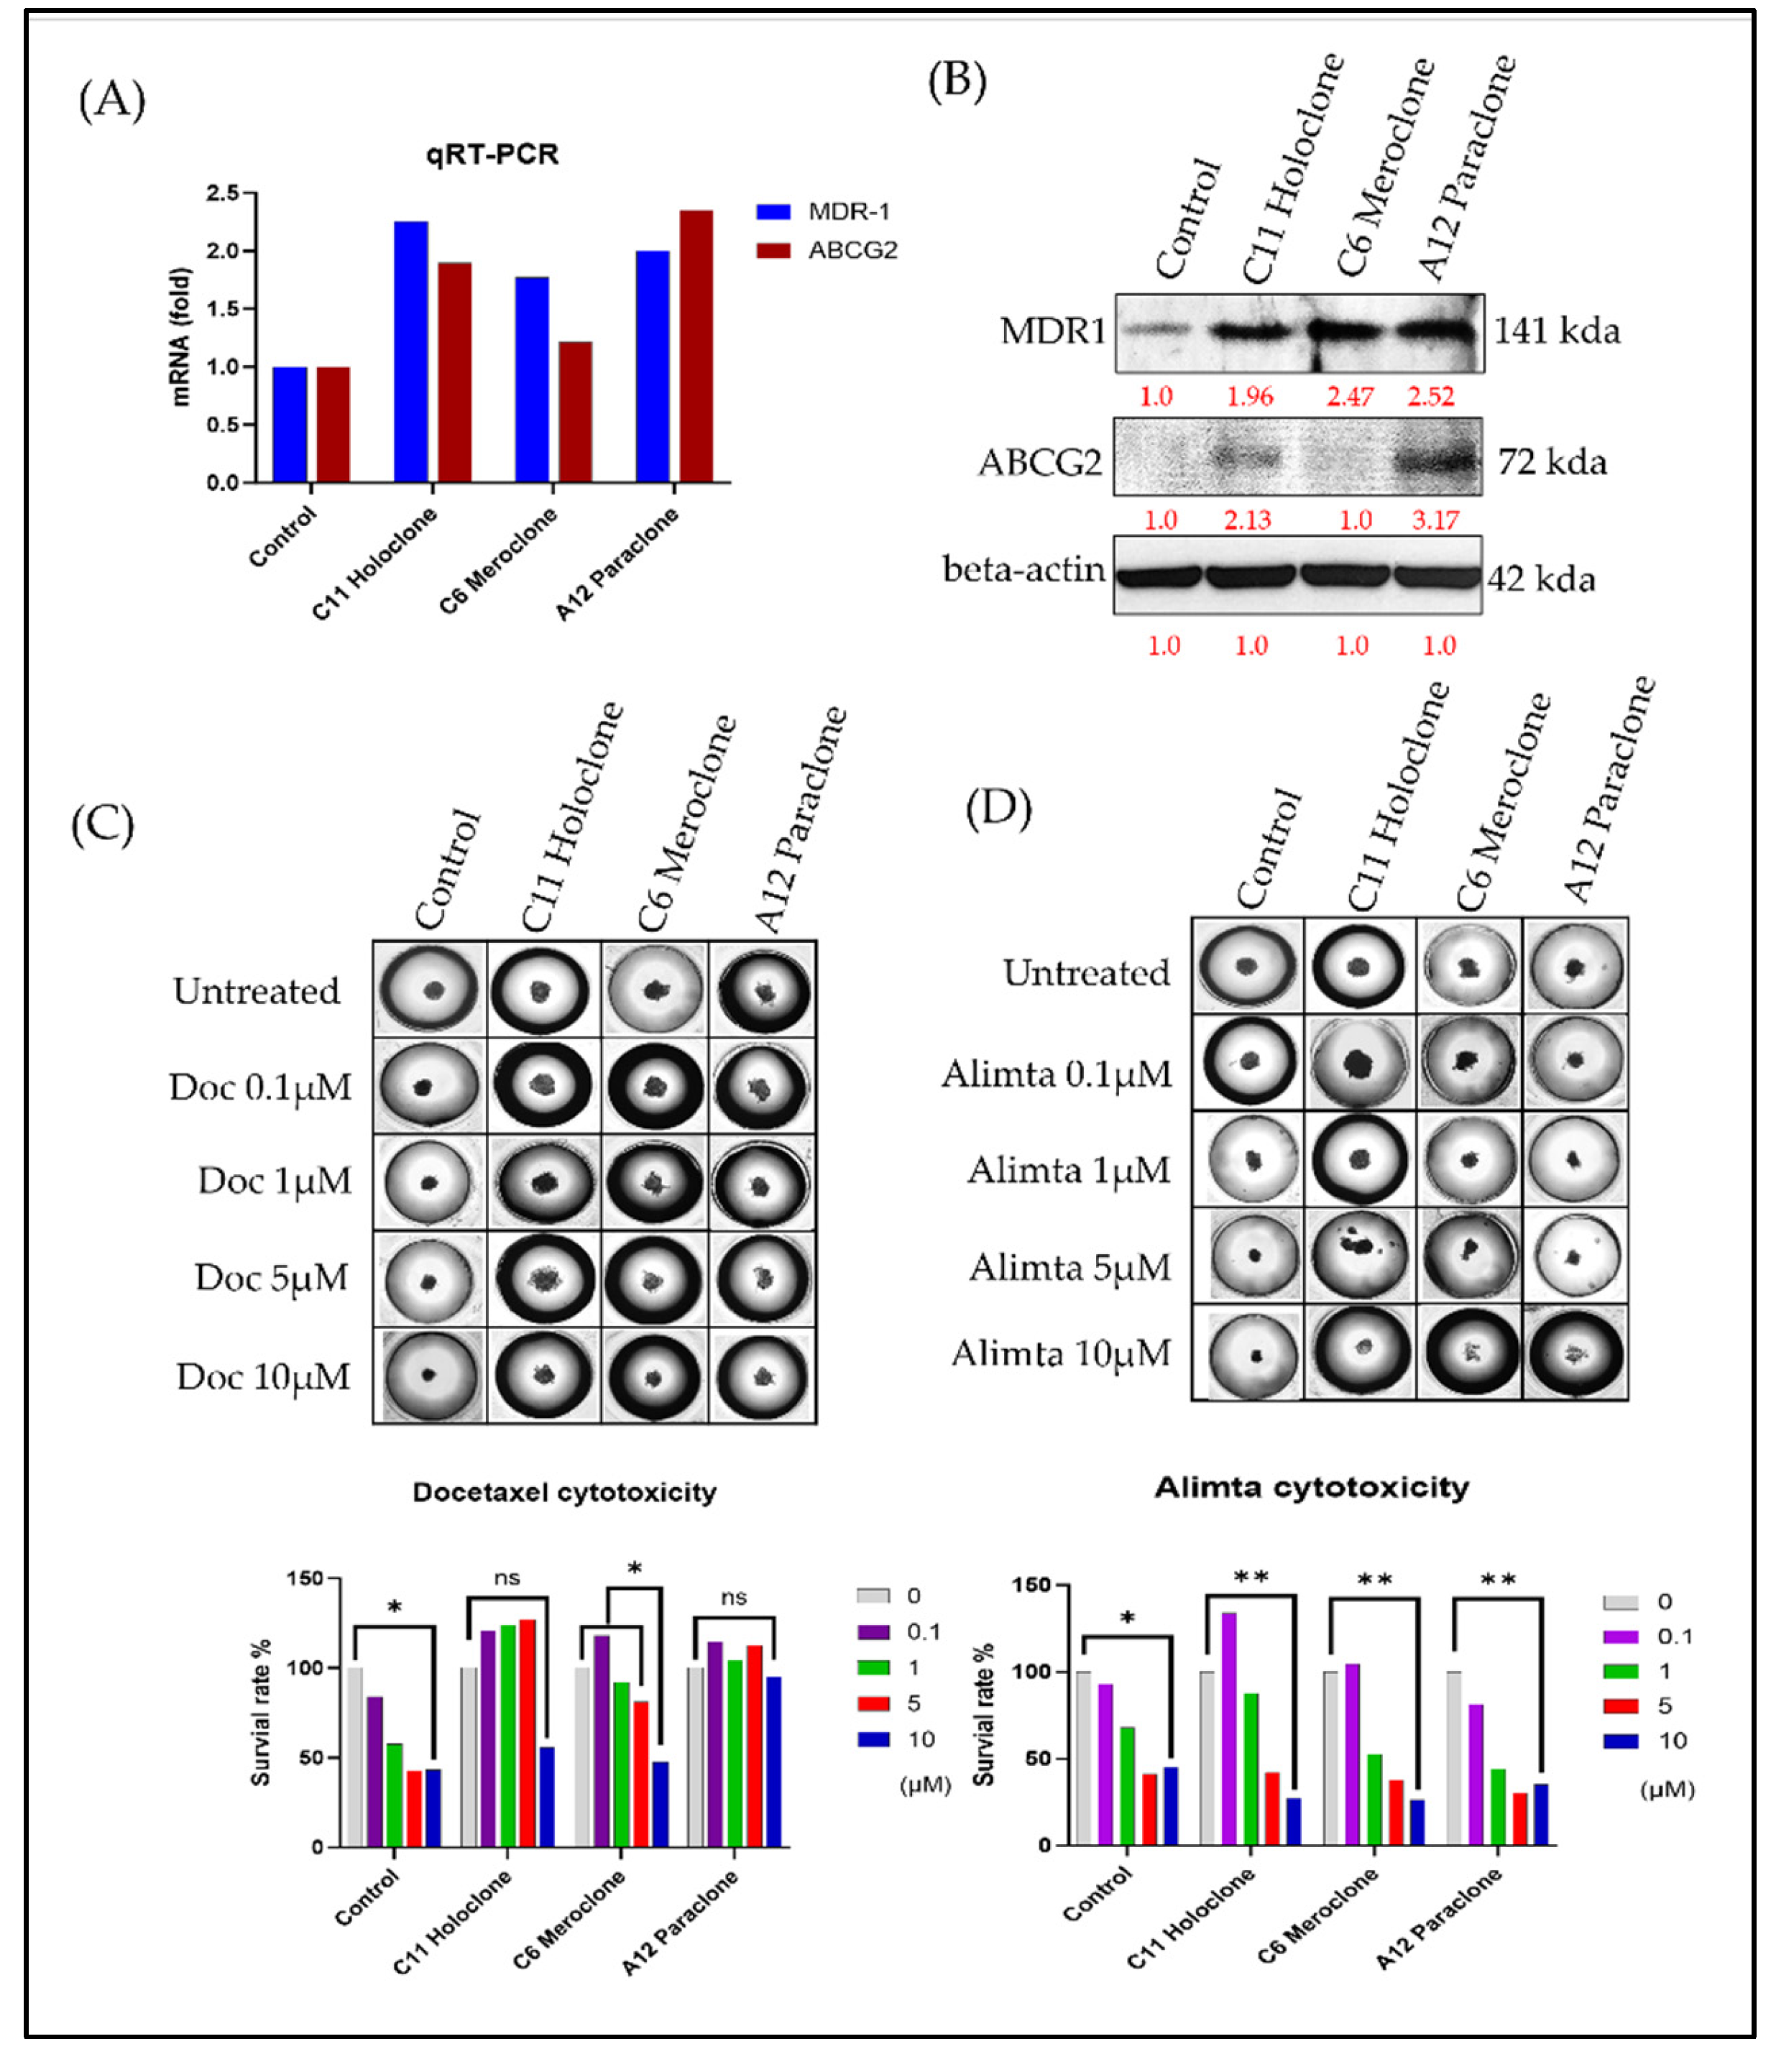
In this study, we compared three drug-resistant A549 subclones—Holoclone, Meroclone, and Paraclone—to elucidate their distinct adaptive strategies and responses to chemotherapy. Morphological differences among the subclones suggested diverse growth patterns and regulatory networks. To explore the genetic basis of these variations, we analyzed expression levels of drug resistance-related genes MDR-1 and ABCG2. Both Holoclone and Paraclone showed significantly elevated MDR-1 and ABCG2 levels (
Figure 2A,B), enhancing their ability to efflux chemotherapeutic agents and survive under drug pressure. In contrast, Meroclone exhibited markedly lower expression, implying reliance on alternative resistance mechanisms or less robust drug efflux capabilities.
To approximate a clinical environment more closely, we employed the 3D tumor spheroid culture chip CellHD256
® to assess the sensitivity of these subclones to chemotherapy under physiologically relevant conditions. This 3D model simulates nutrient gradients, extracellular matrix signals, and intercellular interactions resembling in vivo tumor tissues. Using Docetaxel (0.1–10 µM) (
Figure 2C) and Alimta (0.1–10 µM) (
Figure 2D), we evaluated drug responses after 72 hours. In Control cells, Docetaxel at 5 and 10 µM achieved IC₅₀ inhibition, Meroclone required a higher Docetaxel concentration (10 µM) to reach IC₅₀, while Holoclone and Paraclone no response for Docetaxel reflecting increased tolerance. Alimta at 5 and 10 µM effectively achieved IC₅₀ inhibition in both Control and all three resistant subclones (p < 0.01), indicating that Alimta maintained potent effects even against these heterogeneous populations.
These findings highlight that drug sensitivity is influenced not only by intrinsic resistance mechanisms but also by cellular phenotypes and microenvironmental context. The presence of diverse subclones with varying gene expression patterns, efflux capabilities, and morphological features underscores the complexity of treatment responses. The Holoclone and Paraclone subclones, with their elevated MDR-1 and ABCG2 expression, may require strategies targeting efflux transporters or combination therapies to improve drug efficacy. Meanwhile, Meroclone, with lower MDR-related gene expression, may be susceptible to different therapeutic approaches. By integrating morphological assessments, molecular analyses, and 3D culture systems, this study provides valuable insights into intratumoral heterogeneity and drug resistance. Our results suggest that understanding these subclonal differences can guide more precise, personalized treatment strategies. Future research will focus on refining therapeutic regimens, incorporating multiple molecular markers, and exploring combination treatments to overcome the challenges posed by heterogeneous, drug-resistant cancer cell populations.
2.3. Evidence of Cellular Phenotypic Heterogeneity and Tumor Spheroid Drug Prediction in Primary MPE Cultures
To model the phenotypic diversity of primary lung cancer cells and predict therapeutic responses, we analyzed malignant pleural effusion (MPE) samples from two patients with poorly differentiated pulmonary adenocarcinoma and pleural metastases (
Figure 3A). Clinical data shows that Next-generation sequencing (NGS) identified EGFR Del19 (Case 1) and an Exon 14 splice mutation (Case 2), guiding the use of targeted therapies (
Table S1). Initial cultures revealed heterogeneous cell populations, including both clustered and single-cell morphologies, highlighting diversity that may influence treatment outcomes.
Culturing cells in medium supplemented with 50% MPE yielded two main phenotypes: elongated adherent cells and spherical floating cells, reflecting high adaptability. By applying single-cell isolation and expansion techniques, we established two subclones: Holoclone (clustered, self-renewing, stem-like) and Paraclone (more differentiated, dispersed). Both subclones formed stable 3D tumorspheres within 96 hours, providing a physiologically relevant environment closely mimicking in vivo conditions. We further utilized 3D spheroid culture model to evaluate the therapeutic efficacy of targeted agents. The results demonstrated that Giotrif (afatinib) achieved a half-maximal inhibitory concentration (IC50) of 60 nM, whereas Capmatinib displayed a significantly lower IC50 of 6.5 nM (
Figure 3B). We then evaluated their responses to targeted therapies, Giotrif and Capmatinib, using these 3D spheres (
Figure 3C). Giotrif at 60 M significantly inhibited Holoclone (18.13% viability) but not Paraclone (71.23% viability). In contrast, Capmatinib at 6.5 nM suppressed both Holoclone and Paraclone (26.93% and 47.27% viability, respectively), suggesting that Holoclone’s stem-like features render it highly EGFR-dependent, while Paraclone may rely on alternate survival pathways.
These results underscore the heterogeneous responses of subclones derived from clinical MPE samples to targeted agents. Employing 3D tumorsphere cultures and single-cell isolation offers a refined platform to predict drug efficacy and inform personalized treatment strategies. By capturing intratumoral diversity, this approach promises improved clinical outcomes through tailored therapies that address the distinct vulnerabilities of each subclone.
2.4. Multilevel Analysis of Stem Cell Characteristics and Biomarker Expression in Drug-Resistant Subclonal Cells
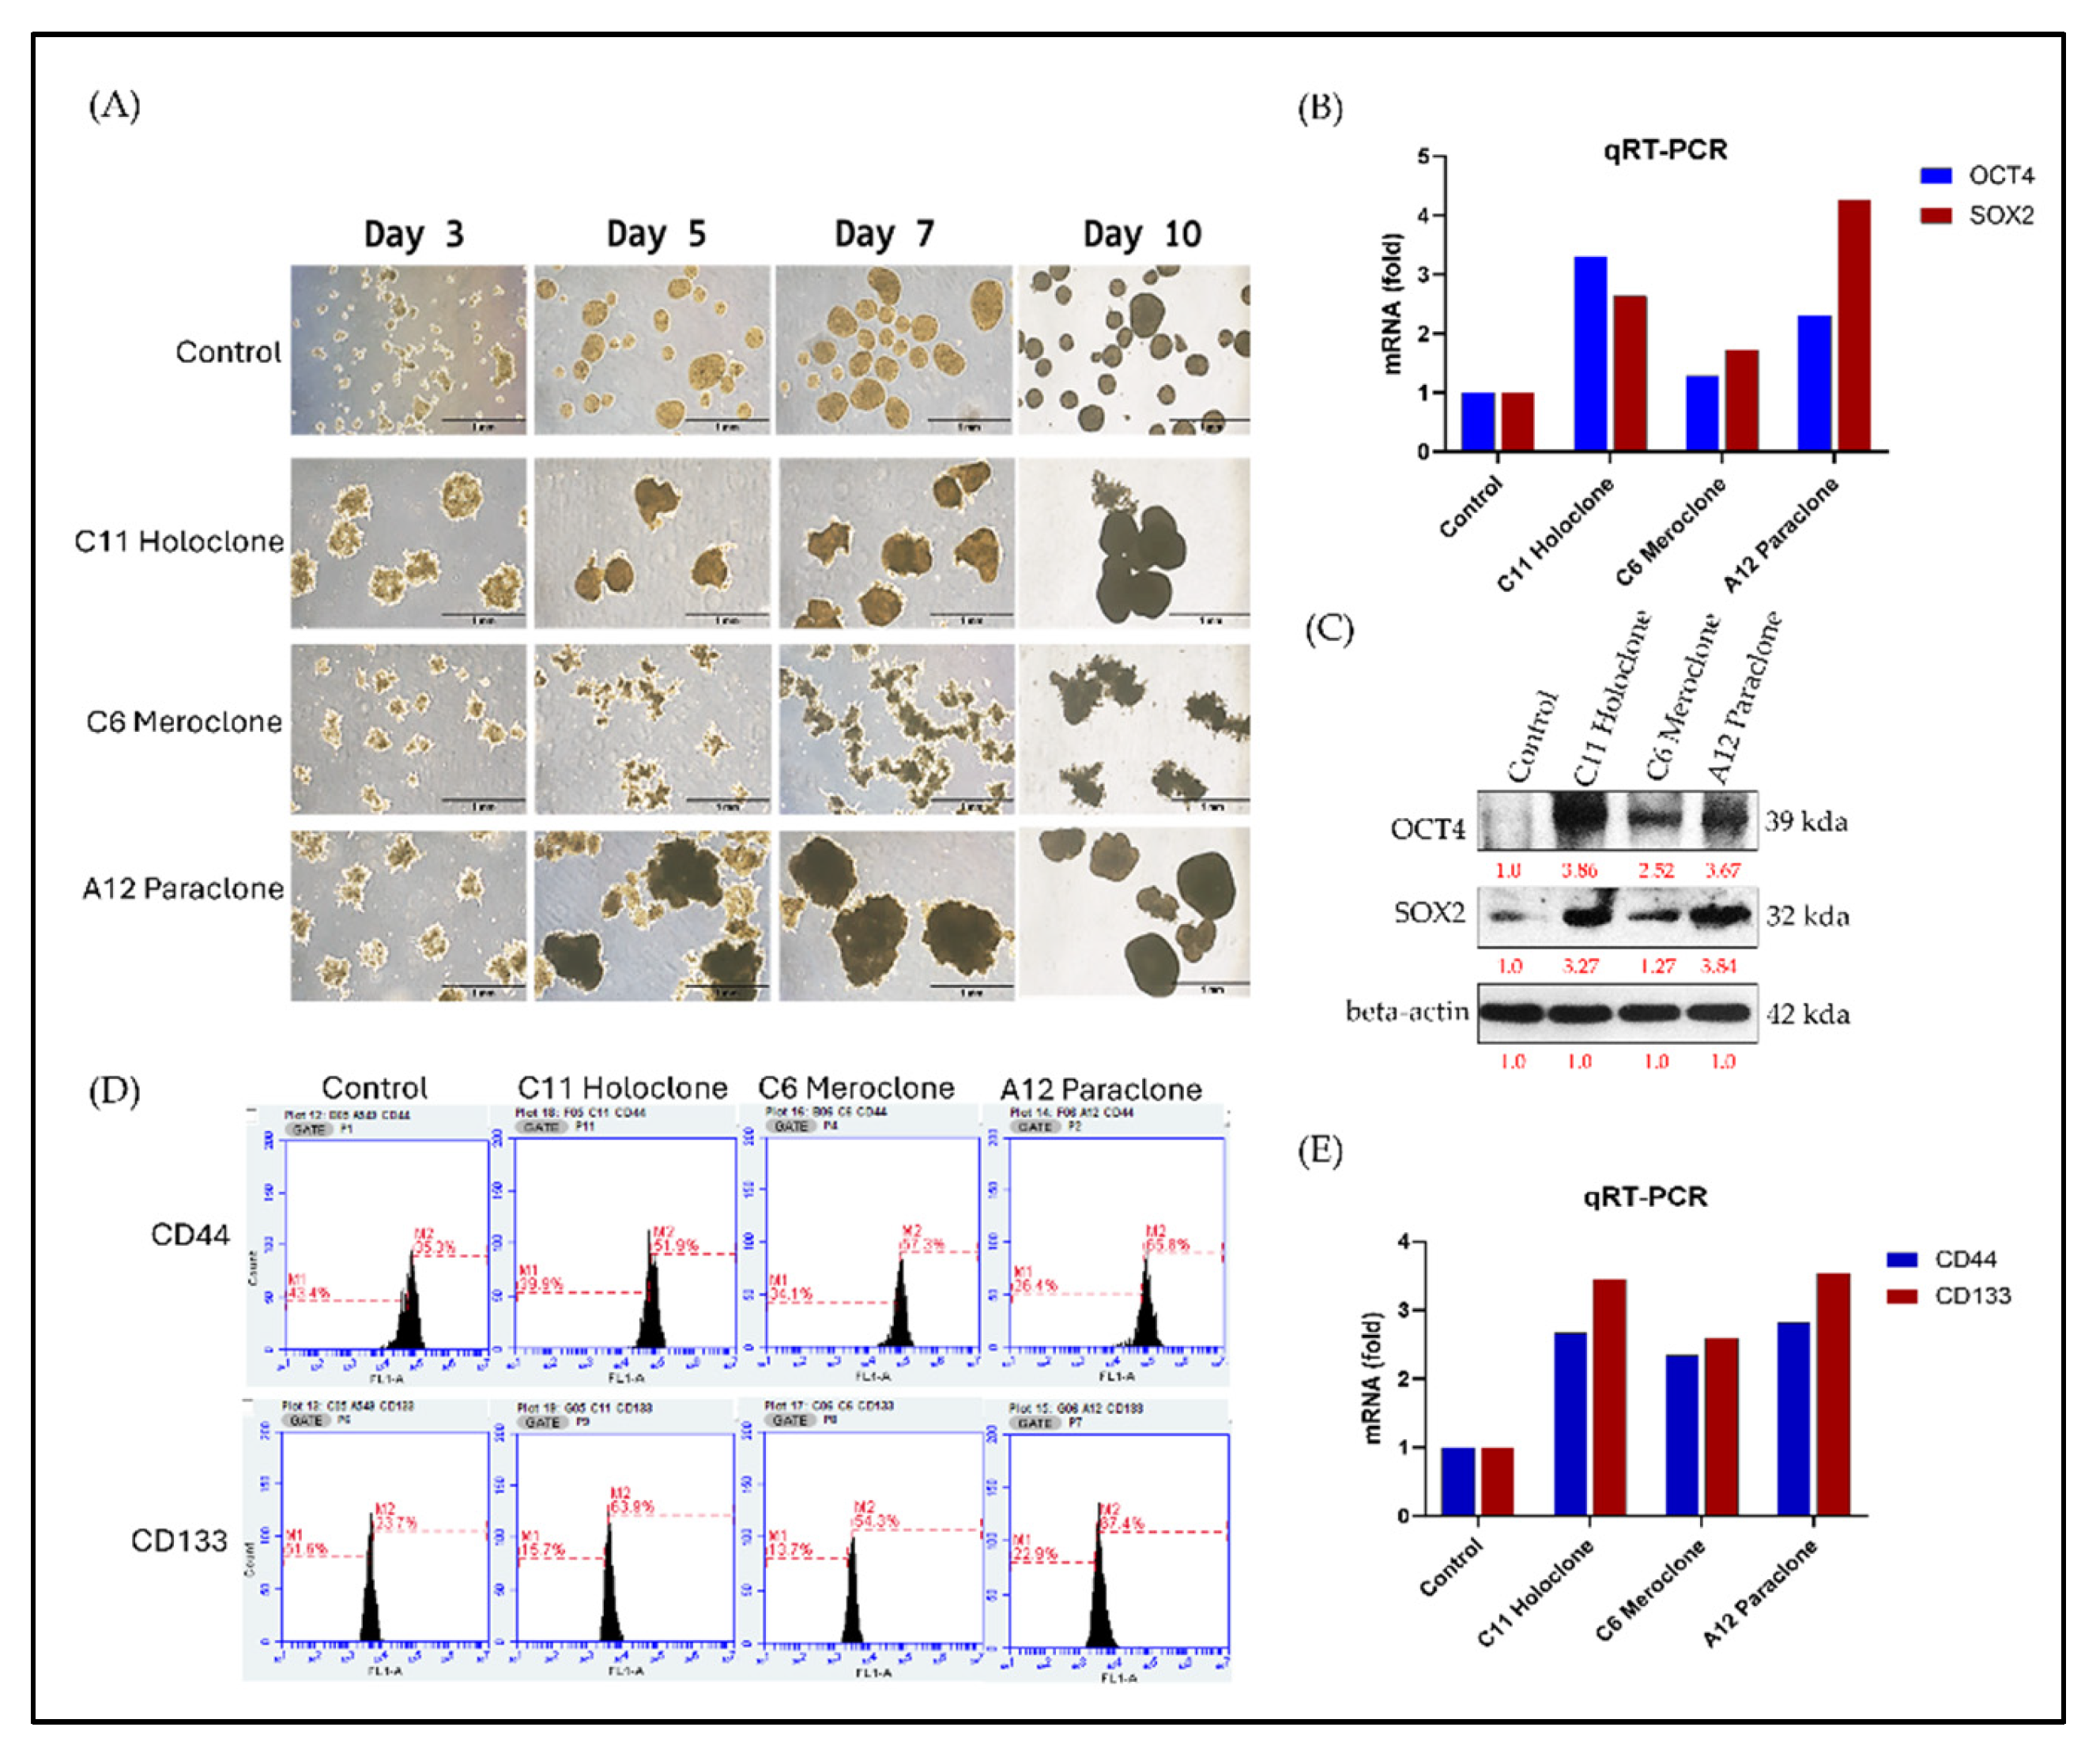
In stem cell and cancer stem cell (CSC) research, OCT4 and SOX2 are pivotal transcription factors linked to pluripotency. Their expression correlates with strong proliferative and regenerative capacities. To assess CSC-like traits in the Holoclone, Meroclone, and Paraclone subclones, we examined self-renewal and spheroid formation. After 10 days, Holoclone and Paraclone formed significantly larger spheroids than Control and Meroclone (
Figure 4A). Spheroid formation under suspension and nutrient-poor conditions is a hallmark of CSC properties, reflecting robust self-renewal and resilience. While Meroclone exhibited a distinctive spiky morphology, it failed to form spheroids as effectively, suggesting an intermediate state with less pronounced CSC features.
At the molecular level, Holoclone and Paraclone showed markedly higher OCT4 and SOX2 expression than Control and Meroclone (
Figure 4B,C). These elevated levels likely endow them with enhanced cell cycle regulation, DNA repair, and metabolic and signaling pathways, facilitating survival and proliferation in drug-resistant environments. Beyond OCT4 and SOX2, we examined two CSC surface markers, CD44 and CD133. Both markers exceeded 50% positivity in all three drug-resistant subclones, surpassing Control’s less than 40% (
Figure 4D). RT-PCR confirmed elevated CD44 and CD133 transcripts (
Figure 4E), reinforcing the link between drug-resistant subclones and CSC phenotypes. This heightened CSC marker profile suggests that such populations may readily resist standard chemotherapy and rebound when therapeutic pressure is lifted, potentially leading to recurrence and metastasis. In summary, Holoclone and Paraclone display pronounced CSC-like characteristics, with robust spheroid formation, elevated OCT4, SOX2, CD44, and CD133 expression, and enhanced proliferative potential. Meroclone’s intermediate traits point to alternative resistance pathways. These findings deepen our understanding of intratumoral heterogeneity and drug resistance, emphasizing the need to target CSC-like subsets to improve therapeutic outcomes and prevent relapse.
2.5. Molecular Characterization of EMT Transformation and Enhanced Invasive Capability in Drug-Resistant Subclonal Cells
Previous studies show that chemoresistant lung cancer subpopulations often express CSC markers and adopt epithelial–mesenchymal transition (EMT)-associated phenotypes [
2,
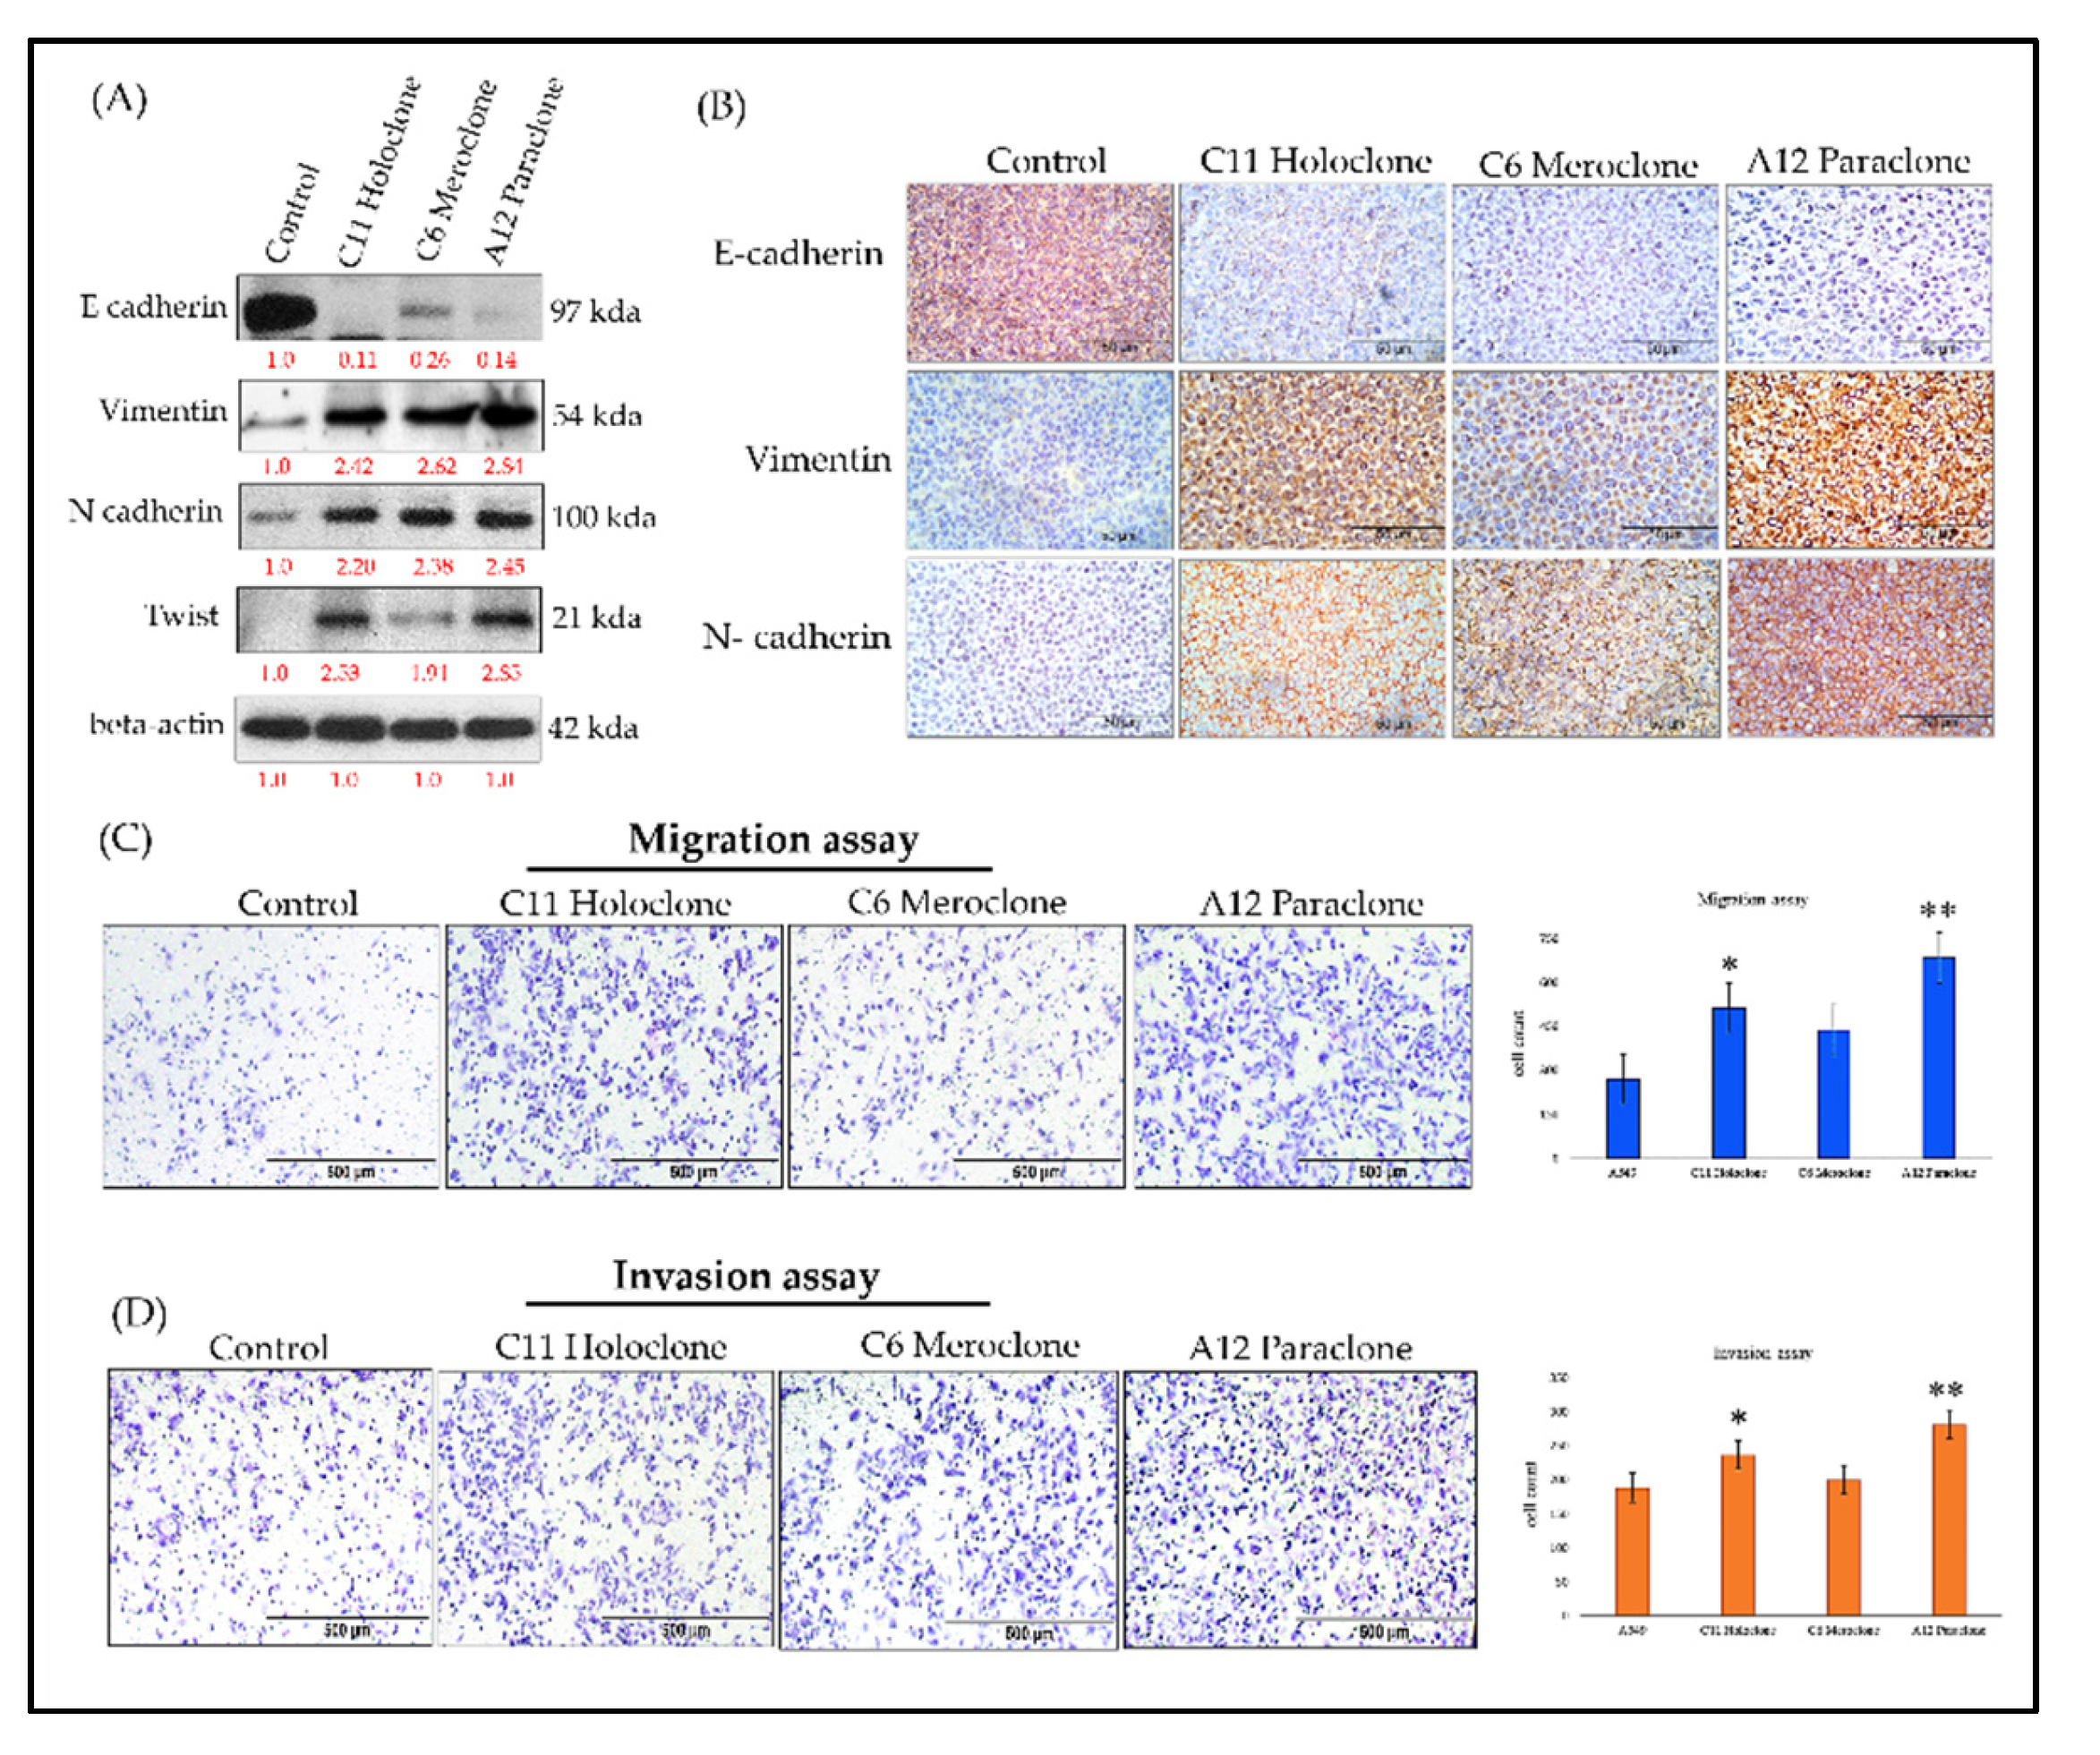
3]. EMT involves a loss of epithelial characteristics—such as E-cadherin expression—and acquisition of mesenchymal features, including increased Vimentin and N-cadherin levels. These changes enhance cell migration, invasion, and overall adaptability, contributing to tumor progression and drug resistance.To clarify this dynamic, we analyzed EMT-related biomarkers in three resistant A549 subclones: Holoclone, Meroclone, and Paraclone. Unlike Control cells, which maintained high E-cadherin expression and epithelial integrity, none of the resistant subclones expressed E-cadherin. Instead, all three exhibited elevated Vimentin and N-cadherin. This shift reflects a mesenchymal phenotype, likely driven by chemotherapeutic pressure. We also examined Twist, a key EMT-transcription factor. Holoclone and Paraclone strongly upregulated Twist, correlating with pronounced EMT and the near-complete loss of epithelial markers. Meroclone displayed a more moderate profile, implying an intermediate EMT state. Functional assays confirmed these molecular traits: all resistant subclones showed enhanced migratory abilities compared to Control cells, while Holoclone and Paraclone demonstrated particularly high invasive potential, suggesting a vital role in advancing metastasis and therapy evasion.
Together, these findings underscore that under drug pressure, tumor cells do not remain static. Instead, they engage an adaptive strategy coupling CSC traits and EMT, shedding epithelial features and gaining invasive mesenchymal properties. While Control cells remain epithelial, Holoclone and Paraclone fully embrace EMT and CSC characteristics, enabling them to detach, invade, and survive under hostile conditions. Meroclone occupies an intermediate stage, retaining some phenotypic flexibility. Recognizing the EMT-driven invasiveness of resistant subclones is critical for refining therapeutic approaches. By understanding these adaptive mechanisms, future strategies can more effectively target the diversity of resistant phenotypes, potentially improving treatment outcomes.
Figure 5.
Molecular Characterization of EMT-Driven Invasiveness in Drug-Resistant Subclones. (A,B) Western blot and immunohistochemical analyses of Holoclone and Paraclone subclones reveal significantly higher OCT4 and SOX2 expression levels compared to Control and Meroclone. Moreover, all three subclones (Holoclone, Meroclone, and Paraclone) exhibit increased Vimentin and N-cadherin, accompanied by reduced E-cadherin expression. (C) Migration assays indicate that these subclones are more migratory than Control. (D) Invasion assays confirm that Holoclone and Paraclone possess greater invasive potential, reflecting an EMT-driven transition. These results suggest that drug-resistant subclones adopt mesenchymal traits and Twist upregulation, enabling them to evade therapeutic pressures, enhance resistance, and potentially contribute to tumor progression, facilitating their survival and dissemination. The results are presented as means ± SD. *p < 0.05 as compared with each group.
3. Discussion
This study employed single-cell isolation techniques to purify and stably culture multiple drug-resistant subclones over the long term. By establishing a comprehensive biobank of drug-resistant subclones, we create a valuable resource that enables systematic exploration of intratumoral heterogeneity and the complexity of resistance mechanisms[
36]. Such a repository not only preserves the unique biological and molecular signatures of these subclones but also facilitates longitudinal, multi-dimensional analyses. This approach allows for parallel evaluations of various therapeutic strategies, advancing our understanding of how different resistant phenotypes emerge, adapt, and interact under selective pressures. Ultimately, this biobank serves as a pivotal tool, driving innovation in targeted therapy design, combination treatment regimens, and personalized medicine protocols aimed at overcoming drug resistance in clinical settings. Compared to conventional serial dilution methods, this approach is more rigorous and effectively minimizes the risk of clonal contamination, thereby laying a solid foundation for precise characterization of each subclone’s unique biological and molecular features. Previous research has established that high intratumoral heterogeneity is a critical determinant of treatment efficacy, recurrence, and metastasis[
37,
38,
39]. Building upon this concept, our study used drug-selective pressure to isolate non-genotype-based resistant subclones, simultaneously correlating their distinct morphological and secretory phenotypes with underlying molecular pathways. This provides a novel, verifiable paradigm for future investigations of cancer drug resistance. By integrating single-cell isolation microfluidic technology with a 3D spheroid culture platform, our study provides new insights into the dynamic behavior and phenotypic characteristics of drug-resistant lung cancer cells in the context of precision medicine. Compared with conventional two-dimensional (2D) cultures, 3D spheroid models more closely mimic the in vivo tumor architecture and nutrient gradients, thereby rendering evaluations of cell proliferation, migration, differentiation, and drug sensitivity more physiologically relevant[
40,
41,
42,
43]. Utilizing this integrated platform allowed us to simultaneously investigate the growth properties and drug-resistant behaviors of Holoclone, Meroclone, and Paraclone subclones under near-physiological conditions, offering more accurate guidance for personalized therapy. Traditional drug screening and therapeutic strategies often rely on the averaged responses of bulk cell populations, overlooking the challenges posed by high intratumoral heterogeneity. Our combined single-cell and 3D spheroid platform circumvents this limitation, enabling refined exploration of diverse subpopulations and their adaptive behaviors. Such an approach not only deepens our understanding of resistance mechanisms and the principles of tumor recurrence but also supports the development of more targeted, individualized interventions. For instance, more aggressive therapeutic measures may be required to inhibit Holoclone subtypes with high self-renewal capacity, while adaptive strategies implemented during drug holidays may prevent the rapid rebound of more plastic subpopulations that can drive relapse. In contrast to studies focusing solely on genetic mutations, our research highlights the significance of cellular phenotypic plasticity and non-genetic factors in resistance mechanisms, echoing recent literature emphasizing the roles of epigenetic modifications and protein interaction networks in shaping therapeutic outcomes[
44,
45].
Furthermore, this is the first application of such a technological platform to malignant pleural effusion (MPE) specimens. We successfully isolated and purified subclones with differential responses to targeted therapies and quantitatively evaluated drug efficacy using a 3D spheroid culture model. The findings demonstrated that Holoclone subclones exhibited notable sensitivity to targeted treatments, whereas Paraclone subclones remained largely unaffected, underscoring the impact of phenotypic heterogeneity on therapeutic results. These observations align with other studies that highlight the influence of non-genetic plasticity and environmental adaptability on drug resistance. Previous efforts to establish primary cultures from clinical lung cancer specimens have frequently encountered poor plating efficiencies and variability influenced by culture conditions and host factors[
46,
47]. Our approach, which included supplementation of the primary cultures with 50% malignant pleural effusion fluid, allowed us to preserve a tumor microenvironment (TME) that closely resembled the in-situ condition. This strategy minimized the artificial selection biases often introduced by standard culture media and helped maintain a diverse range of tumor cell subpopulations reflective of their native milieu.
Tumor cell phenotypic plasticity and non-genetic mechanisms play pivotal roles in metastasis and drug resistance. Through phenotypic heterogeneity, cancer cells employ a “bet-hedging” strategy to remain adaptable under fluctuating therapeutic pressures. The convergence of EMT and CSC properties complicates efforts to fully suppress tumor progression with a single therapeutic modality. Our analyses at the molecular, histological, and functional levels clearly demonstrate that drug-resistant subclones leverage EMT-associated marker changes to enhance their migratory and invasive capabilities, especially in Holoclone and Paraclone subpopulations. These findings underscore the inadequacy of focusing solely on single factors, such as genetic mutations, to comprehend the full therapeutic landscape. The integrated single-cell–derived subclone and 3D spheroid evaluation platform we have developed provides a more holistic perspective on intratumoral heterogeneity, resistance patterns, and adaptive behaviors. By combining genetic profiling, molecular markers, 3D culture data, and clinical parameters, we can begin to design more precise and effective treatment and monitoring strategies that account for the full spectrum of cellular heterogeneity. Employing combination therapies, intermittent dosing, or adaptive treatment regimens may help delay the emergence of resistance and improve clinical outcomes. Future investigations will aim to elucidate the molecular regulatory networks governing differences among subclones and evaluate various drug combinations that could effectively suppress heterogeneous tumor cell populations. By expanding and refining this platform, we anticipate improving the success rate of personalized and precision therapies in clinical settings, ultimately leading to better patient outcomes and quality of life.
By integrating single-cell isolation microfluidic technology with a 3D spheroid culture platform, our study advances the understanding of drug-resistant lung cancer cell behavior within a more physiologically relevant setting. Past research has demonstrated the importance of replicating the TME as closely as possible to predict therapeutic outcomes accurately [
48,
49,
50,
51,
52,
53]. Conventional two-dimensional cultures, although valuable, often fail to capture the complexity and heterogeneity of clinical tumors. By contrast, our 3D spheroid models, by contrast, recapitulate in vivo-like conditions, including nutrient gradients, cell–cell and cell–matrix interactions, and spatial architecture. This approach builds upon the premise that the growth and differentiation of subclonal populations are strongly influenced by their microenvironment, ultimately affecting therapeutic responses. By focusing on Holoclone, Meroclone, and Paraclone subclones, we extended previous findings on intratumoral heterogeneity, drug resistance, and CSC-like properties [
16,
22,
33]. While earlier studies often addressed these issues separately—either by investigating CSC markers or examining EMT-related changes—our integrated single-cell and 3D spheroid platform captures multiple aspects simultaneously. In doing so, we provide a more holistic understanding of how different subpopulations adapt under chemotherapeutic pressure. Notably, Holoclone and Paraclone subclones displayed enhanced self-renewal capabilities and CSC-like phenotypes, marked by elevated OCT4, SOX2, CD44, and CD133 expression. The presence of these markers has been associated with tumor initiation, therapy resistance, and relapse, suggesting that strategies targeting these CSC-rich populations could mitigate resistance and improve long-term patient outcomes. Our results also highlight the dynamic interplay between EMT and CSC properties in promoting drug resistance. While previous work established the importance of EMT in increasing cell motility, invasiveness, and metastasis[
21], our findings connect these processes more explicitly to distinct subclonal populations. Holoclone and Paraclone exhibited marked EMT-related changes, including decreased E-cadherin and increased Vimentin and N-cadherin levels. This phenotypic switch enhances the capacity of these cells to evade therapeutic interventions and disseminate. Similar observations have been made by other groups examining the link between EMT and tumor aggressiveness. However, our study’s single-cell resolution and 3D context provide stronger evidence that such adaptive changes are not uniform across the entire tumor, underscoring the need for personalized therapeutic strategies.
One limitation of our study involves the complexity of translating in vitro findings directly into clinical practice. While our 3D models and primary culture conditions with malignant pleural effusion more closely resemble the patient’s TME compared to standard conditions, they still represent a simplified version of reality. Additional factors—such as immune cell infiltration, stromal components, and systemic physiological processes—were not fully captured[
45,
54,
55,
56]. Moreover, the number of patient-derived samples and the diversity of genetic backgrounds were limited, which may restrict the generalizability of our conclusions. Future studies incorporating organoid co-cultures with immune or stromal cells, as well as larger patient cohorts, will help validate and refine our model.
Looking forward, our integrated platform serves as a steppingstone toward more precise and dynamic therapeutic regimens. By comparing subclone-specific vulnerabilities, future work can identify targeted combination therapies that preemptively address the emergence of drug-resistant phenotypes. Adaptive dosing strategies—intermittently applying drugs or cycling between agents—may prevent or delay resistance by keeping cancer cells in a constant state of readjustment. Moreover, expanding the application of this platform beyond lung cancer to other solid tumors could reveal universal principles guiding intratumoral heterogeneity and drug resistance.
In conclusion, this study leverages single-cell microfluidics and 3D spheroid cultures to provide a more nuanced understanding of lung cancer heterogeneity and adaptive resistance mechanisms. By illuminating how distinct subclones respond to chemotherapy and revealing the intertwining roles of CSC traits and EMT, our work supports a more informed and adaptive approach to precision oncology. This perspective, rooted in previous findings and ongoing hypotheses, underscores the necessity of integrating multiple analytical dimensions—molecular, cellular, and structural—to design next-generation therapeutic strategies aimed at improving clinical outcomes for patients with advanced lung cancer.
4. Materials and Methods
4.1. Cell Culture, Drug-Resistant Cancer Cell Lines and MPE Sample Prepare
A549 cell line originating from human pulmonary adenocarcinomas were obtained from the American Type Culture Collection (ATCC) and cultured according to standard protocols. A549 cells were cultured in Roswell Park Memorial Institute Medium 1640 (Thermo Fisher Scientific) supplemented with 10% (v/v) fetal bovine serum (FBS, ExCell Biology) and 1% (v/v) penicillin− streptomycin (Thermo Fisher Scientific) as normal culture medium. All the cells were incubated at 37 °C in 5% CO2 atmosphere. Cisplatin-resistant A549 cell clones were generated through intermittent exposure to cisplatin at the IC50 concentration. The cells were exposed to 25.11 µM cisplatin—exceeding the established IC50 concentration—for another 24 hours, followed by a return to standard culture conditions. The cells were allowed to recover for two weeks until they reached approximately 70–80% confluence. This cycle of exposure and recovery was repeated three times. The resulting cisplatin-resistant A549 cells were then stored for subsequent studies. Two malignant pleural effusion (MPE) samples from patients diagnosed histopathologically and cytologically with pulmonary adenocarcinoma (PADC) were obtained from the archives of the Department of Pathology, Tri-Service General Hospital, spanning 2024–2025. Approval was granted by the institutional review board (protocol code B202405079). A primary culture cell line was prospectively established culture system with MPE. Among eight initially cultivated primary cell lines, this line proved optimal and was further verified through single cell isolation and tumorspher assessments.
4.2. Single-Cell Isolation and Culture Procedure
A cell suspension was introduced into a microchannel chip equipped with a free-perfusion system (CellGem®, OriGem Biotech Inc.). The CellGem® platform is designed with an array of microwells for single-cell capture, each paired with a corresponding culture well to support long-term cell growth. To initiate the process, 600 µL of the cell suspension (1 × 10^6 cells/mL recommended) was injected into the chip. After a 3-minute settling period, 5 mL of PBS was added to the reservoir to remove any cells not captured in the microwells. The chip was then inverted and kept undisturbed for 30 minutes, allowing the captured cells to naturally settle into the culture wells. Finally, the chip, mounted in its carrier, was placed into a cell culture incubator to promote subsequent cell growth and facilitate downstream analyses.
4.3. D Tumorsphere Culture
To initiate spheroid formation, 100 µL of the cell suspension was introduced into a CellHD256® chip (OriGem Biotech Inc.). After closing the pressure valve, an additional 450 µL of culture medium was added, triggering the pressure-assisted network for droplet accumulation (PANDA) system to create a uniform array of suspended droplets. This approach enables the rapid, cost-effective generation of individual spheroids. Under the influence of gravity, cells within each droplet spontaneously aggregate, forming spheroids with consistent size and morphology. To prevent evaporation, the chip was placed in a 10 cm dish containing sterile distilled water. Cell morphology and growth were monitored every two days, and medium changes were performed as necessary.
4.4. Growth Curves of 3D Tumorsphere Detected by CCK8 Assay
Cell survival was assessed using the CCK-8 assay (MedChemExpress Ltd.). Cancer cells were seeded into a CellHD256® microchip (OriGem Biotech Inc.) and incubated for 96 h at 37 °C with 5% CO₂. The medium was then replaced with drug-containing medium at various concentrations. Each condition was tested in triplicate, and incubation times were determined by drug efficacy. Docetaxel (Selleck Chemicals), Alimta (pemetrexed, Merck & Co., Inc.), Giotrif (Afatinib, Sigma-Aldrich, St. Louis, MO, USA), Capmatinib (MedChemExpress, Monmouth, Junction, NJ, USA), at different concentrations for 72 h. Cell viability was determined using Cell Counting Kit-8 (CCK-8; TargetMol®) according to the manufacturer’s instructions. 10 μL of CCK-8 solution was added to each well, and after 4 h at 37 °C, the OD at 450 nm was measured (Infinite M200 Pro, Tecan). Cell viability was expressed as the percentage of untreated control. The IC50 values, defined as the drug concentrations causing a 50% reduction in proliferation, were calculated. All data are presented as mean ± standard deviation (SD).
4.5. Quantitative Real-Time-PCR (qRT-PCR)
For RNA extraction, total RNA was derived from cultivated cells by employing TRIzol (Invitrogen Life Technologies), and 1 μg of RNA was employed for cDNA synthesis. Quantitative real-time PCR (qRT-PCR) was conducted to assess gene expression using the StepOnePlus real-time PCR system (Applied Biosystems, Waltham, MA, USA). The primers utilized are documented in
Table S3 in the
Supplementary Materials.
4.6. Western Blot Analysis
The protein concentration was determined using the bicinchoninic acid (BCA) protein assay, and denatured proteins were separated via 10-15% SDS polyacrylamide gel electrophoresis and transferred onto PVDF membranes (Amersham, Arlington Heights, IL, USA). Nonspecific binding was blocked with 5% milk in TBST buffer for 2 h, followed by incubation with primary antibodies (
Table S2) at 4°C overnight and secondary antibodies (mouse anti-rabbit and goat-anti-mouse) at room temperature for 2 h. Blots were visualized using ECL detection reagents.
4.7. Migration and Invasion Assay
The migration assay was conducted using modified Boyden chambers equipped with 8 μm pore-size filter inserts designed for 24-well plates. In total, 1 × 10⁴ cells were seeded in 200 μL of serum-free RPMI-1640 medium. Meanwhile, the lower chamber was filled with 500 μL of RPMI-1640 medium enriched with 10% fetal bovine serum to act as a chemoattractant. Following a 24-hour incubation period, cells were fixed using methanol and stained with hematoxylin. Any cells remaining on the basement membrane or adhering to the filter’s upper surface were gently wiped away using paper towels. The cells that migrated to the filter’s lower surface were visualized and quantified under a light microscope. For the invasion assay, a Matrigel/medium (1:2) mixture was placed on the membrane of the upper chamber before seeding the cancer cells. After 12 h of incubation for the migration assay or 24 h of incubation for the invasion assay, non-migratory/invaded cells were removed with a cotton swab wetted in PBS, and migratory or invaded cells were fixed in 4% formaldehyde and stained with hematoxylin at room temperature. The number of migratory cells was calculated by counting cells from five fields of view per slide with 40× magnification while using a counting grid. The obtained data, which were derived from three independent experiments that were performed in triplicate, are presented as the mean ± SD.
4.8. Flow Cytometry
A single-cell suspension containing 1 × 10
6 trypsinized cells and spheres was resuspended in 1 mL of phosphate-buffered saline (PBS) and stained with fluorescent conjugated antibodies against CD133, CD44, CD10, and GPR77 (MAB10254, R&D systems, Minneapolis, MN, USA) for 30 min. After labeling, the cells were washed three times with PBS and subsequently stained with a fluorescein isothiocyanate (FITC)- or PE-labeled secondary antibody for 30 min in the dark. The cells were analyzed using a flow cytometer (FACSCalibur; Epics Elite; Coulter Electronics, Mijdrecht, The Netherlands). Data analysis was performed using Kaluza C analysis software (Beckman Coulter Nederland BV, Woerden, The Netherlands). The antibodies and primers utilized are documented in
Table S2 in the
Supplementary Materials.
4.9. Immunohistochemistry
Three subclones for IHC studies of E-cadherin, Vimentin and N-cadherin stain. Staining intensity was classified as absent (0), mild (1+), moderate (2+), or strong (3+). The bodies used in this study are listed in
Table S2. Cell aggregates were embedded in paraffin, sectioned (~4 μm), deparaffinized, and rehydrated. After antigen retrieval (citrate buffer, pH 6.0), sections were incubated with primary antibodies (e.g., anti-E-cadherin, anti-Vimentin, anti-N-cadherin) at 4°C overnight, followed by HRP-linked secondary antibodies and DAB detection. Hematoxylin was used for counterstaining before microscopic examination.
4.10. Statistical Analysis
The independent Student’s t-test or ANOVA was employed to compare continuous variables between groups, while the Χ2 test was utilized for dichotomous variables. The level of statistical significance was set at p < 0.05. All statistical analyses were performed using SPSS version 22 software (SPSS Inc., Chicago, IL, USA).
Figure 1.
Establishment of Phenotypically Heterogeneous Monoclonal Cell Lines via Single-Cell Cultivation. (A) A549 lung cancer cells were treated with three consecutive doses of cisplatin at the IC50 concentration to simulate clinical chemotherapy pressure and induce drug resistance. (B) Following treatment, the cell population could be stratified into three phenotypically distinct subclones: tiny irregular shapes (blue arrow), polygonal shape (red arrow), and spindle (yellow arrow), reflecting pronounced intratumoral heterogeneity. (C) Single-cell isolation was performed using a specialized microfluidic cultivation chip. After 10–14 days, individual cell colonies reached approximately 70–80% confluence and were subsequently expanded to about 1×10^7 cells. A portion of the cells was cryopreserved in liquid nitrogen for long-term storage and future analyses. (D) A total of 17 stable monoclonal cell lines derived from single-cell isolation were successfully established. These lines encompassed the Holoclone (high proliferation, low differentiation), Meroclone (intermediate state), and Paraclone (high differentiation, low proliferation) phenotypes, each exhibiting distinct differences in proliferation rates and morphological characteristics.
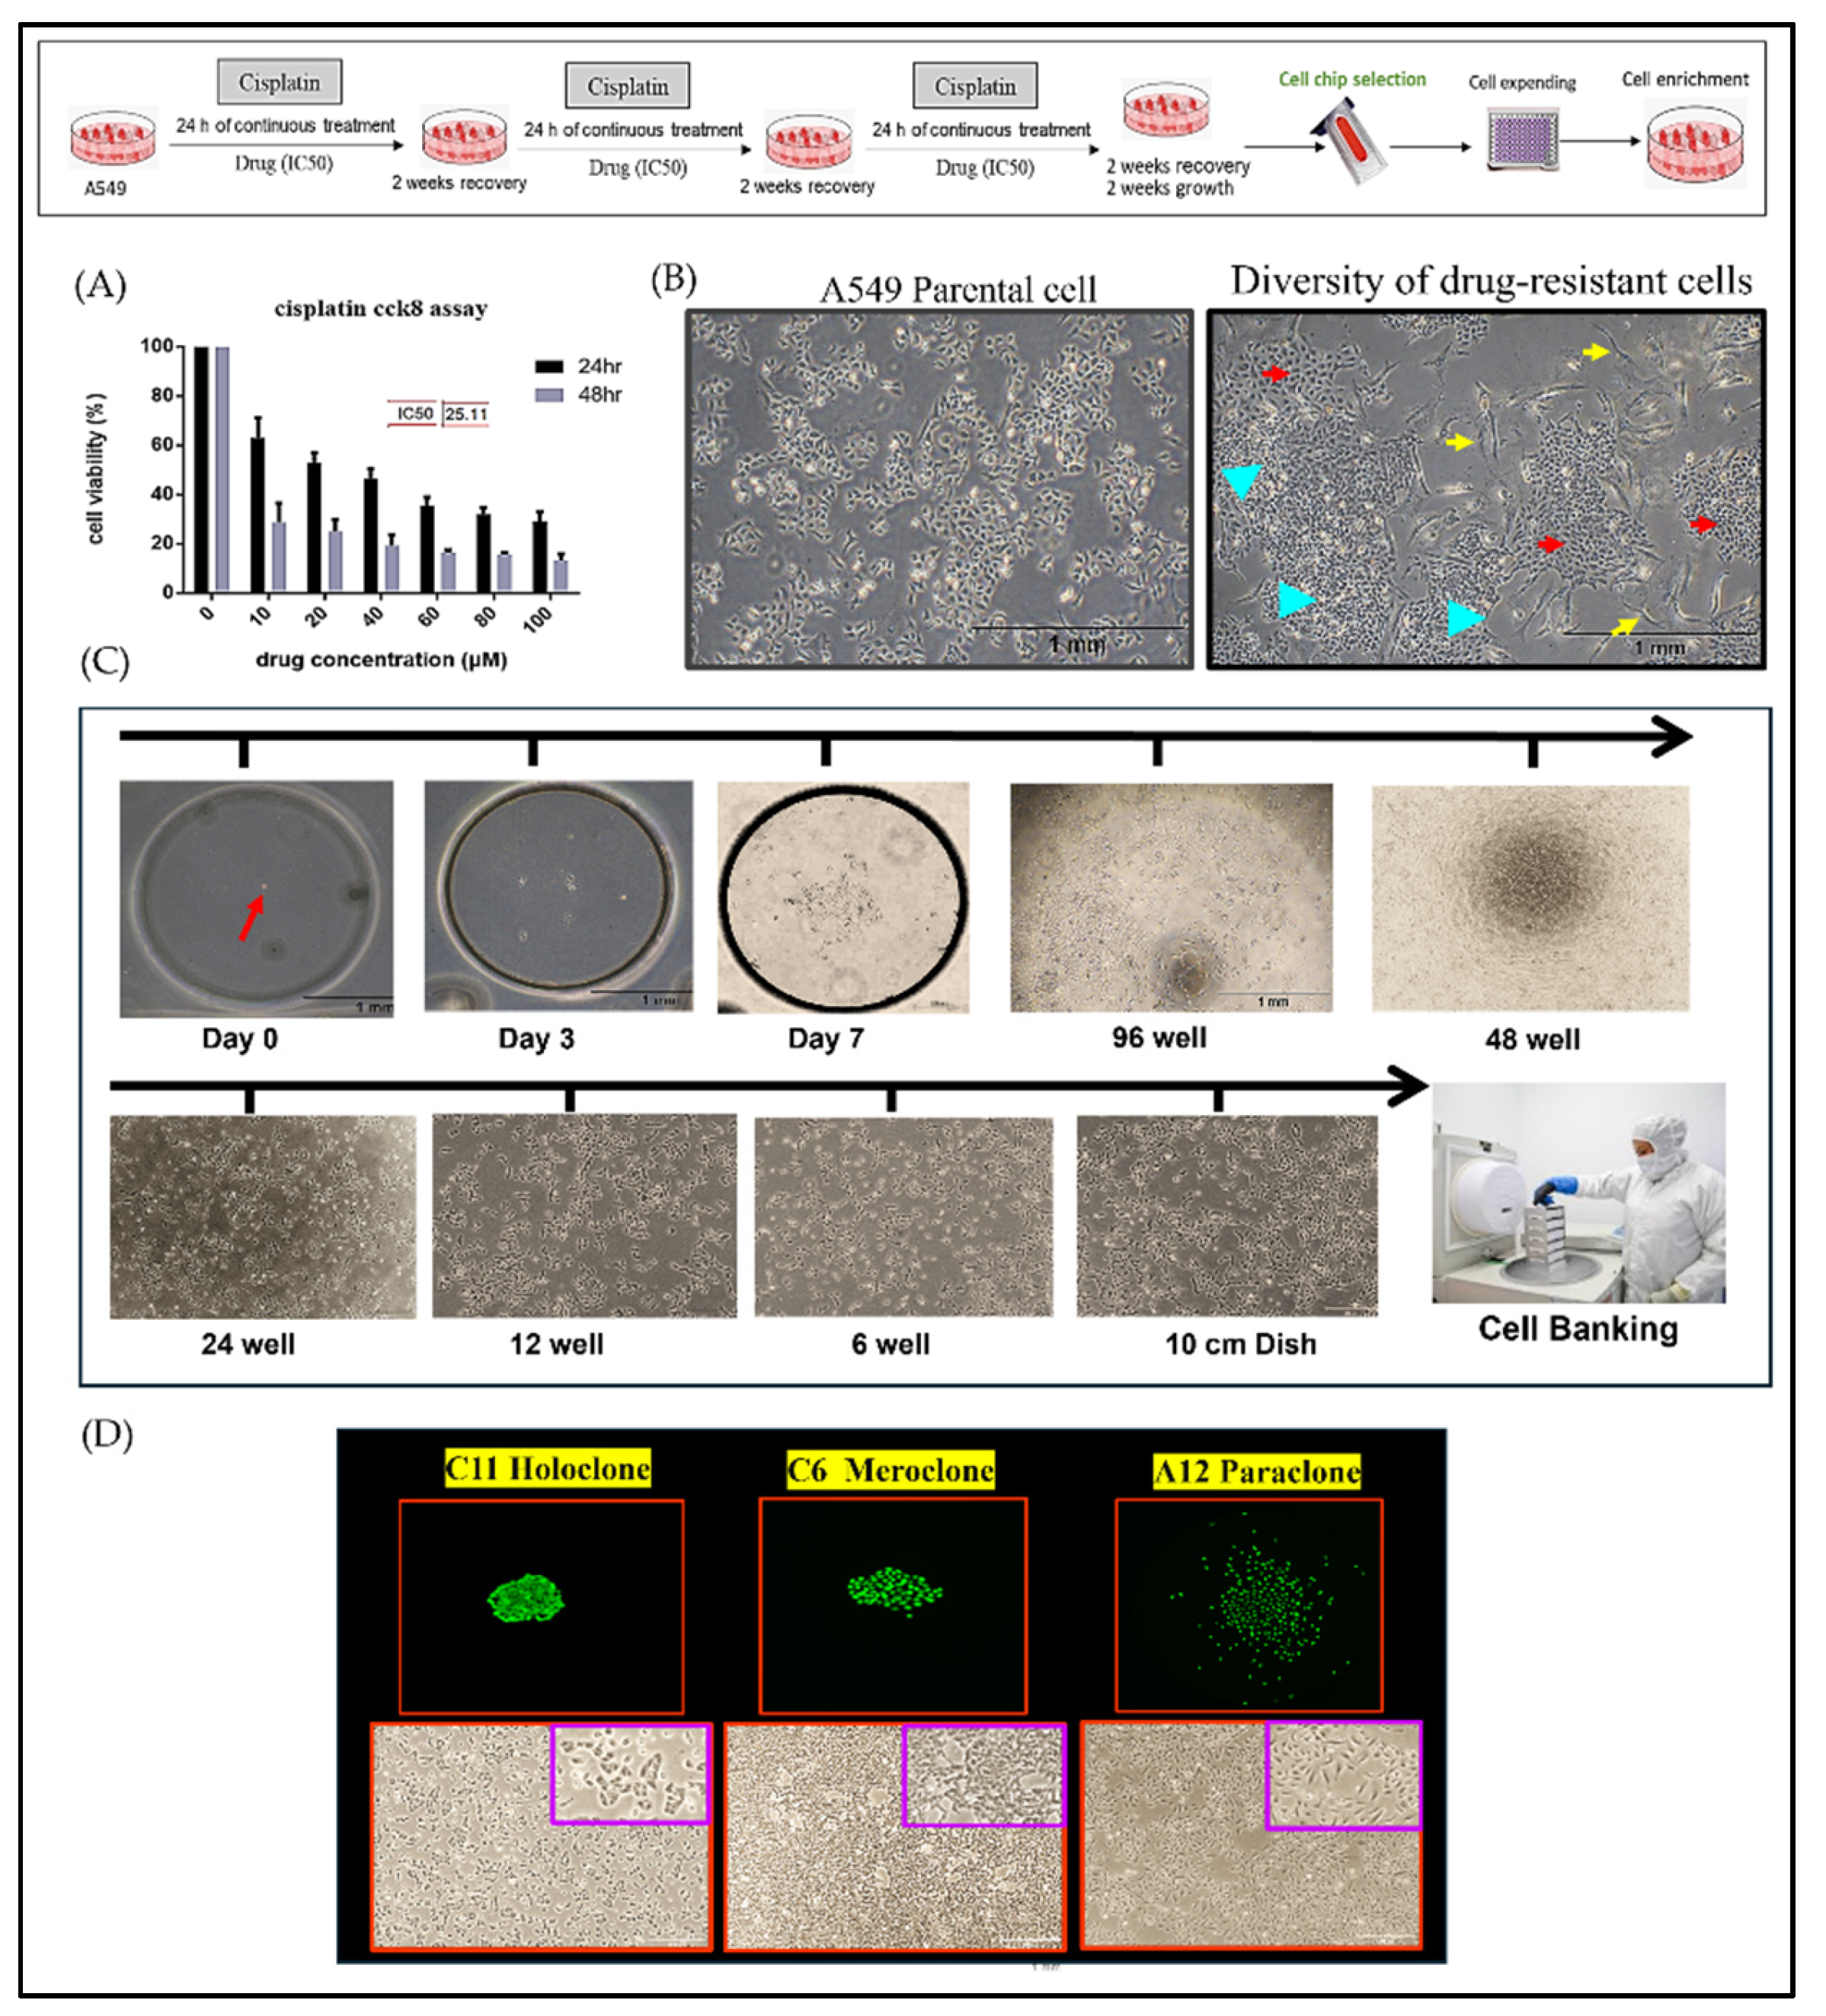
Figure 2.
Differential MDR-1/ABCG2 Expression and Chemosensitivity Among Drug-Resistant Subclones. (A,B) Holoclone and Paraclone cells show significantly higher MDR-1/ABCG2 mRNA and protein levels compared to Meroclone and Control cells, indicating enhanced multidrug resistance. (C) In 3D spheroids, Control cells reach Docetaxel IC50 at 5–10 µM (p<0.05), and Meroclone achieves IC50 at 10 µM (p<0.05). By contrast, Holoclone and Paraclone remain insensitive within this concentration range, demonstrating greater Docetaxel tolerance. (D) Under Alimta (5–10 µM), all subclones achieve IC50 (p<0.01), maintaining strong inhibitory effects. The results are means ± SD for each group of cells from three separate experiments. **p < 0.01 and *p < 0.05 as compared to each group.
Figure 3.
Phenotypic Heterogeneity and Tumorsphere-Based Drug Response Evidence in Primary MPE Cultures. (A) Hematoxylin–eosin (HE) and Papanicolaou’s staining of primary cultures revealed both clustered (yellow arrow) and individually (red arrow) dispersed cell morphologies. In primary cultures, cells displayed both elongated and floating spherical phenotypes. By applying single-cell isolation and expansion techniques, we successfully established two distinct subclones—Holoclone and Paraclone—thereby underscoring their remarkable phenotypic plasticity. (B) In the 3D culture system, MPE primary cells formed stable spheroids within 96 hours. Drug sensitivity assays using the 3D tumorsphere model showed that Giotrif (afatinib) at 60 nM and Capmatinib at 6.5 nM achieved IC50. (C) Both subclones drug sensitivity to Giotrif in Holoclone but had limited effect on Paraclone. In contrast, Capmatinib inhibited in Holoclone and Paraclone growth, demonstrating its pronounced inhibitory efficacy against both subclone types. The results are means ± SD for each group of cells from three separate experiments. *p < 0.05 as compared to each group.
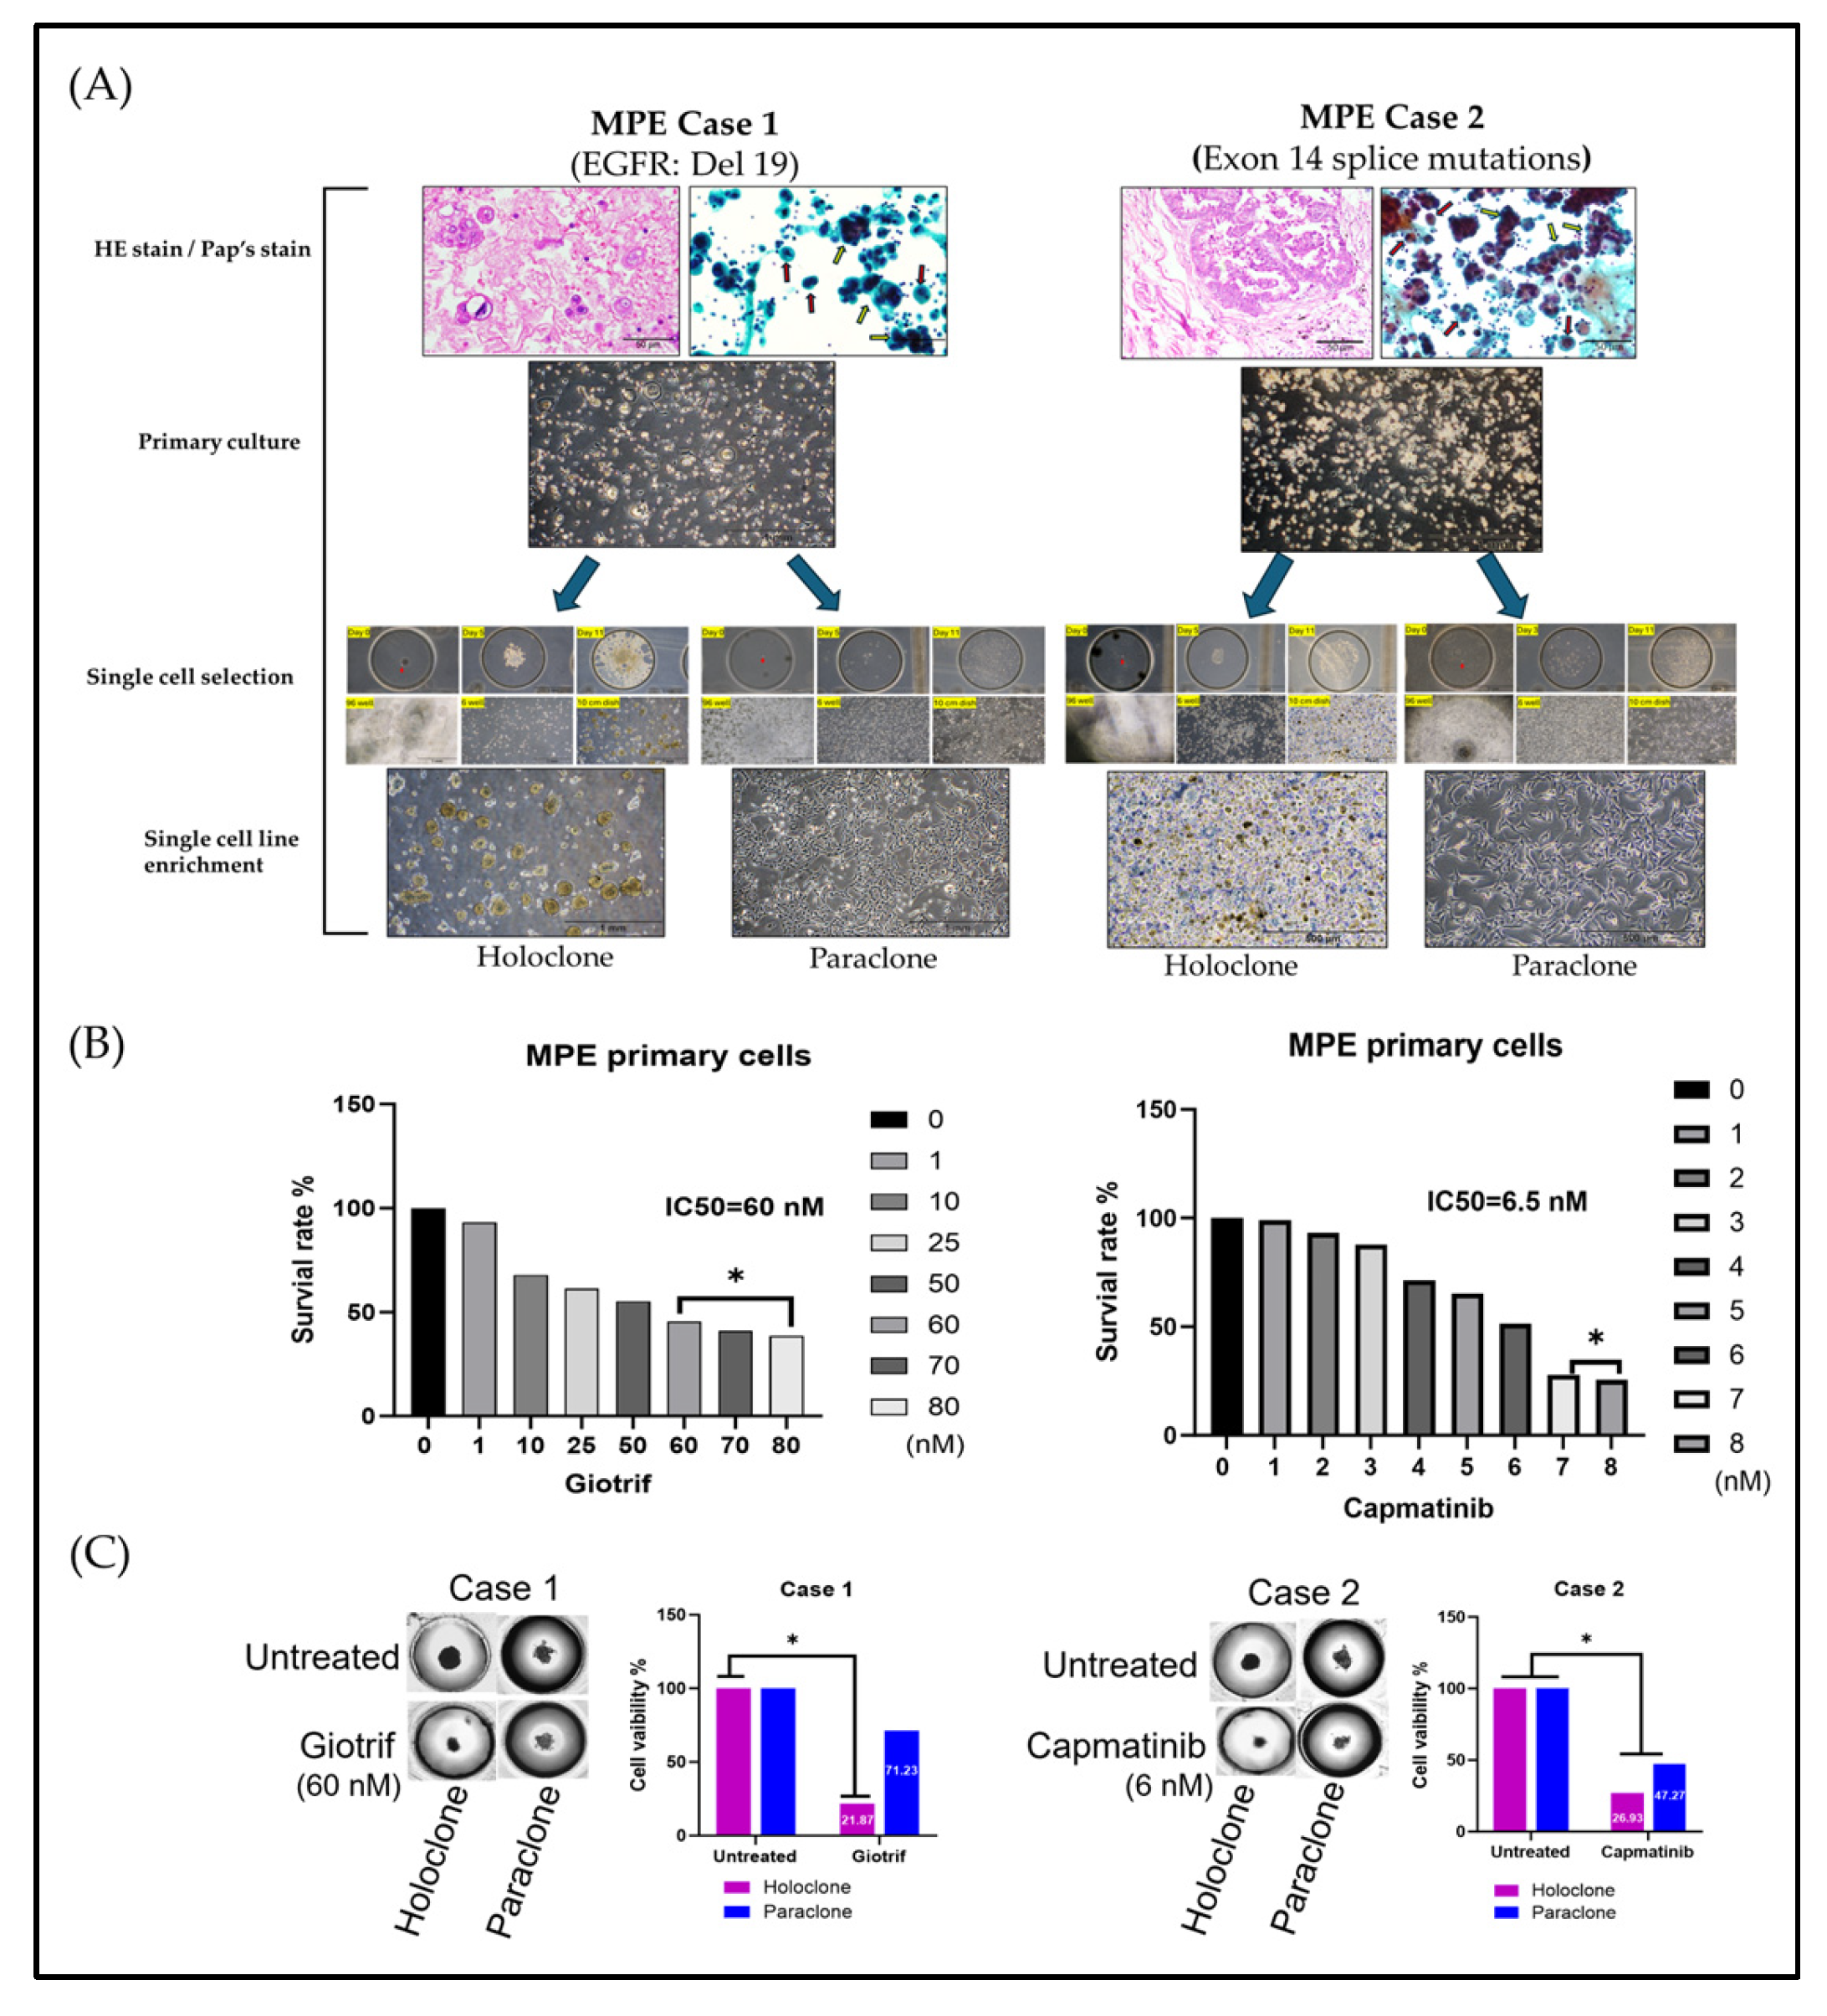
Figure 4.
Differential Stem Cell–Related Gene and Marker Expression in Drug-Resistant Subclones. (A) After 10 days, Holoclone and Paraclone formed significantly larger spheroids than Control and Meroclone, indicating enhanced self-renewal and proliferation. Meroclone’s spiky morphology suggested an intermediate state. (B, C) RT-PCR and protein analyses showed higher OCT4 and SOX2 levels in Holoclone and Paraclone, implying stronger stem-like traits. (D) Over 50% of Holoclone, Meroclone, and Paraclone cells were CD44+ and CD133+, contrasting with <40% in Control, highlighting CSC-like phenotypes. (E) RT-PCR confirmed elevated CD44 and CD133 in all subclones compared to Control, reinforcing their CSC-associated properties and drug-resistant characteristics. This results are presented as means ± standard deviation (SD).