
Submitted:
24 July 2025
Posted:
24 July 2025
You are already at the latest version
Abstract
Disease resistance is one of the most important target traits for sugarcane genetic improvement. Sugarcane brown stripe (SBS) caused by Helminthosporium stenospilum is one of the most destructive foliar diseases, which not only reduces harvest cane yield but also sugar content. This study aimed to identify quantitative trait loci (QTL) and candidate genes associated with SBS resistance. Here, the phenotypic investigation in the field of six habitats showed a continuous normal distribution, revealing that the SBS resistance trait was a quantitative trait. Two high-density linkage maps based on the single dose markers calling from the Axiom Sugarcane100K SNP chip were constructed for the dominant sugarcane cultivars YT93-159 (SBS-resistant) and ROC22 (SBS-susceptible) with a density of 2.53 cM and 2.54 cM per SNP marker, and mapped on 87 linkage groups (LGs) and 80 LGs covering 3,069.45 cM and 1,490.34 cM of genetic distance respectively. A total of 32 QTL associated with SBS resistance were detected by QTL mapping, which explained 3.73%–11.64% of the phenotypic variation, and the total of phenotypic variance explained (PVE) in YT93-159 and ROC22 were 107.44% and 79.09%, respectively. Among these QTL, four repeatedly detected QTL (qSBS-Y38-1, qSBS-Y38-2, qSBS-R8, and qSBS-R46) were considered as stable QTL. Meanwhile, two major QTL, qSBS-Y38 and qSBS-R46, could account for 11.47% and 11.64% of the PVE respectively. Twenty-five disease resistance candidate genes were screened by searching these four stable QTL regions in their corresponding intervals, of which Soffic.01G0010840-3C (PR3) and Soffic.09G0017520-1P (DND2) were significantly up-regulated in YT93-159 by qRT-PCR, while Soffic.01G0040620-1P (EDR2) was significantly up-regulated in ROC22. These results will provide insightful information for future studies of sugarcane breeding in combating this disease.
Keywords:
sugarcane brown stripe
; SBS resistance
; genetic map
; QTL mapping
; candidate gene
1. Introduction
Sugarcane (Saccharum spp. hybrids, 2n = 100-130) is widely cultivated in tropical and subtropical regions and is one of the most important sugar and bioenergy crops. Sugarcane provides 80% of sugar and 60% of bioethanol production worldwide [1]. Nevertheless, various biotic and abiotic stresses have seriously affected the development of sugarcane industry. As far as biotic stress is concerned, sugarcane brown stripe (SBS), caused by the fungal pathogen Helminthosporium stenospilum, is a very harmful fungal disease of sugarcane leaves, resulting in decreased resistance, yield and sugar content of sugarcane [2,3]. Outbreaks of this disease usually causes a yield loss of 18% to 35% for susceptible varieties, and in some cases, it can even reach 40% [2]. The occurrence, development and prevalence of SBS are strongly affected by environmental humidity and temperature. The initial symptoms on leaves are small water-soaked spots (about 0.5 mm in size), and subsequently the leaf lesions gradually expand into stripes parallel to the leaf veins, and the leaf lesions change into reddish-brown in the middle and late stages of SBS infection. The length of leaf lesions is generally 2–25 mm, and the width of leaf lesions will not exceed 4 mm, accompanied by yellow halos. SBS eventually leads to a complete loss of photosynthetic capacity and wilting in the leaves [4,5].
Modern sugarcane cultivars are interspecific hybrids with highly complex genetic backgrounds. Sugarcane breeding relies on large populations with segregating traits and phenotypic selection [6,7]. For example, more than one million seedlings are cultivated every year in China. Sugarcane lacks necessary biotechnological tools for genetic improvement and has been limited to selection of superior seedlings based on the phenotypic traits. Therefore, it is particularly important to develop trait associated DNA markers to improve the breeding efficiency. The agronomic traits of polyploid sugarcane which majority belong to dodecaploid are basically controlled by multiple minor genes or QTL, and the phenotypic variance explained (PVE) between each locus is different. Mapping QTL associated with sugarcane important traits on sugarcane and developing reliable trait-associated linkage markers are the key steps in the application of molecular marker-assisted selection (MAS) to sugarcane genetic improvement and variety breeding [8,9,10]. Currently, only two markers, R12H16 and 9020-F4, which are closely linked to the brown rust resistance gene Bru1, have been applied in sugarcane breeding [11].
A series of studies on association markers related to important traits of sugarcane have been reported [12,13,14]. Aitken et al. [15] constructed the first linkage map of sugarcane with DArT markers without removing any redundant markers. With the upgrading of DNA molecular markers, the rapid development and cost reduction of high-throughput sequencing technology and array genotyping technology, traditional molecular markers such as DArT [16], RAPD [17], RFLP [18], and AFLP [17,19] have shown the disadvantages of low throughput and low efficiency in genotyping, and it is difficult to carry out large-scale population detection efficiently. In contrast, SNP markers have the advantages of rich polymorphism, high coverage density, high genetic stability and high-throughput analysis [20]. Therefore, SNP chips have been continuously developed for polyploid species. These chips have been reported on QTL mapping of agronomic traits and disease resistance traits in maize (Zea mays; 2n = 4x = 40; 50K array) [21], oilseed rape (Brassica napus L.; 2n = 4x = 48; 60K array) [22], wheat (Triticum aestivum L.; 2n = 6x = 42; 660K array) [23], and sugarcane (Saccharum spp. Hybrids; 2n = 12x= 100-130; 100K array) [24]. In terms of sugarcane disease resistance traits, Yang et al. [25] identified three QTL (qORR109, qORR4, and qORR102) related to orange rust (Puccinia kuehnii) resistance using 173 progeny from the cross F1 segregating population of sugarcane variety CP95-1039 × CP88-1762, with a PVE of 58%, 12%, and 8%, respectively. A study by You et al. [26] reported that 23 QTL associated with ratoon stunting disease (RSD) resistance using 146 progenies from sugarcane variety CP80-1827 selfing population were mapped, which explained 6.0% – 13.0% of the PVE. In addition, 82 candidate RSD resistance genes were mined by gene function annotation on their corresponding regions. Recently, six QTL (qSLB-1-qSLB-6) associated with sugarcane leaf blight (SLB) resistance were mapped in sugarcane variety YT93-159 × ROC22 F1 segregating population and screened 16 candidate SLB resistance genes in the candidate region of the major QTL qSLB-1 (PVE = 16.4%) [27]. In summary, previous research findings provide more beneficial gene resources and technical support for sugarcane genetic improvement including disease resistance breeding.
An insufficient heritable resistance is the basis of occurrence and prevalence of SBS disease, which are strongly affected by environmental humidity, and a long-term or continuous rainy weather is conducive to outbreak and spread of the diseases. Therefore, the trait of phenotypes of SBS disease resistance is unstable and needs several crop seasons to ensure the varieties being expose to various climatic conditions and encounter the most favorable conditions for the prevalence. This thereby enhanced the objectivity of the phenotyping of SBS resistance. Considering the one-year growth cycle of sugarcane and several cycles of SBS disease epidemic in a single crop season, an environment friendly and cost-effective prevention and control strategy for SBS is planting the disease resistant varieties, just like other crops that have similar epidemic diseases [28]. To date, research on SBS was limited to the isolation and identification of the pathogen, as well as the disease epidemic regularity and pesticide control [2]. In breeding programs, it is particularly important to develop the associated markers and gene resources controlling SBS resistance in order to improve the efficiency of sugarcane disease resistance breeding. The objectives of this study were to (1) construct an F1 segregation population used for mapping; (2) to phenotypically evaluate the SBS resistance reaction for this population in a mapping population; (3) to construct the genetic linkage maps of the parents and map QTL associated to SBS resistance; (4) to identify candidate genes associated with SBS resistance. The findings from this study are expected to provide some potential SNP markers for genomic selection and genes for improvement of SBS resistance in sugarcane breeding programs, thus accelerating the release of resistant varieties in future.
2. Materials and Methods
2.1. Construction of F1 Population and Evaluation of SBS Resistance
In this study, a sugarcane F1 segregating population comprised of 285 F1 progenies was derived from a bi-parental cross between two dominant sugarcane cultivars YT93-159 (maternal parent, SBS-resistant, 2n = 108) and ROC22 (paternal parent, SBS-susceptible, 2n = 110), which were developed by the Hainan Sugarcane Breeding Station (Sanya, Hannan, China) in 2014. All F1 progeny and their parents were planted in Longchuan, Yunnan, China (24°25′ N, 97°88′ E) following a randomized complete block design (RSBD) with three replicates, one of the main sugarcane producing regions, and its local climate and environmental conditions were conducive to the prevalence of SBS. Each sugarcane clone (seven stems with two buds each) in each replicate was plated in a 1.0 m single row plot and 1.1 m row spacing for phenotype evaluation and leaf sampling. The SBS-susceptible variety ROC22 was used as a protective and disease inducer line, and field management was carried out according to local practices. Sugarcane clones of the progeny were clonally propagated in the field for phenotype evaluation and leaf sampling. From 2015 to 2020, the severity of SBS for all clones in the field was investigated and recorded at the peak of the epidemic using a five-grade grading scale (Figure S1) described by Cheng et al. [3]. Thus a total of six sets of SBS grading data from six habitats, including three from the plant cane and three from the ratoon cane were collected. The IBM SPSS Statistics 22 software (International Business Machines Inc., California, USA) was used for phenotypic statistical and correlation analyses. A pairwise Pearson correlation analysis across the SBS grading data of six habitats was calculated. In addition, the broad-sense heritability (H2) was calculated as follows:
2.2. Genotyping and Linkage Map Construction
Genotyping of the F1 mapping population and bi-parents was called using a customized Axiom Sugarcane100K SNP chip by Thermo Fisher Scientific (Guangzhou, China). This chip is loaded with over 100,000 sugarcane single-dose (SD) SNP probes [29]. In order to improve the accuracy of QTL for SBS resistance, the progeny of the SBS resistance phenotypic data in the field with large errors in six habitats were eliminated. Ultimately, the genotyping data and phenotypic data of 218 progenies were selected for using in the subsequent analysis. Then, the original data was subjected to quality control, filtering, normalization, and finally screening polymorphic SNP markers using Axiom best practices genotyping software. These SNP markers with a deviation from 1:1 segregation ratio and P < 0.01 were dropped via χ2-test. A two-way pseudo-testcross strategy was employed for QTL analysis using GACD V.1.2 software [27]. For the sake of accuracy and quality, only SD markers after screening for polymorphic markers were used to construct the linkage maps of the parents YT93-159 and ROC22, respectively. When constructing a genetic map, the Kosambi mapping function was used for linkage analysis, and the Haldane’s function was used to convert the recombination frequency into a mapping distance. Then, according to the following three essential steps for genetic mapping, the parameters were set as follows: a logarithm of odds (LOD) value of 10.0 for marker grouping, the nnTwoOpt (k-Optimality) algorithm for marker ordering, and the sum of adjacent recombination frequency (SARF) for marker rippling. It should be noted that to ensure the accuracy of the map, linkage groups (LGs) with a genetic distance greater than 35 cM between markers were disconnected to form two linkage groups. Additionally, LGs containing only one SD marker were deleted, and the remaining LGs and SD markers were used for further QTL analysis. The linkage map was visualized using the R package LinkageMapView 2.1.2, including the display of marker density on LGs.
2.3. QTL Mapping
Inclusive composite interval mapping (ICIM) was employed to identify QTL for the trait of sugarcane brown stripe resistance trait using GACD V.1.2 [24,27]. The phenotypic data of each line corresponds to the genotype one by one. The QTL mapping parameters were as follows: mapping parameters step 1.0 cM, default logarithm of odds (LOD) threshold 2.5, and the remaining parameters default. Previous studies have shown that PVE greater than or equal to 10% was considered a major QTL. If the PVE was higher than 3% but lower than 10%, it is called a minor QTL. In addition, if a single QTL was repeatedly detected in multiple habitats, it can be considered a consistent QTL. The detected QTL were named according to McCouch et al. [30]. The software RStudio and Adobe Illustrator CS6 were used to assist in drawing the QTL distribution on the LGs.
2.4. Annotation and Screening of Candidate Genes
Here, all gene sequences in the interval between two flanking SNP markers of QTL stably detected in multiple habitats were used to screen candidate genes associated with SBS resistance. Firstly, we aligned the flanking SNP probe sequences (71-bp) (Table S1) to the S. officinarum LA purple genome (http://sugarcane.zhangjisenlab.cn/sgd/html/download.html, accessed on 8 June 2025) to search for all genes. Then, the Conserved Domain Database (CDD) (https://www.ncbi.nlm.nih.gov/Structure/cdd/wrpsb.cgi, accessed on 8 June 2025) of the NCBI website was used to predict the conserved domains of the extracted gene sequences, and the Blast tool of the Arabidopsis thaliana TAIR database (https://www.arabidopsis.org/Blast/index.jsp, accessed on 8 June 2025) with an e-value threshold < 1e-06 and identity ≥ 90% was also used in functional annotations via Arabidopsis homologous genes. The annotated genes were filtered and screened in the Blast tool of the PlantTFDB 5.0 database (http://planttfdb.gao-lab.org/blast.php, accessed on 10 June 2025) and PRGdb database (http://prgdb.org/prgdb4/blast, accessed on 10 June 2025), and finally the candidate genes associated with SBS resistance were identified (Table S2).
2.5. qRT-PCR Verification of Candidate Genes
Based on the results of QTL analysis and functional annotation, the expression patterns of three selected SBS resistance candidate genes in resistant/susceptible parents were verified by qRT-PCR. Total RNA of ROC22 (SBS-susceptible) and YT93-159 (SBS-resistant) was extracted according to the report of Cheng et al. [3]. Four primer pairs were designed by Primer Premier 6 based on the coding sequences of the three selected genes (Table S3). The glyceraldehyde-3-phosphate dehydrogenase gene (GAPDH) was selected as an internal reference gene. The first strand cDNA synthesis was carried out following the instructions of Prime-ScriptTM RT Reagent Kit (TaKaRa, Shimogyo-ku, Kyoto, Japan). The qRT-PCR amplification system and procedure were performed based on the report of Cheng et al. [3]. Three biological replicates were conducted for each sample, and the relative expression levels of the SBS-resistant candidate genes were calculated according to the 2–ΔΔCt value. Histograms were generated by GraphPad Prism 8, and the significance of the difference in expression levels between different samples was also conducted by GraphPad Prism 8.
3. Results
3.1. Phenotypic Data Analysis
The six-year data sets of SBS disease severity in the F1 mapping population showed a continuous normal distribution indicating that the SBS resistance is a quantitative trait (Figure 1). SBS phenotypic scores in the F1 mapping population from 2015 to 2020 were highly correlated (P < 0.01) with a Pearson correlation coefficient of 0.28 – 0.67 (Table 1). Among them, the correlation coefficient of SBS resistance between the first ratoon (2016) and the second ratoon (2017) was 0.51. The correlation coefficient of SBS resistance between the plant cane in 2015 and 2020 was 0.42. In addition, the coefficient of variation (CV) of this trait in 2015 – 2020 was 30.06%, 34.58%, 31.54%, 34.26%, 33.33% and 29.33%, respectively. Among them, the CV of the first ratooning in 2016 and the plant cane in 2018 was the largest, which were 34.58% and 34.26%, respectively. The broad-sense heritability (H2) of SBS resistance was 0.52 by conducting six-year data sets together (Table S4), indicating that the disease resistance in the F1 mapping population was mainly controlled by genetic factors. Therefore, the F1 population and its phenotypic data of SBS disease resistance can be used for subsequent QTL analysis.
3.2. Linkage Map Constructed from the F1 Mapping Population
The high-density linkage maps of bi-parents were constructed based on the genotyping results of Axiom Sugarcane100K SNP chip. In this study, a total of 1,814 and 929 SD SNP markers in the paternal YT93-159 and maternal ROC22 were validated, respectively. The linkage map of ROC22 was constructed with 587 (63.2%) SD SNP markers forming 80 LGs, which covered 1,490.34 cM genetic distance and had a density of 2.54 cM per marker using GACD. The numbers of SNP markers varied significantly among the 80 LGs, with 23 LGs containing only two SNP markers, while LG5, LG31, and LG12 containing 92, 40, and 39 SNP markers respectively (Figure S2). For the maternal YT93-159, 1,211 (66.8%) SD SNP markers were mapped to 87 LGs containing 3,069.45 cM genetic distance with a density of 2.53 cM per marker. Similarly, 87 LGs with SNP marker numbers ranging from 2 to 94. Among them, 17 LGs containing only two SNP markers, while LG14, LG6, LG17, LG42 and LG26 containing 94, 90, 85, 74, and 73 SNP markers respectively (Figure S3). The average marker density of the linkage maps of the two parents was less than 3.0 cM, which met the requirements for subsequent trait related QTL mapping.
3.3. QTL Analysis of SBS Resistance
In the current study, a total of 32 QTL with a LOD threshold > 2.5 associated with SBS resistance were detected in the F1 mapping population, and the percentage of PVE of all those QTL ranged from 3.73% to 11.64% (Table S5), of which 21 QTL were detected in the genetic map of maternal YT93-159 (Figure 2) and 11 QTL in the paternal ROC22 (Figure 3). Among them, one major QTL detected in the plane cane in 2020 was identified in LG38 of the YT93-159 genetic map, named qSBS-Y38, with 11.47% of PVE in the F1 mapping population (Figure 2). The other one major QTL with 11.64% of PVE was mapped to LG46 of the ROC22 genetic map, also detected in the plane cane in 2020, named qSBS-R46 (Figure 3). It is interesting that four QTL associated with SBS resistance were considered as stable QTL, which were repeatedly detected in different habitats, including qSBS-Y38-1 in 2018 and 2020, qSBS-Y38-2 in 2016 and 2018, qSBS-R8 in 2016 and 2018, and qSBS-R46 in 2015, 2016, and 2020, respectively. The additive effects of all detected QTL ranged from 0.23 to 0.21, and all stable QTL were less than or equal to 0, indicating that the positive alleles were derived from the disease-resistant parent. (Table S2). In addition, the genetic distance between the QTL peak and the nearest marker was mostly less than 1.0 cM, with an average of only 1.1 cM (Table S2).
3.4. Screening of Critical Genes Associated with SBS Resistance
In order to identify candidate genes for SBS resistance, we searched for genes from eight flanking SNP markers within the intervals and the 200 kb extension region of the four stable QTL detected repeatedly in different habitats in the genome of S. officinarum LA purple using the probe sequences (71 bp) of the eight flanking SNP markers (Table S3). A total of 2,809 candidate gene sequences were extracted. Twenty-five candidate genes associated with SBS resistance including 11 transcription factor family genes (Calmodulin-binding transcription activator, CAMTA; NAC domain transcription factor, NAC; basic helix-loop-helix, bHLH; MYB transcription factor, MYB; Basic leucine zipper, bZIP; BEL1-like homeodomain, BLH; Ethylene responsive factor, ERF, Cycling dof factor, CDF; Teosinte branched1/cycloidea/proliferating cell factor, TCP; WRKY transcription factor, WRKY, and TGACG motif-binding factor, TGA), 11 pathogen pattern recognition receptor/receptor-like kinases (Proline-rich protein 5, PR5K; Cysteine-rich receptor kinase, CRK; Leucine-rich repeat-receptor-like kinase, LRR-RLK; Receptor-like protein kinase 1, RLK1; Hercules receptor kinase 1, HERK1; G protein-coupled receptor kinase 2, GRK2; Receptor-like protein kinase 2, RLK2; Cal-cium-dependentcalmodulin-bindingreceptor-like kinase 1, CBRLK1; Leucine-rich repeat receptor kinase 3, RK3, Proline-rich receptor-like protein kinase 5, PERK5, and FLG22-induced receptor-like kinase, FRK). Of these, three critical resistance-related genes (Soffic.01G0010840-3C, pathogenesis-related protein, PR3; Soffic.09G0017520-1P, defense no death 2, DND2; Soffic.01G0040620-1P, enhanced disease resistance 2, EDR2) were identified and annotated by CDD, PlantTFDB 5.0, PRGdb 4.0 and TAIR databases (Table S4). These candidate genes may play an important role in plant immune response and plant-pathogen defense mechanisms.
3.5. Expression Analysis of Critical Candidate Genes by qRT-PCR
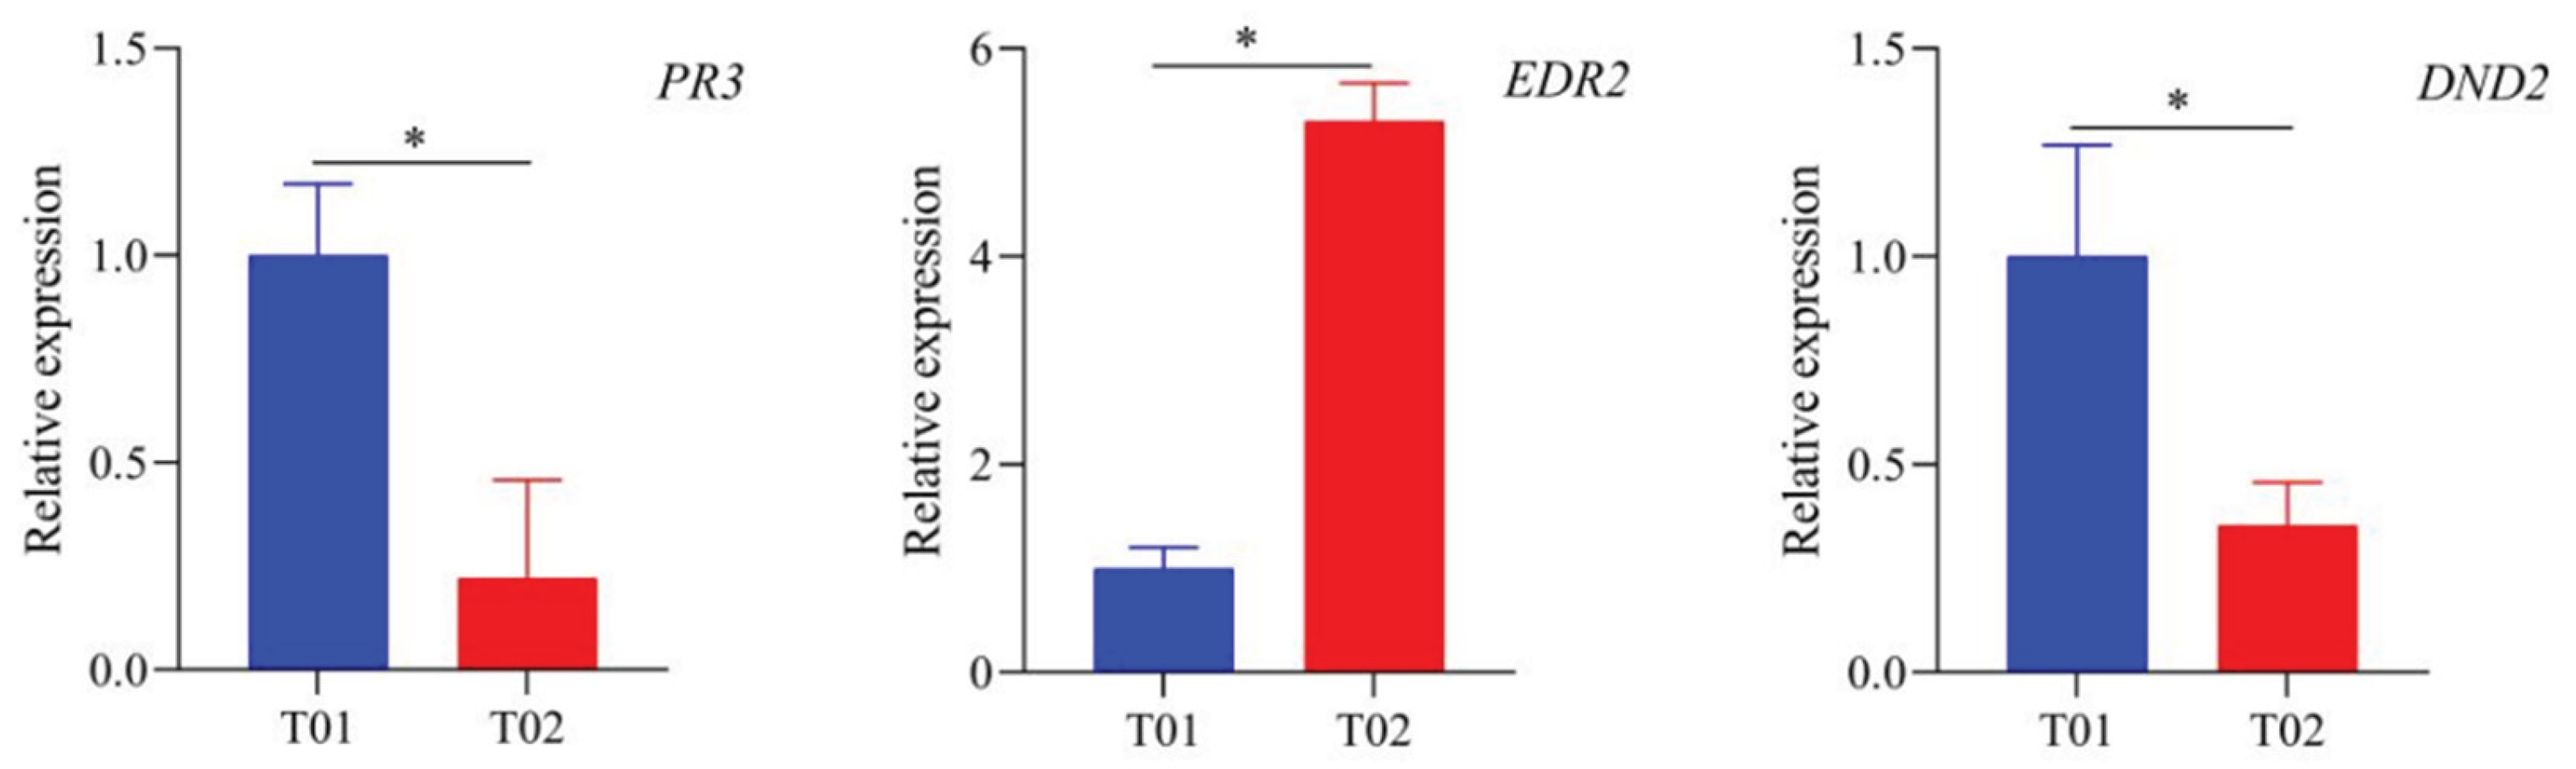
In order to clarify the expression patterns of the three critical candidate gene associated with SBS resistance in SBS-resistant and SBS-susceptible varieties, qRT-PCR expression analysis was performed in this study, and the results showed that the expression levels of Soffic.01G0010840-3C (PR3) and Soffic.09G0017520-1P (DND2) were significantly higher in the SBS-resistant variety YT93-15 (T01) than in the SBS-susceptible variety ROC22 (T02). However, the expression level of Soffic.01G0040620-1P (EDR2), was significantly higher in T02 than in T01. The results above indicate that the function of critical candidate genes in response to SBS infection may differ among different genotypes of sugarcane.
Figure 4.
The relative expression levels of three critical candidate genes by qRT-PCR. The experimental expression level data were normalized to the expression level of the internal reference gene GAPDH. T01 and T02 represent the SBS-resistant parent YT93-159 and the SBS-susceptible parent ROC22, respectively. Each treatment represents three independent tests and three repetitions. Bar is the standard error of each group of processing data (n=3). * Student’s t test indicated that candidate genes were significantly expressed at P < 0.05.
4. Discussion
SBS is a strong epidemic fungal disease, which is threatening to sugarcane production safety. The resistance of sugarcane genotype is the vital factor, which determines the occurrence and is the most crucial factor of outbreak and epidemic of the disease in suitable climatic conditions [2,31]. It is undeniable that the occurrence of diseases is the result of the reaction of the environment, genotypes, and pathogenic microorganisms, which is controlled and interfered by a variety of factors, so it is relatively difficult to identify plant disease resistance, especially in field [32,33,34,35]. For sugarcane, a growth cycle of up to one year, ratoon cultivation system, along with tall plants and large biomass, this undoubtedly further increases the difficulty of disease resistance evaluation. In order to obtain an accurate and objective phenotypic evaluation results, it is necessary to conduct multi-year observation on multiple locations with different climatic conditions, or on the most suitable location with high field pathogen stress and suitable climatic conditions for disease epidemiology. The breeding population of sugarcane is huge due to the low probability of elite genotypes in the segregation population of seedlings. For example, the probability of a released variety is only about 1/100,000–300,000 [36,37]. Therefore, the key to improving breeding efficiency is to develop accurate and practical trait-associated genetic markers, which can identify SBS-resistant and SBS-susceptible genotypes. Because of the highly ploidy characteristic of sugarcane, SD SNP marker strategy has been selected to construct genetic maps and to identify QTL associated with interesting traits in sugarcane F1 segregating populations [26]. In this study, we took advantages of the Axiom Sugarcane100K SNP chip containing more than 100,000 low-dosage SNP markers and multi-set phenotypic data of the SBS resistance collected in six different habitats by surveying an F1 mapping population derived from a bi-parental cross. Then, two parental genetic maps with high density of SD markers were constructed. Our findings could help understanding the genetic basis of the SBS-resistance trait, and potentially promote the development of tools for MAS of this trait in allo-autopolyploid asexually propagated crops.
Modern sugarcane cultivars possessing 10–12 ploidy have a highly heterozygous genetic background, field phenotypic traits segregate widely in crossing or selfing F1 progeny, and its population genetics significantly lags behind compared with diploid crops. [38]. Thus, genetic studies of sugarcane cultivars have many challenges. In terms of the mapping populations used for QTL analysis, sugarcane has no double haploid (DH) and recombinant inbred lines (RIL), but can use F1 segregating population from crossing or self-crossing because of its characteristics of asexual propagation after the F1 seedlings. Previous studies have reported a large number of genetic map constructions and trait-related QTL mappings in the two mentioned types of populations in sugarcane. For example, Balsalobre et al. [39] indentified seven QTL associated with yield-related traits in an F1 mapping population generated from a cross between the sugarcane cultivars SP80-3280 and RB835486. In addition, Wang et al. [40] identified a total of 37 QTL related to the ability of sugarcane tillering and ratooning from a cross of sugarcane varieties YT93-159 × ROC22. The SBS resistance reactions of the bi-parental mapping population showed a nearly normal distribution in this study, supporting SBS resistance is controlled by multiple genes/alleles. Accurate phenotypic evaluation is essential for QTL mapping. In addition, many factors affected on the accuracy and resolution of QTL mapping, such as the density or type of molecular markers, the mapping method for QTL analysis, environmental influence on traits, the type of mapping population, and the size of segregation population, in the previous studies. For example, Lowry et al. [41] indicated that the results of QTL analysis on the same trait can show significant differences when phenotypic data collected in different environments. The reports by Xu et al. [42] and Yang et al. [25] showed that the size of an F1 segregating population significantly affected estimates of PVE in tea plants (Camellia sinensis) and sugarcane (Saccharum spp.), respectively. Generally speaking, the size of the mapping population for different species is about 100–400 individuals [43]. Here, we used a population containing 285 progenies in sugarcane, which is more than most studies, such as reported by Zhang et al. [7], You et al. [26], and Yang et al. [25].
With the development of high-throughput genotyping technology, the customization of high-density SNP chips makes it possible to accurately and extensively screen SD markers from highly ploidy sugarcane, which leads to an efficient and rapid construction of sugarcane genetic maps. To our knowledge, QTL mapping for SBS resistance has not been reported. only other sugarcane diseases, such as sugarcane ratoon stunting disease (RSD) caused by Leifsonia xyli subsp. xyli [26], root rot (Fusarium commune) [44], leaf blight (Stagonospora tainanensis) [27], orange rust (Puccinia kuehnii) [25], and red rot (Colletotrichum falcatum) [9,45] were reported. You et al. [26] indicated that a total of 13 QTL forming 106 LGs related to sugarcane RSD resistance were mapped in a selfing population of CP80-1827, of which six were considered as major QTL with 10% to 13% of PVE, and the average marker density (7.20 cM/SNP marker) was detected on the CP80-1827 map with a total genetic distance of 3,752 cM. Wang et al. [27] reported that six QTL associated with sugarcane leaf blight resistance were identified in a cross of sugarcane cultivar YT93-159 and ROC22, of which three QTL were considered as major QTL with 10.1% to 16.4%, and the average marker density of 3.0 cM and 3.5 cM per marker were mapped on the YT93-159 map and ROC22 map with covering 4,485 cM and 2,270 cM of genetic distance, respectively. This study is the first report of QTL mapping related to SBS resistance. Our study identified 32 QTL on the linkage map of paternal parent ROC22 (80 LGs) and maternal parent YT93-159 (87 LGs) association with SBS resistance in six consecutive habitats, while only two of which are major QTL (6.25%). 21 QTL, 1,814 SD SNP markers and average marker density (2.53 cM/SNP marker) with a total genetic distance of 1,490.34 cM on ROC22, and 11 QTL, 929 SD SNP markers, and average marker density (2.54 cM/SNP marker) were detected on YT93-159 with a total genetic distance of 3,069.45 cM were reported in this study. Four stable QTL were continuously detected in multiple habitats, but no common QTL was identified in all six habitats. However, all detected QTL excluding qSBS-Y38-1 and qSBS-R46 revealed relatively low PVE values (3.73% to 8.67%) with 93.75% (30/32) of them being as minor QTL. The lower PVE values for these QTL may be due to the lower heritability (H2 = 0.52) of SBS resistance trait in the F1 mapping population. Moreover, low marker density and uneven distribution of mapped markers may weaken the results of QTL mapping associated with SBS resistance. To date, we have no evidence to support that these QTL associated to SBS resistance can directly use in the selection of the trait in sugarcane breeding program, and actually only the marker associated to Bru1 for brown rust has been used in breeding till now. In general, the genetic maps of YT93-159 and ROC22 constructed in this study have achieved a higher level in the number [24,25], density [25,26], and coverage of markers [26], especially higher than those based on traditional markers such as SSR [17], RFLP [19], SRAP [46] and AFLP [17,18], which is mainly due to the development and application of high-throughput SNP genotyping chip technology. Furthermore, our findings provide convenience for the study of many other important agronomic traits, and the corresponding trait-associated QTL mapping results have a theoretical value for dissecting the genetic basis of SBS resistance formation and the potential application in sugarcane breeding.
The four stable QTL detected in multiple different habitats were considered as potential intervals to screen trait-associated candidate genes using the probe sequences of QTL flanking SNP markers, although the QTL intervals are relatively large and an uncertain number of candidate gene sequences may be related to the evaluated traits. Hence, the identification of putative candidate genes in the intervals could contribute to new insights to accelerate the process of biological breeding. Here, Twenty-five candidate genes associated with SBS resistance were identified (Table S4). Among them, qRT-PCR expression analysis of the three candidate genes showed that the expression levels of Soffic.01G0010840-3C (PR3) and Soffic.09G0017520-1P (DND2) in resistant varieties were significantly higher than those in susceptible varieties, while the expression pattern of Soffic.01G0040620-1P (EDR2) was the opposite, which was consistent with the results of Boava et al. [47], who inoculated the pathogen Phytophthora parasitica in the resistant (Poncirus trifoliata) and susceptible (Citrus sunki) varieties of citrus root rot, qRT-PCR results showed that the expression level of PR3 in P. trifoliata was significantly higher than that in C. sunki. PRs genes have also been reported in sugarcane. For example, Cheng et al. [3] screened a PR2 gene associated with SBS resistance via BSR-Seq, and its expression level in susceptible varieties (ROC22) was significantly higher than that in resistant varieties (YT93-159). In addition, Peng et al. [48] overexpressed sugarcane ScPR10 in Nicotiana benthamiana, which increased its intracellular H2O2 content and immune gene expression, thereby enhancing its resistance to Ralstonia solanacearum. However, the function of DND2 and EDR2 genes has not been reported in sugarcane. DND2 is a class of ubiquitous channel proteins in plants and belongs to the cyclic nucleotide-gation channel (CNGC) family, which is mainly involved in biological functions such as ion transport, pathogen defense, and response to adversity stress [49]. In Arabidopsis thaliana, Chin et al. [50] and Kale et al. [51] indicated that DND2 can enhance the broad-spectrum resistance of plants after infection by pathogens. Related studies have been reported in other crops, such as citrus (Citrus clementina) [52], upland cotton (Gossypium hirsutum) [53], and rice (Oryza sativa) [54]. In A. thaliana, AtEDR2 was isolated as a negative regulator of programmed cell death (PCD), specifically the cell death elicited by pathogen attack but not by abiotic stresses by Vorwerk et. al. [55]. Therefore, the EDR2 gene identified in this study may be a negative regulation of SBS disease resistance. In the future, verification function of the above genes by editing or over-expression in sugarcane may be the main breakthrough in studying the mechanism of SBS, and may also promote to put forward new ideas for sugarcane disease resistance breeding.
5. Conclusions
In this study, SD SNP markers were used for construction of two high-density genetic linkage maps of the elite Chinese varieties by combining an F1 mapping population derived from a bi-parent cross with the Axiom Sugarcane100 K SNP chip. Disease severity of SBS were evaluated under multiple habitats and across for six years. The maps of YT93-159 and ROC22 containing 1,814 and 929 markers respectively, which spanned 3,069.45 cM and 1,490.34 cM with an average marker density of 2.53 cM and 2.54 cM, respectively. A total of 32 QTL with PVE ranging from 3.73% to 11.64% associated with SBS resistance were detected, of which two QTL qSBS-Y38 and qSBS-R46 were defined as major QTL, which explained 11.47% and 11.64% of the PVE, respectively. Furthermore, four environment-stable QTL were credible to identify trait-associated candidate genes with their corresponding QTL intervals. Twenty-five candidate genes were screened according to sugarcane genome, and three critical genes PR3, DND2 and EDR2 may play an important role in the formation of SBS disease resistance due to their strong response to the pathogen infection. This study may provide potential DNA markers and critical gene resources for MAS and biological breeding of SBS resistance in sugarcane. In addition, the two maps could be useful for future studies of other important sugarcane agronomic traits.
Supplementary Materials
The following supporting information can be downloaded at: Preprints.org.
Author Contributions
Conceptualization, L.X. and Q.W.; methodology, L.X., J.W. and Q.W.; software, W.C., Z.W., F.X. and J.P.; validation, W.C., F.X. and Y.Y.; formal analysis, W.C., J.W. and J.F.; investigation, L.X. and Z.W.; resources, L.X.; writing—original draft preparation, W.C.; writing—review and editing, Z.W., L.X., Q.W.; supervision, L.X. and Q.W.; project administration, L.X. and Q.W.; funding acquisition, L.X. and Q.W. All authors have read and agreed to the published version of the manuscript.
Funding
This research was funded by the National Key R & D Program of China (2021YFF1000103-9); the Open Fund of Yunnan Key Laboratory of Sugarcane Genetic Improvement (2023KFKT002); the Science and Technology Innovation Project of FAFU (KFB24029); and the National Natural Science Foundation of China (NSFC) (32401895).
Data Availability Statement
The original contributions presented in this study are included in this article and further inquiries can be directed to the corresponding author.
Acknowledgments
The authors are thankful to all relevant members for providing the field management work and jointly completing the field disease resistance investigation work at Institute of Sugarcane Science, Longchuan, China.
Conflicts of Interest
The authors declare no conflicts of interest.
References
- Chen, S.Y.; Feng, X.X.; Zhang, Z.; Hua, X.T.; Zhang, Q.; Chen, C.J.; Li J.W.; Liu, X.J.; Weng, C.Y.; Chen, B.S.; Zhang, M.Q.; Yao, W.; Tang, H.B.; Ming, R, Zhang, J.S. ScDB: A comprehensive database dedicated to Saccharum, facilitating functional genomics and molecular biology studies in sugarcane. Plant Biotechnol. J. 2024, 22, 3386–3388. [CrossRef]
- Wang, X.Y.; Cang, X.Y.; Qin, W.;Shan, H.L.; Zhang, R.Y.; Wang, C.M.; Li, W.F.; Huang, Y.K. Evaluation of field resistance to brown stripe disease in novel and major cultivated sugarcane varieties in China. J. Plant Pathol. 2021, 103, 985–989. [CrossRef]
- Cheng, W.; Wang, Z.T.; Xu, F.; Lu, G.L.; Su, Y.C.; Wu, Q.B.; Wang, T.; Que, Y.X.; Xu, L.P. Screening of candidate genes associated with brown stripe resistance in sugarcane via BSR-seq analysis. Int. J. Mol. Sci. 2022, 23, 15500. [CrossRef]
- Nyvall, R.F. Field crop diseases handbook, 2nd ed.; Springer, Boston, MA, 1989; pp. 97–106.
- Parthasarathy, S.; Thiribhuvanamala, G.; Prabakar, K. Diseases of field crops and their management, 1st ed., CRC Press, London, 1988; pp. 344–351.
- Hoarau, J.Y.; Dumont, T.; Wei, X.M.; Jackson, P.; D’Hont, A. Applications of quantitative genetics and statistical analyses in sugarcane breeding. Sugar Tech. 2022, 24, 320–340. [CrossRef]
- Zhang, B.Q.; Huang, Y.X.; Zhang, L.J.; Zhou, Z.F.; Zhou S, Duan, W.X.; Yang, C.F.; Gao, Y.J.; Li, S.C.; Chen, M.Y.; Li, Y.R.; Yang, X.P.; Zhang, G.M.; Huang D.L. Genome-wide association study unravels quantitative trait loci and genes associated with yield-related traits in sugarcane. J. Agric. Food Chem. 2023, 71, 16815–16826. [CrossRef]
- Awata, L.A.O.; Beyene, Y.; Gowda, M.; Suresh, L.M.; Jumbo, M.B.; Tongoona, P.; Danquah, E.; Ifie, B.E.; Marchelo-Dragga, P.W.; Olsen, M.; Ogugo, V.; Mugo, S.; Prasanna, B.M. Genetic analysis of QTL for resistance to Maize lethal necrosis in multiple mapping populations. Genes. 2019, 11, 32. [CrossRef]
- Banerjee, N.; Khan, M.S.; Swapna, M.; Yadav, S.; Tiwari, G.J.; Jena, S.N.; Patel, J.D.; Manimekalai, R.; Kumar, S.; Dattamajuder, S.K.; Kapur, R.; Koebernick, J.C.; Singh, R.K. QTL mapping and identification of candidate genes linked to red rot resistance in sugarcane. 3 Biotech. 2023, 13, 82. [CrossRef]
- Gao, Y.J.; Zhou, S; Huang, Y.X.; Zhang, B.Q.; Xu, Y.H.; Zhang, G.M.; Lakshmanan P; Yang, R.Z.; Zhou, H.; Huang, D.L.; Liu, J.X.; Tan, H.W.; He, W.Z.; Yang, C.F.; Duan, W.X. Quantitative trait loci mapping and development of KASP marker smut screening assay using high-density genetic map and bulked segregant RNA sequencing in sugarcane (Saccharum spp.). Front. Plant Sci. 2022, 12, 796189. [CrossRef]
- Le Cunff, L.; Garsmeur; O.; Raboin; L.M.; Pauquet, J.; Telismart, H.; Selvi, A.; Grivet, L.; Philippe, R.; Begum, D.; Deu, M.; Costet, L.; Wing, R.; Glaszmann, J.C.; D’Hont, A. Diploid/polyploid syntenic shuttle mapping and haplotype-specific chromosome walking toward a rust resistance gene (Bru1) in highly polyploid sugarcane (2n∼12x∼115). Genetics. 2008, 180, 649–660. [CrossRef]
- Wirojsirasak, W.; Songsri, P.; Jongrungklang, N.; Tangphatsornruang, S.; Klomsa-Ard, P.; Ukoskit, K. A large-scale candidate-gene association mapping for drought tolerance and agronomic traits in sugarcane. Int. J. Mol. Sci. 2023, 24, 12801. [CrossRef]
- Xiong, H.Z.; Chen, Y.L.; Pan, Y.B.; Shi A.N. A genome-wide association study and genomic prediction for fiber and sucrose contents in a mapping population of LCP 85-384 sugarcane. Plants. 2023, 12, 1041. [CrossRef]
- Lu, G.L.; Wang, Z.T.; Pan, Y.B.; Wu, Q.B.; Cheng W; Xu F; Dai, S.B.; Li, B.Y.; Que, Y.X.; Xu, L.P. Identification of QTLs and critical genes related to sugarcane mosaic disease resistance. Front Plant Sci. 2023, 14, 1107314. [CrossRef]
- Aitken, K.S.; Jackson, P.A.; McIntyre, C.L. A combination of AFLP and SSR markers provides extensive map coverage and identification of homo(eo)logous linkage groups in a sugarcane cultivar. Theor. Appl. Genet. 2005, 110, 789–801. [CrossRef]
- Hearnden, P.R.; Eckermann, P.J.; McMichael, G.L.; Hayden, M.J.; Eglinton, J.K.; Chalmers, K.J. A genetic map of 1,000 SSR and DArT markers in a wide barley cross. Theor. Appl. Genet. 2007, 115, 383–391. [CrossRef]
- Maughan, P.J.; Bonifacio, A.; Jellen, E.N.; Stevens, M.R.; Coleman, C.E.; Ricks, M.; Mason, S.L.; Jarvis, D.E.; Gardunia, B.W.; Fairbanks, D.J. A genetic linkage map of quinoa (Chenopodium quinoa) based on AFLP, RAPD, and SSR markers. Theor. Appl. Genet. 2004, 109, 1188–1195. [CrossRef]
- Kim, H.C.; Kim, K.H.; Song, K.; Kim, J.Y.; Lee, B.M. Identification and validation of candidate genes conferring resistance to downy mildew in maize (Zea mays L.). Genes. 2020, 11, 191. [CrossRef]
- Klie, M.; Menz, I.; Linde, M.; Debener, T. Strigolactone pathway genes and plant architecture: association analysis and QTL detection for horticultural traits in chrysanthemum. Mol. Genet. Genomics. 2016, 291, 957–969. [CrossRef]
- Yang, S.; Gill, R.A.; Zaman, Q.U.; Ulhassan, Z.; Zhou W.J. Insights on SNP types, detection methods and their utilization in Brassica species: Recent progress and future perspectives. J. Biotechnol. 2020, 324, 11–20. [CrossRef]
- Zhao, M.A.; Liu S.S.; Pei Y.H.; Jiang X.W.; Jaqueth, J.S.; Li B.L.; Han J, Jeffers D, Wang J.B.; Song X.Y. Identification of genetic loci associated with rough dwarf disease resistance in maize by integrating GWAS and linkage mapping. Plant Sci. 2022, 315, 111100. [CrossRef]
- Wang, X.H.; Chen, Y.L.; Thomas, C.L.; Ding, G.D.; Xu, P.; Shi, D.X.; Grandke, F. Jin, K.M.; Cai, H.M.; Xu, F.S.; Yi, B.; Broadley, M.R.; Shi, L. Genetic variants associated with the root system architecture of oilseed rape (Brassica napus L.) under contrasting phosphate supply. DNA Res. 2017, 24, 407–417. [CrossRef]
- Sun, C.W.; Dong, Z.D.; Zhao, L.; Ren, Y.; Zhang, N.; Chen, F. The Wheat 660K SNP array demonstrates great potential for marker-assisted selection in polyploid wheat. Plant Biotechnol J. 2020, 18, 1354–1360. [CrossRef]
- Lu, G.L.; Pan, Y.B.; Wang, Z.T.; Xu, F.; Cheng, W.; Huang, X.G.; Ren, H.; Pang, C.; Que, Y.X.; Xu, L.P. Utilization of a sugarcane100K single nucleotide polymorphisms microarray-derived high-density genetic map in quantitative trait loci mapping and function role prediction of genes related to chlorophyll content in sugarcane. Front Plant Sci. 2021, 12, 817875. [CrossRef]
- Yang, X.P.; Islam, M.S.; Sood, S.; Maya, S.; Hanson, E.A.; Comstock, J.; Wang, J.P. Identifying quantitative trait loci (QTLs) and developing diagnostic markers linked to orange rust resistance in sugarcane (Saccharum spp.). Front Plant Sci. 2018, 9, 350. [CrossRef]
- You, Q.; Sood, S.; Luo, Z.L.; Liu, H.B.; Islam, M.S.; Zhang, M.Q.; Wang, J.P. Identifying genomic regions controlling ratoon stunting disease resistance in sugarcane (Saccharum spp.) clonal F1 population. Crop J. 2021, 9, 1070–1078. [CrossRef]
- Wang, Z.T.; Lu, G.L.; Wu, Q.B.; Li, A.T.; Que, Y.X.; Xu L.P. Isolating QTL controlling sugarcane leaf blight resistance using a two-way pseudo-testcross strategy. Crop J. 2022, 10, 1131–1140. [CrossRef]
- Meena, M.R.; Appunu, C.; Arun Kumar, R.; Manimekalai, R.; Vasantha, S.; Krishnappa, G.; Kumar, R.; Pandey, S.K.; Hemaprabha, G. Recent advances in sugarcane genomics, physiology, and phenomics for superior agronomic traits. Front. Genet. 2022, 13, 854936. [CrossRef]
- You, Q.; Yang, X.P.; Peng, Z.; Islam, M.S.; Sood, S.; Luo, Z.L.; Comstock, J.; Xu, L.P.; Wang, J.P. Development of an Axiom Sugarcane100K SNP array for genetic map construction and QTL identification. Theor. Appl. Genet. 2019, 132, 2829–2845. [CrossRef]
- Mccouch, S.; Cho, Y.G.; Yano, M.; Kinoshita, T. Report on QTL nomenclature. Rice Genetics Newsletter. 1997, 14, 11–13.
- Savary, S.; Willocquet, L.; Pethybridge, S.J.; Esker, P.; McRoberts, N.; Nelson, A. The global burden of pathogens and pests on major food crops. Nat. Ecol. Evol. 2019, 3, 430–439. [CrossRef]
- Li, W.; Deng Y.W.; Ning Y.W.; He Z.H.; Wang, G.L. Exploiting broad-spectrum disease resistance in crops: From molecular dissection to breeding. Annu. Rev. Plant Biol. 2020, 71, 575–603. [CrossRef]
- Miedaner, T.; Juroszek, P. Climate change will influence disease resistance breeding in wheat in Northwestern Europe. Theor. Appl. Genet. 2021, 134, 1771–1785. [CrossRef]
- Nejat, N.; Rookes, J.; Mantri, N.L.; Cahill, D.M. Plant-pathogen interactions: toward development of next-generation disease-resistant plants. Crit. Rev. Biotechnol. 2017, 37, 229–237. [CrossRef]
- Derbyshire, M.C.; Newman, T.E.; Thomas, W.J.W.; Batley, J.; Edwards, D. The complex relationship between disease resistance and yield in crops. Plant Biotechnol. J. 2024, 22, 2612–2623. [CrossRef]
- Xu, Z.J.; Kong, R, An, D.S.; Zhang, X.J.; Li, Q.B; Nie, H.Z.; Liu, Y, Su, J.B Evaluation of a sugarcane (Saccharum spp.) hybrid F1 population phenotypic diversity and construction of a rapid sucrose yield estimation model for breeding. Plants. 2023, 12, 647. [CrossRef]
- Healey, A.L.; Garsmeur, O.; Lovell, J.T.; Shengquiang, S.; Sreedasyam, A.; Jenkins, J.; Plott, C.B.; Piperidis, N.; Pompidor, N.; Llaca, V.; Metcalfe, C.J.; Doležel, J.; Cápal, P.; Carlson, J.W.; Hoarau, J.Y.; Hervouet, C.; Zini, C.; Dievart, A.; Lipzen, A.; Williams, M.; Boston, L.B.; Webber, J.; Keymanesh, K.; Tejomurthula, S.; Rajasekar, S.; Suchecki, R.; Furtado, A.; May, G.; Parakkal, P.; Simmons, B.A.; Barry, K.; Henry, R.J.; Grimwood, J.; Aitken, K.S.; Schmutz, J.; D’Hont, A. The complex polyploid genome architecture of sugarcane. Nature. 2024, 628, 804–810. [CrossRef]
- Piperidis, G.; Piperidis, N.; D’Hont, A. Molecular cytogenetic investigation of chromosome composition and transmission in sugarcane. Mol. Genet. Genomics. 2010, 284, 65–73. [CrossRef]
- Balsalobre, T.W.A.; da Silva Pereira, G.; Margarido, G.R.A.; Gazaffi, R.; Barreto, F.Z.; Anoni, C.O.; Cardoso-Silva, C.B.; Costa, E.A.; Mancini, M.C.; Hoffmann, H.P.; de Souza, A.P.; Garcia, A.A.F.; Carneiro, M.S. GBS-based single dosage markers for linkage and QTL mapping allow gene mining for yield-related traits in sugarcane. BMC Genomics. 2017, 18, 72. [CrossRef]
- Wang, T.; Xu, F.; Wang, Z.T; Wu, Q.B.; Cheng, W.; Que, Y.X.; Xu L.P. Mapping of QTLs and screening candidate genes associated with the ability of sugarcane tillering and ratooning. Int. J. Mol. Sci. 2023, 24, 2793. [CrossRef]
- Lowry, D.B.; Lovell, J.T.; Zhang, L.; Bonnette, J; Fay, P.A.; Mitchell, R.B.; Lloyd-Reilley, J.; Boe, A.R.; Wu, Y.Q.; Rouquette Jr, F.M.; Wynia, R.L.; Weng, X.Y.; Behrman, K.D.; Healey, A.; Barry, K.; Lipzen, A.; Bauer, D.; Sharma, A.; Jenkins, J.; Schmutz, J.; Fritschi, F.B.; Juenger, T.E. QTL × environment interactions underlie adaptive divergence in switchgrass across a large latitudinal gradient. Proc. Natl. Acad. Sci. U S A. 2019, 116, 12933–12941. [CrossRef]
- Xu, L.Y.; Wang, L.Y.; Wei, K.; Tan, L.Q.; Su, J.J.; Cheng, H. High-density SNP linkage map construction and QTL mapping for flavonoid-related traits in a tea plant (Camellia sinensis) using 2b-RAD sequencing. BMC Genomics. 2018, 19, 955. [CrossRef]
- Tang, H.J.; Zhang, R.Y.; Wang, M.; Xie, X.Q.; Zhang, L.; Zhang, X.; Liu, C.; Sun, B.C.; Qin, F.; Yang, X.H. QTL mapping for flowering time in a maize-teosinte population under well-watered and water-stressed conditions. Mol. Breed. 2023, 43, 67. [CrossRef]
- McIntyre, C.L.; Whan, V.A.; Croft, B.; Magarey, R.; Smith, G.R. Identification and validation of molecular markers associated with pachymetra root rot and brown rust resistance in sugarcane using map- and association-based approaches. Mol. Breeding. 2005, 16, 151–161. [CrossRef]
- O’Connell, A.; Deo, J.; Deomano, E.; Wei, X.M.; Jackson, P.; Aitken, K.S.; Manimekalai, R.; Mohanraj, K.; Hemaprabha, G.; Ram, B.; Viswanathan, R.; Lakshmanan, P. Combining genomic selection with genome-wide association analysis identified a large-effect QTL and improved selection for red rot resistance in sugarcane. Front. Plant Sci. 2022, 13, 1021182. [CrossRef]
- Pinar, H.; Bulbul, C.; Simsek, D.; Shams, M.; Mutlu, N.; Ercisli, S. Development of molecular markers linked to QTL/genes controllıng Zn effıcıency. Mol. Biol. Rep. 2022, 49, 5273–5281. [CrossRef]
- Boava, L.P.; Cristofani-Yaly, M.; Stuart, R.M.; Machado, M.A. Expression of defense-related genes in response to mechanical wounding and phytophthora parasitica infection in poncirus trifoliata and citrus sunki. Physiol. Mol. Plant P. 2011, 76, 119–125. [CrossRef]
- Peng, Q.; Su, Y.C.; Ling, H. Ahmad, W.; Gao, S.W.; Guo, J.L.; Que Y.X.; Xu L.P. A sugarcane pathogenesis-related protein, ScPR10, plays a positive role in defense responses under Sporisorium scitamineum, SrMV, SA, and MeJA stresses. Plant Cell Rep. 2017, 36, 1427–1440. [CrossRef]
- Kaupp, U.B.; Seifert, R. Cyclic nucleotide-gated ion channels. Physiol. Reviews. 2002, 82, 769–824. [CrossRef]
- Chin, K.; DeFalco, T.A.; Moeder, W.; Yoshioka, K. The Arabidopsis cyclic nucleotide-gated ion channels AtCNGC2 and AtCNGC4 work in the same signaling pathway to regulate pathogen defense and floral transition. Plant Physiol. 2013, 163, 611–24. [CrossRef]
- Kale, L.; Nakurte, I.; Jalakas, P.; Kunga-Jegere, L.; Brosché, M.; Rostoks, N. Arabidopsis mutant dnd2 exhibits increased auxin and abscisic acid content and reduced stomatal conductance. Plant Physiol. Biochem. 2019, 140, 18–26. [CrossRef]
- Lv, Y.D.; Liu, S.M.; Ma, Y.Y.; Hu, L.N.; Yan, H.X. Analysis of CNGC family members in Citrus clementina (Hort. ex Tan.) by a genome-wide approach. Int. J. Mol. Sci. 2025, 26, 960. [CrossRef]
- Lu, Z.Y.; Yin, G.; Chai, M.; Sun, L.; Wei, H.L.; Chen, J.; Yang, Y.F.; Fu, X.K.; Li, S.Y. Systematic analysis of CNGCs in cotton and the positive role of GhCNGC32 and GhCNGC35 in salt tolerance. BMC Genomics. 2022, 23, 560. [CrossRef]
- Wang, J.C.; Liu, X.; Zhang, A.; Ren, Y.L.; Wu, F.Q.; Wang, G.; Xu, Y.; Lei, C.L.; Zhu, S.S.; Pan, T.; Wang, Y.F.; Zhang, H.; Wang, F.; Tan, Y.Q.; Wang, Y.P.; Jin, X.; Luo, S.; Zhou, C.L.; Zhang, X.; Liu, J.L.; Wang, S.; Meng, L.Z.; Wang, Y.H.; Chen, X.; Lin, Q.B.; Zhang, X.; Guo, X.P.; Cheng, Z.J.; Wang, J.L.; Tian, Y.L.; Liu, S.J.; Jiang, L.; Wu, C.Y.; Wang, E.T.; Zhou, J.M.; Wang, Y.F.; Wang, H.Y.; Wan, J.M. A cyclic nucleotide-gated channel mediates cytoplasmic calcium elevation and disease resistance in rice. Cell Res. 2019, 29, 820–831. [CrossRef]
- Vorwerk, S.; Schiff, C.; Santamaria, M.; Koh, S.; Nishimura, M.; Vogel, J.; Somerville, C.; Somerville, S. EDR2 negatively regulates salicylic acid-based defenses and cell death during powdery mildew infections of Arabidopsis thaliana. BMC Plant Biol. 2007, 7, 35. [CrossRef]
Figure 1.
Frequency distribution and the effect of a normal fitting for disease resistance grade of SBS in the F1 mapping population under six habitats.
Figure 1.
Frequency distribution and the effect of a normal fitting for disease resistance grade of SBS in the F1 mapping population under six habitats.
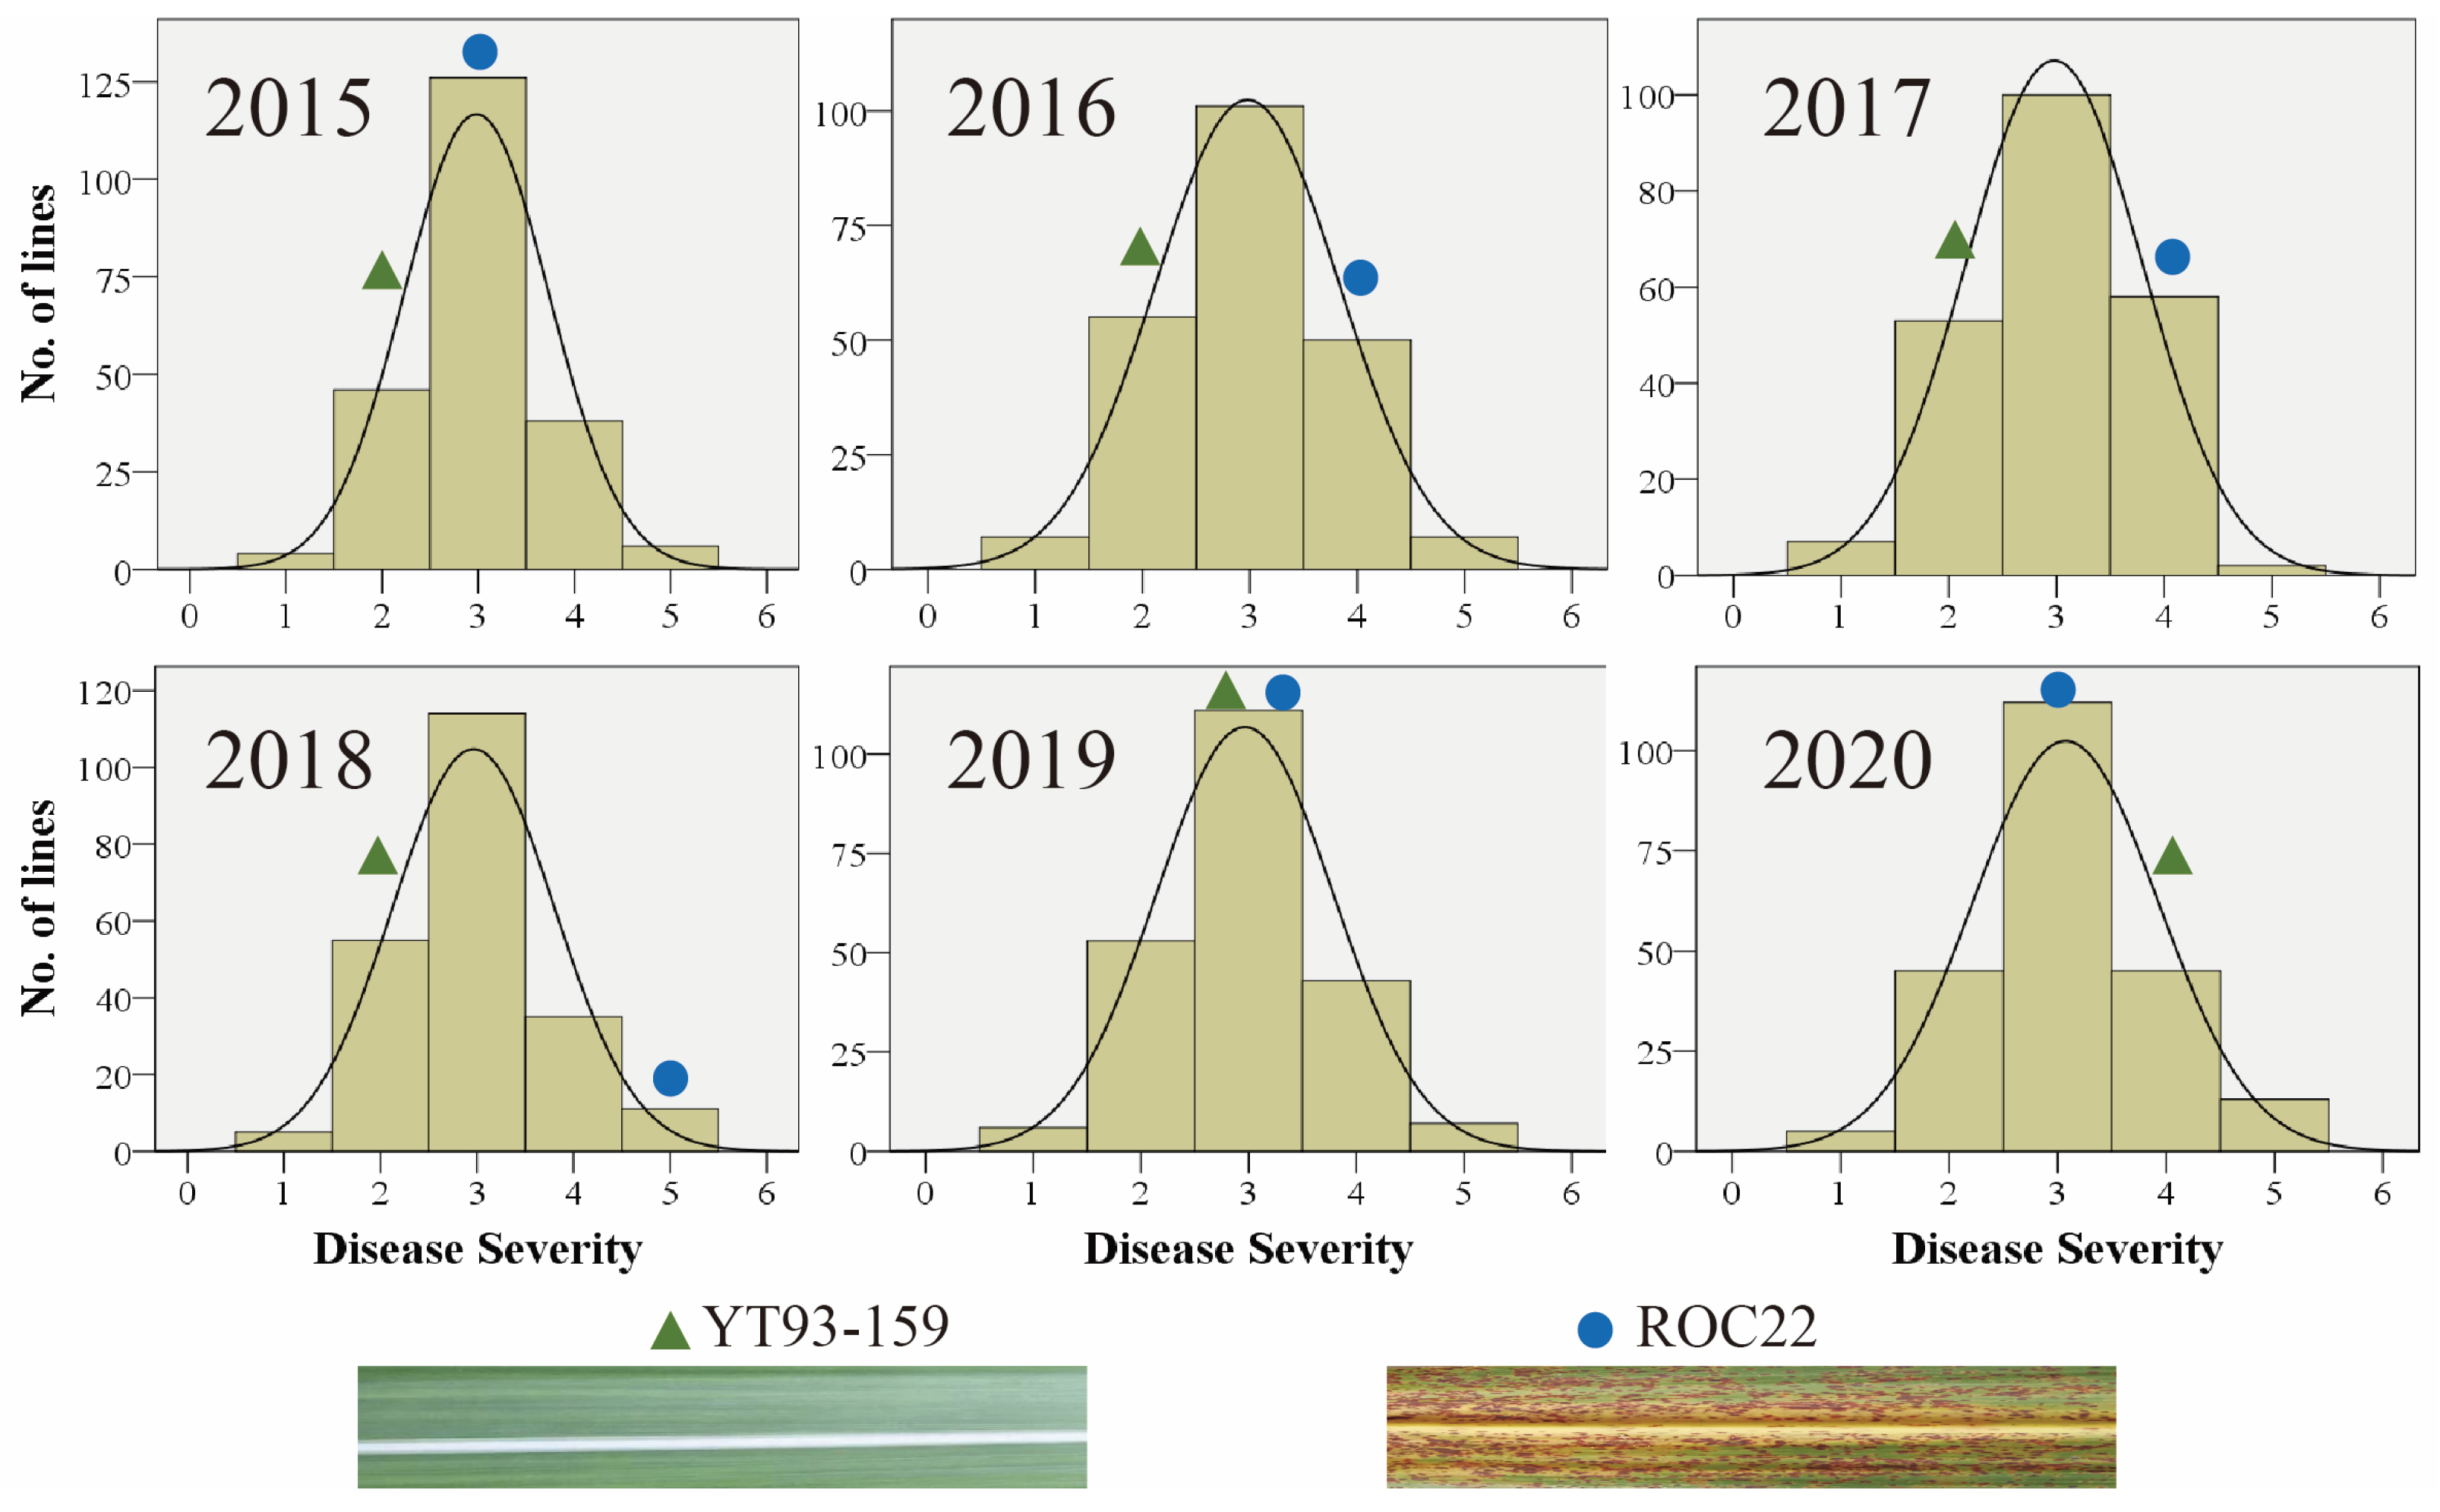
Figure 2.
Mapping of SBS resistance associated QTL on the linkage map of maternal YT93-159. Y represents maternal parent YT93-159; LG represents linkage group; Different colors in the figure represent different habitats. The red represents the plant cane habitat in 2015; green represents the first ratoon habitat in 2016; orange represents the second ratoon habitat in 2017; yellow represents the plant cane habitat in 2018; pink represents the first ratoon habitat in 2019; blue represents the plant cane habitat in 2020.
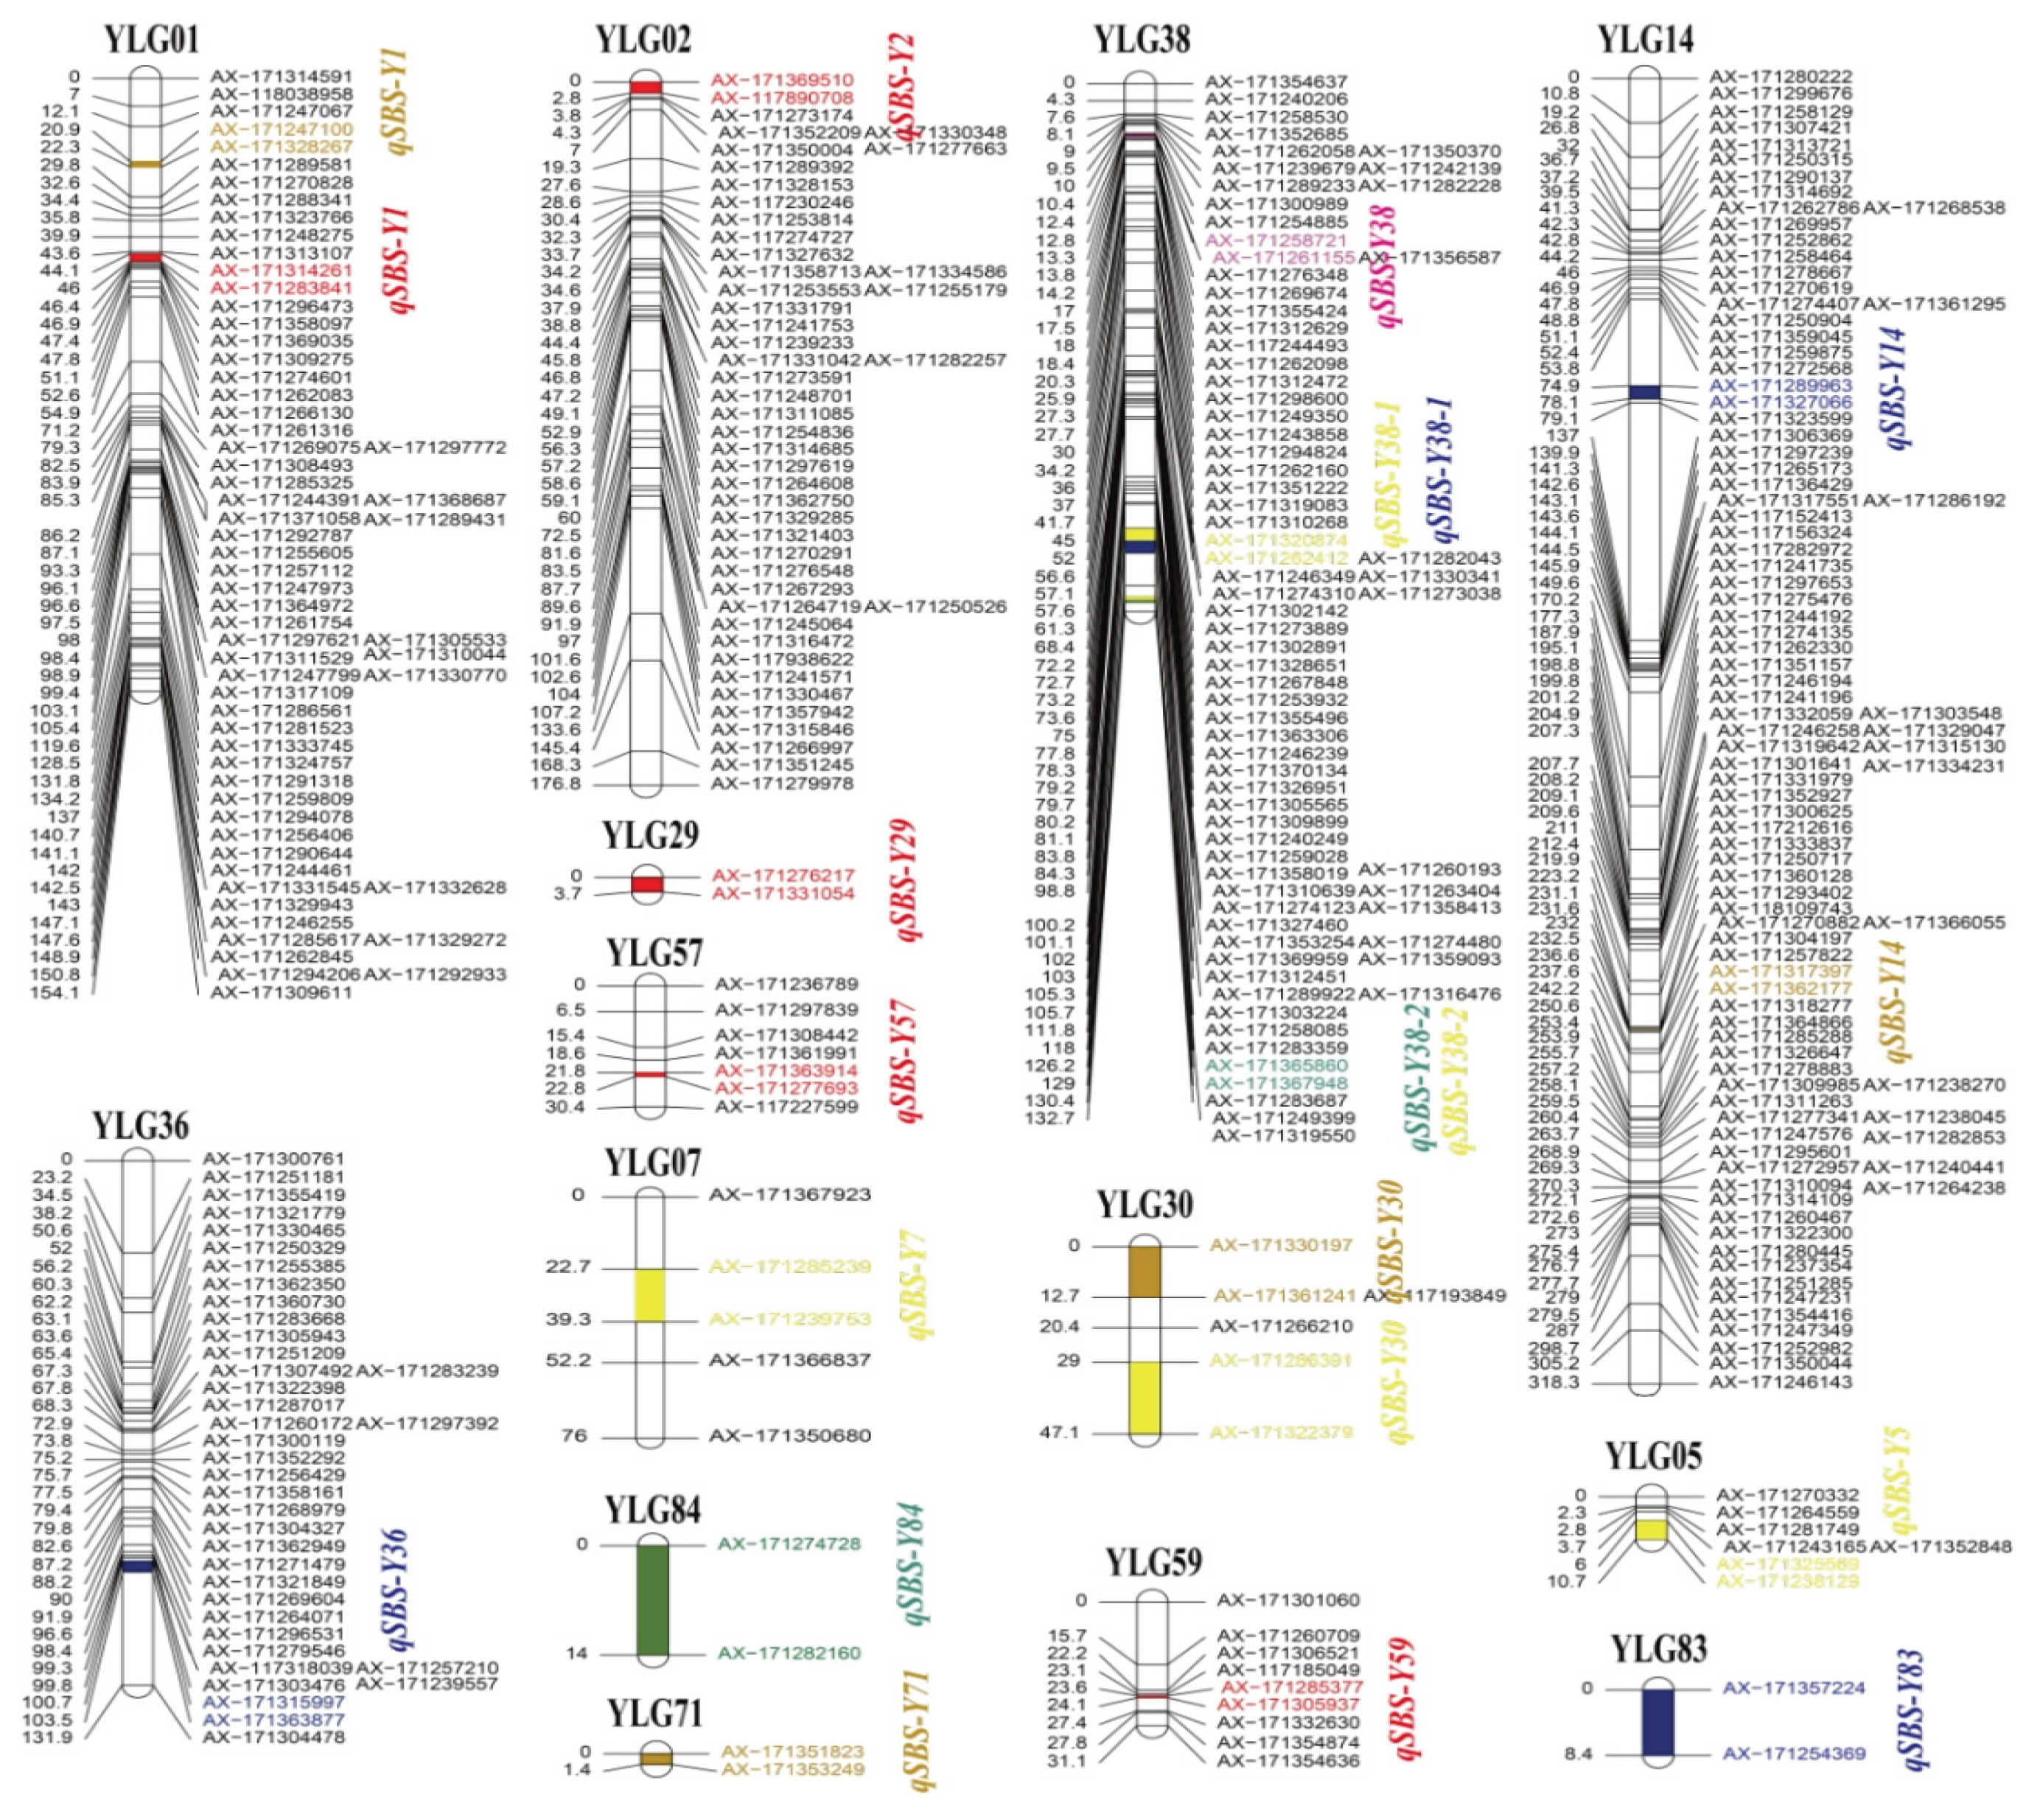
Figure 3.
Mapping of SBS resistance associated QTL on the linkage map of paternal ROC22. R represents paternal parent ROC22. LG represents linkage group. Red represents the plant cane habitat in 2015; green represents the first ratoon habitat in 2016; orange represents the second ratoon habitat in 2017; yellow represents the plant cane habitat in 2018; pink represents the first ratoon habitat in 2019; blue represents the plant cane habitat in 2020.
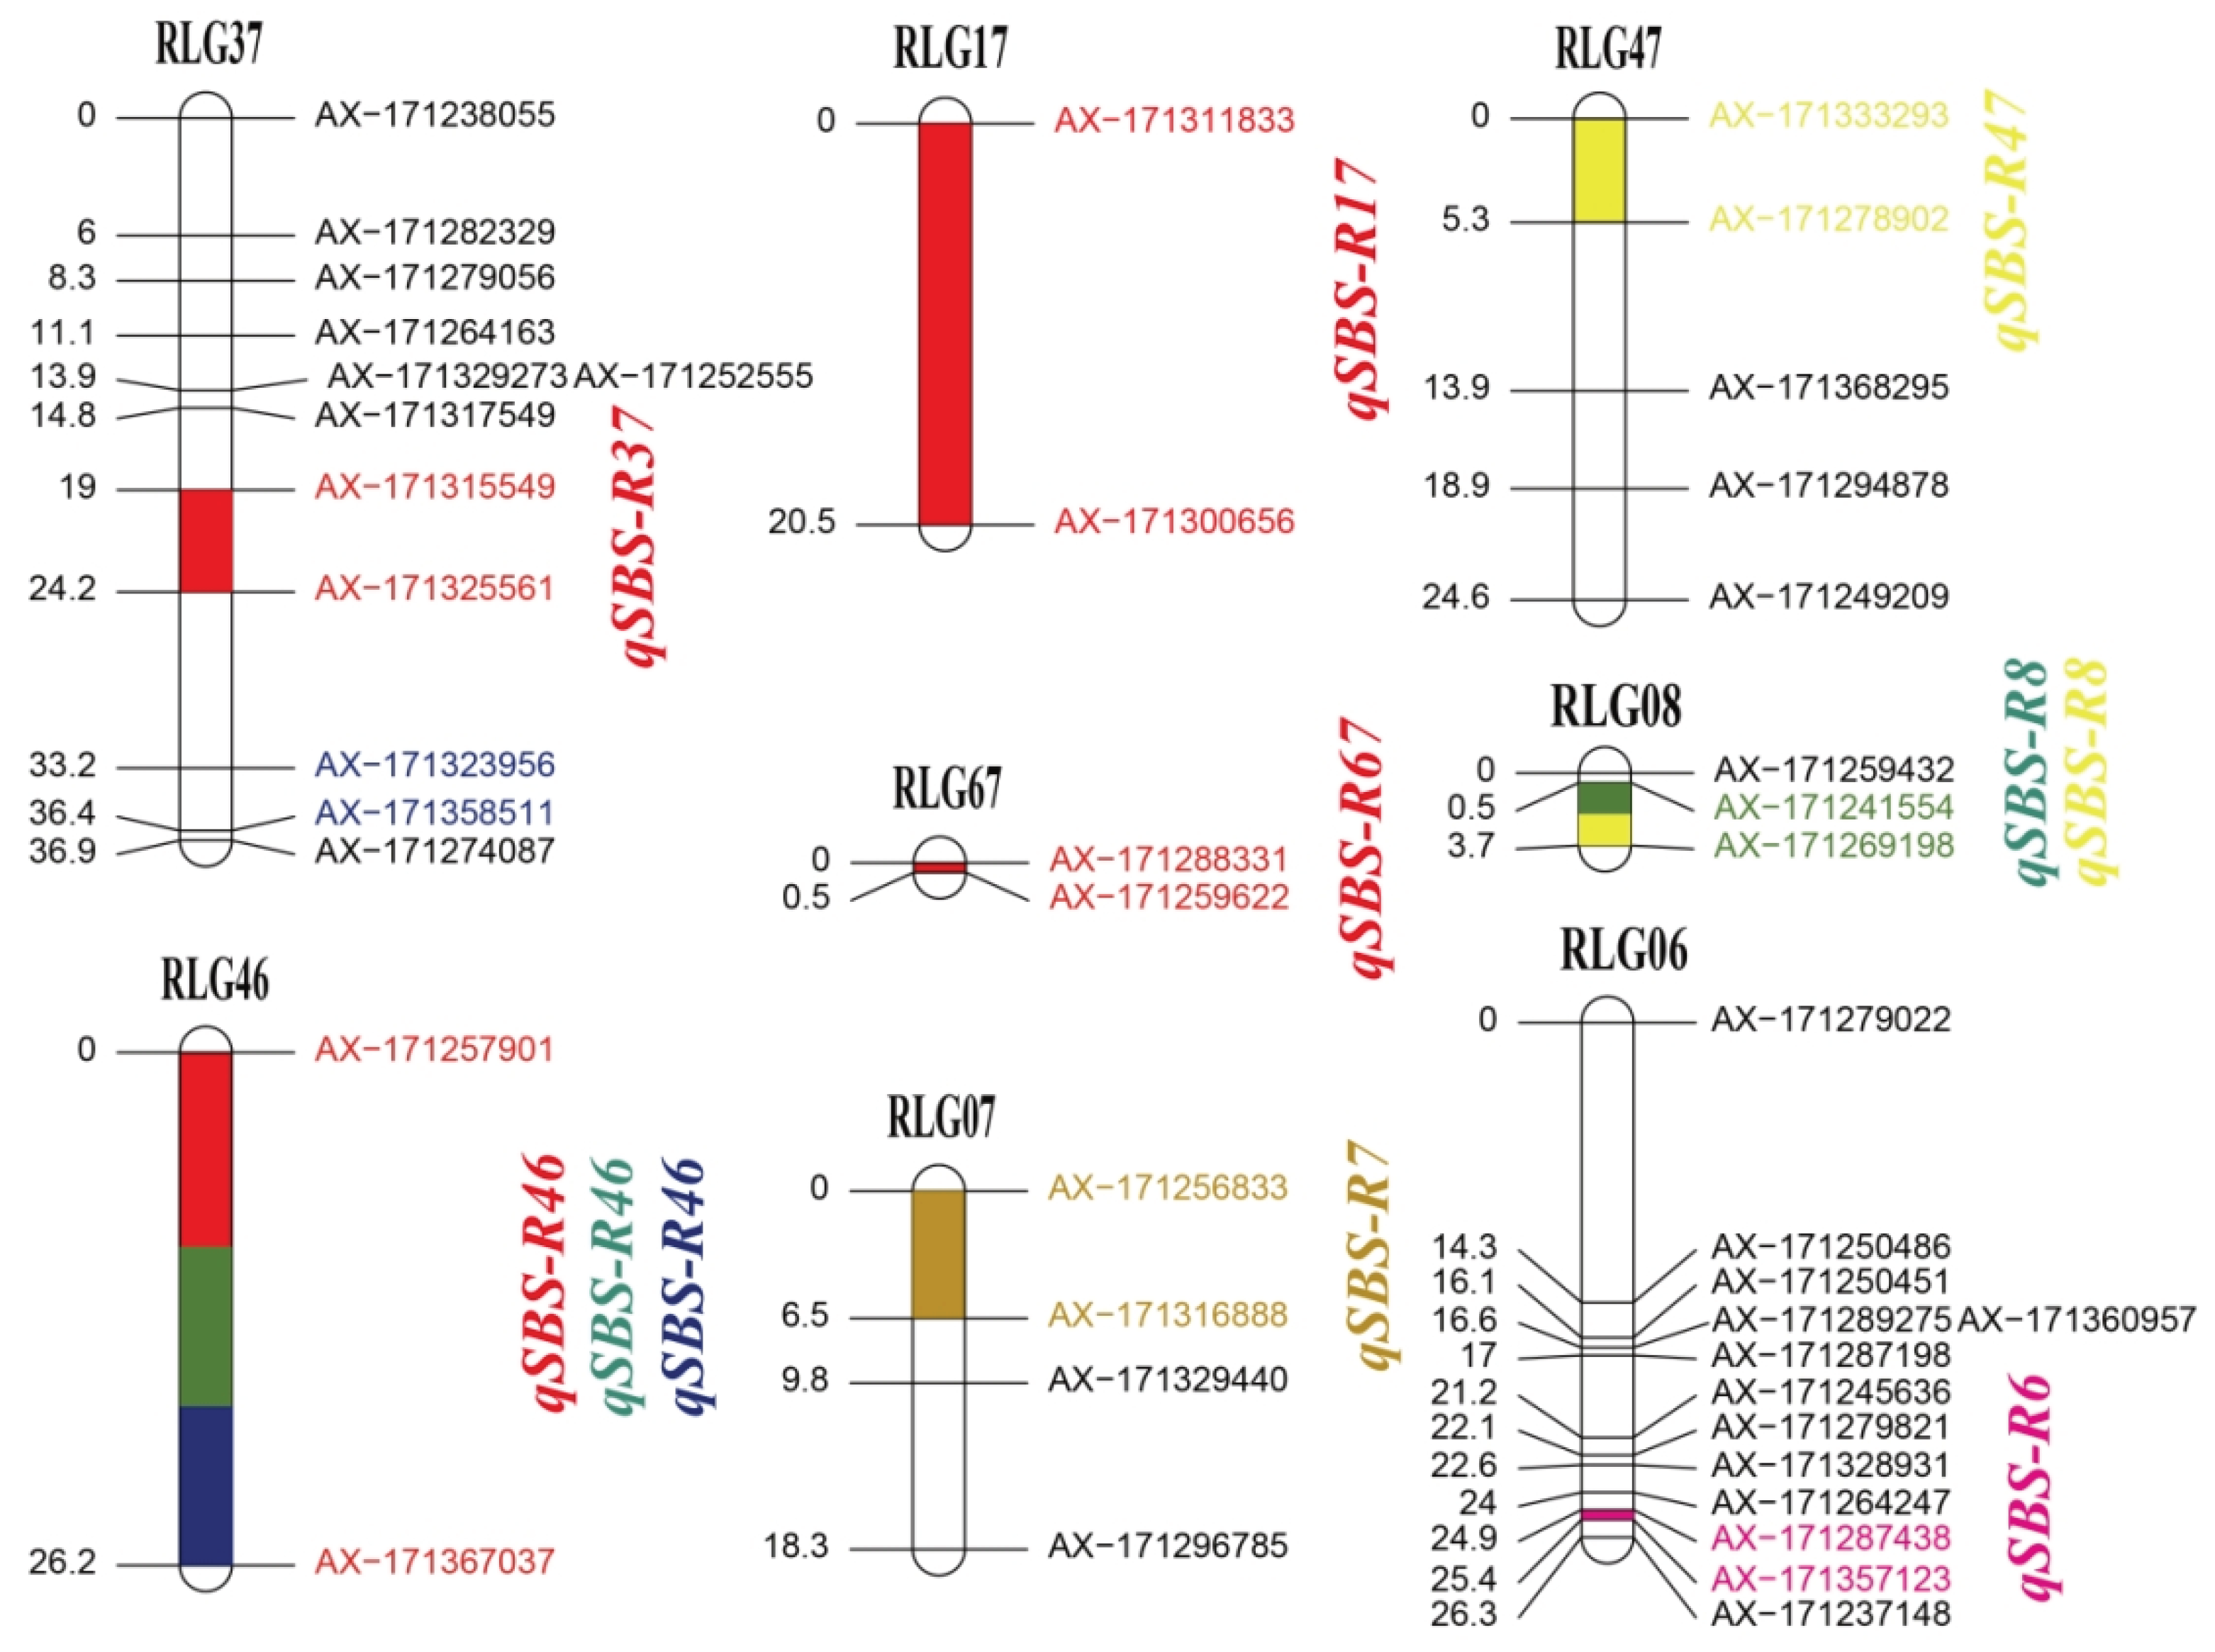

Table 1.
Correlation analysis of SBS resistance in an F1 mapping population under six different habitats.
Table 1.
Correlation analysis of SBS resistance in an F1 mapping population under six different habitats.
| Habitats/Crops | 2015/Plant cane | 2016/First ratoon | 2017/Second ratoon | 2018/Plant cane | 2019/First ratoon | 2020/Plant cane |
| 2015/Plant cane 2016/First ratoon 2017/Second ratoon 2018/Plant cane 2019/First ratoon 2020/Plant cane |
1.000 0.63*** 0.54*** 0.60*** 0.61*** 0.42*** |
1.000 0.51*** 0.67*** 0.60*** 0.28*** |
1.000 0.52*** 0.53*** 0.29*** |
1.000 0.57*** 0.31*** |
1.000 0.29*** |
1.000 |
***, correlations are significant at the 0.001 levels.
Disclaimer/Publisher’s Note: The statements, opinions and data contained in all publications are solely those of the individual author(s) and contributor(s) and not of MDPI and/or the editor(s). MDPI and/or the editor(s) disclaim responsibility for any injury to people or property resulting from any ideas, methods, instructions or products referred to in the content. |
© 2025 by the authors. Licensee MDPI, Basel, Switzerland. This article is an open access article distributed under the terms and conditions of the Creative Commons Attribution (CC BY) license (http://creativecommons.org/licenses/by/4.0/).
Copyright: This open access article is published under a Creative Commons CC BY 4.0 license, which permit the free download, distribution, and reuse, provided that the author and preprint are cited in any reuse.


