Submitted:
28 October 2024
Posted:
28 October 2024
You are already at the latest version
Abstract
The cultivated passion fruit (Passiflora edulis) is a diploid plant (2n=2x=18) and is an important fruit tree in southern China. However, the occurrence and spread of stem rot in passion fruit severely impact its yield and quality. This study aims to construct a high-density genetic linkage map and identify the quantitative trait locus (QTL) and candidate genes associated with stem rot resistance in passion fruit. In this study, we used an HG and ZG7 hybrid to develop a BC1F1 population consisting of 158 individuals. Take a previously published passion fruit genome as reference, a high-density genetic linkage map was constructed with 1,180,406 single nucleotide polymorphisms (SNPs). The map contains 9 linkage groups, covering a total genetic distance of 1559.03 cM, with an average genetic distance of 311.81 cM. The average genetic distance between 4206 bins was 0.404 cM, and the average gap length was 10.565 cM. The collinearity correlation coefficient between the genetic map and the passion fruit genome was 0.9994. Fusarium solani was used to infect the BC1F1 population, and the resistance to stem rot showed a continuous distribution. A QTL, qPSR5, was identified in the 145.878-152.951 cM region on the 5th linkage group. We performed RNA-seq and RT-qPCR to analyze the expression levels of predicted genes in the candidate region and identified ZX.05G0020740 and ZX.05G0020810 as ideal candidate genes for stem rot resistance in passion fruit. The findings in this study not only lay the foundation for cloning the qPSR5 responsible for stem rot resistance but also provide genetic resources for the genetic improvement of passion fruit.
Keywords:
Passion fruit
; Single nucleotide polymorphisms
; Genetic map
; Linkage analysis
; Stem rot resistance
; Candidate gene
1. Introduction
The cultivated passion fruit is a herbaceous vine plant, known for its aromatic fruit, which is rich in sugars, vitamins, and essential minerals such as calcium, iron, and zinc, offering high nutritional value. However, stem rot, caused by fungi such as Fusarium oxysporum and Fusarium solani, has been spreading in southern China, significantly affecting the yield and quality of passion fruit. Studies have shown that using molecular breeding techniques to develop disease-resistant varieties is the most effective and economical method for disease control [1].
Constructing a genetic linkage map is a crucial foundation for plant molecular breeding research, as it provides the most direct and rapid access to information about target trait genes and genetic markers. In the genetic map studies of passion fruit, Carneiro et al. [2] and Lopes et al. [3] used 380 RAPD markers and 174 AFLP markers, respectively, to construct genetic maps for yellow passion fruit varieties IAPAR123 and IAPAR06, with both maps containing 9 linkage groups. Later, Oliveira et al. [4] reconstructed an integrated map for yellow passion fruit using 253 AFLP markers and 107 SSR markers, which contained 10 linkage groups. So far, although researchers have developed molecular genetic maps for passion fruit, these maps suffer from low marker density, limited genome coverage, and low detection efficiency, limiting their application. Therefore, to accelerate the molecular breeding process for disease resistance in cultivated passion fruit, it is essential to construct a high-efficiency, high-density genetic map for the identification of stem rot resistance genes.
The selection of appropriate molecular markers is crucial for constructing a high-density genetic linkage map for cultivated passion fruit. SNP can occur at any location within the genome, and as a new generation of molecular markers, they offer numerous advantages such as high abundance, even distribution, rich polymorphism, and high accuracy [5]. SNP markers have been extensively studied and applied in other plants, but research on their use in passion fruit is only beginning to emerge. da Costa et al. developed 122 primer pairs from 122 transcript sequences of Passiflora edulis to amplify the DNA of Passiflora alata, and found that there was one SNP every 294 bp [6], whereas in the monocot model plant rice, there is one SNP every 336 bp [7], and in the dicot model plant Arabidopsis, one SNP every 333 bp [8]. Nazareno et al. developed 14,536 SNPs in Passiflora spinosa using RAD-seq technology and demonstrated, through comparative analysis with the plants Amphirrhox longifolia and Psychotria lupulina, that rivers act as natural barriers affecting gene flow [9]. Recently, Zheng et al. assembled the genomes of Shaohuang (YPF) and Zihua (PPF), using the passion fruit genome [10] as a reference, and identified 8,069,728 and 7,602,696 SNPs from comparative analysis of YPF and PPF, with an average of 6 SNPs per 1 kb [11]. To date, although researchers have identified a large number of SNPs from the passion fruit genome, there have been no reports of constructing a high-density genetic map using SNP markers for passion fruit.
Stem rot causes severe losses in both the yield and quality of passion fruit, and the types of pathogens vary by region. The reported pathogens causing stem rot in passion fruit mainly include Fusarium oxysporum, Fusarium solani, and Phytophthora nicotianae. In plants such as maize [12,13,14] and wheat [15,16,17], researchers have already identified several resistance genes/QTLs. Ye et al. analyzed the function of the QTL qRfg1 by observing the response of near-isogenic lines of maize infected with Fusarium graminearum, and inferred that qRfg1 encodes a transcription factor that responds to various abiotic stresses [18]. Subsequently, Liu et al. used RNA-seq analysis to reveal that qRfg1 confers resistance to Fusarium stalk rot by constitutively and inducibly expressing defense-related genes, while qRfg2 enhances maize resistance to stalk rot by relatively low induction of auxin signaling and inhibition of polar auxin transport [19]. Following this, Wang et al. fine-mapped the major QTL qRfg1 for resistance to Fusarium graminearum stalk rot in maize to a 170 kb region, identifying ZmCCT as the candidate gene. ZmCCT belongs to the CCT gene family, which plays an important role in plant-specific responses to external environmental signals [20]. Recently, Ye et al. fine-mapped the maize QTL qRfg2 for resistance to Fusarium graminearum stalk rot to a 2.6 kb region. The candidate gene ZmAuxRP1 encodes an auxin-regulated protein that responds rapidly to pathogen attacks, leading to restricted root growth but enhanced resistance to Fusarium stalk rot [21]. Zou et al. discovered that the maize cell wall-associated receptor kinase ZmWAK17 mediates resistance to Fusarium stalk rot [22]. Zhou et al. found that ZmBT2a binds with ZmCUL3 and regulates the transcription of ZmLOXs and ZmPRs via ubiquitination, thereby contributing to the disease resistance process in maize [23]. Wang et al. evaluated the resistance levels of 435 wheat germplasm resources to stalk rot and identified a novel resistance locus on chromosome 3BL [15]. Yang et al. found that TaDIR-B1 may regulate wheat's resistance to stem rot by altering lignin content [16]. Lv et al. cloned the gene TaCWI, which confers resistance to both wheat stem rot and sheath blight. The gene encodes a cell wall invertase protein that inhibits the expression of the TaGAL gene, counteracting its cell wall degradation effect and thickening the cell wall to resist pathogen invasion [17]. Currently, no resistance genes or QTLs for stem rot in passion fruit have been reported domestically or internationally.
In this study, we crossed the passion fruit varieties HG and ZG7 to obtain a BC1F1 population, and performed resequencing on the two parents and 158 progenies, constructing a high-density genetic linkage map for passion fruit. Using Fusarium solani, we evaluated the resistance of the 158 progenies and identified a resistance locus for stem rot through genetic linkage analysis. This study successfully constructed a high-density genetic linkage map for passion fruit and identified a gene related to stem rot resistance, which holds significant importance for the breeding of passion fruit varieties resistant to stem rot.
2. Results
2.1. Genome Resequencing
In December 2020 and January 2021, Ma et al. [10] and Xia et al. [32] successfully assembled high-quality reference genomes of passion fruit, with sizes of 1.28 Gb and 1.34 Gb, respectively, each consisting of 9 chromosomes. These genome sequences provide a solid foundation for identifying SNPs using bioinformatics strategies. In this study, the passion fruit genome assembled by Ma et al. [10] was used as the reference for constructing the genetic map.
Sequencing of the two parents, the HG and ZG7, along with 158 BC1F1 individuals, was performed using the Illumina NovaSeq 6000 sequencing platform. The raw reads obtained from sequencing contained adapter sequences and low-quality reads. To ensure the data quality, the raw reads were filtered to obtain clean reads for further analysis. The sequencing data for the two parents and the 158 progenies are shown in Table 1.
Using the passion fruit genome as the reference sequence, BWA software was used to realign the clean reads obtained from the resequencing of the two parents and 158 progenies to the reference genome (Table 2). By comparing and locating the position of clean reads on the reference genome, statistics are collected on the sequencing depth, genome coverage and other information of each sample, and mutation detection is performed. The average alignment efficiency for all samples was above 90%, indicating that the sequencing quality was normal.
The reads aligned to the reference genome were analyzed to determine the percentage of sequencing bases that covered the passion fruit genome, and the coverage depth was calculated (Table 3). The average genome coverage depth for the parent samples was over 20×, with genome coverage exceeding 90% (at least 1× coverage). For the progeny samples, the average coverage depth was 3.92×, with coverage exceeding 74.87% (at least 1× coverage).
2.2. SNP Detection
For the results obtained from BWA alignment, Picard's Mark Duplicate toolkit was used to remove PCR duplications. GATK was employed for InDel Realignment, specifically realigning around insertion-deletion regions to correct errors in alignment results caused by InDels. Next, GATK was used for base quality score recalibration (Base Recalibration) to correct base quality values and detect variants, including SNPs and InDels (1-5 bp). Strict filtering was applied to SNPs and InDels: SNP clusters were filtered if there were 2 SNPs within 5 bp; SNPs near InDels were filtered if there were SNPs within 5 bp of an InDel; and adjacent InDels were filtered (InDels less than 10 bp apart). A total of 5,849,756 SNPs were detected between the two parents, including 4,096,174 transitions and 1,753,582 transversions. ZG7 had 3,566,274 heterozygous SNPs and 2,283,482 homozygous SNPs, while HG had 946,585 heterozygous SNPs and 4,903,171 homozygous SNPs (Table 4). The higher the number of homozygous SNPs, the greater the difference between the sample and the reference genome. Conversely, the higher the number of heterozygous SNPs, the higher the degree of heterozygosity, which relates to the specific characteristics of the selected materials.
2.3. Bin Markers
Using the 1,180,406 SNPs obtained, we applied a sliding window approach with 15 SNPs per window and a step size of 1 SNP across the chromosomes. If the number of SNPs with the genotype "aa" within the window was greater than or equal to 13, the window was classified as "aa"; if the number of SNPs with the genotype "bb" was greater than or equal to 13, the window was classified as "bb". In other cases, "ab" was used for genotype imputation and correction. After completing the imputation and correction of markers, Bin segmentation was performed based on the recombination events in the progeny. Ultimately, 4,207 valid Bin markers were obtained on the passion fruit genome.
Using 4,206 Bin markers, a graphical genotype analysis of the 158 progenies was performed (Figure 1). In most lines, there are chromosomes without recombination, entirely derived from a single parental genome. Some chromosome segments in certain lines are heterozygous, which may be due to incomplete or erroneous repair after chromosome crossover.
2.4. Genetic Linkage Map
Using the known information, the Bins were divided into 9 linkage groups. For each linkage group, HighMap software [29] was employed to analyze the linear arrangement of markers and estimate the genetic distance between adjacent markers. The final genetic map covered a total length of 1,559.03 cM (Figure 2).
The 9 linkage groups of cultivated Passiflora contained a total of 4,206 Bin markers, ranging from 308 to 956 markers per group. The total genetic distance was 1,559.03 cM, with an average genetic distance of 0.37 cM between Bin markers. The largest gap between markers, 15.45 cM, was located on LG9. Detailed information is presented in Table 5.
2.5. Linkage Assessment and Collinearity Analysis
The genetic map is essentially a result of multipoint recombination analysis, where the smaller the genetic distance between markers, the lower the recombination rate. By analyzing the recombination relationships between markers and their neighboring markers, potential mapping errors or problematic markers can be identified. Figure 3 presents the recombination heatmap of the markers, showing the linkage relationships across all linkage groups.
Next, a collinearity analysis was performed by using the position of the markers on the genome and the genetic map. This analysis helps to assess the accuracy of the genetic map compared to the reference genome. The collinearity between the genetic map and the physical genome is depicted in the figure below. To further quantify the relationship between each linkage group, Spearman's correlation coefficient was calculated for each linkage group. The closer the Spearman coefficient is to 1, the better the collinearity between the genetic map and the physical genome. The Spearman correlation for each linkage group with the reference genome is shown in Figure 4.
2.6. Analysis of Passion Fruit Stem Rot
The identification results showed that the incidence rates of HG and ZG7 were 29.7% and 81.2%, respectively. The incidence rate of stem rot in BC1F1 population are continuously distributed, showing a quantitative genetic model (Figure 5). The minimum incidence rate in 158 individuals was 25.4%, and the maximum was 81.2%. The difference is significant.
2.7. Mapping of Resistance Loci for Stem Rot and Analysis of Candidate Genes
The MapQTL interval mapping method was used to locate the trait, and the threshold was set by 1000 PT tests. A total of one QTL was detected for passion fruit stem rot resistance, located at 145.878-152.951 cM on linkage group 5, with a contribution rate of 8.6% (Figure 6). Subsequently, we named this gene the quantitative trait locus for passion fruit stem rot disease resistance on chromosome 5 (qPSR5).
Based on the analysis results, we aligned the bin markers to the passion fruit genome within the 113,377,860 bp-114,811,870 bp region, which contains 33 candidate genes (Supplementary Table 2). Among them, ZX.05G0020700, ZX.05G0020740, ZX.05G0020790, and ZX.05G0020880 encode NAC domain proteins. Previous studies have shown that NAC transcription factors enhance plant responses to biotic stress by regulating the expression of disease resistance-related genes [33,34,35,36]. ZX.05G0020810 is also associated with increased disease resistance, encoding a zinc ribbon domain-containing protein. In the previous studies, we used RNA-seq to identify differentially expressed genes (DEGs) in response to Fusarium solani infection in both HG and ZG7, identifying a total of 6,801 DEGs[37] (Supplementary Table 3). Within the candidate region for the stem rot resistance gene qPSR5, there are 5 DEGs (Table 6). One of these, ZX.05G0020920, encodes a WAT1-related protein, and the WAT1 gene (At01g75500) in Arabidopsis has been shown to mediate resistance to pathogens [38,39] (Table 6).
Using EF1 as a reference gene, we performed RT-qPCR to detect the expression levels of ZX.05G0020700, ZX.05G0020740, ZX.05G0020760, ZX.05G0020830, ZX.05G0020920, and ZX.05G0020810 in both HG and ZG7 (Figure 7). The results indicated that the expression levels of ZX.05G0020740 and ZX.05G0020810 were significantly different in HG and ZG7, while the expression level of ZX.05G0020700 was no significance.
3. Discussion
A genetic linkage map is a linear diagram that shows the order and relative distances between different genes or specific polymorphic markers on the same chromosome. Constructing a genetic map requires an appropriate population, with commonly used mapping populations including F1, F2, BC, RILs, and DH. Although yellow passion fruit has strong resistance to stem rot disease, it exhibits self-incompatibility [40]. Since the choice of parents directly determines the quality of the genetic map and its applicability in future research, to construct a high-quality genetic map for cultivated passion fruit, we crossed ZG7 as the maternal parent with HG as the paternal parent to obtain an F1 population, and then backcrossed ZG7 to generate the BC1F1 population. Studies have shown that the appropriate population size for constructing a genetic map ranges from 100 to 300 individuals [41-43]. In this study, we used 158 BC1F1 passion fruit individuals to construct the genetic map, which falls within the reasonable size range.
In the study of constructing high-density genetic maps using SNPs, although highly refined genome maps have already been assembled for crops like rice and Arabidopsis, high-density SNP genetic maps remain essential tools for gene mapping research in these species [44,45]. In research on other species, Zhou et al. used GBS technology to sequence a maize recombinant inbred line (RILs, F11) population and constructed a high-density genetic map with 88,268 SNPs, successfully locating plant architecture-related genes and predicting the qPH10 gene [46]. Sun et al. used RAD-seq technology to sequence an F1 population of apples, selecting 3,441 high-quality SNP markers to construct a high-density genetic map of apples and successfully mapped three QTLs for quality traits [47]. Yu et al. constructed a genetic map for broccoli using a double haploid (DH) population containing 9,367 SNPs and identified a locus, QHS.C09-2, associated with the hollow stem trait [48]. Shirasawa et al. successfully constructed a high-density genetic linkage map for hexaploid sweet potato using SNP markers, providing valuable reference data for constructing genetic maps in other polyploid plants [49]. These studies demonstrate that SNP markers, as an efficient and practical molecular marker, can be used to construct high-density genetic maps and locate target trait genes or QTLs across model and non-model species, monocots and dicots, diploid and polyploid plants, and both temporary and permanent mapping populations. In this study, we utilized resequencing technology to sequence the passion fruit varieties HG and ZG7, as well as their BC1F1 population, and constructed a high-density genetic map for passion fruit. The map includes 9 linkage groups with a total genetic distance of 1,559.03 cM and an average genetic distance of 0.404 cM between each bin marker, showing significantly higher resolution compared to the genetic maps constructed by Carneiro et al. [2], Lopes et al. [3], and Oliveira et al. [4]. Additionally, the high-density SNP marker genetic map showed a collinearity correlation coefficient of 0.9994 with the passion fruit genome, indicating the high quality of the map.
In my previous research, we found that genes related to reactive oxygen species (ROS), lignin biosynthesis, and leucine-rich repeat domain proteins play a crucial role in passion fruit resistance to stem rot disease [37]. In this study, through genetic linkage analysis, RNA-seq, and RT-qPCR, we identified that ZX.05G0020700, ZX.05G0020740, and ZX.05G0020920 are likely involved in regulating resistance to passion fruit stem rot disease. Both ZX.05G0020700 and ZX.05G0020740 are NAC transcription factors. NAC transcription factors in plants not only regulate the growth of secondary cell walls [50-53] but also participate in responses to biotic and abiotic stresses [54]. Research has shown that lignin biosynthesis plays a diversified role in plant disease resistance [55,56], with NAC transcription factors regulating this process. For example, in rice, OsNAC5 can directly activate the expression of OsCCR10, which is involved in the biosynthesis of H- and G-lignin, thereby regulating drought tolerance by controlling lignin accumulation [57]. OsNAC028 is involved in lignin synthesis and positively regulates resistance to rice sheath blight [58]. OsNAC29/31 are top-tier transcription factors controlling secondary wall formation and activating OsMYB61, which in turn stimulates the expression of secondary wall cellulose synthesis genes [59]. OsNAC045 reduces stress-induced root growth inhibition by enhancing lignin synthesis in roots and reducing ROS accumulation in response to cold and salt stresses [60]. In wheat, TaNAC032 regulates lignin biosynthesis and enhances resistance to Fusarium head blight [34]. NAC transcription factors also regulate disease resistance genes, enhancing plant immunity. For instance, OsMNAC3 activates negative immune regulators such as OsINO80, OsJAZ10, and OsJAZ11, which negatively regulate resistance to rice blast and bacterial blight [36]. ONAC122 and ONAC131 play critical roles in disease resistance in rice by regulating the expression of defense-related and signaling genes [61]. ONAC083 activates OsRFPH2-6, negatively regulating rice immunity to blast fungus [62]. Despite OsNAC60 overexpression enhancing defense responses, it negatively regulates rice immunity to blast [63]. In barley, the NAC transcription factor Rph7 mediates resistance to rust [35], while in wheat, TaNAC30 negatively regulates resistance to stripe rust [64]. The passion fruit genome contains 105 NAC transcription factors. After Fusarium kyushuense infection, 15 NAC genes showed significantly different expression levels in yellow and purple passion fruit, with PeNAC001, PeNAC003, PeNAC028, PeNAC033, PeNAC057, PeNAC058, PeNAC063, and PeNAC077 suspected to play key roles in Fusarium kyushuense resistance [65]. In this study, ZX.05G0020700 (PeNAC068) and ZX.05G0020740 (PeNAC069) exhibited significant expression changes after Fusarium solani infection in HG and ZG7, suggesting these genes may play important roles in passion fruit resistance to stem rot disease.
WAT1 (Walls Are Thin 1) is an Arabidopsis homolog of Medicago truncatula NODULIN21, essential for secondary wall formation in fibers [66]. The secondary cell wall (SCW) is a critical part of the plant cell wall, located inside the primary wall and gradually formed and thickened during cell growth and development. SCWs are composed primarily of complex polymers like cellulose, lignin, and hemicellulose. These components and structures provide SCWs with many important functions, such as mechanical support, water and nutrient transport, and resistance against pathogen invasion [67]. Denancé found that Arabidopsis wat1 (walls are thin1) mediates resistance to the bacterial vascular pathogen Ralstonia solanacearum [38]. Koseoglou et al. showed that inactivation of WAT1 in tomato reduced susceptibility to Clavibacter michiganensis by downregulating bacterial virulence factors [68]. In this study, significant differences in NAC and WAT1 gene expression were observed between HG and ZG7, and previous research has demonstrated that NAC transcription factors regulate the growth of plant secondary cell walls [50,51,52,53]. Therefore, it is likely that NAC transcription factors and WAT1 genes jointly contribute to the regulation of passion fruit stem rot disease resistance.
4. Materials and Methods
4.1. Plant Materials
F1 generation was obtained by crossbreeding Ziguo7 (ZG7, female parent) and Huangguoyuanshengzhong (HG, male parent). Then use F1 generation to hybridize with ZG7 to obtain BC1F1 population. The experimental materials, HG, ZG7, and 158 progenies, were planted at the Meilinanfang of Guangxi Academy of Agricultural Sciences. Stem rot samples were collected from the boundary between healthy and infected tissue at the stem of passion fruit plants, and the pathogen was isolated and placed on potato dextrose agar (PDA) medium, primarily identified as Fusarium solani. To assess the disease resistance of the passion fruit plants, we used an in vitro inoculation method. The purified and preserved pathogen was reactivated and cultured on PDA medium at 28°C for 5 days. Mycelial plugs were obtained using a 1000 μL sterilized pipette tip. For the disease resistance evaluation, an artificial wound was made at the stem, and the prepared mycelial plugs were placed on the wound, with the mycelium facing directly against the wound site. Each progeny family was planted with 15 plants, and the disease incidence rate was recorded.
4.2. DNA Extraction
At the 6-8 leaf stage, young leaves from the two parents and 158 individuals were collected and stored at -80 °C. Genomic DNA from the parents and BC1F1 population was extracted using the CTAB method. The DNA concentration was measured with a Qubit 2.0 Fluorometer, and the purity and integrity of the DNA were assessed using 1% agarose gel electrophoresis.
4.3. Resequencing and SNP Calling
After the DNA samples passed quality control, the DNA was randomly fragmented using ultrasonication. The DNA fragments were then subjected to end repair, 3' end A-tailing, sequencing adapter ligation, purification, and PCR amplification to construct the sequencing library. Once the library passed quality control, sequencing was performed on the Illumina NovaSeq 6000 platform.
The raw sequencing data were assessed and filtered for quality using Cutadapt software[24] and Trimmomatic software[25]. The main steps for data filtering were as follows: (1) removing adapter sequences; (2) filtering out paired-end reads where the proportion of 'N' bases (undetermined nucleotides) was greater than 10%; and (3) removing low-quality reads, where more than 50% of the bases in the read had a quality score of Q ≤ 10.
Using the passion fruit genome as a reference, we employed BWA software [26] to align the clean reads to the reference genome, generating SAM format alignment results. SAMtools software (version 1.3.1) was then used to convert the SAM files into BAM format. Subsequently, the Picard tool (version 1.91) (http://sourceforge.net/projects/picard/) was used to sort the reads in the BAM files using the SortSam function. The final BAM files were utilized for coverage and depth statistics, as well as for variant calling. Next, the HaplotypeCaller module from the GATK (version 3.7) software package [27] was used to generate gvcf files for each sample, followed by SNP detection across all samples using the GenotypeGVCFs module.
4.4. Genetic Maping
Based on the resequencing results, SNP genotyping and filtering were performed on the parents and 158 RILs. Following the method published by Huang et al., a sliding window approach was used, where each window contained 15 SNPs, and the step size was 1 SNP along the chromosome. If 13 or more SNPs in the window were genotyped as "aa", the window was classified as "aa". Similarly, if 13 or more SNPs were genotyped as "bb," the window was classified as "bb." In other cases, the genotype was filled and corrected as "ab" [28]. Afterward, the HighMap software[29] was used for linkage grouping, marker ordering, genotype correction, and map evaluation.
4.5. QTL Analysis
Trait mapping was performed using the interval mapping method in MapQTL 6 (https://www.kyazma.nl/index.php/MapQTL/Updates/), and a permutation test (PT) was conducted 1000 times to set the threshold value. The IM algorithm in the MapQTL software were used for QTL mapping. When the LOD score at a certain position exceeded the threshold, we would consider a QTL present at that location. At a 5% significance level, a critical value of 2.5 was used, meaning that an LOD score of ≥2.5 was taken as the threshold for determining the existence of a QTL.
4.6. Candidate Gene Analysis
Using the physical position corresponding to the mapped interval, the candidate genes were screened through the annotation function of the passion fruit genome database, combined with the results from previous RNA-seq analyses[30].
4.7. RT-qPCR
Total RNA was extracted using the TRIzol® Reagent kit (Invitrogen, USA), following the manufacturer’s instructions. EF1 was used as the reference gene[31], and RT-qPCR was employed to validate the candidate genes and primers listed in Supplementary Table 1. The detailed RT-qPCR procedure followed the methods described in a previously published paper [30].
4.8. Statistical Analysis
Origin2019B software was used for statistical analysis. CorelDRAW X8 software was utilized for data visualization and figure generation. Primers were designed using Primer 5 software.
5. Conclusions
In this study, we utilized SNP markers to construct the first high-density genetic linkage map for cultivated passion fruit. This map consists of 9 linkage groups, with a total genetic distance of 1559.03 cM, an average genetic distance of 311.806 cM, and an average distance between 4206 bins of 0.404 cM, with a mean gap length of 10.565 cM. The collinearity correlation coefficient between the genetic map and the genome of Passiflora edulis was 0.9994. Using this genetic map, we identified one locus for stem rot disease resistance on linkage group 5, located between 145.878 cM and 152.951 cM, contributing 8.6% to the resistance. Through RNA-seq and RT-qPCR analysis, we detected the expression levels of predicted genes within the candidate region, identifying ZX.05G0020740 and ZX.05G0020810 as ideal candidate genes for resistance to stem rot disease in passion fruit. The construction of this high-efficiency, high-density genetic map provides a strong foundation for identifying QTLs related to stem rot disease resistance and closely linked molecular markers, laying the groundwork for the genetic improvement and molecular breeding of cultivated passion fruit.
Author Contributions
Conceptualization, X.Y. and H.M.; methodology, Y.W. and J.L.; formal analysis, Y.W. and J.Z.; validation, J.Z., Q.T. and Y.W.; investigation, W.H., X.X. and Q.T.; writing—original draft preparation, Y.W.; writing—review and editing, X.Y. and H.M.; supervision, H.M. All authors have read and agreed to the published version of the manuscript.
Funding
This work was supported by the National Natural Science Foundation of China (No.32060660 and 32260740), Guangxi Natural Science Foundation of China (2023GXNSFAA026301), Guangxi Ministry of Science and Technology (GuikeAA22068091-1), Guangxi Academy of Agricultural Sciences (2021YT089).
Data Availability Statement
The RNA-seq data that support the findings of this study have been deposited to National Center for Biotechnology Information (NCBI) Sequence Read Archive (SRA) with the accession code PRJNA1102446 (SRA no. from SRR28748077 to SRR28748094).
Conflicts of Interest
The authors declare no conflicts of interest.
References
- Nelson, R.; Wiesner-hanks, T.; Wisser, R.; Balint-kurti, P. Navigating complexity to breed disease-resistant crops. Nat. Rev. Genet. 2018, 19, 21–33. [Google Scholar] [CrossRef] [PubMed]
- Carneiro, M.S.; Camargo, L.E.; Coelho, A.S.; Vencovsky, R.; Rui, P.L.; Stenzel, N.M.; Vieira, M.L. RAPD-based genetic linkage maps of yellow Passion fruit (Passiflora edulis Sims. f. flavicarpa Deg.). Genome 2002, 45, 670–678. [Google Scholar] [CrossRef] [PubMed]
- Lopes, R.; Lopes, M.T.; Carneiro, M.S.; Matta, F.P.; Camargo, L.E.; Vieira, M.L. Linkage and mapping of resistance genes to Xanthomonas axonopodis pv. passiflorae in yellow Passion fruit. Genome 2006, 49, 17–29. [Google Scholar] [CrossRef] [PubMed]
- Oliveira, E.J.; Vieira, M.; Garcia, A.; Munhoz, C.F.; Margarido, G.; Consoli, L.; Matta, F.P.; Moraes, M.C.; Zucchi, M.I.; Fungaro, M. An integrated molecular map of yellow Passion fruit based on simultaneous Maximum-likelihood estimation of linkage and linkage phases. J. Am. Soc. Hortic. Sci. 2008, 133, 35–41. [Google Scholar] [CrossRef]
- Ganal, W.; Altmann, T.; Röder, M.S. SNP identification in crop plants. Curr. Opin. Plant Biol. 2009, 12, 211–217. [Google Scholar] [CrossRef]
- Costa., Z.D.; Munhoz, C.F.; Vieira, M. Report on the development of putative functional SSR and SNP markers in Passion fruits. BMC Res. Notes 2017, 10, 445. [Google Scholar] [CrossRef]
- Schmid, K.; Sorensen, T.R.; Stracke, R.; Torjek, O.; Altmann, T.; Mitchell-olds, T.; Weisshaar, B. Large-scale identification and analysis of genome-wide single-nucleotide polymorphisms for mapping in Arabidopsis thaliana. Genome Res. 2003, 13, 1250–1257. [Google Scholar] [CrossRef]
- Yu, J.; Wang, J.; Lin, W.; Li, S.; Li, H.; Zhou, J.; Ni, P.; Dong, W.; Hu, S.; Zeng, C.; et al. The genomes of oryza sativa: a history of duplications. PLoS Biol. 2005, 3, e38. [Google Scholar] [CrossRef]
- Nazareno, A.G.; Dick, C.W.; Lohmann, L.G. Tangled banks: a landscape genomic evaluation of wallace’s riverine barrier hypothesis for three Amazon plant species. Mol. Ecol. 2018, 28, 980–997. [Google Scholar] [CrossRef]
- Ma, D.; Dong, S.; Zhang, S.; Wei, X.; Xie, Q.; Ding, Q.; Xia, R.; Zhang, X. Chromosome-level reference genome assembly provides insights into aroma biosynthesis in Passion fruit (Passiflora edulis). Mol. Ecol. Resour. 2021, 21, 955–968. [Google Scholar] [CrossRef]
- Zheng, Y.Y.; Chen, L.H.; Fan, B.L.; Xu, Z.; Wang, Q.; Zhao, B.Y.; Gao, M.; Yuan, M.H.; Tahir, U.M.; Jiang, Y.; et al. Integrative multiomics profiling of Passion fruit reveals the genetic basis for fruit color and aroma. Plant Physiol. 2024, 194, 2491–2510. [Google Scholar] [CrossRef] [PubMed]
- Ma, C.; Ma, X.; Yao, L.; Liu, Y.; Du, F.; Yang, X.; Xu, M. qRfg3, a novel quantitative resistance locus against gibberella stalk ROT in maize. Theor. Appl. Genet. 2017, 130, 1723–1734. [Google Scholar] [CrossRef] [PubMed]
- Duan, C.; Song, F.; Sun, S.; Guo, C.; Zhu, Z.; Wang, X. Characterization and molecular mapping of two novel genes resistant to Pythium stalk rot in maize. Phytopathology 2019, 109, 804–809. [Google Scholar] [CrossRef] [PubMed]
- Chen, Q.; Song, J.; Du, W.P.; Xu, L.Y.; Jiang, Y.; Zhang, J.; Xiang, X.L.; Yu, G.R. Identification, mapping, and molecular marker development for Rgsr8.1: a new quantitative trait locus conferring resistance to Gibberella stalk rot in maize (Zea mays L.). Front. Plant Sci. 2017, 8, 1355. [Google Scholar] [CrossRef] [PubMed]
- Wang, C.; Sun, M.; Zhang, P.; Ren, X.; Zhao, S.; Li, M.; Ren, Z.; Yuan, M.; Ma, L.; Liu, Z.; et al. Genome-wide association studies on Chinese wheat cultivars reveal a novel Fusarium crown rot resistance quantitative trait locus on chromosome 3BL. Plants 2024, 13, 856. [Google Scholar] [CrossRef]
- Yang, X.; Zhong, S.; Zhang, Q.; Ren, Y.; Sun, C.; Chen, F. A loss-of-function of the dirigent gene TaDIR-B1 improves resistance to Fusarium crown rot in wheat. Plant Biotechnol. J. 2021, 19, 866–868. [Google Scholar] [CrossRef]
- Lv, G.; Zhang, Y.; Ma, L.; Yan, X.; Yuan, M.; Chen, J.; Cheng, Y.; Yang, X.; Qiao, Q.; Zhang, L.; et al. A cell wall invertase modulates resistance to fusarium crown rot and sharp eyespot in common wheat. J. Integr. Plant Biol. 2023, 65, 1814–1825. [Google Scholar] [CrossRef]
- Ye, J.; Guo, Y.; Zhang, D.; Zhang, N.; Wang, C.; Xu, M. Cytological and molecular characterization of quantitative trait locus qRfg1, which confers resistance to Gibberella stalk rot in maize. Mol. Plant Microbe Interact. 2013, 26, 1417–1428. [Google Scholar] [CrossRef]
- Liu, Y.; Guo, Y.; Ma, C.; Zhang, D.; Wang, C.; Yang, Q. Transcriptome analysis of maize resistance to Fusarium graminearum. BMC Genomics 2016, 17, 477. [Google Scholar] [CrossRef]
- Wang, C.; Yang, Q.; Wang, W.; Li, Y.; Guo, Y.; Zhang, D.; Ma, X.; Song, W.; Zhao, J.; Xu, M. A transposon-directed epigenetic change in ZmCCT underlies quantitative resistance to Gibberella stalk rot in maize. New Phytol. 2017, 215, 1503–1515. [Google Scholar] [CrossRef]
- Ye, J.; Zhong, T.; Zhang, D.; Ma, C.; Wang, L.; Yao, L.; Zhang, Q.; Zhu, M.; Xu, M. The auxin-regulated protein ZmAuxRP1 coordinates the balance between root growth and stalk rot disease resistance in maize. Mol. Plant 2019, 12, 360–373. [Google Scholar] [CrossRef] [PubMed]
- Zuo, N.; Bai, W.Z.; Wei, W.Q.; Yuan, T.L.; Zhang, D.; Wang, Y.Z.; Tang, W.H. Fungal CFEM effectors negatively regulate a maize wall-associated kinase by interacting with its alternatively-spliced variant to dampen resistance. Cell Rep. 2022, 41, 111877. [Google Scholar] [CrossRef] [PubMed]
- Zhou, F.; Wang, Y.; Liu, P.; Ma, W.; He, R.; Cao, H.; Xing, J.; Zhang, K.; Dong, J. Function of ZmBT2a gene in resistance to pathogen infection in maize. Phytopathol. Res. 2024, 6, 43. [Google Scholar] [CrossRef]
- Martin, M. CUTADAPT removes adapter sequences from high-throughput sequencing reads. EMBnet J. 2011, 17, 10–12. [Google Scholar] [CrossRef]
- Bolger, A.M.; Lohse, M.; Usadel, B. Trimmomatic: a flexible trimmer for Illumina sequence data. Bioinformatics 2014, 30, 2114–2120. [Google Scholar] [CrossRef]
- Li, H.; Durbin, R. Fast and accurate short read alignment with Burrows-Wheeler transform. Bioinformatics 2009, 25, 1754–1760. [Google Scholar] [CrossRef]
- Mckenna, A.; Hanna, M.; Banks, E.; Sivachenko, A.; Cibulskis, K.; Kernytsky, A.; Garimella, K.; Altshuler, D.; Gabriel, S.; Daly, M.; et al. The genome analysis toolkit: a MapReduce framework for analyzing next-generation DNA sequencing data. Genome Res. 2010, 20, 1297–1303. [Google Scholar] [CrossRef]
- Huang, X.; Feng, Q.; Qian, Q. High-throughput genotyping by whole-genome resequencing. Genome Res. 2009, 19, 1068–1076. [Google Scholar] [CrossRef]
- Liu, D.; Ma, C.; Hong, W.; Huang, L.; Liu, M.; Liu, H.; Zeng, H.; Deng, D.; Xin, H.; Song, J.; et al. Construction and analysis of high-density linkage map using high-throughput sequencing data. PLoS One 2014, 9, e98855. [Google Scholar] [CrossRef]
- Wu, Y.; Huang, W.; Tian, Q.; Liu, J.; Xia, X.; Yang, X.; Mou, H. Comparative transcriptomic analysis reveals the cold acclimation during chilling stress in sensitive and resistant Passion fruit (Passiflora edulis) cultivars. PeerJ 2021, 9, e10977. [Google Scholar] [CrossRef]
- Zhao, M.; Fan, H.; Tu, Z.; Cai, G.; Zhang, L.; Li, A.; Xu, M. Stable reference gene selection for quantitative real-time PCR normalization in Passion fruit (Passiflora edulis Sims.). Mol. Biol. Rep. 2022, 49, 5985–5995. [Google Scholar] [CrossRef] [PubMed]
- Xia, Z.; Huang, D.; Zhang, S.; Wang, W.; Ma, F.; Wu, B.; Xu, Y.; Xu, B.; Chen, D.; Zou, M.; et al. Chromosome-scale genome assembly provides insights into the evolution and flavor synthesis of Passion fruit (Passiflora edulis Sims). Hortic. Res. 2021, 8, 14. [Google Scholar] [CrossRef] [PubMed]
- Liu, Q.; Yan, S.; Huang, W.; Yang, J.; Dong, J.; Zhang, S.; Zhao, J.; Yang, T.; Mao, X.; Zhu, X.; et al. NAC transcription factor ONAC066 positively regulates disease resistance by suppressing the ABA signaling pathway in rice. Plant Mol. Biol. 2018, 98, 289–302. [Google Scholar] [CrossRef] [PubMed]
- Soni, N.; Altartouri, B.; Hegde, N.; Duggavathi, R.; Nazarian-firouzabadi, F.; Kushalappa, A.C. TaNAC032 transcription factor regulates lignin-biosynthetic genes to combat Fusarium head blight in wheat. Plant Sci. 2021, 304, 110820. [Google Scholar] [CrossRef]
- Chen, C.; Jost, M.; Outram, M.A.; Friendship, D.; Chen, J.; Wang, A.; Periyannan, S.; Bartoš, J.; Holušová, K.; Doležel, J.; et al. A pathogen-induced putative NAC transcription factor mediates leaf rust resistance in barley. Nat. Commun. 2023, 14, 5468. [Google Scholar] [CrossRef]
- Wang, H.; Bi, Y.; Yan, Y.; Yuan, X.; Gao, Y.; Noman, M.; Li, D.; Song, F. A NAC transcription factor MNAC3-centered regulatory network negatively modulates rice immunity against blast disease. J. Integr. Plant Biol. 2024. [Google Scholar] [CrossRef]
- Wu, Y.; Shi, G.; Zhou, J.; Tian, Q.; Liu, J.; Huang, W.; Xia, X.; Mou, H.; Yang, X. Identification and validation of stem rot disease resistance genes in Passion fruit (Passiflora edulis). Hortic. Sci. 2025, 52, 1–22. [Google Scholar]
- Denancé, N.; Ranocha, P.; Oria, N.; Barlet, X.; Rivière, M.P.; Yadeta, K.A.; Hoffmann, L.; Perreau, F.; Clément, G.; Maia-grondard, A.; et al. Arabidopsis wat1 (walls are thin1)-mediated resistance to the bacterial vascular pathogen, Ralstonia solanacearum, is accompanied by cross-regulation of salicylic acid and tryptophan metabolism. Plant J. 2013, 73, 225–239. [Google Scholar] [CrossRef]
- Hanika, K.; Schipper, D.; Chinnappa, S.; Oortwijn, M.; Schouten, H.J.; Thomma, B.; Bai, Y. Impairment of tomato WAT1 Enhances resistance to Vascular wilt fungi despite severe growth defects. Front Plant Sci 2021, 12, 721674. [Google Scholar] [CrossRef]
- Rêgo, M.M.; Rêgo, E.R.; Bruckner, C.H.; Silva, E.A.; Finger, F.L.; Pereira, K.C. Pollen tube behavior in yellow Passion fruit following compatible and incompatible crosses. Theor. Appl. Genet. 2000, 101, 685–689. [Google Scholar] [CrossRef]
- Zhang, W.; Lu, Z.; Guo, T.; Yuan, C.; Liu, J. Construction of a high-density genetic map and QTL localization of body weight and wool production related traits in Alpine Merino sheep based on WGR. BMC Genomics 2024, 25, 641. [Google Scholar] [CrossRef] [PubMed]
- Zhang, Z.; Xie, W.; Zhang, J.; Wang, N.; Zhao, Y.; Wang, Y.; Bai, S. Construction of the first high-density genetic linkage map and identification of seed yield-related QTLs and candidate genes in Elymus sibiricus, an important forage grass in Qinghai-Tibet Plateau. BMC Genomics 2019, 20, 861. [Google Scholar] [CrossRef] [PubMed]
- Wang, X.; Chen, Z.; Li, Q.; Zhang, J.; Liu, S.; Duan, D. High-density SNP-based QTL mapping and candidate gene screening for yield-related blade length and width in Saccharina japonica (Laminariales, Phaeophyta). Sci. Rep. 2018, 8, 13591. [Google Scholar] [CrossRef] [PubMed]
- Neelam, K.; Mahajan, R.; Gupta, V.; Bhatia, D.; Gill, B.K.; Komal, R.; Lore, J.S.; Mangat, G.S.; Singh, K. High-resolution genetic mapping of a novel bacterial blight resistance gene xa-45(t) identified from Oryza glaberrima and transferred to Oryza sativa. Theor. Appl. Genet. 2019. [Google Scholar] [CrossRef] [PubMed]
- Ear, S.; Snoek, L.B.; Nijveen, H.; Laj, W.; Jiménez-gómez, J.M.; Hilhorst, H.; Ligterink, W. Construction of a High-Density genetic map from RNA-Seq data for an arabidopsis Bay-0 × shahdara RIL population. Front. Genet. 2017, 8, 201. [Google Scholar]
- Zhou, Z.; Zhang, C.; Zhou, Y.; Hao, Z.; Wang, Z.; Zeng, X.; Di, H.; Li, M.; Zhang, D.; Yong, H.; et al. Genetic dissection of maize plant architecture with an ultra-high density bin map based on recombinant inbred lines. BMC Genomics 2016, 17, 178. [Google Scholar] [CrossRef]
- Sun, R.; Chang, Y.; Yang, F.; Wang, Y.; Li, H.; Zhao, Y.; Chen, D.; Wu, T.; Zhang, X.; Han, Z. A dense SNP genetic map constructed using restriction site-associated DNA sequencing enables detection of QTLs controlling Apple fruit quality. BMC Genomics 2015, 16, 747. [Google Scholar] [CrossRef]
- Yu, H.; Wang, J.; Zhao, Z.; Sheng, X.; Shen, Y.; Branca, F.; Gu, H. Construction of a High-Density genetic map and identification of LOCI related to hollow stem trait in broccoli (brassic oleracea l. italica). Front. Plant Sci. 2019, 10, 45. [Google Scholar] [CrossRef]
- Shirasawa, K.; Tanaka, M.; Takahata, Y.; Ma, D.; Cao, Q.; Liu, Q.; Zhai, H.; Kwak, S.S.; Cheol, J.J.; Yoon, U.H.; et al. A high-density SNP genetic map consisting of a complete set of homologous groups in autohexaploid sweetpotato (Ipomoea batatas). Sci. Rep. 2017, 7, 44207. [Google Scholar] [CrossRef]
- Yamaguchi, M.; Ohtani, M.; Mitsuda, N.; Kubo, M.; Ohme-takagi, M.; Fukuda, H.; Demura, T. VND-INTERACTING2, a NAC domain transcription factor, negatively regulates xylem vessel formation in Arabidopsis. Plant Cell 2010, 22, 1249–1263. [Google Scholar] [CrossRef]
- Cao, S.; Wang, Y.; Gao, Y.; Xu, R.; Ma, J.; Xu, Z.; Shang-guan, K.; Zhang, B.; Zhou, Y. The RLCK-VND6 module coordinates secondary cell wall formation and adaptive growth in rice. Mol. Plant 2023, 16, 999–1015. [Google Scholar] [CrossRef] [PubMed]
- Cong, L.; Shi, Y.K.; Gao, X.Y.; Zhao, X.F.; Zhang, H.Q.; Zhou, F.L.; Zhang, H.J.; Ma, B.Q.; Zhai, R.; Yang, C.Q.; et al. Transcription factor PbNAC71 regulates xylem and vessel development to control plant height. Plant Physiol. 2024, 195, 395–409. [Google Scholar] [CrossRef] [PubMed]
- Taylor-teeples, M.; Lin, L.; De lucas, M.; Turco, G.; Toal, T.W.; Gaudinier, A.; Young, N.F.; Trabucco, G.M.; Veling, M.T.; Lamothe, R.; et al. An arabidopsis gene regulatory network for secondary cell wall synthesis. Nature 2015, 517, 571–575. [Google Scholar] [CrossRef] [PubMed]
- Nakashima, K.; Takasaki, H.; Mizoi, J.; Shinozaki, K.; Yamaguchi-shinozaki, K. NAC transcription factors in plant abiotic stress responses. Biochim. Biophys. Acta 2012, 1819, 97–103. [Google Scholar] [CrossRef]
- Ma, Q.H. Lignin biosynthesis and its diversified roles in disease resistance. Genes (Basel) 2024, 15, 295. [Google Scholar] [CrossRef]
- Liu, Q.; Luo, L.; Zheng, L. Lignins: biosynthesis and biological functions in plants. Int. J. Mol. Sci. 2018, 19, 335. [Google Scholar] [CrossRef]
- Bang, S.W.; Choi, S.; Jin, X.; Jung, S.E.; Choi, J.W.; Seo, J.S.; Kim, J.K. Transcriptional activation of rice CINNAMOYL-CoA REDUCTASE 10 by OsNAC5, contributes to drought tolerance by modulating lignin accumulation in Roots. Plant Biotechnol. J. 2022, 20, 736–747. [Google Scholar] [CrossRef]
- Yuan, P.; Yang, S.; Feng, L.; Chu, J.; Dong, H.; Sun, J.; Chen, H.; Li, Z.; Yamamoto, N.; Zheng, A.; et al. Red-light receptor phytochrome B inhibits BZR1-NAC028-CAD8B signaling to negatively regulate rice resistance to sheath blight. Plant Cell Environ. 2023, 46, 1249–1263. [Google Scholar] [CrossRef]
- Huang, D.; Wang, S.; Zhang., B.; Shang-guan, K.; Shi, Y.; Zhang, D.; Liu, X.; Wu, K.; Xu, Z.; Fu, X.; et al. A gibberellin-mediated DELLA-NAC signaling cascade regulates cellulose synthesis in rice. Plant Cell 2015, 27, 1681–1696. [Google Scholar] [CrossRef]
- Yu, S.; Huang, A.; Li, J.; Gao, L.; Feng, Y.; Pemberton, E.; Chen, C. OsNAC45 plays complex roles by mediating POD activity and the expression of development-related genes under various abiotic stresses in rice root. Plant Growth Regul. 2018, 84, 519–531. [Google Scholar] [CrossRef]
- Sun, L.; Zhang, H.; Li, D.; Huang, L.; Hong, Y.; Ding, X.S.; Nelson, R.S.; Zhou, X.; Song, F. Functions of rice NAC transcriptional factors, ONAC122 and ONAC131, in defense responses against Magnaporthe grisea. Plant Mol Biol 2013, 81, 41–56. [Google Scholar] [CrossRef] [PubMed]
- Bi, Y.; Wang, H.; Yuan, X.; Yan, Y.; Li, D.; Song, F. The NAC transcription factor ONAC083 negatively regulates rice immunity against Magnaporthe oryzae by directly activating transcription of the RING-H2 gene OsRFPH2-6. J. Integr. Plant Biol. 2023, 65, 854–875. [Google Scholar] [CrossRef] [PubMed]
- Wang, Z.; Xia, Y.; Lin, S.; Wang, Y.; Guo, B.; Song, X.; Ding, S.; Zheng, L.; Feng, R.; Chen, S.; et al. Osa-miR164a targets OsNAC60 and negatively regulates rice immunity against the blast fungus Magnaporthe oryzae. Plant J. 2018, 95, 584–597. [Google Scholar] [CrossRef] [PubMed]
- Wang, B.; Wei, J.; Song, N.; Wang, N.; Zhao, J.; Kang, Z. A novel wheat NAC transcription factor, TaNAC30, negatively regulates resistance of wheat to stripe rust. J. Integr. Plant Biol. 2018, 60, 432–443. [Google Scholar] [CrossRef] [PubMed]
- Yang, Q.; Li, B.; Rizwan, H.M.; Sun, K.; Zeng, J.; Shi, M.; Guo, T.; Chen, F. Genome-wide identification and comprehensive analyses of NAC transcription factor gene family and expression analysis under Fusarium kyushuense and drought stress conditions in Passiflora edulis. Front. Plant Sci. 2022, 13. [Google Scholar] [CrossRef]
- Ranocha, P.; Denancé, N.; Vanholme, R.; Freydier, A.; Martinez, Y.; Hoffmann, L.; Köhler, L.; Pouzet, C.; Renou, J.P.; Sundberg, B.; et al. Walls are thin 1 (WAT1), an Arabidopsis homolog of Medicago truncatula NODULIN21, is a tonoplast-localized protein required for secondary wall formation in fibers. Plant J. 2010, 63, 469–483. [Google Scholar] [CrossRef]
- Rao, X.; Dixon, R.A. Current models for transcriptional regulation of secondary cell wall biosynthesis in grasses. Front. Plant Sci. 2018, 9, 399. [Google Scholar] [CrossRef]
- Koseoglou, E.; Hanika, K.; Mohd, N.M.; Kohlen, W.; Van der wolf, J.M.; Visser, R.; Bai, Y. Inactivation of tomato WAT1 leads to reduced susceptibility to Clavibacter michiganensis through downregulation of bacterial virulence factors. Front Plant Sci 2023, 14, 1082094. [Google Scholar] [CrossRef]
Figure 1.
Schematic genotype of passion fruit BC1F1 population. Red segments represent chromosomes derived from the male parent (HG) genome, blue segments represent those from the female parent (ZG7) genome, and orange segments indicate heterozygous regions. The horizontal axis represents chromosome size, while the vertical axis represents the individual progeny numbers.
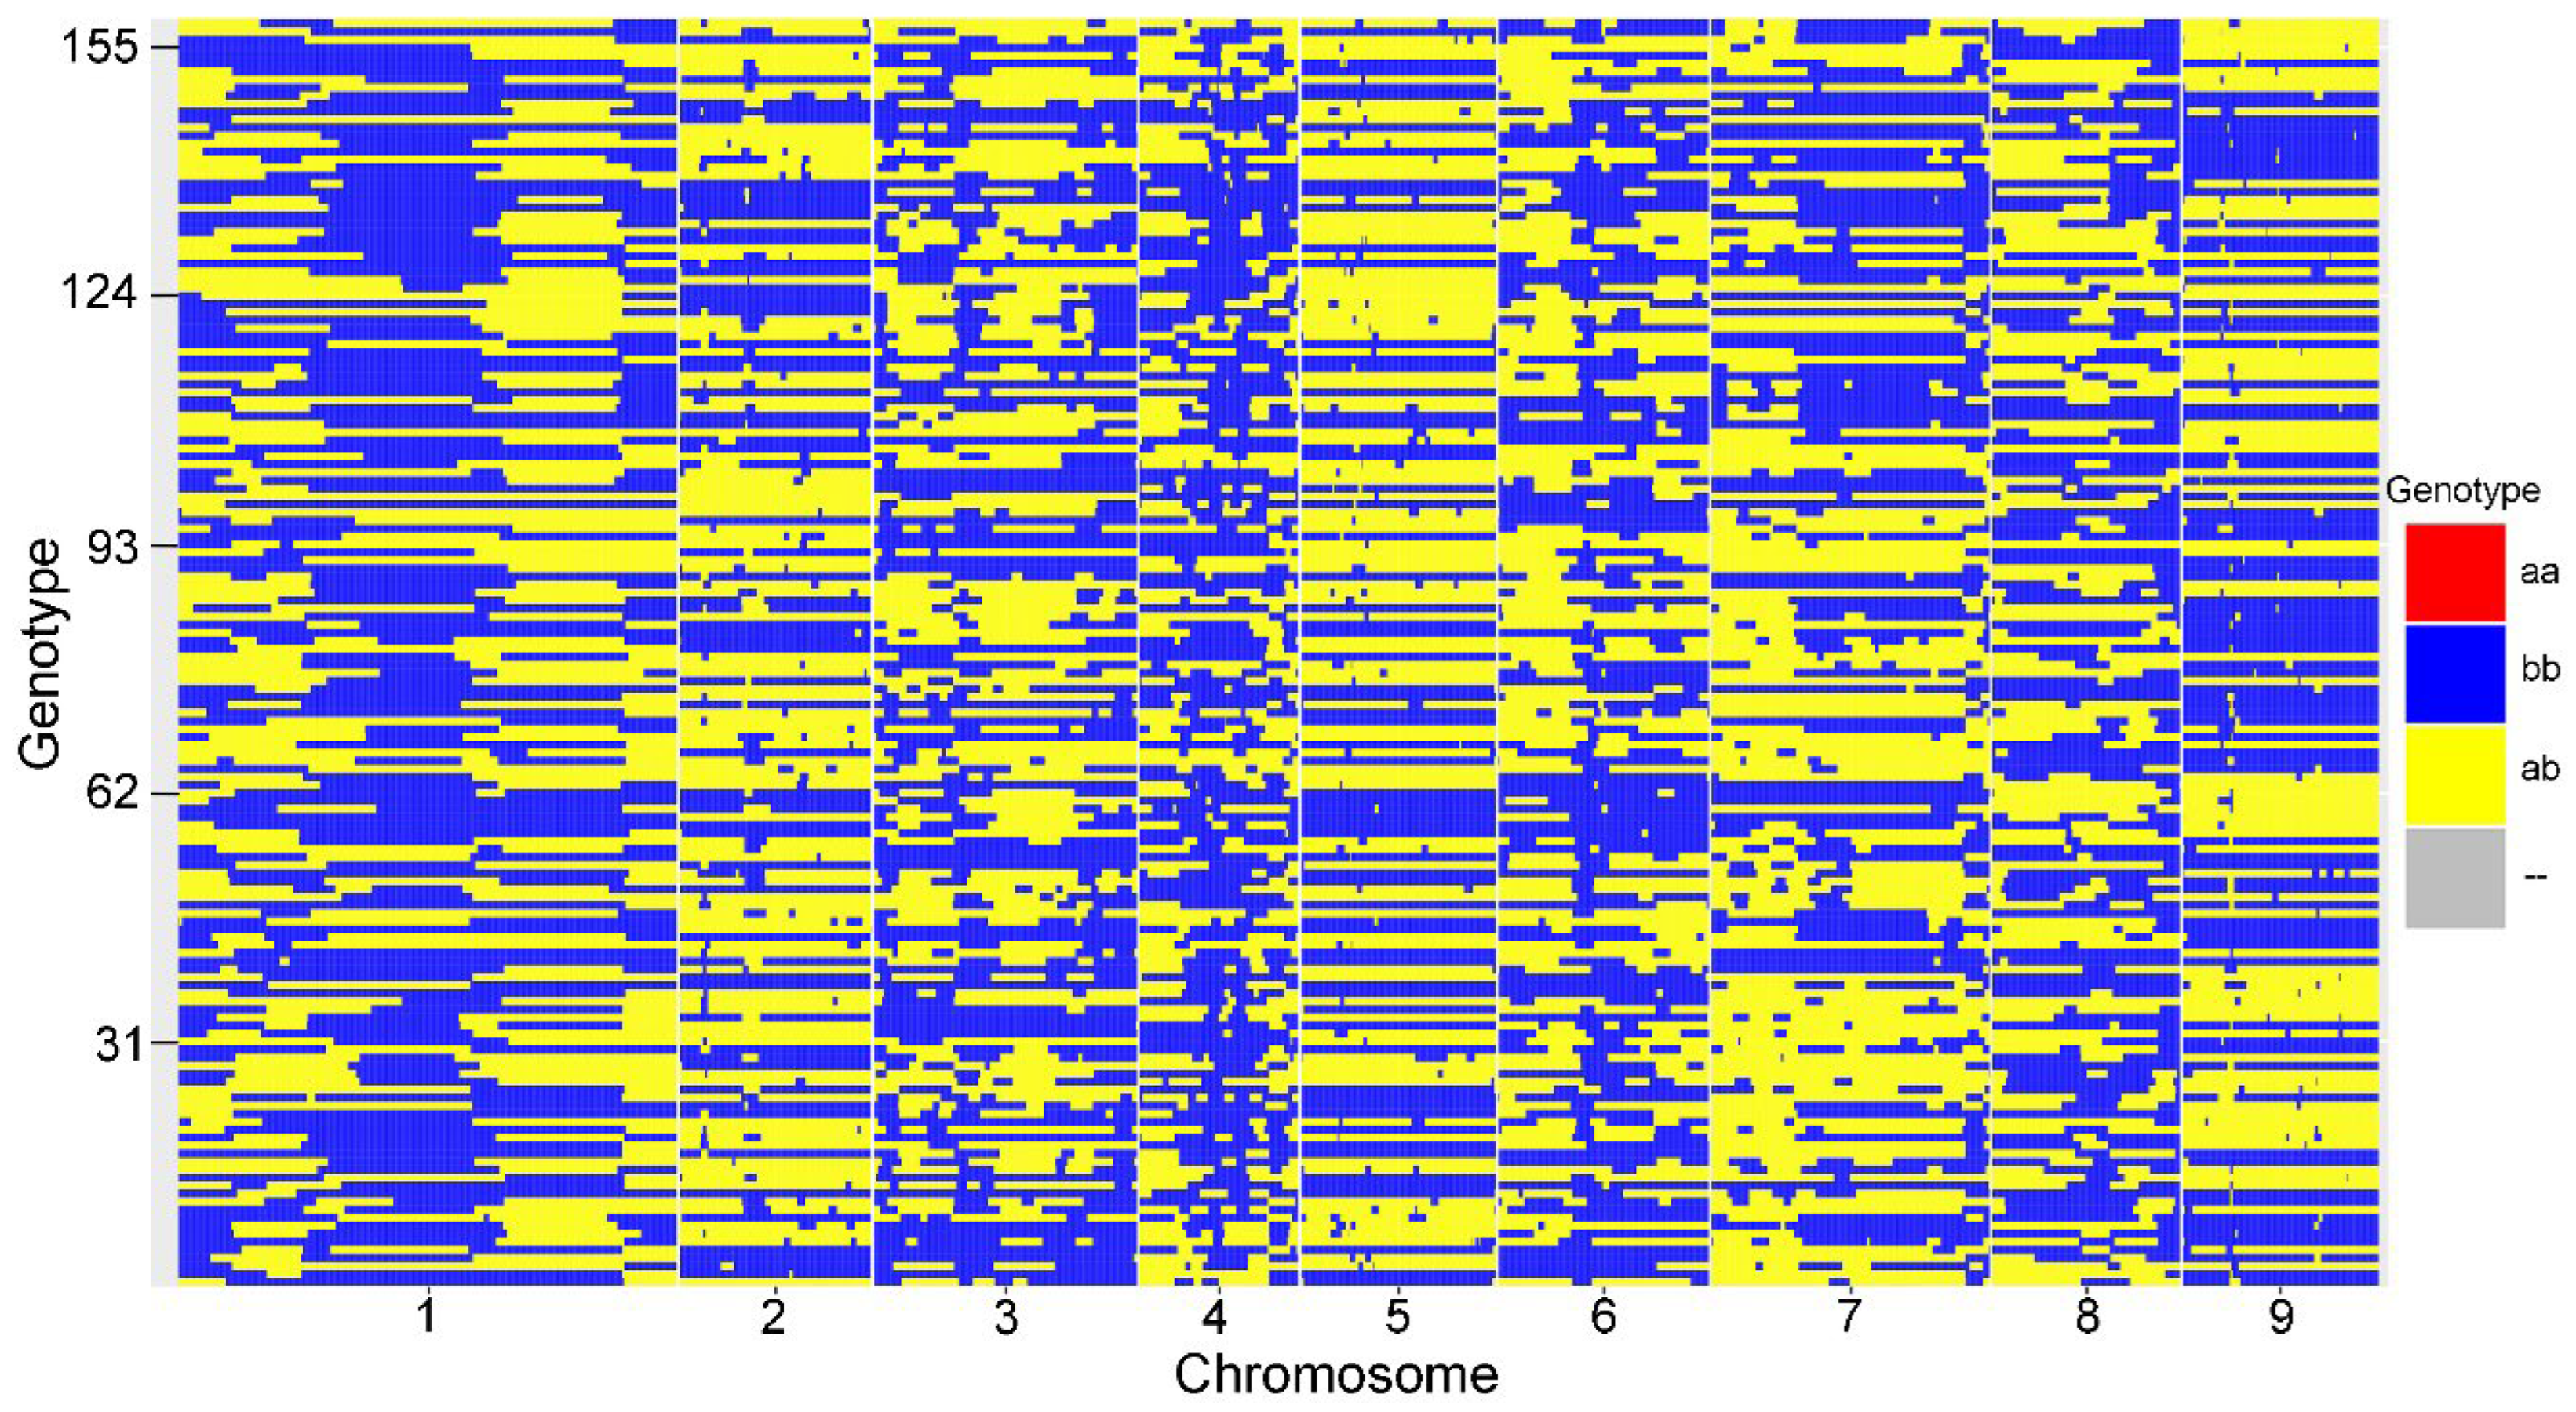
Figure 2.
Genetic lengths and marker distribution of 9 linkage groups in genetic map of passion fruit. x-axis represents the linkage groups, y-axis represents the genetic distance.
Figure 2.
Genetic lengths and marker distribution of 9 linkage groups in genetic map of passion fruit. x-axis represents the linkage groups, y-axis represents the genetic distance.
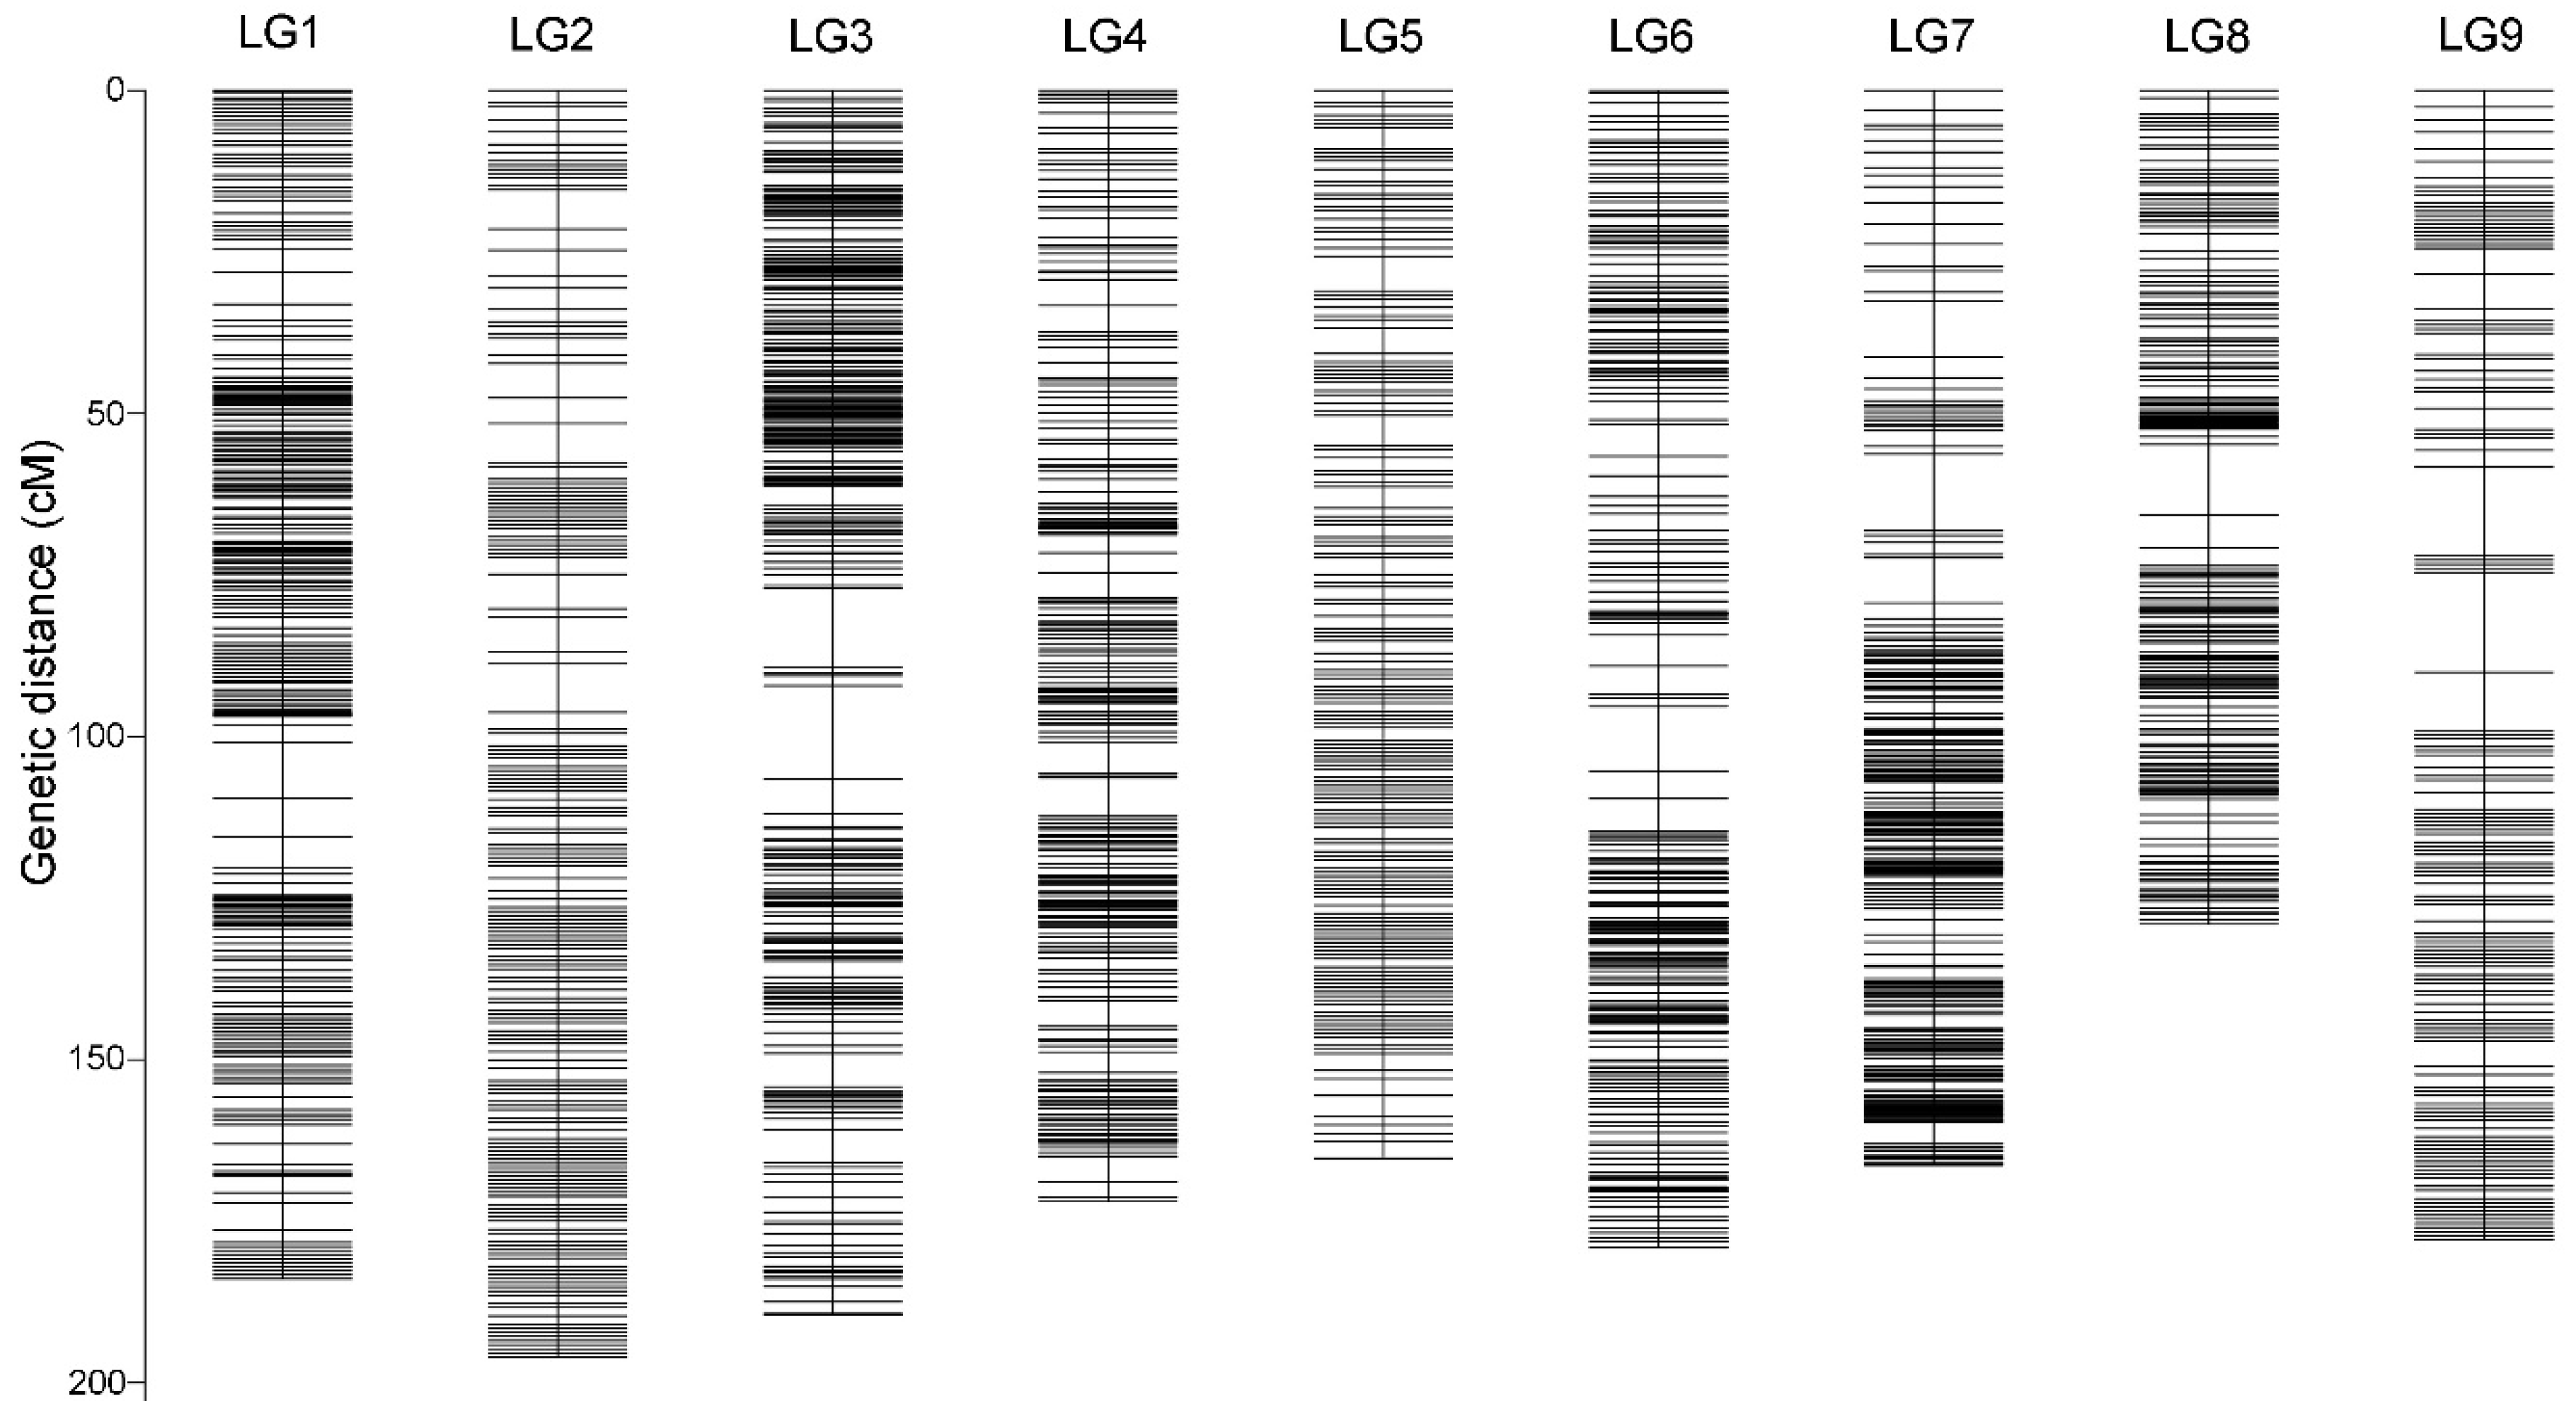
Figure 3.
Marker linkage relationship diagram of nine linkage groups in passion fruit. Each row and column are arranged in the order of the graph as markers, with each small square representing the recombination rate between two markers. The change in color from yellow to red to purple represents the variation in recombination rate from small to large. The closer the distance, the lower the recombination rate of the marker, and the closer the color is to yellow. The farther the distance, the higher the recombination rate of the marker, and the closer it is to purple.
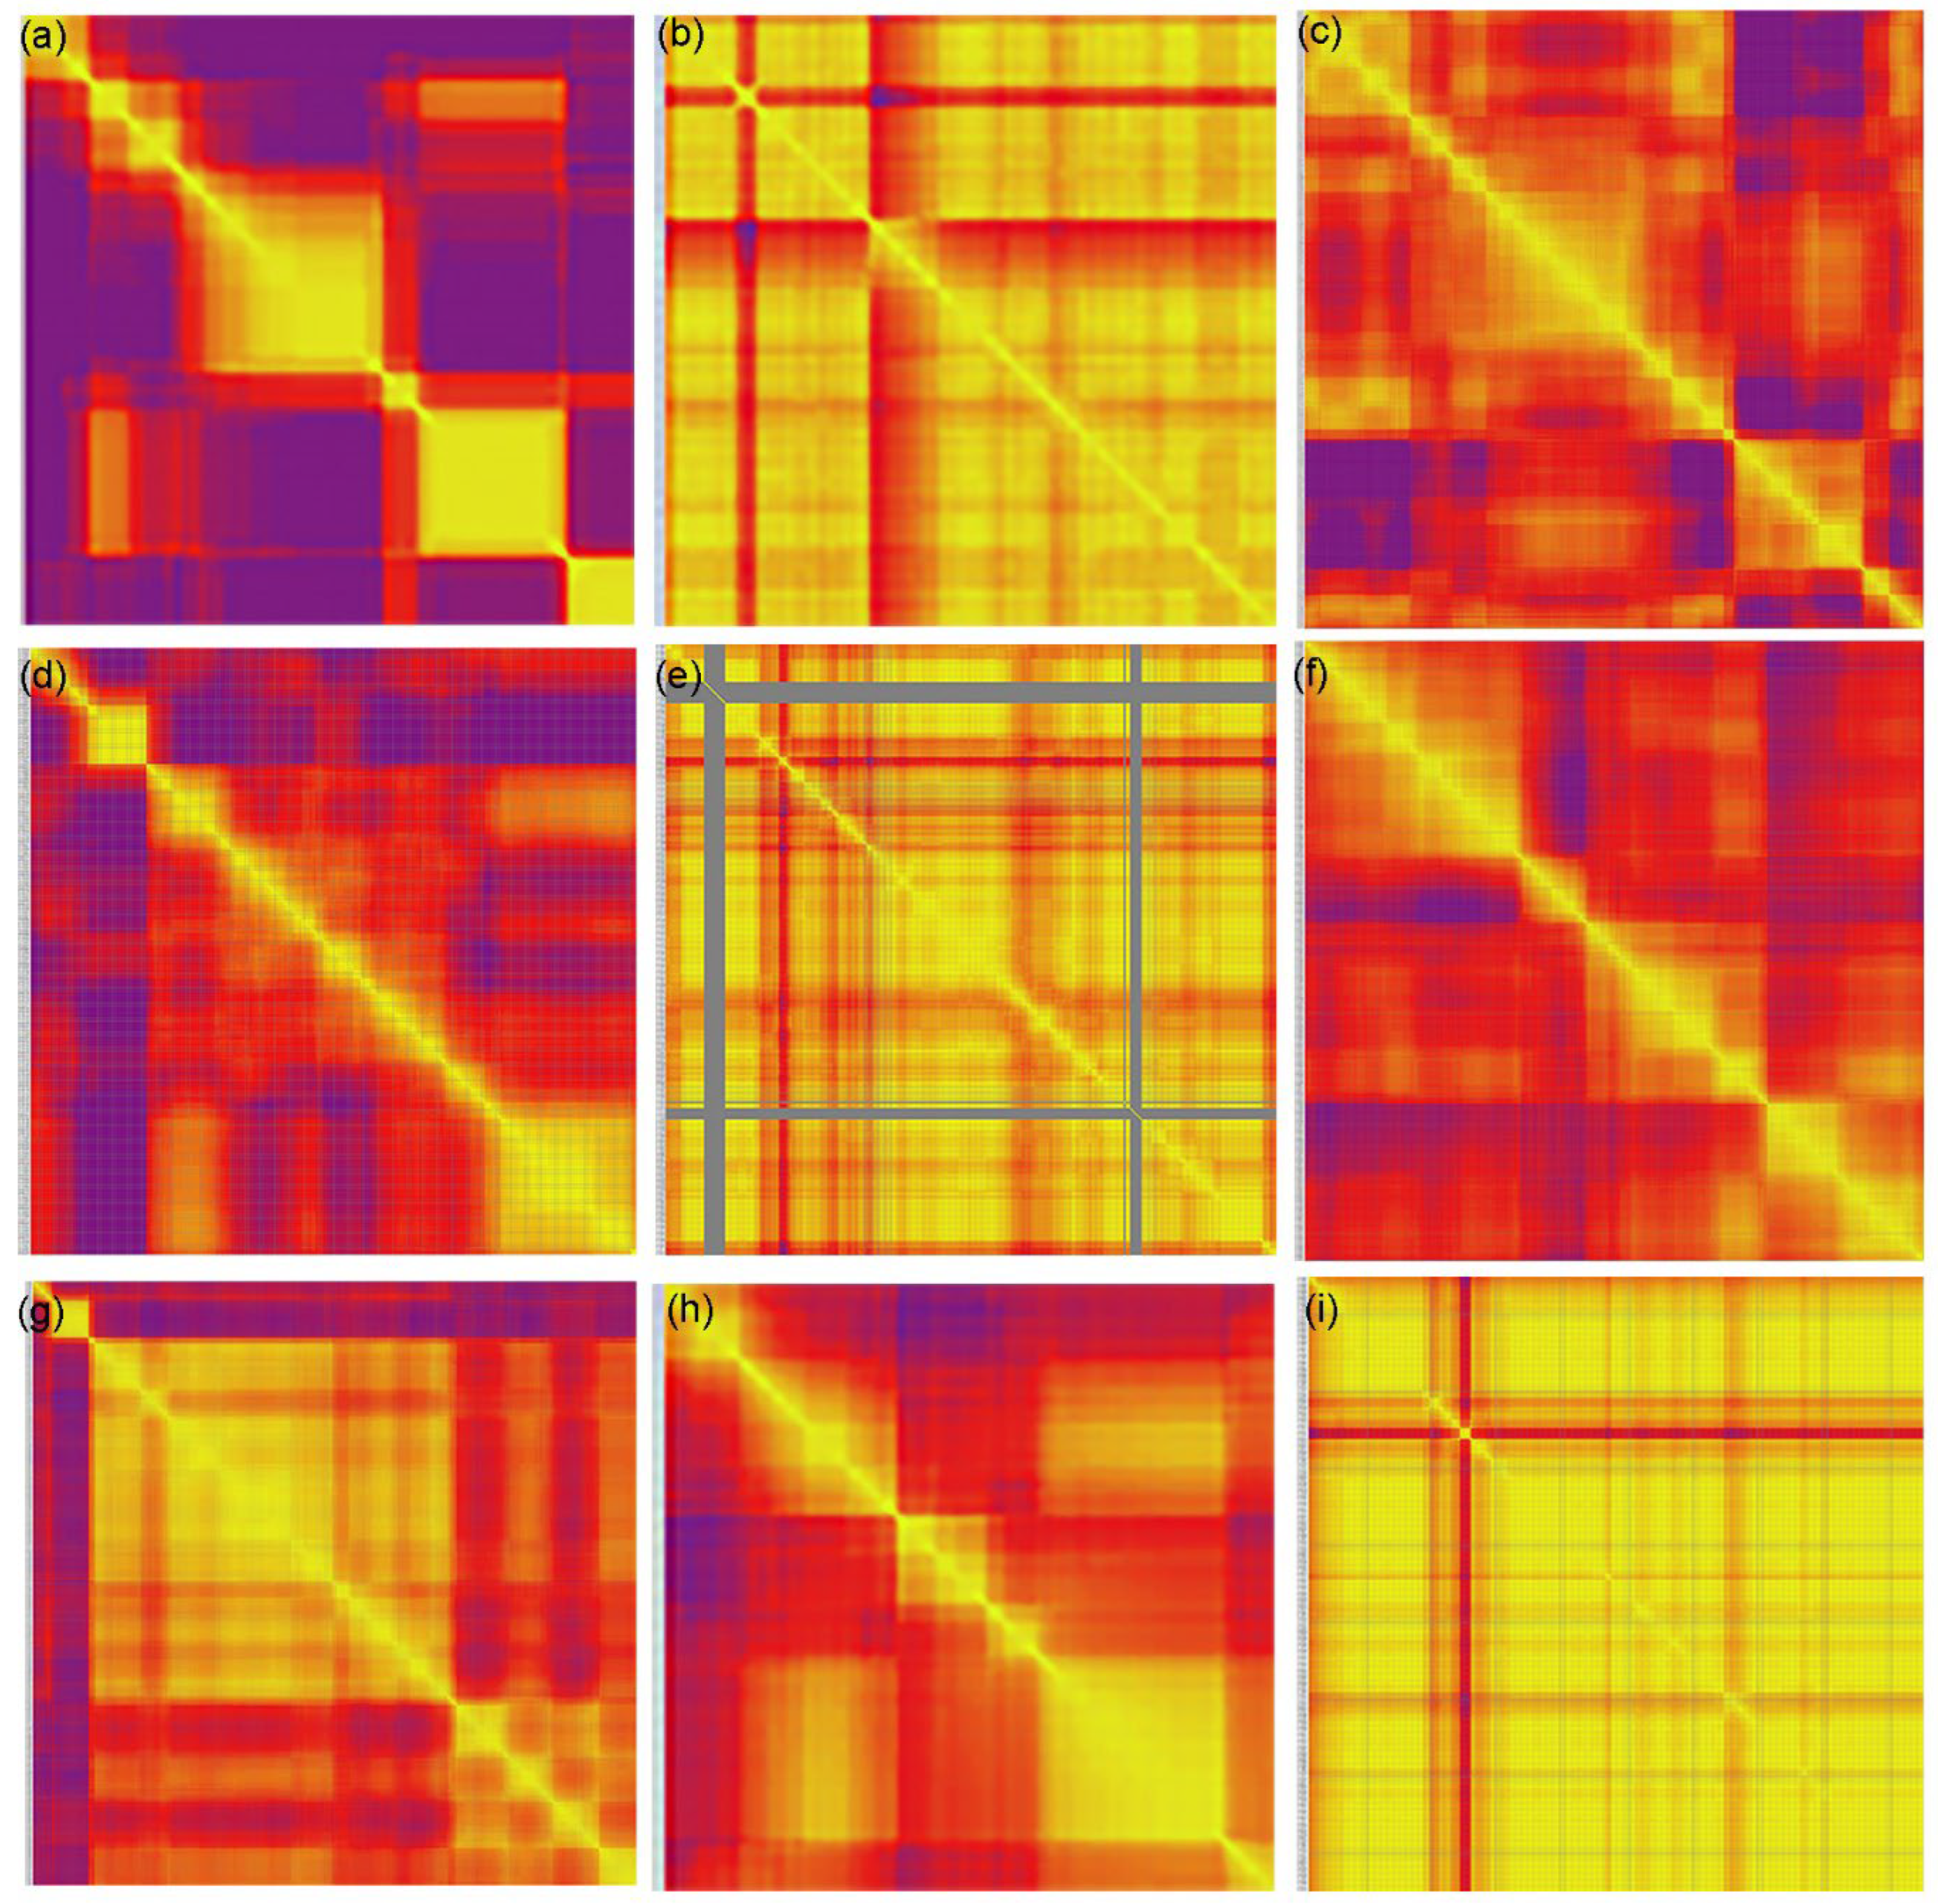
Figure 4.
Collinearity between genetic and reference genome in passion fruit. (a) The relationship between linkage groups and genomes. (b) Visualization of collinearity. x-axis represents genetic distance, y-axis represents physical distance.
Figure 4.
Collinearity between genetic and reference genome in passion fruit. (a) The relationship between linkage groups and genomes. (b) Visualization of collinearity. x-axis represents genetic distance, y-axis represents physical distance.
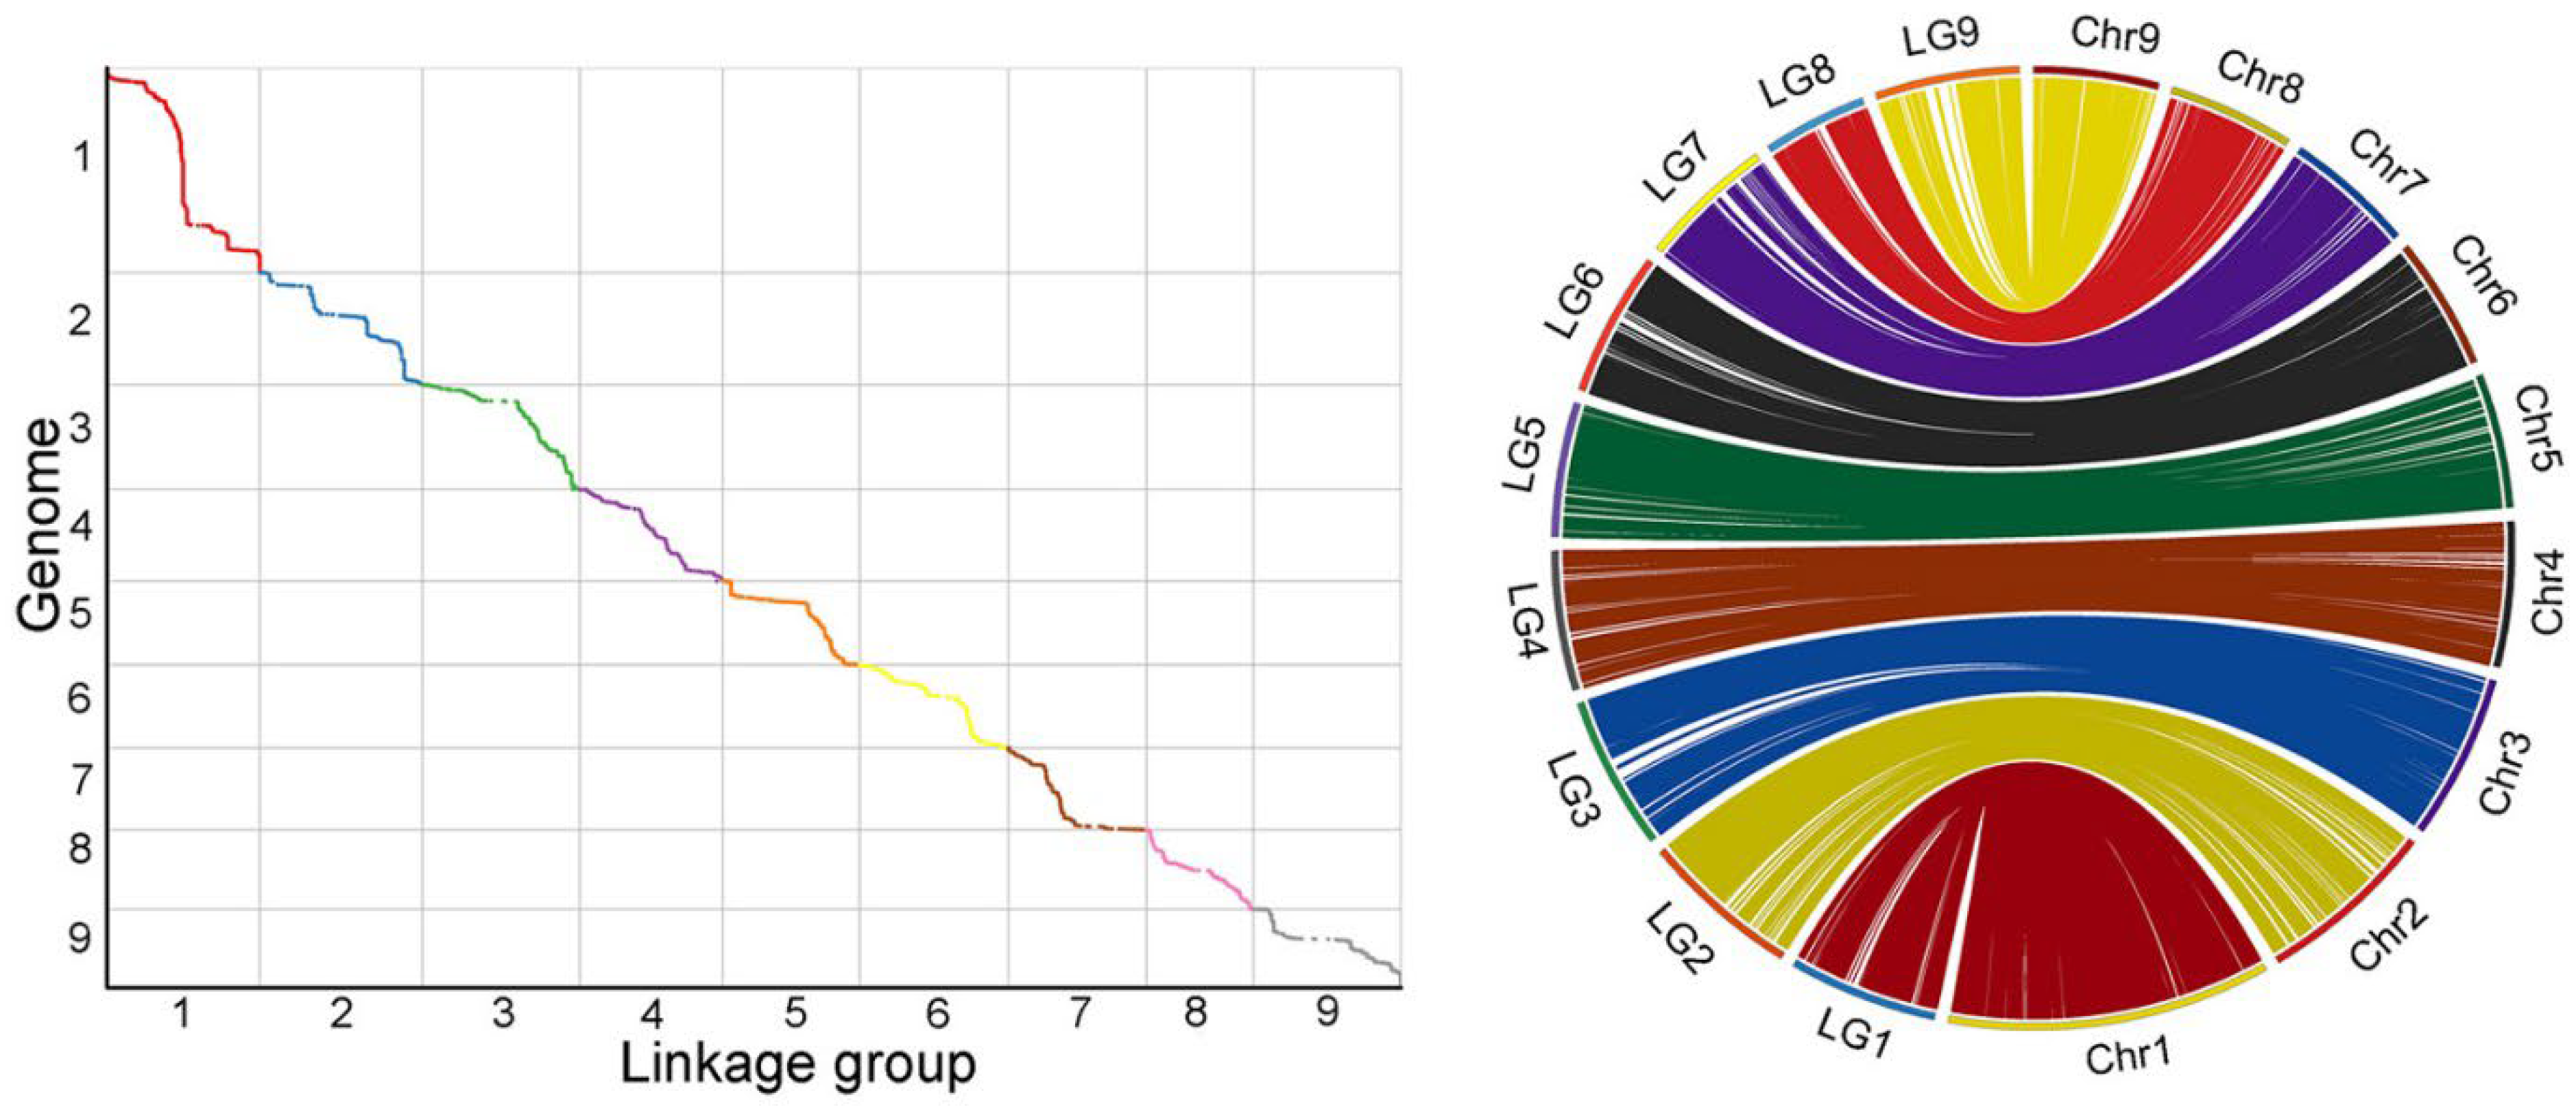
Figure 5.
Distribution of stem rot disease resistance in the passion fruit BC1F1 population. The x-axis shows the ranges of phenotypic traits and the y-axis represents the number of individuals in the BC1F1 population.
Figure 5.
Distribution of stem rot disease resistance in the passion fruit BC1F1 population. The x-axis shows the ranges of phenotypic traits and the y-axis represents the number of individuals in the BC1F1 population.
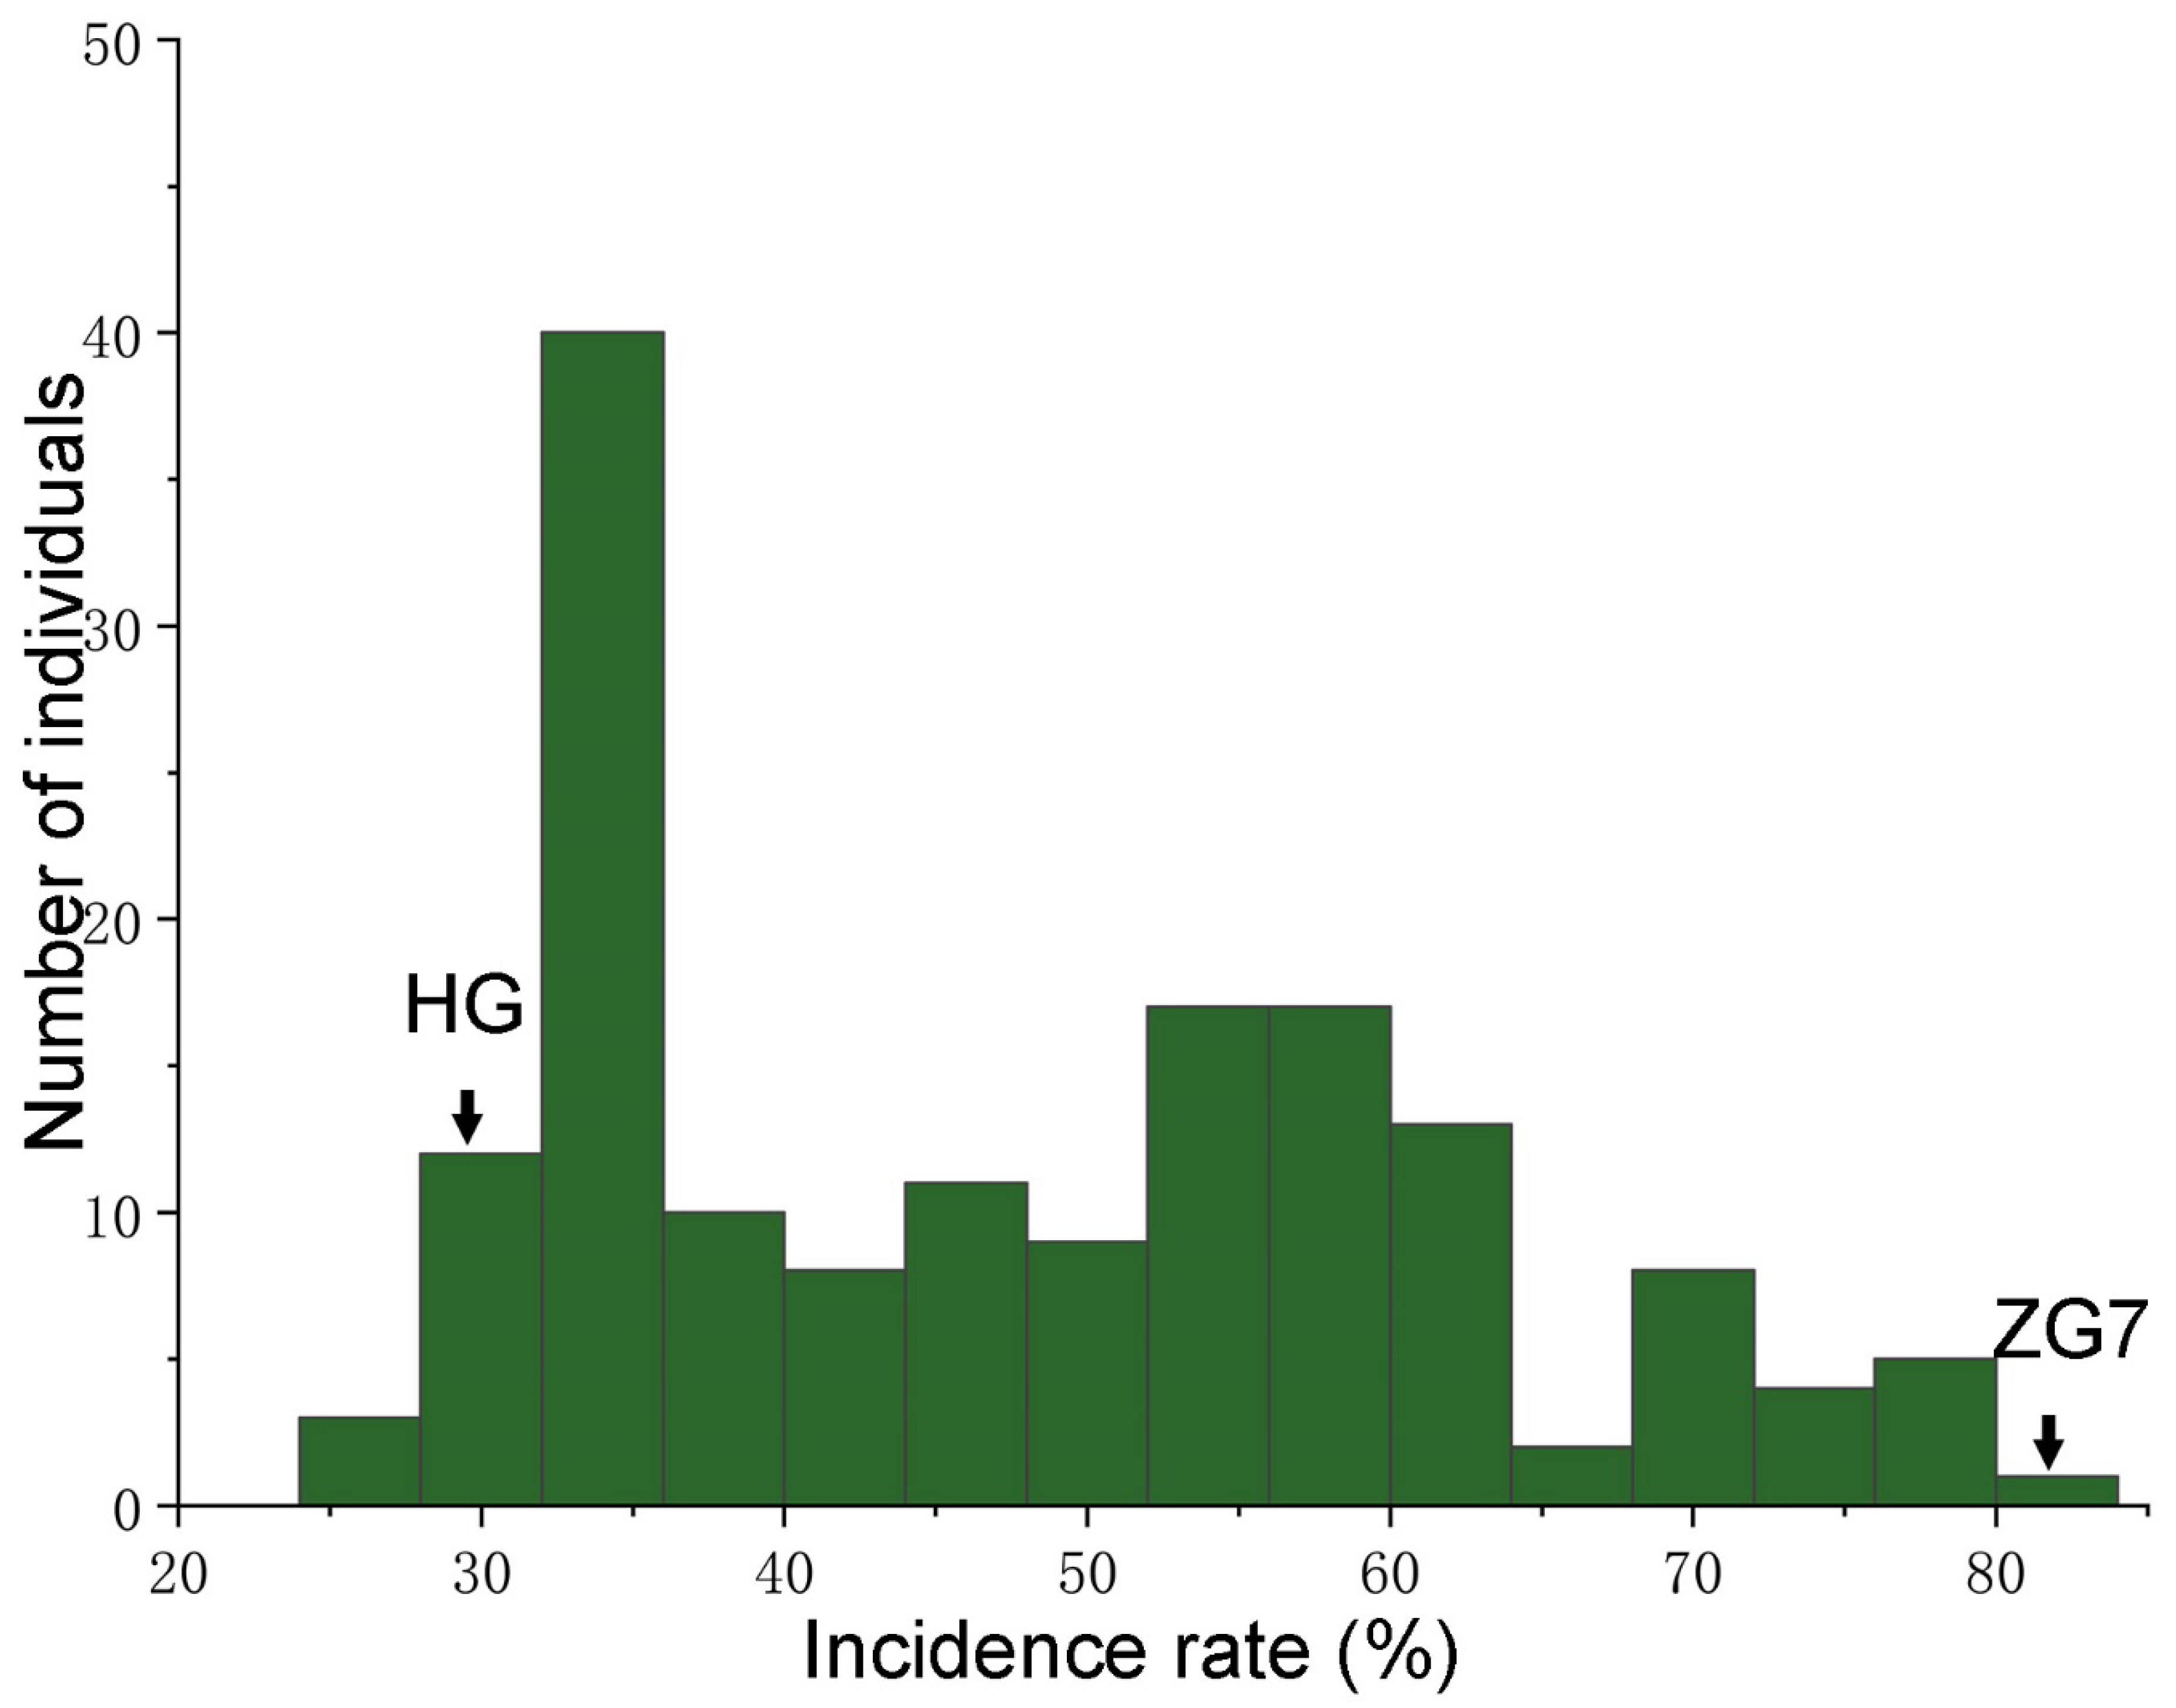
Figure 6.
QTL mapping for stem rot disease resistance on linkage group 5 in the passion fruit. The x-axis represents the linkage groups, LOD: the logarithm of odds score, PVE: the percentage of the phenotypic variance explained by individual QTL.
Figure 6.
QTL mapping for stem rot disease resistance on linkage group 5 in the passion fruit. The x-axis represents the linkage groups, LOD: the logarithm of odds score, PVE: the percentage of the phenotypic variance explained by individual QTL.
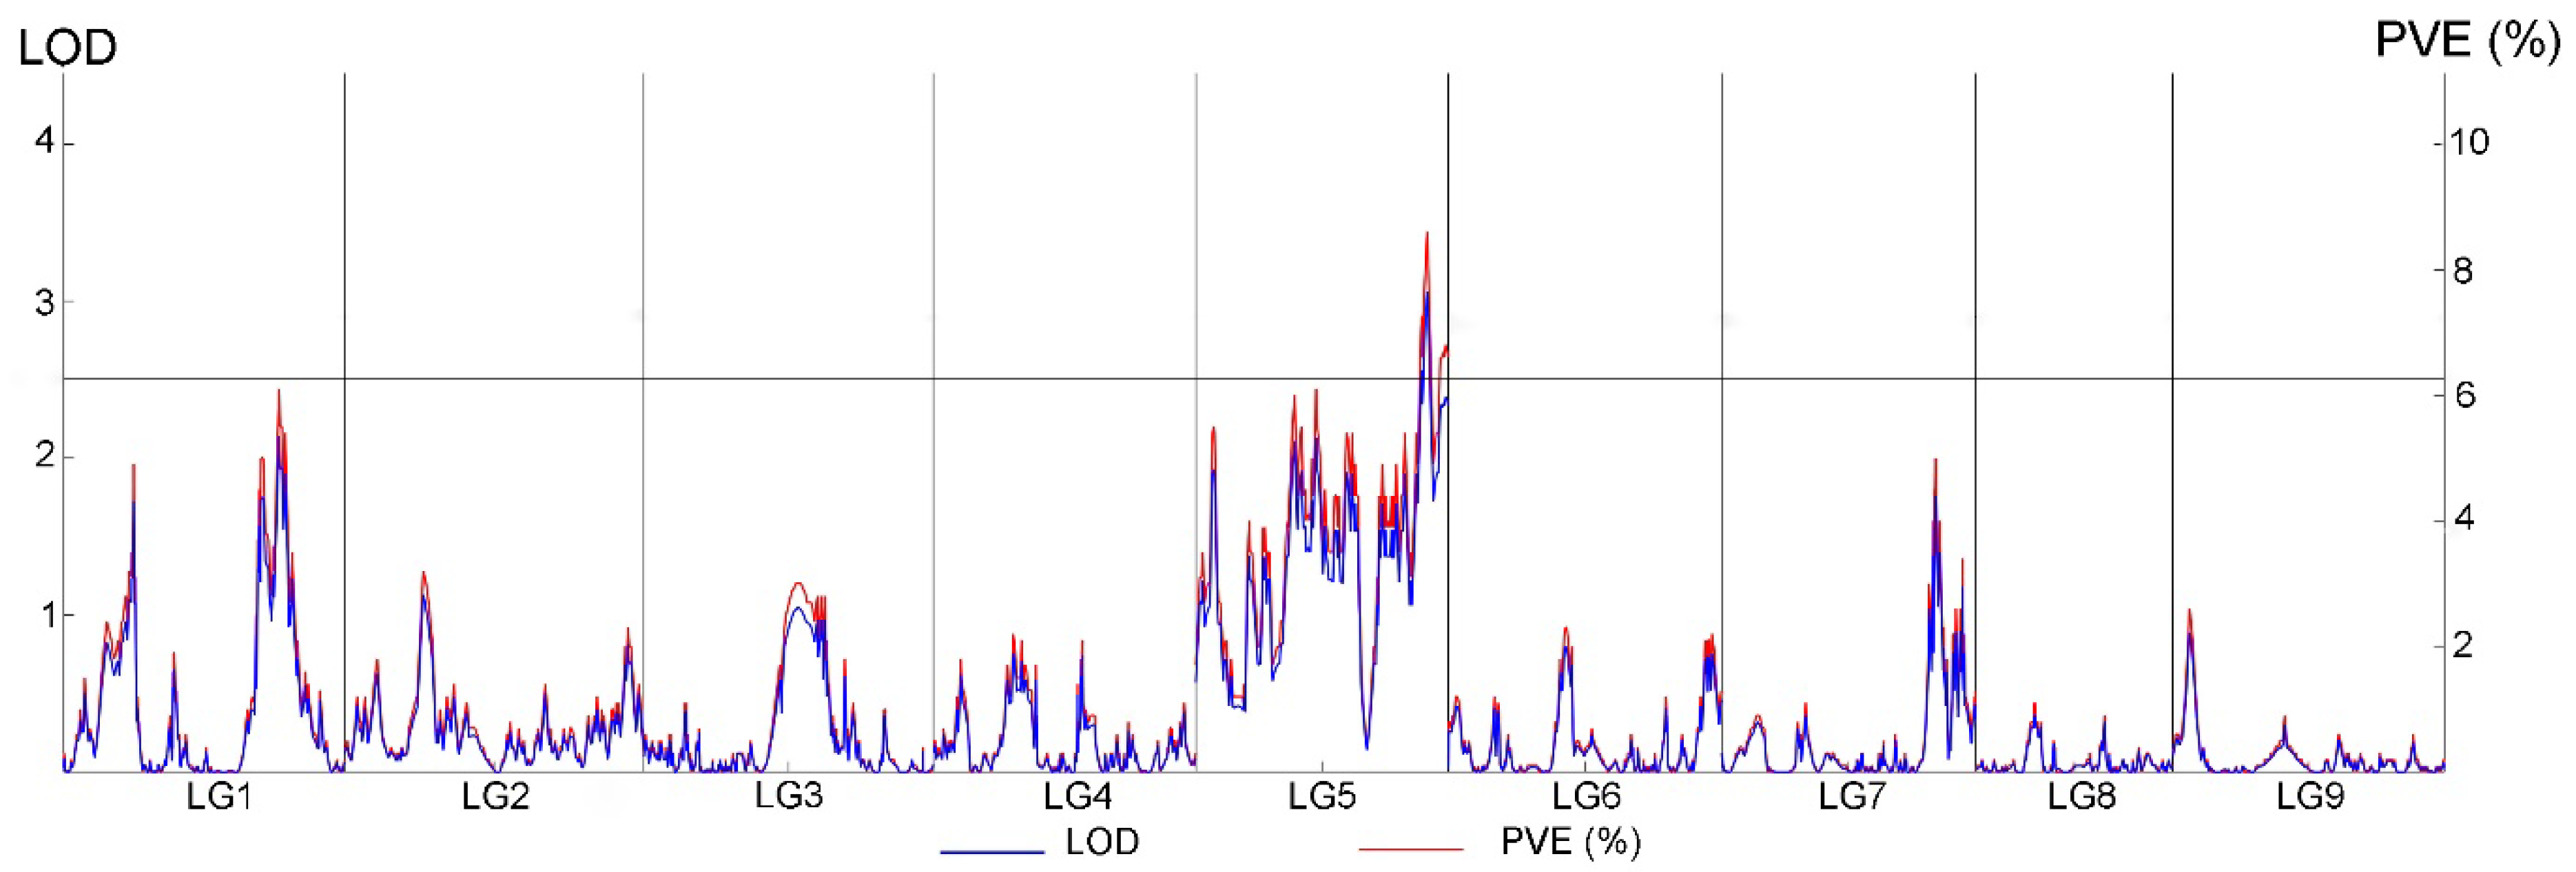
Figure 7.
Relative expression of candidate genes between HG and ZG7. Data are represented as mean ± SD. *P < 0.05, **P < 0.01, ***P < 0.0001, ns indicates no significance, siwith Student’s t-test.
Figure 7.
Relative expression of candidate genes between HG and ZG7. Data are represented as mean ± SD. *P < 0.05, **P < 0.01, ***P < 0.0001, ns indicates no significance, siwith Student’s t-test.
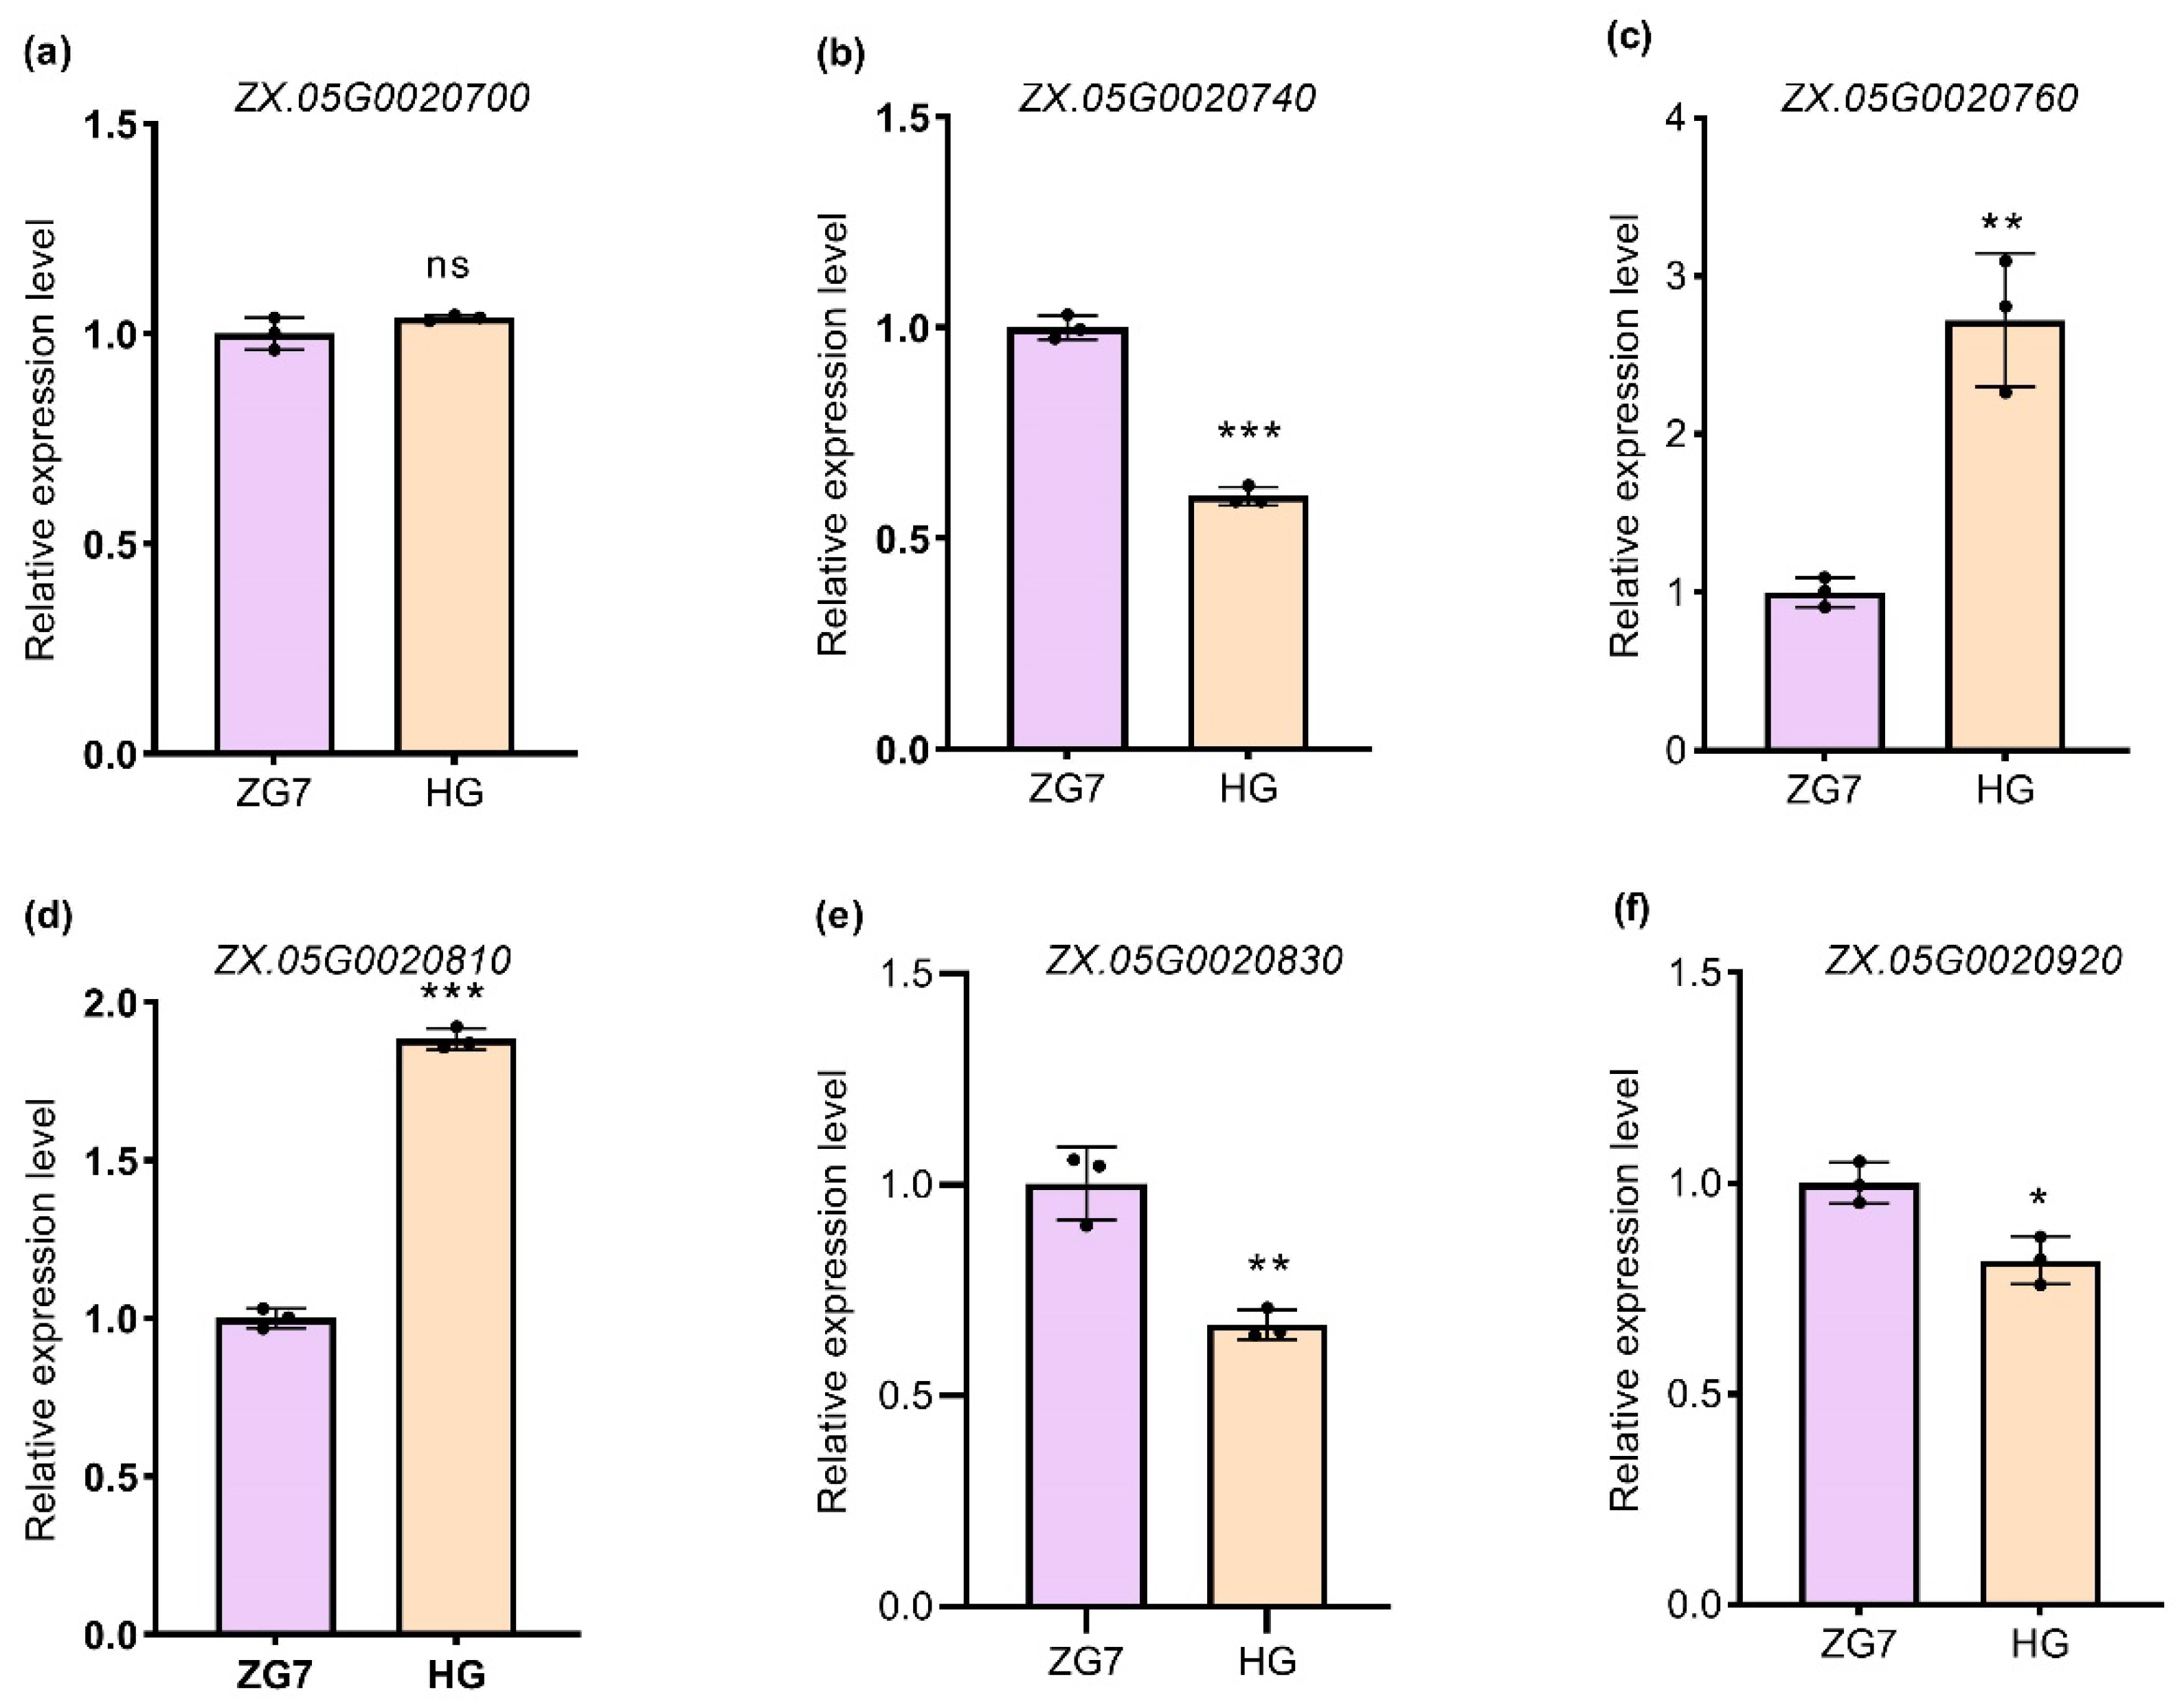

Table 1.
Statistics of sequencing data for ZG7, HG and 158 individuals.
| Sample ID | Total Clean Reads (bp) | Total Clean Bases (bp) | Q30 (%) | GC content (%) |
|---|---|---|---|---|
| ZG7 | 141877476 | 41987231840 | 94.26 | 42.32 |
| HG | 141115213 | 41852618618 | 94.39 | 42.19 |
| Offspring | 2939344344 | 868334262166 | 93.94 | 41.95 |
| Total | 3222337033 | 952174112624 | 93.95 | 41.96 |
Table 2.
Comparison of ZG7, HG, and 158 individuals to the passion fruit genome.
| Sample ID | Clean Reads | Mapped (%) | Properly_mapped (%) |
|---|---|---|---|
| ZG7 | 283754952 | 98.63 | 79.65 |
| HG | 282230426 | 98.75 | 84.35 |
| Offspring (average) | 36970400 | 98.18 | 83.02 |
Table 3.
Depth and coverage of sequencing data for ZG7, HG and 158 individuals.
| Sample ID | Depth | Coverage ratio 1× (%) | Coverage ratio 5× (%) | Coverage ratio 10× (%) |
|---|---|---|---|---|
| ZG7 | 24 | 99.07 | 97.35 | 90.22 |
| HG | 28 | 82.59 | 74.62 | 69.03 |
| Offspring (average) | 3.92 | 74.87 | 31.87 | 9.14 |
Table 4.
The decetation of SNPs between ZG7 and HG.
| Sample ID | SNP Number | Transition Numbers | Transverison Numbers | Ti/Tv Ratio | Heterozygosity Number | Homozygosity Number |
|---|---|---|---|---|---|---|
| ZG7 | 5849756 | 4096174 | 1753582 | 2.34 | 3566274 | 2283482 |
| HG | 5849756 | 4096174 | 1753582 | 2.34 | 946585 | 4903171 |
Table 5.
Statistical analysis of genetic map information of passion fruit.
| Linkage group | Total Bin Marker | Total Distance (cM) | Average Distance (cM) | Max Gap (cM) | Gaps<5 cM (%) |
|---|---|---|---|---|---|
| LG1 | 956 | 183.92 | 0.19 | 8.65 | 98.12% |
| LG2 | 371 | 196.03 | 0.53 | 7.5 | 98.38% |
| LG3 | 509 | 189.5 | 0.37 | 14.49 | 99.02% |
| LG4 | 308 | 171.98 | 0.56 | 5.95 | 99.67% |
| LG5 | 378 | 165.26 | 0.44 | 5.34 | 99.73% |
| LG6 | 407 | 179.08 | 0.44 | 10.01 | 99.51% |
| LG7 | 537 | 166.35 | 0.31 | 11.9 | 99.44% |
| LG8 | 364 | 129.04 | 0.36 | 10.91 | 99.45% |
| LG9 | 376 | 177.87 | 0.47 | 15.45 | 98.93% |
| Total | 4206 | 1559.03 | 0.37 | 15.45 | 98.12% |
Table 6.
Candidate genes and annotation information for the stem rot disease resistance in passion fruit.
Table 6.
Candidate genes and annotation information for the stem rot disease resistance in passion fruit.
| Gene | Annotation |
|---|---|
| ZX.05G0020700 | NAC domain-containing protein 14 |
| ZX.05G0020740 | NAC domain-containing protein 91 |
| ZX.05G0020760 | DNA/RNA polymerases superfamily protein |
| ZX.05G0020810 | Protein ENHANCED DISEASE RESISTANCE 4 |
| ZX.05G0020830 | B3 domain-containing transcription factor |
| ZX.05G0020920 | WAT1-related protein |
Disclaimer/Publisher’s Note: The statements, opinions and data contained in all publications are solely those of the individual author(s) and contributor(s) and not of MDPI and/or the editor(s). MDPI and/or the editor(s) disclaim responsibility for any injury to people or property resulting from any ideas, methods, instructions or products referred to in the content. |
© 2024 by the authors. Licensee MDPI, Basel, Switzerland. This article is an open access article distributed under the terms and conditions of the Creative Commons Attribution (CC BY) license (http://creativecommons.org/licenses/by/4.0/).
Copyright: This open access article is published under a Creative Commons CC BY 4.0 license, which permit the free download, distribution, and reuse, provided that the author and preprint are cited in any reuse.


