
Submitted:
23 July 2025
Posted:
24 July 2025
You are already at the latest version
Abstract
Currently D-fructose (DF) is produced by enzymatic isomerization of beta-D-glucose (DG) under disadvantageous conditions (equilibrium conversion of 50%, costly fructose separation, glucose isomerase poor stability vs. impurities from preliminary starch saccharification). By contrast, the two-steps Cetus enzymatic process became a promising alternative to produce high purity DF. First, DG is oxidized to keto-glucose (kDG) using commercial pyranose 2-oxidase (P2Ox). To avoid the fast P2Ox inactivation by the in-situ produced hydrogen peroxide (H2O2), catalase is added to decompose this byproduct. The reaction is conducted at optimal pH = 6.5 and 25–35oC, with very high conversion and selectivity, leading to a product free of allergenic aldose compounds. Then, kDG is reduced to DF by using the NADPH cofactor, and aldose reductase (recombinant human - ALR), at 25oC and pH = 7. By using information from literature, this paper aims to check the continuously in-situ regeneration of NADPH cofactor by the expense of formate decomposition in the presence of formate dehydrogenase (FDH). By adopting a kinetic model from literature, this in-silico analysis determines the optimal operating conditions of a batch reactor (BR) used in the Cetus second step to maximize the DF production, by minimizing the costly [NADPH, ALR, FDH] consumption.
Keywords:
cetus process
; keto-d-glucose reduction to d-fructose
; aldose reductase
; kinetic model
; NADPH cofactor regeneration
; batch reactor
1. Introduction
“Recent advances in obtaining genetically modified enzymes allowed to develop a lot of biosynthesis of industrial interest, which tend to replace the classical fine chemical synthesis processes, due to the advantages of the enzymatic processes: a) produce fewer by-products; b) consume less energy; c) generate less environmental pollution; d) use smaller catalyst concentrations and much moderate reaction conditions” [1,2].
However, to optimally solve the associated engineering problems (process design, operation, control, and optimization) it is essential to know an adequate mathematical (kinetic) model of the process. This model should preferably be based on the process mechanism, to ensure interpretable predictions of the process behavior under variable running conditions, to be compared to the literature data [3,4,5].
Despite their larger volumes, batch enzymatic reactors (BR), with mechanical mixing, are the most used because they ensure a high diffusion rate of compounds in the liquid phase, and an easy control of temperature/pH [6,7,8].
Although the process efficiency was extensively experimentally studied by using various enzymes, the engineering part regarding the bioreactor design, optimal operation / control was seldom approached [9,10,11,12].
“Concerning the reactor, an essential engineering problem refers to the development of optimal operating policies seeking for production maximization, raw-material consumption minimization, with obtaining a product of high quality (less by-products). This problem depends on at least two aspects: 1) adopted technology (chemical, biochemical, or biological catalysis), but 2) the used engineering analysis to optimize the reactor operation (this paper). “ [13,14]
“In the BR case, its optimal operation problem can be in-silico effectively solved by using an off-line (‘run-to-run’) approach, the optimal operating policy being determined by using an adequate deterministic kinetic model previously identified based on experimental data (this paper, and [8,9,10,15,16,17,18,19,20,21,22]).
However, this approach is not an easy task, due to multiple contrary objectives, and a significant degree of uncertainty of the model/constraints [23,24]. The reactor optimal operating policy is usually determined by using an effective optimization rule [21,25,26]. In the deterministic alternative (this paper), single-/multi-objective criteria, including the product selectivity / yield maximization, (raw-)materials consumption minimization, are usually used to obtain feasible optimal operating strategies for the analyzed reactor [24], by using specific numerical algorithms.” [27,28]
The a-priori in-silico analysis also allows comparing performances of various bioreactor constructive / operating alternatives, as follows [13,14]:
“The BRs are commonly used for slow processes, because they are highly flexible and easy to operate in various alternatives, as followings [14,24]: (i).- Usually, a single- or a multi-objective optimization is off-line performed to determine the best batch time, and substrate/biocatalyst initial load [23,26,29,30,31,32,33]; (ii).- a batch-to-batch (BR-to-BR) optimization, by including a model updating step based on acquired information from the past batches to determine the optimal load of the next BR [9,16,17,18,25,28,34]; (iii).- a sequence of BRs of equal volumes linked in a series (SeqBR) [11]. For every BR, its content is transferred to the next one, with adjusting the reactants and biocatalyst concentrations of the latter, at levels off-line determined to ensure its optimal operation [18,28]. (iv).- The fed-batch reactor (FBR), with an optimally varied feeding policy of biocatalyst/substrate(s) is not discussed here [14,24,34,35]. Despite the FBRs better performances, they are difficult to operate, because they need previously prepared stocks of biocatalyst, and substrate(s), of different concentrations (a-priori in-silico determined), to be fed for every ‘time-arc’ of the batch (that is a batch-time equal division in which the feeding composition is constant) [36]. The time-step-wise variable optimal feeding policy of the FBR are determined off-line [14], or on-line” by using a simplified, often empirical mathematical model to obtain a state-parameter estimator based on the on-line recorded data (such as the classical Kalman filter) [19,22,23,25,27,29,37,38,39].
D-fructose “is a sweetener of high value in the food industry and medicine. As other polyols largely used as sweeteners (e.g., sorbitol, mannitol, xylitol, erythritol), it is produced on a large scale by using chemical or biochemical catalysis. [40,41]
The chemical catalysis to produce DF (that is hydrogenation of glucose on Ni, Fe, or Fe-Ni alloy catalysts) presents the critical disadvantage of significant energy consumption, occurring at high pressures (30 bar) and temperatures (140oC). One alternative is the beta-D-glucose isomerization to D-fructose on Fe/CarbonBlack catalyst.” [41]
By far, as displayed in Table 1, the biocatalytic routes to produce D-fructose are more convenient due to a large number of advantages: they consume less energy, by occurring at ambiental conditions; they produce less waste due to the high yields and selectivity, and the product is free of allergenic compounds.
Glucose isomerization. “Starting from the high-fructose syrup (HFCS) obtained from starch [42], after rough/fine filtration, ion exchange, and evaporation, a DG isomerization step leads to a high fructose syrup (HFS, of 42-55% D-fructose)” [42,43,44,45]. However, this industrial process suffers of a large number of disadvantages, mentioned in the Footnote [d] of Table 1.
Inulin hydrolysis. This promising alternative produce DF of high purity. However, the used inulinase is still expensive, while the whole process development is limited by the production capacity of GMO chicory crops, and of the cultures of Aspergillus sp. (Table 1)

Table 1.
Comparison between three enzymatic methods to produce D-fructose at a large scale.
| Characteristics | Glucose isomerization [a,d] | Cetus two steps process [b] | Inulin hydrolysis [c] |
|---|---|---|---|
| Number of steps | 1 | 2 | 1 |
| Conversion (%) | 50 (limited by the equilibrium) [d] |
99 | 99.5 |
| Raw-materials availability | Glucose from the starch of crops, mollases, cellulose, and food processing byproducts [58,59] | genetically modified chicory crop; cultures of Aspergillus sp. | |
| Impurities in the product | yes | traces | negligibles |
| Reaction type | Enzymatic isomerization | Enzymatic oxidation (step 1), followed by enzymatic reduction (step 2) | Enzymatic hydrolysis |
| Enzyme mobility | Immobilized [d] | Free (suspended) | immobilized |
| Enzyme stability, and other additives | Intra-cellular glucose-isomerase (e.g., Streptomyces murinus) of low stability; metal (Al) salts |
Pyranose 2-oxidase (P2Ox) and catalase (step 1); aldose reductase and NAD(P)H (step 2); enzymes are costly |
Inulinase |
| Temperature | 50-60oC | 25-30oC / 25-30oC |
55oC (40-60oC) |
| Reaction time (h) | 7 | 3-20 (step 1); 25 (step 2) |
13 |
| pH | 7-8.5 | 6.5-7(-8.5); 7-8.5 |
5.5 |
| Reaction steps | 1 isomerization |
2 oxidation (step 1), reduction (step 2) |
1 hydrolysis |
| Coenzyme necessary? | No | yes catalase for (step 1) to prevent P2Ox quick inactivation; NAD(P)H for step 2. NAD(P)H is continuously in-situ regenerated |
No |
| Product purification | Difficult [d] | simple (due to high selectivity) | simple (due to high selectivity) |
| Product purity | 2-5% impurities [d] | High (99.9%) |
High (99.9%) |
Footnotes. “[a] Process described by [42,60,61]. The raw-material HFCS is obtained from yeast hydrolysis (resulting a mixture of 42% fructose, 50% glucose, and 8% other sugars)[42]. [b] Process described by [13,47–49,62]. Cofactor NAD(P)H regeneration was given by [12,46,52,55–57,63,64]. [c] Process described by [65–68]. [d] This process suffers from a large number of disadvantages, as followings: i) The reaction is thermodynamically limited to around 50% glucose conversion, making the subsequent fructose separation in large chromatographic columns to be very costly. ii) Glucose isomerase is an intracellular enzyme with relatively poor stability, making its purification and immobilisation very difficult. iii) The amylase used to carry out the starch saccharification (to obtain the HFCS raw-material) requires calcium ions for full activity, but calcium inhibits glucose isomerisation, requiring its removal by ion-exchange treatment prior to glucose isomerisation. iv) The fructose product is still contaminated by several other saccharides (such as aldose which is an allergenic compound).” [7,61,65–72].
The two-step Cetus process “for production of high purity DF with high yields, are the followings [48,49]: Step 1).- DG is converted to kDG in the presence of commercial pyranose 2-oxidase (P2Ox, from Coriolus sp. expressed in E. coli)) at 25-30oC and pH=6-7, with a high conversion and selectivity [13,51]. Catalase is added to decompose the resulted H2O2, thus avoiding the quick P2Ox inactivation. Step 2).- The obtained kDG is then reduced to DF by using a commercial (recombinant human or or animal, expressed in E. coli) aldose reductase (ALR) (EC 1.1.1.21), and NAD(P)H as co-factor (proton donor), at 25oC and pH=7 (Figure 2) [47]. The resulted NAD(P)+ is regenerated (in-situ or externally) and re-used [46,51,52] (Figure 2). The co-factor (NADPH, or NADH) regeneration can be done in several ways [46,51,53–56]. For instance, Gijiu et al. [12] realized this step, by using the in-situ alternative, at the expense of the enzymatic degradation of ammonium formate.” The same route will also be followed here.
This paper aims at analyze and optimize the STEP-2 of the Cetus process with continuous in-situ regeneration of the cofactor NADPH (Figure 1). Thus, by adopting an adequate kinetic model from the literature the in-silico analysis will evaluate the performances of this alternative, by comparing it with the baseline process experimentally studied in a BR, without NADPH regeneration. The obtained results will finally allow optimizing the BR initial load, by using a nonlinear programming (NLP) procedure, seeking for the DF production maximization in the presence of various technological constraints, by limiting the raw-materials consumption.
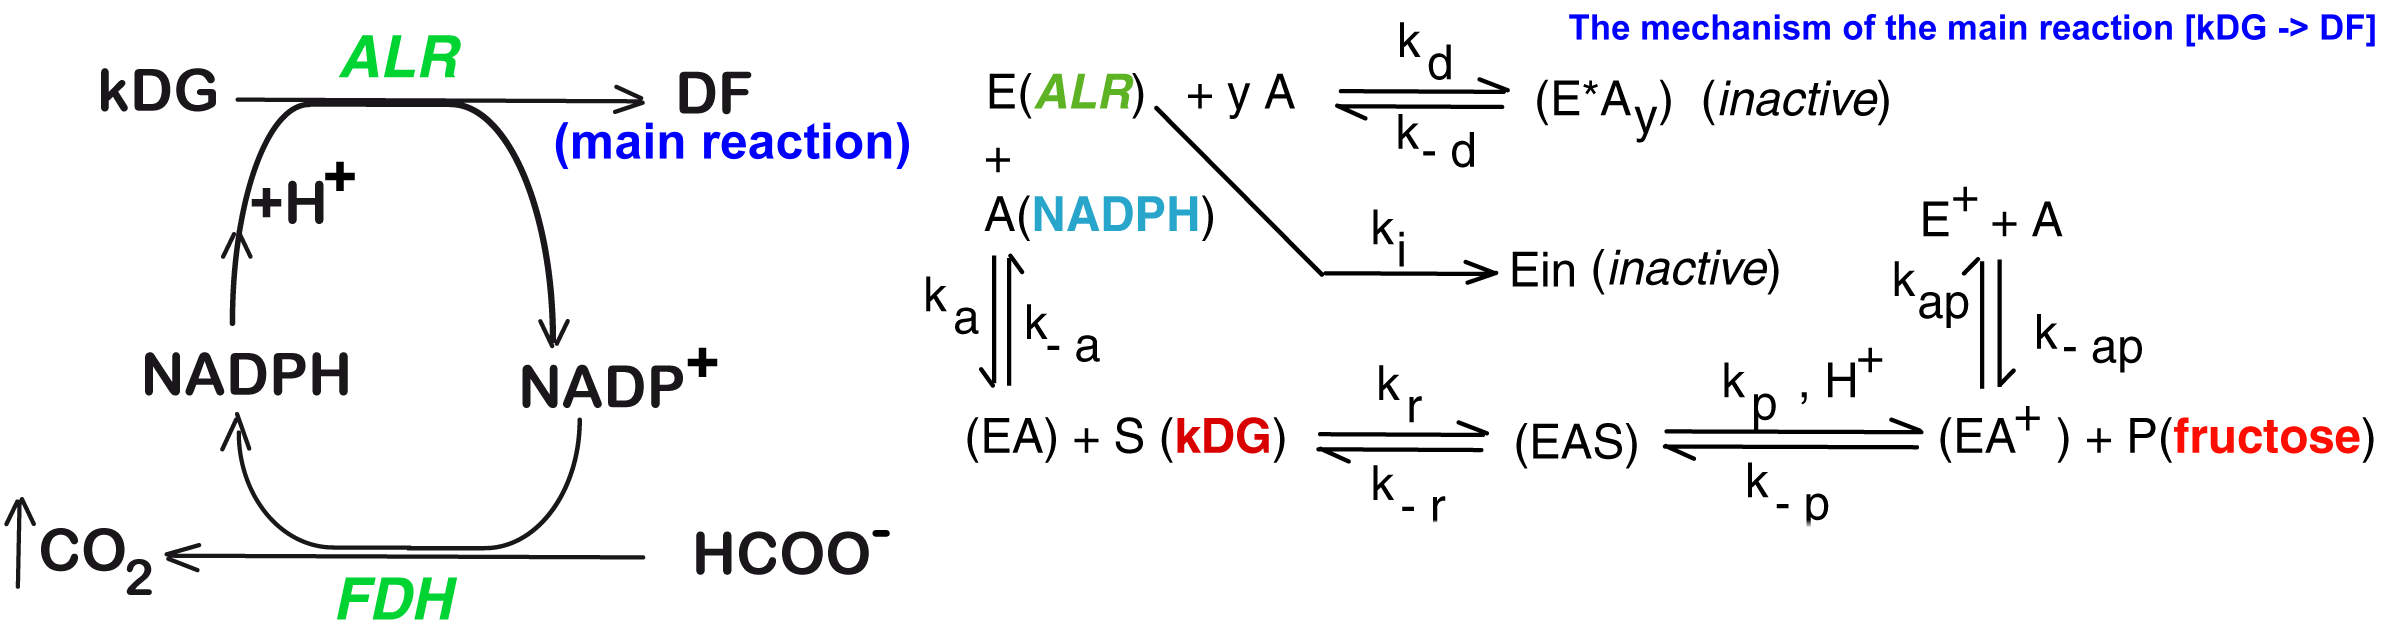
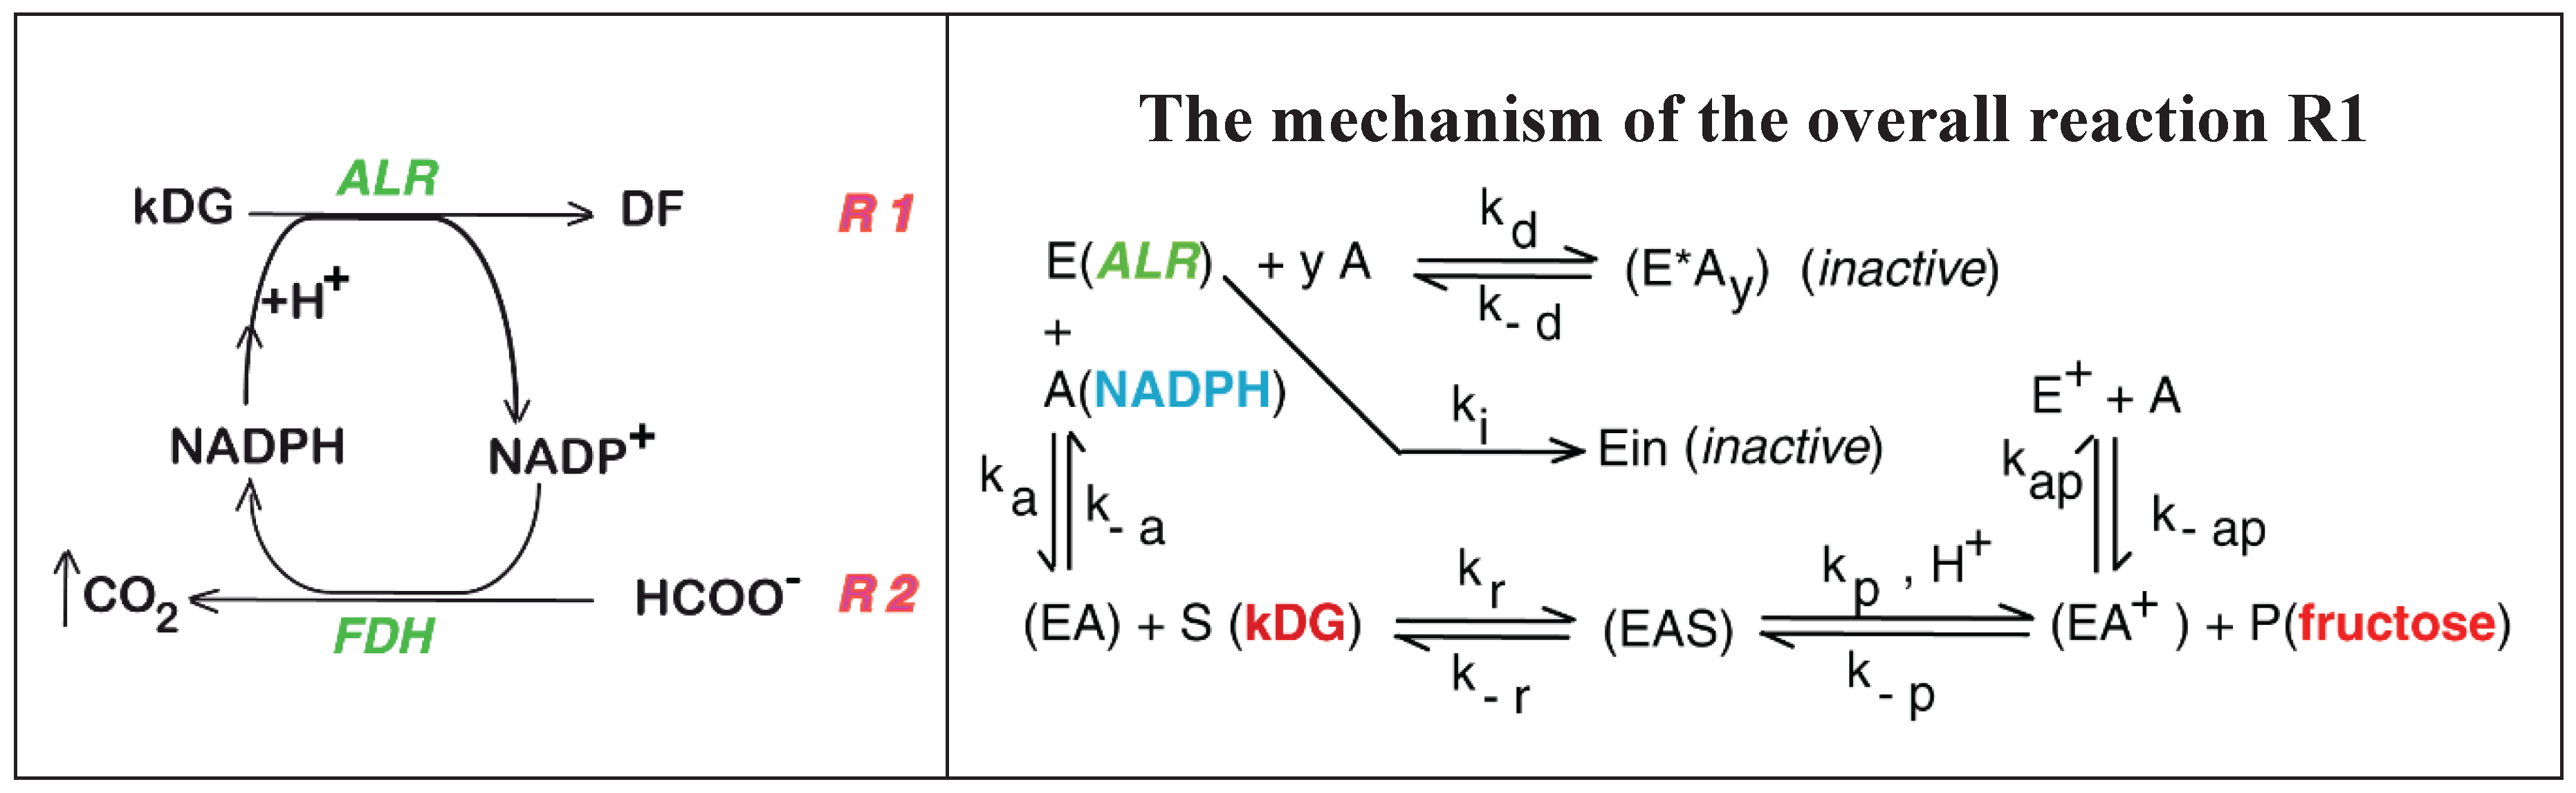
Figure 1.
[LEFT] “The reaction scheme of the two coupled enzymatic reactions: (R1) keto-D-glucose (kDG) reduction to D-fructose (DF) by using suspended ALR (aldose reductase) and cofactor NADPH (Nicotinamide adenine dinucleotide phosphate reduced form); (R2) NADPH cofactor continuous in-situ regeneration by the expense of formate (HCOO) degradation in the presence of suspended FDH (Formate dehydrogenase),” following the process proposed by Slatner et al. [46]. [RIGHT] Detailing the reaction (R1). “A simplified representation of the reaction pathway proposed by Maria and Ene [47] for the enzymatic reduction of kDG to DF, by using NADPH (Nicotinamide adenine dinucleotide phosphate - reduced form), and aldose reductase (ALR). Notations in the notation list. Adapted from Maria and Ene [47], with the courtesy of CABEQ Jl.”.
The paper presents a significant number of novelty aspects, as followings: (i) The engineering evaluation of this process is a premiere in the literature. (ii) The in-silico engineering analysis of the Cetus process with NADPH in-situ continuous regeneration is a premiere in the literature; (iii) the way by which this BR optimization problem was successfully solved, by limiting the consumption of costly enzymes and cofactor is a model that can be followed to solve similar multi-enzymatic processes. (iv) Before this paper, there are very few enzymatic processes analyzed in the literature from the engineering point of view by also accounting the cofactor during the optimization procedure. (v) The scientific value of this paper is not virtual, as long as the numerical analysis is based on the kinetic model of Maria and Ene [47] constructed and validated by using the extensive experimental data sets of (Figure 2), and based on the kinetic model of Maria [57] for NADPH regeneration validated by using the extensive experiments of Slatner et al. [46]. (vi) The in-silico analysis suggests that an optimally operated BR with a policy determined from applying a NLP procedure, can lead to high performances, that is a total conversion, the reaction occurring quantitatively with consuming 2x less enzymes (FDH,ALR), and 25% less NADPH. vii) The major and combined role played by the biocatalyst, and cofactor (ALR, and NADPH concentrations), as control variables during BR optimization “(an option seldom discussed in the literature). viii) The in silico (model-based) optimal operation of enzymatic reactors is a very important engineering tool because it can lead to consistent economic benefits, as proven by the results presented in this paper.”
Table 2.
Nominal (not-optimal) operating conditions of the experimental BR with suspended ALR and NADPH used by Maria and Ene [47] to investigate the kDG conversion to D-fructose,. DSn = data set number “n”. Notations: S = substrate (kDG); P = product (D-fructose, DF); A = NADPH; A(+) = NADP+; E = ENZ= ALR.
| Parameter | Nominal initial value | Remarks | ||||
|---|---|---|---|---|---|---|
|
Data set # 1 (DS1) |
[S]o = [kDG]o | 35 mM | Other species initial conc. [P]o = 0; [A(+)]o = [NADP(+)]o = 0; [EA]o = 0 |
|||
| [A]o = [NADPH]o | 35 mM | |||||
| [E]o = [ALR]o | 0.0048 U/mL | |||||
|
Data set # 2 (DS2) |
[S]o = [kDG]o | 35 mM | ||||
| [A]o = [NADPH]o | 35 mM | |||||
| [E]o = [ALR]o | 0.00257 U/mL | |||||
|
Data set # 3 (DS3) |
[S]o = [kDG]o | 35 mM | ||||
| [A]o = [NADPH]o | 6 mM | |||||
| [E]o = [ALR]o | 0.0055 U/mL | |||||
|
Data set # 4 (DS4) |
[S]o = [kDG]o | 15 mM | ||||
| [A]o = [NADPH]o | 35 mM | |||||
| [E]o = [ALR]o | 0.006 U/mL | |||||
| Temperature, pH | 25oC, 7 | pH buffer | ||||
| Optimization limits of initial loads | [S]o ∈ [5-100], mM [NADPH]o ∈ [5-80], mM |
[E]o ∈ [0.003-0.1] U/mL [47] [FDH] ∈ [100-2000] (U/L) [12] |
||||
| NADPH regeneration | [HCOO]o = [kDG]o | Similarly to Maria [57]; Slatner et al. [46] | ||||
| [CO2]o = 0; [FDH]o = 1000 U/L (adopted as an average) | [FDH]o should be determined by optimization | |||||
| Reactor volume (L) | 1 | up to 3 L capacity | ||||
| Batch time (tf) (h) | 24 | For all DS1-DS4 | ||||
| Solubility in water | DG (kDG) | 5-7 M | (25-30oC) [73] | |||
| DF | ca. 22.2 M | 25°C pH= 7 [//en.wikipedia.org/wiki/Fructose] | ||||
| CO2 solubility, [CO2]* | 31.3 (mM) at (25oC) | [74,75] | ||||
| DG (kDG) water solution viscosity | 1-3 cps (for < 0.3 M) 1000 cps (4.5M, 30oC), Vs.- 1094 cps (molasses, 38oC) |
[64,76] | ||||
2. The Experimental Enzymatic Reactor
The analyzed BR is those used by Maria and Ene [47] to derive the kinetic model of the Cetus first-step-process, and by Maria and Ene [47] to derive the kinetic model of the Cetus second-step process (analyzed here). The BR characteristics are presented in Table 2 [13,47]. The reactor operation is completely automated, with a tight control of the pH, temperature, and of the mixing intensity.
3. Biocatalytic Process Kinetic Model
“The reaction scheme of the two coupled enzymatic reactions is presented in (Figure 1). In the main reaction (R1), kDG is reduced to D-fructose (DF) by using suspended ALR (aldose reductase) and the cofactor NADPH (Nicotinamide adenine dinucleotide phosphate reduced form) as proton donor. In paralel, the NADPH cofactor is continuously in-situ regenerated through the reaction (R2), by the expense of ammonium formate (HCOO) degradation in the presence of suspended FDH (Formate dehydrogenase), according to the similar reaction used by Slatner et al.[46] with the same purpose.”
For the main reaction R1, the process kinetic model proposed by Maria and Ene [47], is based on their proposed reaction pathway of Figure 1. The reaction rate expressions are given in Table 3. The associated 9 rate constants of Table 4 are those identified by Maria and Ene [47], by using four kinetic data sets (DS1-DS4 of Table 2) recorded in batch experiments plotted in Figure 2. An extensive and reasoned/documented discussion about this kinetic model is given by Maria and Ene [47]. To maximize the recorded kinetic information, these runs were carried out for large batch times of 24 h, and by varying the enzyme/reactant/cofactor initial ratios, in the range of: kDG ∈ [15-35] mM; NADPH ∈ [6-35] mM; ALR ∈ [0.0026-0.006] U/mL.
Table 3.
The overall reactions considered by the kinetic model proposed by Maria and Ene [47] (that is the main reaction R1 scheme of Figure 1-right) for the “kDG enzymatic reduction to DF by using the NADPH cofactor, and the suspended aldose reductase (commercial recombinant ALR obtained by expressing human 1-316aa plasmids in E. coli; enzyme source: ATGEN, Cat. no. ALR-0901). Notations: E = aldose reductase (ALR); A = NADPH; A+ = NADP+; S = kDG (substrate); P = D-fructose (product).”.
| The overall reaction R1 of Figure 1 and its attached side-reactions |
|
|
| Rate expressions of the reactions displayed in Figure 1-right, corresponding to the mechanism of the overall reaction R1 |
|
, (successive Bi-Bi mechanism) ; ; ; ; ; |
Table 4.
The rate constants of the kinetic model of Table 3 estimated by Maria and Ene [47] from using the four datasets presented in the Figure 2.
| Rate constant | Value | Rate constant | Value |
| , mM/min/(U/mL) | 3.9 106 | , 1/(mM min) | 2.07·106 |
| , mM | 65.41 | , 1/min | 858.23 |
| , mM | 1.24 | , mM /(U/mL) | 1.48·104 |
| , mM | 1427 | , 1/min | 7.01·10-2 |
| , mM | 0.886 |
“The overall reduction reaction rP of R1 is given in Table 3. It follows a successive Bi-Bi mechanism, being accompanied by a reversible binding of ALR to the NADPH to form an inactive complex (E*Ay), and by the enzyme ALR deactivation.”[47]
The model rate constants have been estimated from using these four sets of experimental kinetic curves (Figure 2). A weighted least square criterion has been used as statistical estimator, because the standard measurement errors of species are very different [4]. The obtained kinetic model of Maria and Ene [47] was proved to be very adequate in a statistical sense (see the model predictions vs. experimental points in Figure 2).
The in-situ continuous regeneration of the reduction reaction cofactor (NADPH here) is a very common technique to ensure a high conversion of the enzymatic main reaction along the entire batch. There are several alternatives to realize such an objective, well discussed in the literature [51,54,77–80]. The NADPH regeneration reaction R2 displayed in Figure 1, was adopted by analogy with the NADH regeneration in the D-fructose reduction to mannitol, extensively studied experimentally by Slatner et al. [46]. Based on these experimental data, Maria [57] proposed a kinetic model for the cofactor regeneration, and estimated its rate constants. In this paper, by preserving this similarity (that is the use of FDH enzyme, and the same HCOO substrate, under the same reaction conditions) the same kinetic model was adopted for the NADPH regeneration, while keeping the same relative rate constants, with adapted units for kc2, as presented in Table 5. The (FDH)(EC 1.2.1.2, or EC 1.17.1.9 from Candida boidinii) Michaelis-Menten adopted constants match the literature data, as follows: i) The KM2 rate constant of 0.088 (mM) is comparable to 0.09 mM of Chenault-Whitesides [51], or to 0.09-0.8 mM by Jiang et al. [78], or to 0.083 - 0.92 mM of Brenda [81]. ii) kc2 = 0.1387 1/min/(U/L) = 2.31 (1/s) (for nominal FDH = 1000 U/L) is comparable to 0.26-3.7 (1/s) of Brenda [81], or to 1.07-8.8 (1/s) by Jiang et al.[78], under the same NADPH regeneration conditions (25oC, pH 7).
Table 5.
“The kinetic model proposed by Maria [57] for the reaction (R2) of Figure 1, that is the in-situ continuous regeneration of the cofactor NADPH by the expense of ammonium formate (HCOO) degradation in the presence of FDH. Rate constants have been estimated to match the experimental kinetic data of Slatner et al. [46],” and extrapolated when using NADPH instead of NADH under the same reaction conditions, and the same FDH.
| , (mM/min) |
| kc2 = 0.1387, 1/min/(U/L); KM2 = 8.8047 ×10⁻² mM; KHC = 5.0061×10⁻² ; KNADP = 90.181 |
4. The BR Enzymatic Reactor Dynamic Model
To in-silico simulate the key-species dynamics in the BR, a classical ideal model was adopted [6], by using the usual hypotheses:(i) Isothermal, iso-pH; (ii) Perfectly mixed liquid phase (with no concentration gradients), ensured by continuous mechanical mixing. (iii) The liquid volume is constant, its increase due to the pH controlling additives being negligible.
In a general form, the enzymatic BR dynamic model is presented in Equation (1), with including the mass balances of 6 key-species of the kDG reduction (reaction R1 of Figure 2), most of them being observable. The species mass balance is on the following form:
The index “i” refers to the species [kDG, P, NADPH, NADP(+), ALR, E*A] of reaction R1, but also to the species [HCOO, CO2, FDH] of the reaction R2. The detailed dynamic model of the BR is presented in Table 6.
Table 6.
Key-species mass balances of the batch bioreactor BR model, including the bioprocess kinetic model of Maria and Ene [47], completed with the NADPH regeneration similarly to the model of Maria [57]. The reaction rates expressions are given in Table 3 and Table 5, while the associated rate constants are given in Table 4 and Table 5.
| Key species mass balances in the BR (corresponding to Equation (1)) | The main experimental conditions of Table 2 |
|---|---|
|
; ; |
“Liquid volume = 1 L Phosphate buffer, pH = 7; 25oC Initial conc. are in the ranges: [kDG] = 15-35 mM [NADPH] = 6-35 mM Initial [ALR] = 2.6-6 U/L [HCOO]o = [kDG]o [63]; [FDH] = 100-2000 U/L ; If [CO2] ≥ [CO2]*, then [CO2] ≈ [CO2]*, and the excess leave the system. FDH inactivation is neglected. Notations: S = substrate (kDG); P = product (fructose); A = NADPH; A(+) = NADP(+); E = ALR The units are in mM, min, and U/L.” |
5. BR Simulation and Optimization
5.1. Nominal BR Simulation, and Control Variables Selection
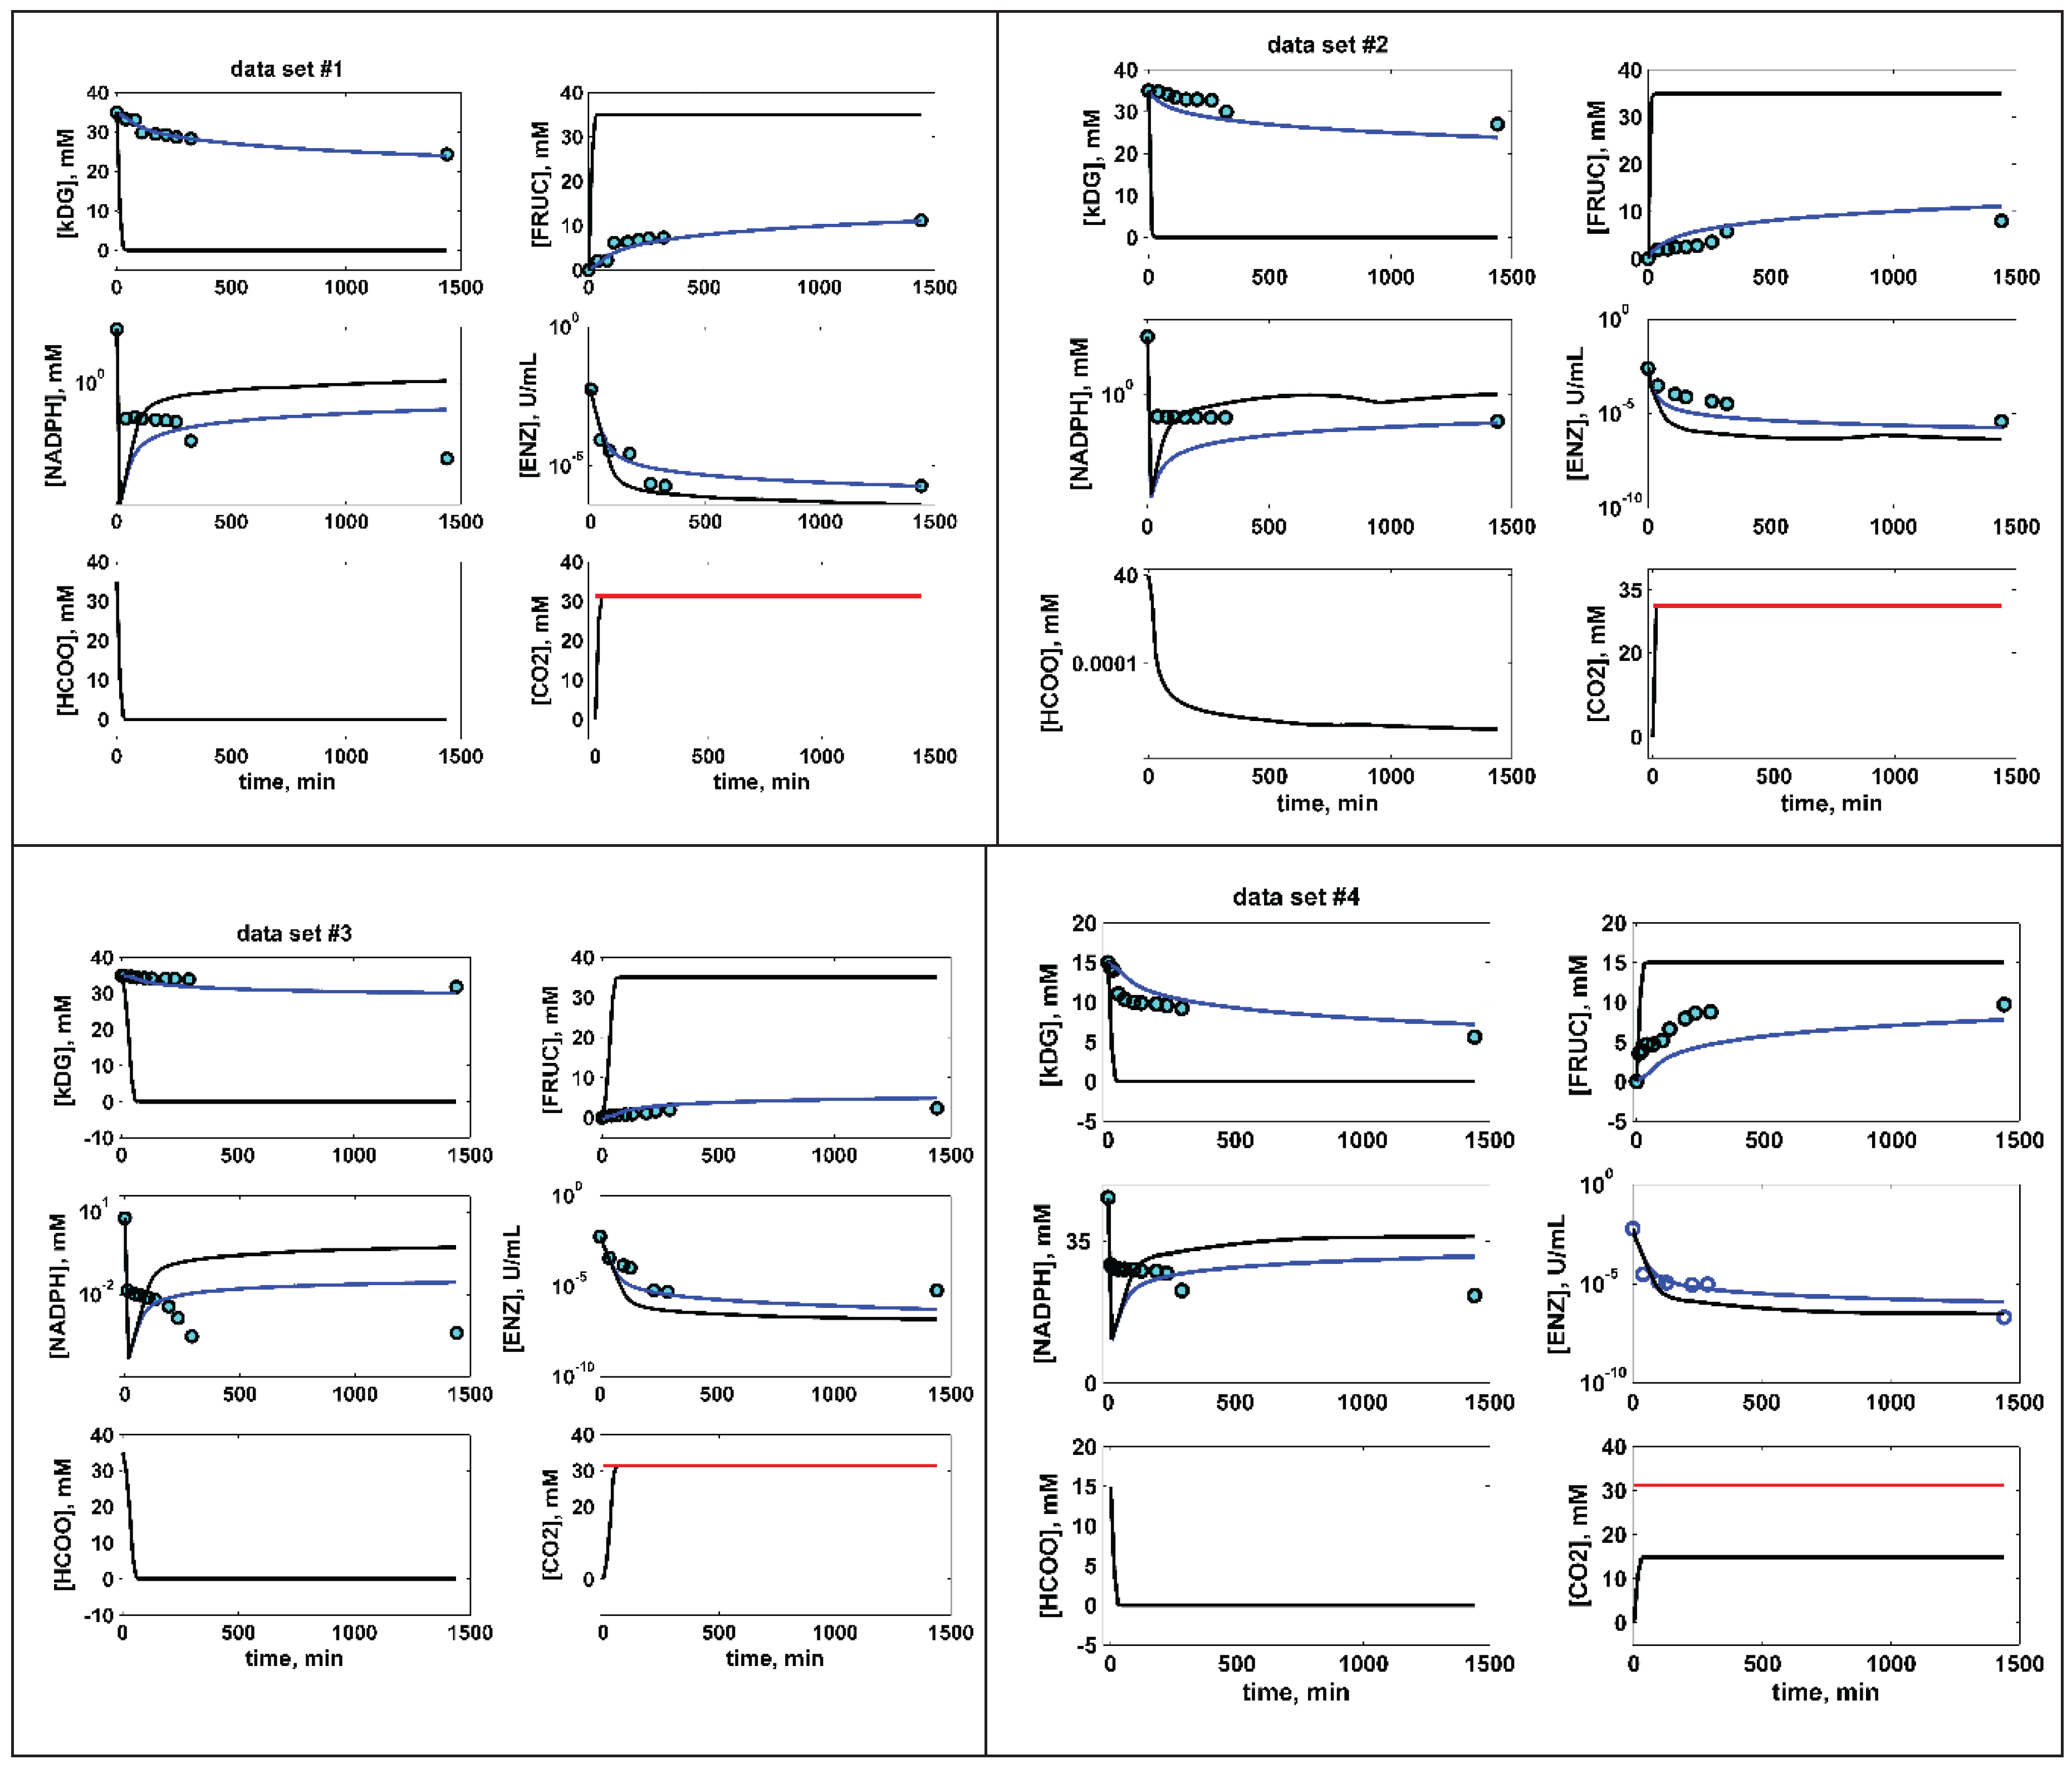
By using the reactor model of Table 6, with accounting for the NADPH in-situ regeneration, the species dynamics was simulated for the all four batch experiments DS1-DS4 of Maria and Ene [47]., with the initial conditions of Table 2. The results, plotted in Figure 2, reveal several conclusions: 1) NADPH regeneration keeps a low but effective concentration during the batch, thus ensuring a high process efficiency. 2) Cofactor regeneration is efficient enough, so residual [NADPH] at the batch end is higher than in case regeneration is missing. 3) Due to the continuous cofactor regeneration, the conversion is complete. 4) The NADPH efficient recover leads to a quick and practically total HCOO decomposition; 5) In turn, the quick HCOO decomposition leds to an abrupt rise of [CO2], quickly reaching its saturation level, the excess leaving the system. Only in the DS4 case, the lower [HCOO] produce a [CO2] below its saturation level. 6) As pointed-out by Maria and Ene [47], the suspended ALR enzyme (ENZ) suffers a significant inactivation during the batch, even if its level is enough to ensure the process progress during the whole batch. As reviewed by Maria and Ene [47], a more efficient but costly alternative is to use an immobilized ALR.
By analyzing the process main reactions of Figure 1, and the reactor model of Table 6, the chosen control variables are those with the highest influence on the BR efficiency, that is: [S]o = [KDG]o, [A]o = [NADPH]o, [E]o = [ALR]o , [FDH]o (right column in Table 6).
5.2. Single Objective Function Optimization (NLP) of the BR
In the BR operation mode, its optimal operation involves to in-silico determine the optimal initial load that ensures the product [P] (D-fructose) maximization, in the presence of multiple technological constraints.
Optimization of the BR operation translates in finding its initial load with the 4 key-species (control variables). In math terms, for a single objective function, this optimization problem can be written as maximization of the [P] (D-fructose) production, that is:
Find [KDG]o, [NADPH]o, [ALR]o, [FDH]o, such that:
Max Ω, where: Ω = [P(t)]
The problem Equation (2) can be solved by using a common nonlinear programming (NLP) optimization rule [4], seeking to determine the extreme of the objective function in the presence of multiple constraints. “In Equation (2), the time-varying P(t) is in fact a multi-variable function P(C(t), Co,k)(t), evaluated by using the process/reactor model Equation (1) over the whole batch time (t) ∈ [0, tf ] (Figure 2), with the initial condition of Cj,0 = Cj(t=0) searched during optimization iterative numerical rule.”
“Because the enzymatic process kinetic model Equation (1), the optimization objective Equation (2), and the problem constraints Equation (3) are all highly nonlinear, the formulated problem Equation (2) translates into a difficult NLP with a multimodal objective function and a non-convex searching domain. To obtain the global feasible solution with enough precision, the multi-modal optimization solver MMA of Maria [4] has been used, being proved to be very effective for solving such difficult NLP problems.” The MMA is an adaptive random search that automatically adapts the search random direction and step-length by considering the search history in generating the new trial point distribution. To increase the reliability in locating the problem global optimum, MMA search was repeated several times, every time using a randomly chosen starting point in the defined feasible domain by Equation (3).
5.3. Optimization Problem Constraints
The above formulated NLP problem Equation (2) must account for the followings constraints:
(a).- The BR model Equation (1);
(b).- To limit the excessive consumption of raw-materials (especially the costly enzymes), feasible searching limits are imposed to the control/decision variables, based on the unpublished experimental information of Maria and Ene [47]. In math terms, the constraints (b) translate in:
6. Optimization Results and Their Discussion
The BR optimization problem results are the followings:
-.- A comparison of the key-species dynamics (Figure 2) for the nominal operation of the BR (Table 2), with or without use of NADPH in-situ regeneration. The same comparison is repeated in a quantitative way in Table 3.
-.- The NLP optimal operating policy of the analyzed BR of Table 2. The optimal species dynamics are plotted in (Figure 3), while its efficiency in quantitative terms is given in Table 3.
-.- A comparison of all BR operating alternatives in terms of P production and raw-materials consumption (based on the initial load) is presented in Table 3.
By analyzing these results, and the operating alternatives of Table 3, several conclusions can be derived, as followings:
(1).- The performances of the not-optimal DS1-DS4 BR experimental runs defined in (Table 2) are much better if the NADPH is in-situ regenerated. Thus, the realized yields (4.9/35, 11/35, 7.8/15) are very low, if NADPH is not regenerated, though the yields are 100% if NADPH is regenerated. This is a major reason to use the cofactor in-situ regeneration for this process.
(2).- The not-optimal BR operation (DS1-DS3) with using the NADPH in-situ regeneration reported a high consumption of enzymes as resulted from (Table 3). This sub-optimal operation can be improved by applying a NLP procedure with using the optimization objective Equation (2), subjected to the constraints of section 5.3. Thus, one obtains the optimal BR operation of Table 3 (last row), with the species dynamics plotted in (Figure 3). Compared to the experimental nominal, not-optimal BR operation (DS1-DS4), with or without using the cofactor regeneration, the optimized BR with cofactor regeneration reported a 25% lower consumption of NADPH, though the amount of the processed substrate is of ca. 3x higher. Also, the costly enzymes (ALR, FDH) consumption is roughly 2x smaller.
(3).- By analyzing the NLP optimal operating policy of the BR, from Table 3, and also from Figure 3 , some conclusions can be derived: a) the P-productivity increases with the initial substrates [kDG, NADPH] concentrations, if enough enzymes (ALR,FDH) are present, and if ALR (and FDH) does not deactivate too fast. To better fulfill such a condition, the best alternative could be the use of more stable enzymes, that is immobilized on a suitable porous supports [82-84] (not investigated here).
(4).- For a enough stable (immobilized) enzymes (ALR, FDH), the DF production maximization, clearly depends on the available amount of substrate (kDG), and cofactor (NADPH). As the kDG results from the step 1 of the Cetus process [85], a more realistic optimization must concomitantly consider the both linked Cetus processes. Some trials have already been done [86].
Figure 3.
The in-silico determined NLP best optimal operating policy of the BR given in Table 3, in terms of the key-species dynamics over the batch time, with imposing the optimization limits ofTable 1. The used kinetic model accounts for the in-situ NADPH continuous regeneration by the expense of HCOO enzymatic (FDH) disintegration to CO2. The red line in the CO2 plots indicates the saturation concentration under the running conditions. The BR best initial load for (phosphate buffer, pH = 7; 25oC), leading to a total conversion, is given in Table 3. (ENZ = ALR).
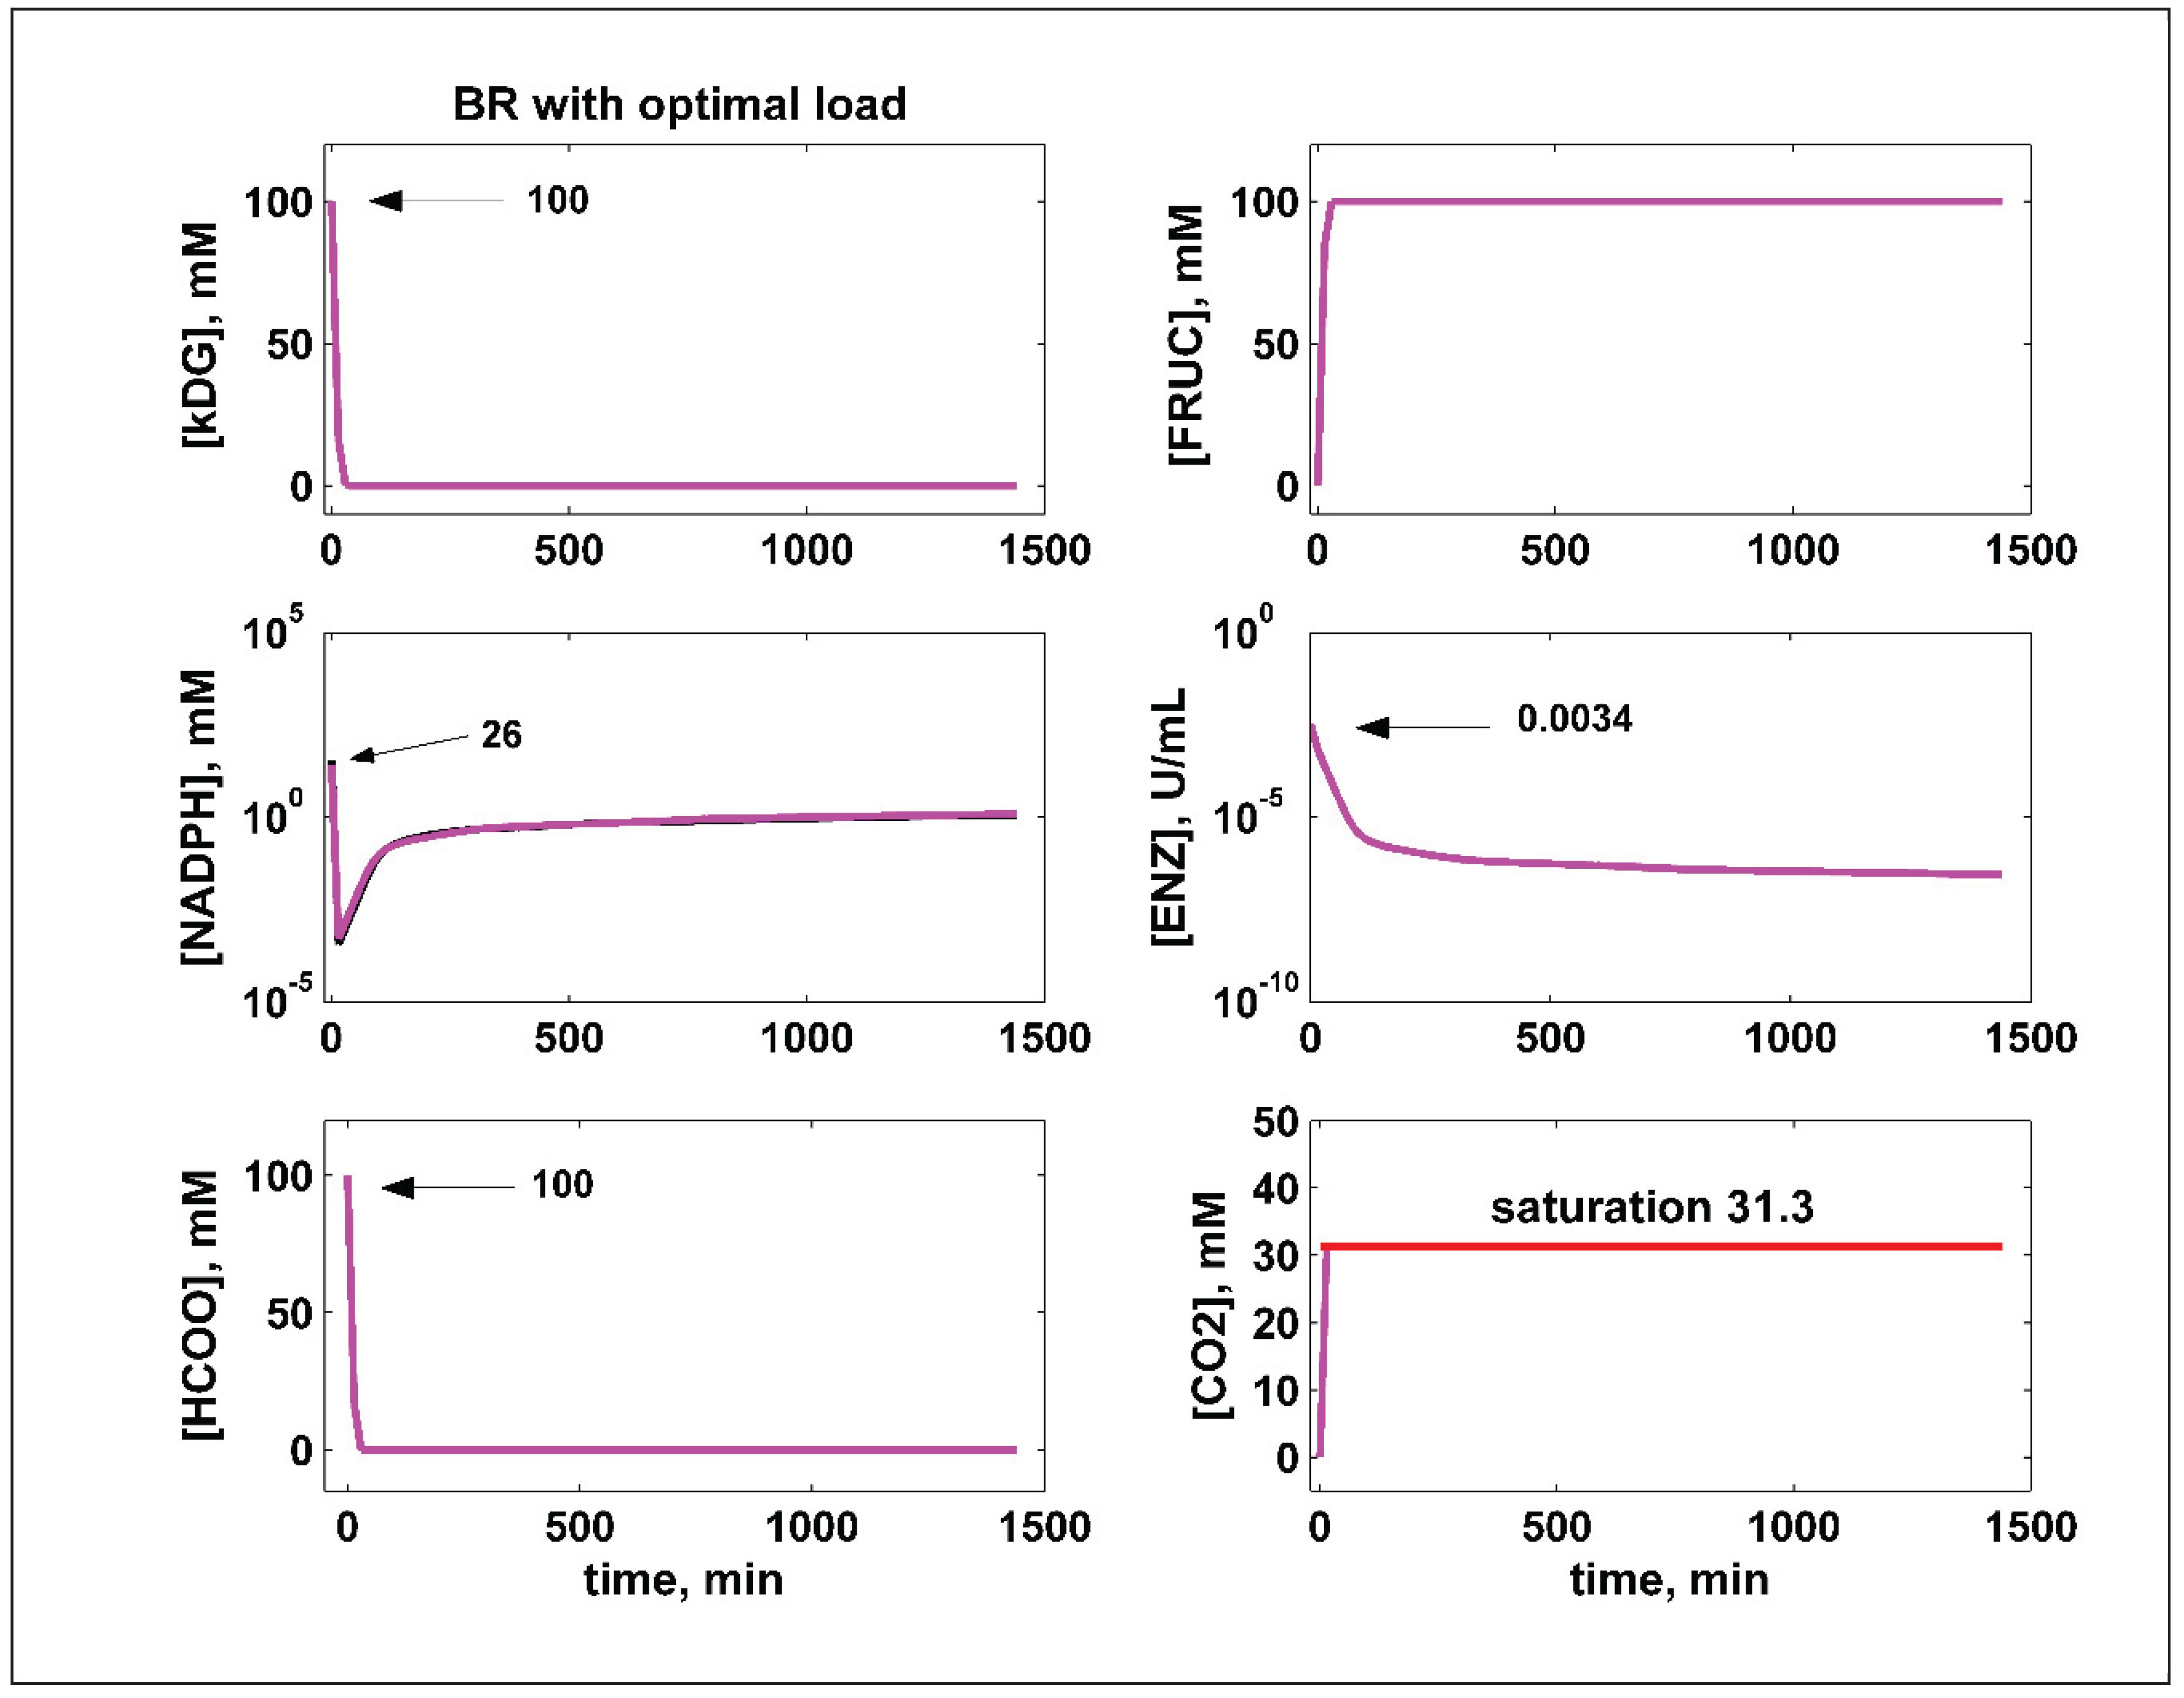
Table 3.
The productivity and raw-materials consumption of the analyzed BR of Table 2, when operated in various modes.
Table 3.
The productivity and raw-materials consumption of the analyzed BR of Table 2, when operated in various modes.
| Bioreactor operation | Raw material consumption (a,b,c) |
DF prod,mmoles | ||||||||||||||||
|---|---|---|---|---|---|---|---|---|---|---|---|---|---|---|---|---|---|---|
| kDG,mmoles | NADPH,mmoles | Final NADPH, mmoles | ALR,(U) | FDH,(U) | ||||||||||||||
|
BR Not-optimal experiments [47] |
Without NADPH regeneration, Figure 2 (d) (very poor) |
DS1 | 35 | 35 | 0.18 | 4.8 | - | 11 | ||||||||||
| DS2 | 35 | 35 | 0.18 | 2.57 | - | 11.1 | ||||||||||||
| DS3 | 35 | 6 | 0.03 | 5.5 | - | 4.9 | ||||||||||||
| DS4 | 15 | 35 | 0.29 | 6 | - | 7.8 | ||||||||||||
| With NADPH regeneration, Figure 2 (d) (good) |
DS1 | 35 | 35 | 1.25 | 4.8 | 1000 | 35 | |||||||||||
| DS2 | 35 | 35 | 1.06 | 2.57 | 1000 | 35 | ||||||||||||
| DS3 | 35 | 6 | 0.5 | 5.5 | 1000 | 35 | ||||||||||||
| DS4 | 15 | 35 | 1.19 | 6 | 1000 | 15 | ||||||||||||
|
BR optimal initial load, within limits of Table 2 |
With NADPH regeneration Figure 3 (e,f) (best) |
kDG | 100 | 100 | 26 | 1.17 | 3.38 | 440 | 100 | |||||||||
| NADPH | 26 | |||||||||||||||||
| ALR | 3.38 | |||||||||||||||||
| FDH | 440 | |||||||||||||||||
Footnotes: (a) Referring to the reactor liquid initial volume of 1 L (Table 1). (b) The displayed digits come from the numerical simulations. (c) The initial load concentration multiplied with the liquid volume. (d) The BR experimental nominal set-points #1 to #4 from (Table 2, Figure 2) of Maria and Ene [47]. (e). The BR optimal policy (initial load) was obtained by using search intervals of Table 2.(f) The units of the initial load are: [kDG], mM; [NADPH], mM; [ALR], [FDH] (U/L).
7. Conclusions
To conclude, the in-silico, off-line optimization of a BR operation “can offer a significantly improved efficiency, due to its high flexibility in using an easily adaptable process model [87], and due to the applied effective optimization rules, that is single objective NLP here,” or multi-objective techniques (not approached here, see [12,86,88] ).
The nominal, not-optimal BR operation without cofactor regeneration reported very poor performances. By comparison, the optimized BR with cofactor regeneration reported a 25% lower consumption of NADPH, though the amount of the processed substrate is ca. 3x higher. Also, the costly enzymes (ALR, FDH) consumption is roughly 2x smaller.
Thus, the in-silico BR optimization analysis appears to be fully justified by the obtained economic benefits.
Funding
The authors did not receive support from any organization for the submitted work. This research did not receive any specific grant from funding agencies in the public, commercial, or not-for-profit sectors.
Data Availability Statement
Experimental datasets and some information used in this study come from the authors’ own experiments, or are imported from the literature, every-time the source being referred in the text. Data will be made available on request.
Declaration of Competing Interest
The authors declare that they have no known competing financial interests or personal relationships that could have appeared to influence the work reported in this article. The authors confirm that their paper has no conflict of interest of any kind, and of any nature.
Abbreviations and Notations
| Cj, | - | Species j concentration |
| Kj, kj, y, kc2, KM2 | - | Kinetic model constants |
| k | - | Rate constants vector |
| - | Species j reaction rate | |
| - | Temperature | |
| - | Time | |
| - | Batch time | |
| Ω | - | Optimization objective function |
| [x] | - | Concentration of species ‘x’ |
| Index | ||
| 0,o | - | Initial |
| Abbreviations | ||
| A,A* | - | NADPH, NADP+ |
| ALR | - | Aldose reductase |
| BR | - | Batch reactor |
| DG | - | D-glucose |
| DF | - | D-fructose |
| DS1-DS4 | - | The data sets obtained by Maria and Ene [47] in batch experiments aiming at investigating the kDG conversion to D-fructose |
| “E, ENZ | - | ALR enzyme |
| Ein, E*Ay | - | Inactive forms of the enzyme E |
| FBR | - | Fed-batch reactor |
| FDH | - | Formate dehydrogenase |
| GMO | - | Genetically modified organisms |
| HFCS | - | High fructose-glucose syrup |
| HFS | - | High fructose syrup |
| kDG | - | Keto D-Glucose |
| Max | - | Maximum |
| Min | - | Minimum |
| NADPH | - | Nicotinamide adenine dinucleotide phosphate reduced form |
| NLP | - | Nonlinear programming |
| P | - | Product (D-fructose) |
| P2Ox | - | Pyranose 2-oxidase |
| R1, R2 | - | Main reactions of the 2-nd step of the Cetus process (Figure 1) |
| S | - | Substrate (kDG)” |
References
- Moulijn, J.A.; Makkee, M.; van Diepen, A. Chemical process technology, Wiley: New York, 2001.
- Wang, P. Multi-scale features in recent development of enzymic biocatalyst systems, Appl. Biochem. Biotechnol. , 2009, 152, 343–352. [Google Scholar] [CrossRef]
- Vasic-Racki, D.; Findrik, Z.; Presecki, A.V. , Modelling as a tool of enzyme reaction engineering for enzyme reactor development, Applied Microbiology and Biotechnology, 2011, 91, 845-856. 91. [CrossRef]
- Maria, G. , A review of algorithms and trends in kinetic model identification for chemical and biochemical systems, Chem. Biochem. Eng. Q., 2004, 18, 195–222. [Google Scholar]
- Gernaey, K.V.; Lantz, A.E.; Tufvesson, P.; Woodley, J.M.; Sin, G. , Application of mechanistic models to fermentation and biocatalysis for next-generation processes, Trends in biotechnology, 2010, 28, 346-354. 28. [CrossRef]
- Moser, A. Bioprocess technology - kinetics and reactors, Springer Verlag, Berlin,1988.
- Straathof, A.J.J.; Adlercreutz, P. , Applied biocatalysis, Harwood Academic Publ.: Amsterdam,2005.
- Dutta, R. , Fundamentals of biochemical engineering, Springer: Berlin, 2008.
- Lübbert, A.; Jørgensen, S.B. , Bioreactor performance: a more scientific approach for practice, J. Biotechnol., 2001, 85, 187–212. [Google Scholar] [CrossRef] [PubMed]
- Engasser, J.M. , Bioreactor engineering: the design and optimization of reactors with living cells, Chem. Eng. Sci., 1988, 43, 1739–1748. [Google Scholar] [CrossRef]
- Maria, G.; Peptanaru, I.M. Model-based optimization of mannitol production by using a sequence of batch reactors for a coupled bi-enzymatic process – A dynamic approach, Dynamics-Basel, 2021, 1, 134-154. [CrossRef]
- Gijiu, C.L.; Maria, G.; Renea, L. Pareto optimal operating policies of a batch bi-enzymatic reactor for mannitol production, Chemical Engineering and Technology. 2024; 48. [Google Scholar] [CrossRef]
- Maria, G. , Enzymatic reactor selection and derivation of the optimal operation policy by using a model-based modular simulation platform, Comput. Chem. Eng. 2012, 36, 325–341. [Google Scholar] [CrossRef]
- Maria, G. , Model-based optimization of a fed-batch bioreactor for mAb production using a hybridoma cell culture, Molecules – Organic Chemistry, 2020b, 25, 5648-5674. 25. [CrossRef]
- Bonvin, D.; Srinivasan, B.; Hunkeler, D. , Control and optimization of batch processes, IEEE Control systems magazine, Dec. 26, 2006, 34-45. [CrossRef]
- Srinivasan, B.; Primus, C.J.; Bonvin, D.; Ricker, N.L. , Run-to-run optimization via control of generalized constraints, Control Engineering Practice, 2001, 9, 911-919. 9. [CrossRef]
- Dewasme, L.; Amribt, Z.; Santos, L.O.; Hantson, A.L.; Bogaerts, P.; Wouwer, A.V. , Hybridoma cell culture optimization using nonlinear model predictive control, Proc. 12th IFAC symposium on computer applications in biotechnology, Mumbai, India, Dec. 16-18, 2013. Published in: The International Federation of Automatic Control, 2013, 46, 60–65. [Google Scholar] [CrossRef]
- Dewasme, L.; Cote, F.; Filee, P.; Hantson, A.L.; Wouwer, A.V. , Macroscopic dynamic modeling of sequential batch cultures of hybridoma cells: an experimental validation, Bioengineering (Basel), 2017, 4, 17. 4. [CrossRef]
- Mendes, R.; Rocha, I.; Pinto, J.P.; Ferreira, E.C.; Rocha, M. , Differential evolution for the offline and online optimization of fed-batch fermentation processes. In: Chakraborty, U.K.(ed.), Advances in differential evolution. Studies in Computational Intelligence, Springer verlag: Berlin, 2008, pp. 299-317.
- Liu, Y.; Gunawan, R. , Bioprocess optimization under uncertainty using ensemble modeling, J. Biotechnol., 2017, 244, 34–44. [Google Scholar] [CrossRef] [PubMed]
- Amribt, Z.; Dewasme, L.; Wouwer, A.V.; Bogaerts, P. , Optimization and robustness analysis of hybridoma cell fed-batch cultures using the overflow metabolism model, Bioprocess Biosyst Eng. , 2014, 37, 1637–1652. [Google Scholar]
- Ruppen, D.; Bonvin, D.; Rippin, D.W.T. , Implementation of adaptive optimal operation for a semi-batch reaction system, Comput. Chem. Eng., 1998, 22, 185–199. [Google Scholar] [CrossRef]
- Bonvin, D. , Optimal operation of batch reactors—a personal view, J. Process Control., 1998, 8, 355–368. [Google Scholar] [CrossRef]
- Smets, I.Y.; Claes, J.E.; November, E.J.; Bastin, G.P.; van Impe, J.F. , Optimal adaptive control of (bio)chemical reactors: past, present and future, J. Process Control., 2004, 14, 795–805. [Google Scholar] [CrossRef]
- Bonvin, D. , Realtime optimization, MDPI: Basel, 2017.
- Srinivasan, B.; Bonvin, D.; Visser, E.; Palanki, S. , Dynamic optimization of batch processes: II. Role of measurements in handling uncertainty, Comput. Chem. Eng., 2003, 27, 27–44. [Google Scholar] [CrossRef]
- DiBiasio, D. , Introduction to the control of biological reactors. In: Shuler, M.I. (ed.), Chemical engineering problems in biotechnology, American Institute of Chemical Engineers: New York, 1989, pp. 351-391.
- Martinez, E. , Batch-to-batch optimization of batch processes using the STATSIMPLEX search method, Proc. 2nd Mercosur Congress on Chemical Engineering. Rio de Janeiro, Costa Verde, Brasil, 2005, paper #20.
- Abel, O.; Marquardt, W. , Scenario-integrated on-line optimisation of batch reactors, J. Process Control., 2003, 13, 703–715. [Google Scholar] [CrossRef]
- Von Weymarn, N. , Process development for mannitol production by lactic acid bacteria, PhD Diss., Helsinki University of Technology, Laboratory of Bioprocess Engineering, 2002, URL: http://lib.tkk.fi/Diss/2002/isbn9512258854/ (last accessing Aug. 07, 2021).
- Song, K.H.; Lee, J.K.; Song, J.Y.; Hong, S.G.; Baek, H.; Kim, S.Y.; Hyun, H.H. Production of mannitol by a novel strain of Candida magnoliae, Biotechnology Letters, 2002, 24, 9–12. [Google Scholar] [CrossRef]
- Loesche, W.J.; Kornman, K.S. , Production of mannitol by Streptococcus mutans, Arch. Oral Biol., 1976, 21, 551–553. [Google Scholar] [CrossRef] [PubMed]
- Bäumchen, C.; Roth, A.H.F.J.; Biedendieck, R.; Malten, M.; Follmann, M.; Sahm, H.; Bringer-Meyer, S.; Jahn, D. , D-Mannitol production by resting state whole cell biotransformation of D-fructose by heterologous mannitol and formate dehydrogenase gene expression in Bacillus megentarium, Biotechnol. J., 2007, 2, 1408–1416. [Google Scholar] [CrossRef] [PubMed]
- Binette, J.C.; Srinivasan, B. , On the use of nonlinear model predictive control without parameter adaptation for batch processes, Processes- Basel, 2016, 4., 27. 4. [CrossRef]
- Franco-Lara, E.; Weuster-Botz, D. , Estimation of optimal feeding strategies for fed-batch bioprocesses, Estimation of optimal feeding strategies for fed-batch bioprocesses, Bioprocess Biosyst. Eng., 2005, 28, 71–77. [Google Scholar] [CrossRef]
- Avili, M.G.; Fazaelipoor, M.H.; Jafari, S.A.; Ataei, S.A. , Comparison between batch and fed-batch production of rhamnolipid by Pseudomonas aeruginosa, Iranian Journal of Biotechnology, 2012, 10, 263-269. 10.
- Loeblein, C.; Perkins, J.; Srinivasan, B.; Bonvin, D. , Performance analysis of on-line batch optimization systems, Comput. Chem. Eng., 1997, 21, S867–S872. [Google Scholar] [CrossRef]
- Lee, J.; Lee, K.S.; Lee, J.H.; Park, S. , An on-line batch span minimization and quality control strategy for batch and semi-batch processes, Control Eng. Pract., 2001, 9, 901–909. [Google Scholar] [CrossRef]
- Rao, M.; Qiu, H. , Process control engineering: a textbook for chemical, mechanical and electrical engineers, Gordon and Breach Science Publ.: Amsterdam, 1993.
- Akinterinwa, O.; Khankal, R.; Cirino, P.C. , Metabolic engineering for bioproduction of sugar alcohols, Current Opinion in Biotechnology, 2008, 19, 461–467. 19. [CrossRef]
- Fu, Y.; Ding, L.; Singleton, M.L.; Idrissi, H.; Hermans, S. E: Synergistic effects altering reaction pathways: The case of glucose hydrogenation over Fe-Ni catalysts, Applied Catalysis B, 2021.
- Liese, A.; Seelbach, K.; Wandrey, C. (Eds), Industrial biotransformations, Wiley-VCH: Weinheim, 2006.
- Myande comp., Fructose syrup production, China. 2024. https://www.myandegroup.com/starch-sugar-technology? 22 March 8242.
- Marianou, A.A.; Michailof, C.M.; Pineda, A.; Iliopoulou, E.F.; Triantafyllidis, K.S.; Lappas, A.A. , Glucose to fructose isomerization in aqueous media over homogeneous and heterogeneous catalysts, ChemCatChem, 2016, 8, 1100-1110, doi/10.1002/cctc. 2015. [Google Scholar]
- Hanover, L.M.; White, J.S. Manufacturing, composition, and applications of fructose, The American Journal of Clinical Nutrition, 1993, 58, 724S-732S. [CrossRef]
- [Slatner, M.; Nagl, G.; Haltrich, D.; Kulbe, K.D.; Nidetzky, B. , Enzymatic production of pure D-mannitol at high productivity. Biocatal. Biotransform, 1998, 16, 351–363. [Google Scholar] [CrossRef]
- Maria, G.; Ene, M.D. , Modelling enzymatic reduction of 2-keto-D-glucose by suspended aldose reductase, Chemical & Biochemical Engineering Quarterly, 2013, 27, 385–395. , 27,.
- Leitner, C.; Neuhauser, W.; Volc, J.; Kulbe, K.D.; Nidetzky, B.; Haltrich, D. , The Cetus process revisited: A novel enzymatic alternative for the production of aldose-free D-fructose, Biocatal. Biotransform, 1998, 16, 365–382. [Google Scholar] [CrossRef]
- Shaked, Z.; Wolfe, S. , Stabilization of pyranose 2-oxidase and catalase by chemical modification, Methods Enz. , 1988, 137, 599–615. [Google Scholar] [CrossRef]
- Bastian, S.; Rekowski, M.J.; Witte, K.; Heckmann-Pohl, D.M.; Giffhorn, F. , Engineering of pyranose 2-oxidase from Peniophora gigantean towards improved thermostability and catalytic efficiency, Appl Microbiol Biotechnol. , 2005, 67, 654–663. [Google Scholar] [CrossRef]
- Chenault, H.K.; Whitesides, G.M. , Regeneration of nicotinamide cofactors for use in organic synthesis, Appl. Biochem. Biotechnol., 1987, 14, 147–197. [Google Scholar] [CrossRef] [PubMed]
- Parmentier, S.; Arnaut, F.; Soetaert, W.; Vandamme, E.J. , Enzymatic production of D-mannitol with the Leuconostoc pseudomesenteroides mannitol dehydrogenase coupled to a coenzyme regeneration system, Biocatalysis and Biotransformation, 2005, 23, 1-7. 23. [CrossRef]
- Leonida, M.D. , Redox enzymes used in chiral syntheses coupled to coenzyme regeneration, Current Medicinal Chemistry, 2001, 8, 345-369. 8. [CrossRef]
- Bachosz, K.; Zdarta, J.; Bilal, M.; Meyer, A.S.; Jesionowski, T. A: Enzymatic cofactor regeneration systems: A new perspective on efficiency assessment, Science of the total environment, 2023, 868, 161630. [CrossRef]
- Liu, W.; Wang, P. , Cofactor regeneration for sustainable enzymatic biosynthesis, Biotechnology Advances, 2007, 25, 369-384. 25. [CrossRef]
- Berenguer-Murcia, A.; Fernandez-Lafuente, R. , New trends in the recycling of NAD(P)H for the design of sustainable asymmetric reductions catalyzed by dehydrogenases, Current Organic Chemistry, 2010, 14, 1000-1021. 14. [CrossRef]
- Maria, G. Model-based optimization of a batch reactor with a coupled bi-enzymatic process for mannitol production, Computers & Chemical Engineering, 2020a, 133, 106628-106635. [CrossRef]
- Kanagasabai, M.; Elango, B.; Balakrishnan, P.; Jayabalan, J. , In: Pandey, R.; Pala-Rosas, I., Contreras, J.L., Eds.; Salmones, J., Ethanol and glycerol chemistry - production, modelling, applications, and technological aspects, IntechOpen: London (UK), 2023. [Google Scholar] [CrossRef]
- Akbas, M.Y.; Stark, B.C. , Recent trends in bioethanol production from food processing byproducts, Jl. Ind. Microbiol Biotechnol, 2016, 43, 1593–1609. [Google Scholar] [CrossRef] [PubMed]
- Ju, Z.; Zhang, Y.; Zhao, T.; Xiao, W.; Yao, X. Mechanism of glucose–fructose isomerization over aluminum-based catalysts in methanol media, ACS Sustainable Chemistry & Engineering, 2019, 7, 14962-14972. [CrossRef]
- Ricca, E.; Calabro, V.; Curcio, S.; Iorio, G. The state of the art in the production of fructose from inulin enzymatic hydrolysis, Critical Reviews in Biotechnology, 2007, 27, 129–145. [CrossRef]
- Leskovac, V.; Trivic, S.; Wohlfahrt, G.; Kandrac, J.; Pericin, D. , Glucose oxidase from Aspergillus niger: the mechanism of action with molecular oxygen, quinones, and one-electron acceptors, The International Journal of Biochemistry & Cell Biology, 2005, 37, 731–750. [CrossRef]
- Slatner, M.; Nagl, G.; Haltrich, D.; Kulbe, K.D.; Nidetzky, B. , Enzymatic synthesis of mannitol. Reaction engineering for a recombinant mannitol dehydrogenase, Annals New York Academy of Sciences, 1998b, 864, 450-453. 864. [CrossRef]
- Laos, K.; Harak, M. ; The viscosity of supersaturated aqueous glucose, fructose and glucose-fructose solutions, J. Food Physics, 2014, 27, 27–30, URL: http://www.foodphysics.net/journal/2014/paper_4.pdf , (last accessing 7 July,2025). [Google Scholar]
- Roberfroid, M. , Inulin-type fructans, CRC press: Boca Raton, 2005.
- Rocha, J.R.; Catana, R.; Ferreira, B.S.; Cabral, J.M.S.; Fernandes, P. , Design and characterisation of an enzyme system for inulin hydrolysis, Food Chemistry, 2006, 95, 77–82. 95. [CrossRef]
- Ricca, E.; Calabro, V.; Curcio, S.; Iorio, G. , Fructose production by chicory inulin enzymatic hydrolysis: A kinetic study and reaction mechanism, Process Biochemistry, 2009a, 44, 466–470. 44. [CrossRef]
- Ricca, E.; Calabro, V.; Curcio, S.; Iorio, G. , Optimization of inulin hydrolysis by inulinase accounting for enzyme time- and temperature-dependent deactivation. Biochemical Engineering Journal, 48. [CrossRef]
- Tewari, Y.B.; Goldberg, R.N. , Thermodynamics of the conversion of aqueous glucose to fructose, Applied Biochemistry and Biotechnology, 1985, 11, 17-24. 11. [CrossRef]
- Illanes, A.; Zuniga, M.E.; Contreras, S.; Guerrero, A. , Reactor design for the enzymatic isomerization of glucose to fructose, Bioprocess and Biosystems Engineering, 1992, 7, 199-204. 7. [CrossRef]
- Lee, H.S.; Hong, J. , Kinetics of glucose isomerization to fructose by immobilized glucose isomerase: anomeric reactivity of D-glucose in kinetic model. Journal of Biotechnology, 2000, 84, 145–153. [Google Scholar] [CrossRef] [PubMed]
- Dehkordi, A.M.; Safari, I.; Karima, M.M. , Experimental and modeling study of catalytic reaction of glucose isomerization: Kinetics and packed-bed dynamic modelling, AIChE Jl., 2008, 54, 1333-1343. [CrossRef]
- Bishop, M. , An introduction to chemistry, Chiral publ., 2013, URL: https://preparatorychemistry.com/Bishop_contact.html (last accessing 7 July, 2025).
- Carroll, J.J.; Mather, A.E. , The system carbon dioxide-water and the Krichevsky-Kasarnovsky equation, J. Solut. Chem., 1992, 21, 607–621. [Google Scholar] [CrossRef]
- Reid, R.C.; Prausnitz, J.M.; Poling, B.E. , The properties of gases and liquids, McGraw-Hill: Boston, 1987.
- Zaykovskaya, A.; Amano, B.; Louhi-Kultanen, M. , Influence of viscosity on variously scaled batch cooling crystallization from aqueous erythritol, glucose, xylitol, and xylose solutions, Cryst. Growth Des., 2024, 24, 2700–2712. [Google Scholar] [CrossRef] [PubMed]
- Chenault, H.K.; Simon, E.S.; Whitesides, G.M. Cofactor regeneration for enzyme-catalysed synthesis, Biotechnology and Genetic Engineering Reviews, 2013, 6, 221-270. [CrossRef]
- Jiang, H.W.; Chen, Q.; Pan, J.; Zheng, G.W.; Xu, J.H. Rational engineering of formate dehydrogenase substrate/cofactor affinity for better performance in NADPH regeneration, Applied Biochemistry and Biotechnology, 2020, 192, 530–543. [CrossRef]
- Ansorge-Schumacher, M.B.; Steinsiek, S.; Eberhard, W.; Keramidas, N.; Erkens, K.; Hartmeier, W.; Buechs, J. , Assaying CO2 release for determination of formate dehydrogenase activity in entrapment matrices and aqueous-Organic two-phase systems, Biotechnology and Bioengineering, 2006, 95, 199-203, DOI 10. 1002. [Google Scholar]
- Wang, X.; Saba, T.; Yiu, H.H.P.; Howe, R.F.; Anderson, J.A.; Shi, J. Cofactor NAD(P)H regeneration inspired by heterogeneous pathways, Chem, 2017, 2, 621–654. [CrossRef]
- Brenda. 2025. Enzyme database, URL: www.brenda-enzymes.org, (last accessing March 25, 2025).
- Nasliyan, M.V.; Bereketoglu, S.; Yildirim, O. , Optimization of immobilized aldose reductase isolated from bovine liver, Turk J Pharm Sci. , 2019, 16, 206–210. [Google Scholar] [CrossRef]
- Tanaka, A.; Tosa, T.; Kobayashi, T. (Eds.) , Industrial applications of immobilized catalysts, Marcel Dekkwer: New York,1993.
- Guisan, J.M. (Ed.) , Immobilization of enzymes and cells, Humana Press: Totowa, New Jersey, 2006.
- Maria, G.; Ene, M.D.; Jipa, I. , Modelling enzymatic oxidation of D-glucose with pyranose 2-oxidase in the presence of catalase, Journal of Molecular Catalysis B: Enzymatic, 2012, 74, 209-218. 74. [CrossRef]
- Maria, G.; Crisan, M. , Operation of a mechanically agitated semi-continuous multi-enzymatic reactor by using the Pareto-optimal multiple front method, Journal of Process Control, 2017, 53, 95-105. 53. [CrossRef]
- Fotopoulos, J.; Georgakis, C.; Stenger jr., H. G. , Uncertainty issues in the modeling and optimization of batch reactors with tendency models, Chem. Eng. Sci., 1994, 49, 5533–5547. [Google Scholar] [CrossRef]
- Rao, S.S. , Engineering optimization—Theory and practice, Wiley: New York, 1993.
Figure 2.
BR non-optimal runs. Comparison of the kinetic model predictions (blue continuous line _______) without NADPH regeneration [47], vs.- the eperimental kinetic data (blue circles ο), and vs.- the kinetic model predictions with also considering the NADPH in-situ regeneration (this paper, FDH = 1000 U/L) (black continuous line ________). Species dynamics concerns the observable key-species concentrations, that is for kDG (S), NADPH (A), D-fructose (P), and the suspended ALR (enzyme ENZ). The red line in the CO2 plots indicates the saturation concentration under the running conditions. The experimental BR initial loads are the followings (phosphate buffer, pH = 7; 25oC, Table 2): “ Data set # 1 (DS1) - 35 mM kDG, 35 mM NADPH, 0.0048 U/mL ALR Data set # 2 (DS2)- 35 mM kDG, 35 mM NADPH, 0.00257 U/mL ALR Data set # 3 (DS3)- 35 mM kDG, 6 mM NADPH, 0.0055 U/mL ALR Data set # 4 (DS4)- 15 mM kDG, 35 mM NADPH, 0.006 U/mL ALR The experimental curbes reproduced from [47] with the courtesy of CABEQ Jl.”.
Disclaimer/Publisher’s Note: The statements, opinions and data contained in all publications are solely those of the individual author(s) and contributor(s) and not of MDPI and/or the editor(s). MDPI and/or the editor(s) disclaim responsibility for any injury to people or property resulting from any ideas, methods, instructions or products referred to in the content. |
© 2025 by the authors. Licensee MDPI, Basel, Switzerland. This article is an open access article distributed under the terms and conditions of the Creative Commons Attribution (CC BY) license (http://creativecommons.org/licenses/by/4.0/).
Copyright: This open access article is published under a Creative Commons CC BY 4.0 license, which permit the free download, distribution, and reuse, provided that the author and preprint are cited in any reuse.


