Submitted:
22 July 2025
Posted:
23 July 2025
You are already at the latest version
Abstract
This study aims to evaluate the impact of irrigation and fertilisation practices on the productivity of apple trees cultivated in nursery settings. Tree growth and yield in such environments are largely determined by the effective management of water resources and nutrients supplied through fertilisers. Given the growing importance of resource sustainability, diverse management approaches are being employed to optimise the use of water and fertilisers while maintaining desirable yield levels. The study was conducted at a privately operated nursery located in northwestern Romania. A three-factor experimental design (4 × 2 × 4) was employed, comprising five replicates per treatment. Each experimental plot contained four apple trees, planted at a distance of 0.7 x 0.25 m. The main factor was irrigation, the secondary factor was cultivar, and the tertiary factor was fertilisation. MM 106 apple layering, classified within the "Certified" category, served as the main biological material for this research. Grafting material consisted of dormant buds from the Gala and Jonagold cultivars, obtained from a virus-free mother-branch plantation located within the same nursery. Four irrigation treatments were applied: no irrigation, irrigation with 10 mm, 20 mm and 30 mm. Additionally, four NPK fertilisation regimes were tested: (N0 P0 K0 , N8 P8 K8 , N16 P16 K16, N24 P24 K24 ). The application of different doses of NPK resulted in a significant increase in tree production, of 145-187.4%, compared to the non-fertilised variant. Irrigation had a significant effect on the production of grafted trees, with increases of 110.64-158.62%. Fertilisation made the highest contribution to the variability of grafted tree production for the two apple cultivars (57.78%), significantly higher than the effect of irrigation (15.26%) and cultivar (0.75%). Similarly, simple (9.09-11.01%) and double (2.99%) interactions between factors also had significant influences on the production of grafted trees for the apple species.
Keywords:
irrigation
; fertilisation
; Gala
; Jonagold
; nursery
; fruit tree production
1. Introduction
The significance of this investigation lies in its response to the demand for high-quality fruit tree planting material, alongside efficient economic activity in nurseries. Achieving this goal involves a detailed assessment of site-specific soil and climate conditions, along with the technological solutions applied during cultivation. This research brings practical insights by exploring the impact of varied irrigation and fertilization approaches on nursery apple seedlings with the aim of developing the horticultural sector and raising it to a higher level of productivity. Implementing various irrigation and fertilisation regimes is expected to enhance the yield of grafted trees, especially in comparison to nurseries that do not incorporate such practices.
Similar to other areas of agriculture, contemporary fruit cultivation relies significantly on maintaining an adequate water regime. It is essential to align with both the specific needs of the cultivated species and the characteristics of the adopted cultivation system. [1]. Although many fruit tree species possess robust root systems that can explore extensive soil volumes and absorb water efficiently—enabling satisfactory yields even in regions with low rainfall or on sloped, arid, sandy soils where water retention is challenging—this capacity has its limitations [2]. Given their high specific water requirements, optimal growth and fruiting in crop areas prone to frequent and prolonged drought conditions necessitate the use of irrigation as an essential agrotechnical intervention to compensate for water deficits. [3]. Water consumption is influenced not only by the diversity of plant species but also by the productivity per unit area. It also depends on the length of the growing season. The degree of soil nutrient enrichment also affects water usage, as improved nutrient conditions typically lead to increased water consumption by plants [4].
As with all cultivated plants, the vegetative development of fruit trees in nurseries is largely dependent on climate and soil conditions. Among essential factors, such as heat, light, air and minerals, water plays a particularly important role. In many tree parts, water accounts for between 75% and 85% (or even more) of their total weight [5]. In addition to its role as a transporter of nutrients from the soil to the plant, water is a fundamental component in the synthesis of all organic substances that make up the tissues of rootstocks and trees. It is therefore crucial that trees have a constant and sufficient supply of water to ensure maximum growth [6].
Due to their considerable water demands, apple rootstocks are typically cultivated extensively in regions characterized by substantial rainfall. Although their root systems absorb large volumes of soil moisture to support the biosynthesis of organic compounds, only a small proportion is directly utilized by the rootstock, the rest being eliminated through transpiration [7]. Irrigation is an essential method for supplementing water from precipitation, especially when it is insufficient for crop needs. In practice, irrigation is a tool used to correct a natural factor (lack of rain) that leads to large fluctuations in harvests from one year to another [8]. The primary objective of irrigation is to secure consistently stable yields that approach the maximum productive potential of plants, within the constraints of existing soil and climate conditions. This is all the more important given that there have been years in Romania when, due to insufficient rainfall during certain periods, harvests have fallen dramatically, or have been completely compromised.
Irrigation proves essential when juxtaposing actual plant water consumption with the volume of accessible water from rainfall and groundwater sources, particularly when evaluating yield differences across wet and dry years or between irrigated and non-irrigated agricultural crops [9].
Undeniably, irrigation constitutes a critical pillar for the success of any fruit tree nursery. Unlike other crops, young fruit trees in nurseries have specific needs and are much more sensitive to water shortages because their root system is still underdeveloped. Proper water management at this early stage of life ensures vigorous growth and effective establishment in the orchard.
One of the key climatic challenges facing fruit cultivation in Romania is the irregular distribution of rainfall throughout the year, which significantly impacts crop development. This leads to prolonged periods of drought in certain areas (more than 10 days without rainfall exceeding 5 mm during the growing season and more than 14 days during dormancy). Given these aspects and the trend to develop important fruit-growing centres in arid areas, on specific soils or on sand dunes, it is clear that irrigation is a priority for the fruit-growing sector in Romania. However, irrigation must be differentiated, taking into account the pedoclimatic zone, the type of rootstock and other specific factors.
Although fruit tree nurseries are usually located on fertile soils, rational fertilisation is crucial. This is due to the high nutritional requirements of young plants, their relatively high density per unit area and the need for intensive growth in a short period of time [10]. Therefore, correct fertilisation becomes a very important factor in increasing the yield and quality of planting material. The nutrient boosting strategy employed in nurseries encompasses a series of long-term measures designed to enhance the physical and chemical characteristics of the soil, thereby improving its overall fertility. The aim is to ensure the necessary supply of assimilable nutrients, adapted to the specific requirements of each species, rootstock, or cultivar/rootstock combinations, depending on the age and growth stages of the plants. The key elements of a modern fertilisation system in fruit tree nurseries are: the accumulation of organic matter in the soil through crop rotation (fallow), the incorporation of special plants for green manure and the application of mineral fertilisers (nitrogen, phosphorus and potassium) [11]. It is important to note that the doses, timing and methods of fertiliser application are determined separately for each sector of the nursery. This differentiation is made according to the agrochemical properties of the soil and the specific needs of the cultivated plants. The most important principle of an efficient fertilisation system is the maximum utilisation and correct combination of fertilisers on horticultural land. In this system, fertilisers are considered an element of utmost importance, representing the main source of nutrients for horticultural plants during the growing season [12]. In nurseries, the lack of essential nutrients (nitrogen, phosphorus, potassium) causes significant deficiencies in the production and growth of seedlings. The annual consumption of nutrients from the soil is influenced by various factors specific to the experiment, such as climatic and edaphic conditions, the maintenance and tillage system, as well as the vigour of the rootstock-scion complex.
In horticultural practices, nutrient deficiency is seldom the primary constraint; more often, it is the imbalance among essential nutrients. This can be caused by an excess of certain elements, but also by insufficient or excessive water supply. Insufficient water supply creates conditions of excessive salinity around the roots, which inhibits both nutrient and water absorption. On the other hand, excess water leads to two major problems: the washing away of nutrients from the root zone (rhizosphere) and the deterioration of their oxygen supply, which reduces nutrient absorption.
This research seeks to determine an integrated and well-balanced provision of water and fertilisers, with the objective of producing a substantial volume of high-quality apple tree planting material within nursery conditions.
2. Materials and Methods
2.1. Climate and Soil Conditions of the Research Location
The research was conducted in a private nursery in north-western Romania. Climatic conditions were characterised using data sourced from the Meteorological Station of Oradea, situated approximately 5 km southeast of the research site. In 2024, the average annual temperature was 10.7ºC. The coldest month in 2024 was January, with an average temperature of –2.5ºC, and the warmest month was July, with an average temperature of 24ºC. The highest amount of precipitation was recorded in May, totaling 103.8 mm, whereas the lowest precipitation was observed in January 2024, with 12.5 mm, as shown in Table 1.
The length of sunlight exposure is very important for the growth and formation of trees in nurseries. In the conditions specific to the experimental field, July registered the highest number of sunshine hours (292.9), while December recorded the lowest (52.2).
Late spring frosts are common in March, given Romania's climate. Early autumn frosts rarely occur in September, but are common in October and November. Late spring frosts occasionally occur as unexpected climatic events, posing a threat to the normal growth and development of grafted trees. In contrast, early autumn frosts have a minimal adverse impact, as they typically coincide with the end of the grafted trees' vegetative cycle.
Geomorphologically, the experimental field features a predominantly flat terrain, subtly disrupted by depressions and gravel banks—elements characteristic of floodplain landscapes. A distinctive characteristic of the area is the presence of rolled gravel banks scattered throughout, appearing across all types of micro-relief—whether on gravel ridges, within depressions, or on flat terrain. The experiment involves soils of various textures, formed by fluvial deposits, particularly coarse, and fluvial gravel in various stages of evolution: from young, unevolved soils (alluvial soils – Aluviosols) to cambisols (Eutricambosols) and Preluvosols (former brown clayey alluvial soils). The experiment was carried out on a Preluvosol soil, distinguished by its layered composition, featuring an ochric horizon (Ao), an argic horizon (Bt), which exhibits clay accumulation resulting from migration from the upper layers, and a C horizon, representing the parent rock. The Ao horizon, 20–25 cm thick, is lighter in colour—typically brown or light brown; the Bt horizon, measuring approximately 75 cm in thickness, is characterized by significant clay accumulation and exhibits a more yellowish hue in its upper section. Beneath it, the C horizon consists of unconsolidated rock material, as shown in Table 2.
Table 3 presents the main physical properties of the soil on which the research was conducted. Soil density ranges from 1.47 g/cm³ at a depth of 0–10 cm to 1.50 g/cm³ at 50–60 cm within horizon A. In horizon Bt, values fluctuate between 1.61 and 1.63 g/cm³ at depths of 70–150 cm. The transitional horizon B/C shows a density of 1.58 g/cm³ at 160–170 cm depth
Porosity in horizon A, spanning depths of 0–60 cm, varies between 45% and 51%. As depth increases, porosity gradually declines; in horizon Bt (70–150 cm), it remains below 40–42%.
The soil reaction is acidic to slightly acidic, with a pH between 5.75 and 6.35 in the Ao and Bt horizons.
The humus content in the topsoil layer (0–10 cm) reaches 1.85% due to more intensive fertilization. This value declines to 1.41% at a depth of 50–60 cm, marking the beginning of the subsoil layer. Within the subsoil (up to 115 cm depth), humus levels fluctuate between 1.46% and 1.70%, consistently remaining above 1%.
2.2. Research Methods and Biological Material Used
To achieve the research objectives, a comprehensive experimental framework was employed, structured as a three-factor factorial design of type 4 × 2 × 4. The study was conducted in five replications, with each plot containing four trees arranged at a density of 0.7× 0.25 m. Irrigation served as the primary factor in the study, encompassing four treatments: no irrigation, and irrigation levels of 10 mm, 20 mm, and 30 mm. The apple cultivars Gala and Jonagold were treated as the secondary factor, while fertilisation was evaluated as the tertiary factor. In order to obtain the NPK doses corresponding to the fertilisation treatments, complex fertiliser 16:16:16 was used in the following quantities (kg/ha): 50 kg for N8P8K8; 100 kg for N16P16K16; 150 kg for N24P24K24.
The initial biological material for the study consisted of MM 106 apple layer classified under the 'Certified' category. Dormant buds from the Gala and Jonagold cultivars were used for grafting.
The Gala and Jonagold apple cultivars are two of the most popular and widely grown cultivars worldwide, appreciated for their fruit quality and adaptability. The Gala cultivar has medium-sized fruit with a round-conical shape. The skin is thin, with a golden-yellow base colour, almost completely covered with intense, shiny red stripes and spots. The flesh is crisp, dense, juicy, with a fine texture and a yellowish-cream colour. The taste is sweet and aromatic, slightly acidic, with a floral aroma. It is highly appreciated for fresh consumption, or when used in salads and baked food. The fruit generally ripens in August or early September, depending on the climate. It adapts well to the climatic conditions of Romania, especially in hilly areas. It needs a defined period of cold temperatures in order to fully complete its vegetative cycle and prefers fertile, well-drained soils with a neutral to slightly acidic pH. For this species, heavy clay soils with poor drainage should be avoided. Full sunlight is essential to ensure vibrant fruit coloration and robust growth. In orchards, the Gala cultivar responds very well to irrigation, especially during dry periods, ensuring fruit development and tree growth. It also benefits from a balanced fertilisation programme, based on soil analyses, to support vigorous growth and fruiting [13].
The Jonagold cultivar produces fruits that are notably large to very large, often exceeding 225 grams. The form is ovoid, with gentle ribbing along the surface. The skin is thin, smooth, with a greenish-yellow base colour, covered on 30-45% of the surface with a bright red hue or red stripes. The flesh is yellowish-white, semi-crisp, juicy, aromatic and sweet-tart, with hints of honey. The taste is a balanced combination of sweet and tart and is very versatile. It is excellent for fresh consumption, juices, cider, baking and various desserts. The fruit ripens in late September to early October. It adapts well to the temperate climate of Romania, being resistant to cold (down to -25°C). Sunny areas are ideal for maximum productivity and optimal fruit ripening. It prefers fertile, well-drained soils with a neutral to slightly acidic pH (6.0-7.0). It requires full sun exposure to maximise fruiting and obtain high-quality fruit. Regular irrigation is crucial, especially during dry periods, to support the growth of large fruit and maintain tree vigour. The Jonagold cultivar requires an annual fertilisation programme with balanced fertilisers rich in nitrogen and potassium [13].
The rootstocks were grafted in the summer of 2023, and in the autumn of 2024, the trees were removed from field II and prepared for sale.
To establish Field I in the nursery, the land underwent deep ploughing (35 cm) in August 2022, followed by disc harrowing and harrowing for levelling in October 2022. The planting of rootstocks in field I took place in autumn 2022. In 2023, two rounds of mechanical weeding were conducted between the rows, complemented by two rounds of manual weeding along each row. In addition, phytosanitary treatments were administered using Dithane (0.2%) as fungicide and Decis (0.02%) as insecticide. Concurrently with mechanical hoeing, fertilisation treatments were applied with the complex fertiliser 16:16:16 in the following quantities: 50 kg/ha for the N8P8K8 variant, 100 kg/ha for the N16P16K16 variant, 150 kg/ha for the N24P24K24 variant. To maintain optimal soil moisture, one irrigation was performed in July, followed by three sessions in August, each tailored with specific application rates according to the three experimental variants: 100 m3/ha, 200 m3/ha and 300 m3/ha, respectively. In August 2023, grafting was performed on dormant buds. The procedures implemented in field II of the nursery, starting in the spring of 2024, included a series of horticultural operations. Initial pruning was conducted to support proper plant development. This was followed by two rounds of mechanical weeding between the rows and four rounds of manual weeding along the rows to manage weed growth. Additionally, four targeted weeding operations were performed to eliminate spontaneous vegetation. To further optimize crown formation, two maintenance cuts of lateral shoots were also carried out In October 2024, after the first frost and the cessation of sap flow, the trees in the nursery were harvested. This operation was carried out using a special plough designed for uprooting trees. After harvesting, the trees were sorted, labelled and tied in bundles of 10. Finally, they were stratified in specially designed trenches.
Irrigation was performed using a drip system equipped with hoses measuring 16 mm in diameter and 0.4 mm in wall thickness. This hose was equipped with drippers positioned at intervals of 25 cm. Each dripper had four outlet holes and ensured a flow rate of 2 l/ha at a pressure of 1 bar. The daily duration of irrigation varied according to the desired irrigation rate: for a rate of 10 mm, irrigation lasted 3.5 hours; for a rate of 20 mm, the duration was 7 hours; for a rate of 30 mm, irrigation lasted 10.5 hours. The timing of fertigation was determined based on soil moisture variation and the minimum threshold (19.85%) for the variant irrigated with 10 mm. Thus, in 2024, irrigation was applied on 20 July, 17 August, 20 August and 23 August.
2.3. Water Consumption for Different Irrigation Conditions
Taking into account water consumption across various irrigation methods, the analysis identified how precipitation, soil moisture reserves, and irrigation standards contribute to meeting the water requirements of apple seedlings (Table 4).
In 2024, the amount of precipitation during the growing season increased by 255 m³/ha compared to previous conditions, which resulted in water consumption ranging from 3872 to 4251 m3 /ha and irrigation rates between 300 and 900 m3 /ha.
In 2024, for the non-irrigated variant, seedlings relied on useful precipitation in a proportion of 81.67% and on the internal soil reserve in an amount of 18.33% to meet their water requirements, as shown in Figure 1. Under the 10 mm irrigation regime, water consumption was covered by precipitation (76.66%), soil reserves (12.88%) and irrigation (7.46%). In terms of water consumption coverage for the variant irrigated with a watering rate of 20 mm, there was a slight reduction in the contribution of precipitation (74.98%) and soil reserves (10.70%) against a significant increase in the contribution of irrigation (14.23%), compared to the 10 mm irrigation rate. Changing the irrigation rate from 20 to 30 mm led to a reduction in the contribution of soil water (4.44%) associated with a constant contribution of precipitation and an increase in the contribution of irrigation (21.17%) to meet the water requirements of the seedlings.
2.4. Calculations and Measurements
The irrigation norm (∑m) refers to the cumulative volume of water applied to a crop over a specified period, encompassing both supply and washing irrigations. Depending on the purpose, ∑m can be calculated for the entire vegetation period, by month, or for specific growth and development stages. While the seasonal irrigation rate—tailored to each crop’s water requirements and the duration of its growing cycle—is vital for water management planning, irrigation system design relies primarily on estimating the volume of water that must be delivered during the peak consumption period (month). This indicator serves as a fundamental parameter for sizing pumping stations, as well as for designing the water transport and distribution network. The irrigation norm during the peak month, in relation to the return period, determines the hydromodule size required for proper dimensioning of the irrigation facility.
For the irrigation norm during the growing season in the case of a closed-circuit balance (hydrological irrigation regime without groundwater recharge), the relationship is given by the formula [14]:
∑m= ∑ (E+T) + Rf+ Ri-Pv (m3 /ha)
- -
- ∑ (E+T) Total water consumption from the soil during the growing season: This represents the total amount of water used by plants through transpiration (T) and evaporated from the soil surface (E) during the entire crop growth period;
- -
- Rf - Soil water reserve at the end of the growing season: This value indicates the volume of water remaining in the soil at the end of the growing season. It is calculated using a formula that takes into account the volumetric weight of the soil at the specific depth analysed, the depth of the irrigated soil layer and the wilting coefficient for the same depth (expressed in m(3) / ha);
- -
- Ri - Initial soil water reserve at the beginning of the growing season: This refers to the amount of water present in the soil at the beginning of the growing season, in the moistened layer. The calculation follows a method similar to that used for determining the final reserve (Rf), but it replaces the wilting coefficient with the soil's field water capacity, also expressed in cubic meters per hectare (m³/ha);
- -
- Pv - Summer precipitation (≥ 5 mm) refers to the cumulative rainfall recorded during the summer months, considering only events where individual rainfall amounts are equal to or exceed 5 mm.
For a given crop, the optimal actual evapotranspiration (ETRO) or water consumption that allows photosynthesis to take place in order to obtain an economically efficient harvest can be determined by measurements carried out in irrigated fields, or estimated as follows:
ETRO = kp x ETP
Where ETRO represents the optimal actual evapotranspiration, measured in cubic meters per hectare (m³/ha); the coefficient kp reflects the specific features of the plants analysed, cultivated within the pedoclimatic area under consideration; Potential evapotranspiration (ETP), also expressed in m³/ha, is determined using the Thornthwaite method.
Evapotranspiration (ET) is a significant consumer of irrigation water and precipitation on cultivated land.
The wilting coefficient (Co) represents the moisture content in the soil at which plants wilt without recovering even when placed in an atmosphere saturated with water vapour. It can be determined directly by growing plants in pots whose surface is waxed. Moisture is considered to have reached the wilting coefficient when the leaves wilt without recovering even after being kept in a humid environment. The wilting coefficient is obtained by determining the soil moisture content using the gravimetric method. It is expressed as a percentage of the dry weight of the soil at 105 °C.
In the case of an open circuit balance (hydrological irrigation regime with groundwater recharge), the following formula is used:
∑m= ∑ (E+T) + Rf- CC- Pv- Af (m3 /ha)
CC is the field capacity for maximum (supported) soil water, and Af represents the amount of supply.
The technical literature also defines the irrigation norm as:
m=100 x H x DA (CC – Pmin) xᵩ; m(3) /ha
xᵩ- fraction of effectively moistened soil (0.2-0.4), lower values for fruit trees and higher values for crops with dense rows.
For apple trees cultivated in nurseries, irrigation is advisable from July through September, especially during drought conditions.
To calculate the irrigation rate, one can convert the difference between the field capacity (CC) and the wilting point (p) for the specific soil depth into cubic meters per hectare (m³/ha) using the following formula:
where:
M= 100 x H x DA (CC-p)
m is the irrigation rate, in m3 /ha;
H is the thickness of the active soil layer (watering depth), in m;
DA is the apparent density (volumetric weight) of the soil layer H, in t/m3;
CC is the field capacity for water of the soil layer H, in percent by weight relative to dry soil;
The parameter pp represents the current water content of the soil layer HH, expressed as a percentage by weight in relation to the dry soil mass.
Since, under proper usage conditions, the water supply in the soil should not fall below the minimum threshold (pmin), the formula for calculating the irrigation rate becomes m = 100 x H x DA (CC-pmin). The irrigation rate can also be defined as the amount of water applied to the soil in order to raise its moisture content from the minimum threshold to field capacity [14].
The production of grafted trees per hectare was determined by the number of seedlings in the plot that had suitable vigour to be used as planting material. To ascertain the significance of the differences between the gradations and combinations of the three factors, the experimental data was processed using analysis of variance and the t-test for trifactorial experiments. Significances were expressed both with symbols (*; **; ***; 0; 00; 000) and with letters, with differences between variants marked with different letters being considered significant.
Statistical analysis of leaf area was conducted through ANOVA, applied to a 4×2×4 split-split-plot design. The LSD (Least Significant Difference) test was employed to identify significant differences between means, at a significance level of p<0.05 [18]. All results were reported as the mean ± standard error.
3. Results
3.1. Effect of Irrigation on the Production of Grafted Trees
Considering the interaction between irrigation and the production of grafted trees of the Gala cultivar presented in Table 5, it can be observed that watering with 10-20 mm resulted in a significant increase of 67.83-74.39% compared to the non-irrigated variant, while the effect of the 30 mm watering rate was considerably higher (110.54%).
3.2. Effect of Cultivar on Grafted Tree Production
The productivity of grafted Jonagold trees was impacted by the type of irrigation regime, with outputs ranging from 17.046 in the non-irrigated variant to 55.070 in the 30 mm variant, which fluctuated considerably depending on the irrigation regime applied. Compared to the non-irrigated agricultural land base, irrigation proved highly efficient, resulting in notable yield increases of 168–223%. Increasing the irrigation rate from 10 to 20 mm led to a significant 15% boost in production, whereas a further rise from 20 to 30 mm was associated with an additional increase of 4.69%. After comparing the yields of the two cultivars under different irrigation regimes (Table 6), it was found that on the unirrigated soil, the Gala cultivar showed superior performance, resulting in an increase of approximately 25.4% in the number of grafted trees.
3.3. Effect of Irrigation and Fertilisation on the Production of Grafted Trees
Under the effect of 10 mm and 20 mm doses, the production of grafted Jonagold trees was significantly higher by 19.12-31.98%. Grafted Jonagold trees benefited more from irrigation with a norm of 30 mm. In terms of the influence of fertilisation on the production of grafted trees under a given irrigation regime (Table 7), the highest variation was recorded in the non-irrigated variant, while under the 30 mm regime, NPK doses had a greater effect on this production.
With an 8% NPK fertilization regime, grafted tree production varied noticeably, ranging from 20.072 under non-irrigated conditions to 53.958 at an irrigation rate of 30 mm. Within this agricultural framework, irrigation led to substantial yield increases, of 126–169%, compared to the non-irrigated variant. Furthermore, only changing the irrigation rate from 10 to 20 mm resulted in a significant increase of 14.78 %, while the transition from 20 to 30 mm irrigation volume was not associated with a significant change in the number of grafted trees obtained. Under the effect of the 16% NPK treatment, the production of grafted trees ranged between 28.777 and 56.143. Accordingly, in this instance, the irrigation levels produced comparable effects, resulting in significant yield increases of 91.62–95.10% relative to the non-irrigated control. Against the background of fertilisation with 24% NPK, irrigation with different watering rates resulted in an increase of 81.22-84.61% in the production of grafted trees, with similar values for the three rates. In the absence of fertilization, the studied irrigation rates allowed for very significant yield increases, ranging from 11.428 at the 10 mm rate to 39.132 at the 30 mm irrigation rate (Table 8). Modifying the watering norms by supplementing them with 10 mm each generated significant increases of 8.064-19.640 in the production of grafted trees.
Fertilization exerted a notable effect on grafted tree production under a 20 mm irrigation regime, generating increases of 167.51-193.16, against significantly higher values for doses of 16-24% NPK. With the application of a 30 mm irrigation rate, fertilization led to a 38–46% increase in grafted seedling production. Considering the impact of fertilization across various irrigation regimes (Table 9), it is obvious that, in the absence of irrigation, production values ranged from 0 in the unfertilised variant to 30.953 in the 24% NPK variant, with very high variability between treatments. Changing the NPK dose from 8 to 16% was associated with significant effects on production, generating an increase of 43.37%, while supplementing fertilisation from 16 to 24% generated an insignificant increase of 7.56%. On a 10 mm irrigation framework, fertilization treatments produced incremental gains in grafted tree production, ranging from 45.428 for the soil fertilised with 8% to 56,094 for the 24% NPK dose. Under these soil moisture conditions, only an increase in the dose from 8 to 16% NPK generated a significant increase in production of 21.4%.
3.4. Effect of Cultivar and Fertilisation on the Production of Grafted Trees
With regard to the combined effect of cultivar and fertilisation on the production of grafted trees (Table 10), it was found that for both cultivars, fertilisation and the progressive increase in doses had a significant positive influence, with higher effects in the Gala cultivar.
Taking into account the effect of the cultivar on the production of grafted trees under different fertilisation treatments (Table 11), amplitudes ranging from 142 for the 24% NPK dose to 20.454 for the unfertilised variant were observed.
Against the backdrop of these differences, it can be seen that the Jonagold cultivar made better use of the unfertilised soil conditions, achieving increases of 280%, while the Gala cultivar showed a higher yield with 221 trees under the effect of 8% NPK fertilisation. Also, with fertilisation with 16-24% NPK, the Jonagold cultivar achieved production increases of 142-845 grafted trees. Regarding the effect of fertilisation on the production of grafted trees for each cultivar (Table 12), it can be seen that for Gala, the values ranged from 7.286 for the unfertilised variant to 50.262 when applying a dose of 24% NPK. Compared to the unfertilised variant, NPK treatments had significant effects associated with increases of 35.725-42.976. It was also found that changing the dose from 8 to 16% NPK generated a significant increase of 13.06%, whereas increasing the dose from 16 to 24% NPK did not influence this yield.
In the case of the Jonagold cultivar, the variability between the effects of fertilisation was lower, associated with an amplitude of 22.664, ranging from 27.740 on unfertilised soil to 50.404 for the 24% NPK dose. As with the other cultivar, NPK fertilisation had a significant influence of 54.25-81.70% on production. Supplementing fertilisation by progressively increasing the doses resulted in a significant increase of 15.62% between the 8% and 16% doses, and an insignificant variation of 1.9% between the 16% and 24% NPK doses.
4. Discussion
In the field of pomology, the cultivation of high-quality nursery stock is fundamental for the long-term viability and productivity of future orchards. Within this agronomic context, irrigation and fertilization emerge as critical inputs, whose optimal management directly influences the morphophysiological performance, stress tolerance and, implicitly, the survival and growth potential of the seedlings. Studies by DeJong highlight the interdependence and synergy of these practices in achieving production objectives [15]. Water is an essential component of cell protoplasm (75-85% of the total weight of plant organs) and a crucial transport medium for nutrients. An adequate water regime in nurseries determines the vigorous growth and development of trees. Optimal water supply supports cell division, cell elongation and fundamental metabolic processes such as photosynthesis and respiration [16]. Water deficit induces water stress, manifested by reduced turgor, slowed vegetative growth (height, stem diameter), premature lignification of tissues and suboptimal development of the root system. According to research by Haberle, water is the solvent through which nutrient ions are taken up from the soil solution by the roots [17]. Insufficient moisture limits the availability of nutrients, even when they are present in the soil, negatively affecting the mineral nutrition of trees. Well-irrigated seedlings have superior morphological characteristics: larger collar diameter, appropriate height, adequate number of lateral branches and optimal wood lignification. These attributes confer increased resistance to transplant shock and a higher survival rate in the orchard [18].
By enriching the soil's nutrient reserves, fertilization facilitates rapid seedling growth and promotes complex development in nursery conditions. Balanced fertilization is crucial for ensuring essential macro- and microelements. Nitrogen promotes intense vegetative growth, leaf and shoot formation. However, excess nitrogen, especially without a balance with phosphorus and potassium, can prolong the growing season, slow wood lignification and increase sensitivity to frost. Phosphorus is vital for root system development, energy processes and proper tissue lignification. As an element with low mobility in the soil, phosphorus must be incorporated at the depth of root spread for maximum efficiency [19]. By strengthening resistance to drought, frost, and disease, potassium plays a key role in maintaining water balance within the plant. It also influences fruit quality. An optimal nutritional status gives seedlings superior vigour and increased natural resistance to biotic and abiotic stress factors. Correct fertilisation of trees in the nursery ensures uniform growth, adequate stem diameter, good lignification and overall health, all of which are criteria for classifying elite planting material.
Research conducted to date indicates that irrigation and fertilisation work synergistically. Each factor amplifies the effectiveness of the other. Water availability is a prerequisite for efficient nutrient absorption. Under conditions of water deficit, even a nutrient-rich soil will not allow optimal absorption [20]. A well-controlled irrigation regime prevents leaching (deep washing) of nutrients, especially nitrogen, which has high mobility in the soil. Fertigation, the method used in the present study, allows for precise and uniform distribution of nutrients directly to the active root zone, synchronising nutrient supply with the physiological demand of the plant. This approach improves fertilizer efficiency, minimizes leaching losses, promotes vigorous nursery growth, and yields high-quality planting stock, thereby positively affecting cost-effectiveness and sustainability.
5. Conclusions
Fertilization accounted for the largest share of variation in grafted tree production (57.78%), markedly surpassing the effects of irrigation (15.26%) and varietal differences (0.75%). Furthermore, both simple interactions (ranging from 9.09% to 11.01%) and double-factor interactions (2.99%) significantly influenced production outcomes. Overall, irrigation exerted a notable impact on grafted tree yield, resulting in increases between 110.64% and 158.62%. A rise in the watering rate from 10 mm to 20 mm significantly enhanced production by 10%, while further increasing the rate from 20 mm to 30 mm led to an additional gain of 11.60% in grafted seedling output. The application of varying NPK fertilization rates resulted in a significant enhancement of this parameter, with increases reaching 145-187.4% compared to the unfertilised variant. An adjustment in fertilisation levels from 8 to 16% led to a 14.34% improvement in the production of grafted seedlings, while the shift from a 16% to a 24% dose resulted in a limited gain of 2.61%, which did not reach statistical significance. In the absence of fertilization, the Gala cultivar demonstrated enhanced productivity, with an increase of approximately 25.4% in the number of grafted trees. Irrigation rates of 10 mm and 20 mm exerted a marked influence on the productivity of grafted Jonagold trees, resulting in significantly higher yields by 19.12-31.98%. The 30 mm irrigation dose yielded the highest benefits for grafted Jonagold trees, resulting in superior productivity. The Jonagold cultivar benefited more from unfertilised soil conditions, achieving increases of 280%, while the Gala cultivar showed a higher yield with 221 trees under the effect of fertilisation with 8% NPK. Also, with fertilisation of 16-24% NPK, the Jonagold cultivar achieved production increases of 142-845 grafted trees.
Conclusively, the implementation of integrated and scientifically grounded irrigation and fertilization strategies is essential for enhancing the development of fruit trees in modern nurseries. Through the targeted optimization of the aforementioned factors, nurseries can achieve the cultivation of superior-quality seedlings with enhanced viability and vigorous growth trajectories, contributing significantly to the profitability and sustainability of fruit orchards. Tree production in nurseries, as a fundamental element of fruit growing, plays a crucial role in the transition to sustainable agriculture. This link involves the adoption of practices that ensure not only the production of quality planting material, but also the conservation of natural resources, the reduction of environmental impact and the maintenance of long-term economic viability. The aim among nursery owners to attain high levels of tree production represents both a rational economic objective and a pivotal element in the success of horticultural enterprises. This ambition yields not only increased financial returns, but also facilitates optimal resource allocation and enhances market responsiveness through the consistent supply of high-quality planting stock. Achieving this goal depends on a complex set of interrelated factors, such as the use of irrigation and fertilisation, which require a strategic approach and rigorous implementation.
Author Contributions
Conceptualisation, A.V. and A.P.; methodology, A.V.; software, A.P.; validation, A.V. and A.P.; formal analysis, A.V.; investigation, A.V. and A.P.; resources, A.V.; data curation, A.V.; writing—original draft preparation, A.V.; writing—review and editing, A.V.; visualization, A.V.; supervision, A.P.; project administration, A.V.; funding acquisition, A.V. All authors have read and agreed to the published version of the manuscript.
Funding
The APC was funded by University of Oradea.
Institutional Review Board Statement
Not applicable.
Data Availability Statement
The data are contained within the article or the references.
Conflicts of Interest
The authors declare no conflicts of interest.
References
- Jäger, H. The Fruit Trees Nursery, Salzwasser Publishing House: Paderborn, Germany, 2022; p. 73.
- Stănică, F.; Peticilă, A. G. Establishment of Fruit Trees Plantations, Valahia University Press: Târgoviște, Romania, 2012; p.39.
- Cerdà, A.; Ackermann, O.; Terol, E.; Rodrigo-Comino, J. Impact of Farmland Abandonment on Water Resources and Soil Conservation in Citrus Plantations in Eastern Spain. Water 2019, 11, 824. [Google Scholar] [CrossRef]
- Cronin, D. Irrigation and Soil Nutrition, Syrawood Publishing House: New York, U.S.A., 2019; p. 17.
- Mayer, J. My Little Fruit Tree, Franckh Kosmos Publishing House: Stuttgart, Germany, 2019; p. 113.
- Andreu-Coll, L.; Carbonell-Barrachina, Á.A.; Burló, F.; Galindo, A.; García-Brunton, J.; López-Lluch, D.B.; Martínez-Font, R.; Noguera-Artiaga, L.; Sendra, E.; Hernández-Ariola, P.; et al. Regulated Deficit Irrigation Perspectives for Water Efficiency in Apricot Cultivation: A Review. Agronomy 2024, 14, 1219. [Google Scholar] [CrossRef]
- Chira, L.; Pașca, I. Apple Trees growing, MAST Publishing House: Bucharest, Romania, 2004; p.37.
- De Clercq, P.; De Vroe, A.; Janssens, P.; Steppe, K.; Van Haecke, D.; Gobin, B.; Van Labeke, M.-C.; Dhooghe, E. Effect of a Soil Water Balance Controlled Irrigation on the Cultivation of Acer pseudoplatanus Forest Tree Liners Under Non-Limiting and Limiting Soil Water Conditions. Horticulturae 2025, 11, 435. [Google Scholar] [CrossRef]
- Shao, Q.; Roche, R.; Jamali, H.; Nunn, C.; Zheng, B.; Jin, H.; Chapman, S.C.; Bange, M. Comprehensive Assessment of PeriodiCT Model for Canopy Temperature Forecasting. Agronomy 2025, 15, 1665. [Google Scholar] [CrossRef]
- González-Teruel, J.D.; Ruiz-Abellon, M.C.; Blanco, V.; Blaya-Ros, P.J.; Domingo, R.; Torres-Sánchez, R. Prediction of Water Stress Episodes in Fruit Trees Based on Soil and Weather Time Series Data. Agronomy 2022, 12, 1422. [Google Scholar] [CrossRef]
- Choi, S.-H.; Kim, D.-Y.; Lee, S.Y.; Lee, K.H. Effect of Nutrient Management During the Nursery Period on the Growth, Tissue Nutrient Content, and Flowering Characteristics of Hydroponic Strawberry in 2022. Horticulturae 2024, 10, 1227. [Google Scholar] [CrossRef]
- Neupane, K.; Witcher, A.; Baysal-Gurel, F. An Evaluation of the Effect of Fertiliser Rate on Tree Growth and the Detection of Nutrient Stress in Different Irrigation Systems. Horticulturae 2024, 10, 767. [Google Scholar] [CrossRef]
- Blind, S. The Old Fruit Trees Cultivars, Du Mont Publishing House: Cologne, Germany, 2020; p.93.
- Enache, L. Agrometeorology, Sitech Publishing House: Bucharest, Romania, 2012; p. 80-92.
- DeJong, T. Concepts for Understanding Fruit Trees, CABI Publishing: Wallingford, U.K., 2022; p.125.
- Kokkotos, E.; Zotos, A.; Triantafyllidis, V.; Patakas, A. Impact of Fruit Load on the Replenishment Dynamics of Internal Water Reserves in Olive Trees. Agronomy 2024, 14, 1026. [Google Scholar] [CrossRef]
- Haberle, J.; Raimanová, I.; Svoboda, P.; Moulik, M.; Mészáros, M.; Kurešová, G. The Effect of Increasing Irrigation Rates on the Carbon Isotope Discrimination of Apple Leaves. Agronomy 2023, 13, 1623. [Google Scholar] [CrossRef]
- Mattar, M.A.; Soliman, S.S.; Al-Obeed, R.S. Effects of Various Quantities of Three Irrigation Water Types on Yield and Fruit Quality of ‘Succary’ Date Palm. Agronomy 2021, 11, 796. [Google Scholar] [CrossRef]
- Šimanský, V.; Kačániová, M.; Juriga, M.; Čmiková, N.; Borotová, P.; Aydın, E.; Wójcik-Gront, E. Impact of Soil Management Practices on Soil Culturable Bacteriota and Species Diversity in Central European a Productive Vineyard under Warm and Dry Conditions. Horticulturae 2024, 10, 753. [Google Scholar] [CrossRef]
- Salama, H.S.A.; Nawar, A.I.; Khalil, H.E.; Shaalan, A.M. Improvement of Maize Productivity and N Use Efficiency in a No-Tillage Irrigated Farming System: Effect of Cropping Sequence and Fertilisation Management. Plants 2021, 10, 1459. [Google Scholar] [CrossRef] [PubMed]
Figure 1.
Percentage of water consumption coverage from different sources for irrigation conditions in 2024.
Figure 1.
Percentage of water consumption coverage from different sources for irrigation conditions in 2024.
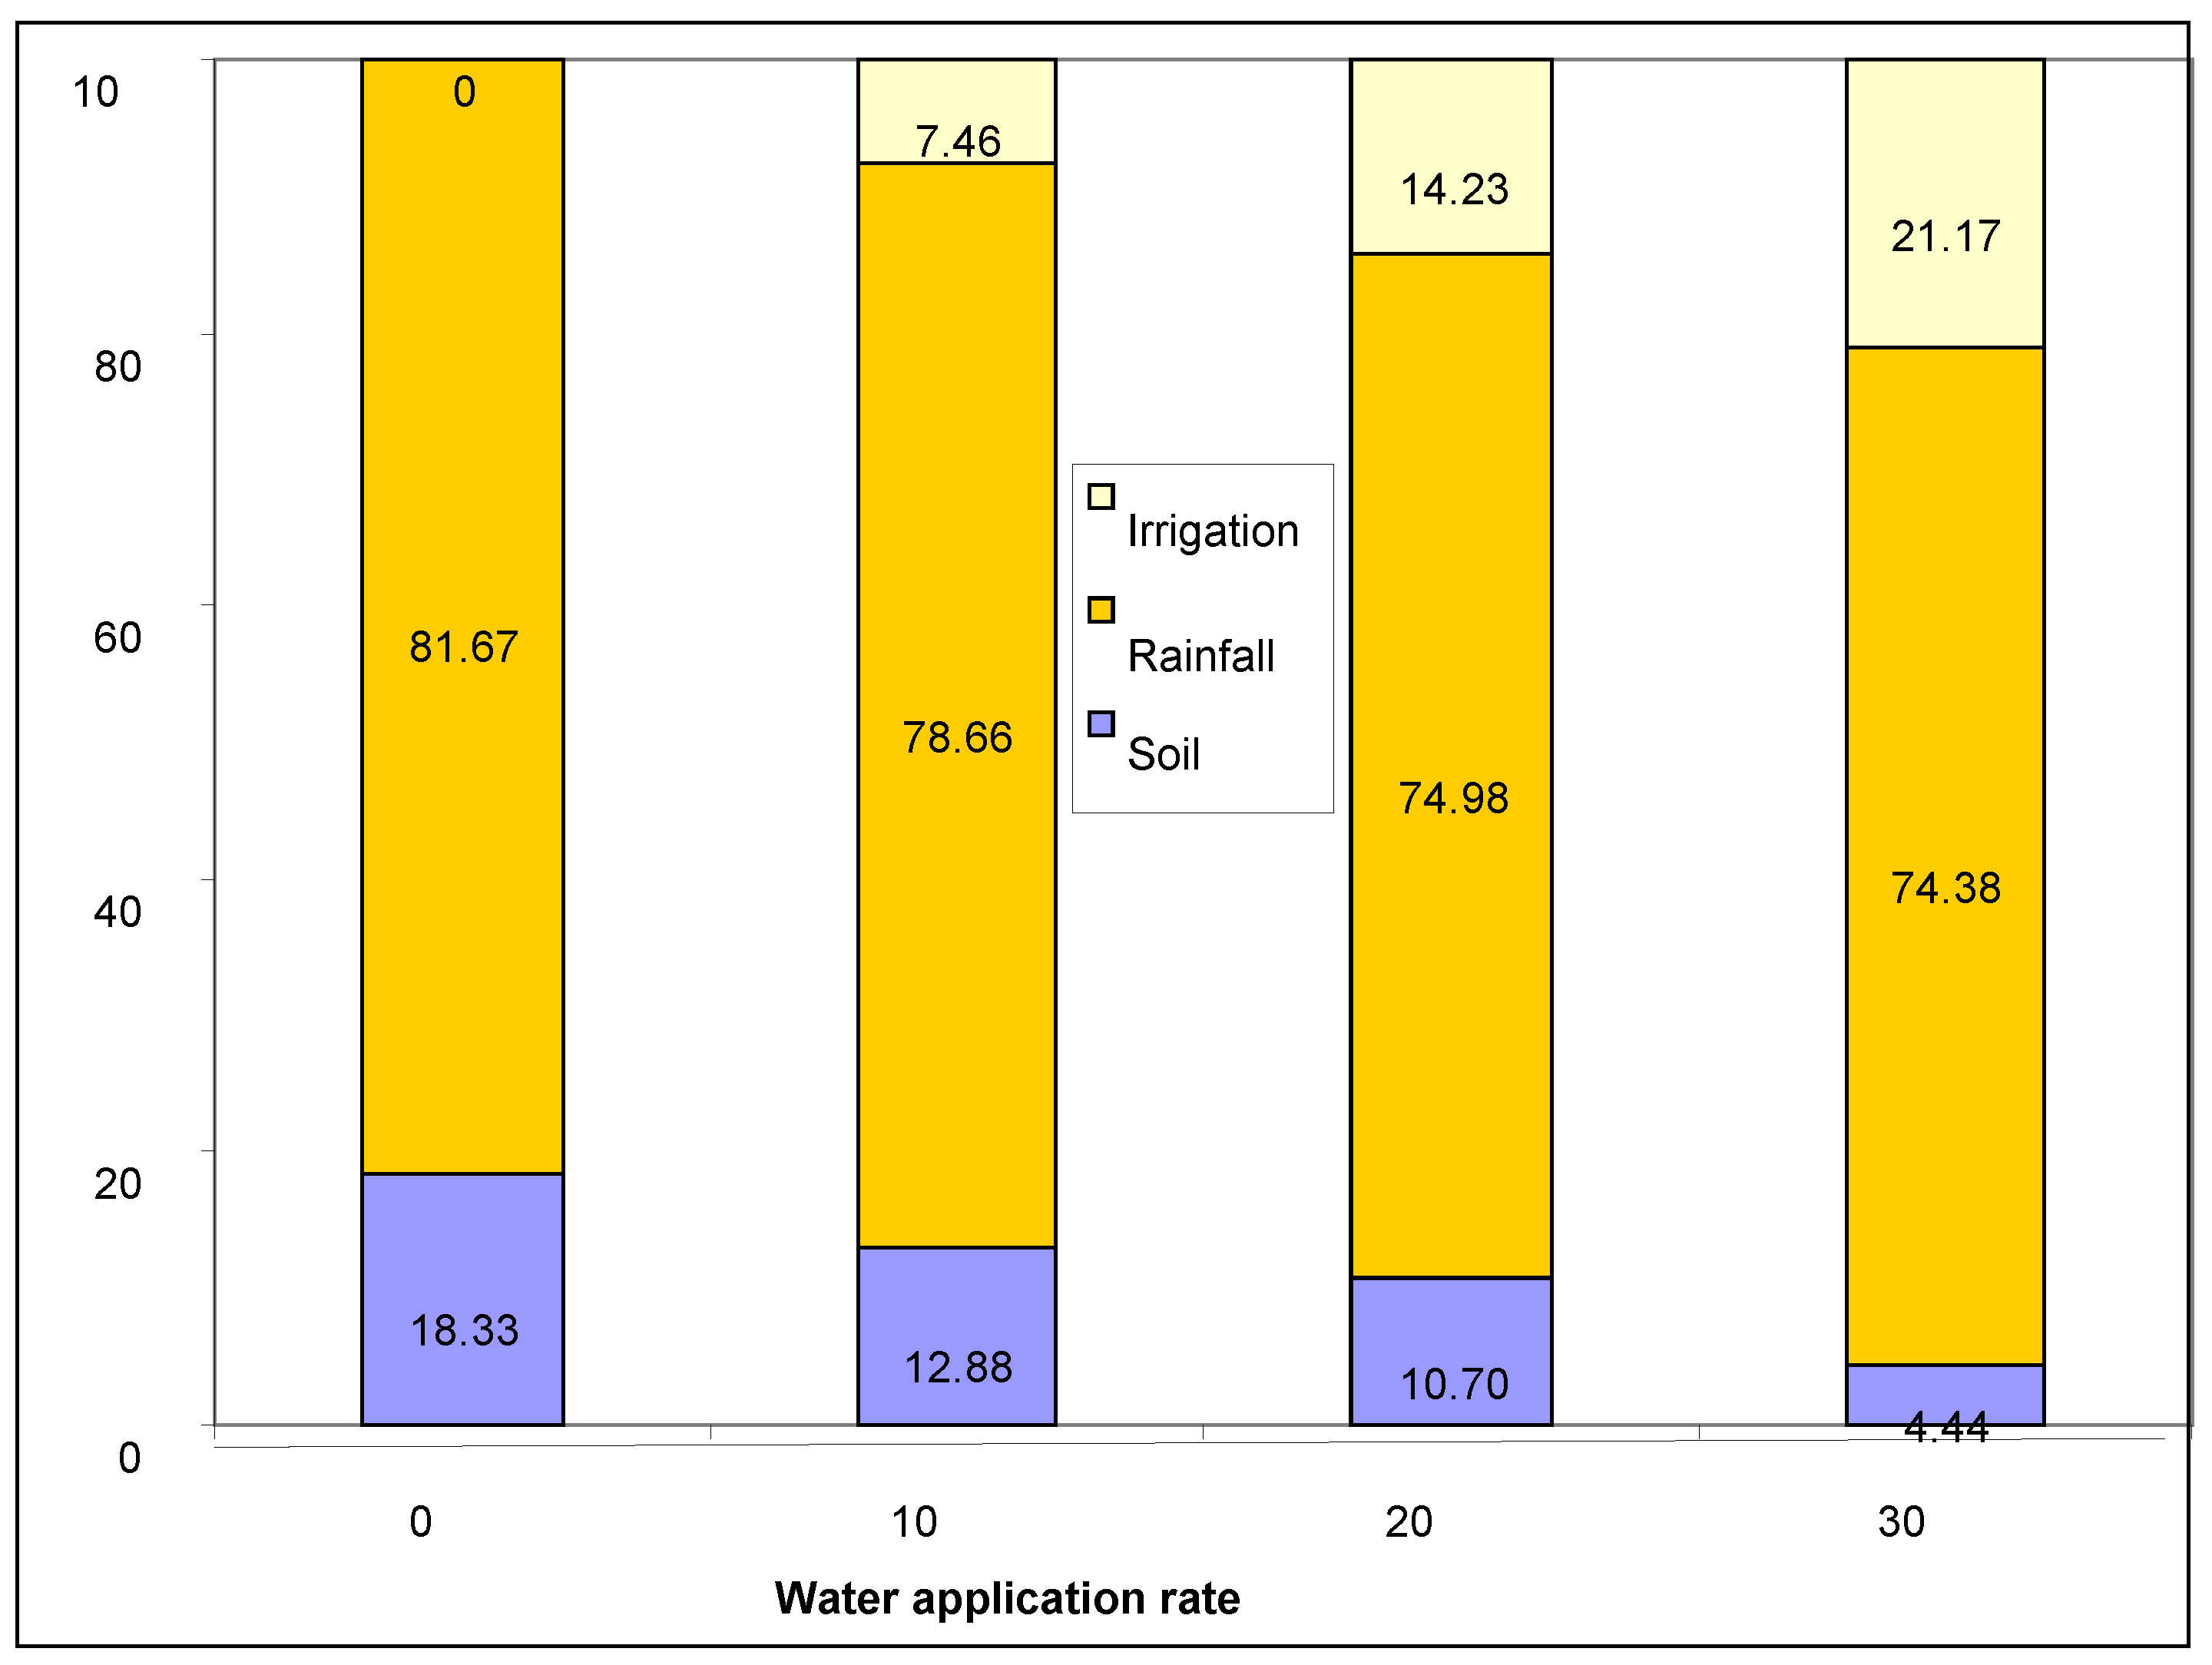

Table 1.
Average monthly temperatures and average monthly precipitation in 2024 (0 C).
| Month | I | II | III | IV | V | VI | VII | VIII | IX | X | XI | XII |
|---|---|---|---|---|---|---|---|---|---|---|---|---|
| Average monthly temperatures (0C) | -2.5 | -1.9 | 4.0 | 12.5 | 16.0 | 19.5 | 24.0 | 20.0 | 18.3 | 13.5 | 7.5 | -2.4 |
| Average monthly precipitations (l/m2) | 12.5 | 15.7 | 18.0 | 2.0 | 103.8 | 55.6 | 86.4 | 30.8 | 57 | 63 | 20.4 | 54.3 |
I-January, II-February, III-March, IV-April, V-May, VI-June, VII-July, VIII-August, IX-September, X-October, XI- November, XII- December.
Table 2.
Main physical properties of soil.
| Horizon | Depth (cm) | Granulometric composition (%) | Density g/cm³ | Porosity % | ||||
|---|---|---|---|---|---|---|---|---|
| 0.2-0.02 | 0.02-0.01 | 0.01-0.005 | 0.005-0.002 | |||||
| A | 0-10 | 0.9 | 46.6 | 10.2 | 8.4 | 33.9 | 1.47 | 45 |
| 10-20 | 0.9 | 46.6 | 9.6 | 10.6 | 32.3 | 1.41 | 48 | |
| 20-30 | 0.6 | 46.0 | 8.9 | 12.0 | 32.5 | 1,31 | 51 | |
| 30-40 | 0.5 | 35.6 | 16.6 | 13.3 | 34.0 | 1,3 | 51 | |
| 40-50 | 0.7 | 40.2 | 9.3 | 12.7 | 36.9 | 1.33 | 50 | |
| 50-60 | 0.7 | 35.3 | 12.2 | 12.5 | 39.3 | 1.50 | 45 | |
| Bt | 70-80 | 0.6 | 38.4 | 10.1 | 13.3 | 37.6 | 1.61 | 42 |
| 85-95 | 0.7 | 39.0 | 10.9 | 13.7 | 35.8 | 1.64 | 40 | |
| 105-115 | 0.8 | 37.2 | 11.8 | 15.1 | 35.1 | 1.63 | 40 | |
| 120-130 | 1.1 | 37.3 | 14.1 | 13.2 | 34.3 | 1.64 | 40 | |
| 140-150 | 1.0 | 39.0 | 16.4 | 11.0 | 32.6 | 1.63 | 40 | |
| B/C | 160-170 | 0.6 | 44.1 | 13.2 | 12.0 | 29.9 | 1.58 | 42 |
Table 3.
Main physical properties of the soil.
| Horizon | Depth (cm) | pH | Humus (%) |
|---|---|---|---|
| A | 0-10 | 5.75 | 1.85 |
| 10-20 | 6.40 | 1.47 | |
| 20-30 | 6.50 | 1.53 | |
| 30-40 | 6.50 | 1,45 | |
| 40-50 | 6.50 | 1.70 | |
| 50-60 | 6.50 | 1.41 | |
| Bt | 70-80 | 6.55 | 1.45 |
| 85-95 | 6.10 | 1.32 | |
| 105-115 | 6.05 | 1.24 | |
| 120-130 | 6.20 | 0.91 | |
| 140-150 | 6.30 | ||
| B/C | 160-170 | 6.35 |
Table 4.
Sources of water consumption coverage for different irrigation conditions in 2024.
| Year | Irrigation rate | Total water consumption (m³/ha) | Source of water consumption coverage (m3 /ha) | ||
|---|---|---|---|---|---|
| Soil | Rainfall | Irrigation | |||
| 2024 | 0 mm | 3.872 | 710 | 3.162 | - |
| 10 mm | 4.020 | 558 | 3.162 | 300 | |
| 20 mm | 4.217 | 455 | 3.162 | 600 | |
| 30 mm | 4.251 | 189 | 3.162 | 900 | |
Table 5.
Effect of irrigation on the production of grafted trees for the two apple cultivars.
| Watering norm x Cultivars | Grafting trees/ha | Relative values (%) | Difference/Significance | |
|---|---|---|---|---|
| Gala | ||||
| 10 mm – 0 mm | 38.357 | 22.855 | 167.83 | 15.502*** |
| 20 mm – 0 mm | 39.857 | 22.855 | 174.39 | 17.002*** |
| 30 mm – 0 mm | 48.118 | 22.855 | 210.54 | 25.263*** |
| 20 mm – 10 mm | 39.857 | 38.357 | 103.91 | 1.500* |
| 30 mm – 10 mm | 48.118 | 38.357 | 125.45 | 9.761*** |
| 30 mm – 20 mm | 48.118 | 39.857 | 120.73 | 8.261*** |
| Jonagold | ||||
| 10 mm – 0 mm | 45.690 | 17.046 | 268.04 | 28.644*** |
| 20 mm – 0 mm | 52.603 | 17.046 | 308.59 | 35.557*** |
| 30 mm – 0 mm | 55.070 | 17.046 | 323.07 | 38.024*** |
| 20 mm – 10 mm | 52.603 | 45.690 | 115.13 | 6.913*** |
| 30 mm – 10 mm | 55.070 | 45.690 | 120.53 | 9.380*** |
| 30 mm – 20 mm | 55.070 | 52.603 | 104.69 | 2.467** |
DL (LSD)5% =1.423 DL (LSD)1% =1.920 DL (LSD)0.1% =2.554.
Table 6.
Effect of cultivar on the production of grafted trees under different watering regimes.
| Cultivars x Watering norm | Grafting trees/ha | Relative values (%) | Difference/ Significance | |
|---|---|---|---|---|
| 0 mm | ||||
| Jonagold - Gala | 17.046 | 22.855 | 74.58 | -5.809000 |
| 10 mm | ||||
| Jonagold - Gala | 45.690 | 38.357 | 119.12 | 7.333*** |
| 20 mm | ||||
| Jonagold - Gala | 52.603 | 39.857 | 131.98 | 12.746*** |
| 30 mm | ||||
| Jonagold - Gala | 55.070 | 48.118 | 114.45 | 6.952*** |
DL (LSD)5%=1.662 DL (LSD)1%=2.290 DL (LSD)0,1%=3.148.
Table 7.
Effect of irrigation and fertilisation on grafted tree production.
| Watering norm | NPK dose | ||||
|---|---|---|---|---|---|
| N0 P0 K0 | N8 P8 K8 | N16 P16 K16 | N24 P24 K24 |  |
|
| 0 mm | z 0 d | y 20072 c | x 28777 b | x 30953 b | 19950+ 3883 |
| 10 mm | z 11428 c | y 45428 b | x 55143 a | x | 42023+ 3228 |
| 20 mm | z 19492 b | y 52143 a | x 56143 a | x | 46230+ 3027 |
| 30 mm | z 39132 a | y 53958 a | xy 56143 a | x 57143 a | 51594+ 598 |
|
24286+ 4237 | 48572+ 2379 | 50302+ 612 | 50429+ 198 | 39950+ 1602 |
Irrigation – DL (LSD)5% =2460; DL (LSD)1% =3254; DL (LSD)0.1% =4198; (a,b,c). Fertilisation – DL (LSD)5% =2679; DL (LSD)1% =35471; DL (LSD)0.1% =4582; (x,y,z).
Table 8.
Effect of irrigation on the production of grafted trees under different fertilisation regimes.
Table 8.
Effect of irrigation on the production of grafted trees under different fertilisation regimes.
| Watering norm x NPK | Grafting trees/ha | Relative values (%) | Difference/Significance | |
|---|---|---|---|---|
| N0P0K0 | ||||
| 10 mm – 0 mm | 11.428 | 0 | - | 11.428*** |
| 20 mm – 0 mm | 19.492 | 0 | - | 19.492*** |
| 30 mm – 0 mm | 39.132 | 0 | - | 39.132*** |
| 20 mm – 10 mm | 19.492 | 11.428 | 170.56 | 8.064*** |
| 30 mm – 10 mm | 39.132 | 11.428 | 342.42 | 27.704*** |
| 30 mm – 20 mm | 39.132 | 19.492 | 200.76 | 19.640*** |
| N8P8K8 | ||||
| 10 mm – 0 mm | 45.428 | 20.072 | 226.33 | 25.356*** |
| 20 mm – 0 mm | 52.143 | 20.072 | 259.78 | 32.071*** |
| 30 mm – 0 mm | 53.958 | 20.072 | 268.82 | 33.886*** |
| 20 mm – 10 mm | 52.143 | 45.428 | 114.78 | 6.715*** |
| 30 mm – 10 mm | 53.958 | 45.428 | 118.78 | 8.530*** |
| 30 mm – 20 mm | 53.958 | 52.143 | 103.48 | 1.815 |
| N16P16K16 | ||||
| 10 mm – 0 mm | 55.143 | 28.777 | 191.62 | 26.366*** |
| 20 mm – 0 mm | 56.143 | 28.777 | 195.10 | 27.366*** |
| 30 mm – 0 mm | 56.143 | 28.777 | 195.10 | 27.366*** |
| 20 mm – 10 mm | 56.143 | 55.143 | 101.81 | 1.000 |
| 30 mm – 10 mm | 56.143 | 55.143 | 101.81 | 1.000 |
| 30 mm – 20 mm | 56.143 | 56.143 | 100.00 | 0 |
| N24P24K24 | ||||
| 10 mm – 0 mm | 56.094 | 30.953 | 181,22 | 25.141*** |
| 20 mm – 0 mm | 57.143 | 30.953 | 184.61 | 26.190*** |
| 30 mm – 0 mm | 57.143 | 30.953 | 184.61 | 26.190*** |
| 20 mm – 10 mm | 57.143 | 56.094 | 101.87 | 1.049 |
| 30 mm – 10 mm | 57.143 | 56.094 | 101.87 | 1.049 |
| 30 mm – 20 mm | 57.143 | 57.143 | 100.00 | 0 |
DL (LSD)5%=2.460 DL (LSD)1%=3.254 DL (LSD)0,1%=4.198
Table 9.
Effect of fertilisation on the production of grafted trees under different watering regimes.
Table 9.
Effect of fertilisation on the production of grafted trees under different watering regimes.
| NPK dose x Watering norm | Grafting trees/ha | Relative values (%) | Difference/Significance | |
|---|---|---|---|---|
| 0 mm | ||||
| N8P8K8 – N0P0K0 | 20.072 | 0 | - | 20.072*** |
| N16P16K16– N0P0K0 | 28.777 | 0 | - | 28.777*** |
| N24P24K24 – N0P0K0 | 30.953 | 0 | - | 30.953*** |
| N16P16K16 – N8P8K8 | 28.777 | 20.072 | 143.37 | 8.705*** |
| N24P24K24 – N8P8K8 | 30.953 | 20.072 | 154.21 | 10.881*** |
| N24P24K24 – N16P16K16 | 30.953 | 28.777 | 107.56 | 2.176 |
| 10 mm | ||||
| N8P8K8 – N0P0K0 | 45.428 | 11.428 | 397.51 | 34.000*** |
| N16P16K16– N0P0K0 | 55.143 | 11.428 | 482.53 | 43.715*** |
| N24P24K24 – N0P0K0 | 56.094 | 11.428 | 490.85 | 44.666*** |
| N16P16K16 – N8P8K8 | 55.143 | 45.428 | 121.39 | 9.715*** |
| N24P24K24 – N8P8K8 | 56.094 | 45.428 | 123.48 | 10.666*** |
| N24P24K24 – N16P16K16 | 56.094 | 55.143 | 101.72 | 951 |
| 20 mm | ||||
| N8P8K8 – N0P0K0 | 52.143 | 19.492 | 267.51 | 32.651*** |
| N16P16K16– N0P0K0 | 56.143 | 19.492 | 288.03 | 36.651*** |
| N24P24K24 – N0P0K0 | 57.143 | 19.492 | 293.16 | 37.651*** |
| N16P16K16 – N8P8K8 | 56.143 | 52.143 | 107.67 | 4.000*** |
| N24P24K24 – N8P8K8 | 57.143 | 52.143 | 109.59 | 5.000*** |
| N24P24K24 – N16P16K16 | 57.143 | 56.143 | 101.78 | 1.000 |
| 30 mm | ||||
| N8P8K8 – N0P0K0 | 53.958 | 39.132 | 137.89 | 14.826*** |
| N16P16K16– N0P0K0 | 56.143 | 39.132 | 143.47 | 17.011*** |
| N24P24K24 – N0P0K0 | 57.143 | 39.132 | 146.03 | 18.011*** |
| N16P16K16 – N8P8K8 | 56.143 | 53.958 | 104.05 | 2.185 |
| N24P24K24 – N8P8K8 | 57.143 | 53.958 | 105.90 | 3.185* |
| N24P24K24 – N16P16K16 | 57.143 | 56.143 | 101.78 | 1.000 |
DL (LSD)5%=2.679 DL (LSD)1%=3.547 DL (LSD)0,1%=4.582
Table 10.
Effect of cultivar and fertilisation on the production of grafted trees.
| Cultivar | NPK dose | ||||
| N0P0K0 | N8P8K8 | N16P16K16 | N24P24K24 | |
|
| Gala | z 7286 b | y 43011 a | x 48629 a | x 50262 a | 37297+2491 |
| Jonagold | u 27740 a | z 42790 a | y 49474 a | x 50404 a | 42602+2028 |
|
24286+4237 | 48572+2379 | 50302+612 | 50429+198 | 39950+1602 |
Cultivar – DL (LSD)5%=1813; DL (LSD)1%=2398; DL (LSD)0,1%=3093; (a,b). Fertilization – DL (LSD)5%=1895; DL (LSD)1%=2508; DL (LSD)0,1%=3240; (x,y, z,u).
Table 11.
Effect of cultivar on the production of grafted trees under different fertilisation treatments.
Table 11.
Effect of cultivar on the production of grafted trees under different fertilisation treatments.
| Cultivars x NPK | Grafting trees/ha | Relative values (%) | Difference/Significance | |
|---|---|---|---|---|
| N0P0K0 | ||||
| Jonagold – Gala | 27740 | 7286 | 380.73 | 20454*** |
| N8P8K8 | ||||
| Jonagold – Gala | 42790 | 43011 | 99.49 | -221 |
| N16P16K16 | ||||
| Jonagold – Gala | 49474 | 48629 | 101.74 | 845 |
| N24P24K24 | ||||
| Jonagold – Gala | 50404 | 50262 | 100.28 | 142 |
DL (LSD)5%=1813 DL (LSD)1%=23984 DL (LSD)0,1%=3093
Table 12.
Effect of fertilisation on the production of grafted trees of the two cultivars.
| NPK dose x Variaties | Grafting trees/ha | Relative values (%) | Difference/ Significance | |
| Gala | ||||
| N8P8K8 – N0P0K0 | 43.011 | 7.286 | 590.32 | 35.725*** |
| N16P16K16– N0P0K0 | 48.629 | 7.286 | 667.43 | 41.343*** |
| N24P24K24 – N0P0K0 | 50.262 | 7.286 | 689.84 | 42.976*** |
| N16P16K16 – N8P8K8 | 48.629 | 43.011 | 113.06 | 5.618*** |
| N24P24K24 – N8P8K8 | 50.262 | 43.011 | 116.86 | 7.251*** |
| N24P24K24 – N16P16K16 | 50.262 | 48.629 | 103.36 | 1.633 |
| Jonagold | ||||
| N8P8K8 – N0P0K0 | 42.790 | 27.740 | 154.25 | 15.050*** |
| N16P16K16– N0P0K0 | 49.474 | 27.740 | 178.35 | 21.734*** |
| N24P24K24 – N0P0K0 | 50.404 | 27.740 | 181.70 | 22.664*** |
| N16P16K16 – N8P8K8 | 49.474 | 42.790 | 115.62 | 6.684*** |
| N24P24K24 – N8P8K8 | 50.404 | 42.790 | 117.79 | 7.614*** |
| N24P24K24 – N16P16K16 | 50.404 | 49.474 | 101.88 | 930 |
DL (LSD)5%=1.895 DL (LSD)1%=2.508 DL (LSD)0,1%=3.240
Disclaimer/Publisher’s Note: The statements, opinions and data contained in all publications are solely those of the individual author(s) and contributor(s) and not of MDPI and/or the editor(s). MDPI and/or the editor(s) disclaim responsibility for any injury to people or property resulting from any ideas, methods, instructions or products referred to in the content. |
© 2025 by the authors. Licensee MDPI, Basel, Switzerland. This article is an open access article distributed under the terms and conditions of the Creative Commons Attribution (CC BY) license (http://creativecommons.org/licenses/by/4.0/).
Copyright: This open access article is published under a Creative Commons CC BY 4.0 license, which permit the free download, distribution, and reuse, provided that the author and preprint are cited in any reuse.


