Submitted:
08 September 2025
Posted:
09 September 2025
You are already at the latest version
Abstract
This study aims to evaluate the impact of irrigation and fertilization practices on the density of grafted apple trees in nursery settings. The primary hypothesis posits that a customized approach delivering water and nutrients aligned with the young tree's distinct growth phases and physiological requirements will yield superior planting material compared to conventional nursery methods. The study was conducted at a privately operated nursery located in northwestern Romania. The research investigated the impact of two apple cultivars (Gala and Jonagold), four irrigation levels (0 mm, 10 mm, 20 mm, and 30 mm), and four fertilization treatments (N0P0K0, N8P8K8, N16P16K16, and N24P24K24) on fruit tree density in the nursery. In comparison to the Gala cultivar (93.50% ± 6.195), the Jonagold cultivar displayed a marginally higher tree density percentage (95.63% ± 4.790). With a 30 mm watering norm, the tree density was at its highest value (99.38% ± 1.295), and it gradually declined with decreasing watering norms. There was no statistically significant difference in the percentage of trees with different fertilization levels. The cultivars Gala (99.25% ± 1.650) and Jonagold (99.50% ± 0.827) had the highest density percentages under the 30 mm watering norm. The highest trees’ density was consistently attained at the 30 mm watering norm across all fertilization levels, according to the interaction between fertilization and watering norm. A 100% tree density was achieved by the combination of the Gala cultivar, the 30 mm watering norm, and N16P16K16 or N24P24K24 fertilization. The Jonagold cultivar achieved a 100% tree density at the 20 mm watering norm with N0 P0 K0 fertilization and at the 30 mm watering norm with N0 P0 K0 or N16 P16 K16 fertilization. N24P24K24 fertilization at 0 mm watering norm (89.00% ± 6.944) for the Gala cultivar had the lowest densities. According to these findings, the most important element in reaching the highest fruit tree density in the nursery is the 30 mm watering norm; in a few combinations involving both cultivars, a 100% density was noted.
Keywords:
irrigation
; fertilisation
; nursery
; apple cultivar
; fruit trees density
1. Introduction
The nursery phase is an important stage in the lives of grafted fruit trees, influencing their productivity and profitability in the orchard. Traditional nursery management usually employs a one-size-fits-all approach, providing uniform amounts of water and fertilizer to an entire block of trees. This approach, while simple, may fail to meet the specialized needs of individual trees or developmental stages, resulting in suboptimal growth and poor productivity. Grafted tree production success is dependent on a complex combination of irrigation, fertilizer, and cultivar selection. An optimal irrigation schedule can result in large output improvements, underscoring its critical role in nutrient transfer and plant vigor. Without sufficient irrigation, even in nutrient-rich soils, absorption is poor, limiting growth potential [1,2,3]. Regarding fertilisation, this is often the most important factor in explaining density variability. The proper application of nutrients is essential for promoting vegetative development (nitrogen), creating a strong root system (phosphorus), and boosting plant stress resistance (potassium). A well-defined fertilisation program can result in significant productivity improvements, often outweighing the influence of other factors like irrigation or cultivar [4,5]. Optimizing fertilizer doses is thus an essential component of the technology for growing high-quality nursery stock. The cultivar is the genetic foundation of production, determining the seedlings' suitability to local soil and climate conditions, as well as their resistance to disease and pests. Although it makes a smaller statistical contribution to production variability than fertilisation or irrigation, the cultivar impacts the tree's intrinsic growth potential and final quality. Choosing an adapted and vigorous cultivar reduces the need for remedial treatments while also ensuring long-term production stability. As a result, thorough cultivar selection is a critical first step toward nursery success. The key to producing high-quality seedlings and yielding optimally is to regulate these parameters carefully [6]. Evaluating the factors that may impede nursery owners from effectively integrating irrigation, fertilisation, and cultivar selection in grafted tree production necessitates an examination of various elements, including technical and financial acumen as well as the unique challenges posed by the agricultural environment [7]. Nursery owners may lack a comprehensive understanding of how all aspects interact. This comprehensive view, which is critical for maximizing productivity and quality, is acquired through years of hands-on experience. Without a thorough grasp of how an irrigation program affects nutrient absorption from a certain soil type, as well as how these interact with the genetic requirements of a specific cultivar, judgments may be suboptimal [8,9]. Another key consideration is financial. Implementing a high-performance irrigation system, purchasing premium fertilizers, and procuring certified planting material for certain cultivars can be costly expenses. Nursery operators with limited financial resources may be obliged to compromise and choose less efficient options. Furthermore, access to new technologies, such as drip irrigation systems or regular soil assessments, can be limited, too [10,11]. Unpredictable climate changes and poor soil quality can hamper the optimization procedure. Even with a well-established plan, nursery owners must adapt to a constantly changing environment [12]. A perfect fertilisation strategy, for example, may become useless after a lengthy period of drought, and a promising cultivar may be vulnerable to a new type of disease that appears in the region. These climatic and biological concerns make it more difficult to maintain a consistent approach while also handling these aspects efficiently [13]. The difficulty in combining irrigation, fertilizer, and cultivar in the production of grafted trees is not always due to a lack of will, but rather to several systemic problems such as knowledge gaps, economic restrictions, and the complexity of the natural environment. A successful strategy necessitates a mix of technical skill, financial investment, and the flexibility to react to change [14]. The current state of irrigation in Romanian nurseries is characterized by a substantial gap between the needs imposed by climatic change and the available technology level. This disparity has a direct impact on the quality and amount of planting material produced. A defining feature of the current scenario is the scarcity of new, high-performance irrigation equipment in many nurseries. There is a high reliance on obsolete technologies or rudimentary irrigation methods, resulting in significant water losses and decreased efficiency. Extreme weather events, such as lengthy droughts and heat waves, are becoming increasingly often and strong, exacerbating these technology limits. These climatic circumstances raise the need for water, which traditional systems cannot meet, resulting in poor seedling growth and lower planting material quality. This situation leads to the need for implementing an irrigation management. Irrigation management is a complex operation that involves more than just controlling the devices. It entails meticulous irrigation planning based on a thorough study of the cultivars' individual requirements, the stage of development, the soil type, and the meteorological circumstances [15,16,17]. Undeniably, irrigation constitutes a critical pillar for the success of any fruit tree nursery. Unlike other crops, young fruit trees in nurseries have specific needs and are much more sensitive to water shortages because their root system is still underdeveloped [18]. Proper water management at this early stage of life ensures vigorous growth and effective establishment in the orchard. As with all cultivated plants, the vegetative development of fruit trees in nurseries is largely dependent on climate and soil conditions [19,20]. Among essential factors, such as heat, light, air and minerals, water plays a particularly important role. In many tree parts, water accounts for between 75% and 85% (or even more) of their total weight [5]. Water is crucial for enduring horticultural productivity, but high water-use requirements and declining water supplies with the changing climate challenge economic viability, environmental sustainability, and social justice [21,22,23].
Beyond providing the necessary water, soil fertility in the nursery is an essential and decisive factor for the successful production of fruit trees. Therefore, correct fertilisation becomes a very important factor in increasing the yield and quality of planting material. The nutrient boosting strategy employed in nurseries encompasses a series of long-term measures designed to enhance the physical and chemical characteristics of the soil, thereby improving its overall fertility. The aim is to ensure the necessary supply of assimilable nutrients, adapted to the specific requirements of each species, rootstock, or cultivar/rootstock combinations, depending on the age and growth stages of the plants [24]. The key elements of a modern fertilisation system in fruit tree nurseries are: the accumulation of organic matter in the soil through crop rotation (fallow), the incorporation of special plants for green manure and the application of mineral fertilisers (nitrogen, phosphorus and potassium) [25]. It is important to note that the doses, timing and methods of fertiliser application are determined separately for each sector of the nursery. This differentiation is made according to the agrochemical properties of the soil and the specific needs of the cultivated plants. The most important principle of an efficient fertilisation system is the maximum utilisation and correct combination of fertilisers on horticultural land. In this system, fertilisers are considered an element of utmost importance, representing the main source of nutrients for horticultural plants during the growing season [26,27]. In nurseries, the lack of essential nutrients (nitrogen, phosphorus, potassium) causes significant deficiencies in the density and growth of seedlings. The annual consumption of nutrients from the soil is influenced by various factors specific to the experiment, such as climatic and edaphic conditions, the maintenance and tillage system, as well as the vigour of the rootstock-scion complex [28].
The apple species (Malus domestica) was chosen as the species for this study because of its outstanding adaptability to Romanian circumstances and consistent market demand for fruit trees. This versatility, as seen by its tolerance for a wide range of soils and Romania’s peculiar climatic variations, are making it a reference species in domestic fruit production [29]. Due to their considerable water demands, apple rootstocks are typically cultivated extensively in regions characterized by substantial rainfall. Although their root systems absorb large volumes of soil moisture to support the biosynthesis of organic compounds, only a small proportion is directly utilized by the rootstock, the rest being eliminated through transpiration [30]. Furthermore, the significant market demand for fruit trees motivates nursery owners' attempts to improve cultivation practices and increase production.
The practical importance of this study is to provide information to nursery owners. For a nursery owner, managing irrigation and fertilizer means lowering production expenses. Waste is minimized by determining each species' specific water and nutrient requirements. An intelligent irrigation system based on scientific data saves water and energy, while tailored fertilizer application lowers chemical prices. This efficient strategy boosts the profit margin for each seedling generated. Furthermore, a higher survival rate in the nursery decreases economic losses from non-viable planting material, allowing for more accurate production and revenue projections. Nursery owners might use the study's findings to design ways for adapting to drought or temperature swings to increase tree density.
2. Results and Discussion
2.1. Effect of Fertilisation, Watering Norm and Cultivar on Apple Trees Density
According to Figure 1, as the watering norm rises, the trees’ density for the Gala cultivar generally shows an upward trend. The trees’ density value is lowest at a watering norm of 0 mm, with a range of roughly 86 to 92 %. The trees’ density values are consistently higher at the highest watering norm of 30 mm, typically ranging from 95 to 100 %. The trees’ density is also influenced by the fertilisation treatments (N0P0K0, N8P8K8, N16P16K16, N24P24K24), with N24P24K24 frequently displaying the highest values within each watering norm. Additionally, as the watering norm rises, the Jonagold cultivar shows an increase in trees’ density. Like Gala cultivar, the lowest trees’ density values, which range from roughly 91 to 94%, are found at the 0 mm watering norm. The trees’ density values are highest at the 30 mm watering norm, regularly hitting 100 % or very nearly. The effects of the various fertilisation methods are also apparent, as N24P24K24 continuously displays high trees’ density values.
Jonagold shows higher trees’ density values than Gala under the same conditions when comparing the two cultivars. At higher watering norms, this difference becomes more noticeable. At the given watering norms, Jonagold often reaches 100 % trees’ density, whereas Gala reaches a maximum of roughly 100 % but has a wider range of values. Overall, the findings indicate that a higher percentage of tree density is positively correlated with both using the Jonagold cultivar and raising the watering norm.
2.2. Effect of Water Norm and Cultivar on Apple Trees Density
Jonagold typically shows higher density values than Gala under the same conditions when comparing the two cultivars, according to Figure 2. At higher watering norms, this difference becomes more noticeable. At the given watering norms, Jonagold often reaches 100 % density, whereas Gala reaches a maximum of roughly 100 % but has a wider range of values. Overall, the findings indicate that a higher percentage of tree density is positively correlated with both using the Jonagold cultivar and raising the watering norm.
2.3. Effect of Fertilisation and Cultivar on Apple Trees Density
Across the various fertilisation treatments, the density values for the Gala cultivar remain comparatively constant (Figure 3). At roughly 94%, N0 P0 K0 and N8 P8 K8 and exhibit higher values. The values of trees’ density for the N16P16K16 and N24P24K24 treatments range from 93 % to 93.5 %. Conversely, the Jonagold apple cultivar shows a more noticeable fertilisation-based variation in trees’ density. At roughly 97.5 %, the N0 P0 K0 treatment produces the highest density for this cultivar. The values then drop for N8P8K8 and N16P16K16, reaching roughly 93 and 95%.
When comparing the two apple cultivars, Jonagold generally shows higher density values than Gala under the same fertilisation treatment. The most significant difference is noticed with the N0 P0 K0 treatment, where Jonagold reaches approximately 97.5 % compared to Gala, approximately 94 %. The difference is less pronounced for the other fertilisation treatments.
2.4. Effect of Watering Norm and Fertilisation on Apple Trees Density
There is a consistent pattern across all fertilisation treatments: the trees’ density rises in tandem with the watering norm (Figure 4). The 0 mm watering norm yields the lowest density values, which range from roughly 89 % to 95 %. The 30 mm watering norm consistently yields the highest density values, with values approaching or surpassing 100 % for all fertilisation treatments.
There are some differences when the fertilisation treatments are compared. With trees’ density beginning higher at 0 mm and then sharply increasing with higher watering norms, the N0 P0 K0 and N24P24K24 treatments exhibit a similar pattern. In comparison to N0 P0 K0 and N24P24K24, the N8 P8 K8 and N16P16K16 treatments exhibit lower trees’ density values at the 0 mm and 10 mm watering norms. All fertilisation treatments produce high trees’ density at the 30 mm watering norm, with N16P16K16 and N24P24K24 displaying values at or close to 100%.
2.5. Classification of Apple Cultivars Based on Water and Fertilisation Treatments
The grafted apple trees’ density for different levels of factor interactions can be classified using the Lp-norm. The Lp-Norm was calculated using the general p-space normalization formula: . The values of the grafted apple trees’ density for each factor level were scaled (i.e., normalized) in the range [0; 1] with the formula . In our case, p = 2.5 was considered and we derive the values for the interaction factor Cultivar*Water_Norm*Fertilisation in Table 3 and Figure 5, Figure 6, Figure 7, Figure 8, Figure 9 and Figure 10.
Quartiles of Lp-Norm for the interaction factor Cultivar*Water_Norm*Fertilisation perform values, in decreasing order of tree density, from: 4, with Lp-Norm values range [0.9901; 1.0000]; 3, with Lp-Norm values range [0.9510, 0.9901]; 2, with Lp-Norm values range [0.9206; 0.9810] and 1, with Lp-Norm values range [0.8652; 0.9206].
The interactions between factors: fertilisation (N0 P0 K0, N8 P8 K8, N16P16K16, N24P24K24) and cultivar (Gala and Jonagold) at various watering norms (0 mm, 10 mm, 20 mm, and 30 mm) are shown in Figure 5 and Figure 6. Particularly with N16P16K16 and N24P24K24 fertilisation, the 'Lp-Norm' values for the Gala cultivar are low at 0 mm and 10 mm watering norms but greatly increase at 20 mm and 30 mm. Conversely, the Jonagold cultivar exhibits greater 'Lp-Norm' values at the 0 mm and 10 mm watering norms, especially when fertilized with N0 P0 K0 and N8 P8 K8. With lower values for Gala at low watering norms and higher values at high watering norms, the patterns for "Quartiles" are comparable to those for "Lp-Norm.". Jonagold displays a range of values, with high "Quartiles" at watering norms of 20 and 30 mm.
The Gala cultivar exhibits very low values at 0 mm and 10 mm watering norms and very high values at 30 mm for both 'Lp-Norm' and 'Quartiles'. The Jonagold cultivar exhibits a distinct pattern, exhibiting a range of low and high values across the various watering norms.
The combined impact of fertilisation and watering norm is examined in the final heatmap. The N0P0K0 fertilisation treatment exhibits higher values at 10 mm watering norm, but otherwise the values are low at the 0 mm and 10 mm watering norms. The values are primarily high at the 20 mm and 30 mm watering norms, with the 30 mm watering norm exhibiting the deepest red hues across all fertilisation treatments. This suggests that there is a strong correlation between higher values for the measured parameter and a higher watering norm.
The results of this study consistently confirm the basic premise that a personalized approach to water and nutrient delivery considerably increases the production of grafted apple trees in a nursery setting. One important finding is the unmistakable positive relationship between higher tree density percentages and rising watering norms. At the 30 mm watering norm, the mean tree density rose dramatically to 99.38 % from the 0 mm watering norm of 91.00 %. This pattern holds true for all fertilisation treatments and cultivars, including Gala and Jonagold. The 30 mm watering norm consistently produced the highest tree density values, and certain combinations—like Gala with N16P16K16 and N24P24K24 fertilisation and Jonagold with N0P0K0 and N16P16K16 fertilisation—achieved a maximum of 100%. A change from lower values from 0 mm and 10 mm watering norms to higher values at 20 mm and 30 mm is also visually confirmed by the heatmaps. The cultivar is another important consideration. In comparison to the Gala cultivar (93.50 %), the Jonagold cultivar consistently displayed a higher mean tree density (95.63 %). When considering the interaction with fertilisation, this difference becomes even more noticeable. Jonagold with N0 P0 K0 fertilisation had the highest mean tree density at 97.75 %, whereas Gala had 93.75 % under the same conditions. The fertilisation treatments' interactions with cultivars and watering norms are noteworthy, even though they did not statistically differ in the overall mean tree density. For instance, when compared to other fertilisation treatments, the N0 P0 K0 treatment produced a higher tree density for both cultivars at the 0 mm watering norm. All fertilisation treatments, however, produced high tree densities for both cultivars at the standard watering of 30 mm, with some even reaching 100%. All these findings point to the watering norm as the most important factor.
The 4th quartile, which has the highest level of tree density, contains samples with all water norm with 30 mm and high fertilisation levels for both analysed cultivars, but the samples of Jonagold 20 mm*NPKv0 and 30 mm*NPKv0 which are without irrigation (Table 1 and Figure 10). The 3rd quartile, which has the second highest level of tree density, contains samples with water norm with 10 mm and 20 mm and with high fertilisation levels for both analysed cultivars, but the samples of Jonagold 10 mm*NPKv0 and Gala 0mm*NPKv0 which are without fertilisation. The 2nd quartile, contains samples with water norm with 0 mm, 10 mm and 20 mm and with all fertilisation levels for both analysed cultivars. This fact prescribes that the Lp-Norm classification method is successful for classification of the grafted apple trees’ density within the levels of the interaction factor Cultivar*Water_Nnorm*Fertilisation. Furthermore, the distribution of analysed factors over the Lp-Norm values and Lp-Norm quartiles proves that the Water_Norm factor performs the main effect over the grafted apple trees’ density.
3. Materials and Methods
3.1. Climate and Soil Conditions of the Research Location
The research was conducted in a private nursery in north-western Romania. Climatic conditions were characterised using data sourced from the Meteorological Station of Oradea, situated approximately 5 km southeast of the research site. In 2024, the average annual temperature was 10.7º C. The coldest month in 2024 was January, with an average temperature of –2.5º C, and the warmest month was July, with an average temperature of 24º C. The highest amount of precipitation was recorded in May, totalling 103.8 mm, whereas the lowest precipitation was observed in January 2024, with 12.5 mm, as shown in Table 2. Late spring frosts are common in March, given Romania's climate. Early autumn frosts rarely occur in September, but are common in October and November. Late spring frosts occasionally occur as unexpected climatic events, posing a threat to the normal growth and development of grafted trees. In contrast, early autumn frosts have a minimal adverse impact, as they typically coincide with the end of the grafted trees' vegetative cycle.
Geomorphologically, the experimental field features a predominantly flat terrain, subtly disrupted by depressions and gravel banks—elements characteristic of floodplain landscapes. A distinctive characteristic of the area is the presence of rolled gravel banks scattered throughout, appearing across all types of micro-relief—whether on gravel ridges, within depressions, or on flat terrain. The experiment involves soils of various textures, formed by fluvial deposits, particularly coarse, and fluvial gravel in various stages of evolution: from young, unevolved soils (alluvial soils – Aluviosols) to cambisols (Eutricambosols) and Preluvosols (former brown clayey alluvial soils). The experiment was carried out on a Preluvosol soil, distinguished by its layered composition, featuring an ochric horizon (Ao), an argic horizon (Bt), which exhibits clay accumulation resulting from migration from the upper layers, and a C horizon, representing the parent rock. The Ao horizon, 20–25 cm thick, is lighter in colour—typically brown or light brown; the Bt horizon, measuring approximately 75 cm in thickness, is characterized by significant clay accumulation and exhibits a more yellowish hue in its upper section. Beneath it, the C horizon consists of unconsolidated rock material. The soil reaction is acidic to slightly acidic, with a pH between 5.75 and 6.35 in the Ao and Bt horizons.
The humus content in the topsoil layer (0–10 cm) reaches 1.85 % due to more intensive fertilisation. This value declines to 1.41% at a depth of 50–60 cm, marking the beginning of the subsoil layer. Within the subsoil (up to 115 cm depth), humus levels fluctuate between 1.46 % and 1.70 %, consistently remaining above 1%.
3.2. Research Methods and Biological Material Used
To achieve the research objectives, a comprehensive experimental framework was employed, structured as a three-factor factorial design of type 4 × 2 × 4. The study was conducted in five replications, with each plot containing four trees arranged at a density of 0.7× 0.25 m. Irrigation served as the primary factor in the study, encompassing four treatments: no irrigation, and irrigation levels of 10 mm, 20 mm, and 30 mm. The apple cultivars Gala and Jonagold were treated as the secondary factor, while fertilisation was evaluated as the tertiary factor. To obtain the NPK doses corresponding to the fertilisation treatments, complex fertiliser 16:16:16 was used in the following quantities (kg/ha): 50 kg for N8P8K8; 100 kg for N16P16K16; 150 kg for N24P24K24. The fertilizer is water-soluble and is produced by Azomureș, a Romanian manufacturer.
The initial biological material for the study consisted of MM 106 apple layer classified under the 'Certified' category. Dormant buds from the Gala and Jonagold cultivars were used for grafting.
Both Gala and Jonagold apples are among the most widely cultivated apple varieties, but they differ significantly in their fruit and tree characteristics. Gala is an autumn cultivar, producing medium-sized fruit with a thin, intense red skin and a predominantly sweet taste. Jonagold, a winter cultivar, yields much larger fruit with a yellowish-green skin partially covered in red, and is noted for its balanced, sweet-tart flavor. While the crisp, fine flesh of the Gala apple makes it ideal for immediate consumption, the semi-crisp and very juicy flesh of the Jonagold, combined with its excellent storage life, makes it suitable for both fresh eating and processing. In short, Gala is preferred for its sweet and delicate taste, while Jonagold is valued for its generous size and complex, perfectly balanced flavor. Both apple cultivars adapt well to the climatic conditions of Romania, especially in hilly areas [29].
Fertigation was performed using a drip system equipped with hoses measuring 16 mm in diameter and 0.4 mm in wall thickness. This hose was equipped with drippers positioned at intervals of 25 cm. Each dripper had four outlet holes and ensured a flow rate of 2 l/hour at a pressure of 1 bar. The daily duration of irrigation varied according to the desired irrigation rate: for a rate of 10 mm, irrigation lasted 3.5 hours; for a rate of 20 mm, the duration was 7 hours; for a rate of 30 mm, irrigation lasted 10.5 hours. The timing of fertigation was determined based on soil moisture variation and the minimum threshold (19.85%) for the variant irrigated with 10 mm. The soil moisture was measured with the HD2 moisture meter, a portable device for measuring soil moisture, produced by IMKO GmbH, Germany. Thus, to establish the fruit tree density, fertigation was applied in 2024 on 20 July, 17 August, 20 August and 23 August. Fertigation took place in the early morning (between 4:00 and 8:00 a.m.) to reduce water loss due to evaporation. The method is inefficient at midday due to heat and wind. A reservoir was used to create a concentrated blend of water-soluble fertilizer.
The density of grafted trees per hectare was determined by the number of seedlings in the plot that had suitable vigour to be used as planting material (higher than 1 meter and healthy). To ascertain the significance of the differences between the gradations and combinations of the three factors, the experimental data was processed using three-way ANOVA (P = 0.05) and Lp-norm (N = 5). The analysed factors were: Cultivar, with two levels Gala and JonaGold; Water_Norm, with four levels: 0mm (i.e., without any irrigation), 10 mm, 20 mm and 30 mm and Fertilisation with four levels: NPKv0 (i.e., without any fertilizers), NPKv8, NPKv16 and NPKv24.
Statistical analysis of grafted trees density was conducted through XLSTAT v27.1.3.0 (Lumivero LLC, 1331 17th Street, Suite 404, Denver, CO 80202, USA).
3.3. Water Consumption for Different Irrigation Conditions
Considering water consumption across various irrigation methods, the analysis identified how precipitation, soil moisture reserves, and irrigation standards contribute to meeting the water requirements of apple seedlings (Table 3).
In 2024, for the non-irrigated variant, seedlings relied on useful precipitation in a proportion of 81.67% and on the internal soil reserve in an amount of 18.33% to meet their water requirements, as shown in Figure 11. Under the 10 mm irrigation regime, water consumption was covered by precipitation (76.66%), soil reserves (12.88%) and irrigation (7.46%). In terms of water consumption coverage for the variant irrigated with a watering rate of 20 mm, there was a slight reduction in the contribution of precipitation (74.98%) and soil reserves (10.70%) against a significant increase in the contribution of irrigation (14.23%), compared to the 10 mm irrigation rate. Changing the irrigation rate from 20 to 30 mm led to a reduction in the contribution of soil water (4.44%) associated with a constant contribution of precipitation and an increase in the contribution of irrigation (21.17%) to meet the water requirements of the seedlings.
4. Conclusions
The analysis of the provided data reveals a clear and significant relationship between the factors studied and tree density. The most influential factor in achieving a high percentage of tree density is the watering norm. A higher watering norm, specifically 30 mm, consistently resulted in the highest tree density percentages across all cultivars and fertilisation treatments. Some combinations, such as the Gala cultivar with N16P16K16 and N24P24K24 fertilisation, and the Jonagold cultivar with N0P0K0 and N16P16K16 fertilisation, achieved a maximum tree density of 100%.
While the findings are compelling, the regional distinctiveness and small number of cultivars pose a potential barrier to generalizability. Future research should broaden the scope to include more apple cultivars and geographic regions to validate these findings across varied pedoclimatic situations. Furthermore, more research into the long-term impact of these treatments on the survivability and productivity of grafted trees after transplantation to orchards will benefit the entire fruit-growing sector.
Author Contributions
Conceptualization, A.V. and A. C. T.; methodology, A. P..; software, A. C. T.; validation, A. P. and A. C. T.; formal analysis, A.V.; investigation, A. P.; resources, A.V.; data curation, A.P.; writing—original draft preparation, A. C. T.; writing—review and editing, A.V and A. P.; visualization, A.V.; supervision, A. P. and A. C. T.; project administration, A.V.; funding acquisition, A.V. All authors have read and agreed to the published version of the manuscript.
Funding
The APC was funded by the University of Oradea.
Data Availability Statement
The raw data supporting the conclusions of the article will be made available by the authors on request.
Conflicts of Interest
The authors declare no conflicts of interest.
References
- Spinelli, G.; Bonarrigo, A.C.; Cui, W.; Grobowsky, K.; Jordan, S.H.; Ondris, K.; García, C.P.; Redding, K.; Waldman, K.Z.; Dahlke, H.E. Evaluating the distribution uniformity of ten overhead sprinkler models used in container nurseries. Agric. Water Manag. 2024, 303. [Google Scholar] [CrossRef]
- Tardivo, C.; Patel, S.; Bowman, K.D.; Albrecht, U. Nursery Characteristics and Field Performance of Nine Novel Citrus Rootstocks under HLB-endemic Conditions. HortScience 2025, 60, 931–939. [Google Scholar] [CrossRef]
- Wei, H.; Xu, W.; Kang, B.; Eisner, R.; Muleke, A.; Rodriguez, D.; Devoil, P.; Sadras, V.; Monjardino, M.; Harrison, M.T. Irrigation with Artificial Intelligence: Problems, Premises, Promises. Human-Centric Intell. Syst. 2024, 4, 187–205. [Google Scholar] [CrossRef]
- Mir, M.S.; Raja, W.; Kanth, R.H.; Dar, E.A.; Shah, Z.A.; Bhat, M.A.; Mir, A.H.; Wani, F.J.; Bhat, T.A.; Bhat, J.A.; et al. Optimizing irrigation and nitrogen levels to achieve sustainable rice productivity and profitability. Sci. Rep. 2025, 15, 1–25. [Google Scholar] [CrossRef]
- Kumawat, K.L.; Raja, W.H.; Nabi, S.U. Quality of Nursery Trees Is Critical for Optimal Growth and Inducing Precocity in Apple. Appl. Fruit Sci. 2024, 66, 2135–2143. [Google Scholar] [CrossRef]
- Kumawat, K.; Raja, W.; Chand, L.; Rai, K.; Resources, R.S.I.-N.B.O.P.G.; Lal, S. Influence of plant growth regulators on growth and formation of sylleptic shoots in one-year-old apple cv. Gala Mast. J. Environ. Biol. 2023, 44, 122–133. [Google Scholar] [CrossRef]
- Chu, L.; Liu, D.; Li, C.; Liu, J.-H. Dwarfing of fruit trees: from old cognitions to new insights. Hortic. Adv. 2025, 3, 1–15. [Google Scholar] [CrossRef]
- Aglar, E.; Ozturk, B.; Saracoglu, O.; Long, L.E.; Yildiz, K.; Gun, S.; Has, S. Rootstock and Training Effects on Growth and Fruit Quality of Young ‘0900 Ziraat’ Sweet Cherry Trees. Appl. Fruit Sci. 2024, 66, 61–70. [Google Scholar] [CrossRef]
- Hasan, M.U.; Malik, A.U.; Saleem, B.A.; Anwar, R.; Khalid, S.; Khan, A.S.; Nasir, M. Supplementation of Potassium and Phosphorus Nutrients to Young Trees Reduced Rind Thickness and Improved Sweetness in ‘Kinnow’ Mandarin Fruit. Erwerbs-Obstbau 2023, 65, 1657–1666. [Google Scholar] [CrossRef]
- Nečas, T.; Wolf, J.; Kiss, T.; Göttingerová, M.; Ondrášek, I.; Venuta, R.; Venuta™, K.P.F.N.; Laňar, L.; Letocha, T. Improving the quality of nursery apple and pear trees with the use of different plant growth regulators. Eur. J. Hortic. Sci. 2020, 85, 430–438. [Google Scholar] [CrossRef]
- Wolf, J.; Kiss, T.; Ondrášek, I.; Nečas, T. Induction of Lateral Branching of Sweet Cherry and Plum in Fruit Nursery. Not. Bot. Horti Agrobot. Cluj-Napoca 2019, 47, 962–969. [Google Scholar] [CrossRef]
- Sayyad-Amin, P. A Review on Breeding Fruit Trees Against Climate Changes. Erwerbs-Obstbau 2022, 64, 697–701. [Google Scholar] [CrossRef]
- Ferreira, C.S.S.; Soares, P.R.; Guilherme, R.; Vitali, G.; Boulet, A.; Harrison, M.T.; Malamiri, H.; Duarte, A.C.; Kalantari, Z.; Ferreira, A.J.D. Sustainable Water Management in Horticulture: Problems, Premises, and Promises. Horticulturae 2024, 10, 951. [Google Scholar] [CrossRef]
- Neupane, K.; Witcher, A.; Baysal-Gurel, F. An Evaluation of the Effect of Fertilizer Rate on Tree Growth and the Detection of Nutrient Stress in Different Irrigation Systems. Horticulturae 2024, 10, 767. [Google Scholar] [CrossRef]
- Thakur, S.; Sharma, N.C.; Kumar, P.; Verma, P.; Singh, U.; Verma, P. Optimisation of budding timing and methods for production of quality apricot nursery plants. J. Hortic. Sci. Biotechnol. 2025, 1–18. [Google Scholar] [CrossRef]
- Carr, M. IRRIGATION RESEARCH: DEVELOPING A HOLISTIC APPROACH. Acta Hortic. 2000, 733–739. [Google Scholar] [CrossRef]
- Rosa, L.; Ragettli, S.; Sinha, R.; Zhovtonog, O.; Yu, W.; Karimi, P. Regional irrigation expansion can support climate-resilient crop production in post-invasion Ukraine. Nat. Food 2024, 5, 684–692. [Google Scholar] [CrossRef]
- Nicolae, S. , Butac M., Chivu M. Comparative Study in the Nursery of Vegetative Plum Rootstocks, 'Mirodad 1’ and 'Saint Julien A’. Scientific Papers. Series B, Horticulture, 2024, Vol. Lxviii, Issue 1, Print ISSN 2285-5653, 94-98.
- Ray, S. , Majumder, S. Water management in agriculture: Innovations for efficient irrigation. Modern agronomy, 2024, 169-185.
- Heera, J. Challenges Encountered by Nursery Owners When Producing Seedlings. Indo-American Journal of Agricultural and Veterinary Sciences, 2025, 13(2), 1-10.
- Oyedele, O.O.; Adebisi-Adelani, O.; Amao, I.O.; Ibe, R.B.; Arogundade, O.; Amosu, S.A.; Alamu, O.O. Knowledge Uptake of Stakeholders in Fruit Tree Production Training in Ibadan, Oyo State. J. Agric. Ext. 2025, 29, 101–110. [Google Scholar] [CrossRef]
- Lian, H.N.; Sema, A.; Singh, B.; Sarkar, A.; Konjengbam, R. Nursery Performance of Khasi Mandarin On Different Citrus Rootstocks in Northeast India. Appl. Fruit Sci. 2025, 67, 1–9. [Google Scholar] [CrossRef]
- Kour, R. , Alavekar, M. S., Singh, R. P., Singh, D. Nursery Management and Disease Control. Horticulture Crops, 2025, 174.
- Dominguez, L.I.; Robinson, T.L. Effects of Tree Lateral Branch Number and Angle on Early Growth and Yield of High-density Apple Trees. HortTechnology 2025, 35, 191–201. [Google Scholar] [CrossRef]
- Mayer, J. My Little Fruit Tree, Franckh Kosmos Publishing House: Stuttgart, Germany, 2019; p. 113.
- Zahir, S.A.D.M.; Jamlos, M.F.; Omar, A.F.; Nordin, M.A.H.; Raypah, M.E.A.; Mamat, R.; Jamlos, M.A.; Muncan, J. Quantifying the impact of varied NPK fertilizer levels on oil palm plants during the nursery stage: A Vis-NIR spectral reflectance analysis. Smart Agric. Technol. 2025, 11. [Google Scholar] [CrossRef]
- Choi, S.-H.; Kim, D.-Y.; Lee, S.Y.; Lee, K.H. Effect of Nutrient Management During the Nursery Period on the Growth, Tissue Nutrient Content, and Flowering Characteristics of Hydroponic Strawberry in 2022. Horticulturae 2024, 10, 1227. [Google Scholar] [CrossRef]
- Rotowa, O.J.; Małek, S.; Jasik, M.; Staszel-Szlachta, K. Substrate and Fertilization Used in the Nursery Influence Biomass and Nutrient Allocation in Fagus sylvatica and Quercus robur Seedlings After the First Year of Growth in a Newly Established Forest. Forests 2025, 16, 511. [Google Scholar] [CrossRef]
- Chira, L.; Pașca, I. Apple Trees Growing, MAST Publishing House: Bucharest, Romania, 2004; p. 37.
- Blind, S. The Old Fruit Trees Cultivars, Du Mont Publishing House: Cologne, Germany, 2020; p. 93.
Figure 1.
Interaction between fertilisation, watering norm and cultivar.
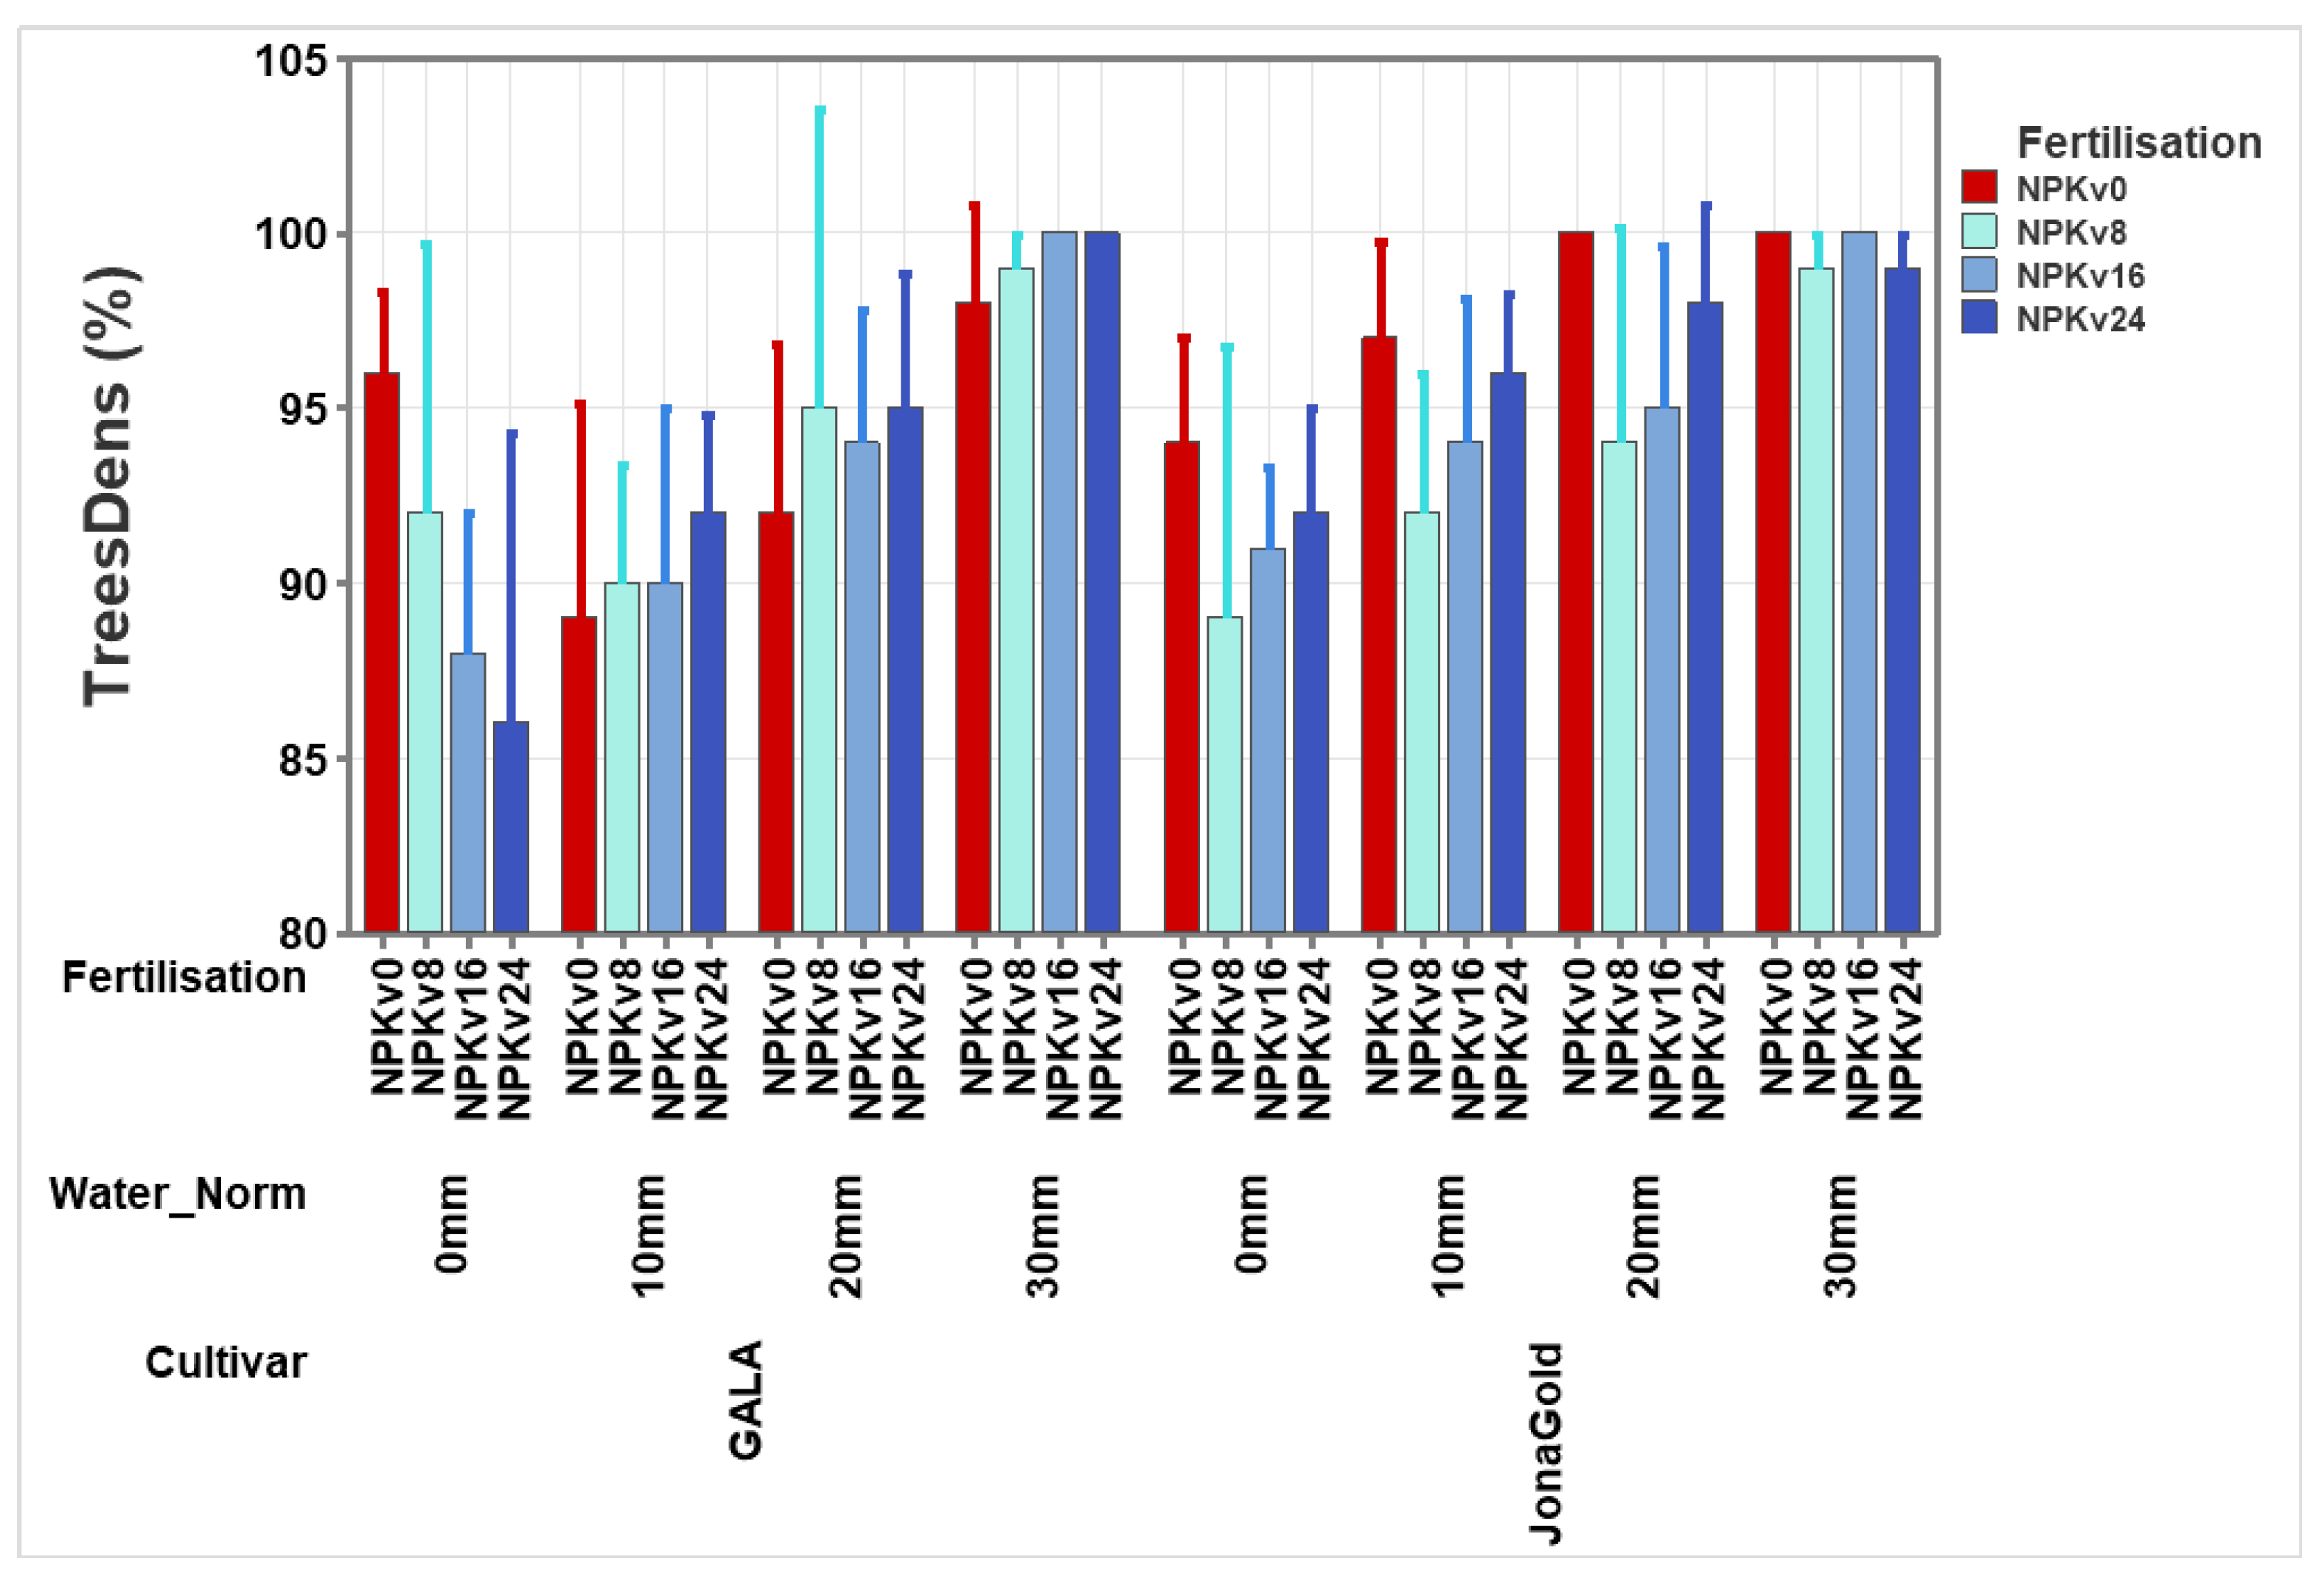
Figure 2.
Interaction between watering norm and cultivar.
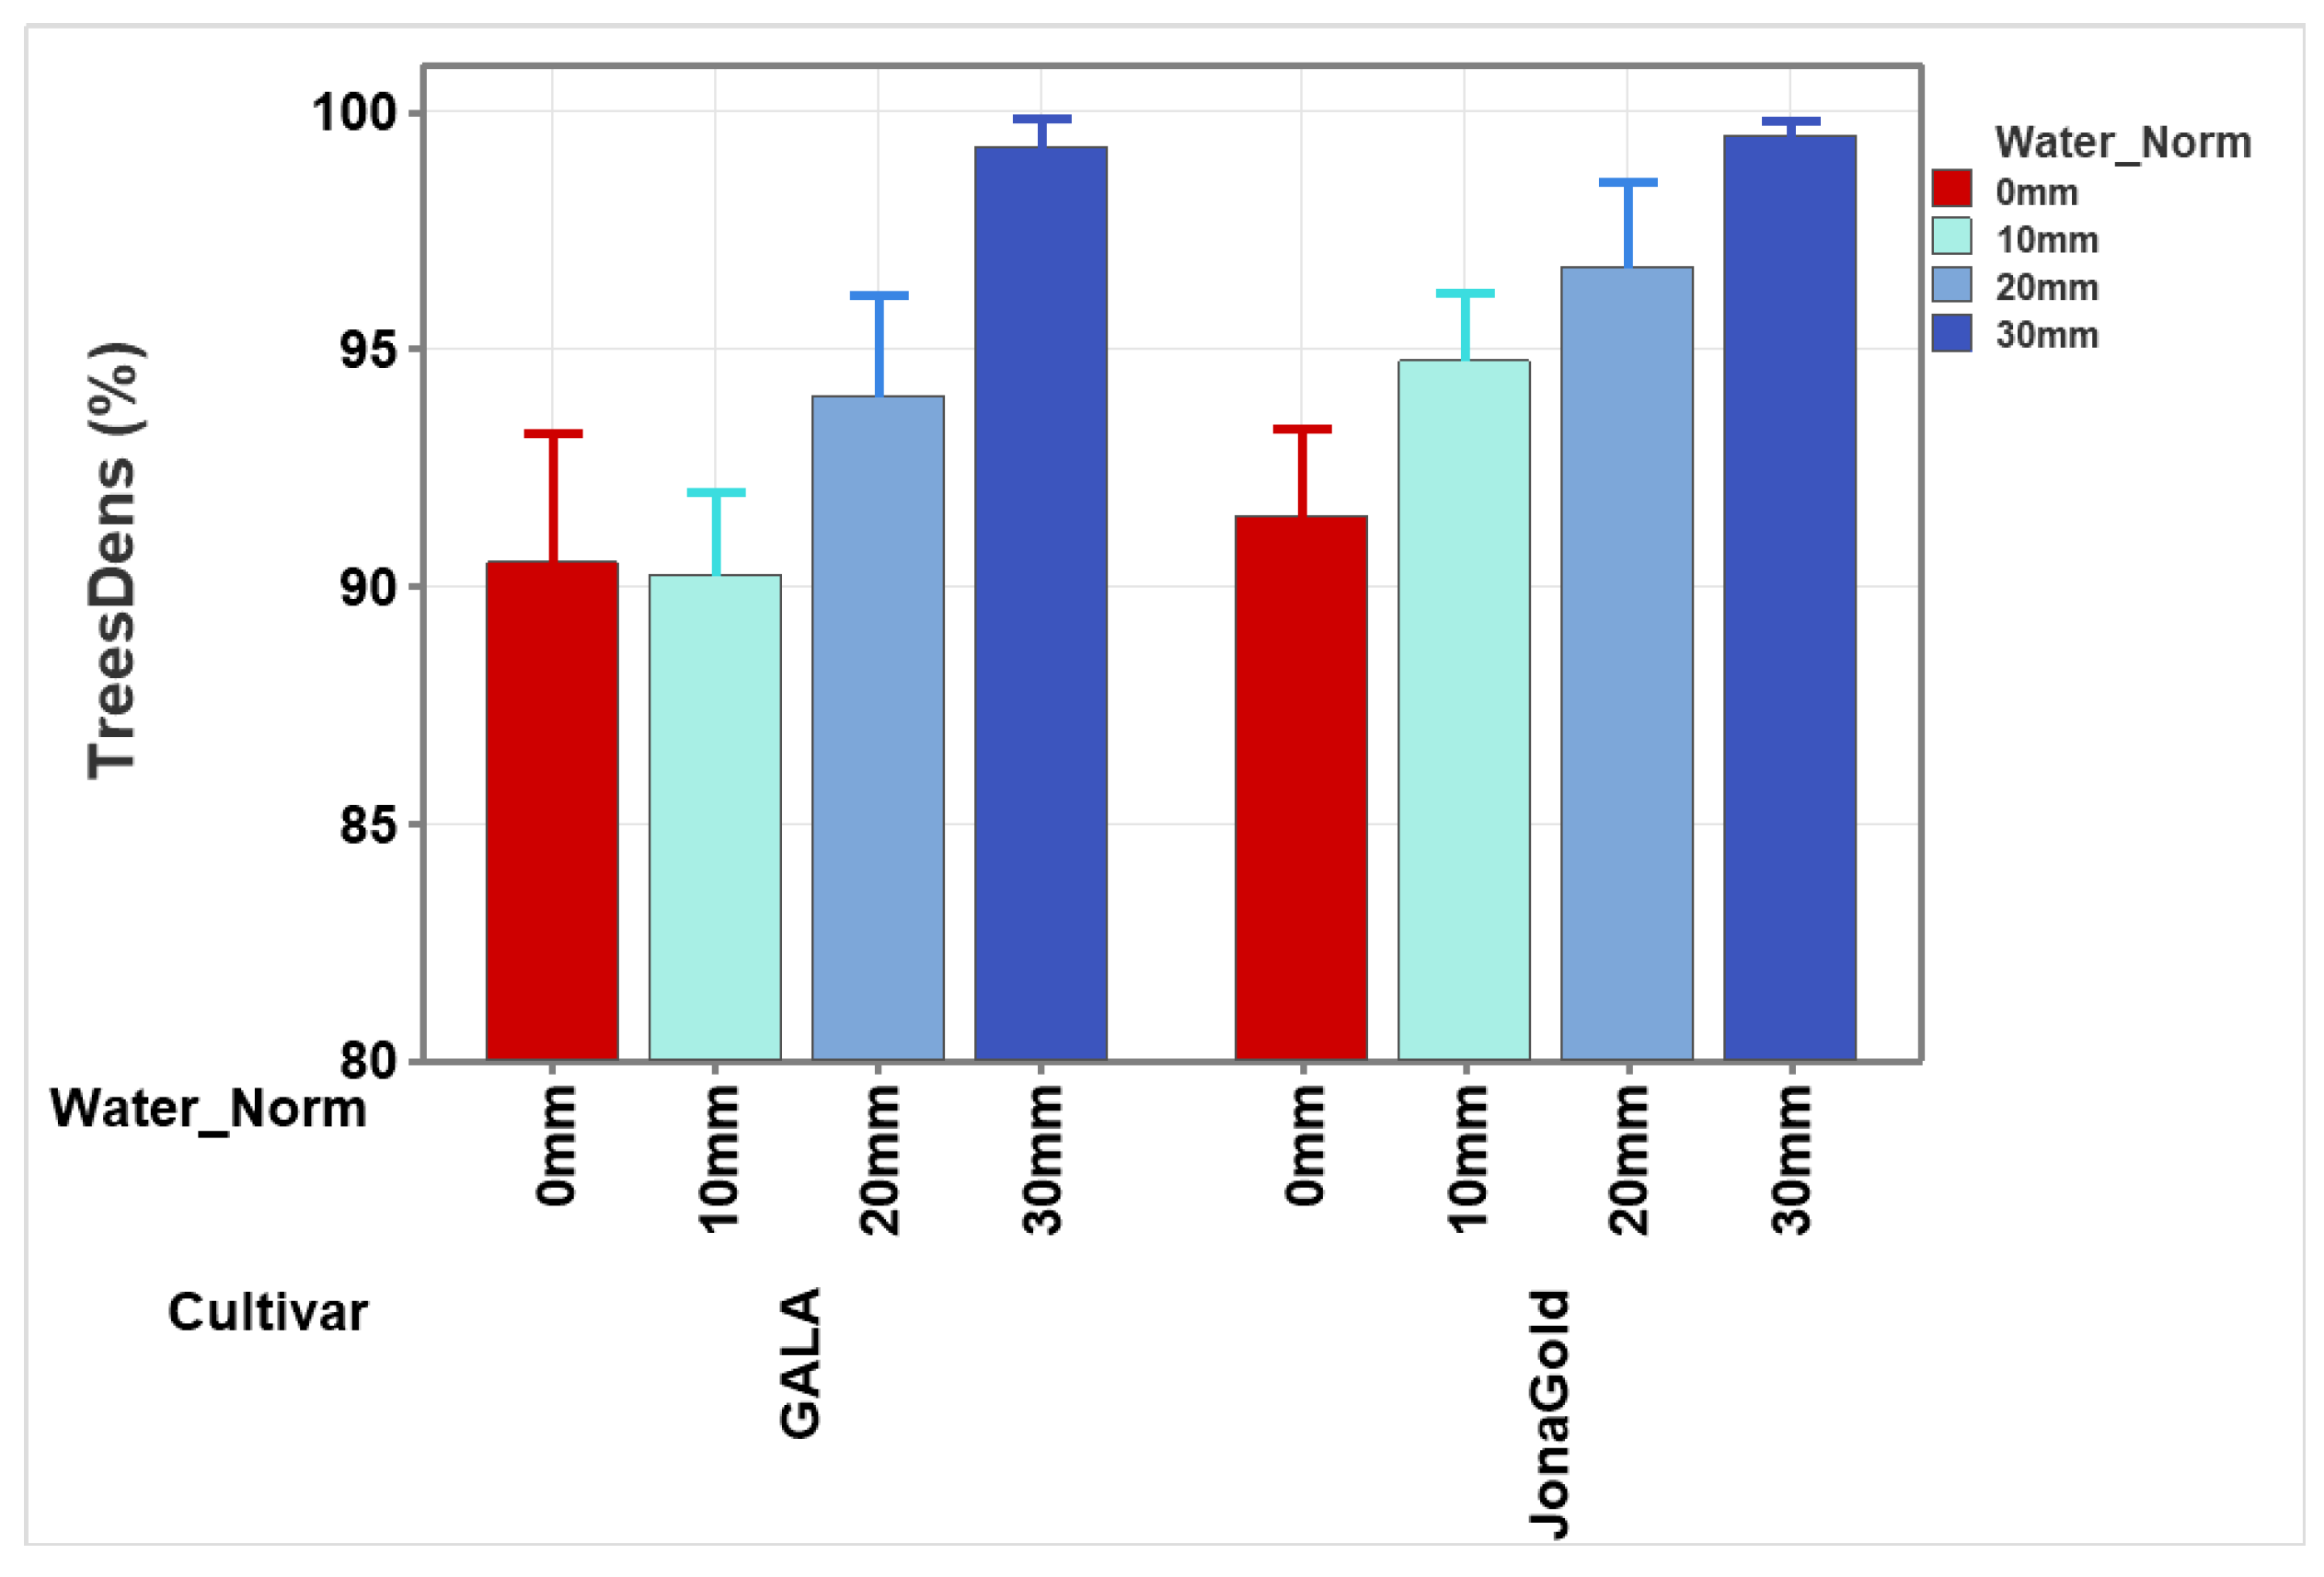
Figure 3.
Interaction between fertilisation and cultivar.
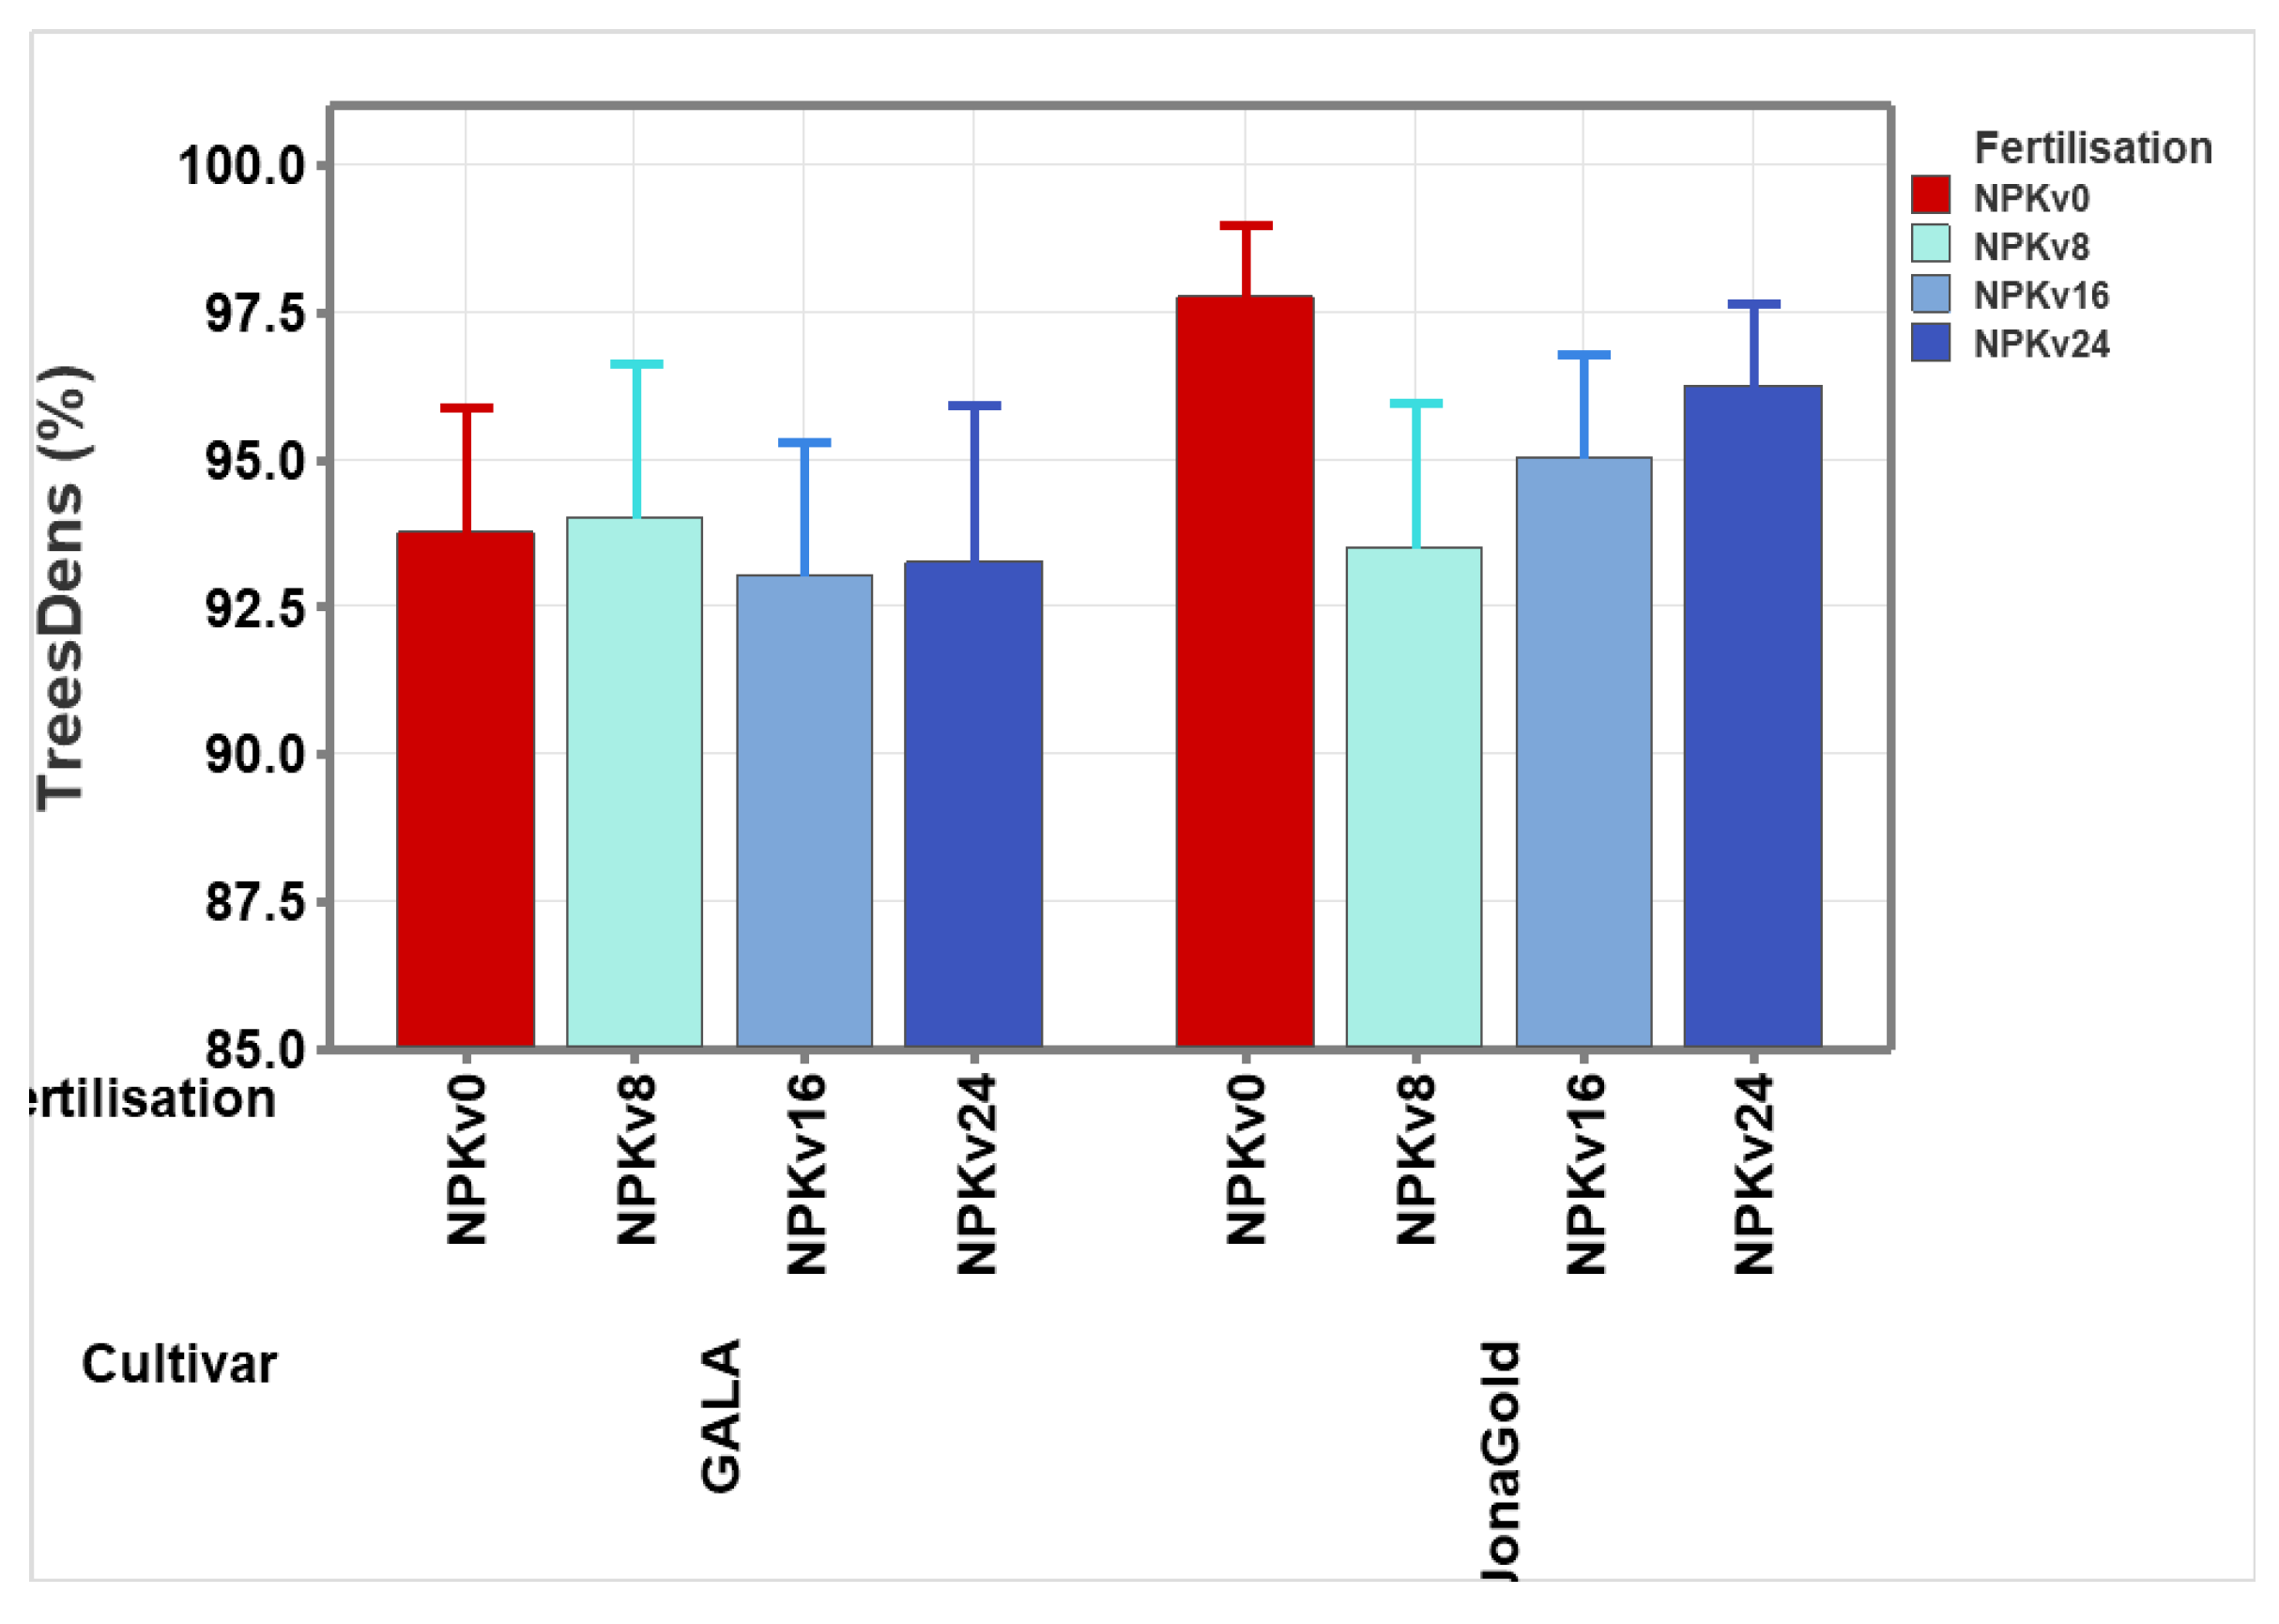
Figure 4.
Interaction between watering norm and fertilisation.
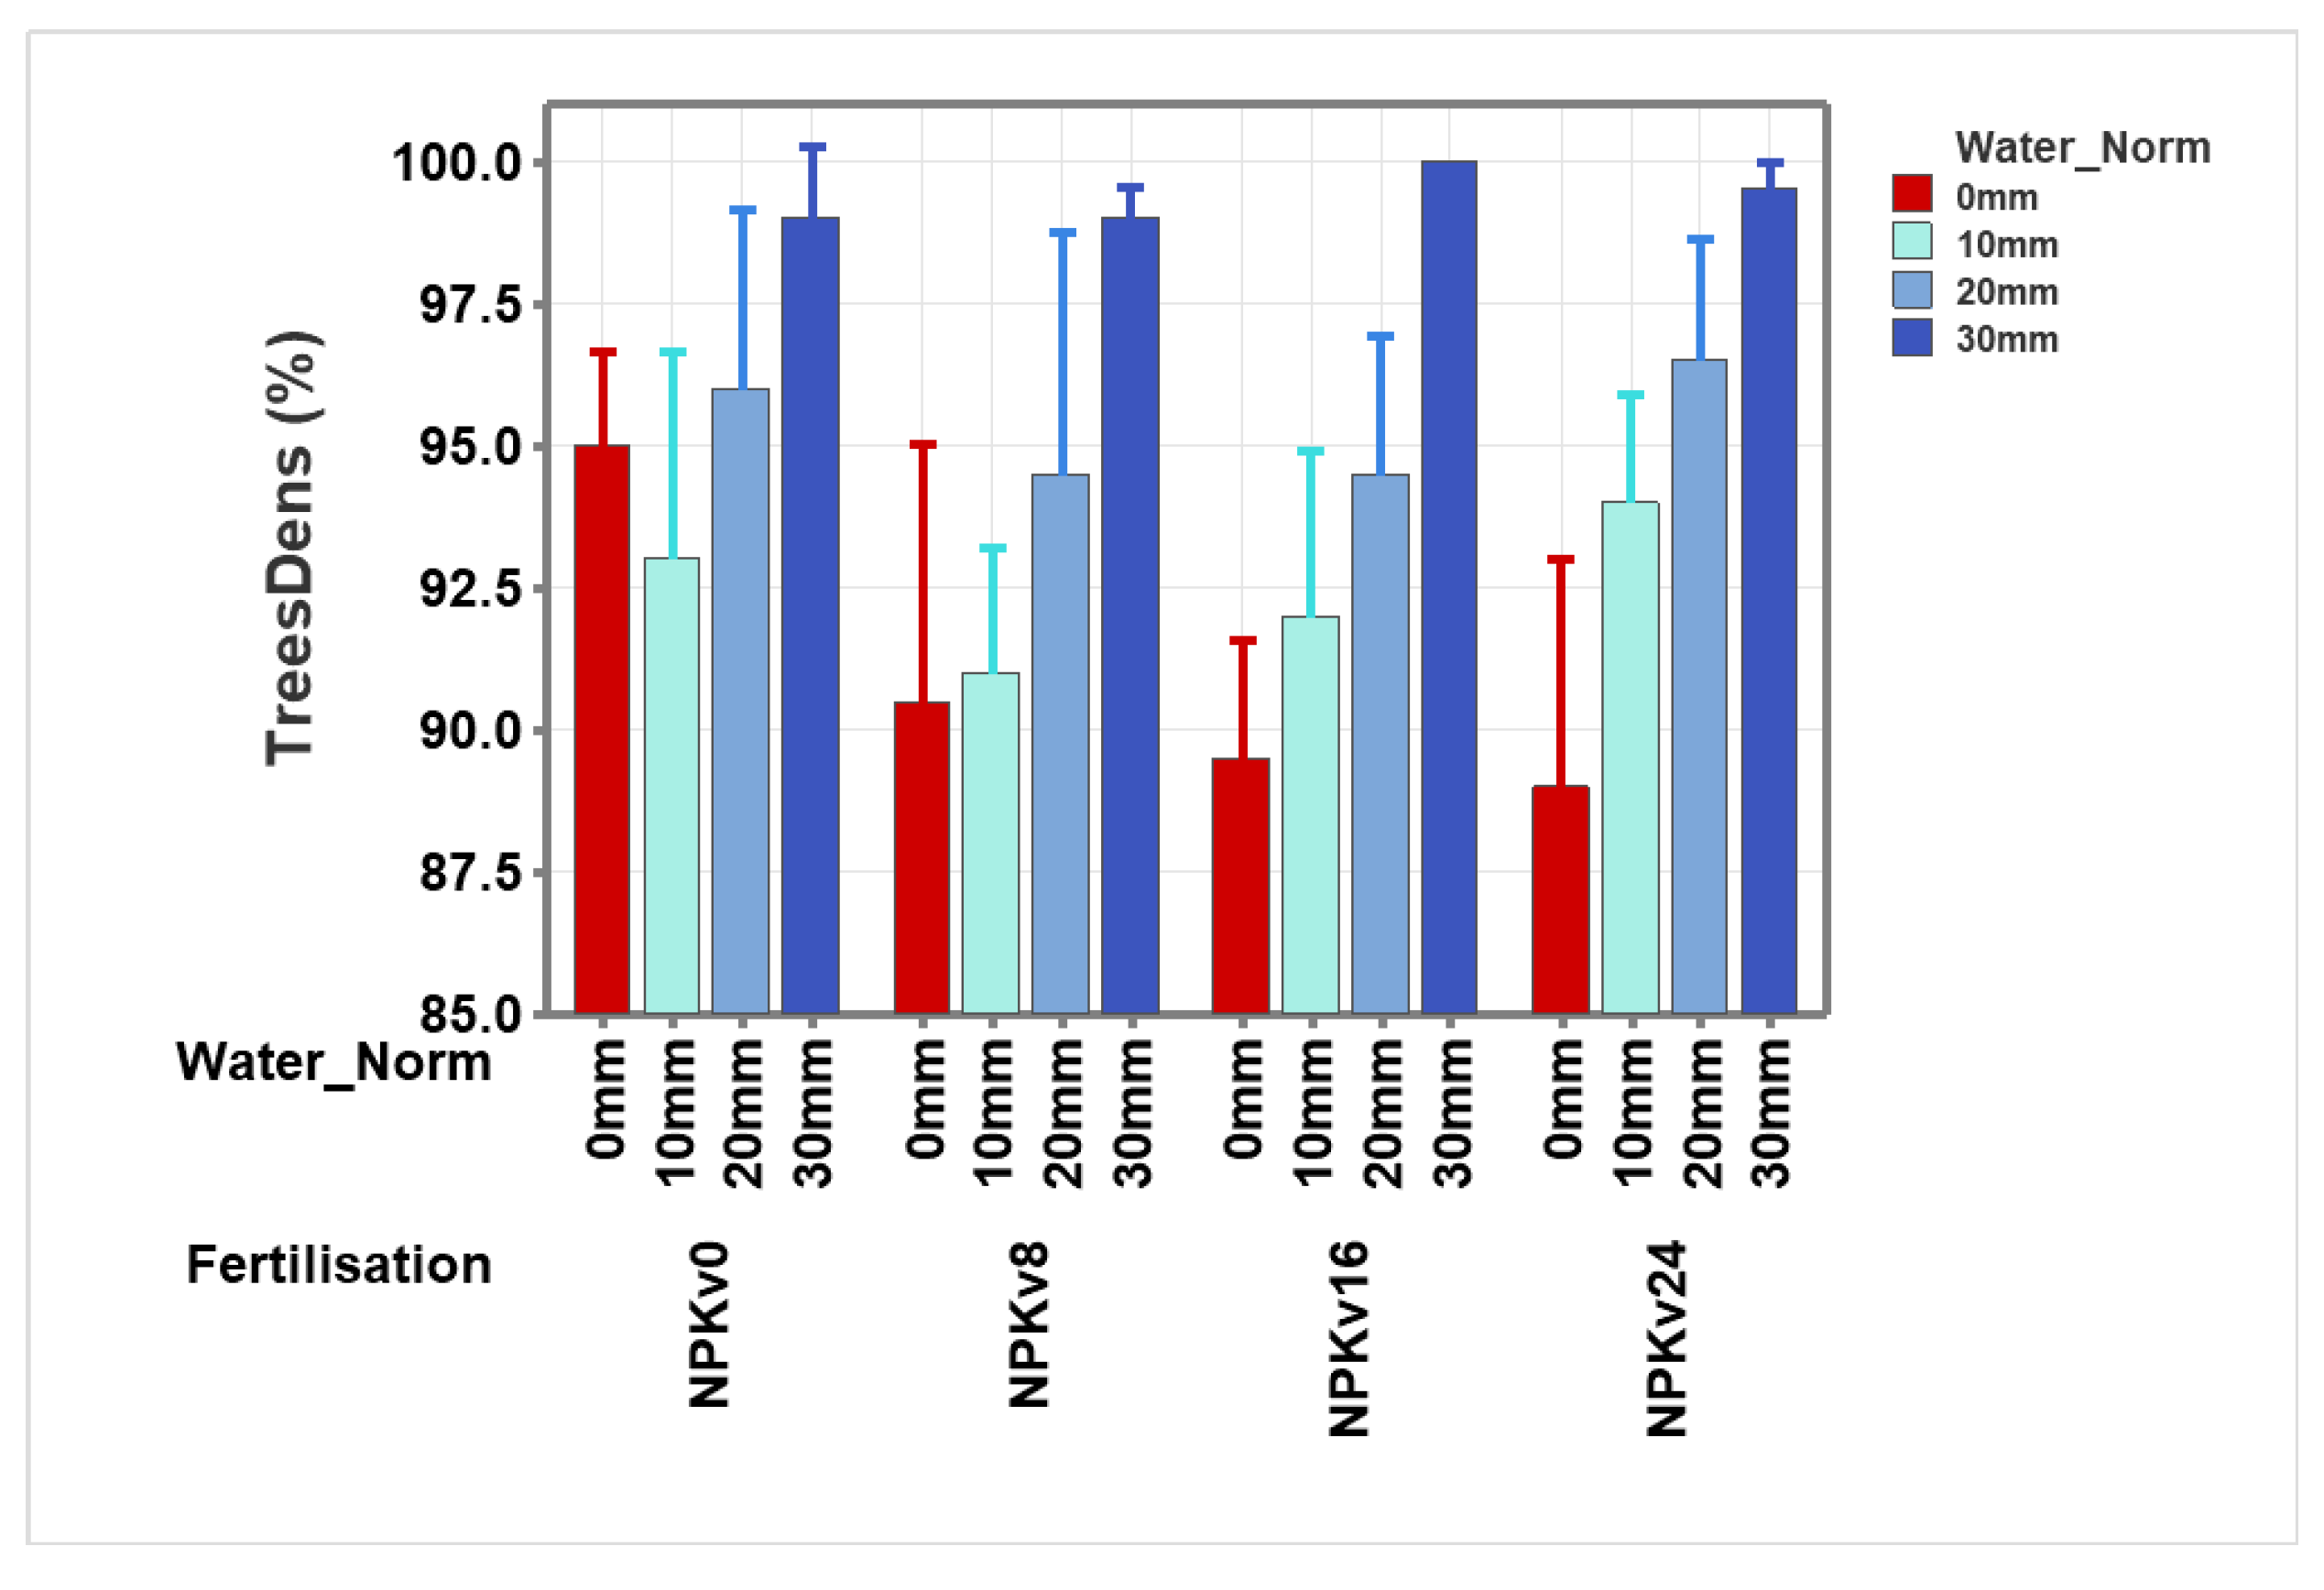
Figure 5.
Heat-map graph of Lp-Norm values for different water and fertilisation levels for the apple cultivars.
Figure 5.
Heat-map graph of Lp-Norm values for different water and fertilisation levels for the apple cultivars.
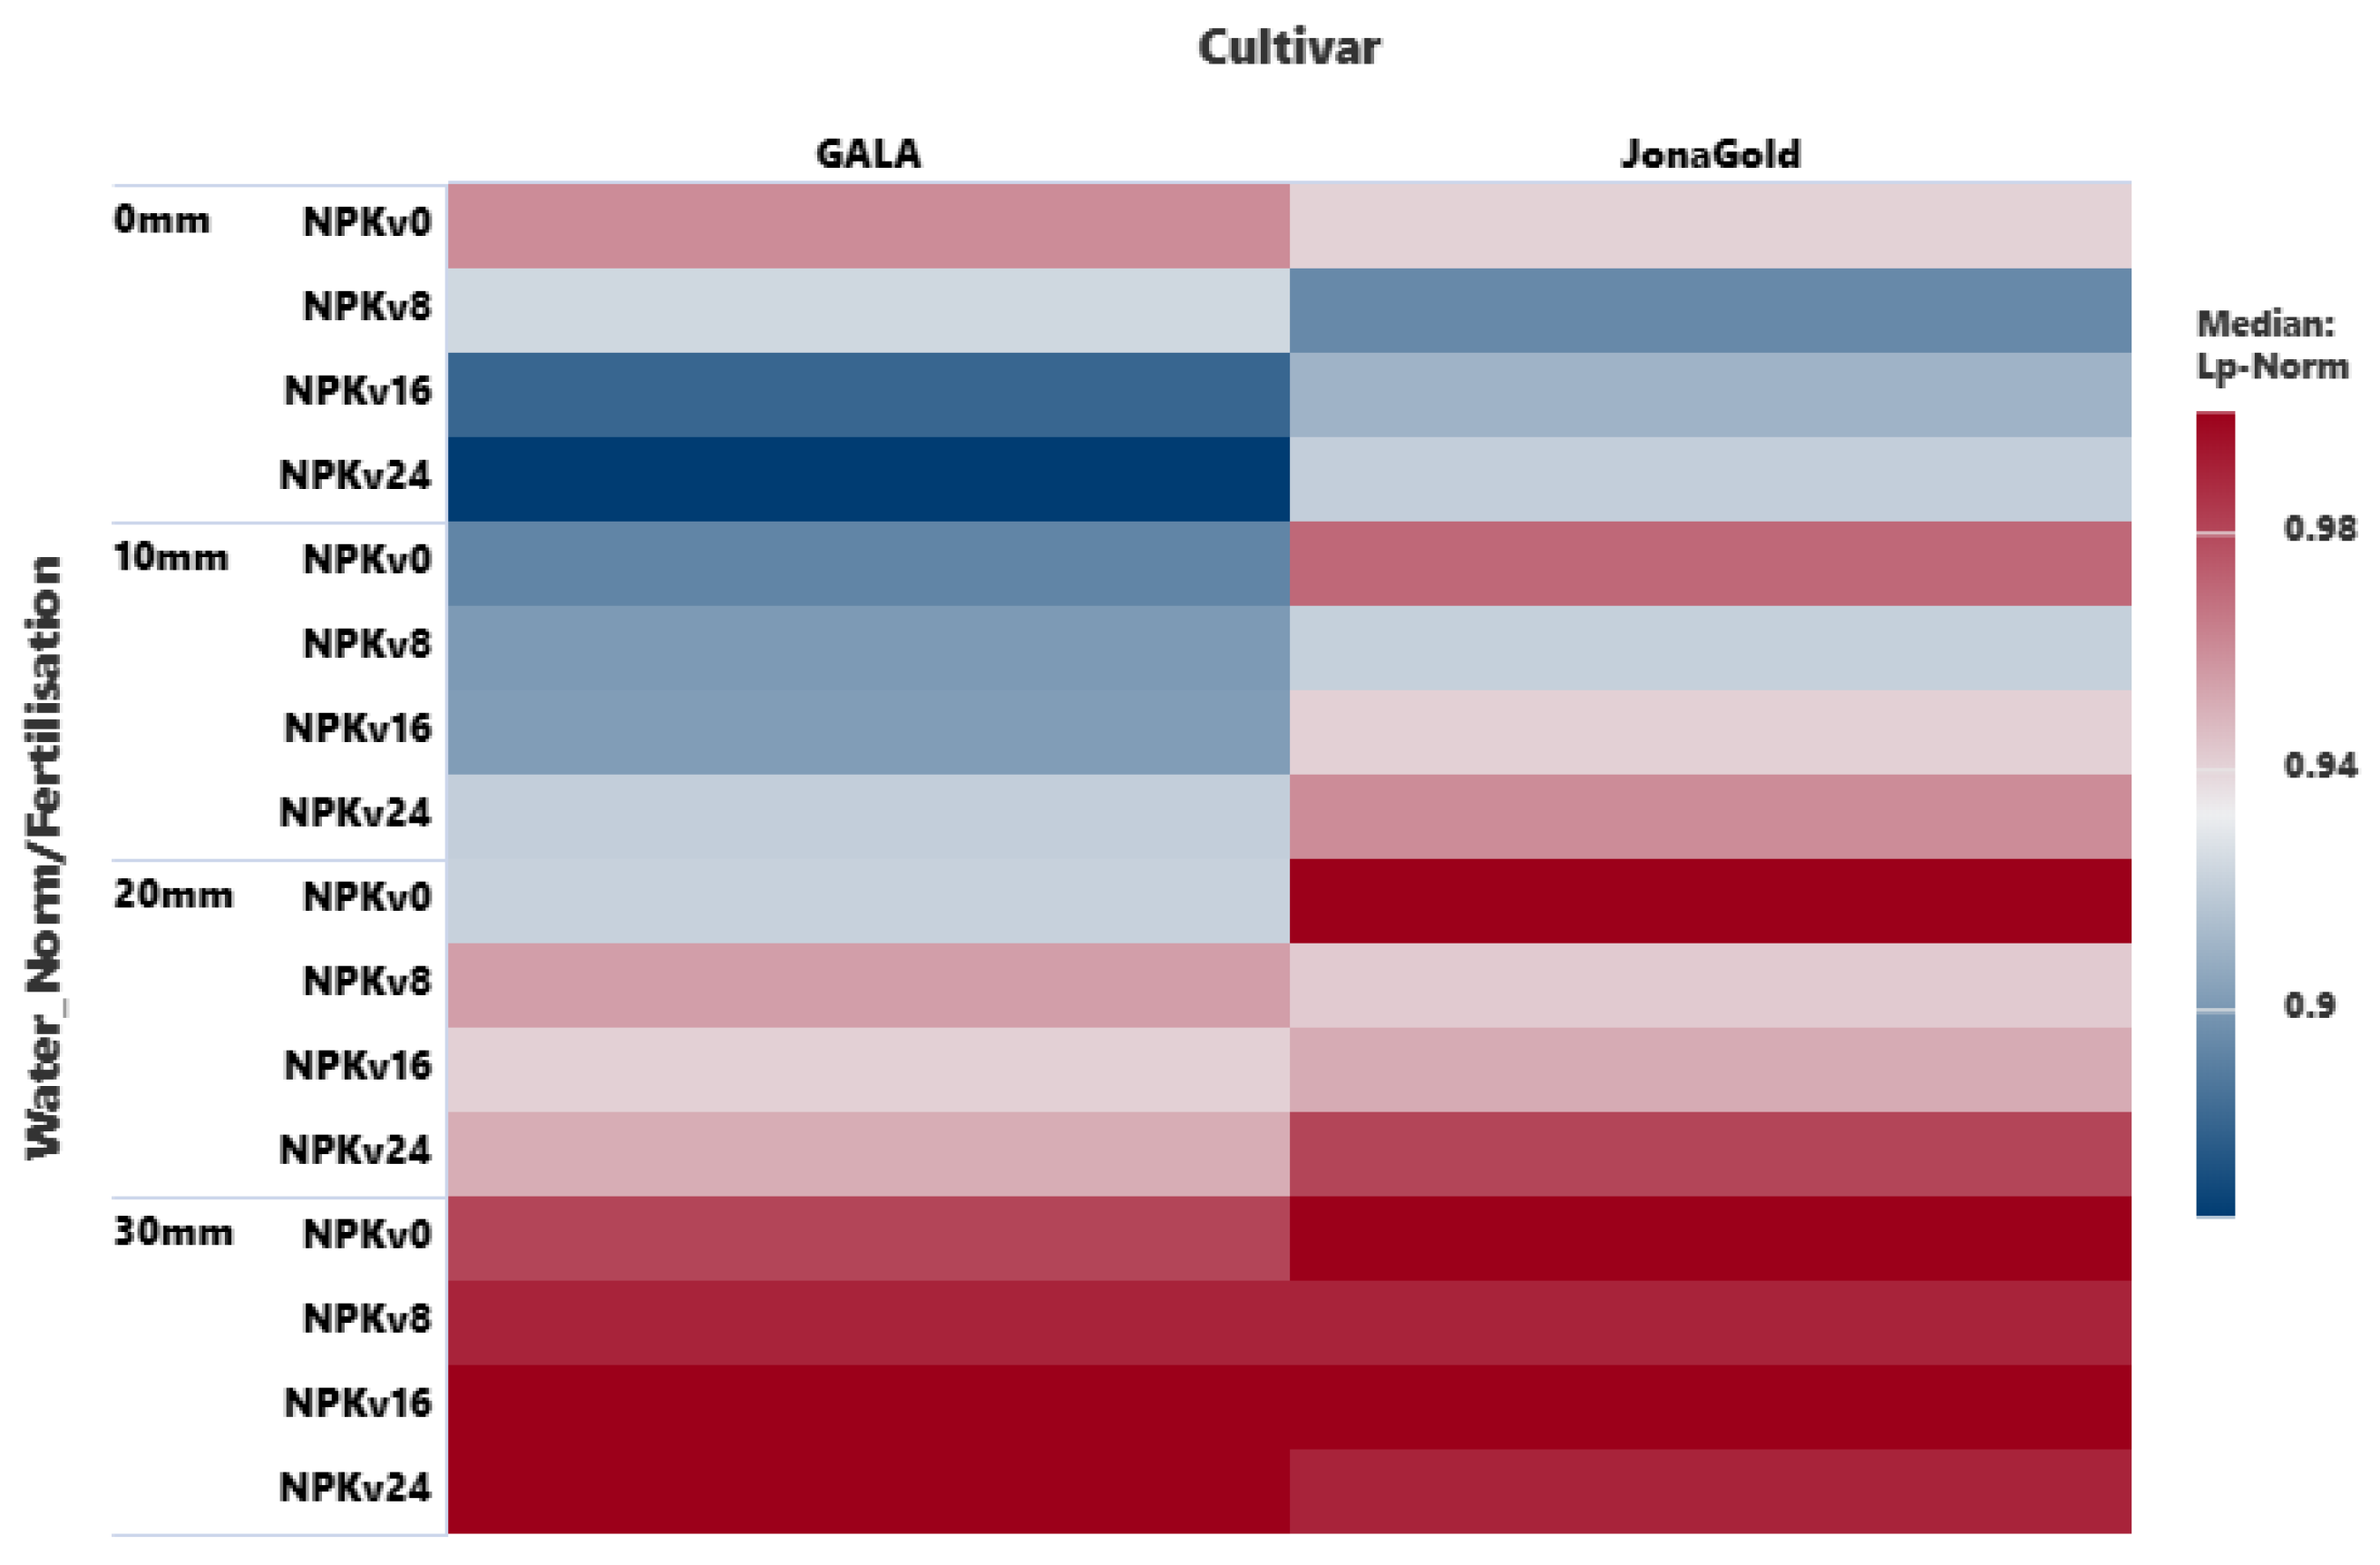
Figure 6.
Heat-map graph of Lp-Norm quartiles for different water and fertilisation levels for the apple cultivars.
Figure 6.
Heat-map graph of Lp-Norm quartiles for different water and fertilisation levels for the apple cultivars.
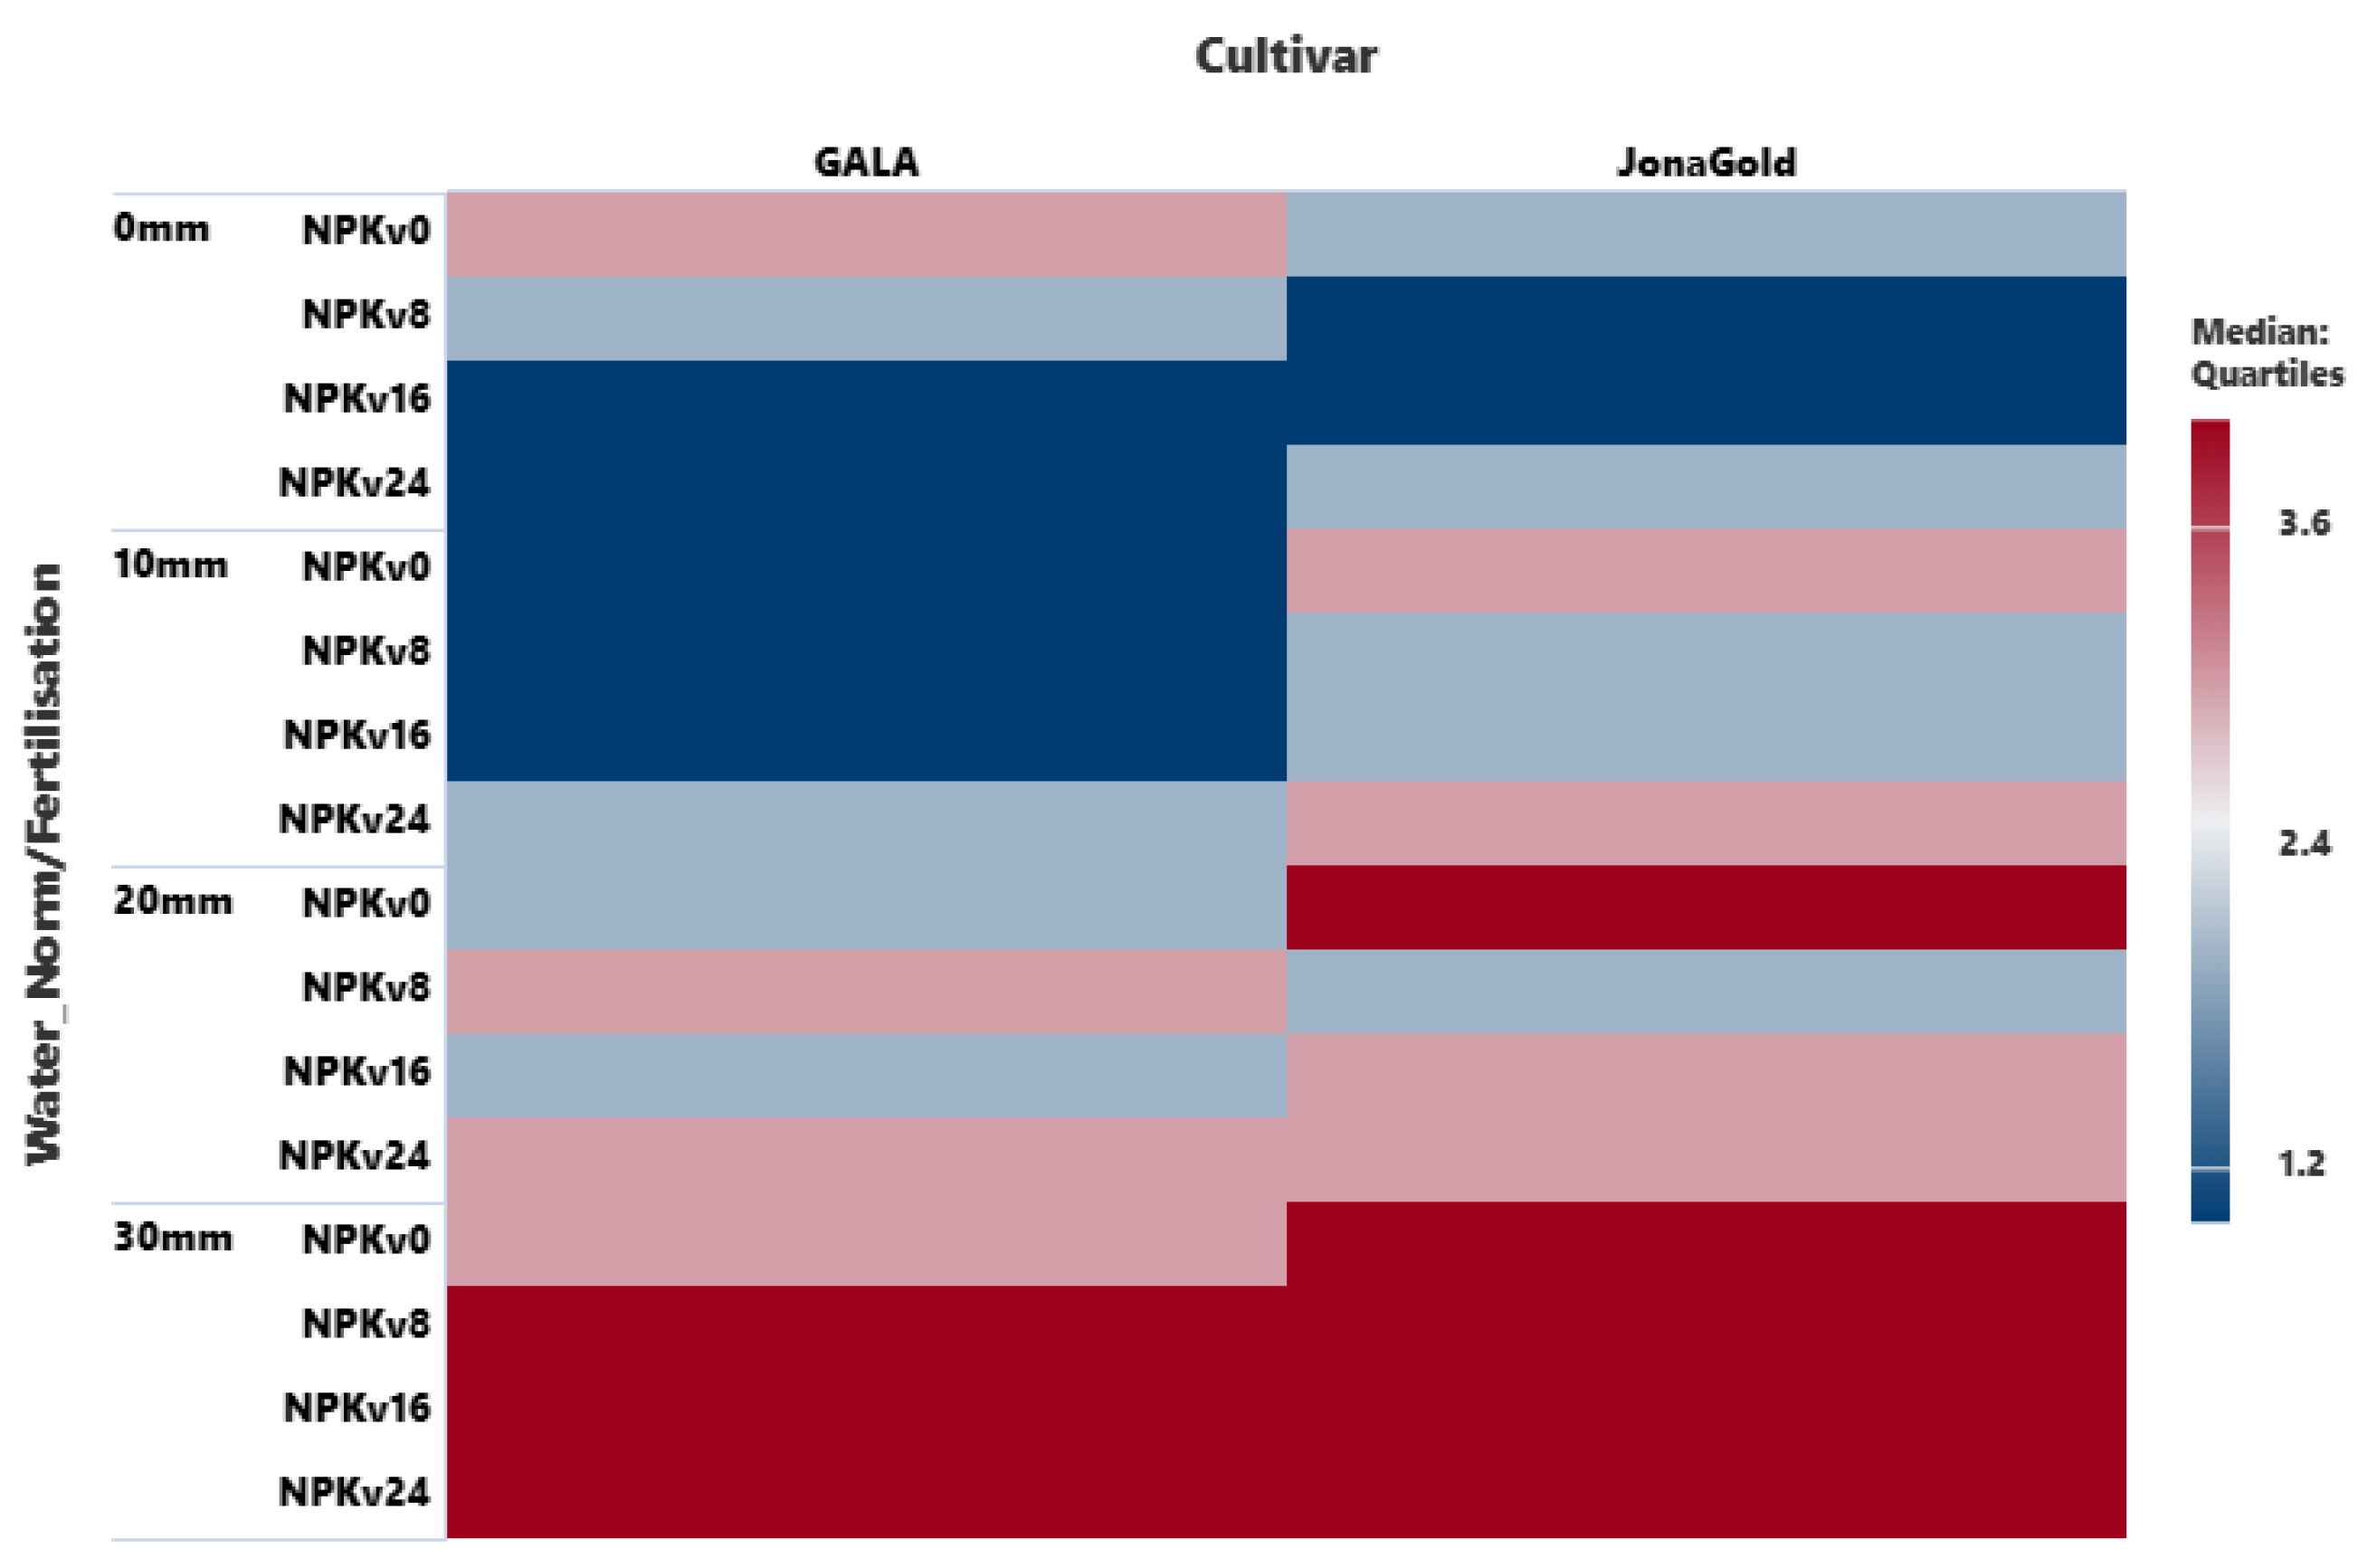
Figure 7.
Heat-map graph of Lp-Norm values for different water levels across the apple cultivars.
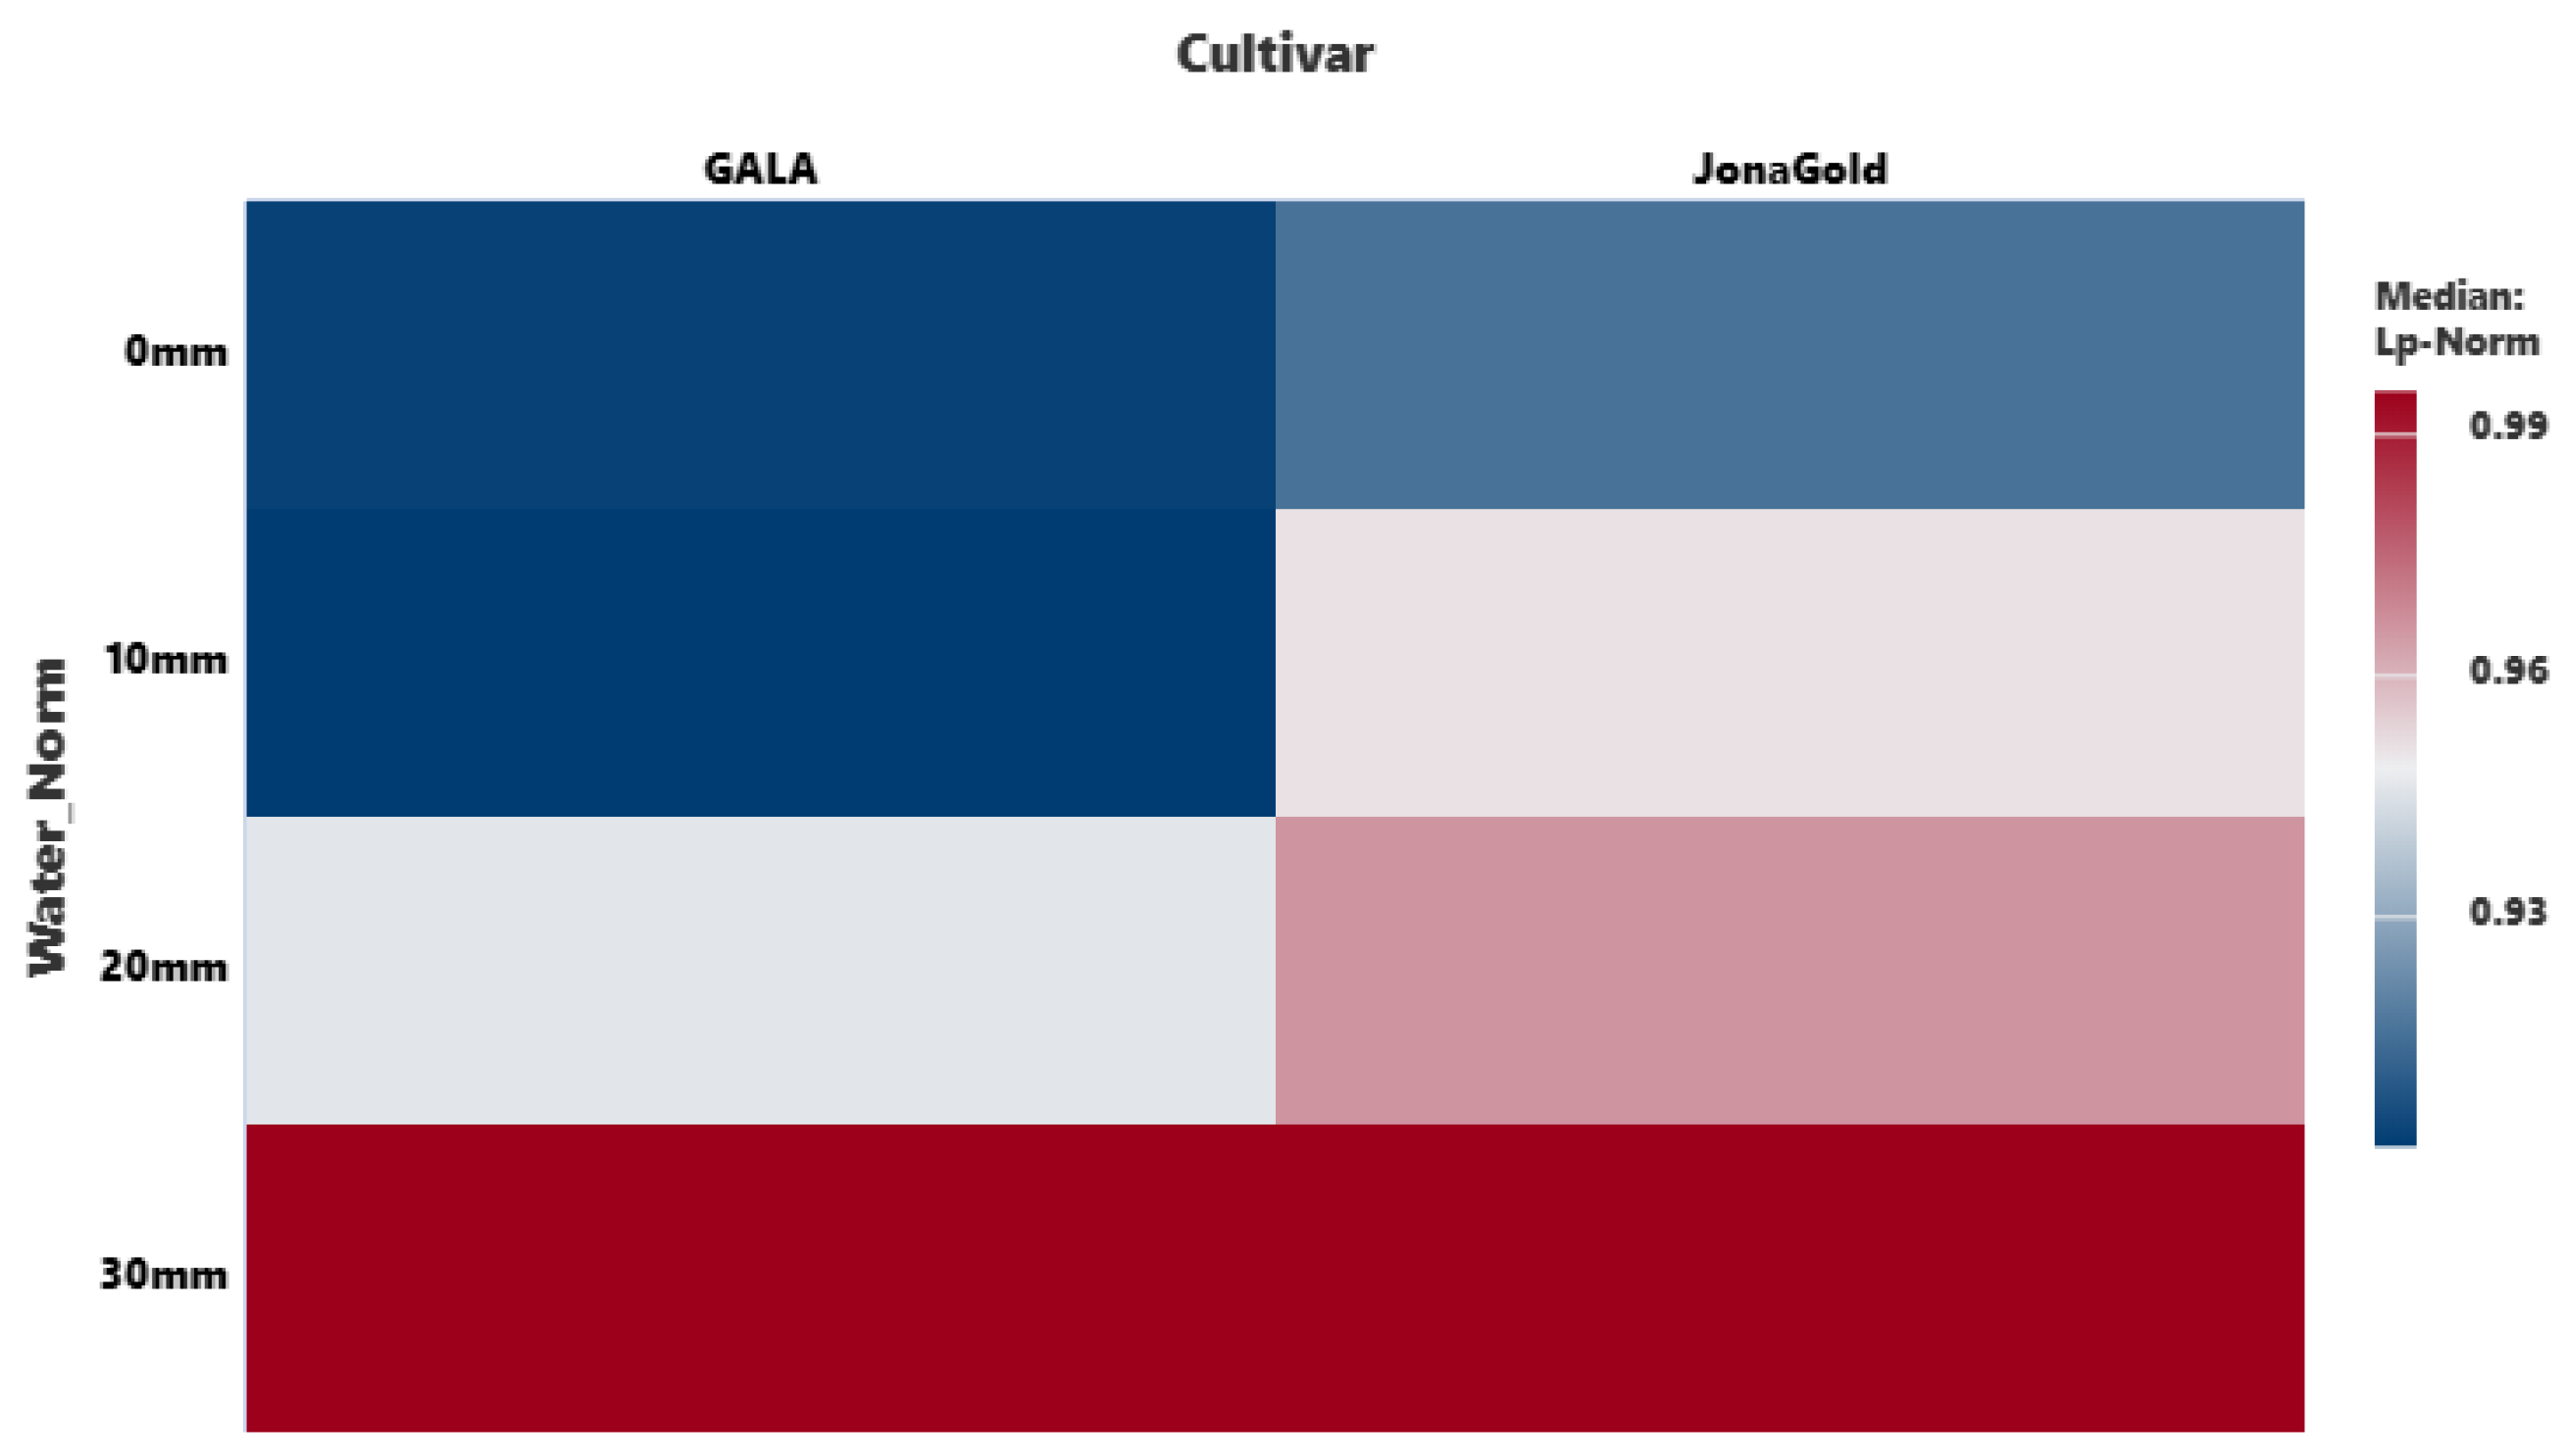
Figure 8.
Heat-map graph of Lp-Norm quartiles for different water levels across the apple cultivars.
Figure 8.
Heat-map graph of Lp-Norm quartiles for different water levels across the apple cultivars.
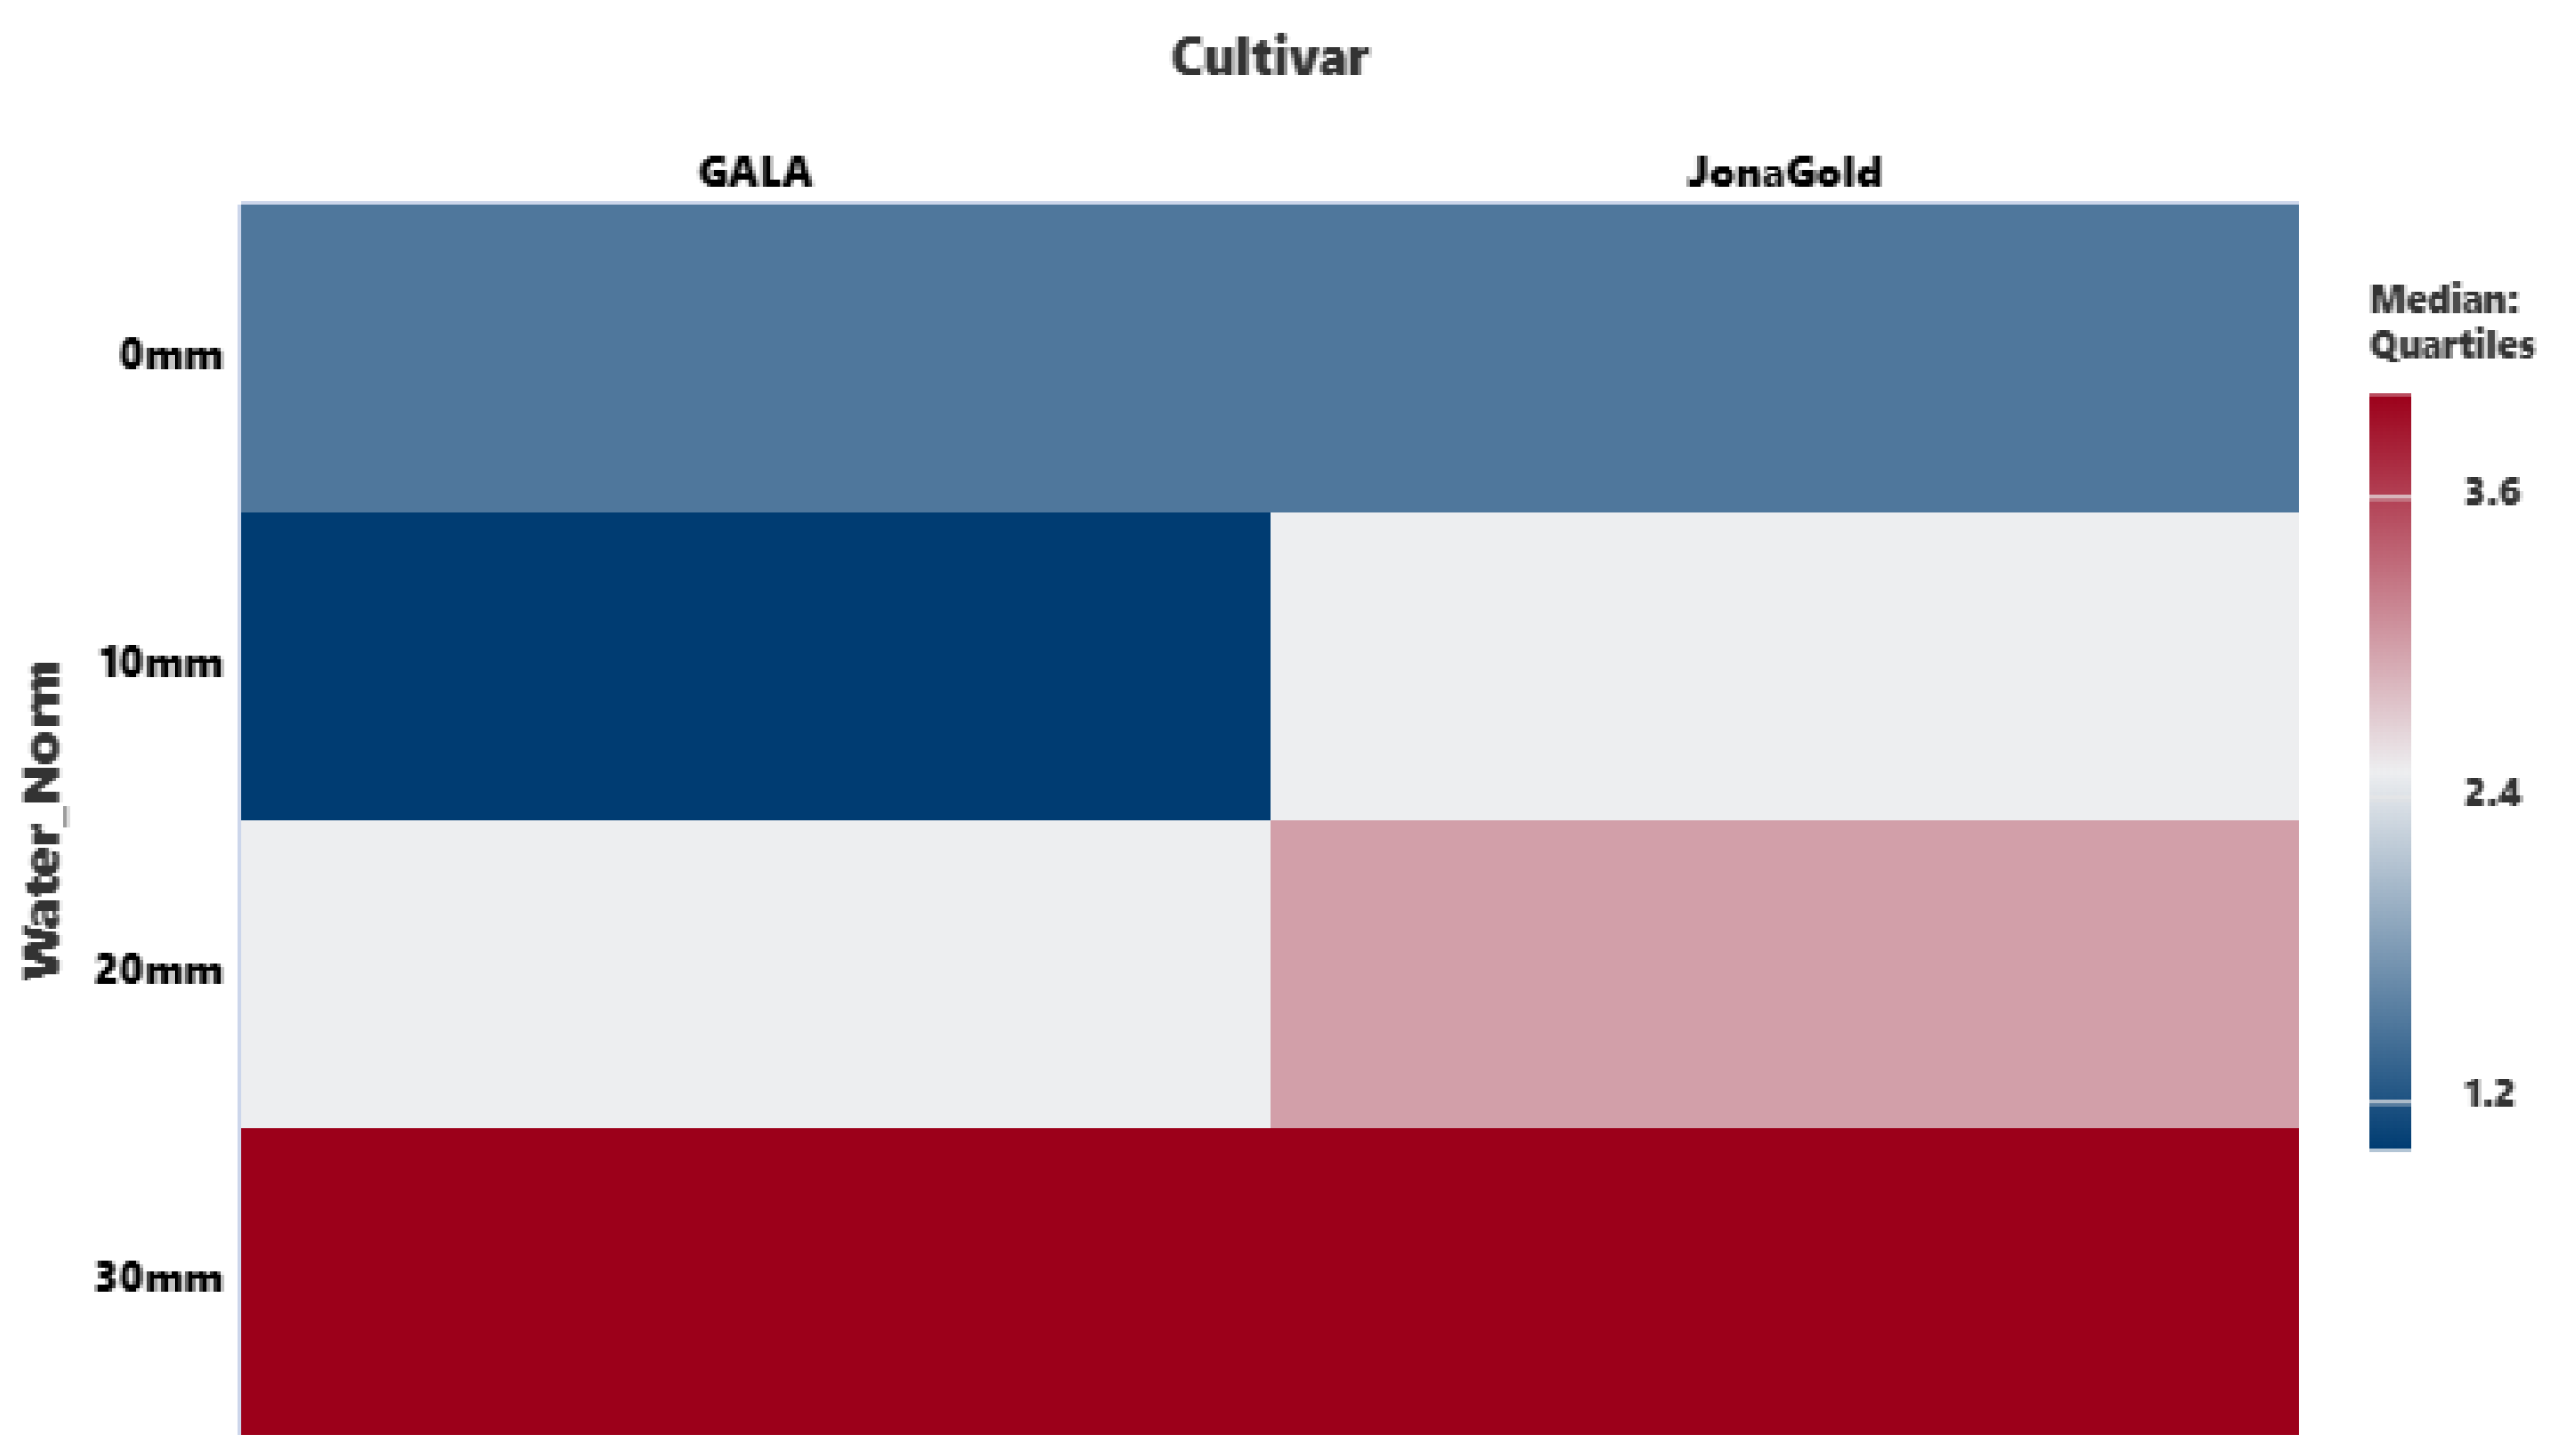
Figure 9.
Heat-map graph of Lp-Norm quartiles for different fertilisation levels in relation to varying water norms.
Figure 9.
Heat-map graph of Lp-Norm quartiles for different fertilisation levels in relation to varying water norms.
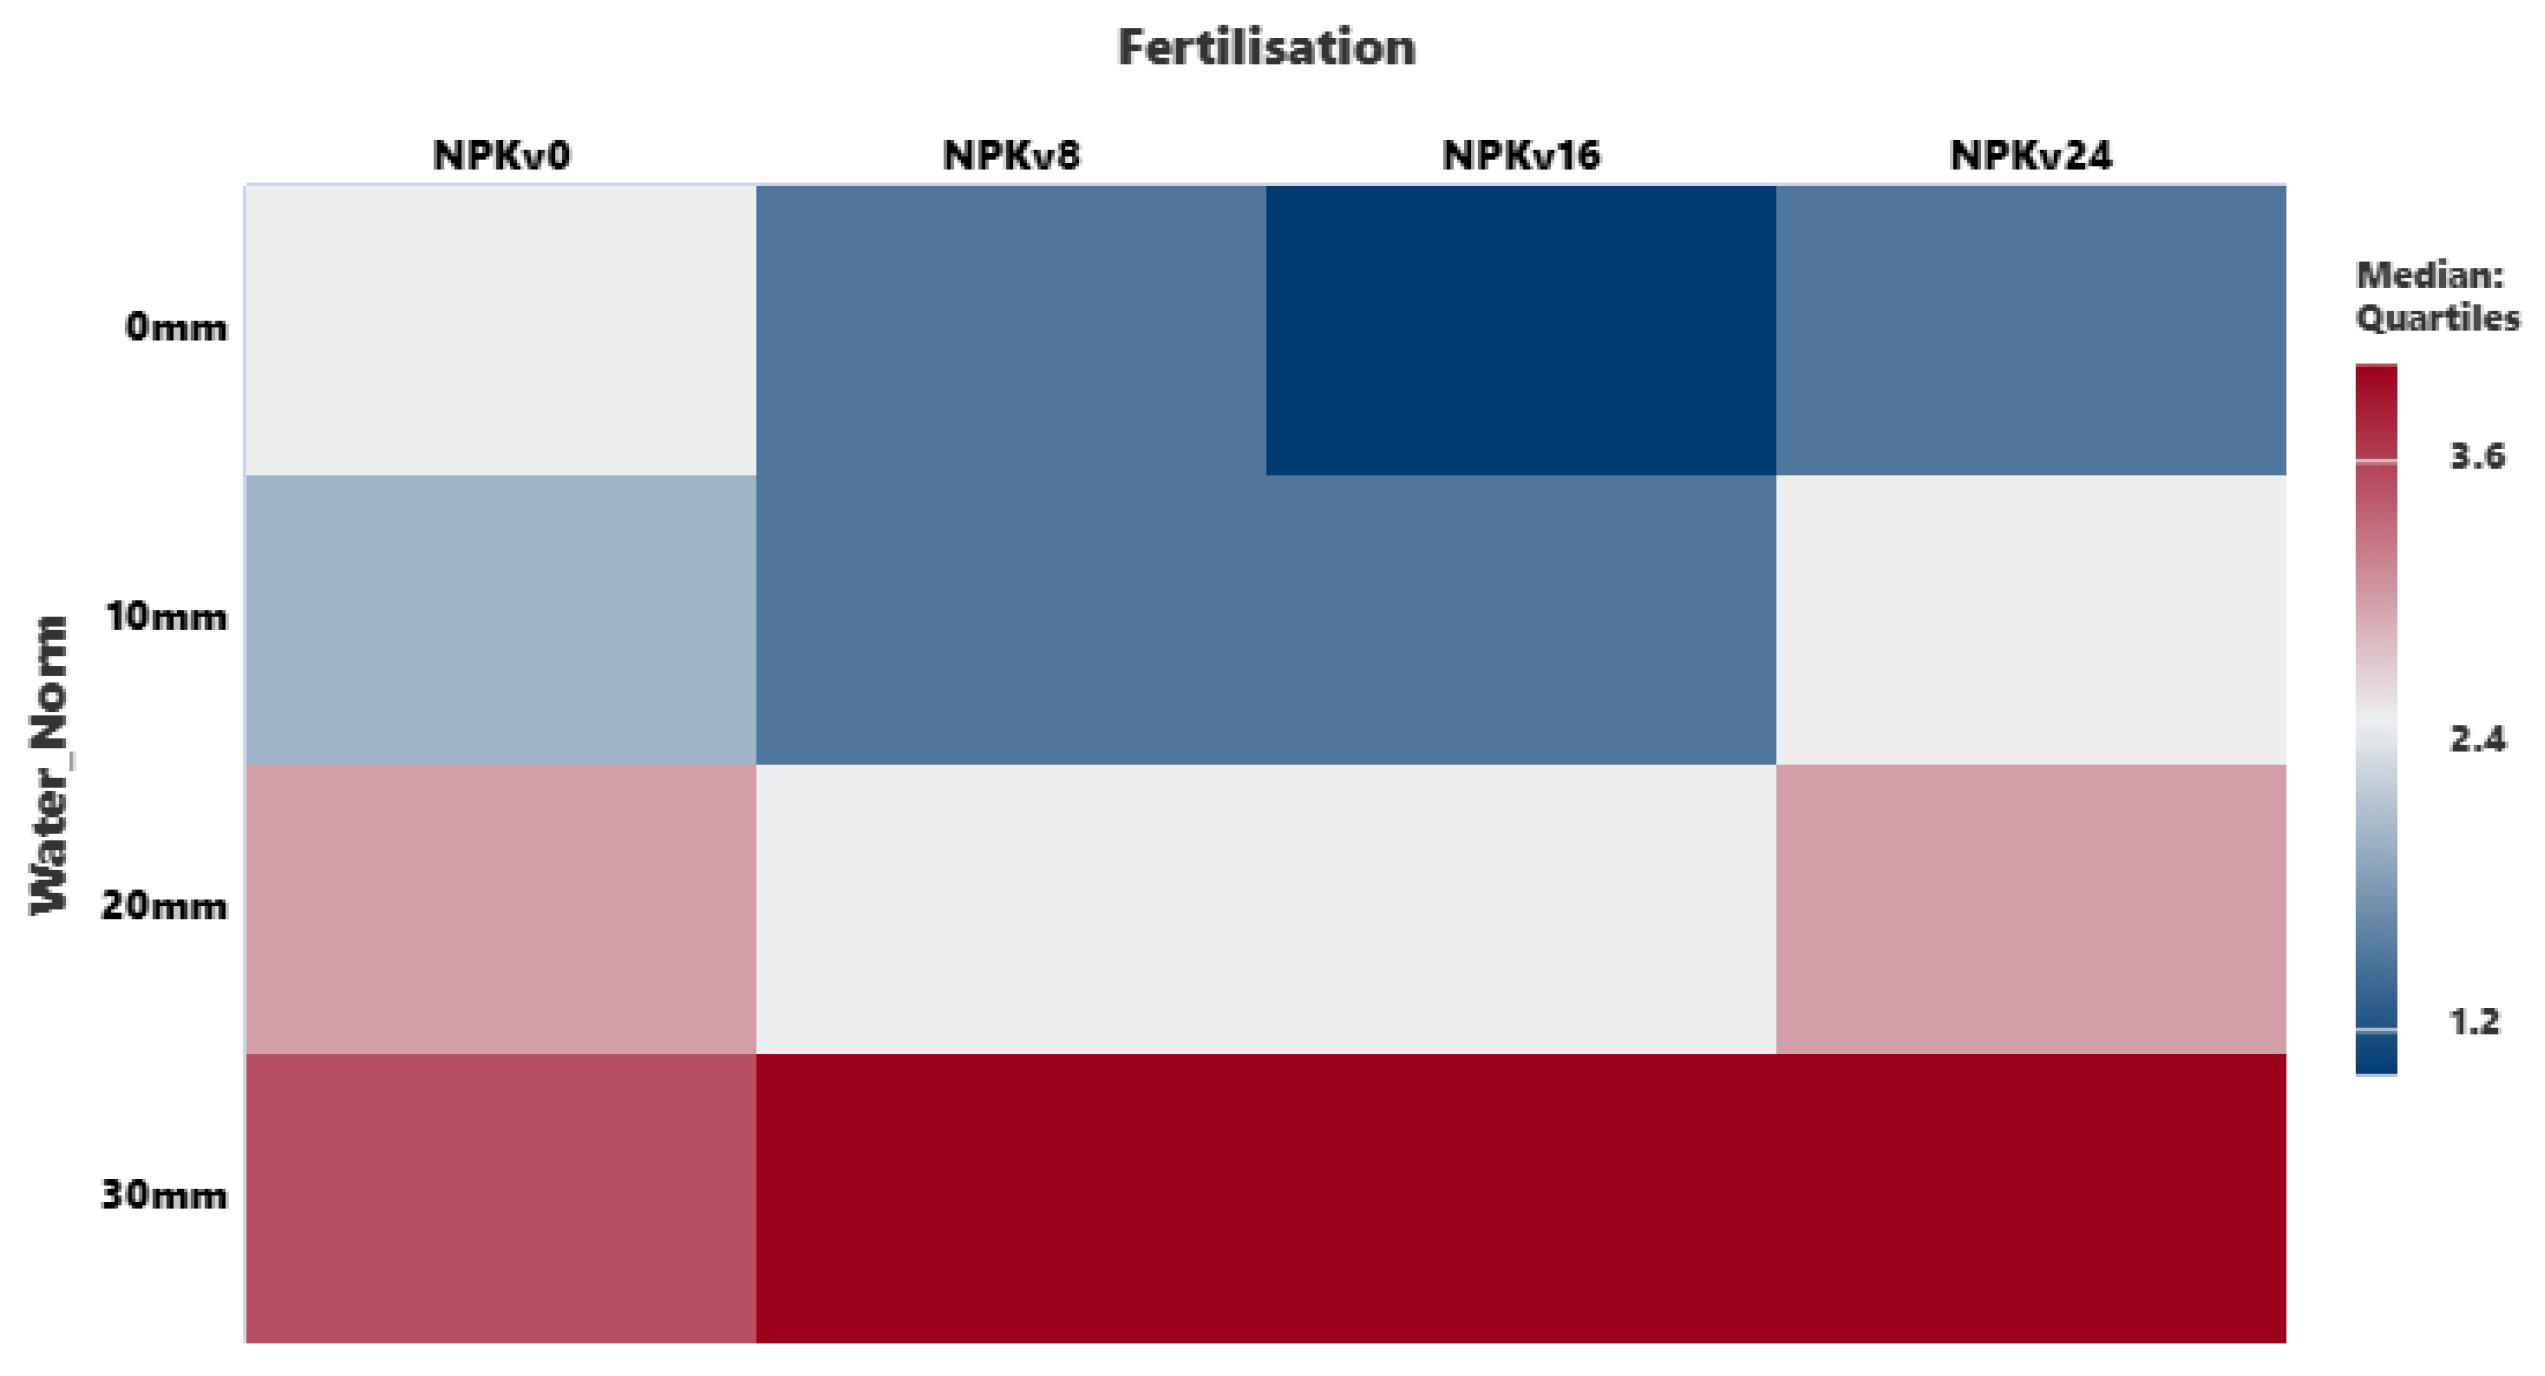
Figure 10.
Graphical distribution of the values and quartiles of Lp-Norm for the interaction factor Cultivar*Water_Nnorm*Fertilisation.
Figure 10.
Graphical distribution of the values and quartiles of Lp-Norm for the interaction factor Cultivar*Water_Nnorm*Fertilisation.
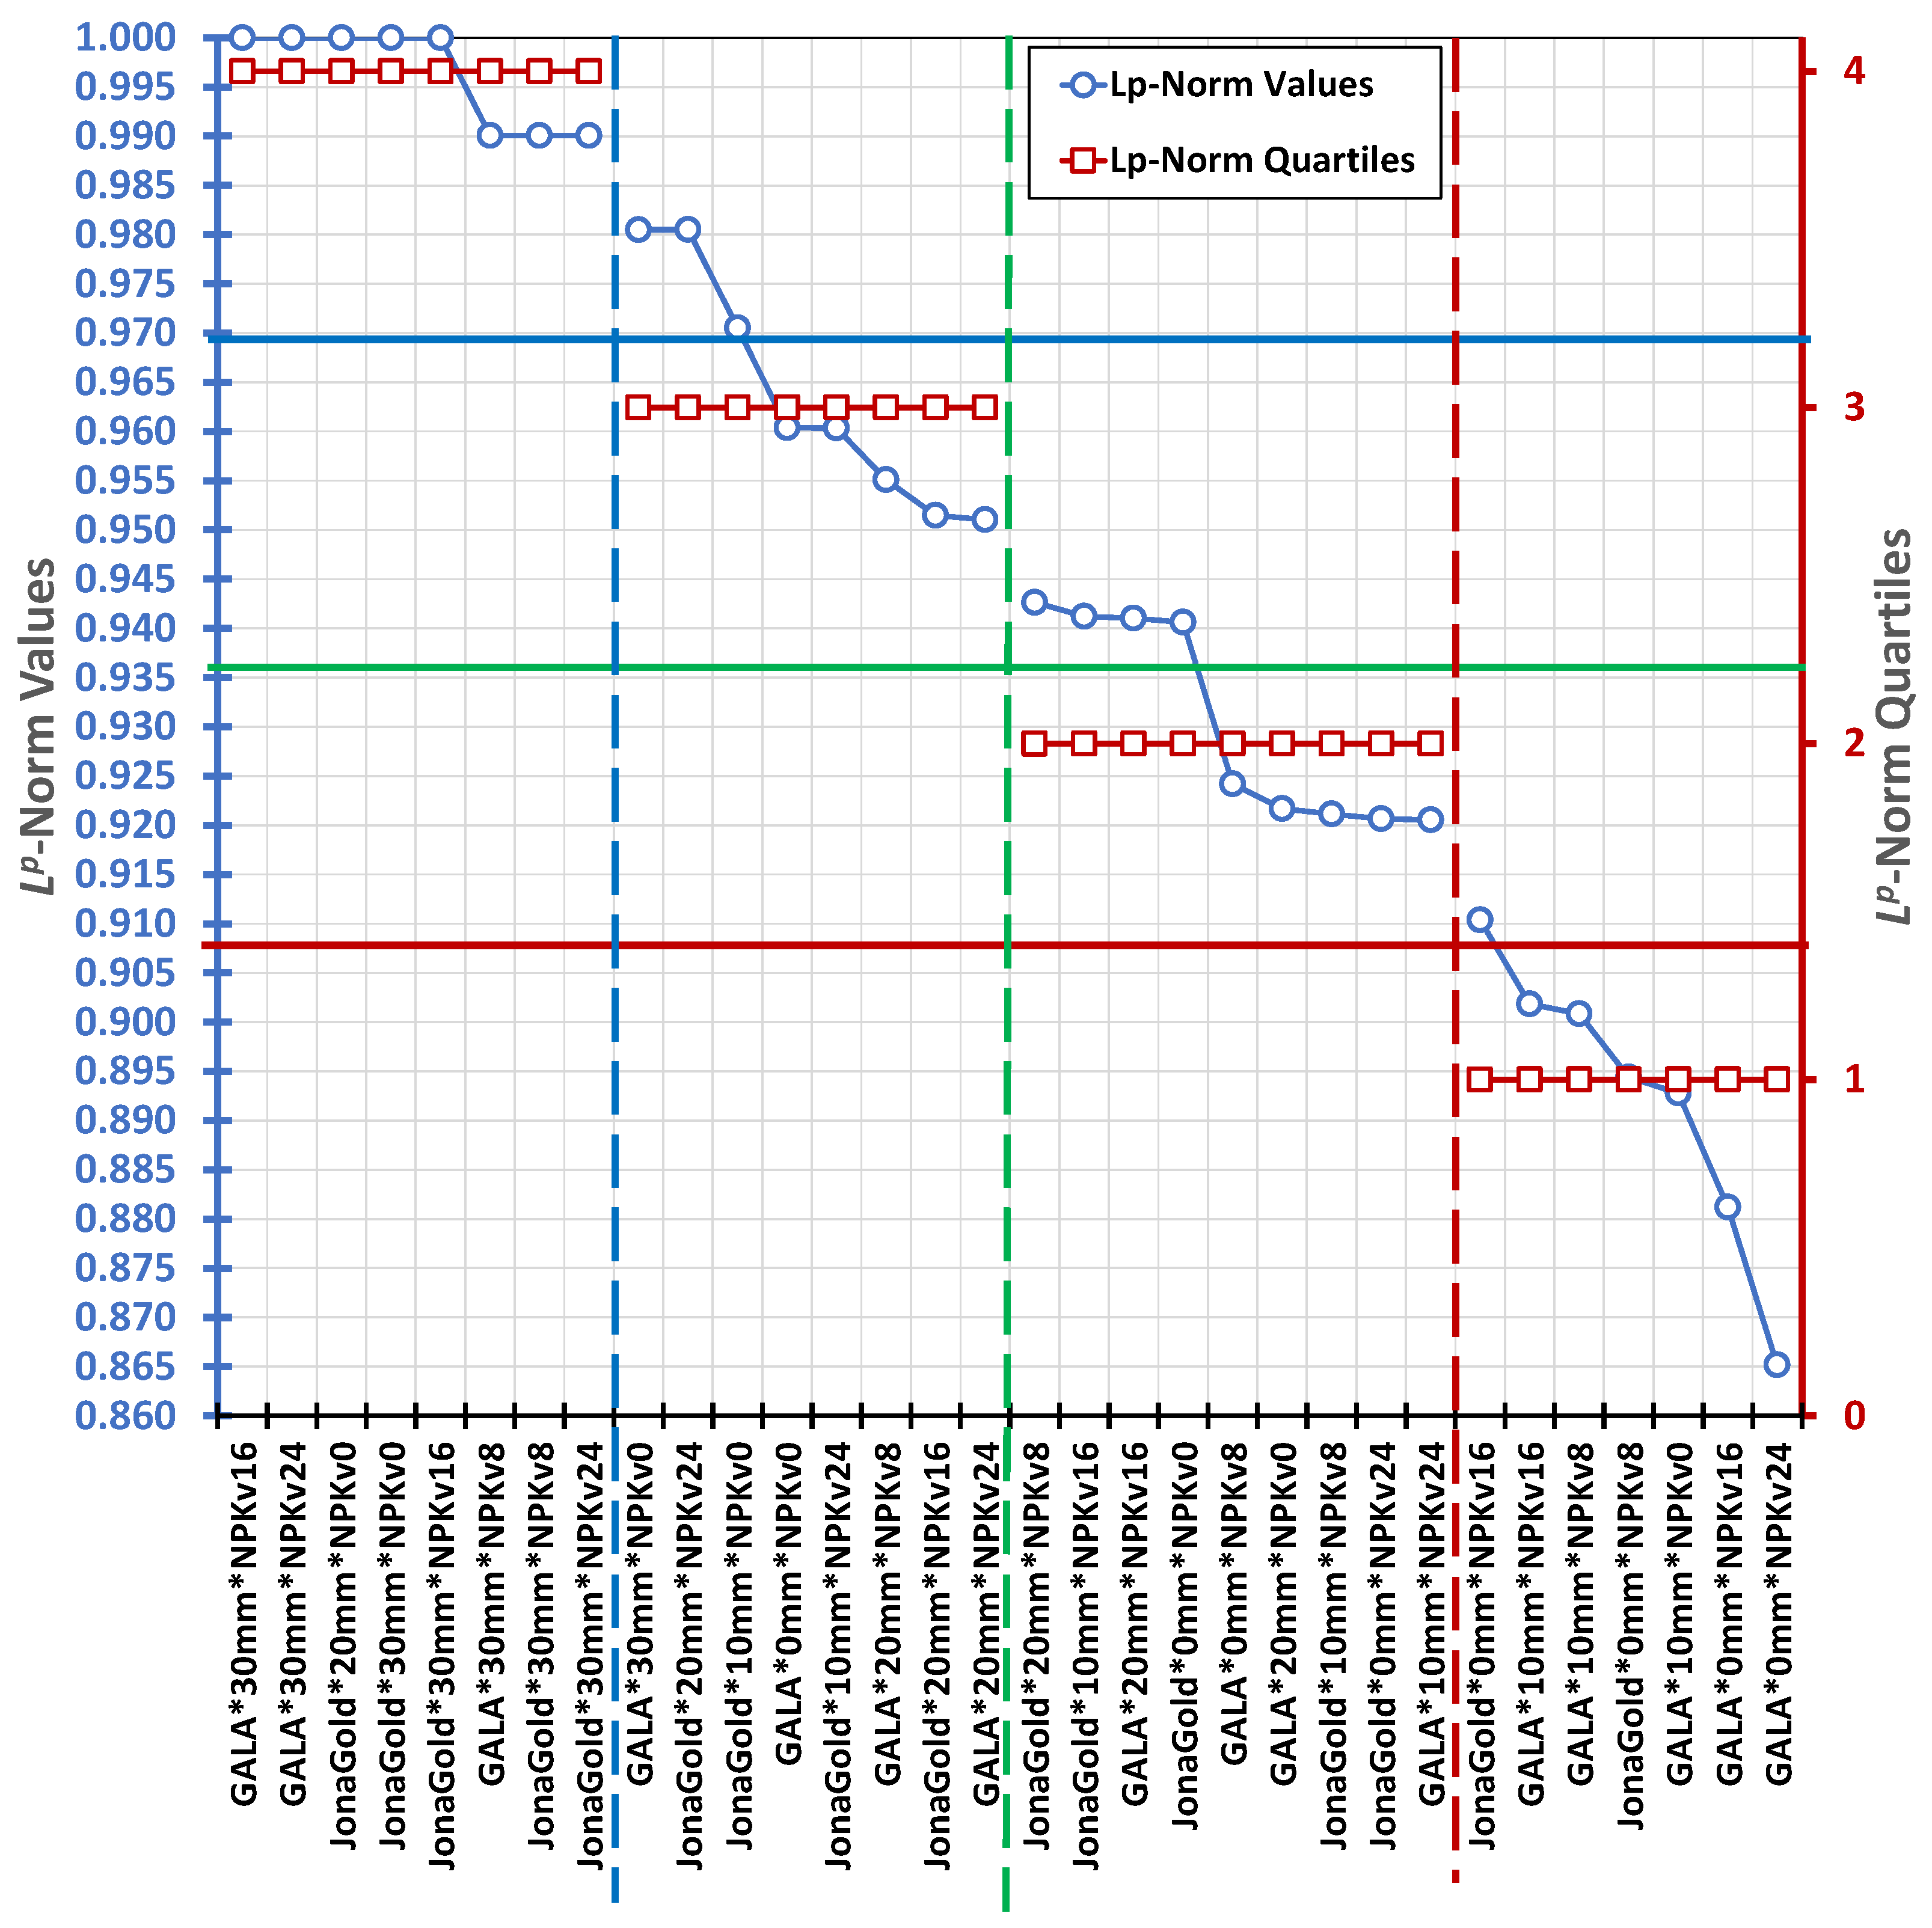
Figure 11.
Percentage of water consumption coverage from different sources for irrigation conditions in 2024.
Figure 11.
Percentage of water consumption coverage from different sources for irrigation conditions in 2024.
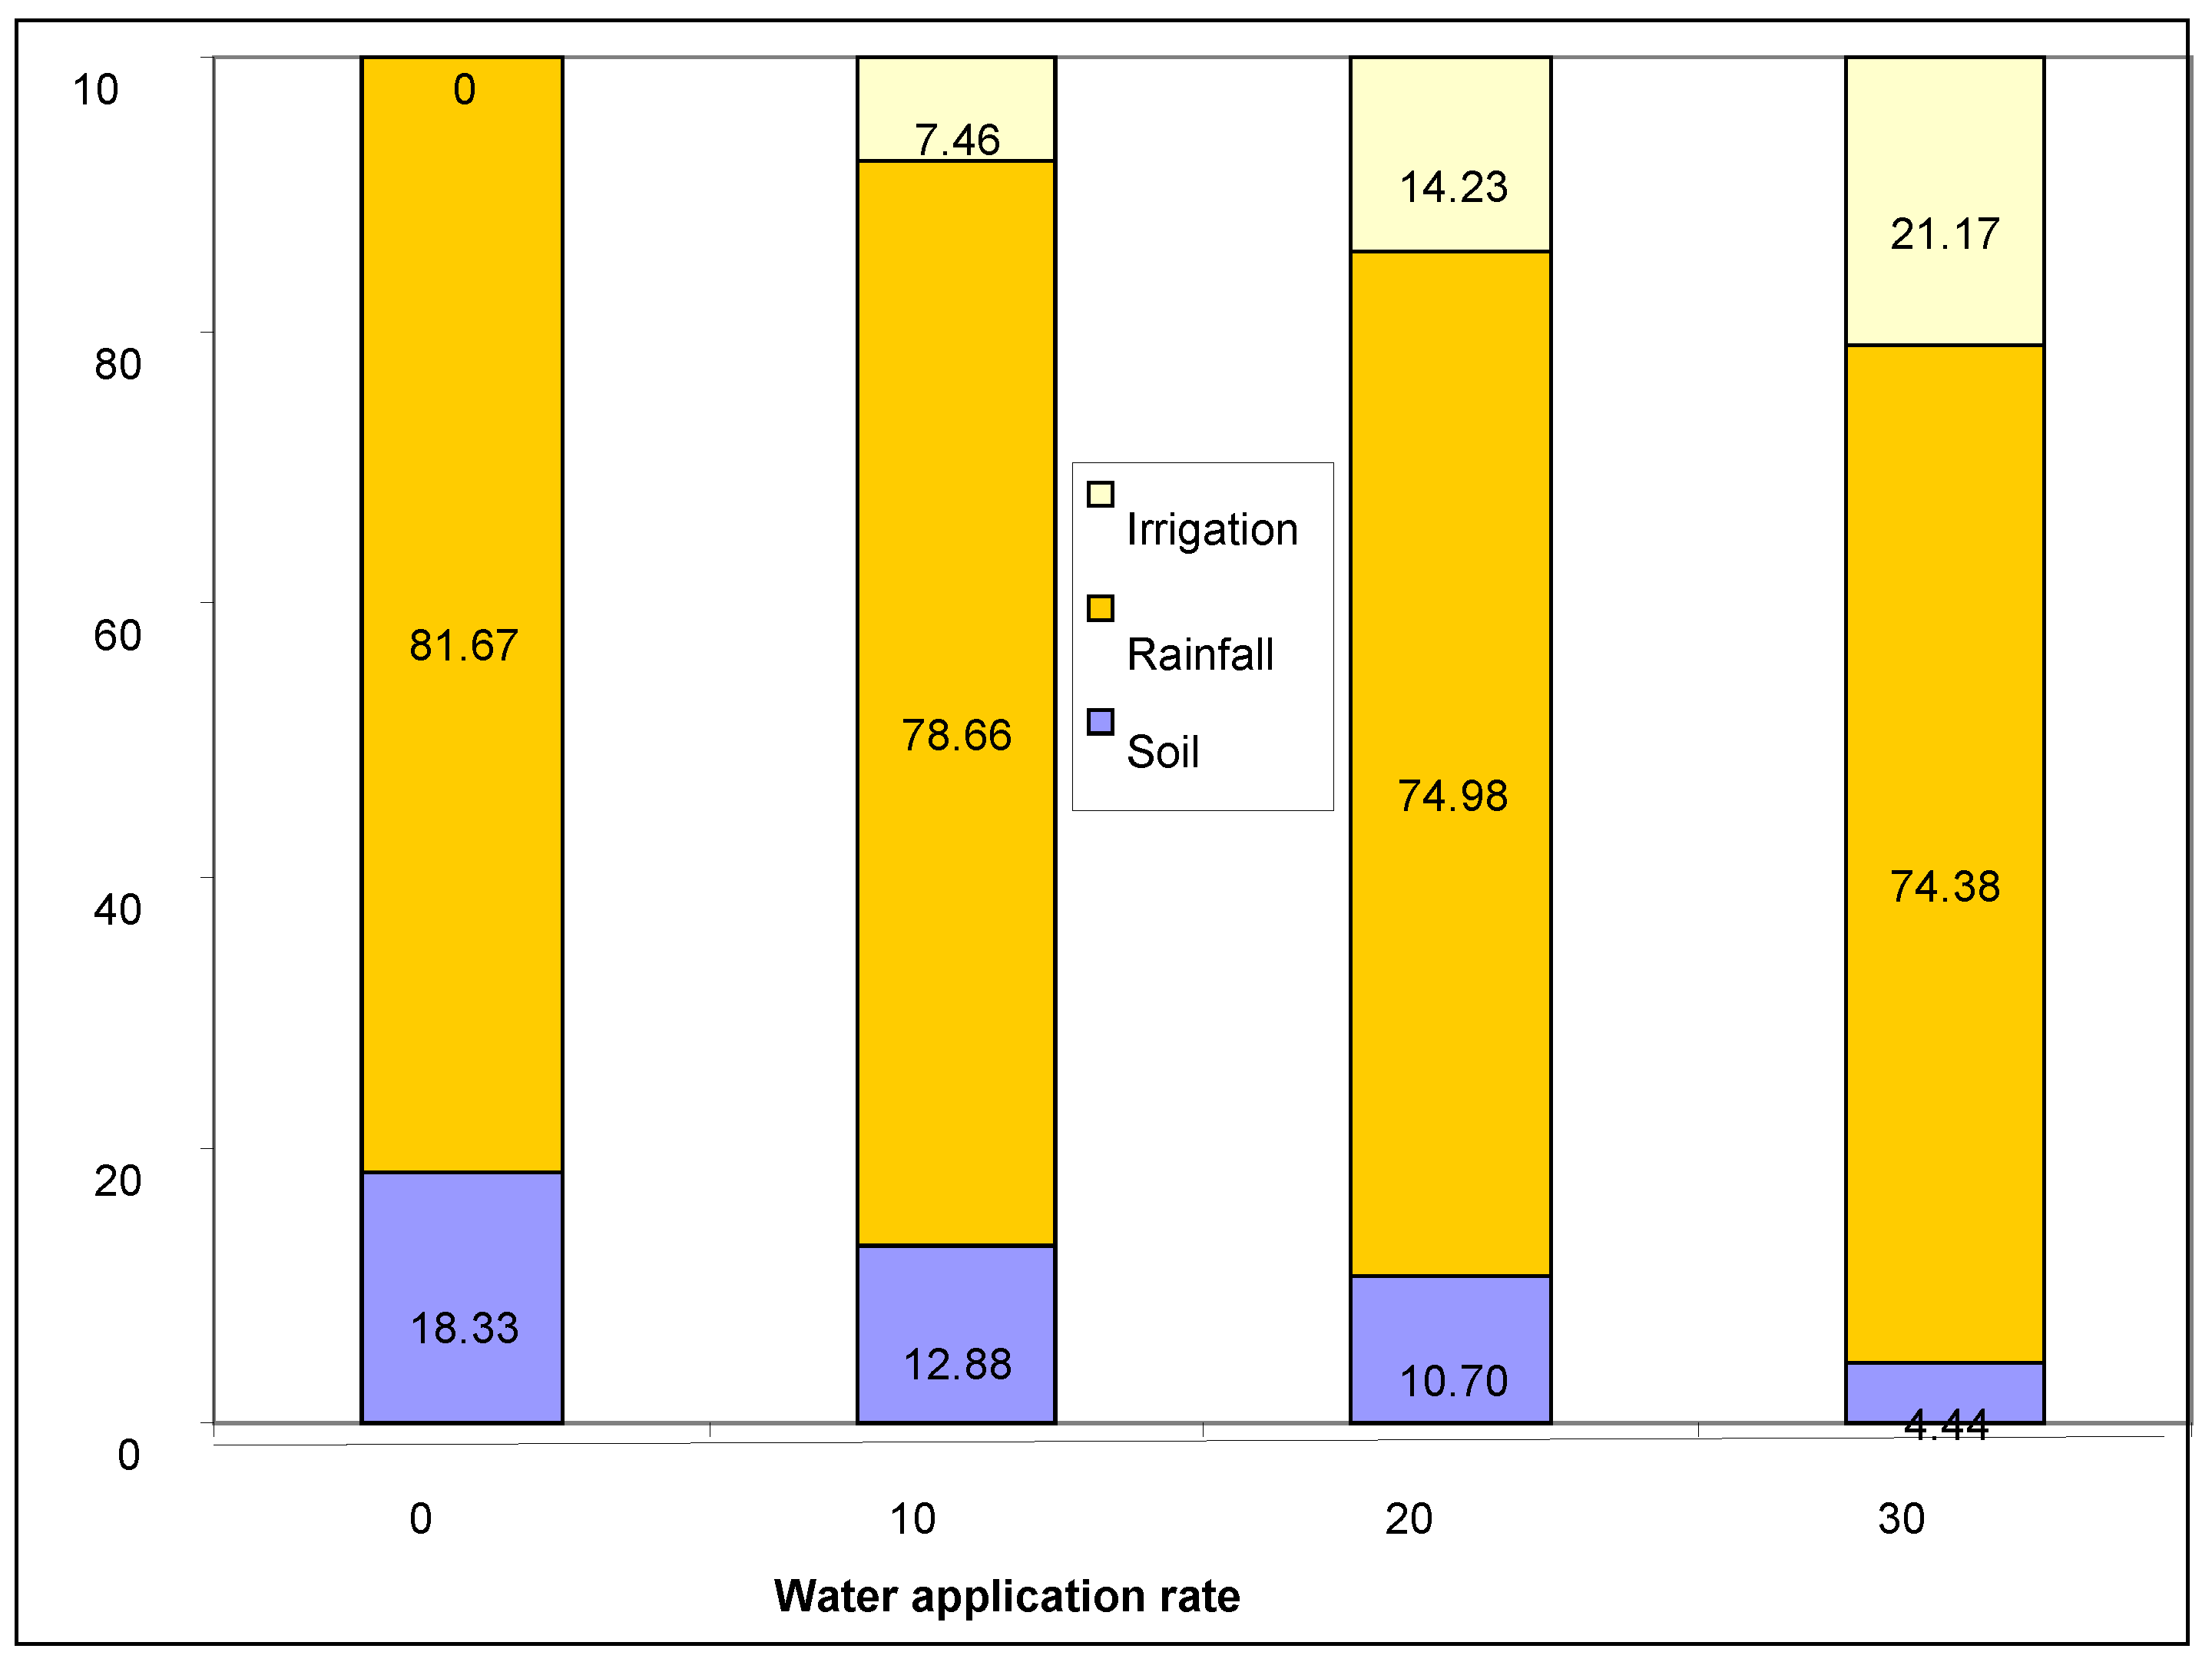

Table 1.
The values and quartiles of Lp-Norm for the interaction factor Cultivar*Water_Norm*Fertilisation.
Table 1.
The values and quartiles of Lp-Norm for the interaction factor Cultivar*Water_Norm*Fertilisation.
| Interaction Factor: Cultivar*Water_Norm*Fertilisation | Lp-Norm values | Lp-Norm Quartiles |
| GALA*30mm*NPKv16 | 1.0000 | 4 |
| GALA*30mm*NPKv24 | 1.0000 | 4 |
| JonaGold*20mm*NPKv0 | 1.0000 | 4 |
| JonaGold*30mm*NPKv0 | 1.0000 | 4 |
| JonaGold*30mm*NPKv16 | 1.0000 | 4 |
| GALA*30mm*NPKv8 | 0.9901 | 4 |
| JonaGold*30mm*NPKv8 | 0.9901 | 4 |
| JonaGold*30mm*NPKv24 | 0.9901 | 4 |
| GALA*30mm*NPKv0 | 0.9805 | 3 |
| JonaGold*20mm*NPKv24 | 0.9805 | 3 |
| JonaGold*10mm*NPKv0 | 0.9705 | 3 |
| GALA*0mm*NPKv0 | 0.9604 | 3 |
| JonaGold*10mm*NPKv24 | 0.9603 | 3 |
| GALA*20mm*NPKv8 | 0.9551 | 3 |
| JonaGold*20mm*NPKv16 | 0.9515 | 3 |
| GALA*20mm*NPKv24 | 0.9510 | 3 |
| JonaGold*20mm*NPKv8 | 0.9427 | 2 |
| JonaGold*10mm*NPKv16 | 0.9412 | 2 |
| GALA*20mm*NPKv16 | 0.9410 | 2 |
| JonaGold*0mm*NPKv0 | 0.9406 | 2 |
| GALA*0mm*NPKv8 | 0.9242 | 2 |
| GALA*20mm*NPKv0 | 0.9217 | 2 |
| JonaGold*10mm*NPKv8 | 0.9211 | 2 |
| JonaGold*0mm*NPKv24 | 0.9207 | 2 |
| GALA*10mm*NPKv24 | 0.9206 | 2 |
| JonaGold*0mm*NPKv16 | 0.9104 | 1 |
| GALA*10mm*NPKv16 | 0.9018 | 1 |
| GALA*10mm*NPKv8 | 0.9008 | 1 |
| JonaGold*0mm*NPKv8 | 0.8944 | 1 |
| GALA*10mm*NPKv0 | 0.8928 | 1 |
| GALA*0mm*NPKv16 | 0.8812 | 1 |
| GALA*0mm*NPKv24 | 0.8652 | 1 |
Table 2.
Average monthly temperatures and average monthly precipitation in 2024 (0 C).
| Month | Jan. | Feb. | Mar. | Apr. | May | Jun. | Jul. | Aug. | Sep. | Oct. | Nov. | Dec. | Average |
|
Average monthly temperatures (0C) |
-2.5 | -1.9 | 4.0 | 12.5 | 16.0 | 19.5 | 24.0 | 20.0 | 18.3 | 13.5 | 7.5 | -2.4 | 10.7 |
|
Average monthly precipitations (mm) |
12.5 | 15.7 | 18.0 | 2.0 | 103.8 | 55.6 | 86.4 | 30.8 | 57 | 63 | 20.4 | 54.3 | 43.29 |
Table 3.
Sources of water consumption coverage for different irrigation conditions in 2024 (m3/ha).
|
Year |
Irrigation rate |
Total water consumption (m3/ha) |
Source of water consumption coverage (m3 /ha) |
||
| Soil | Rainfall | Irrigation | |||
| 2024 | 0 mm | 3.872 | 710 | 3.162 | - |
| 10 mm | 4.020 | 558 | 3.162 | 300 | |
| 20 mm | 4.217 | 455 | 3.162 | 600 | |
| 30 mm | 4.251 | 189 | 3.162 | 900 | |
Disclaimer/Publisher’s Note: The statements, opinions and data contained in all publications are solely those of the individual author(s) and contributor(s) and not of MDPI and/or the editor(s). MDPI and/or the editor(s) disclaim responsibility for any injury to people or property resulting from any ideas, methods, instructions or products referred to in the content. |
© 2025 by the authors. Licensee MDPI, Basel, Switzerland. This article is an open access article distributed under the terms and conditions of the Creative Commons Attribution (CC BY) license (https://creativecommons.org/licenses/by/4.0/).
Copyright: This open access article is published under a Creative Commons CC BY 4.0 license, which permit the free download, distribution, and reuse, provided that the author and preprint are cited in any reuse.


