
Submitted:
15 July 2025
Posted:
16 July 2025
You are already at the latest version
Abstract
Accurate detection of water in organic solvents is essential for various industrial and analytical applications. In this study, we present a simple, rapid, and sensitive fluorescence-based method for water quantification using 1,5-diaminonaphthalene (1,5-DAN) as a solvatochromic probe. The method exploits the excited-state intramolecular charge transfer (ICT) behavior of 1,5-DAN, which undergoes a symmetry-breaking transition in the presence of protic solvents such as water, leading to a distinct redshift in its emission spectrum and a change from a structured double band to a single ICT band. We demonstrate that in solvents like acetonitrile and tetrahydrofuran, the emission maxima of 1,5-DAN correlate linearly with water content up to 100%, while ratiometric analysis of peak intensities allows for sensitive detection in the low concentration range. The method achieved limits of detection as low as 0.08% (v/v) in MeCN, with high reproducibility and minimal sample preparation. Application to a real MeCN–water azeotrope confirmed the method’s accuracy, matching classical refractometric measurements.Our findings highlight the potential of 1,5-DAN as a low-cost, efficient, and non-destructive fluorescent sensor for monitoring moisture in organic solvents, offering a practical alternative to conventional methods such as Karl Fischer titration for both bulk and trace water analysis.
Keywords:
water detection
; solvent
; diaminonaphthelene
; ratiometric
; fluorescence
1. Introduction
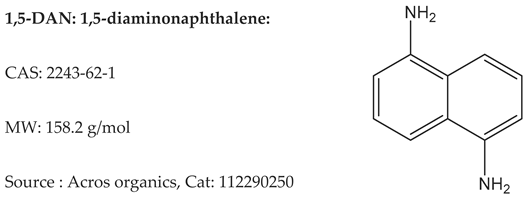
Accurate water content determination is vital for ensuring product quality and process efficiency in the chemical industry[1]. The presence of water in organic solvents can lead to catalyst poisoning[2], undesired side reactions[3], shifts in chemical equilibria[3] and can significantly influence corrosion rates[4]. Moreover, accurate on-line measurement of moisture in industrial solvents is crucial for solvent recovery, as it enhances the efficiency and economy of continuous distillation columns[5]. Various analytical methods have been developed to accurately measure water content in different chemical matrices, each with its advantages and limitations. The Karl Fischer (KF) titration is a preferred method for industrial quality control, capable of measuring water content in solid, liquid, and gaseous samples across a wide range from ppm to 100%[6]. Although being the most widely used and highly accurate method, it requires larger sample sizes and can be destructive[7]. Its limitations include the inability for continuous analysis and the requirement for specific (costly) reagents and equipment[8]. Besides KF titration, rapid Ambient Mass Spectrometry[9] capable of detecting water over a wide concentration range, from 10 ppm to 99%, Cathodic Stripping Voltammetry (CSV)[10] based on electrooxidation of a gold electrode, Gas Chromatography (GC)[7] a versatile and small sample size requiriring method, Infrared Spectroscopy (IR) for trace water analysis, utilizing the water fundamental at 2.8 μm[11] can be mentioned. For continuous monitoring in various organic solvents, optical sensors, categorized into spectrophotometry and spectrofluorimetry, are favored for their simplicity, low cost, and minimal need for complex equipment. [8] Fluorescent probes have emerged as effective tools for determining water content in organic solvents, leveraging various mechanisms to achieve high sensitivity and specificity. Recent studies highlight several innovative approaches, including carbon quantum dots (CQDs) and metal-organic frameworks (MOFs), which demonstrate promising results in detecting trace water levels across different solvents. Nitrogen-doped carbon quantum dots (Y-CDs and R-CDs) exhibit significant fluorescence quenching in the presence of water, with detection limits as low as 0.056% in solvents like acetone and DMF[12]: Another study reported carbon quantum dots with a detection limit of 0.01% in solvents such as ethanol and THF[13]. A novel MOF (SNNU-301) utilizes Excited-State Intramolecular Proton Transfer (ESIPT) for a turn-on fluorescence response, achieving detection limits of 0.011% in dimethyl sulfoxide[14]. Owing to their simple structure and easy preparation, naphthalene-based 1,8-naphthalimide probes have emerged as effective tools for detecting water content in organic solvents due to their unique fluorescent properties. These probes leverage the interaction between solvent polarity and fluorescence intensity, allowing for precise measurements of water concentration. N-amino-4-(2-hydroxyethylamino)-1,8-naphthalimide (AHN) shows a linear decrease in fluorescence intensity with increasing water concentration in organic solvents with detection limits of 0.019%, 0.038%, and 0.060% for dioxane, acetonitrile, and ethanol, respectively.[15] A highly water-soluble naphthalimide probe has been developed for solid-state applications, allowing for the detection of acid/base vapors and water content in a more versatile manner.[16] Ones of the simplest naphthalene-based fluorescent probes are symmetric, quite small molecular weight diaminonaphthalenes, namely 1,5- and 1,8-diaminonaphtalenes (1,5-DAN and 1,8-DAN, respectively). DANs are important precursors of smart fluorescent dyes and polymers.
During our preliminary studies we were surprised to find that both 1,5- and 1,8-DAN exhibited real solvatochromic behavior[17]. We have proposed an aromatic quasi-iminium ion (Ar=NH2+) based excited state form for the transformation of the originally symmetrical structure in ground state (S0) to a non-symmetrical excited state (S1), where intramolecular charge transfer (ICT) happens between two non-equivalent NH2 groups (Figure 1). The emission spectra of 1,5-DAN show significant differences in non-protic and protic solvents. In non-protic solvents, 1,5-DAN contains structured (double) bands, whereas in protic solvents there is only a broad band in the spectrum, which may be explained by the stabilization of the iminium form in protic solvents by H-bonds. For 1,8-DAN, only one band is present in all solvents. A red shift is observed in the emission maxima of both symmetric diamines as the proton donor properties of the solvent increase. The observed bathochromic shifts are almost exactly 40 nm in both cases: λEm=367-406 nm (1.5-DAN) and λEm=398-439 nm (1.8-DAN)[17]. We wondered whether these changes in the emission spectrum could be utilized for the detection of protic moieties i.e. water in aprotic solvents.
Hereby, we report the first application of the simple 1,5-diaminonaphthalene for the detection of both large and trace amounts of water in aprotic solvents, such as acetonitrile, tetrahydrofuran and dimethylsulfoxide, based on the redshift and transition from double peak to single ICT band of the emission spectra.
2. Materials and Methods
2.1. Materials
Solvents
The main criterion for the selection of solvents was low water content (maximum 30-50 ppm). Absolute solvents were not required because the method is not suitable for the determination of trace amounts of water, so the moisture content of the solvents remained below the detection limit. Acetonitrile (MeCN), tetrahydrofuran (THF), dimethyl sulfoxide (DMSO) (HPLC grade, VWR, Germany), and 1,4-dioxane (reagent grade, Reanal, Hungary) were used without further purification. For water content measurements deionized water R=18 MΩ was used.
2.2. Methods
Fluorimetry
The excitation and emission spectra were recorded on a Jasco FP-8550 Spectrofluorometer. at 20 °C, with an excitation and emission bandwidth of 2.5 nm and a scan rate of 200 nm/min. The previously determined absorption maxima were chosen as excitation wavelengths (λex=333 nm in MeCN and dioxane, λex=344 nm in THF, λex=341 nm in DMSO). The absorbance at the excitation wavelength was kept below A = 0.1 to avoid self-absorption. First, the spectrum of the pure solvent was recorded to exclude contaminants that might affect the peak shape. Raw spectra were evaluated using Spectragryph and Origin 2018 software.
Bulk water determination
For the investigation of solvent water mixtures, the following compositions were prepared as shown in Table 1.
To the mixtures 10 µL of 1,5-DAN stock solution at a concentration of 3.12 mM (in MeCN) was added and the emission spectra were recorded.
Low water content determination
10 µL of 1,5-DAN stock solution at a concentration of 3.12 mM (in MeCN) was added to 2990 µL MeCN and the emission spectrum was recorded. This sample corresponds to the sample containing 0 M water. Consequently, deionized water was added to the sample at 10 µL between 0-100 µL and 20 µL between 100-200 µL. After each addition the sample was homogenized by shaking in a stoppered cuvette and the bubbles formed were allowed to leave the solution and then the fluorescence spectrum was recorded. For each solvent triplicates were measured. The composition of the samples is presented in Table 3.

Table 2.
The amount of deionized water added to the 3000 µL 1,5-DAN in MeCN solution and the resulting H2O concentrations. The volume change was taken into consideration when calculating final water concentration.
Table 2.
The amount of deionized water added to the 3000 µL 1,5-DAN in MeCN solution and the resulting H2O concentrations. The volume change was taken into consideration when calculating final water concentration.
| Polluting solvent (H2O) | |
| Quantity added (µL) | Concentration H2O (mol/dm3) |
| 0 | 0.0000 |
| 10 | 0.1846 |
| 20 | 0.3679 |
| 30 | 0.5501 |
| 40 | 0.7310 |
| 50 | 0.9107 |
| 60 | 1.0893 |
| 70 | 1.2667 |
| 80 | 1.4430 |
| 90 | 1.6181 |
| 100 | 1.7921 |
| 120 | 2.1368 |
| 140 | 2.4770 |
| 160 | 2.8129 |
| 180 | 3.1447 |
| 200 | 3.4722 |
Acetonitrile-water distillate
The refractive index of the MeCN-H2O distillate was measured by an Anton Paar Abbemat 3200 refractometer at 20 ºC. The density of the distillate was determined in a 25 cm3 picnometer at 20 ºC. The average of 3 measurements was taken as the final value.
3. Results and Discussion
3.1. Determination of Water Content of Solvent Mixtures in the Range of 0-100%
It is clear from the results presented in Figure 1, that for 1,5-DAN the redshift of the emission maxima can be used to determine the polarity of the medium. Since the polarity of water (εr= 80.1) is the highest among the commonly used solvents, we assume that the composition of the organic solvent-water mixture can be determined from the position of the emission maxima. To test this assumption, commonly used aprotic organic solvents, such as acetonitrile (MeCN), tetrahydrofuran (THF), dioxane and dimethyl sulfoxide (DMSO) were chosen that are well miscible with water. Consequently, aqueous mixtures in the range of 0-100% were prepared in 10% steps (Table 3). Emission spectra were recorded at the respective absorption maximum of 1,5-DAN in the solvents: λex=333 nm (MeCN), λex=333 (Dioxane), λex=344 nm (THF), λex=341 nm (DMSO), and the results are summarized in Table 3 and in Figure 2. The original spectra and that of DMSO are presented in Figures S1–S8 in the Supporting Information. Since fluorescent intensity decreases with increasing water content, for better visualization normalized spectra are compared in Figure 2.
Table 3.
Percentage by volume composition of the organic solvent-water mixtures used in the experiment and the emission maxima of 1,5-DAN measured in them.
Table 3.
Percentage by volume composition of the organic solvent-water mixtures used in the experiment and the emission maxima of 1,5-DAN measured in them.
| Water content (v/v) | |||||||||||
| 0% | 10% | 20% | 30% | 40% | 50% | 60% | 70% | 80% | 90% | 100% | |
| Solvent | Emission maximum (nm) | ||||||||||
| MeCN | 377 | 379 | 381 | 383 | 386 | 388 | 393 | 397 | 400 | 403 | 405 |
| THF | 378 | 381 | 382 | 382 | 383 | 384 | 388 | 392 | 399 | 402 | 405 |
| Dioxane | 377 | 379 | 380 | 382 | 383 | 386 | 391 | 395 | 399 | 402 | 404 |
| DMSO | 386 | 386 | 386 | 387 | 387 | 389 | 392 | 396 | 400 | 402 | 403 |
It is evident from Figure 2 and Figures S1–S8 that in all four solvents studied, the emission maximum is redshifted by the increasing water content. Similarly, in all 4 solvents, a double-peaked band structure is observed in anhydrous medium, indicating the presence of the symmetric excited form of 1,5-DAN, where both NH2 groups are sp3 hybridized (Figure 1B and Figure 2A). In acetonitrile, the double-peaked structure disappears at about 20% water content (Figure 2A), whereas in THF (Figure 2B) and dioxane (Figure 2C), the higher energy peak (at 364 nm) can be identified up to 50% water, as a shoulder. A significant difference can be observed in DMSO (Figures S7 and S8) where between 0-50% water content the position of the emission maximum is virtually unchanged, only the shape of the peak changes. To visualize the variation, the emission peak maximum is plotted as a function of water content (Figure 3). Here again, the different behavior of DMSO is immediately striking. This can be explained by the fact that DMSO can form strong hydrogen bonds with water molecules[18], so that at low water content the water molecules compete with the H-bond donation between DMSO and the sp3 NH2 group of the asymmetrical excited 1,5-DAN (Figure 1C). Similarly, THF and dioxane are also able to accept H-bonding from water molecules, but much weaker than in the case of DMSO. The lower H-bond accepting ability is clearly observed in the sigmoidal slope of the curves. A near linear correlation is observed only for acetonitrile, which is not involved in H-bond formation, so that all the added water helps to stabilize the asymmetric iminium ion-containing form.
The values measured in acetonitrile were also plotted separately and subjected to regression analysis using Origin 2018 software (Figure 3B). It is clearly seen that the emission maxima fall on a straight line with a close to one adjusted coefficient of determination, R2adj=0.999.
3.2. Testing the Method on MeCN-Water Azeotrope as Real Sample
Acetonitrile is employed as a key solvent in high-performance liquid chromatography (HPLC) applications[19]. The bulk of the mobile phase is water, usually 70-80% (v/v), and the recovery of acetonitrile is carried out by distillation. However, owing to the azeotropic phenomenon, acetonitrile cannot be separated from its aqueous solution by a conventional rectification method.[20] The composition of the azeotropic mixture[20] at 1 atm is 69.71 % (n/n) MeCN and 30.29% (n/n) H2O, which corresponds to 84.0% (m/m) MeCN and 16.0% (m/m) H2O. Fluorometry offers a quick and efficient way to determine the water content in the distilled acetonitrile. To check the applicability of our method 1,5-DAN was added to freshly distilled MeCN:Water distillate close to the azeotropic composition, was measured three times and the results are presented in Figure 4.
It can be seen from Figure 4A that the emission spectra of the 3 independent measurements for the near azeotropic distillate perfectly overlap indicating the reproducibility of the method. It is also evident that the emission peak of the distillate is located between the previously measured 10% and 20% (v/v) water containing MeCN samples, closer to the 20%. The emission maximum was λem, max=380.48±0.06 nm. Using the recalculated calibration curve to mass percent in Figure 4B y=374.36+0.297×%water the water content of our sample was determined to be 20.6 % (m/m) as indicated by dashed lines in Figure 4B. The refractive index of the mixture was nD,20=1.3463 and its density 0.808±0.001 g/cm3. A 20 % (m/m) water containing MeCN sample was freshly prepared by mixing 1.00 ml water and 5.10 ml MeCN. Its refractive index was measured exactly as nD,20= 1.3463. This indicates the usability of the method for the determination of the water content of aqueous acetonitrile, such as obtained after azeotropic distillation. The accuracy of the method is approximately 1%.
3.3. Determination of Water Content of Solvent Mixtures in the Low Concentration Range
The change in the shape of the emission peaks, i.e. the decrease in the intensity of the high-energy peak at λem=364 nm (shoulder), opens the possibility of detecting/determining small amounts of H-donor moieties, e.g. water. To develop an analytical method, fluorescence titration experiments were carried out where water was added in 10 µL increments to 3.00 mL of 1,5-DAN solution in the corresponding dry (H2O < 30 ppm) solvent. First, the spectrum of the pure solvent was recorded to exclude contaminants that might affect the peak shape. None of the solvents contained fluorescent contaminants. The water titration results in acetonitrile and THF are summarized in Figure 5.
As expected, even after the addition of small amounts of water, the intensity of the higher energy shoulder at λem=364 nm (belonging to the symmetrically excited state, Figure 1B) decreased, while an increase in intensity was observed at higher wavelengths (belonging to the asymmetrically excited state, Figure 1C). To better visualize the changes, normalized spectra were used since the addition of water causes dilution and thus intensity changes. The normalized spectra show better the change of the peak shape, which indicates the disappearance of the symmetric excited structure and the appearance of the asymmetric water-stabilized iminium form. Since both a simultaneous decrease and increase in intensity can be observed in the spectra, it is worthwhile to reduce the quantitative analytical method to a ratiometric one, as this allows the method to be independent of external factors such as dye concentration and temperature. In order to decide which wavelength ratio to be taken into account, an optimization was carried out as seen in Figure 6.
It is evident from Figure 6 that the longer the wavelengths, the higher the slope of the intensity ratios, i.e. the sensitivity of the method depends strongly on the wavelengths chosen. After a careful evaluation the 364/440 nm pair was chosen for further investigations. As shown in Figure 5C for acetonitrile, I364/I440 gives an almost perfectly straight line as a function of water concentration in the range 0.00-1.79 M, where the coefficient of determination is close to 1 (R2=0.998), demonstrating the analytical applicability of the method. The equation of the calibrating line is y = -1.66x + 11.8, that is one unit change in the intensity ratio corresponds to 0.60 M water (approximately 1% v/v). 10 µL of water corresponds to 0.3% v/v for a total volume of 3.00 mL. Above 1.79 M water concentration the linearity is no longer valid, most probably due to the redshift of the emission with increasing water content as was presented previously in Figure 2. Repeating the experiment in tetrahydrofuran shows similar results as in acetonitrile. The slope of the calibration line (m=-1.75) is within 10% of that in acetonitrile (m=-1.66), illustrating the applicability of the method in other solvents.
3.4. Limit of Detection and Limit of Quantification of the Method
To evaluate the sensitivity and reliability of the method, limit of detection (LOD) and limit of quantification (LOQ) investigations were carried out. LOD and LOQ were calculated as LOD = 3σ and LOQ = 10σ, where σ represents the standard deviation of the blank (1,5-DAN measured 10 times). For the calculations the calibration curves in Figure 5C and 5D were used, the background spectra, and detailed LOD and LOQ calculations for MeCN and THF are provided in the Supporting Information in FigureS9-10. The summarized data are presented in Table 4.
Of the two solvents investigated MeCN gave the lower LOD value of 0.047 M H2O, which corresponds to 0.08 % (v/v). The method also demonstrated relatively high sensitivity in THF, with an LOD of 0.047 M water, that is 0.13 % (v/v). From the results it is evident that we can go down to a water content of about 0.1%, which should be sufficient for most practical applications.
4. Conclusions
In this study, we introduced a simple yet highly effective fluorometric method for detecting water content in aprotic organic solvents using 1,5-diaminonaphthalene (1,5-DAN) as a fluorescent probe. Our results demonstrate that the solvatochromic shift in the emission spectrum of 1,5-DAN, driven by the formation of an excited-state iminium form stabilized by protic solvents, provides a sensitive and reproducible means of quantifying water concentration. We observed a clear redshift in emission maxima and a characteristic peak transition from a double-structured to a single ICT band upon increasing water content. The method proved linear, accurate, and highly sensitive down to approximately 0.1% v/v water, with a limit of detection of 0.08% in acetonitrile and 0.13% in THF. Furthermore, its applicability was confirmed on a real azeotropic MeCN-water distillate, showing strong agreement with reference refractometry and density-based data. By employing ratiometric fluorescence measurements, we enhanced both the precision and robustness of the detection, making the method less susceptible to variations in dye concentration or external conditions. Due to its simplicity, low material requirement, and lack of need for specialized instrumentation, this method holds strong potential for integration into industrial process monitoring, solvent purification, and quality control applications where rapid and accurate moisture determination is essential.
Supplementary Materials
The following supporting information can be downloaded at the website of this paper posted on Preprints.org
Author Contributions
Conceptualization, M.N. and E.K.; methodology, E.K.; validation, E.K., M.N. and P.K.; formal analysis, E.K.; investigation, E.K.; data curation, P.K.; writing—original draft preparation, M.N., E.K: and P.K:; writing—review and editing, X.X.; visualization, X.X.; supervision, M.N.; All authors have read and agreed to the published version of the manuscript.”
Funding
The project was supported by TKP2021-NVA-14 grant of the National Office of Science, Innovation and Technology (NKFIH).
Data Availability Statement
The authors declare that the data supporting the findings of this study are available within the paper and its Supplementary Information file. Should any raw data files be needed in another format they are available from the corresponding author upon reasonable request.
Acknowledgments
This paper was Supported by the University Research Scholarship Program of the Ministry for Culture and Innovation from the source of the National Research, Development and Innovation Fund.
Conflicts of Interest
The authors declare no conflicts of interest.
Abbreviations
The following abbreviations are used in this manuscript:
| MDPI | Multidisciplinary Digital Publishing Institute |
| DOAJ | Directory of open access journals |
| TLA | Three letter acronym |
| LD | Linear dichroism |
References
- Shivam, L., Dr. Sachin, N., Dr. Shailesh, L. & Dr. Anuradha, P. Review on Moisture Content: A Stability Problem in Pharmaceuticals. EPRA International Journal of Research & Development (IJRD), 27-33 (2022). [CrossRef]
- Pahl, C., Pasel, C., Luckas, M. & Bathen, D. Adsorptive Water Removal from Organic Solvents in the ppm-Region. Chemie Ingenieur Technik 83, 177-182 (2010). [CrossRef]
- Goderis, H. L., Fouwe, B. L., Van Cauwenbergh, S. M. & Tobback, P. P. Measurement and control of water content of organic solvents. Analytical Chemistry 58, 1561-1563 (2002). [CrossRef]
- Heitz, E. in Advances in Corrosion Science and Technology Ch. Chapter 3, 149-243 (1974).
- Hall, T. F. et al. Computer-Controlled On-Line Moisture Measurement in Organic Solvents Using a Novel Potentiometric Technique. Measurement and Control 22, 240-244 (1989). [CrossRef]
- Schöffski, K. & Strohm, D. in Encyclopedia of Analytical Chemistry (2000).
- Padivitage, N. L. T., Smuts, J. P. & Armstrong, D. W. in Specification of Drug Substances and Products 223-241 (2014).
- Jouyban, A. & Rahimpour, E. Optical sensors for determination of water in the organic solvents: a review. Journal of the Iranian Chemical Society 19, 1-22 (2021). [CrossRef]
- Qiu, L. et al. Quantitative Determination of Water in Organic Liquids by Ambient Mass Spectrometry. Angewandte Chemie International Edition 62 (2023). [CrossRef]
- Xiao, C., Weremfo, A., Wan, C. & Zhao, C. Cathodic Stripping Determination of Water in Organic Solvents. Electroanalysis 26, 596-601 (2014). [CrossRef]
- Barbetta, A. & Edgell, W. Infrared Spectrophotometric Determination of Trace Water in Selected Organic Solvents. Applied Spectroscopy 32, 93-98 (1978). [CrossRef]
- Yang, C. et al. Determination of Trace Water Using Fluorescence Probes Based on Nitrogen-Doped Carbon Quantum Dot Fluorescence Senors (Y-CDs and R-CDs). ChemistrySelect 8 (2023). [CrossRef]
- Wei, J. et al. A novel fluorescent sensor for water in organic solvents based on dynamic quenching of carbon quantum dots. New Journal of Chemistry 42, 18787-18793 (2018). [CrossRef]
- Li, S.-Y. et al. High-Performance Turn-On Fluorescent Metal–Organic Framework for Detecting Trace Water in Organic Solvents Based on the Excited-State Intramolecular Proton Transfer Mechanism. ACS Applied Materials & Interfaces 14, 55997-56006 (2022). [CrossRef]
- Niu, C., Li, L., Qin, P., Zeng, G. & Zhang, Y. Determination of Water Content in Organic Solvents by Naphthalimide Derivative Fluorescent Probe. Analytical Sciences 26, 671-674 (2010). [CrossRef]
- Georgiev, N. I., Krasteva, P. V., Bakov, V. V. & Bojinov, V. B. A Highly Water-Soluble and Solid State Emissive 1,8-Naphthalimide as a Fluorescent PET Probe for Determination of pHs, Acid/Base Vapors, and Water Content in Organic Solvents. Molecules 27 (2022). [CrossRef]
- Kopcsik, E. et al. Excited state iminium form can explain the unexpected solvatochromic behavior of symmetric 1,5- and 1,8-diaminonaphthalenes. Chemical Communications 60, 1008-1011 (2024). [CrossRef]
- Virk, A. S., Codling, D. J., Stait-Gardner, T. & Price, W. S. Non-Ideal Behaviour and Solution Interactions in Binary DMSO Solutions. ChemPhysChem 16, 3814-3823 (2015). [CrossRef]
- Goetz, G. H., Beck, E. & Tidswell, P. W. On-Column Solvent Exchange for Purified Preparative Fractions. JALA: Journal of the Association for Laboratory Automation 16, 335-346 (2011). [CrossRef]
- Li, J., Wang, K., Lian, M., Li, Z. & Du, T. Process Simulation of the Separation of Aqueous Acetonitrile Solution by Pressure Swing Distillation. Processes 7 (2019). [CrossRef]
Figure 1.
Proposed structural changes and optical spectra of 1,5-diaminonaphthalene (1,5-DAN) with respect to solvent character in the ground (S0) and excited state (S1). (A) symmetric ground state structure and normalized UV-VIS absorption spectra, (B) symmetric excited state structure and normalized emission spectra in aprotic solvents, (C) asymmetric excited state structure and normalized emission spectra in water and methanol as protic solvents..
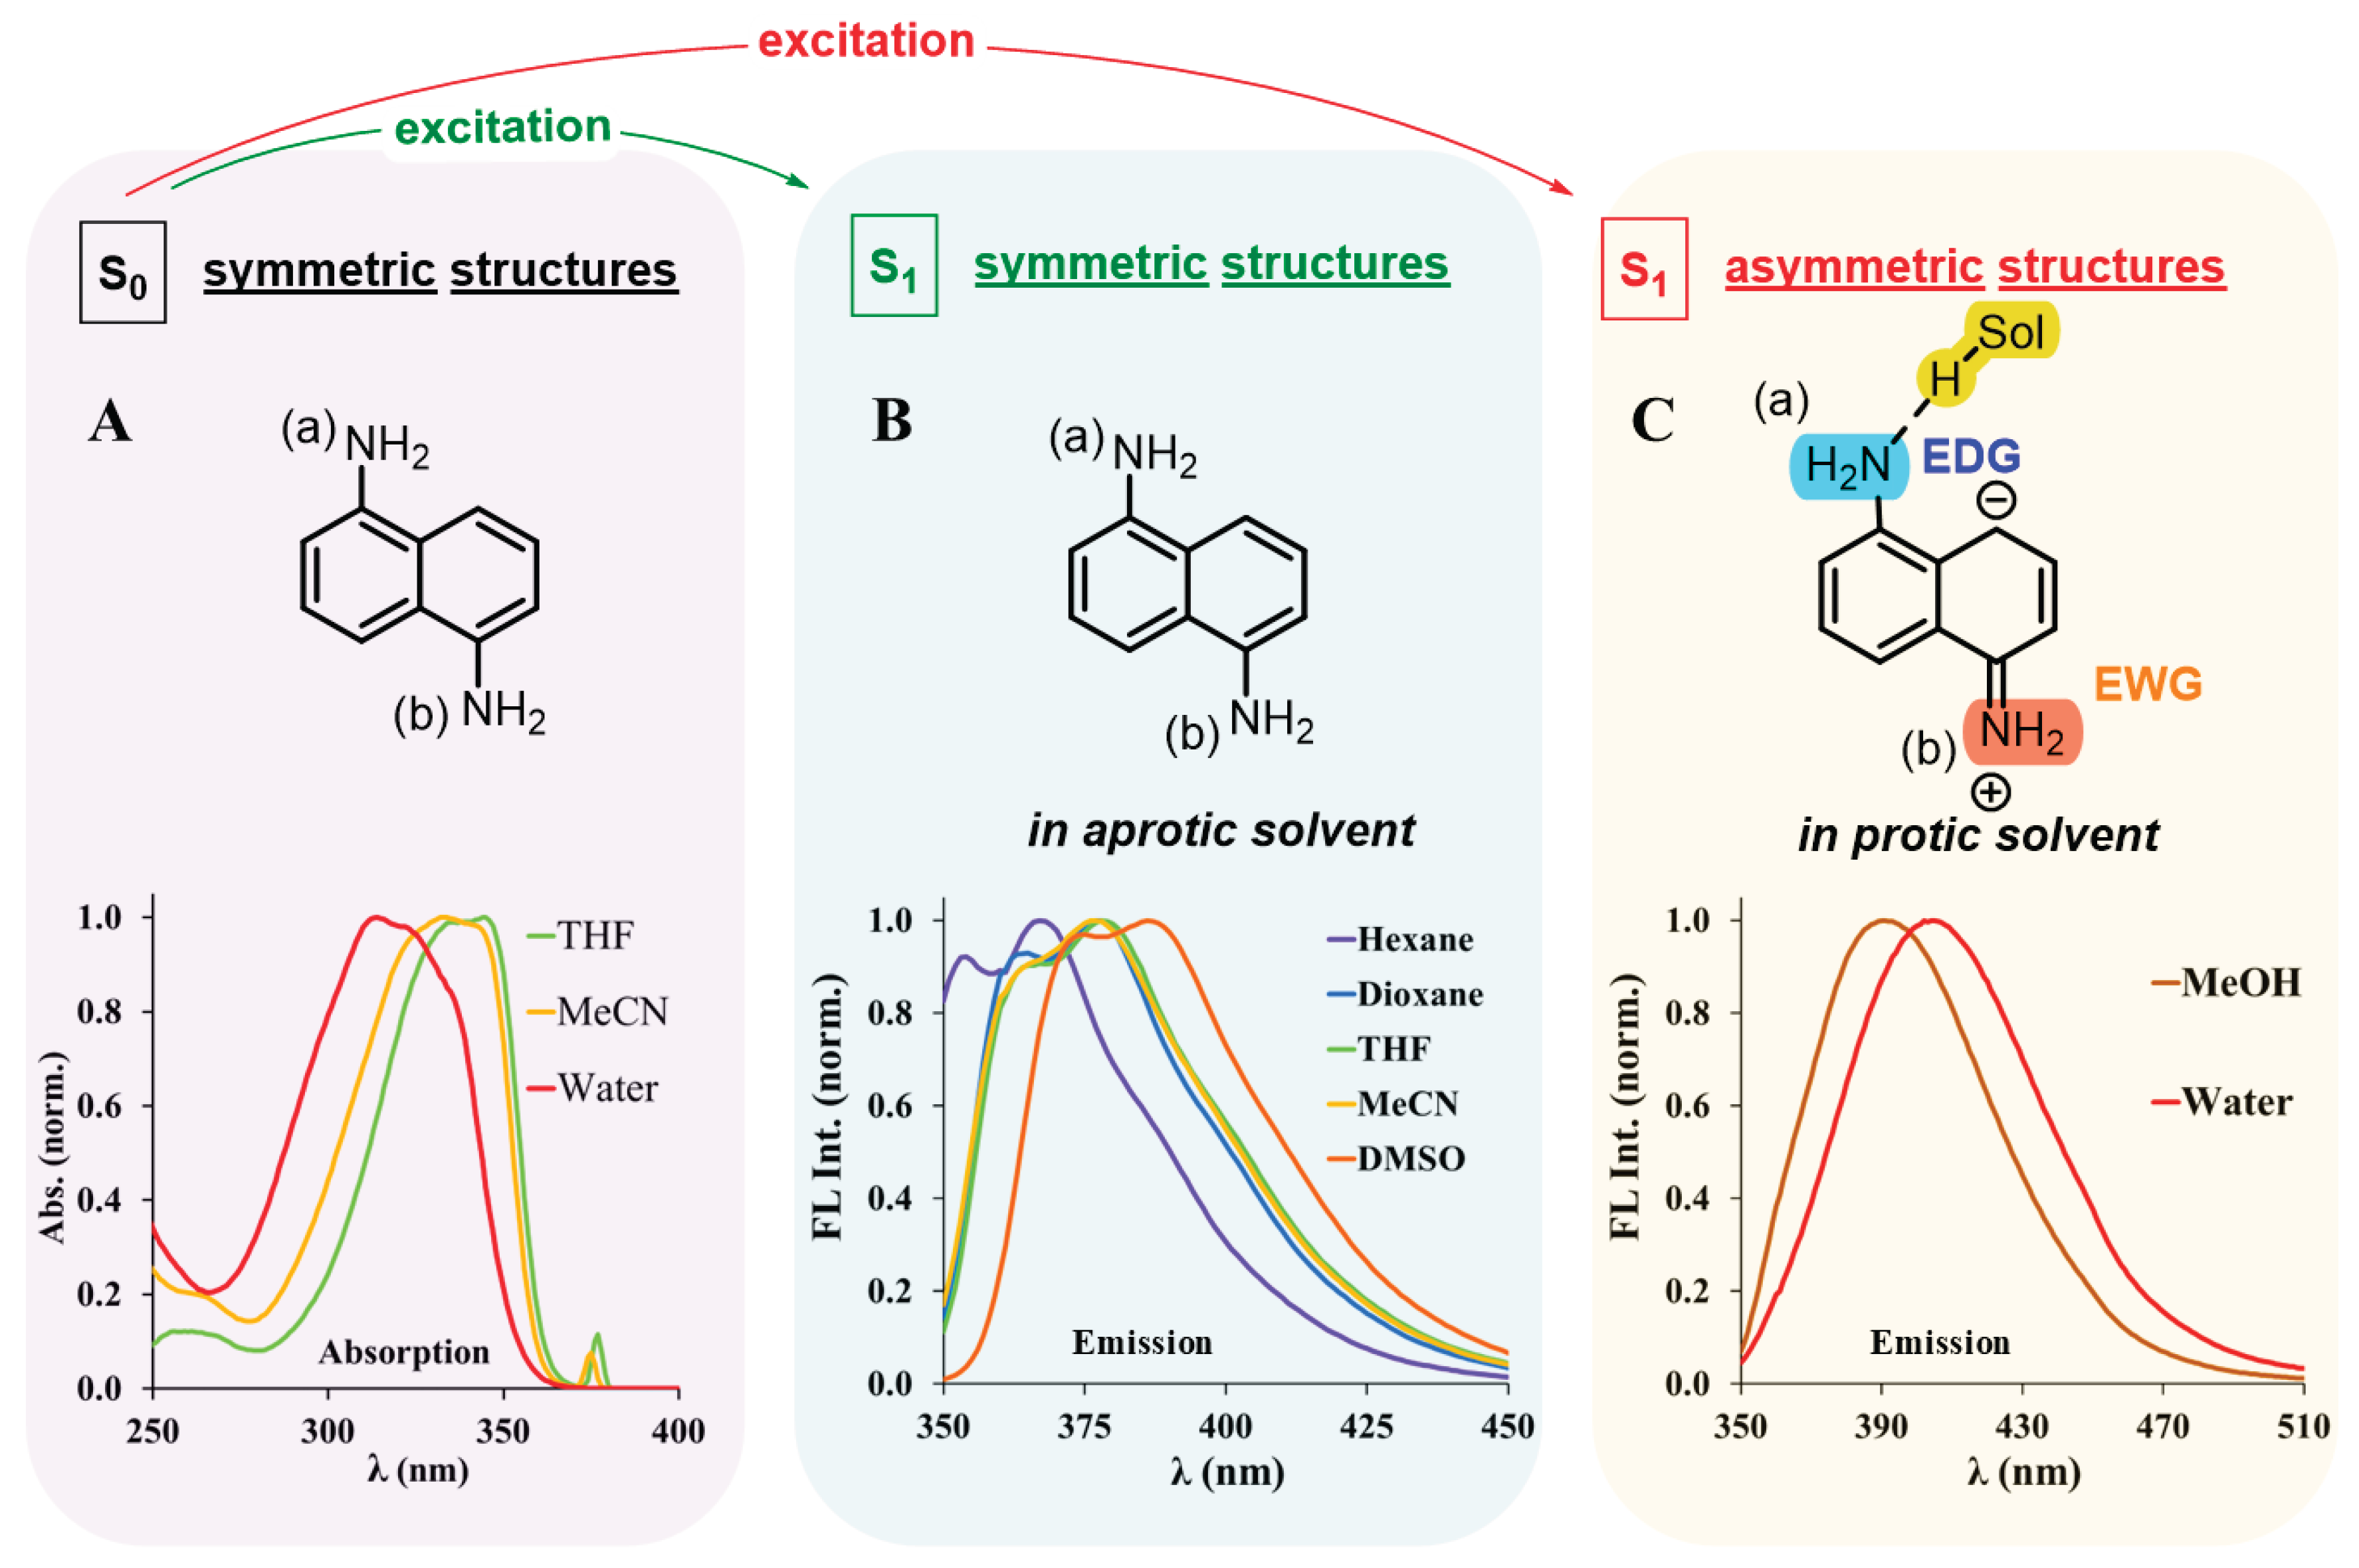
Figure 2.
Normalized emission spectra of 1,5-DAN in different water-solvent mixtures (A) acetonitrile-water, (B) tetrahydrofuran-water, (C) dioxane-water. ([1,5-DAN] = 1.05×10⁻⁵ M, T=20 ºC).
Figure 2.
Normalized emission spectra of 1,5-DAN in different water-solvent mixtures (A) acetonitrile-water, (B) tetrahydrofuran-water, (C) dioxane-water. ([1,5-DAN] = 1.05×10⁻⁵ M, T=20 ºC).
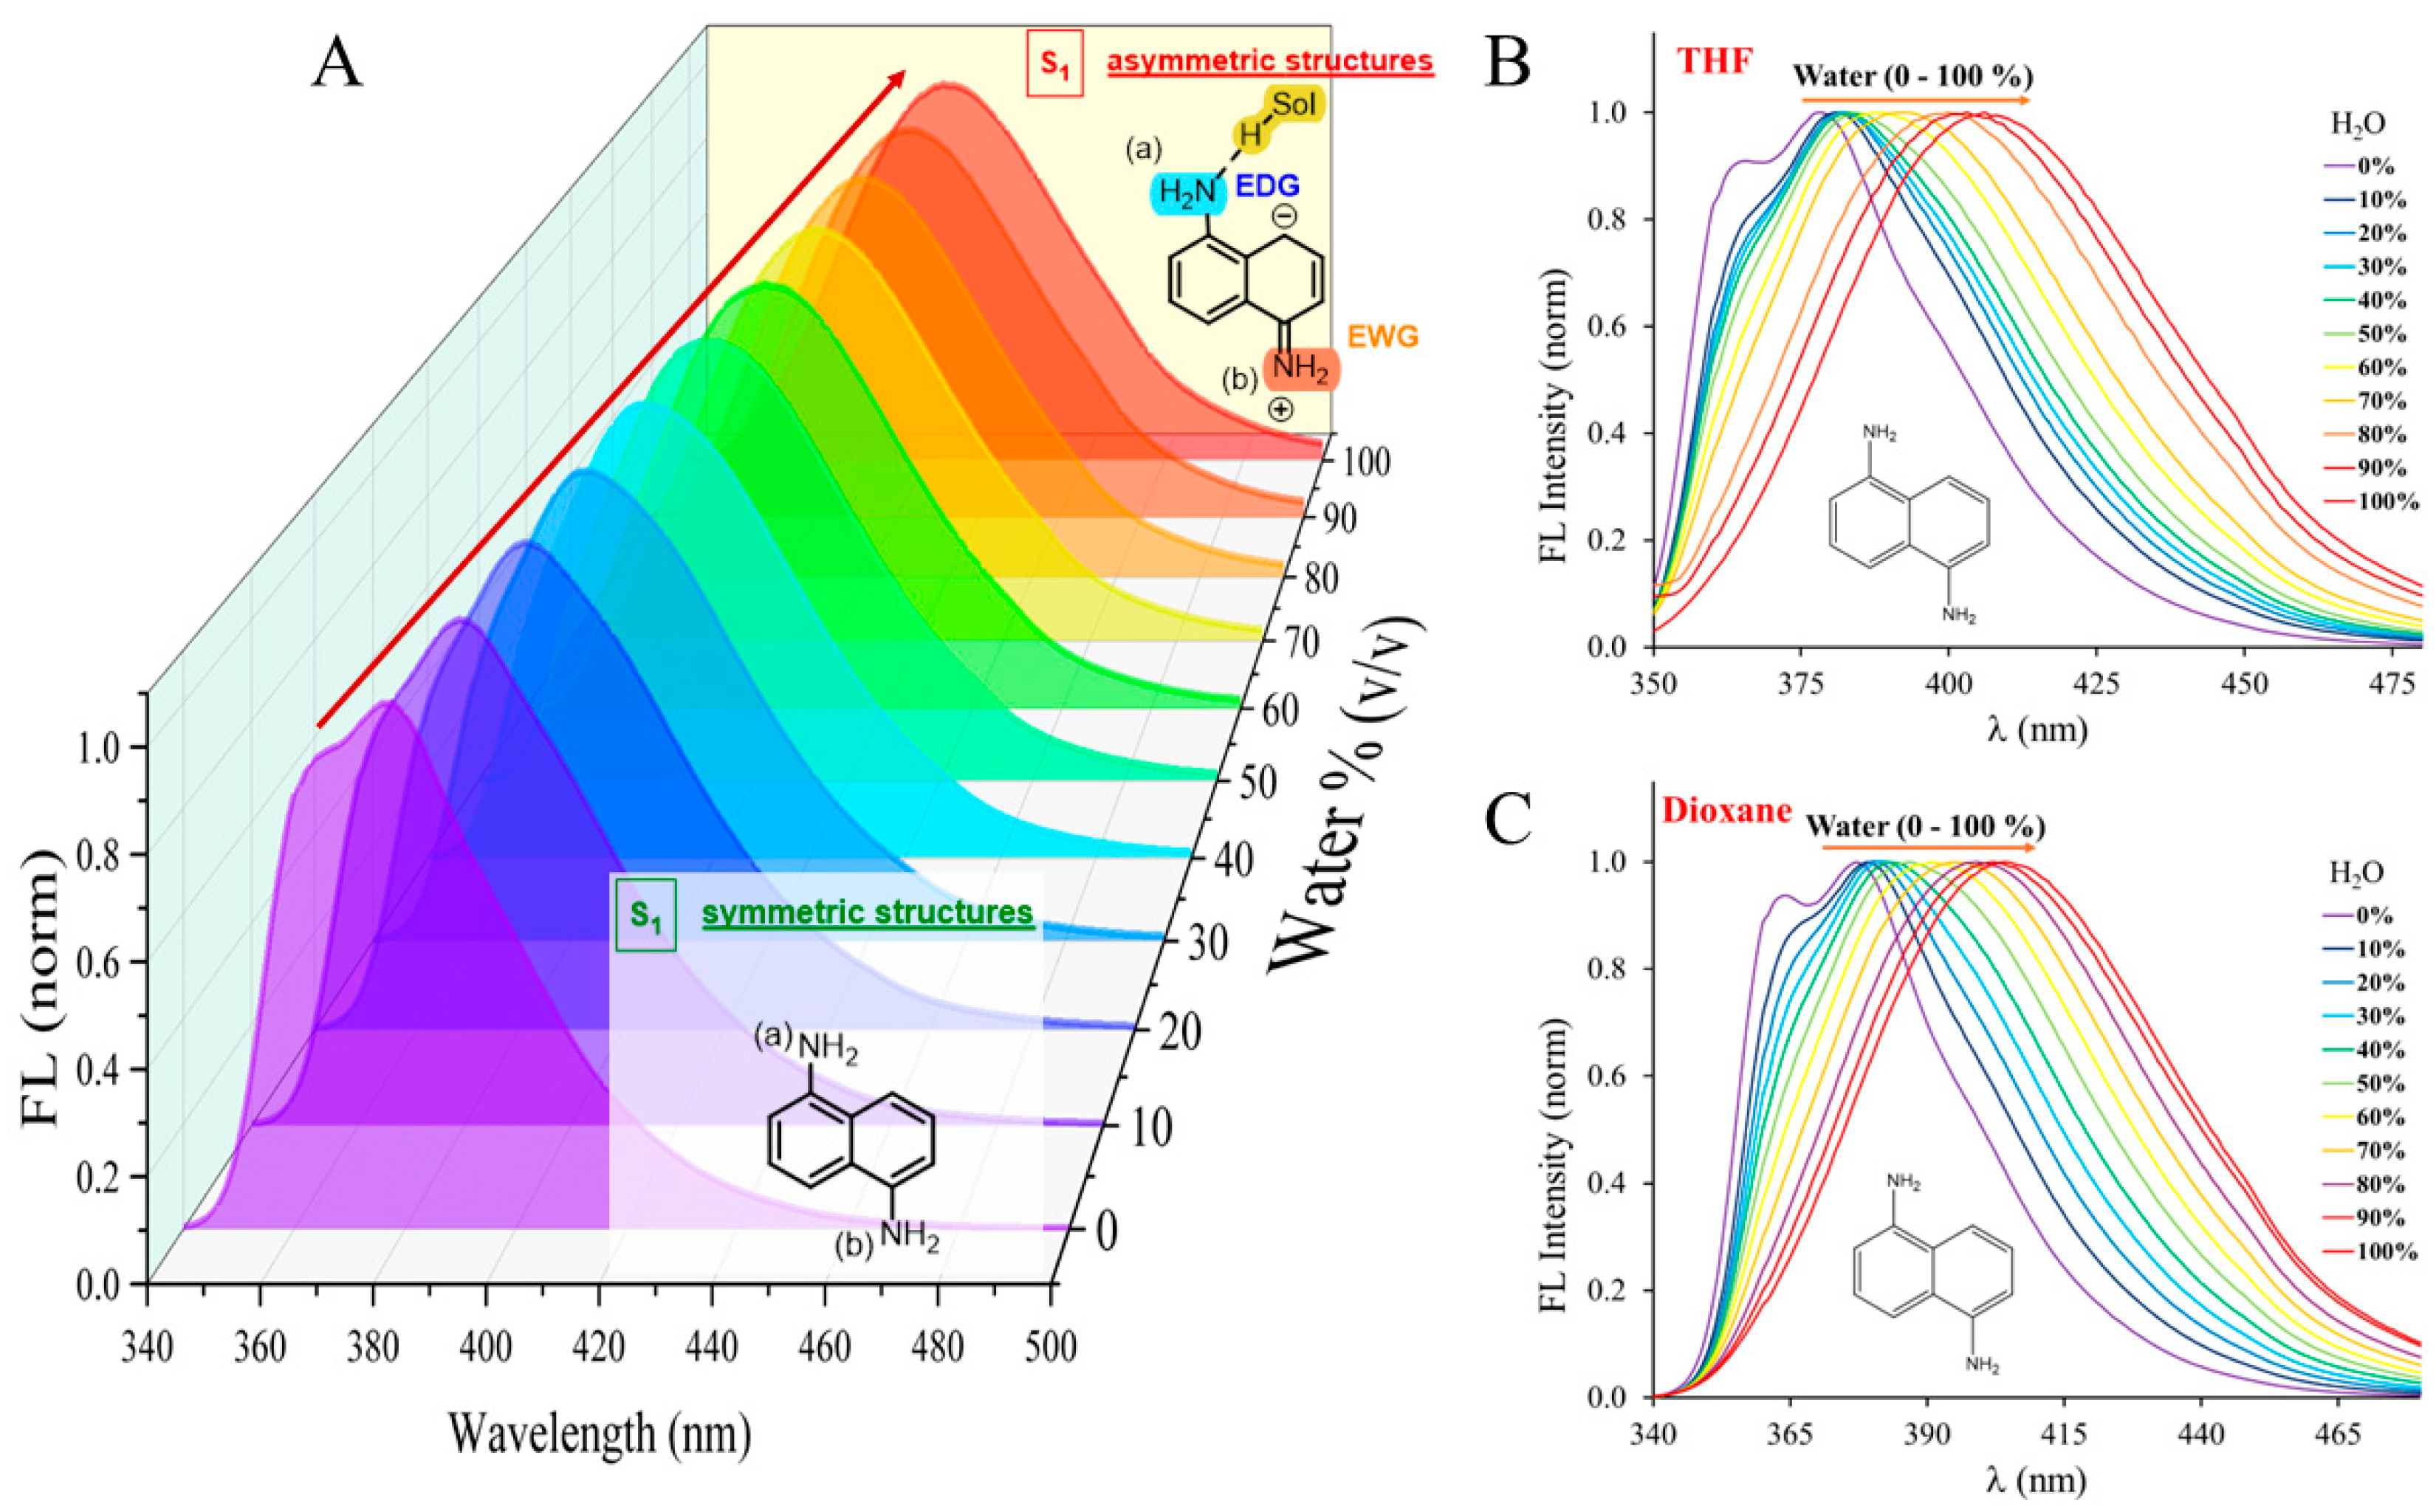
Figure 3.
(A) Emission maxima of 1,5-DAN as a function of water content in different solvents ([1,5-DAN] = 1.05×10⁻⁵ M, T=20 ºC). Figure. (B) Emission maxima of 1,5-DAN as a function of water content in acetonitrile. Text boxes show results of linear regression analysis.
Figure 3.
(A) Emission maxima of 1,5-DAN as a function of water content in different solvents ([1,5-DAN] = 1.05×10⁻⁵ M, T=20 ºC). Figure. (B) Emission maxima of 1,5-DAN as a function of water content in acetonitrile. Text boxes show results of linear regression analysis.
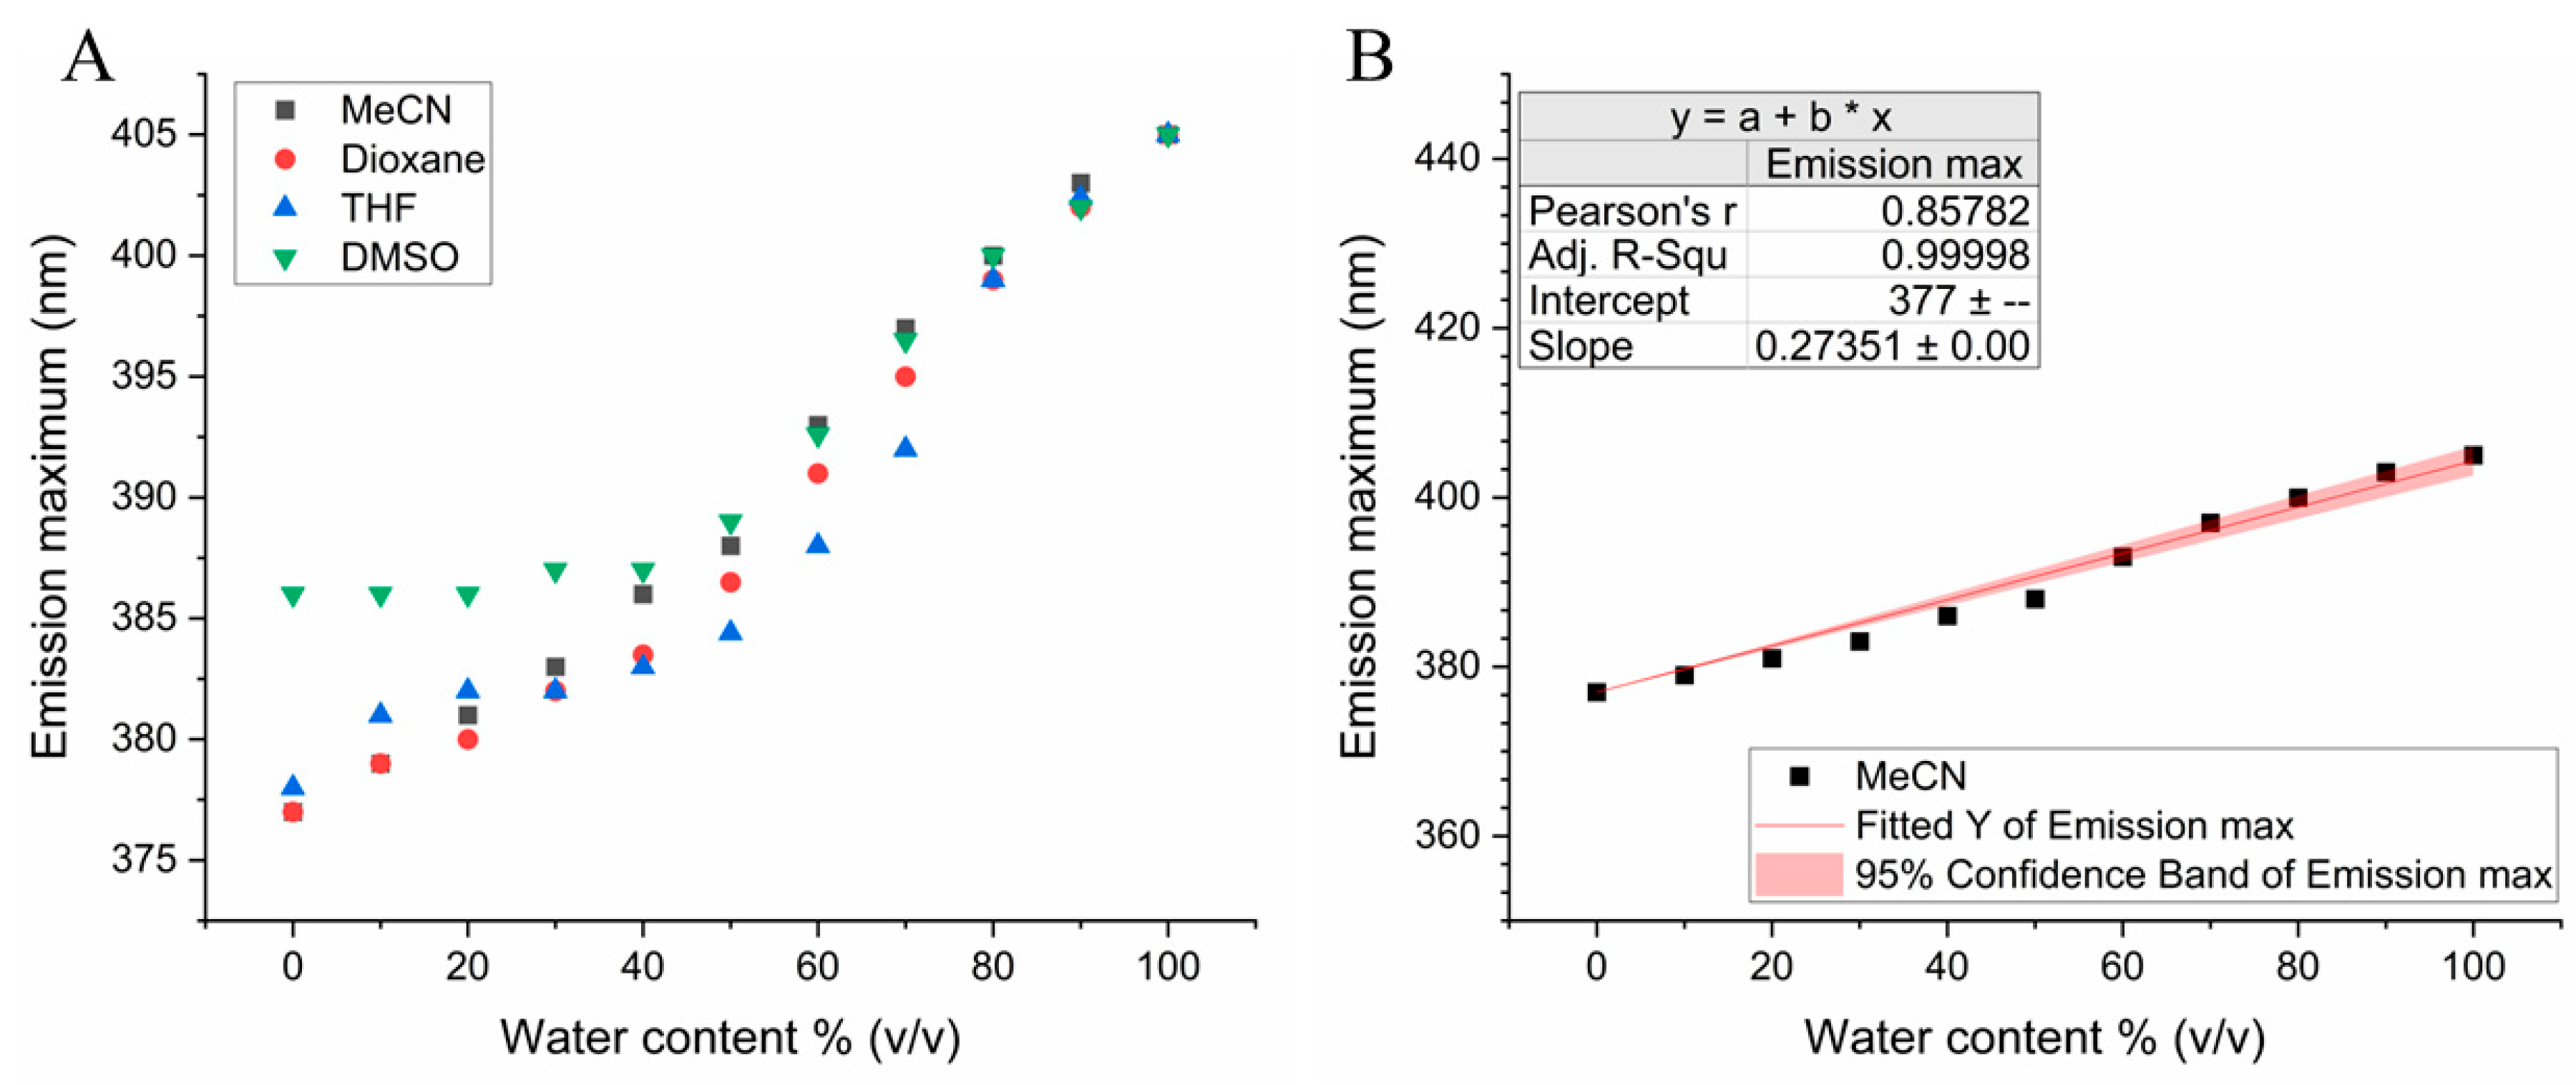
Figure 4.
(A) The normalized emission spectra of 1,5-DAN in MeCN:Water distillate of unknown composition along with those of known 10% and 20 % (v/v) water containing MeCN samples. (B) The emission maximum-water % (m/m) calibration curve. The dashed lines indicate the emission maximum of the unknown distillate and its determined composition.
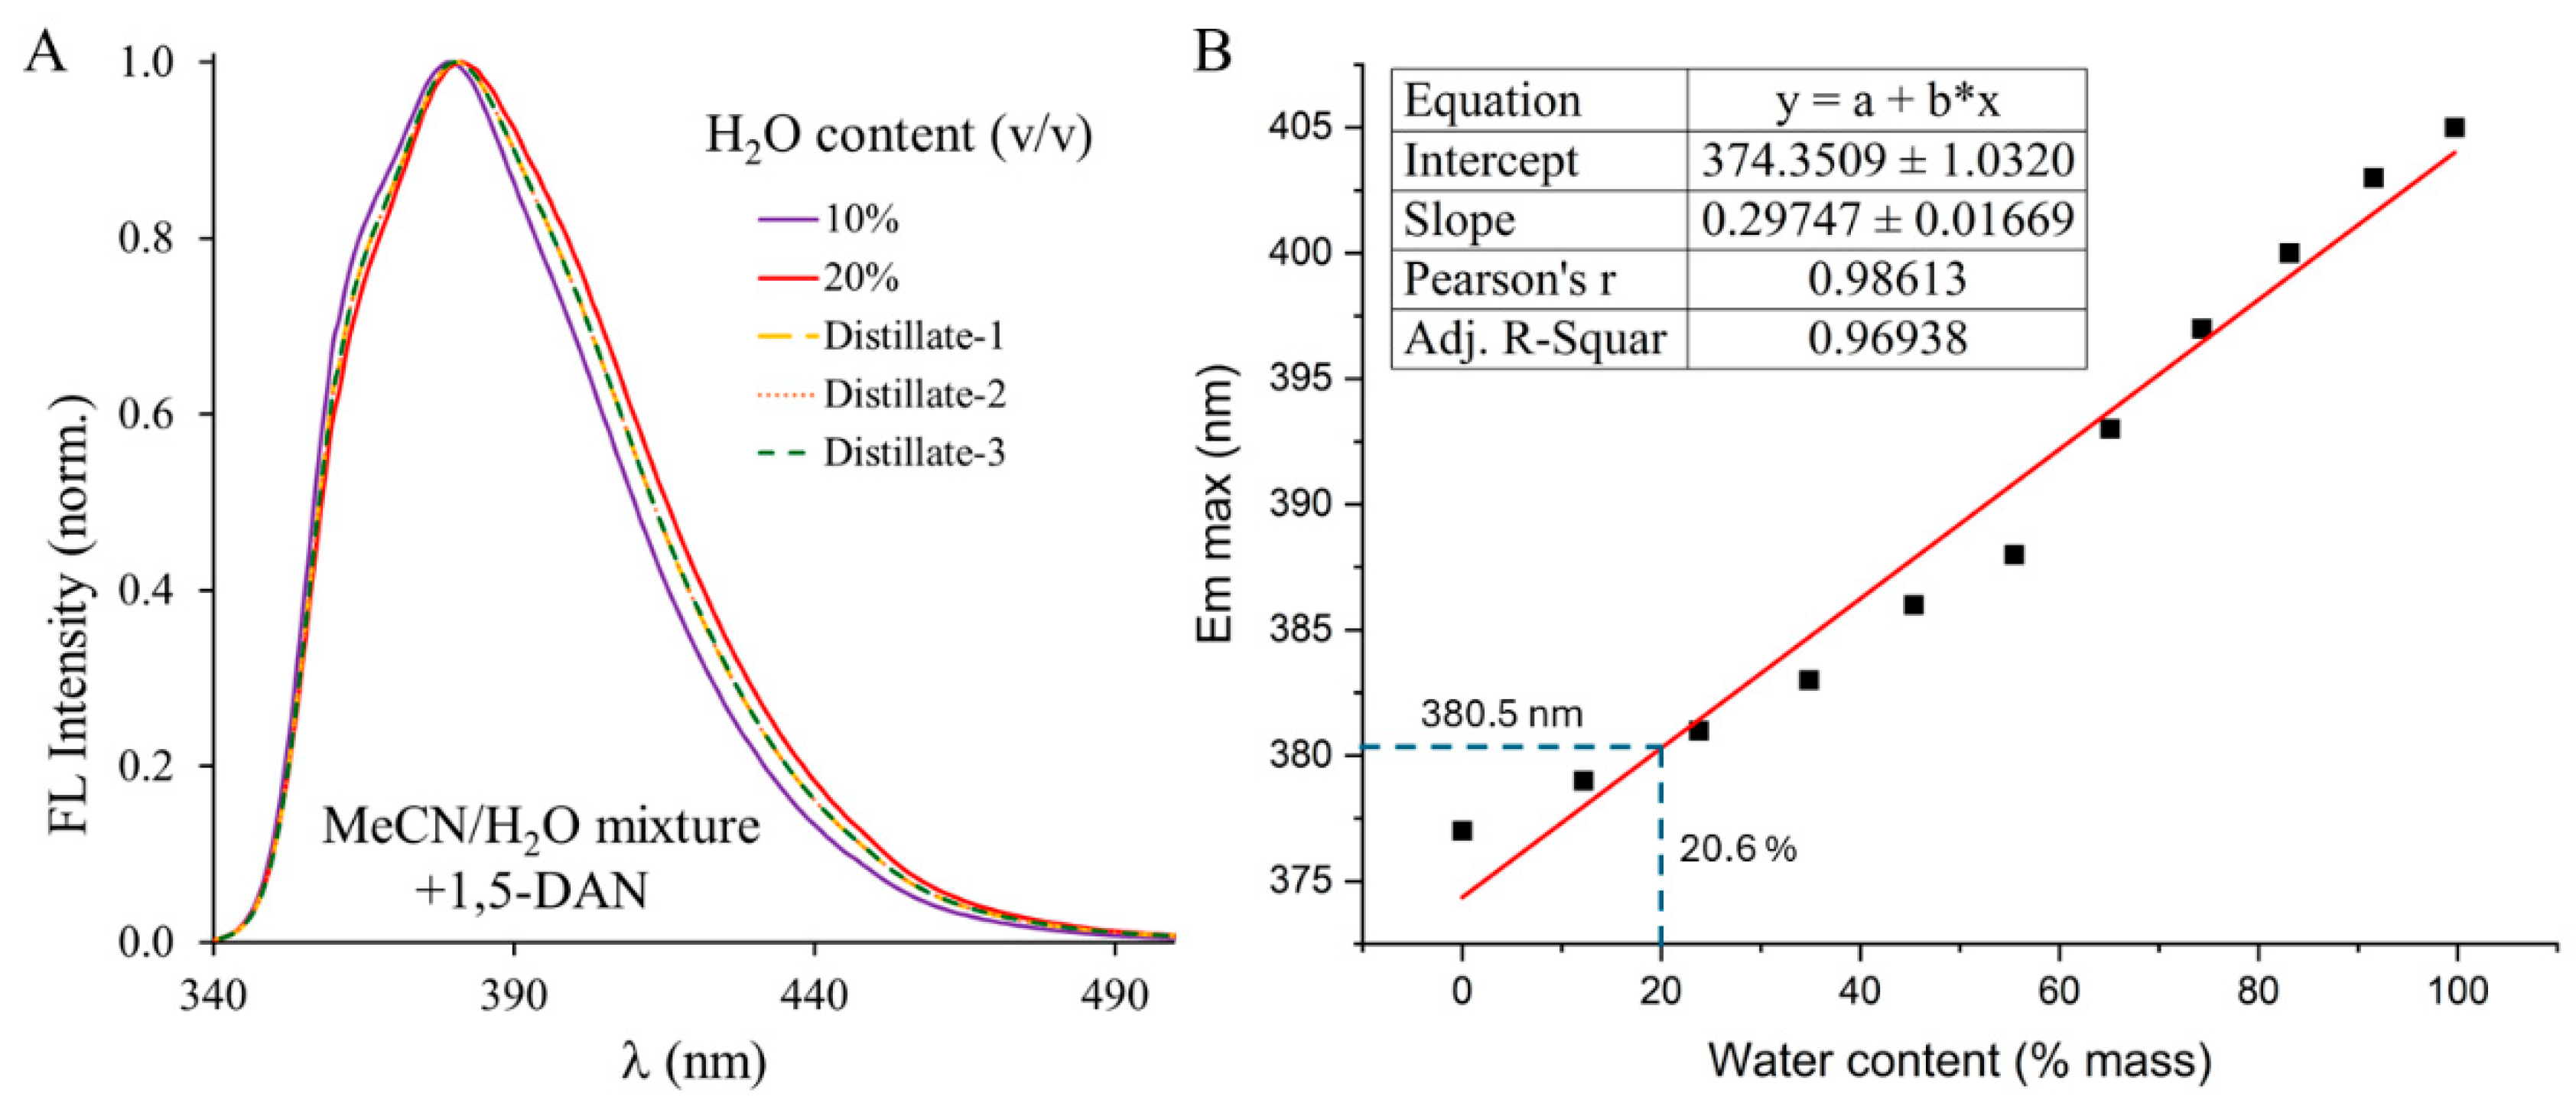
Figure 5.
(A) The change in the shape of the emission spectra upon addition of water to the solution of 1,5-DAN in (A) acetonitrile and (B) tetrahydrofuran. (C) and (D) are the ratiometric calibration curves for water content in the respective solvents. The textboxes contain the equation of the linear trendline and the coefficient of determination (R2). I364 and I440 are the fluorescent intensities measured at λem= 364 nm and λem= 440 nm, respectively. ([1,5-DAN] = 1.05×10⁻⁵ M, T=20 ºC).
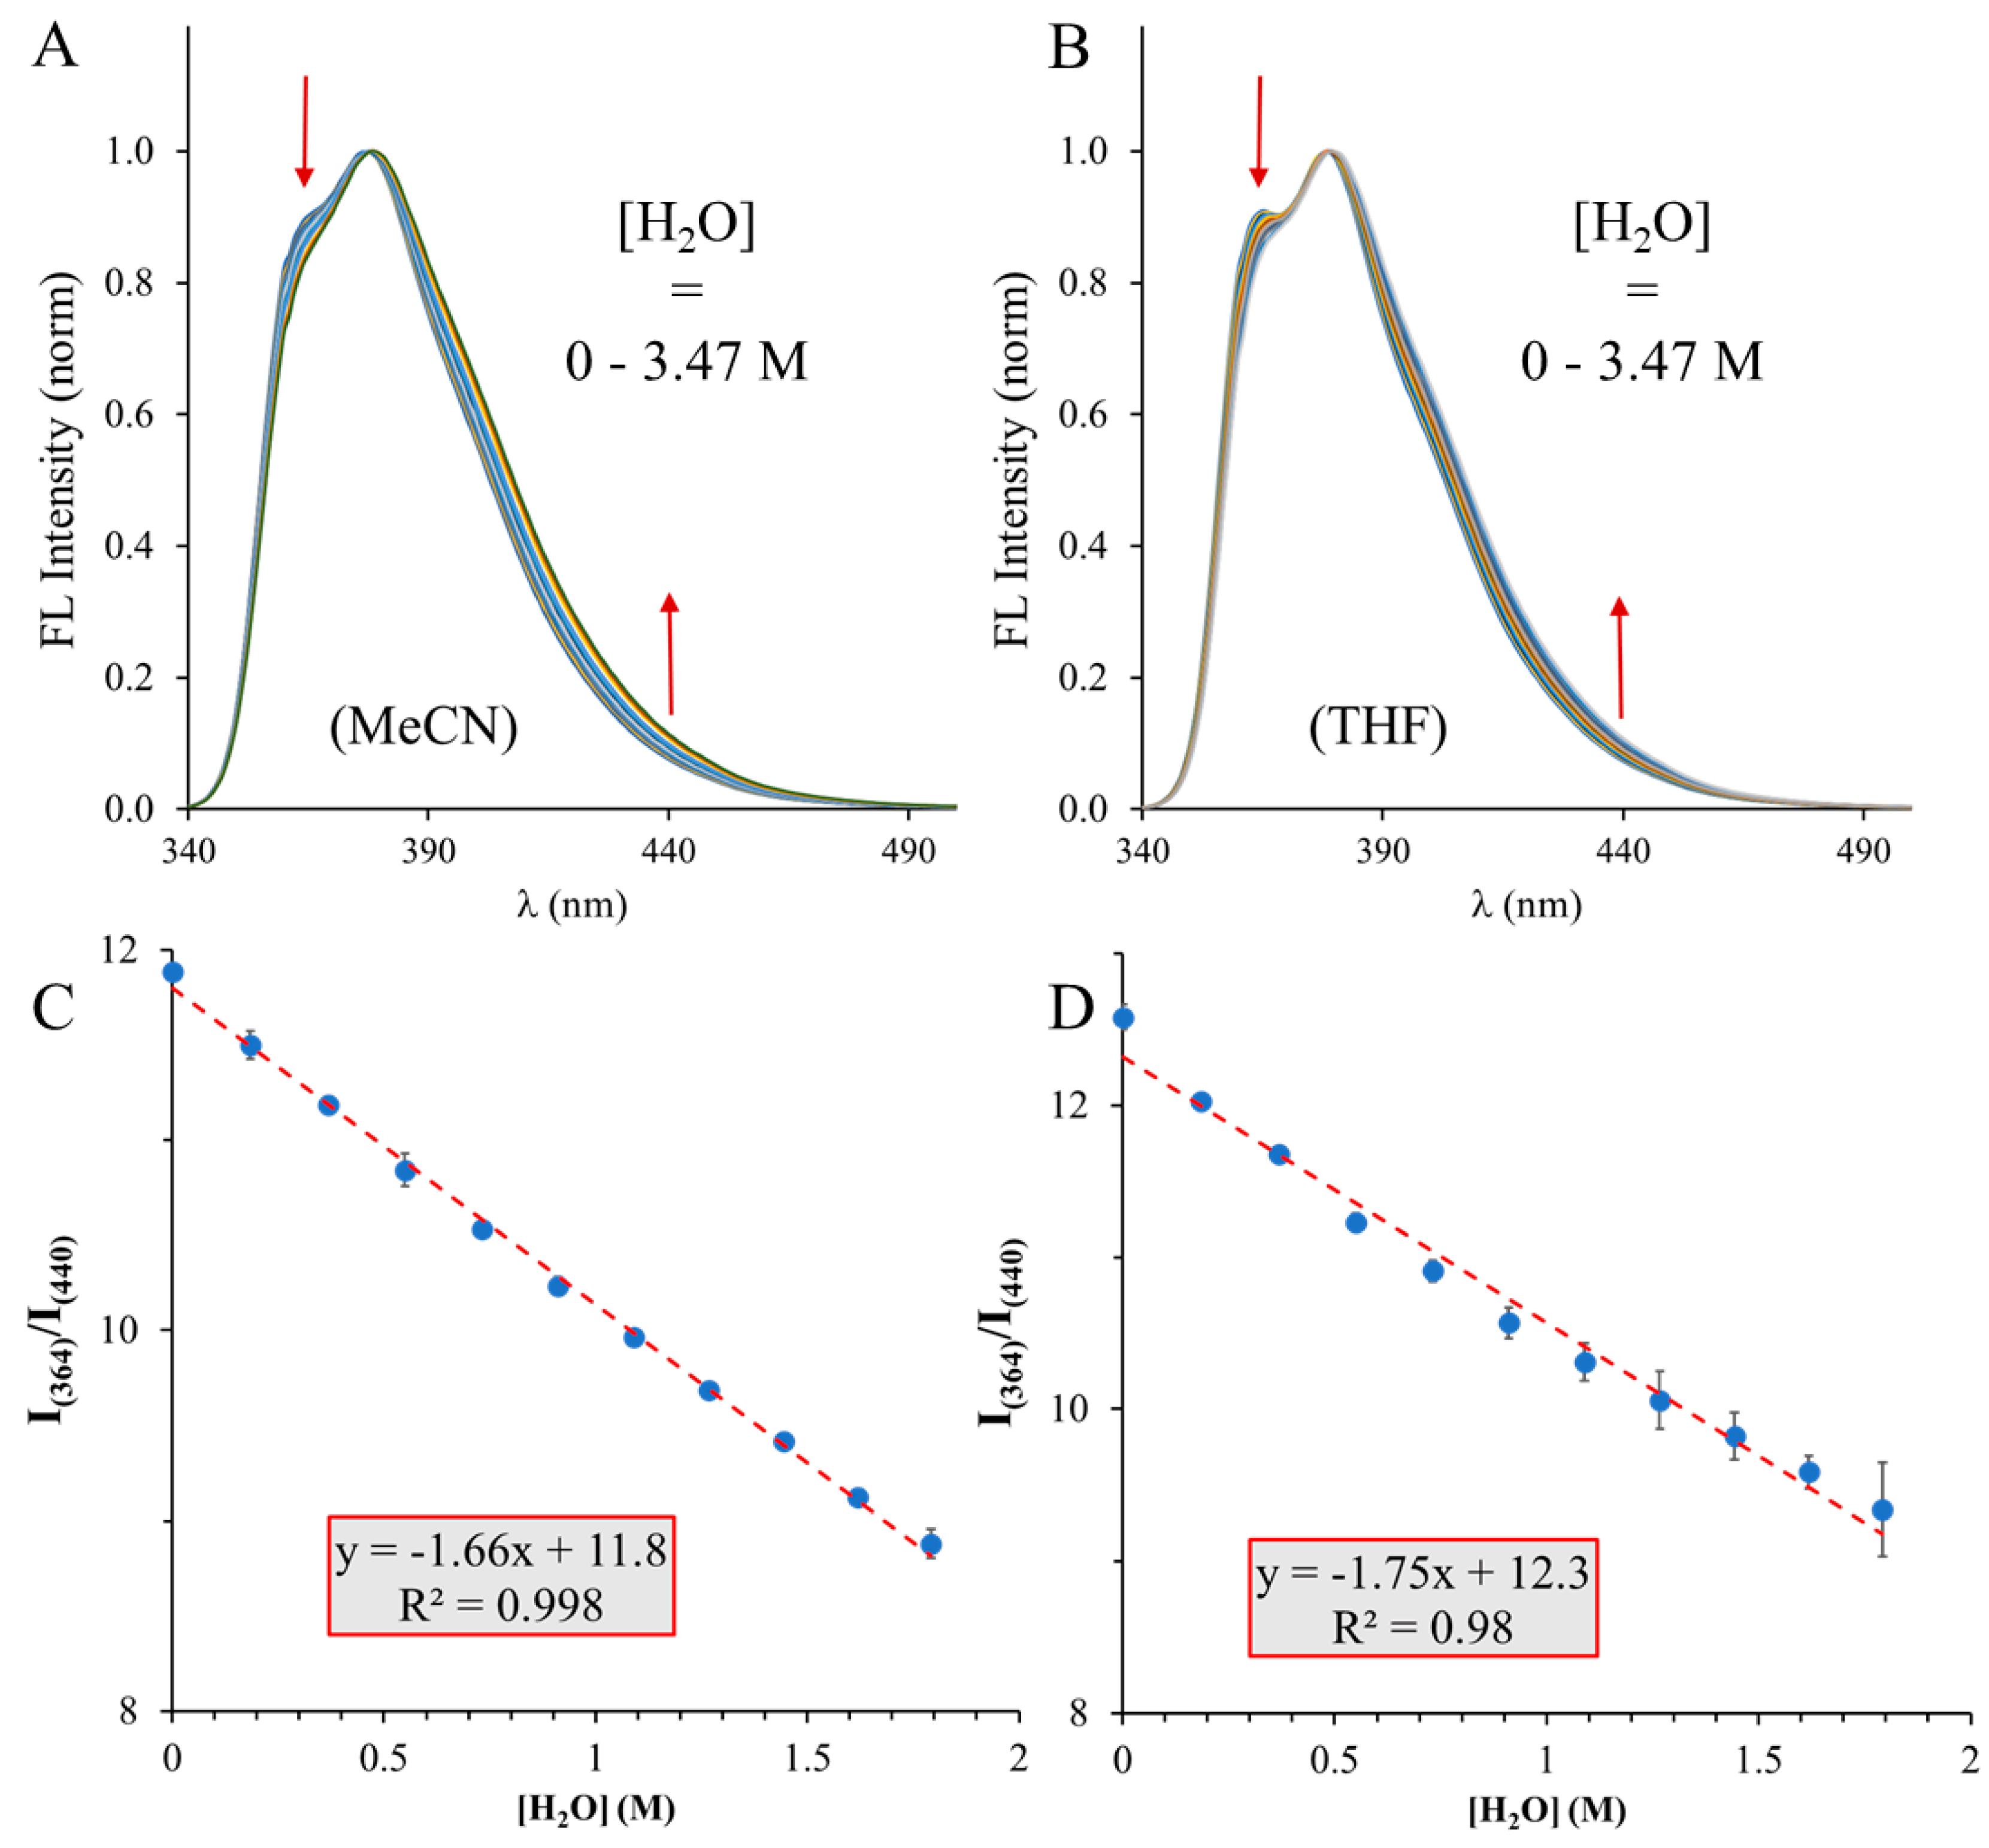
Figure 6.
Ratios of the intensities of the emission of 1,5-DAN at different wavelengths in acetonitrile solution at different water concentrations. Ihigh and Ilow are the intensities measured at higher and lower energy than the emission maximum, respectively.
Figure 6.
Ratios of the intensities of the emission of 1,5-DAN at different wavelengths in acetonitrile solution at different water concentrations. Ihigh and Ilow are the intensities measured at higher and lower energy than the emission maximum, respectively.
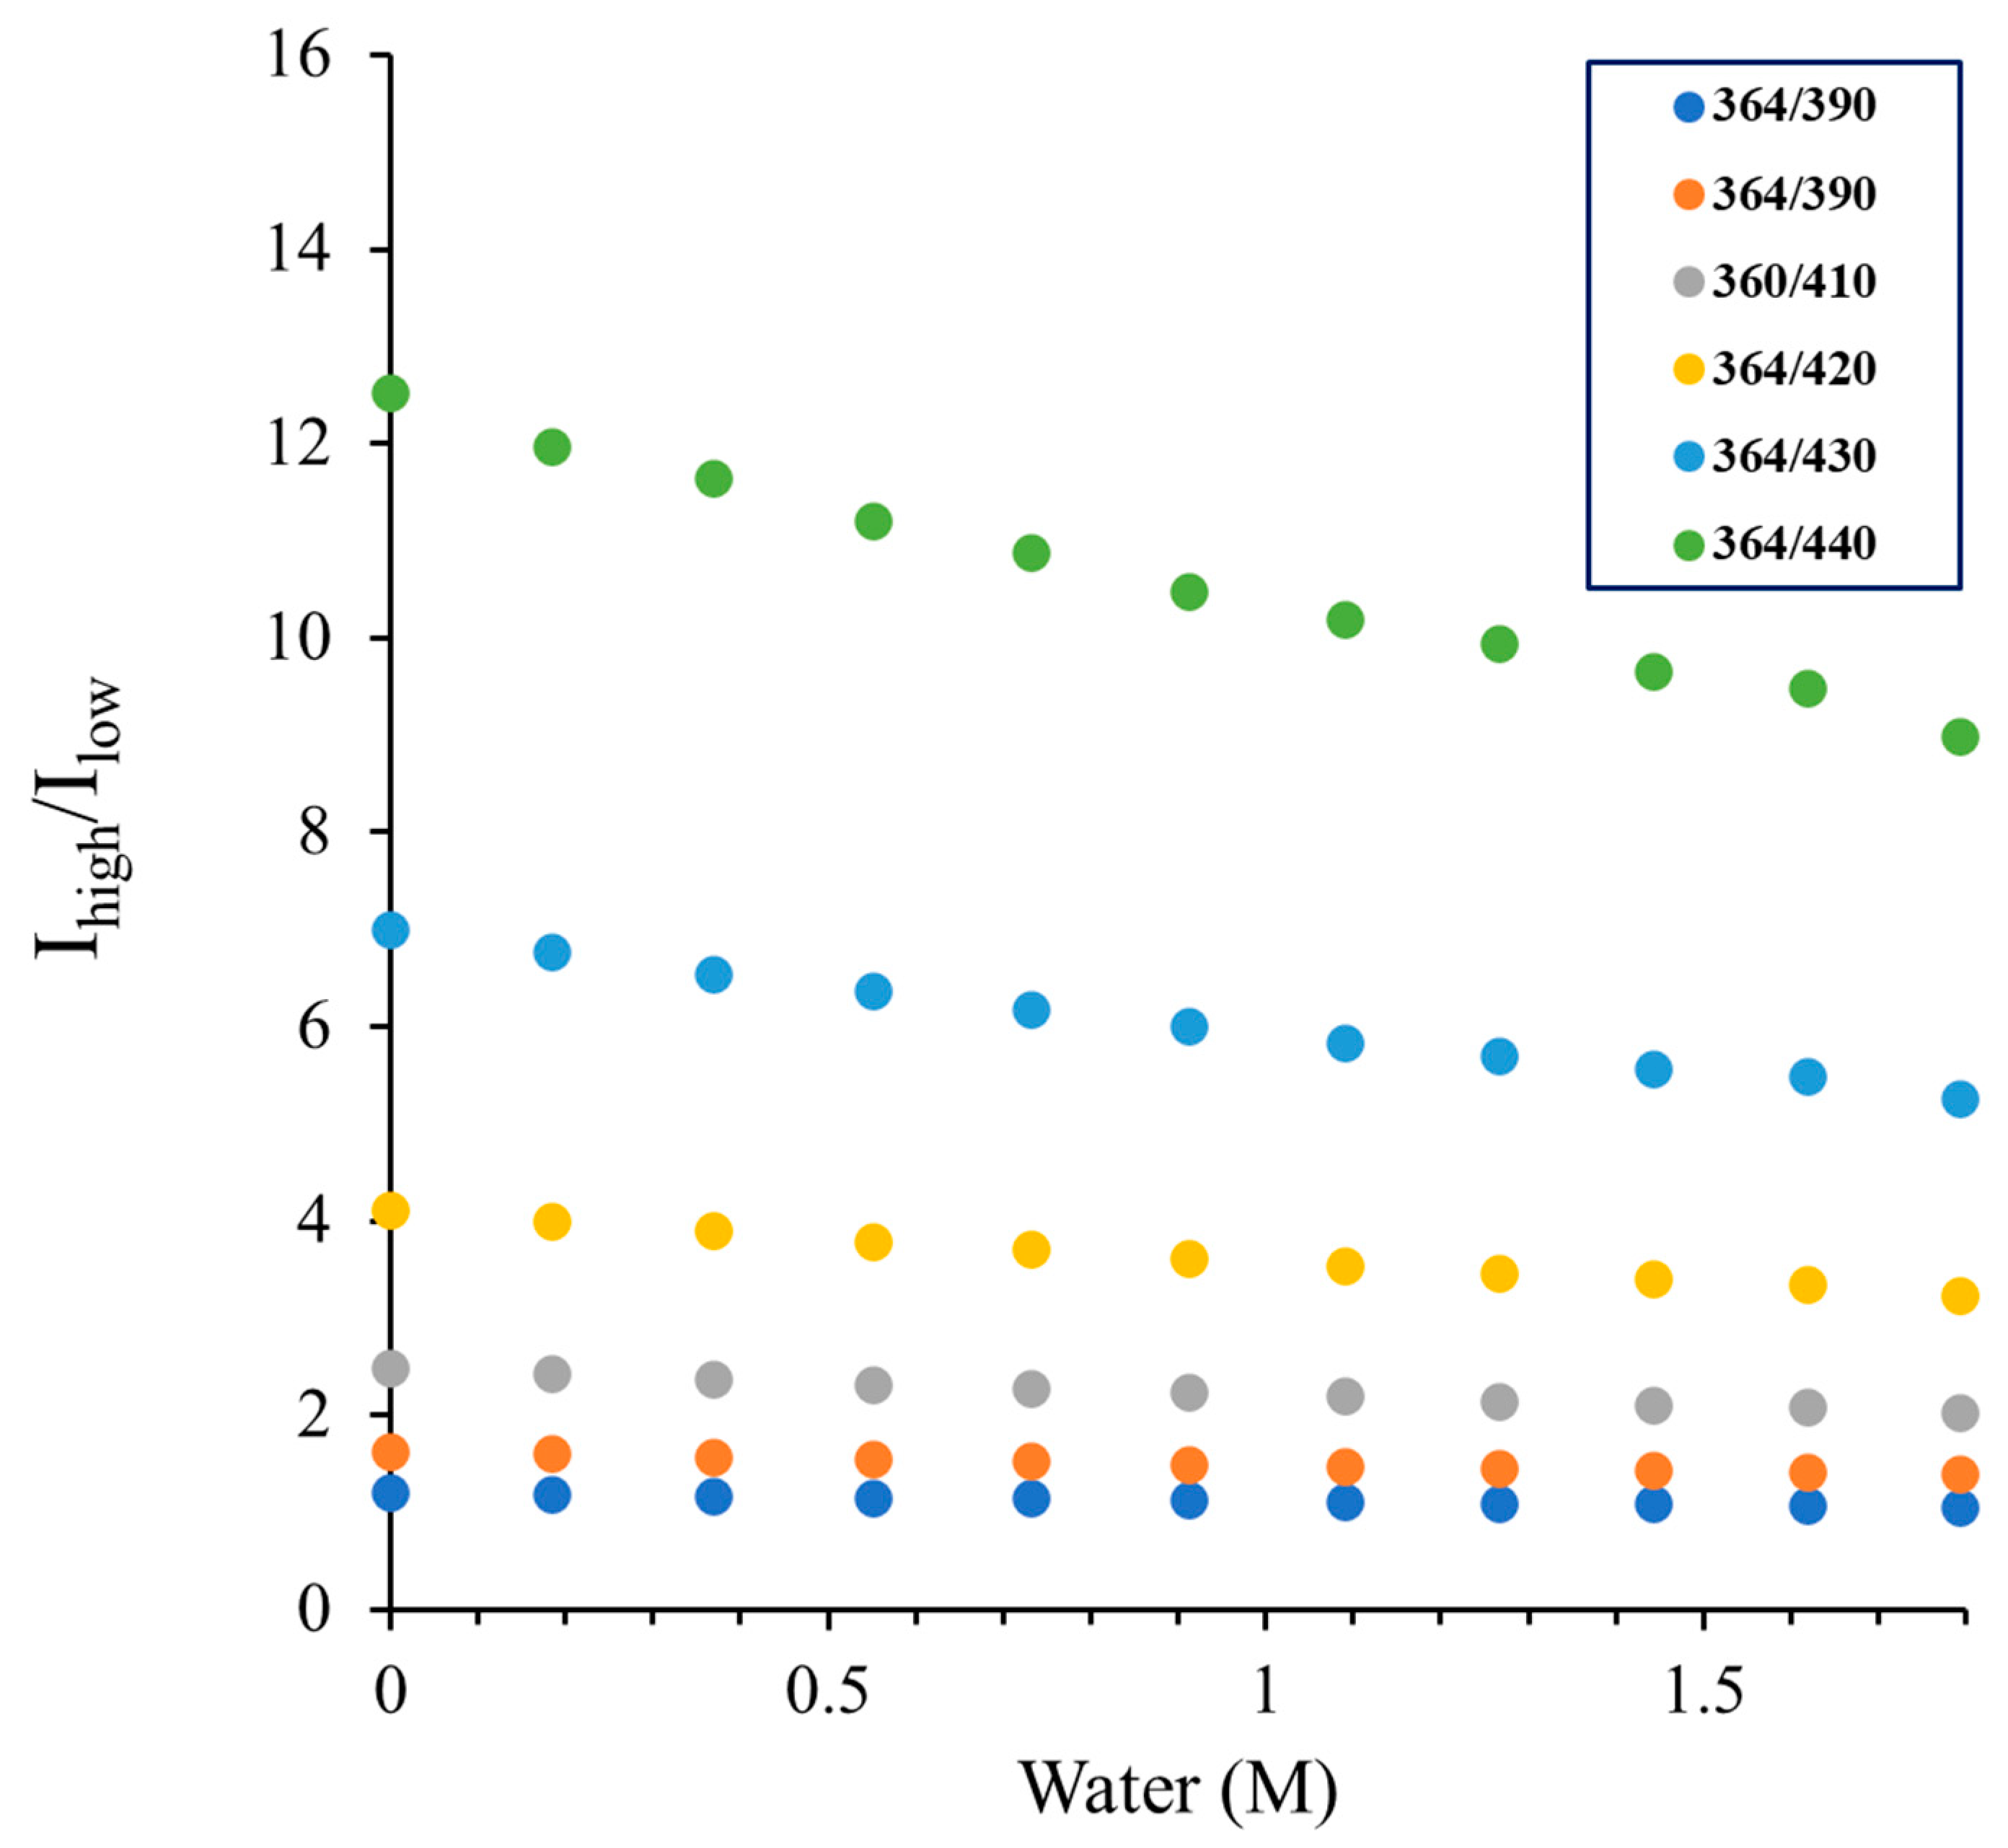
Table 1.
The volumes of the solvent (MeCN, dioxane, THF, DMSO) and deionized water measured to the cuvette and the resulting composition in % (v/v).
Table 1.
The volumes of the solvent (MeCN, dioxane, THF, DMSO) and deionized water measured to the cuvette and the resulting composition in % (v/v).
| Water content (v/v) | |||||||||||
| 0% | 10% | 20% | 30% | 40% | 50% | 60% | 70% | 80% | 90% | 100% | |
| Solvent (µL) | 3000 | 2700 | 2400 | 2100 | 1800 | 1500 | 1200 | 900 | 600 | 300 | 0 |
| Water (µL) | 0 | 300 | 600 | 900 | 1200 | 1500 | 1800 | 2100 | 2400 | 2700 | 3000 |
Table 4.
The limit of detection (LOD), limit of quantitation (LOQ), the equation of the calibration curve and coefficient of determination (R2) for H2O detection method in different solvents. % stands for percentage by volume.
Table 4.
The limit of detection (LOD), limit of quantitation (LOQ), the equation of the calibration curve and coefficient of determination (R2) for H2O detection method in different solvents. % stands for percentage by volume.
| Solvent | Equation of Calibrating line | LOD [M] | LOD [%] | LOQ [M] |
LOQ [%] |
R2 |
| MeCN | y = -1.66x + 11.8 | 0.047 | 0.08 | 0.156 | 0.24 | 0.998 |
| THF | y = -1.75x + 12.3 | 0.076 | 0.13 | 0.229 | 0.40 | 0.98 |
Disclaimer/Publisher’s Note: The statements, opinions and data contained in all publications are solely those of the individual author(s) and contributor(s) and not of MDPI and/or the editor(s). MDPI and/or the editor(s) disclaim responsibility for any injury to people or property resulting from any ideas, methods, instructions or products referred to in the content. |
© 2025 by the authors. Licensee MDPI, Basel, Switzerland. This article is an open access article distributed under the terms and conditions of the Creative Commons Attribution (CC BY) license (http://creativecommons.org/licenses/by/4.0/).
Copyright: This open access article is published under a Creative Commons CC BY 4.0 license, which permit the free download, distribution, and reuse, provided that the author and preprint are cited in any reuse.


