
Submitted:
08 July 2025
Posted:
08 July 2025
You are already at the latest version
Abstract
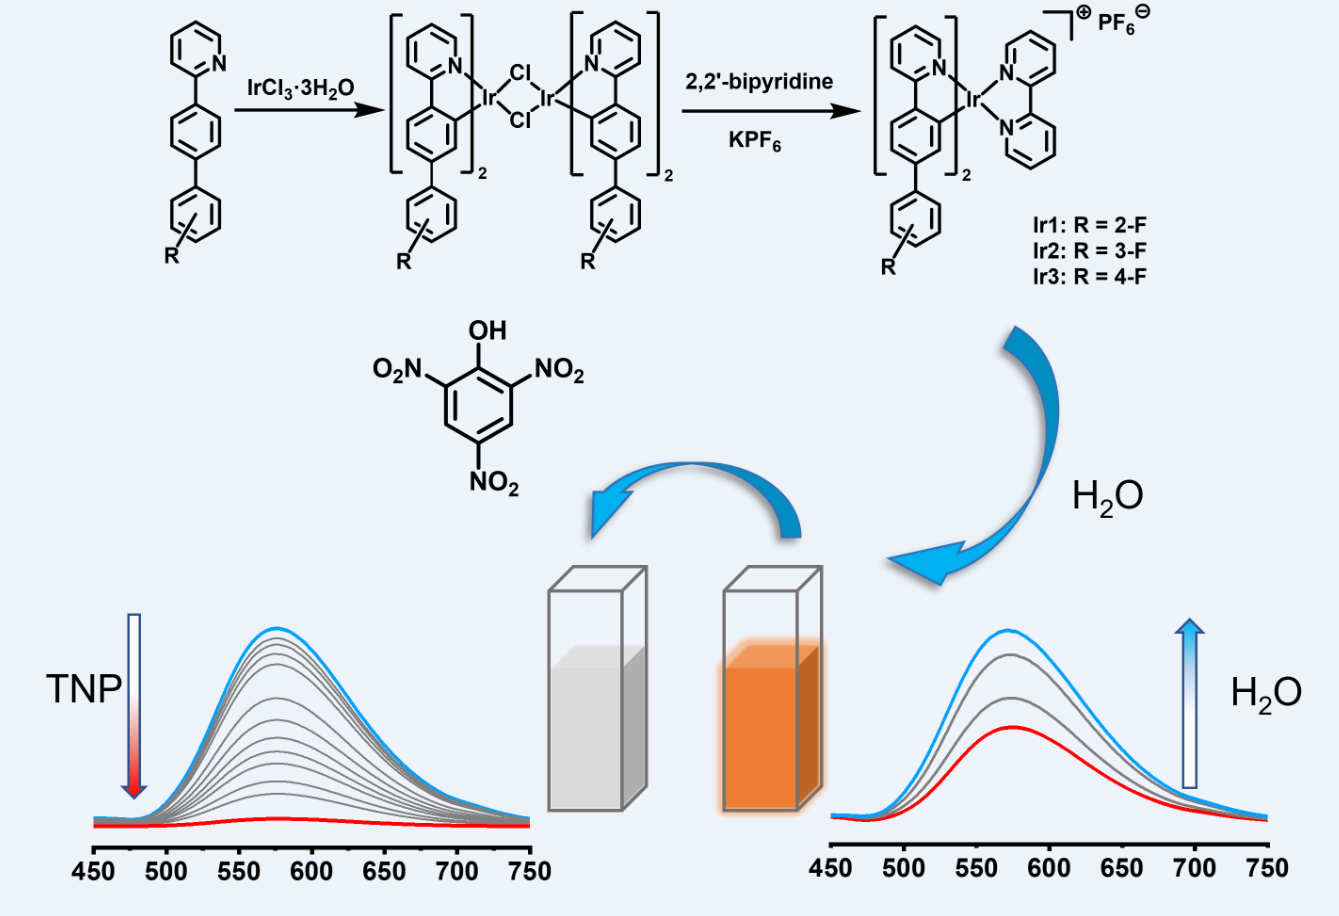
Three fluorophenyl-substituted cyclometalated Ir(III) complexes (Ir1-Ir3) have been synthesized by changing the position of the fluorine atom. All complexes exhibit distinct aggregation-induced phosphorescence emission (AIPE) characteristics in CH3CN/H2O and demonstrate satisfactory detection performance for 2,4,6-trinitrophenols (TNP) with limits of detection as 124 nM, 101 nM, and 127 nM, respectively. In addition, Ir1-Ir3 possess excellent selectivity and anti-interference capability for TNP detection, showing outstanding performance even in different common water samples. Ultraviolet-visible absorption spectra and luminescence lifetimes of the complexes show that their quenching processes include both static process and dynamic process, and the detection mechanism may be assigned to photoinduced electron transfer.
Keywords:
Ir(III) complexes
; AIPE-active
; 2
; 4
; 6-trinitrophenols
; aqueous media
1. Introduction
In 2001, Tang et al. proposed a new concept of aggregation-induced emission (AIE) [1]. In contrast to the aggregation-caused quenching (ACQ) phenomenon, the AIE phenomenon demonstrates that some molecules can significantly enhance their luminescence at the aggregated states. The introduction of the AIE notion has broadened the range of applications for luminescent materials, and provides new direction for the development of luminescent materials [2,3,4,5,6]. In 2002, Mani et al. first discovered the phenomenon of aggregation-induced phosphorescence emission (AIPE) in transition metal complexes [7]. Compared to traditional luminescent molecules, transition metal complexes have the advantages of longer phosphorescence lifetime, higher quantum yield, and larger Stokes shift. Currently, studies on the AIPE properties of transition metal complexes have received a broad range of attention [8,9,10].
Ir(III) complexes possess excellent photothermal stability, adjustable luminescence characteristics, and high luminescence efficiency [11,12,13,14,15]. These make them valuable for applications in optoelectronic devices [16], biological imaging and therapy [17], and catalytic science [18]. In 2008, Zhao et al. reported AIPE-active Ir(III) complexes for the first time [19]. Subsequently, a series of AIPE-active Ir(III) complexes have been developed [20,21,22]. Recently, the use of Ir(III) complexes with AIPE properties as probes for monitoring environmental parameters, including organic pollutants [23], pH [24], and toxic gases [25], has received significant attention.
2,4,6-Trinitrophenol (TNP) is a type of nitro compound with powerful explosive properties and high sensitivity to temperature, friction, and impact. At the same time, it has a broad range of industrial applications, such as pharmaceuticals, leather processing, and raw materials for dyes and pigments [26,27]. However, it also pollutes the environment by entering the ecosystem through the medium of water, leading to soil and groundwater contamination [28,29]. Since TNP may persist in the environment, especially when TNP residues contaminate drinking water and agricultural land, it can directly affect human and animal health. Therefore, the highly sensitive, selective, and trace detection of TNP is urgently needed. Recently, the detection of TNP in aqueous media using Ir(III) complexes as sensors has attracted extensive interests [30,31,32]. However, the relationship between the molecular structures of the complexes and the detection performances, as well as the detection mechanism for TNP, still require further exploration.
In the past several years, our team has developed a series of Pt(II), Ir(III), and Ru(II) complexes for TNP detection [33,34,35]. We found that introducing a fluorophenyl group can significantly affect the AIPE properties and TNP detection performances of the corresponding Pt(II) complexes [35]. In this work, three fluorophenyl-substituted cyclometalated Ir(III) complexes Ir1-Ir3 were synthesized and their properties were systematically studied in detail. The results indicate that Ir1-Ir3 all are AIPE-active and demonstrate high selectivity and sensitivity for the detection of TNP in aqueous media, showing great potential as probes for TNP detection.
2. Materials and Methods
2.1. Materials and Instruments
Additional information for the instruments and materials used in this study can be seen in the Supporting Information.
2.2. Synthesis and Characterization of Complexes
Scheme 1.
Structures and the synthetic routes of Ir1-Ir3.
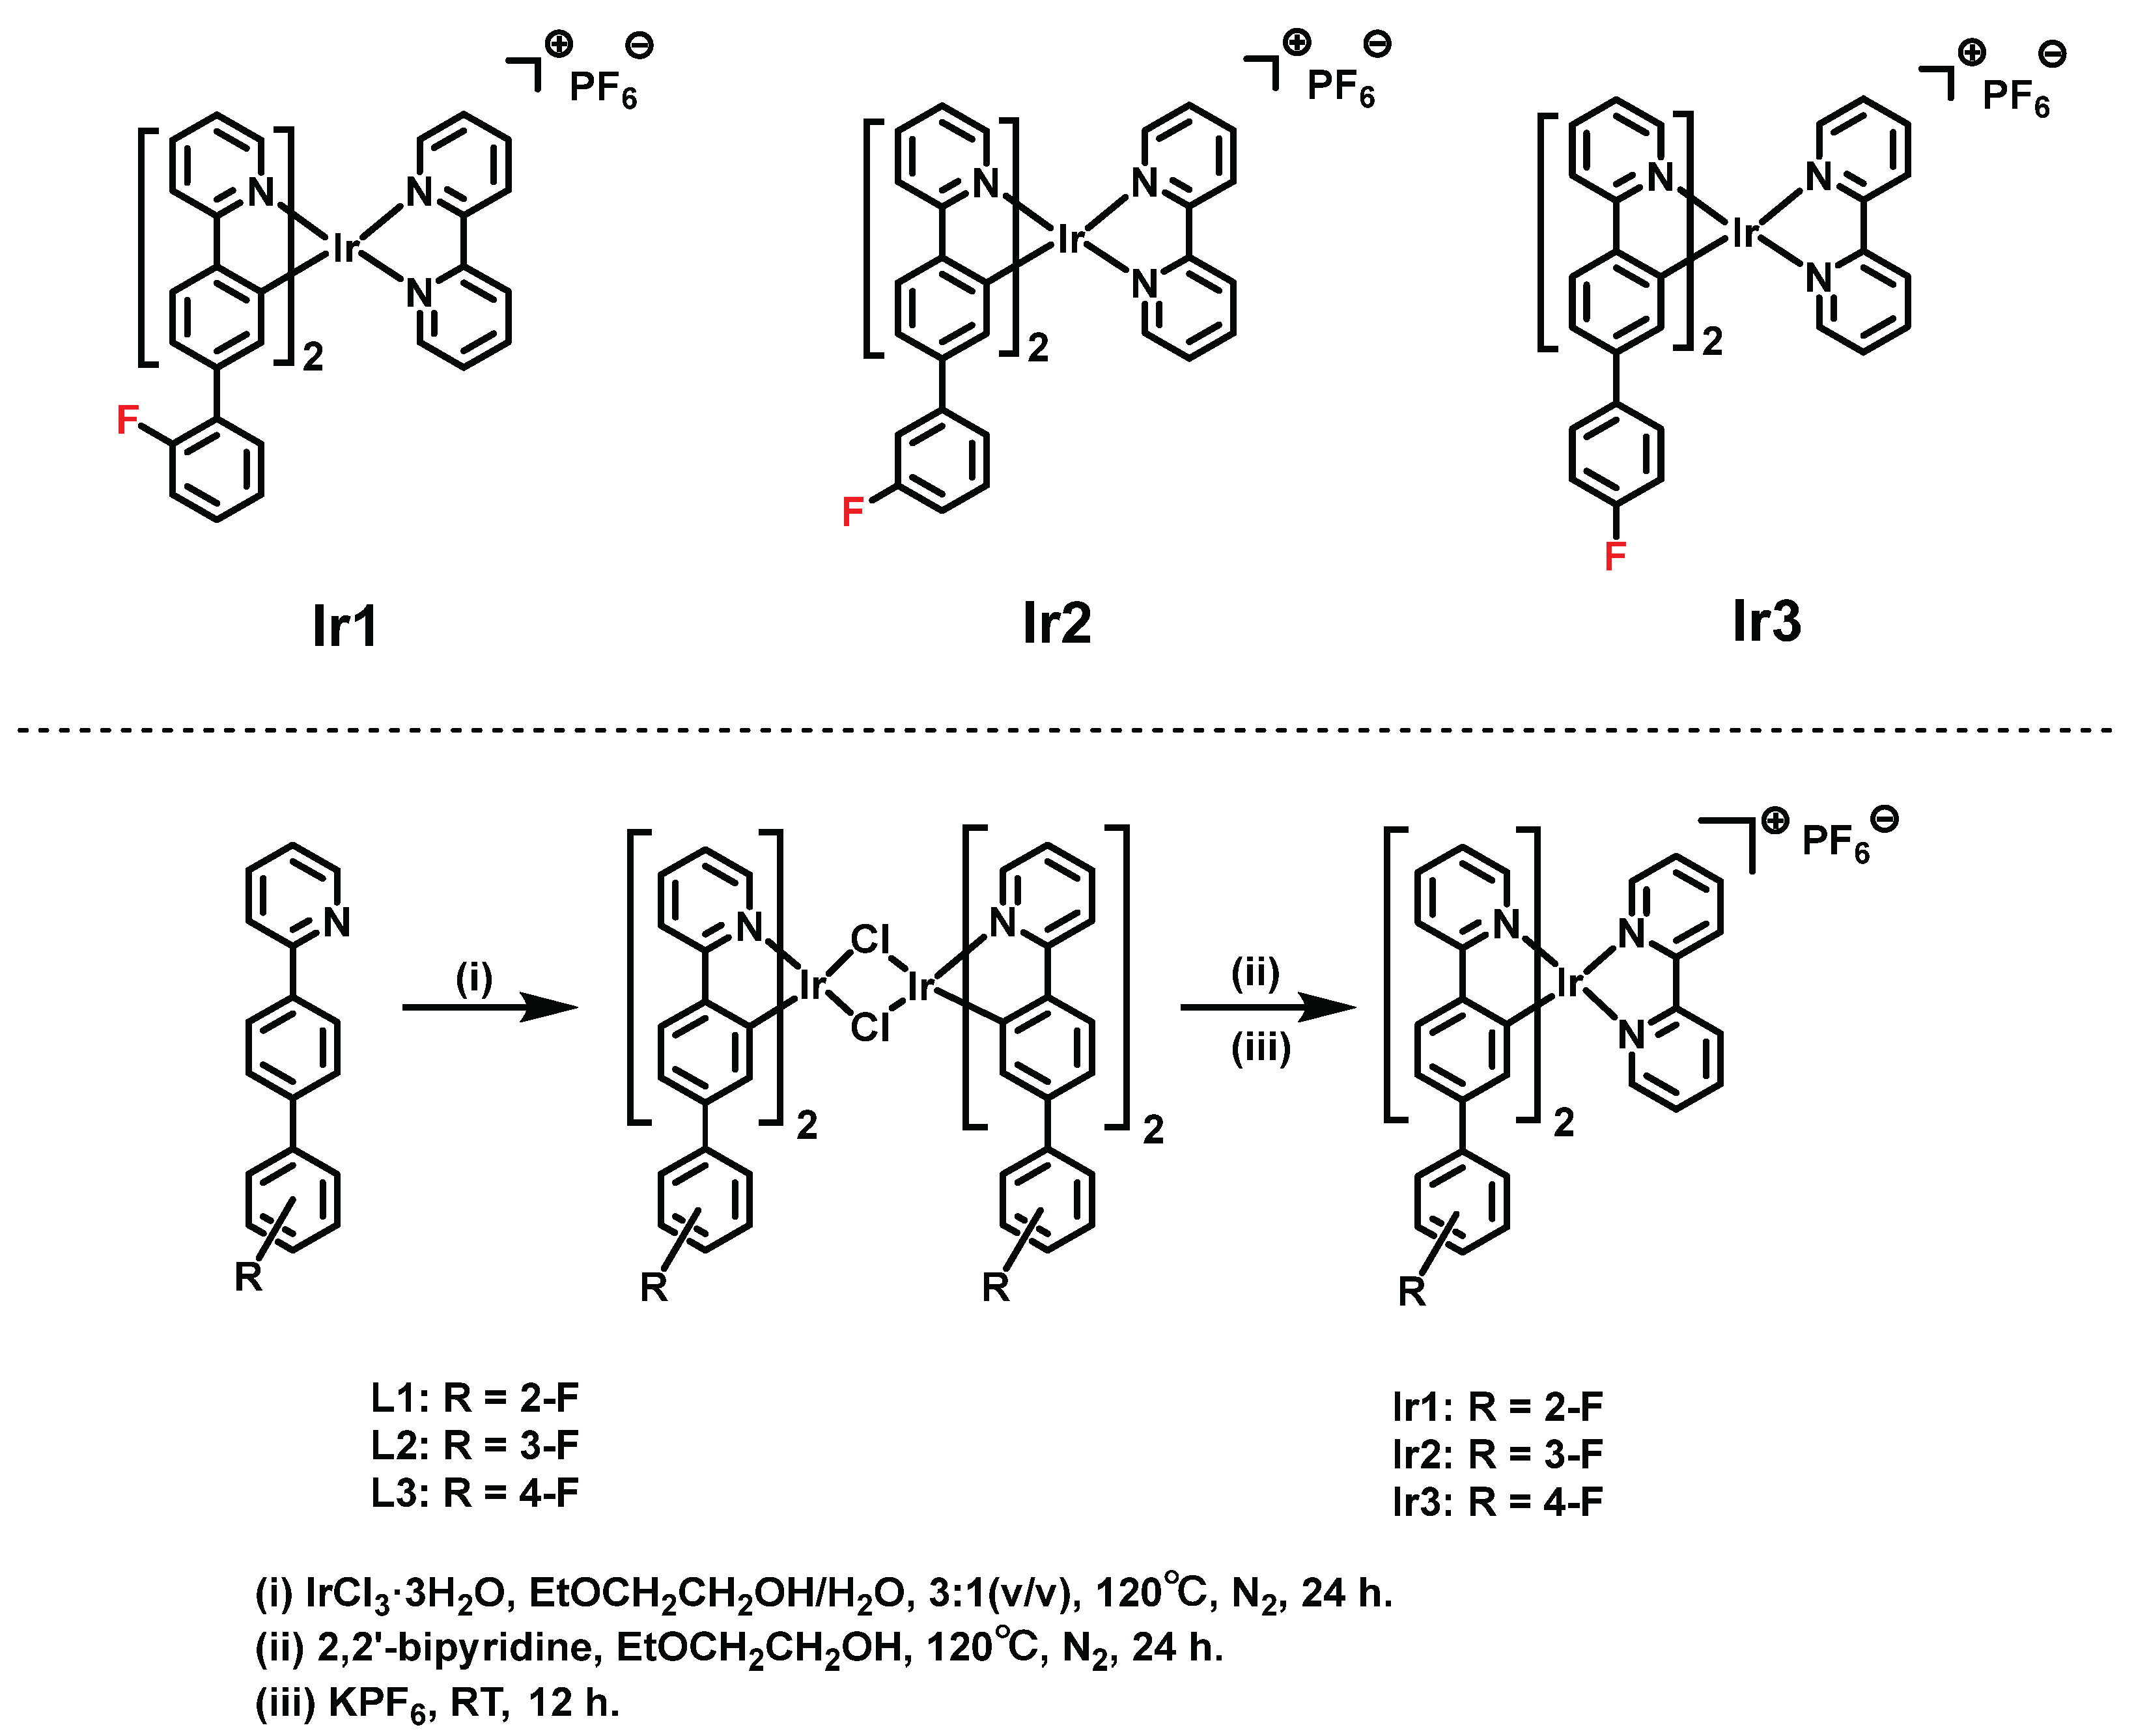
Three fluorophenyl-substituted C^N ligands were synthesized according to the reported method (Figure S1) [36]. The Ir(III) complexes were synthesized by the following routes (Scheme 1): IrCl3·3H2O (0.2 mmol, 70.5 mg) and the C^N ligand (0.5 mmol, 124.5 mg) were added to a mixed solution of EtOCH2CH2OH (9 mL) and H2O (3 mL). The mixture was stirred for 24 h at 120°C under N2 to provide the dichlorobridge intermediate. Subsequently, the intermediate and 2,2′-bipyridine (0.6 mmol, 93.7 mg) were transferred into EtOCH2CH2OH (12 mL) and the mixture was stirred for 24 h at 120°C under N2. At the end of the reaction, the reaction system was cooled to room temperature. An excess of saturated aqueous solution of KPF6 (1.2 mmol, 220.9 mg) was added into the reaction system and the mixture was stirred at room temperature for 12 h. Finally, the target products of Ir1-Ir3 were isolated and purified by column chromatography. The comprehensive characterizations for Ir1-Ir3 are given in the Supporting Information (Figures S2–S10).
Ir1. an orange-yellow solid, 168.3 mg, yield: 85%. 1H NMR (400 MHz, DMSO-d6) δ 8.91 (d, J = 8.4 Hz, 2H), 8.31 (t, J = 7.7 Hz, 4H), 8.07 - 7.93 (m, 6H), 7.75 (t, J = 7.6 Hz, 2H), 7.70 (d, J = 5.9 Hz, 2H), 7.34 - 7.29 (m, 4H), 7.28 - 7.17 (m, 8H), 6.42 (d, J = 2.4 Hz, 2H).13C NMR (151 MHz, DMSO-d6) δ 166.25, 159.80, 158.16, 155.33, 150.06, 149.87, 148.97, 143.51, 139.64, 138.80, 136.31, 131.04, 131.01, 130.26, 130.24, 129.47, 129.42, 128.72, 128.00, 127.92, 125.04, 125.00, 124.76, 124.74, 124.03, 122.99, 120.28, 116.16, 116.01. HRMS (ESI, m/z): calcd for C44H30N4F2Ir [M-PF6]+: 845.2068, found: 845.2061.
Ir2. an orange-yellow solid, 182.2 mg, yield: 92%. 1H NMR (400 MHz, DMSO-d6) δ 8.91 (d, J = 8.3 Hz, 2H), 8.36 (d, J = 8.2 Hz, 2H), 8.29 (t, J = 7.9 Hz, 2H), 8.01 (dd, J = 11.6, 7.4 Hz, 6H), 7.74 (t, J = 5.3 Hz, 4H), 7.38 (td, J = 8.2, 4.0 Hz, 4H), 7.23 (t, J = 6.7 Hz, 2H), 7.18 - 7.08 (m, 6H), 6.41 (d, J = 2.0 Hz, 2H). 13C NMR (151 MHz, DMSO-d6) δ 166.20, 163.19, 161.58, 155.30, 150.83, 150.12, 149.18, 143.89, 142.55, 142.50, 139.86, 139.62, 138.83, 130.74, 130.69, 128.73, 128.58, 125.50, 124.96, 124.08, 122.34, 122.32, 121.33, 120.36, 114.25, 114.11, 113.01, 112.86. HRMS (ESI, m/z): calcd for C44H30N4F2Ir [M-PF6]+: 845.2068, found: 845.2065.
Ir3. an orange-yellow solid, 178.2 mg, yield: 90%. 1H NMR (400 MHz, DMSO-d6) δ 8.91 (d, J = 8.3 Hz, 2H), 8.30 (q, J = 8.0 Hz 4H), 7.99 (q, J = 8.0 Hz, 6H), 7.72 (t, J = 6.6 Hz, 4H), 7.37 - 7.31 (m, 6H), 7.21 (t, J = 8.1 Hz, 6H), 6.39 (s, 2H). 13C NMR (151 MHz, DMSO-d6) δ 165.80, 162.10, 160.48, 154.80, 150.41, 149.54, 148.55, 142.73, 139.82, 139.11, 138.29, 136.01, 136.00, 128.22, 128.05, 127.77, 127.72, 124.99, 124.45, 123.41, 120.64, 119.71, 115.18, 115.04. HRMS (ESI, m/z): calcd for C44H30N4F2Ir [M-PF6]+: 845.2068, found: 845.2064.
2.3. Tests for the Detection of TNP
Stock solutions of Ir1-Ir3 (c = 100 μM) were prepared in CH3CN, respectively. Then, eight 3 mL suspensions were prepared by taking the stock solution (v = 300 μL) and adding different volumes of CH3CN and H2O, respectively. In this way, suspensions with different water contents (0%-90%, c = 10 μM) were prepared. For each suspension, 3 mL of them was placed into quartz cuvettes, and then the emission spectra were recorded to study the properties of Ir1-Ir3.
The suspensions of Ir1-Ir3 (Ir1: fw = 60%, Ir2: fw = 70%, Ir3: fw = 70%, in CH3CN/H2O) were prepared in volumetric flasks (200 mL). Then, 11 blank suspension samples of Ir1-Ir3 were randomly selected, and their emission spectra were measured after equilibrium. The TNP solutions with concentrations varying from 0.1 to 20 mM were prepared in CH3CN/H2O. TNP solutions (30 μL) at different concentrations were added to Ir1-Ir3 suspensions (3 mL), and the emission spectra were recorded after allowing the system to equilibrate. In the experiments on selectivity and competition for the detection of TNP, seven analytes with structures partially similar to TNP were selected for testing. The analytes included: 4-Methoxyphenol (MEHQ), 2-Nitrotoluene (2-NT), Nitromethane (NM-55), Phenol, 2-Cresol, 3-Cresol, and 4-Cresol. During the testing process, 30 μL (c = 20 mM) of the analytes were added to Ir1-Ir3 suspensions, respectively. To further investigate the anti-interference capability of Ir1-Ir3, 30 μL (c = 20 mM) of eight common ionic compounds was added to the complex suspensions, respectively. The ionic compounds include: KF, KBr, NaOAc, ZnCl2, CaCl2, NiCl2, CuSO4, and CoCO3. Finally, lake water, rainwater, seawater, and tap water were selected for testing in place of deionised water to assess the universality of the complexes in different common water samples. The lake water was collected from Lingshui Lake at Dalian University of Technology, the seawater was collected from Qixianling, Dalian and the tap water was collected from Dalian University of Technology.
Be cautious! Nitroaromatic compounds are explosive and should be processed in small amounts in a well-ventilated environment. Avoid exposure to high temperatures, open flames, and impact. Always wear appropriate protective equipment.
3. Results and Discussion
3.1. Photophysical Properties
The photophysical properties of Ir1-Ir3 were tested by UV-Vis absorption and emission spectrometers. The UV-Vis absorption spectra of Ir1-Ir3 exhibit strong absorption bands at 220-320 nm (Figure 1a), which is probably related to the π-π* transitions in the ligand-centered (LC). Additionally, weak absorption features are observed at wavelengths of 380-450 nm, likely originating from metal-to-ligand charge transfer (MLCT) and ligand-ligand charge transfer (LLCT) [37]. Figure 1b shows the normalized emission spectra of Ir1-Ir3 in CH3CN, and their maximum emission wavelengths are 574 nm, 573 nm, and 578 nm, respectively.
3.2. AIPE Properties and Stability Testing
The luminescence properties of Ir1-Ir3 were initially tested by recording their emission spectra in CH3CN/H2O with different water contents. As shown in Figure 2, there is a significant enhancement of the emission intensities with an increase in water contents from 0% to 70%. We speculate that the addition of water, as a poor solvent, causes the aggregation of the complex molecules, thus exhibiting good AIPE properties. Subsequently, dynamic light scattering (DLS) experiments were performed to verify whether Ir1-Ir3 had undergone aggregation (Figure S11 in Supporting Information). It can be seen that Ir1-Ir3 indeed produce aggregates at the selected water contents (Ir1: fw = 60%, Ir2: fw = 70%, Ir3: fw = 70%), and their hydrodynamic diameters are 20.96 nm, 57.36 nm, and 51.33 nm, respectively. The above results confirm that Ir1-Ir3 exhibit significant AIPE properties.
Then, the stabilities of Ir1-Ir3 were analyzed by their emission spectra. The results show that Ir1-Ir3 reach equilibrium after 8 h, 7 h, and 4 h, respectively (Figure 3). Then, the emission spectra of 11 blank suspensions of the complexes were tested after equilibrium to calculate the standard deviations (Table 1).
3.3. Sensing of TNP
Ir1-Ir3 exhibit significant AIPE properties, which indicates their potential to act as probes for detecting TNP. Therefore, we prepared suspensions of Ir1-Ir3 in CH3CN/H2O (Ir1: fw = 60%, Ir2: fw = 70%, Ir3: fw = 70%), and performed TNP titration tests after reaching equilibrium (illustrated in Figure 4). The results show that as the concentrations of TNP increases, the emission intensities of Ir1-Ir3 significantly decreases. The quenching efficiencies of Ir1-Ir3 are 18%, 22%, and 17%, respectively, at a TNP concentration of 8 μM (0.8 equiv.). When the TNP concentration increases to 200 μM (20.0 equiv.), the quenching efficiencies of Ir1-Ir3 all exceed 95%. To calculate the quenching constants (KSV) for the detection of TNP, the ratios of the emission intensities before the addition of TNP (I0) to the emission intensities after the addition of TNP (I) were plotted (Figure 4). The Stern-Volmer curves for Ir1-Ir3 are overall non-linear. But at low concentrations of TNP (0-8 μM), the I0/I ratios of Ir1-Ir3 exhibit a clear linear relationship, indicating that it is a static quenching process. The Stern-Volmer plots show a non-linear relationship with increasing concentrations of TNP. This indicates that the luminescence quenching processes involves both static and dynamic quenching [38]. According to the Stern-Volmer equation (I0/I = KSV[Q] + 1), the quenching constants for Ir1-Ir3 were obtained in the low concentration range through fitting, with values of 2.7×10⁴ M−1, 3.3×10⁴ M−1, and 2.3×10⁴ M−1, respectively.
Within the low concentration range (0-8 μM), linear regression analyses are performed on the emission intensities of Ir1-Ir3 to calculate their slopes K (Figure 5). The limits of detection (LODs) for Ir1-Ir3 are calculated according to the formula LOD = 3σ/|K| with values of 124 nM, 101 nM, and 127 nM, respectively.
3.4. Selectivity and Anti-Interference Capability Experiments
First, selective and competitive experiments were performed on Ir1-Ir3. Seven analytes (MEHQ, 2-NT, NM-55, Phenol, 2-Cresol, 3-Cresol, and 4-Cresol) were individually added to Ir1-Ir3 suspensions. The emission spectra before and after the addition of TNP were tested. The results show that the addition of these analytes has little effect on the luminescence of the complex samples (< 6% for all analytes except 2-NT, which is approximately 20%), and there are small changes in emission intensities (Figure 6). The luminescence quenching rates of all samples exceed 94% after the addition of TNP. In summary, the effects of other analytes on the emission intensities of the samples are much smaller than those of TNP, and Ir1-Ir3 show excellent selectivity for TNP.
Next, an in-depth study was conducted on the anti-interference capability of Ir1-Ir3. Eight common ionic compounds (KF, KBr, NaOAc, ZnCl2, CaCl2, NiCl2, CuSO4, and CoCO3) were individually added to Ir1-Ir3 suspensions, and the emission spectra before and after the addition of TNP were tested as well. The results show that the addition of common ionic compounds has a negligible effect on emission intensities and a minimal effect on quenching efficiencies of Ir1-Ir3 (< 7% for all compounds, Figure 7). Furthermore, the luminescence quenching effects of the samples are not affected by these ionic compounds after the addition of TNP, and the luminescence quenching rates reach over 94% in all cases. These experimental results indicate that Ir1-Ir3 show outstanding anti-interference capability when used for the detection of TNP. They effectively avoid effects from common ionic compounds, ensuring the accuracy and reliability of the detection results.
Finally, the emission spectra of Ir1-Ir3 were tested using lake water, rainwater, seawater, or tap water in place of deionized water. This is done to assess the universality of Ir1-Ir3 for the detection of TNP. The emission intensities of Ir1-Ir3 vary in different common water samples. However, the emission intensities of Ir1-Ir3 are not affected by different water samples after the addition of TNP, and they still show excellent selectivity for TNP (Figure 8). The quenching effects in different water samples are similar to those in deionized water, and the quenching rates still reach over 94%. This indicates that despite the differences in water quality, Ir1-Ir3 not only exhibit remarkable stability and efficiency but also demonstrate an excellent ability to detect TNP in different environments, showing great potential for applications.
3.5. Sensing Mechanism
There are two common types of luminescence quenching processes, one is static quenching and the other is dynamic quenching [39]. Static quenching refers to the interaction between the luminescent molecules and the quenchers, forming non-luminescent ground state complexes [40]. These complexes inhibit the luminescence of the luminophores, leading to a decrease in their intensities. Dynamic quenching refers to the process of collisions between the luminophores and the quenchers, which lead to energy or charge transfer [41]. Dynamic quenching is usually a rapid process and its rate is influenced by the concentration of quenchers and the collision frequency between molecules. At the same time, this process is accompanied by the decay of the luminescence lifetime [42].
To study the quenching processes of Ir1-Ir3, UV-Vis absorption spectra were recorded (Figure 9a). As the concentrations of TNP increase, the absorption peak at 257 nm of Ir1 exhibits a slight shift, and the absorption peak at 278 nm disappears, while Ir2 and Ir3 show similar behaviors (Figures S12a and S13a in Supporting Information). This suggests that static quenching may be involved in the quenching process. To confirm whether dynamic quenching is also present in the quenching process, we further conducted luminescence lifetimes measurements (Figures 9b, S12b and S13b in Supporting Information). At a low concentration range (TNP concentrations from 0 to 10 μM), the luminescence lifetimes of the complexes remain essentially unchanged. While in the high concentration range, the luminescence lifetimes of the complexes decrease significantly (Figure S14 in Supporting Information). This suggests that the quenching process for the detection of TNP by Ir1-Ir3 may involve both static quenching and dynamic quenching.
The common detection mechanisms for dynamic quenching include photo-induced electron transfer (PET) and Förster resonance energy transfer (FRET) [43]. By plotting the emission spectra of Ir1-Ir3 and UV-Vis absorption spectrum of TNP, it can be seen that these two spectra do not overlap (Figures 9c, S12c and S13c in Supporting Information), which rules out the FRET mechanism. Therefore, it is deduced that the detection mechanism of Ir1-Ir3 is more likely to be PET. This indicates a rapidly transfer of electrons from the excited state of the complex to the excited state of the TNP and finally back to the ground state, thereby weakening the luminescence intensity. In addition, 1H NMR spectra of Ir1-Ir3 and TNP before and after mixing demonstrate that the addition of TNP does not lead to decomposition of Ir1-Ir3 (Figures S15–S17 in Supporting Information).
4. Conclusions
In this work, three fluorophenyl-substituted cyclometalated Ir(III) complexes have been synthesized by altering the position of the fluorine atom. The results show that all the complexes possess obvious AIPE properties and exhibit high stability, high selectivity, and excellent anti-interference capability for the TNP detection in aqueous media. The KSV for the Ir1-Ir3 are 2.7×10⁴ M−1, 3.3×10⁴ M−1, and 2.3×10⁴ M−1, respectively. Their LODs are 124 nM, 101 nM, and 127 nM, respectively. Ir2 with a fluorine atom at the meta position has the highest KSV and the lowest LOD. Their quenching processes include both dynamic quenching process and static quenching process, and the quenching mechanism may be attributed to the PET. This study has enriched the development and application of Ir(III) complexes as luminescent probes for the detection of TNP.
Supplementary Materials
The following supporting information can be downloaded at the website of this paper posted on Preprints.org, Figure S1: Synthesis routes of ligand L1-L3; Figure S2: The 1H NMR spectrum of Ir1 in DMSO-d6; Figure S3: The high-resolution mass spectrum of Ir1; Figure S4: The 13C NMR spectrum of Ir1 in DMSO-d6; Figure S5: The 1H NMR spectrum of Ir2 in DMSO-d6; Figure S6: The high-resolution mass spectrum of Ir2; Figure S7: The 13C NMR spectrum of Ir2 in DMSO-d6; Figure S8: The 1H NMR spectrum of Ir3 in DMSO-d6; Figure S9: The high-resolution mass spectrum of Ir3; Figure S10: The 13C NMR spectrum of Ir3 in DMSO-d6; Figure S11: DLS analysis of (a) Ir1, (b) Ir2, and (c) Ir3 in CH3CN/H2O mixtures (Ir1: fw = 60%, Ir2: fw = 70%, Ir3: fw = 70%); Figure S12: (a) The UV-Vis absorption spectra of Ir2 upon the addition of TNP with different concentrations; (b) The changes in luminescence lifetime of Ir2 upon the addition of TNP with different concentrations; (c) The normalized UV-Vis absorption spectrum of TNP (red line) and the normalized emission spectrum of Ir2 (blue line); Figure S13: (a) The UV-Vis absorption spectra of Ir3 upon the addition of TNP with different concentrations; (b) The changes in luminescence lifetime of Ir3 upon the addition of TNP with different concentrations; (c) The normalized UV-Vis absorption spectrum of TNP (red line) and the normalized emission spectrum of Ir3 (blue line); Figure S14: Lifetimes of (a) Ir1 (fw = 60%), (b) Ir2 (fw = 70%), and (c) Ir3 (fw = 70%) in CH3CN/H2O after the addition of TNP with different concentrations. Insert: Lifetimes in the low concentration range (0-10 μM); Figure S15: The 1H NMR spectra of Ir1, TNP and Ir1 + TNP in DMSO-d6; Figure S16: The 1H NMR spectra of Ir2, TNP and Ir2 + TNP in DMSO-d6; Figure S17: The 1H NMR spectra of Ir3, TNP and Ir3 + TNP in DMSO-d6.
Author Contributions
Investigation, J.D., R.C. and X.Y.; Data curation, Visualization, Writing - original draft, J.D.; Writing - review & editing, X.L., and C.L.; Funding acquisition, Supervision, C.L. All authors have read and agreed to the published version of the manuscript.
Funding
The authors thank the financial support from the National Natural Science Foundation of China (21978042) and the Fundamental Research Funds for the Central Universities (DUT22LAB610).
Institutional Review Board Statement
Not applicable.
Informed Consent Statement
Not applicable.
Data Availability Statement
Data are contained within the article.
Conflicts of Interest
The authors declare no conflicts of interest.
References
- Luo, J.D.; Xie, Z.L.; Lam, J.W.Y.; Cheng, L.; Chen, H.Y.; Qiu, C.F.; Kwok, H.S.; Zhan, X.W.; Liu, Y.Q.; Zhu, D.B. Aggregation-induced emission of 1-methyl-1,2,3,4,5-pentaphenylsilole. Chem. Commun. 2001, 18, 1740–1741. [Google Scholar] [CrossRef]
- Chi, Y.; Chang, T.-K.; Ganesan, P.; Rajakannu, P. Emissive bis-tridentate Ir(III) metal complexes: Tactics, photophysics and applications. Coord. Chem. Rev. 2017, 346, 91–100. [Google Scholar] [CrossRef]
- Hong, Y.N.; Lam, J.W.Y.; Tang, B.Z. Aggregation-induced emission. Chem. Soc. Rev. 2011, 40, 5361–5388. [Google Scholar] [CrossRef] [PubMed]
- Naithani, S.; Goswami, T.; Thetiot, F.; Kumar, S. Imidazo [4,5-f] [1,10] phenanthroline based luminescent probes for anion recognition: Recent achievements and challenges. Coord. Chem. Rev. 2023, 475, 214894. [Google Scholar] [CrossRef]
- Pan, Z.-Y.; Feng, W.-W.; Liu, Q.-Y.; He, L.; Yao, D.-H.; He, Z.-D. Lipophilic neutral iridium(III) complexes for phosphorescence imaging of lipid droplets and potential photodynamic therapy. Dyes Pigm. 2022, 203, 110387. [Google Scholar] [CrossRef]
- Zhang, G.; Fu, X.; Zhou, D.; Hu, R.; Qin, A.; Tang, B.Z. Smart aggregation-induced emission polymers: Preparation, properties and bio-applications. Smart Mol. 2023, 1, e20220008. [Google Scholar] [CrossRef]
- Manimaran, B.; Thanasekaran, P.; Rajendran, T.; Lin, R.J.; Chang, I.J.; Lee, G.H.; Peng, S.M.; Rajagopal, S.; Lu, K.L. Luminescence enhancement induced by aggregation of alkoxy-bridged rhenium(I) molecular rectangles. Inorg. Chem. 2002, 41, 5323–5325. [Google Scholar] [CrossRef] [PubMed]
- Lin, S.H.; Pan, H.H.; Li, L.; Liao, R.; Yu, S.Z.; Zhao, Q.; Sun, H.B.; Huang, W. AIPE-active platinum(ii) complexes with tunable photophysical properties and their application in constructing thermosensitive probes used for intracellular temperature imaging. J. Mater. Chem. C 2019, 7, 7893–7899. [Google Scholar] [CrossRef]
- Sathish, V.; Ramdass, A.; Thanasekaran, P.; Lu, K.L.; Rajagopal, S. Aggregation-induced phosphorescence enhancement (AIPE) based on transition metal complexes-An overview. J. Photochem. Photobiol. C 2015, 23, 25–44. [Google Scholar] [CrossRef]
- Mauro M, Cebrián C. Aggregation-induced phosphorescence enhancement in Ir(III) Complexes. Isr. J. Chem. 2018, 58, 901–914.
- Smith A R G, Burn P L, Powell B J. Spin-orbit coupling in phosphorescent Ir(III) Complexes. ChemPhysChem 2011, 12, 2428–2437.
- Jhun, B.H.; Song, D.; Park, S.Y.; You, Y. Phosphorescent Ir(III) complexes for biolabeling and biosensing. Top. Curr. Chem. 2022, 380, 35. [Google Scholar] [CrossRef] [PubMed]
- Zhao Q A, Liu S J, Huang W. Promising optoelectronic materials: Polymers containing phosphorescent Ir(III) complexes. Macromol. Rapid Commun. 2010, 31, 794–807.
- Li, Y.Y.; Wu, Y.Q.; Wu, J.; Lun, W.C.; Zeng, H.; Fan, X.L. A near-infrared phosphorescent Ir(III) complex for fast and time-resolved detection of cysteine and homocysteine. Analyst 2020, 145, 2238–2244. [Google Scholar] [CrossRef]
- Gao, H.F.; Qi, H.T.; Peng, Y.J.; Qi, H.L.; Zhang, C.X. Rapid “turn-on” photoluminescence detection of bisulfite in wines and living cells with a formyl bearing bis-cyclometalated Ir(III) complex. Analyst 2018, 143, 3670–3676. [Google Scholar] [CrossRef]
- Yang, X.L.; Guo, H.R.; Liu, B.A.; Zhao, J.; Zhou, G.J.; Wu, Z.X.; Wong, W.Y. Diarylboron-based asymmetric red-emitting Ir(III) complex for solution-processed phosphorescent organic light-emitting diode with external quantum efficiency above 28%. Adv. Sci. 2018, 5, 1701067. [Google Scholar] [CrossRef]
- Abbas, S.; Din, I.U.D.; Raheel, A.; Din, A.T.U. Cyclometalated Ir(III) complexes: Recent advances in phosphorescence bioimaging and sensing applications. Appl. Organomet. Chem. 2020, 34, e5413. [Google Scholar] [CrossRef]
- Schreier, M.R.; Guo, X.W.; Pfund, B.; Okamoto, Y.; Ward, T.R.; Kerzig, C.; Wenger, O.S. Water-soluble tris(cyclometalated) Ir(III) complexes for aqueous electron and energy transfer photochemistry. Acc. Chem. Res. 2022, 55, 1290–1300. [Google Scholar] [CrossRef]
- Zhao, Q.; Li, L.; Li, F.Y.; Yu, M.X.; Liu, Z.P.; Yi, T.; Huang, C.H. Aggregation-induced phosphorescent emission (AIPE) of iridium(III) complexes. Chem. Commun. 2008, 685–687. [Google Scholar] [CrossRef]
- Wei, R.H.; Chen, J.F.; Feng, J.Q.; Hu, J.S.; Cao, D.K. Two heteroleptic Ir(III)-bisthienylethene compounds: Syntheses, structures and aggregation-induced luminescence. RSC Adv. 2015, 5, 14359–14365. [Google Scholar] [CrossRef]
- Dong, L.C.; Shang, G.J.; Shi, J.B.; Zhi, J.G.; Tong, B.; Dong, Y.P. Effect of substituent position on the photophysical properties of triphenylpyrrole isomers. Phys. Chem. C 2017, 121, 11658–11664. [Google Scholar] [CrossRef]
- Song, W.L.; Gao, J.; Gao, Y.; Shan, G.G.; Geng, Y.; Shao, K.Z.; Su, Z.M. Constructing anion-π interactions in cationic iridium (III) complexes to achieve aggregation-induced emission properties. Inorg. Chem. Front. 2024, 11, 1198–1206. [Google Scholar] [CrossRef]
- Thekkathu, R.; Ashok, D.; Ramkollath, P.K.; Neelakandapillai, S.; Kurishunkal, L.P.; Yadav, M.S.P.; Kalarikkal, N. Magnetically recoverable Ir/IrO2@Fe3O4 core/SiO2 shell catalyst for the reduction of organic pollutants in water. Chem. Phys. Lett. 2020, 742, 137147. [Google Scholar] [CrossRef]
- Paziresh, S.; Aghakhanpour, R.B.; Shahsavari, H.R.; Dolatyari, V.; Ara, I.; Nabavizadeh, S.M. Phosphorescent cyclometalated Ir(III) complexes comprising chelating thiolate ligands as pH-activatable sensors. New J. Chem. 2023, 47, 1378–1387. [Google Scholar] [CrossRef]
- Lin, C.K.; Wang, J.; Yang, K.; Liu, J.B.; Ma, D.L.; Leung, C.H.; Wang, W.H. Development of a NIR iridium(III) complex for self-calibrated and luminogenic detection of boron trifluoride. Spectrochim. Acta Part A 2022, 282, 121658. [Google Scholar] [CrossRef]
- Geng, T.M.; Ye, S.N.; Wang, Y.; Zhu, H.; Wang, X.; Liu, X. Conjugated microporous polymers-based fluorescein for fluorescence detection of 2,4,6-trinitrophenol. Talanta 2017, 165, 282–288. [Google Scholar] [CrossRef]
- Tasci, E.; Aydin, M.; Gorur, M.; Gürek, A.G.; Yilmaz, F. Pyrene-functional star polymers as fluorescent probes for nitrophenolic compounds. J. Appl. Polym. Sci. 2018, 135, 46310. [Google Scholar] [CrossRef]
- Fabin M, Lapkowski M, Jarosz T. Methods for detecting picric acid-a review of recent progress. Appl. Sci. 2023, 13, 3991.
- Khan, I.; Shah, T.R.; Tariq, M.R.; Ahmad, M.; Zhang, B.L. Understanding the toxicity of trinitrophenol and promising decontamination strategies for its neutralization: Challenges and future perspectives. J. Environ. Chem. Eng. 2024, 12, 112720. [Google Scholar] [CrossRef]
- Yi, S.L.; Lu, Z.; Xie, Z.H.; Hou, L.X. Amphiphilic gemini-iridium (III) complex for rapid and selective detection of picric acid in water and intracellular. Talanta 2020, 208, 120372. [Google Scholar] [CrossRef]
- Shan, G.G.; Li, H.B.; Sun, H.Z.; Zhu, D.X.; Cao, H.T.; Su, Z.M. Controllable synthesis of iridium(III)-based aggregation-induced emission and/or piezochromic luminescence phosphors by simply adjusting the substitution on ancillary ligands. J. Mater. Chem. C 2013, 1, 1440–1449. [Google Scholar] [CrossRef]
- Yang, C.; Wen, L.L.; Shan, G.G.; Sun, H.Z.; Mao, H.T.; Zhang, M.; Su, Z.M. Di-/trinuclear cationic Ir(III) complexes: Design, synthesis and application for highly sensitive and selective detection of TNP in aqueous solution. Sens. Actuators B 2017, 244, 314–322. [Google Scholar]
- Chen, R.M.; Zhang, Q.L.; Zhang, L.Y.; Liu, C. A phenyl-modified aggregation-induced phosphorescent emission-active cationic Ru(II) complex for detecting picric acid in aqueous media. Chemosensors 2025, 13, 14. [Google Scholar] [CrossRef]
- Xu, J.C.; Zhang, L.Y.; Shi, Y.S.; Liu, C. Carbazolyl-modified neutral Ir(III) complexes for efficient detection of picric acid in aqueous media. Sensors 2024, 24, 4074. [Google Scholar] [CrossRef] [PubMed]
- Yan, Y.Y.; Jia, W.H.; Zhang, L.Y.; Liu, C. Fluorophenyl-modified AIPE-active cationic Pt(II) complexes for detecting picric acid in aqueous media. Dyes Pigm. 2023, 220, 111719. [Google Scholar] [CrossRef]
- Liu, C.; Rao, X.F.; Song, X.L.; Qiu, J.S.; Jin, Z.L. Palladium-catalyzed ligand-free and aqueous Suzuki reaction for the construction of (hetero)aryl-substituted triphenylamine derivatives. RSC Adv. 2013, 3, 526–531. [Google Scholar] [CrossRef]
- Wang, R.J.; Deng, L.J.; Zhang, T.; Li, J.Y. Substituent effect on the photophysical properties, electrochemical properties and electroluminescence performance of orange-emitting iridium complexes. Dalton Trans. 2012, 41, 6833–6841. [Google Scholar] [CrossRef] [PubMed]
- Toprak, M.; Aydin, B.M.; Arik, M.; Onganer, Y. Fluorescence quenching of fluorescein by Merocyanine 540 in liposomes. J. Lumin. 2011, 131, 2286–2289. [Google Scholar] [CrossRef]
- Wang, J.; Wang, D.; Miller, E.K.; Moses, D.; Heeger, A.J. Static and dynamic photoluminescence (PL) quenching of polymer: Quencher systems in solutions. Synth. Met. 2001, 119, 591–592. [Google Scholar] [CrossRef]
- Ciotta E, Prosposito P, Pizzoferrato R. Positive curvature in Stern-Volmer plot described by a generalized model for static quenching. J. Lumin. 2019, 206, 518–522.
- Zu, F.L.; Yan, F.Y.; Bai, Z.J.; Xu, J.X.; Wang, Y.Y.; Huang, Y.C.; Zhou, X.G. The quenching of the fluorescence of carbon dots: A review on mechanisms and applications. Microchim. Acta 2017, 184, 1899–1914. [Google Scholar] [CrossRef]
- Gadomska, A.V.; Nevidimov, A.V.; Tovstun, S.A.; Petrova, O.V.; Sobenina, L.N.; Trofimov, B.A.; Razumov, V.F. Fluorescence from 3,5-diphenyl-8-CF3-BODIPYs with amino substituents on the phenyl rings: Quenching by aromatic molecules. Spectrochim. Acta Part A 2021, 254, 119623. [Google Scholar] [CrossRef] [PubMed]
- Hollett, G.; Roberts, D.S.; Sewell, M.; Wensley, E.; Wagner, J.; Murray, W.; Krotz, A.; Toth, B.; Vijayakumar, V.; Sailor, M.J. Quantum ensembles of silicon nanoparticles: Discrimination of static and dynamic photoluminescence quenching processes. J. Phys. Chem. C 2019, 123, 17976–17986. [Google Scholar] [CrossRef] [PubMed]
Figure 1.
(a) The UV-Vis absorption spectra and (b) the normalized emission spectra of Ir1-Ir3 in CH3CN (Excitation wavelength: 400 nm, c = 10 μM).
Figure 1.
(a) The UV-Vis absorption spectra and (b) the normalized emission spectra of Ir1-Ir3 in CH3CN (Excitation wavelength: 400 nm, c = 10 μM).
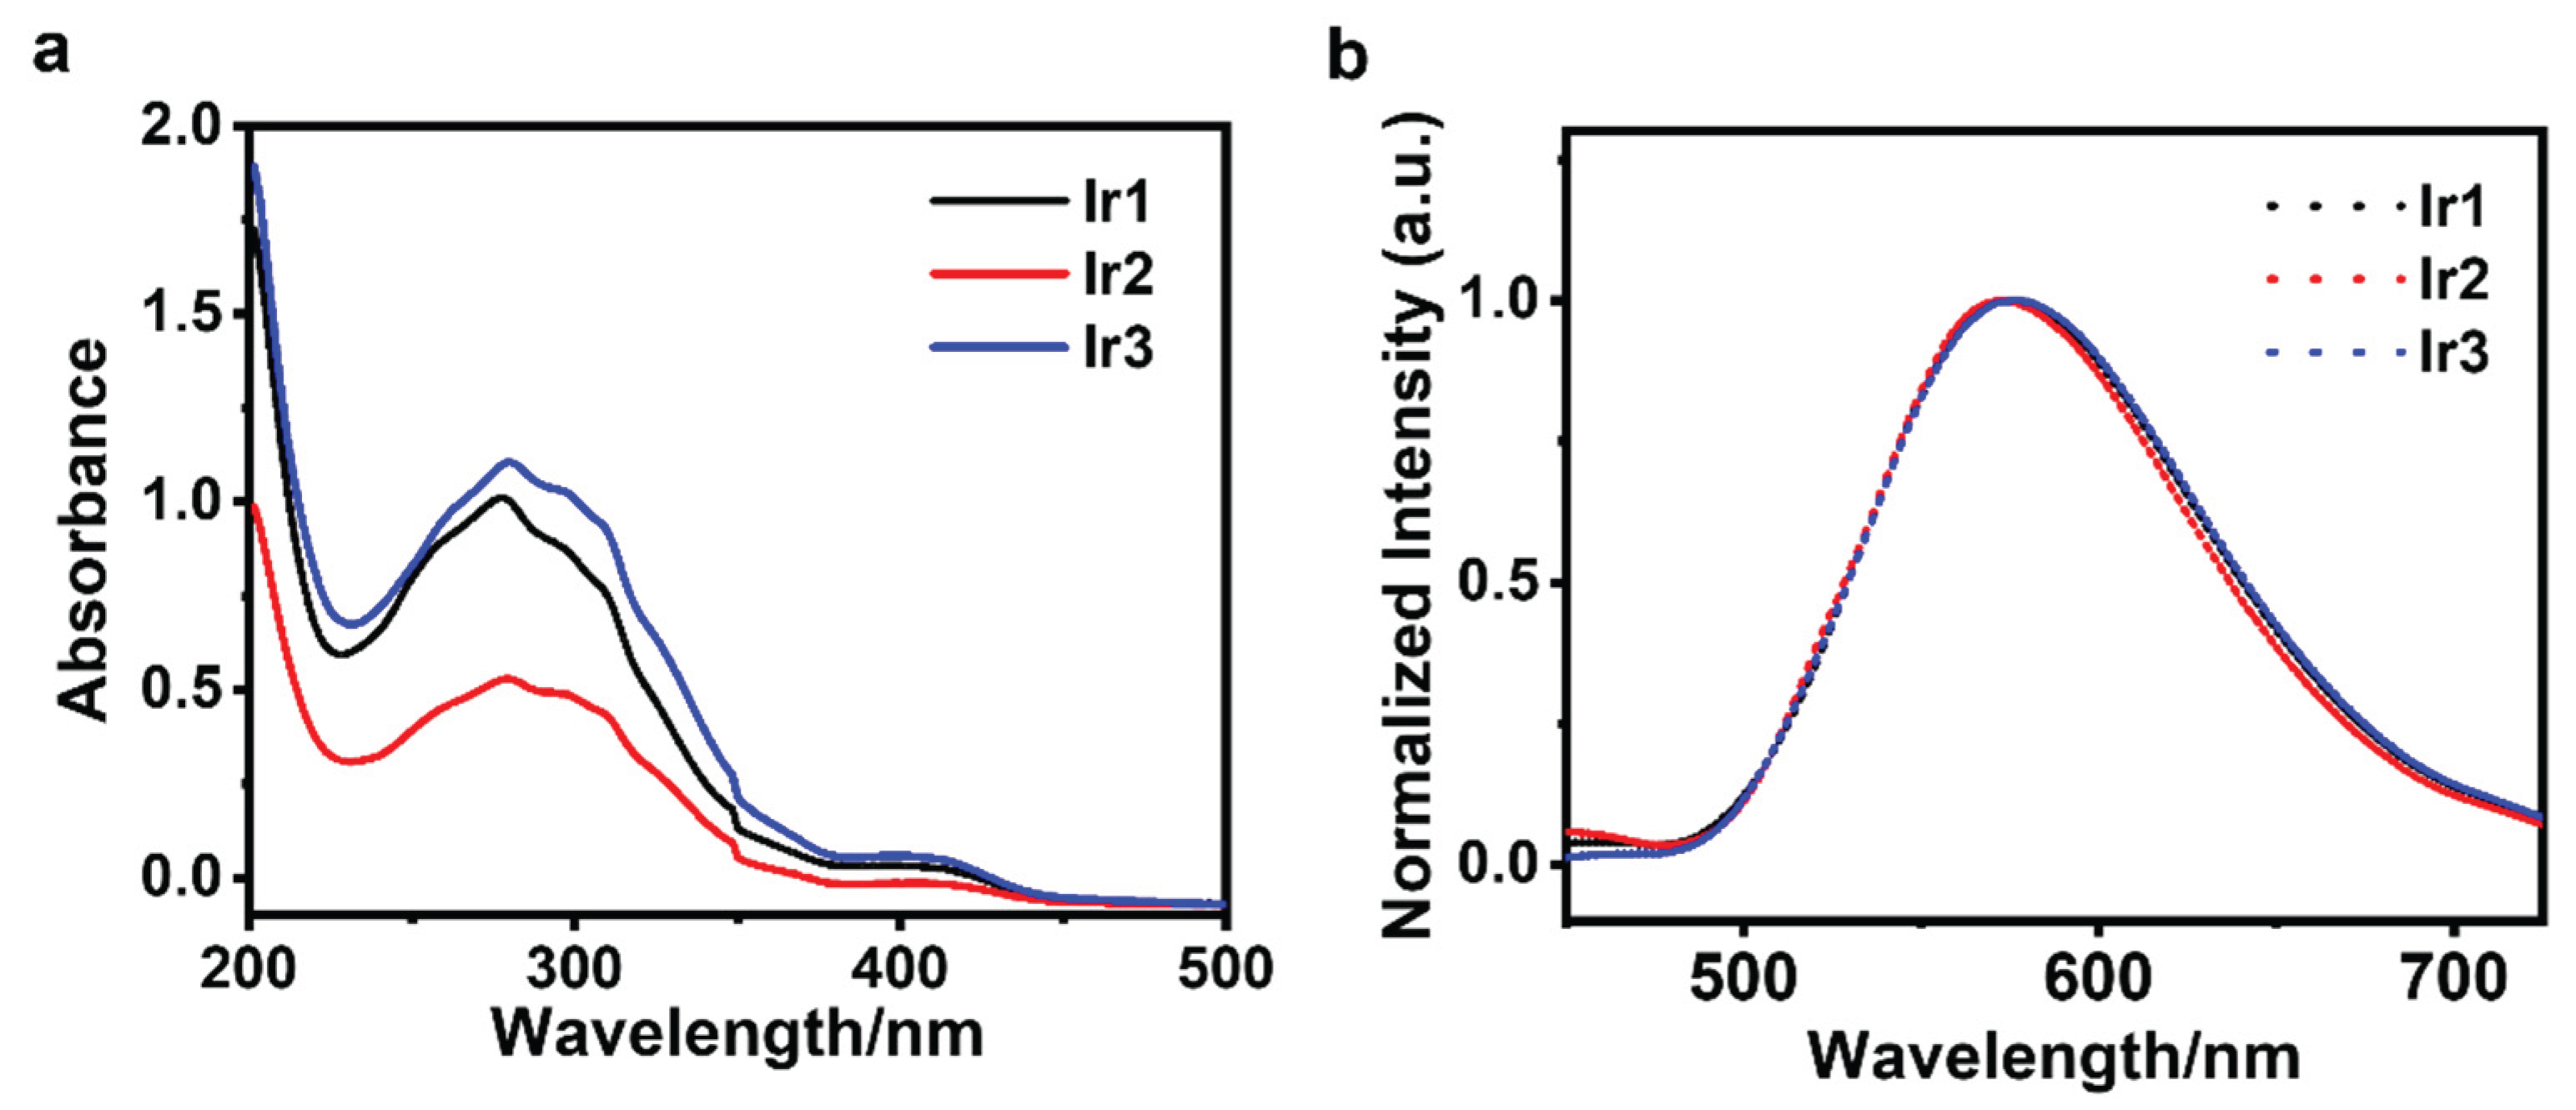
Figure 2.
The emission spectra of (a) Ir1, (b) Ir2, and (c) Ir3 in CH3CN/H2O mixtures with varying water contents and (d) the relative intensities I/I0 of Ir1-Ir3. I represents the emission intensities at the maximum emission wavelength in different water contents (Ir1: 574 nm; Ir2: 573 nm; Ir3: 578 nm), while I0 represents the emission intensities at the maximum emission wavelength in CH3CN (Excitation wavelength: 400 nm, c = 10 μM).
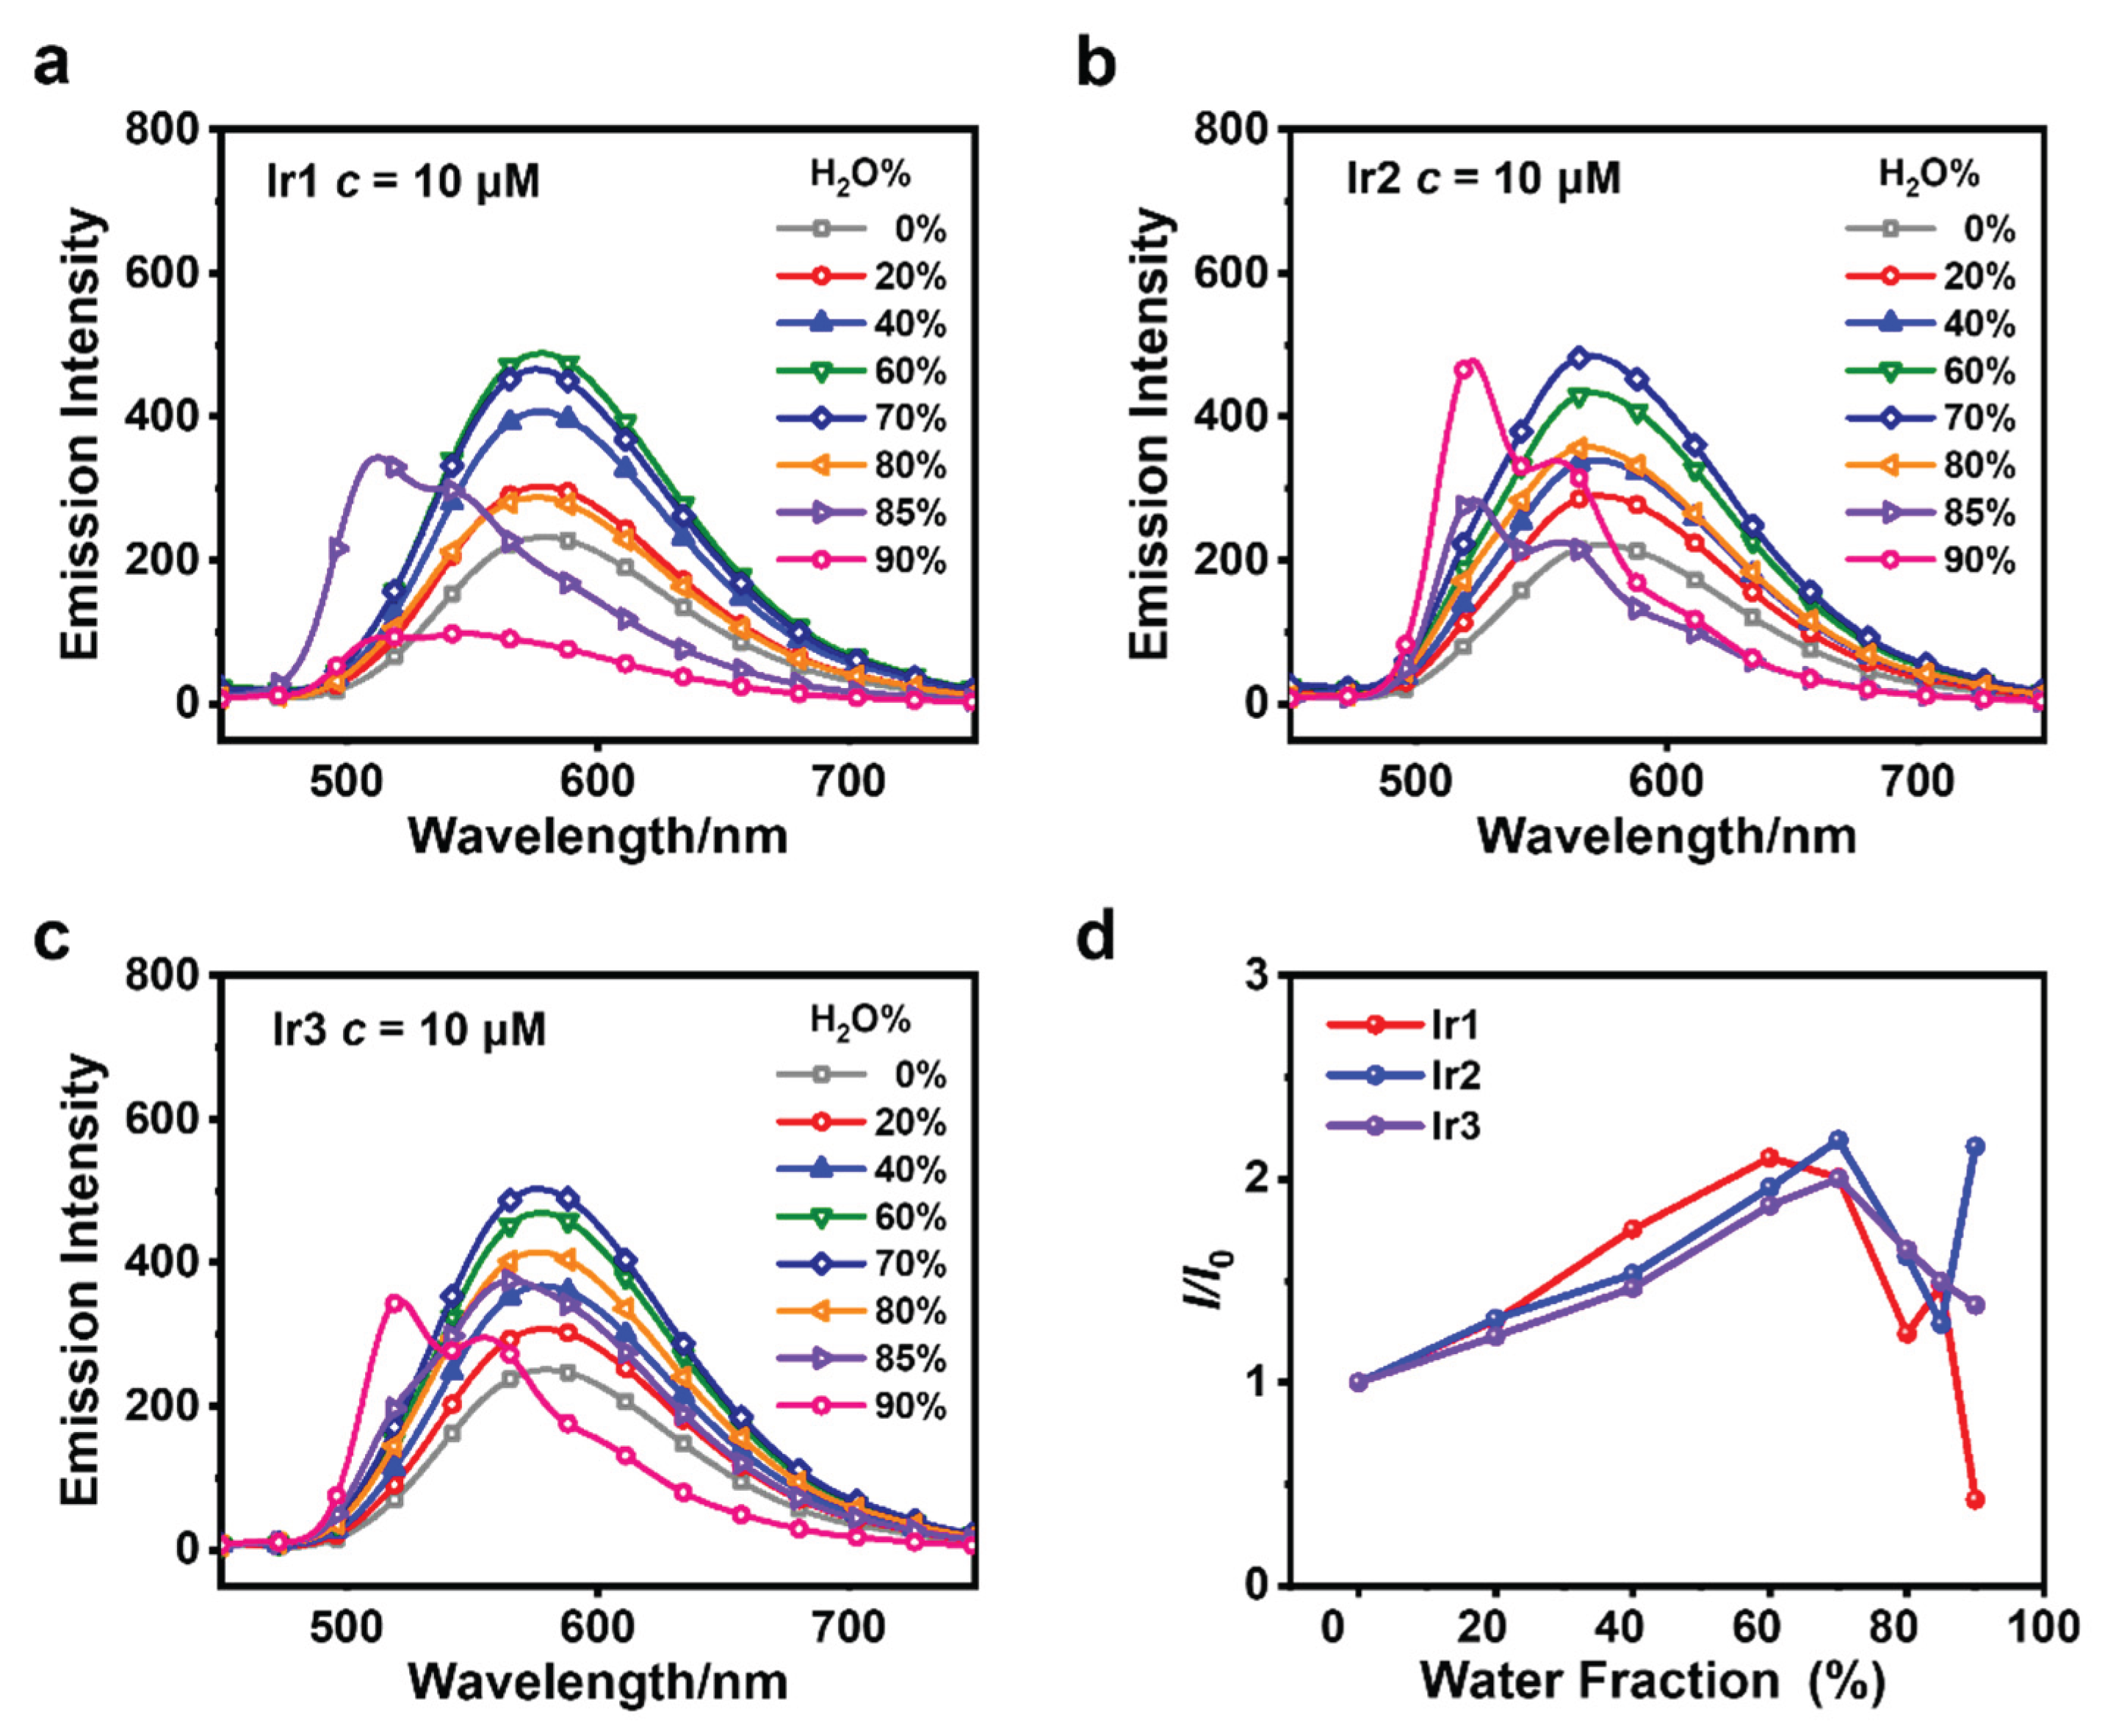
Figure 3.
The emission spectra of (a) Ir1 (fw = 60%), (b) Ir2 (fw = 70%), and (c) Ir3 (fw = 70%) in volumetric flasks after being placed for different durations, as well as the emission spectra of 11 blank suspension samples for (d) Ir1, (e) Ir2, and (f) Ir3 after reaching equilibrium at 8 h, 7 h, and 4 h, respectively (Excitation wavelength: 400 nm, c = 10 μM).
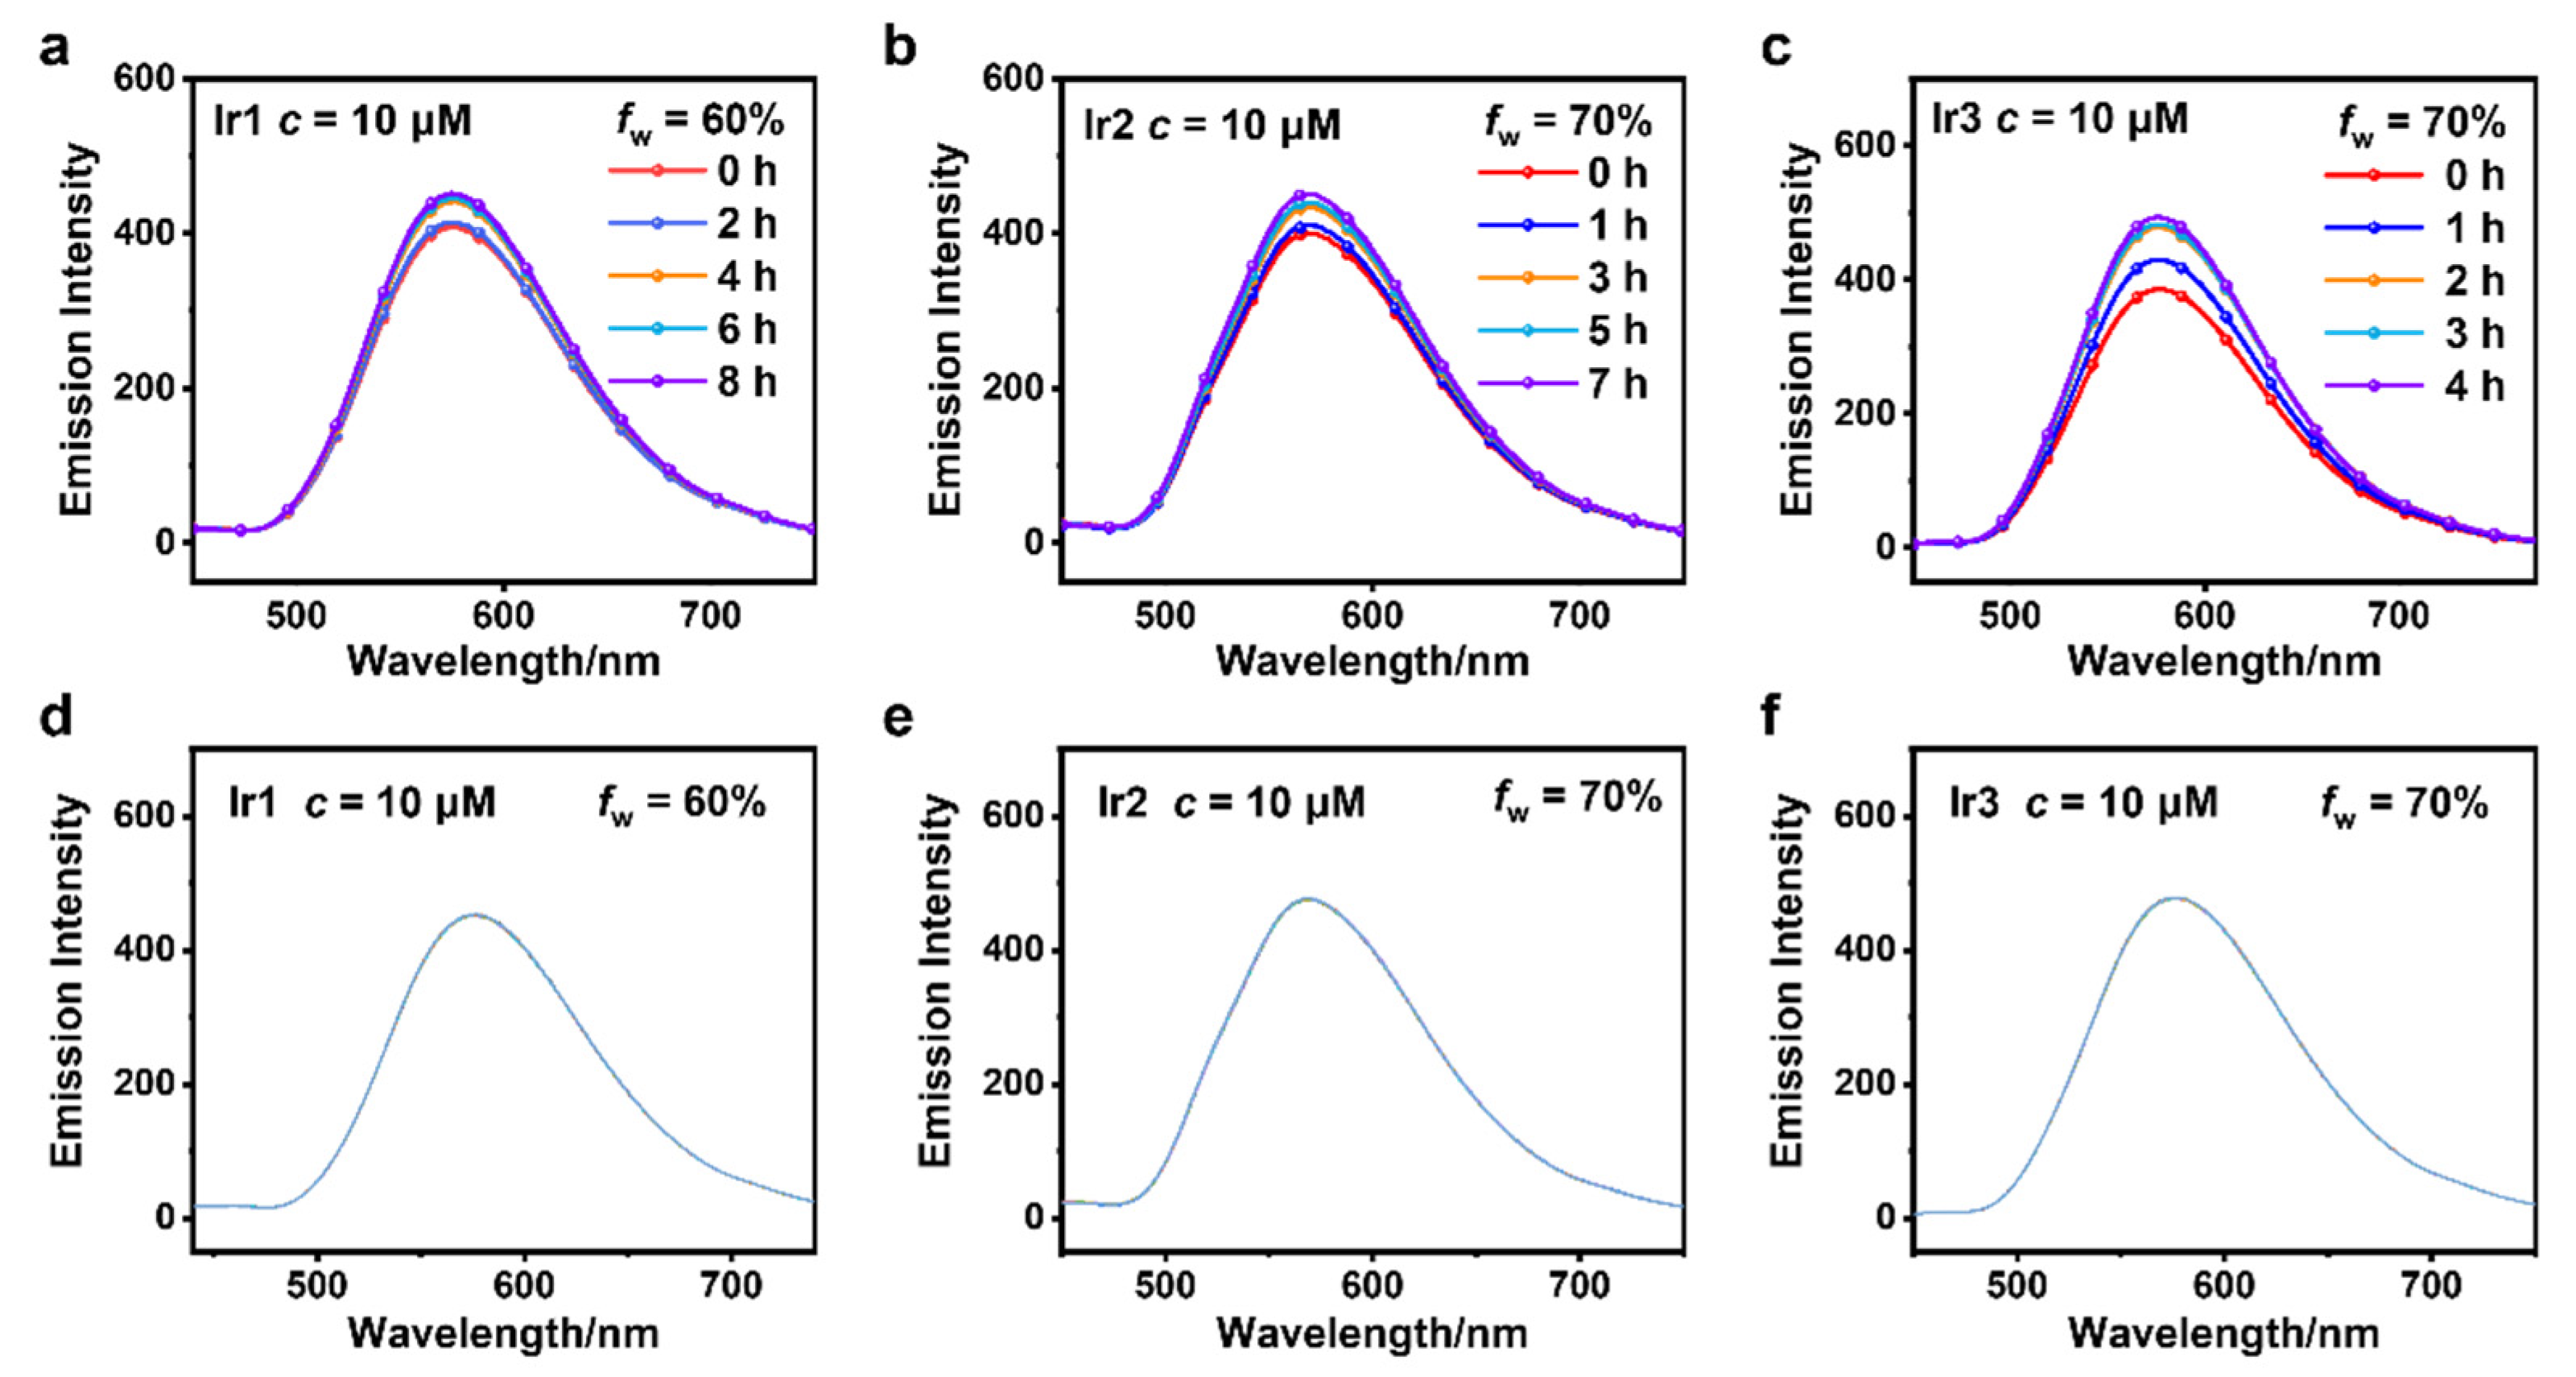
Figure 4.
The Stern-Volmer curves of (a) Ir1 (fw = 60%), (b) Ir2 (fw = 70%), and (c) Ir3 (fw = 70%) for the detection of TNP. Insert: The emission spectra of the complexes in the presence of TNP at different concentrations (top left) and the linear portion of the Stern-Volmer curves (bottom right).
Figure 4.
The Stern-Volmer curves of (a) Ir1 (fw = 60%), (b) Ir2 (fw = 70%), and (c) Ir3 (fw = 70%) for the detection of TNP. Insert: The emission spectra of the complexes in the presence of TNP at different concentrations (top left) and the linear portion of the Stern-Volmer curves (bottom right).
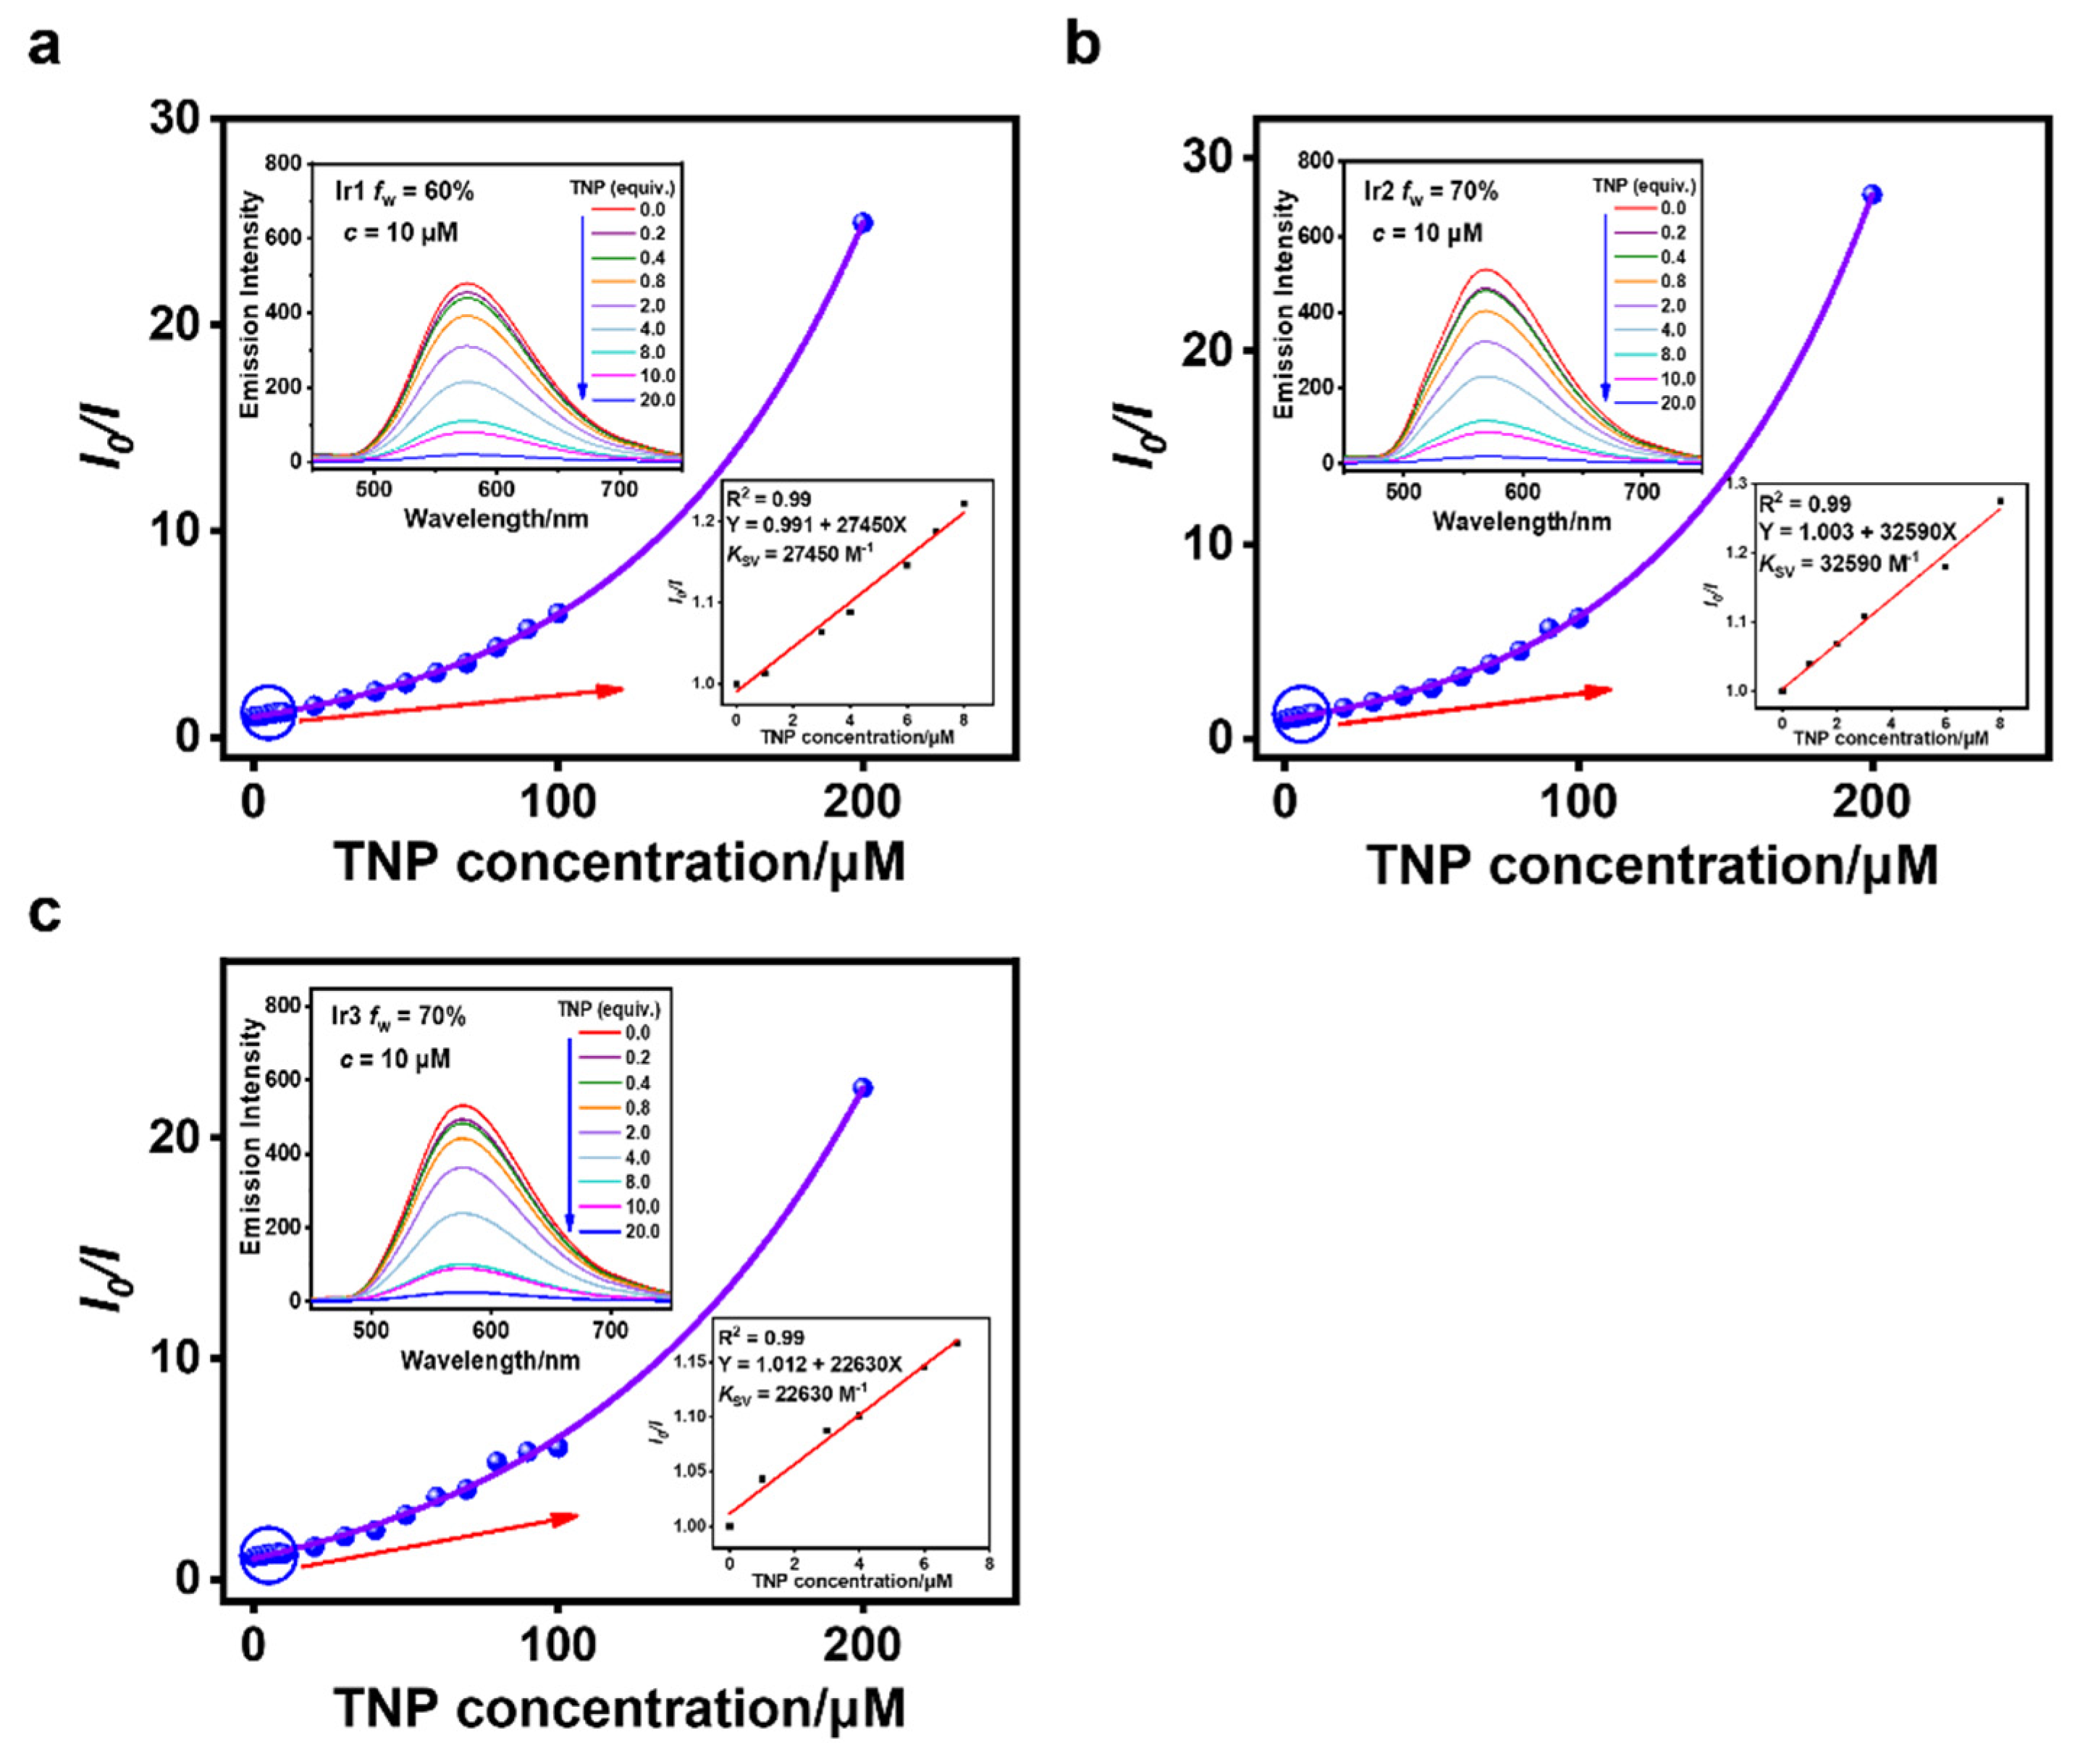
Figure 5.
The emission intensities versus TNP concentrations relationship for (a) Ir1 (fw = 60%), (b) Ir2 (fw = 70%), and (c) Ir3 (fw = 70%) (Excitation wavelength: 400 nm, c = 10 μM).
Figure 5.
The emission intensities versus TNP concentrations relationship for (a) Ir1 (fw = 60%), (b) Ir2 (fw = 70%), and (c) Ir3 (fw = 70%) (Excitation wavelength: 400 nm, c = 10 μM).
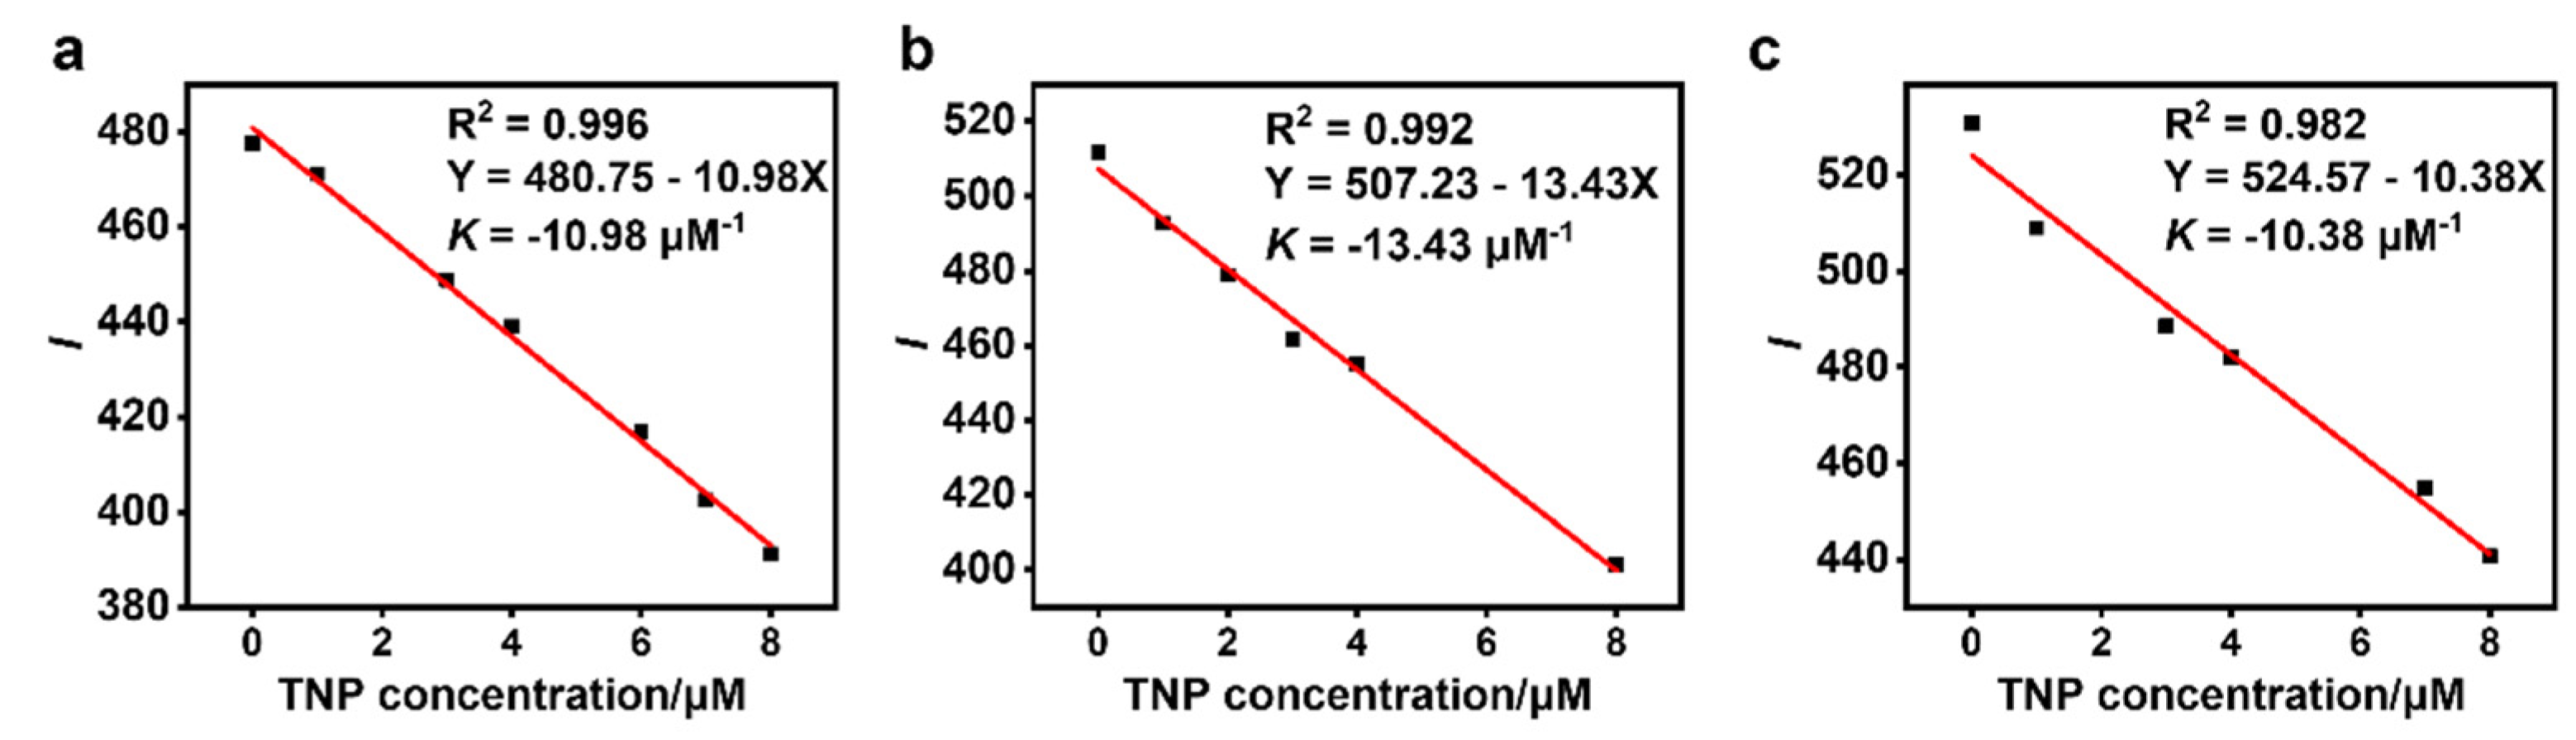
Figure 6.
The emission spectra of (a) Ir1 (fw = 60%), (b) Ir2 (fw = 70%), and (c) Ir3 (fw = 70%) after the addition of different analytes (20 equiv.) and the quenching rates of different analytes on (d) Ir1, (e) Ir2, and (f) Ir3 (Excitation wavelength: 400 nm, c = 10 μM, CH3CN/H2O).
Figure 6.
The emission spectra of (a) Ir1 (fw = 60%), (b) Ir2 (fw = 70%), and (c) Ir3 (fw = 70%) after the addition of different analytes (20 equiv.) and the quenching rates of different analytes on (d) Ir1, (e) Ir2, and (f) Ir3 (Excitation wavelength: 400 nm, c = 10 μM, CH3CN/H2O).
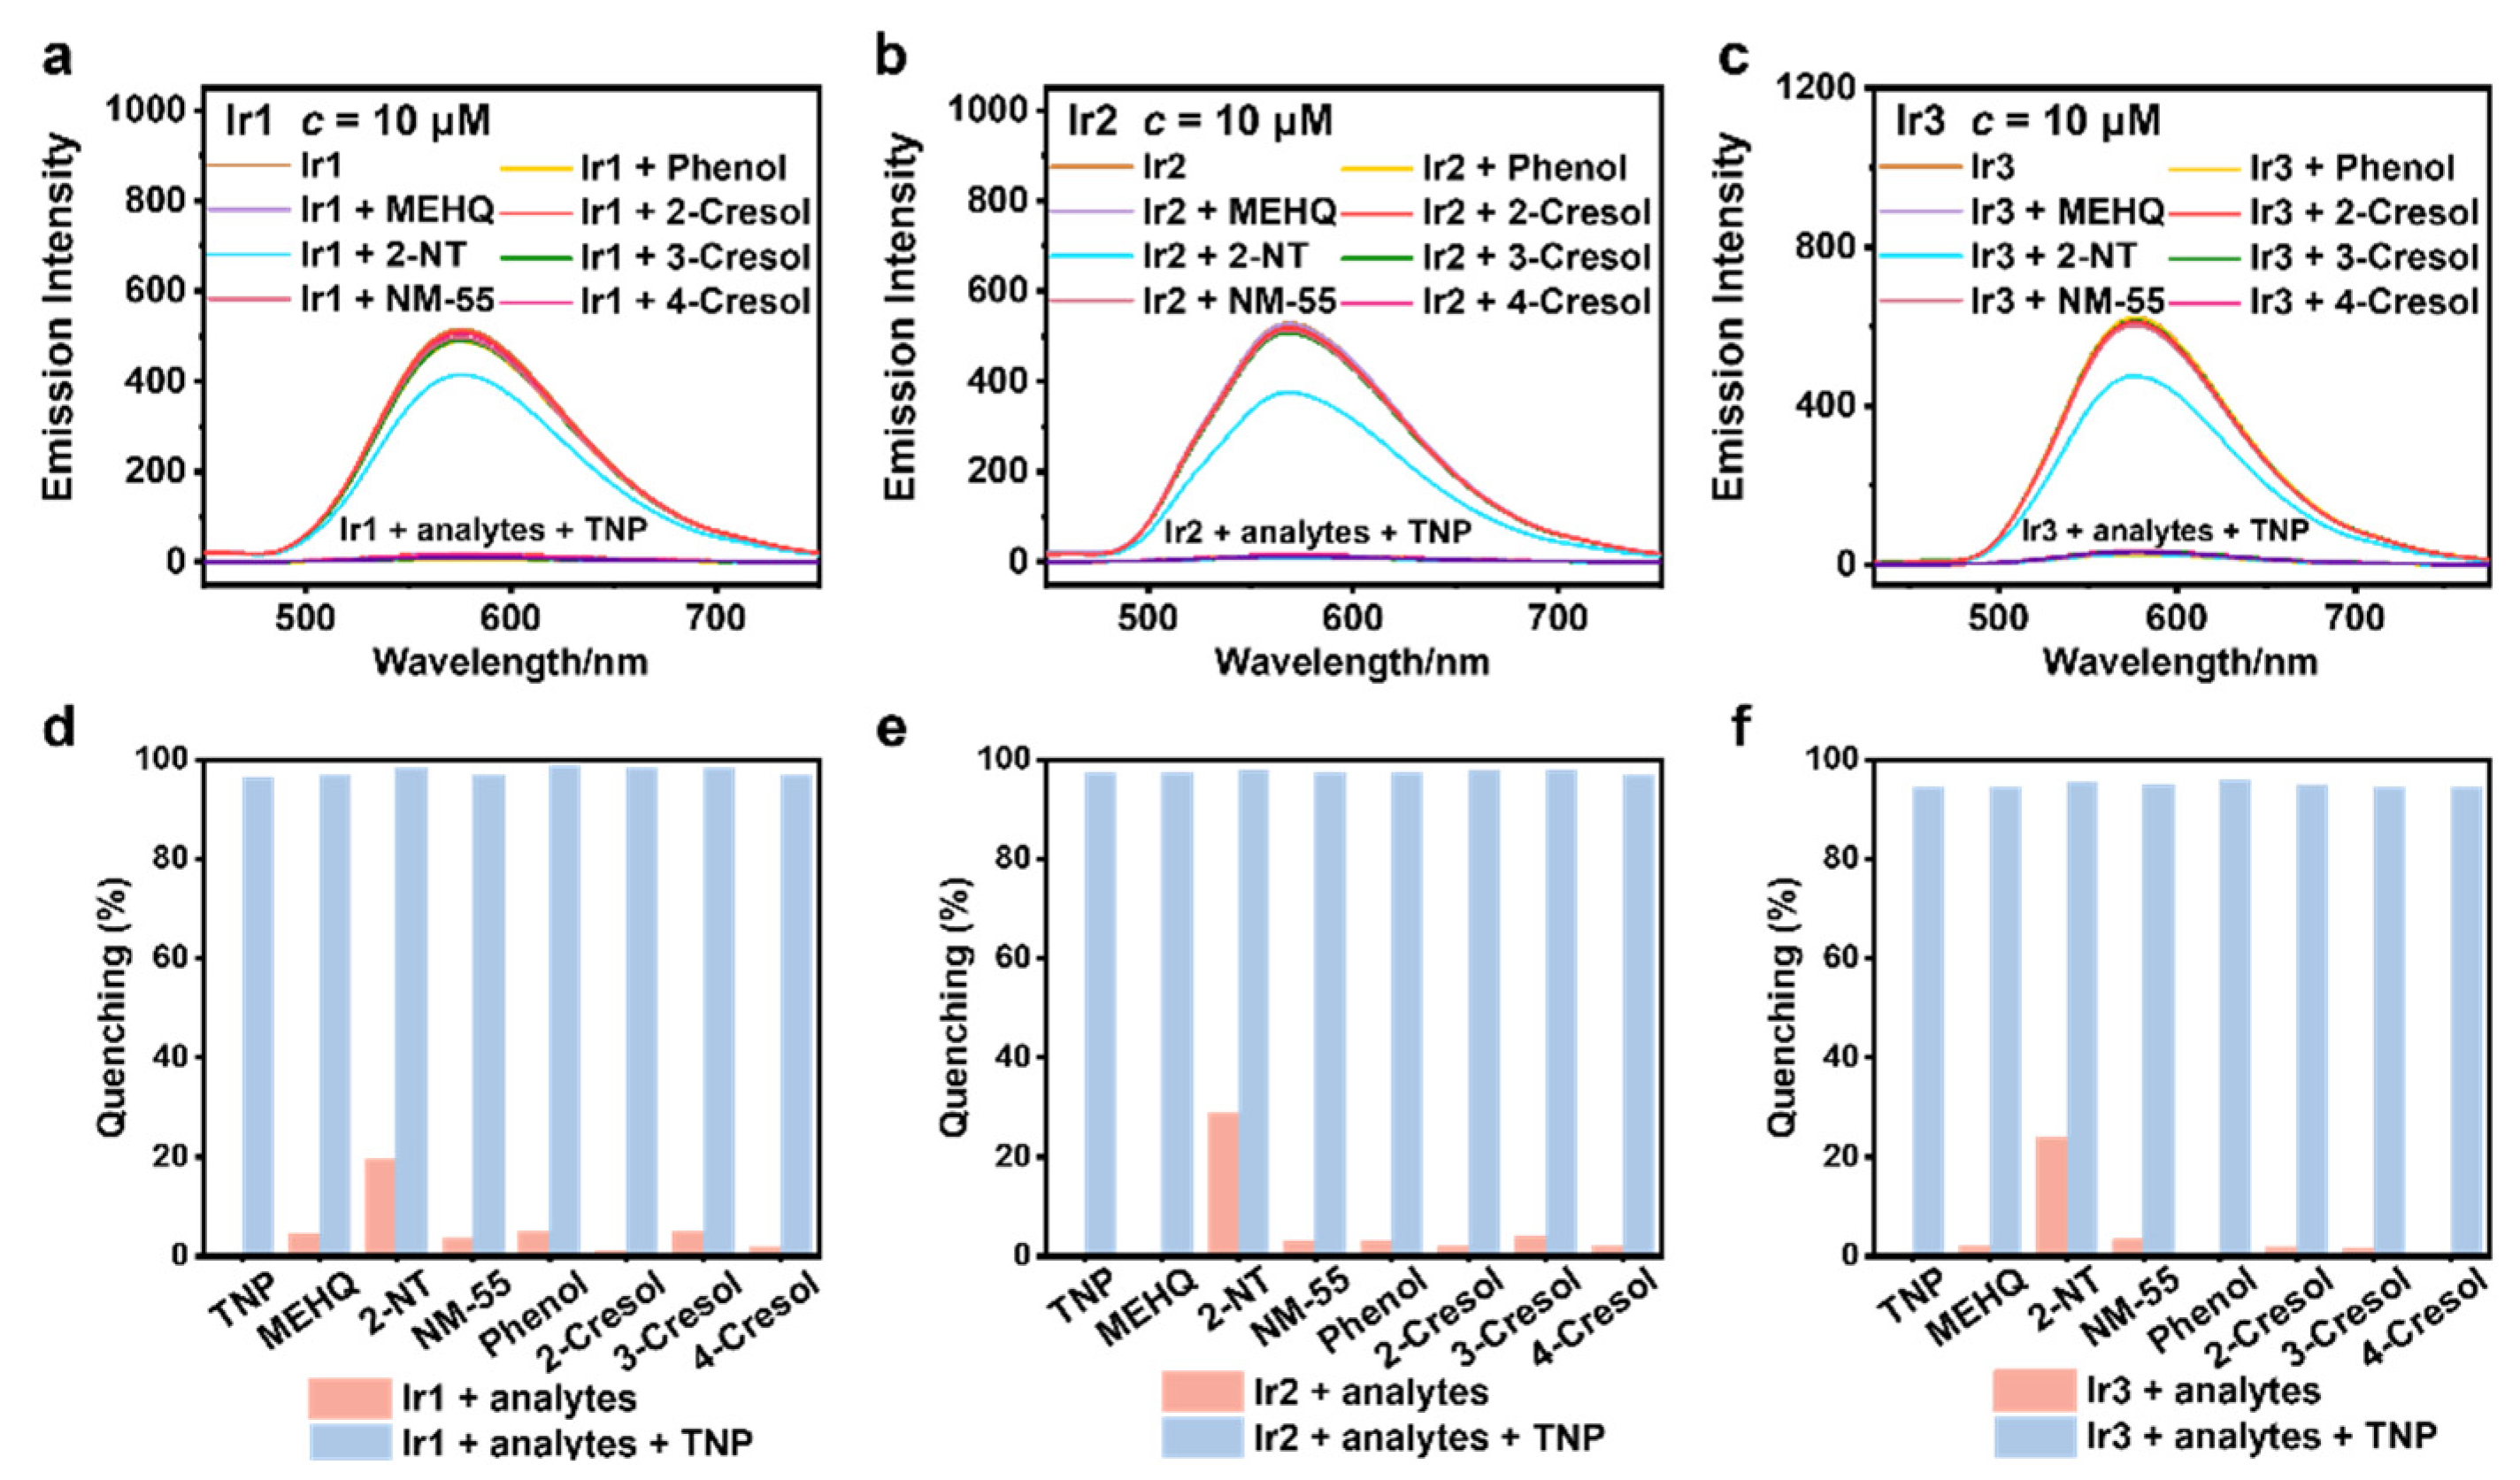
Figure 7.
The emission spectra of (a) Ir1 (fw = 60%), (b) Ir2 (fw = 70%), and (c) Ir3 (fw = 70%) after the addition of different ionic compounds (20 equiv.) and the quenching rates of different ionic compounds on (d) Ir1, (e) Ir2, and (f) Ir3 (Excitation wavelength: 400 nm, c = 10 μM, CH3CN/H2O).
Figure 7.
The emission spectra of (a) Ir1 (fw = 60%), (b) Ir2 (fw = 70%), and (c) Ir3 (fw = 70%) after the addition of different ionic compounds (20 equiv.) and the quenching rates of different ionic compounds on (d) Ir1, (e) Ir2, and (f) Ir3 (Excitation wavelength: 400 nm, c = 10 μM, CH3CN/H2O).
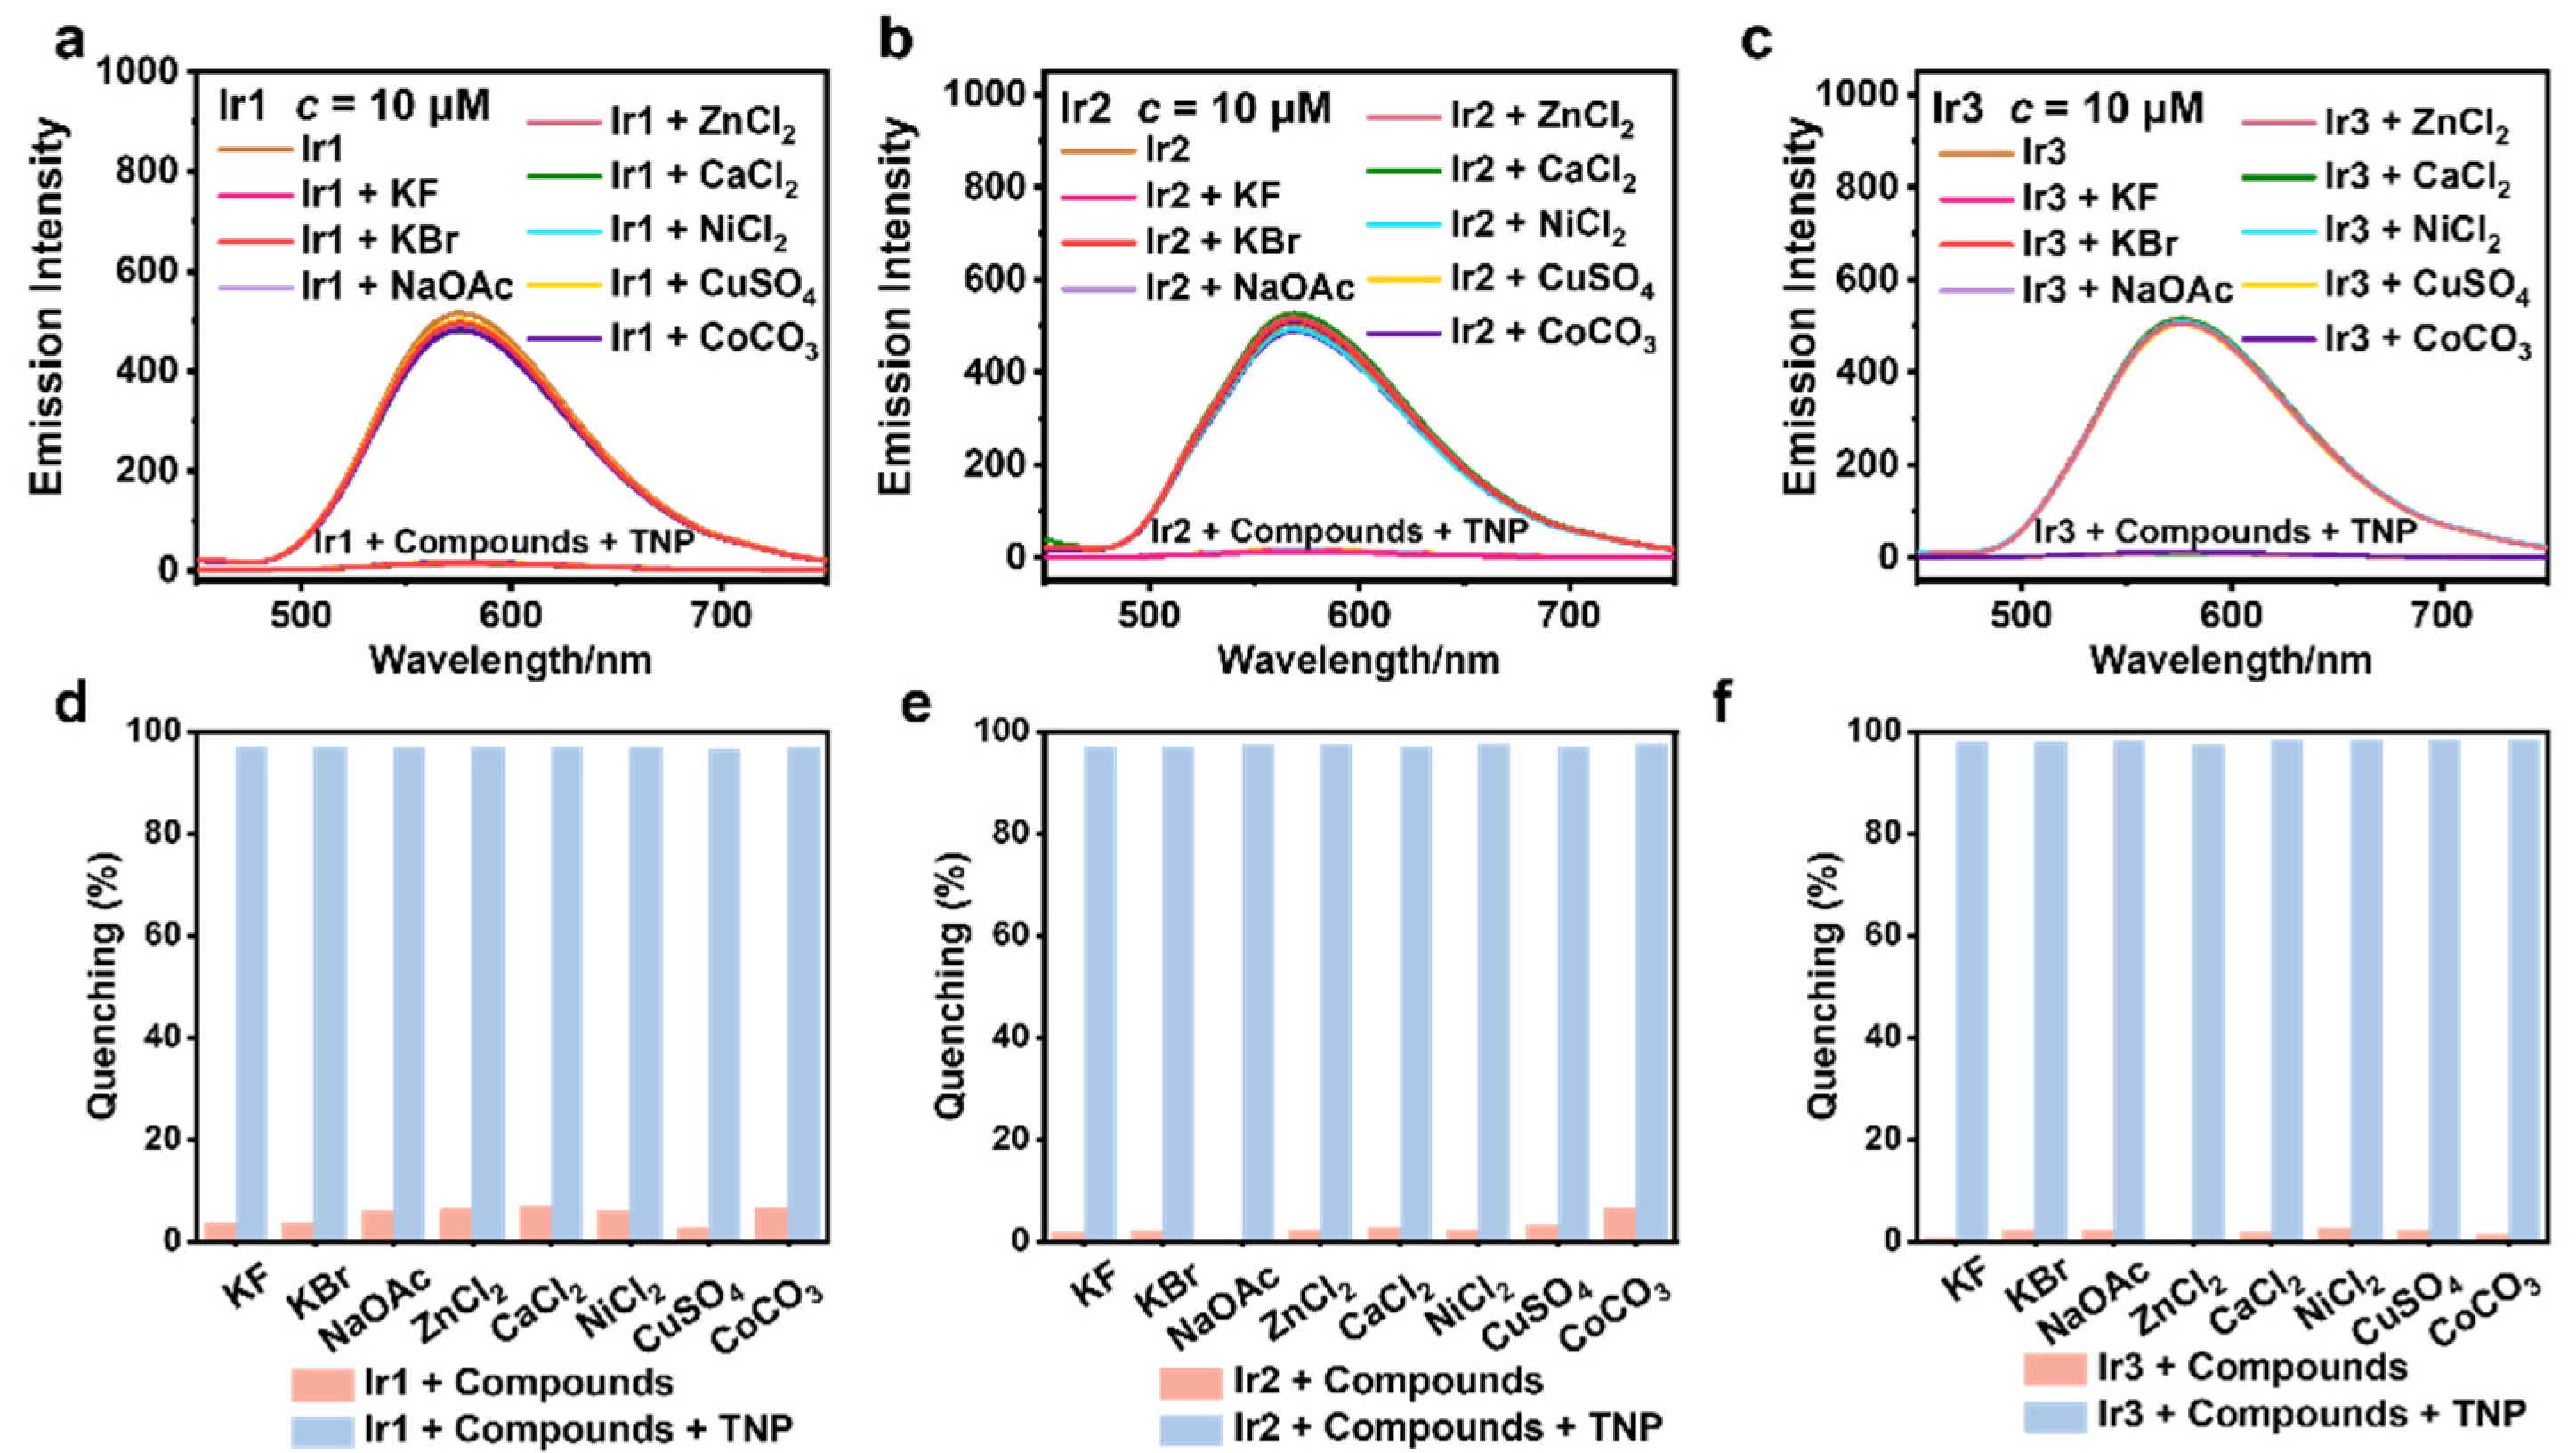
Figure 8.
The emission spectra of (a) Ir1 (fw = 60%), (b) Ir2 (fw = 70%), and (c) Ir3 (fw = 70%) in different water samples and the quenching rates of (d) Ir1, (e) Ir2, and (f) Ir3 in different water samples (Excitation wavelength: 400 nm, c = 10 μM, CH3CN/H2O).
Figure 8.
The emission spectra of (a) Ir1 (fw = 60%), (b) Ir2 (fw = 70%), and (c) Ir3 (fw = 70%) in different water samples and the quenching rates of (d) Ir1, (e) Ir2, and (f) Ir3 in different water samples (Excitation wavelength: 400 nm, c = 10 μM, CH3CN/H2O).
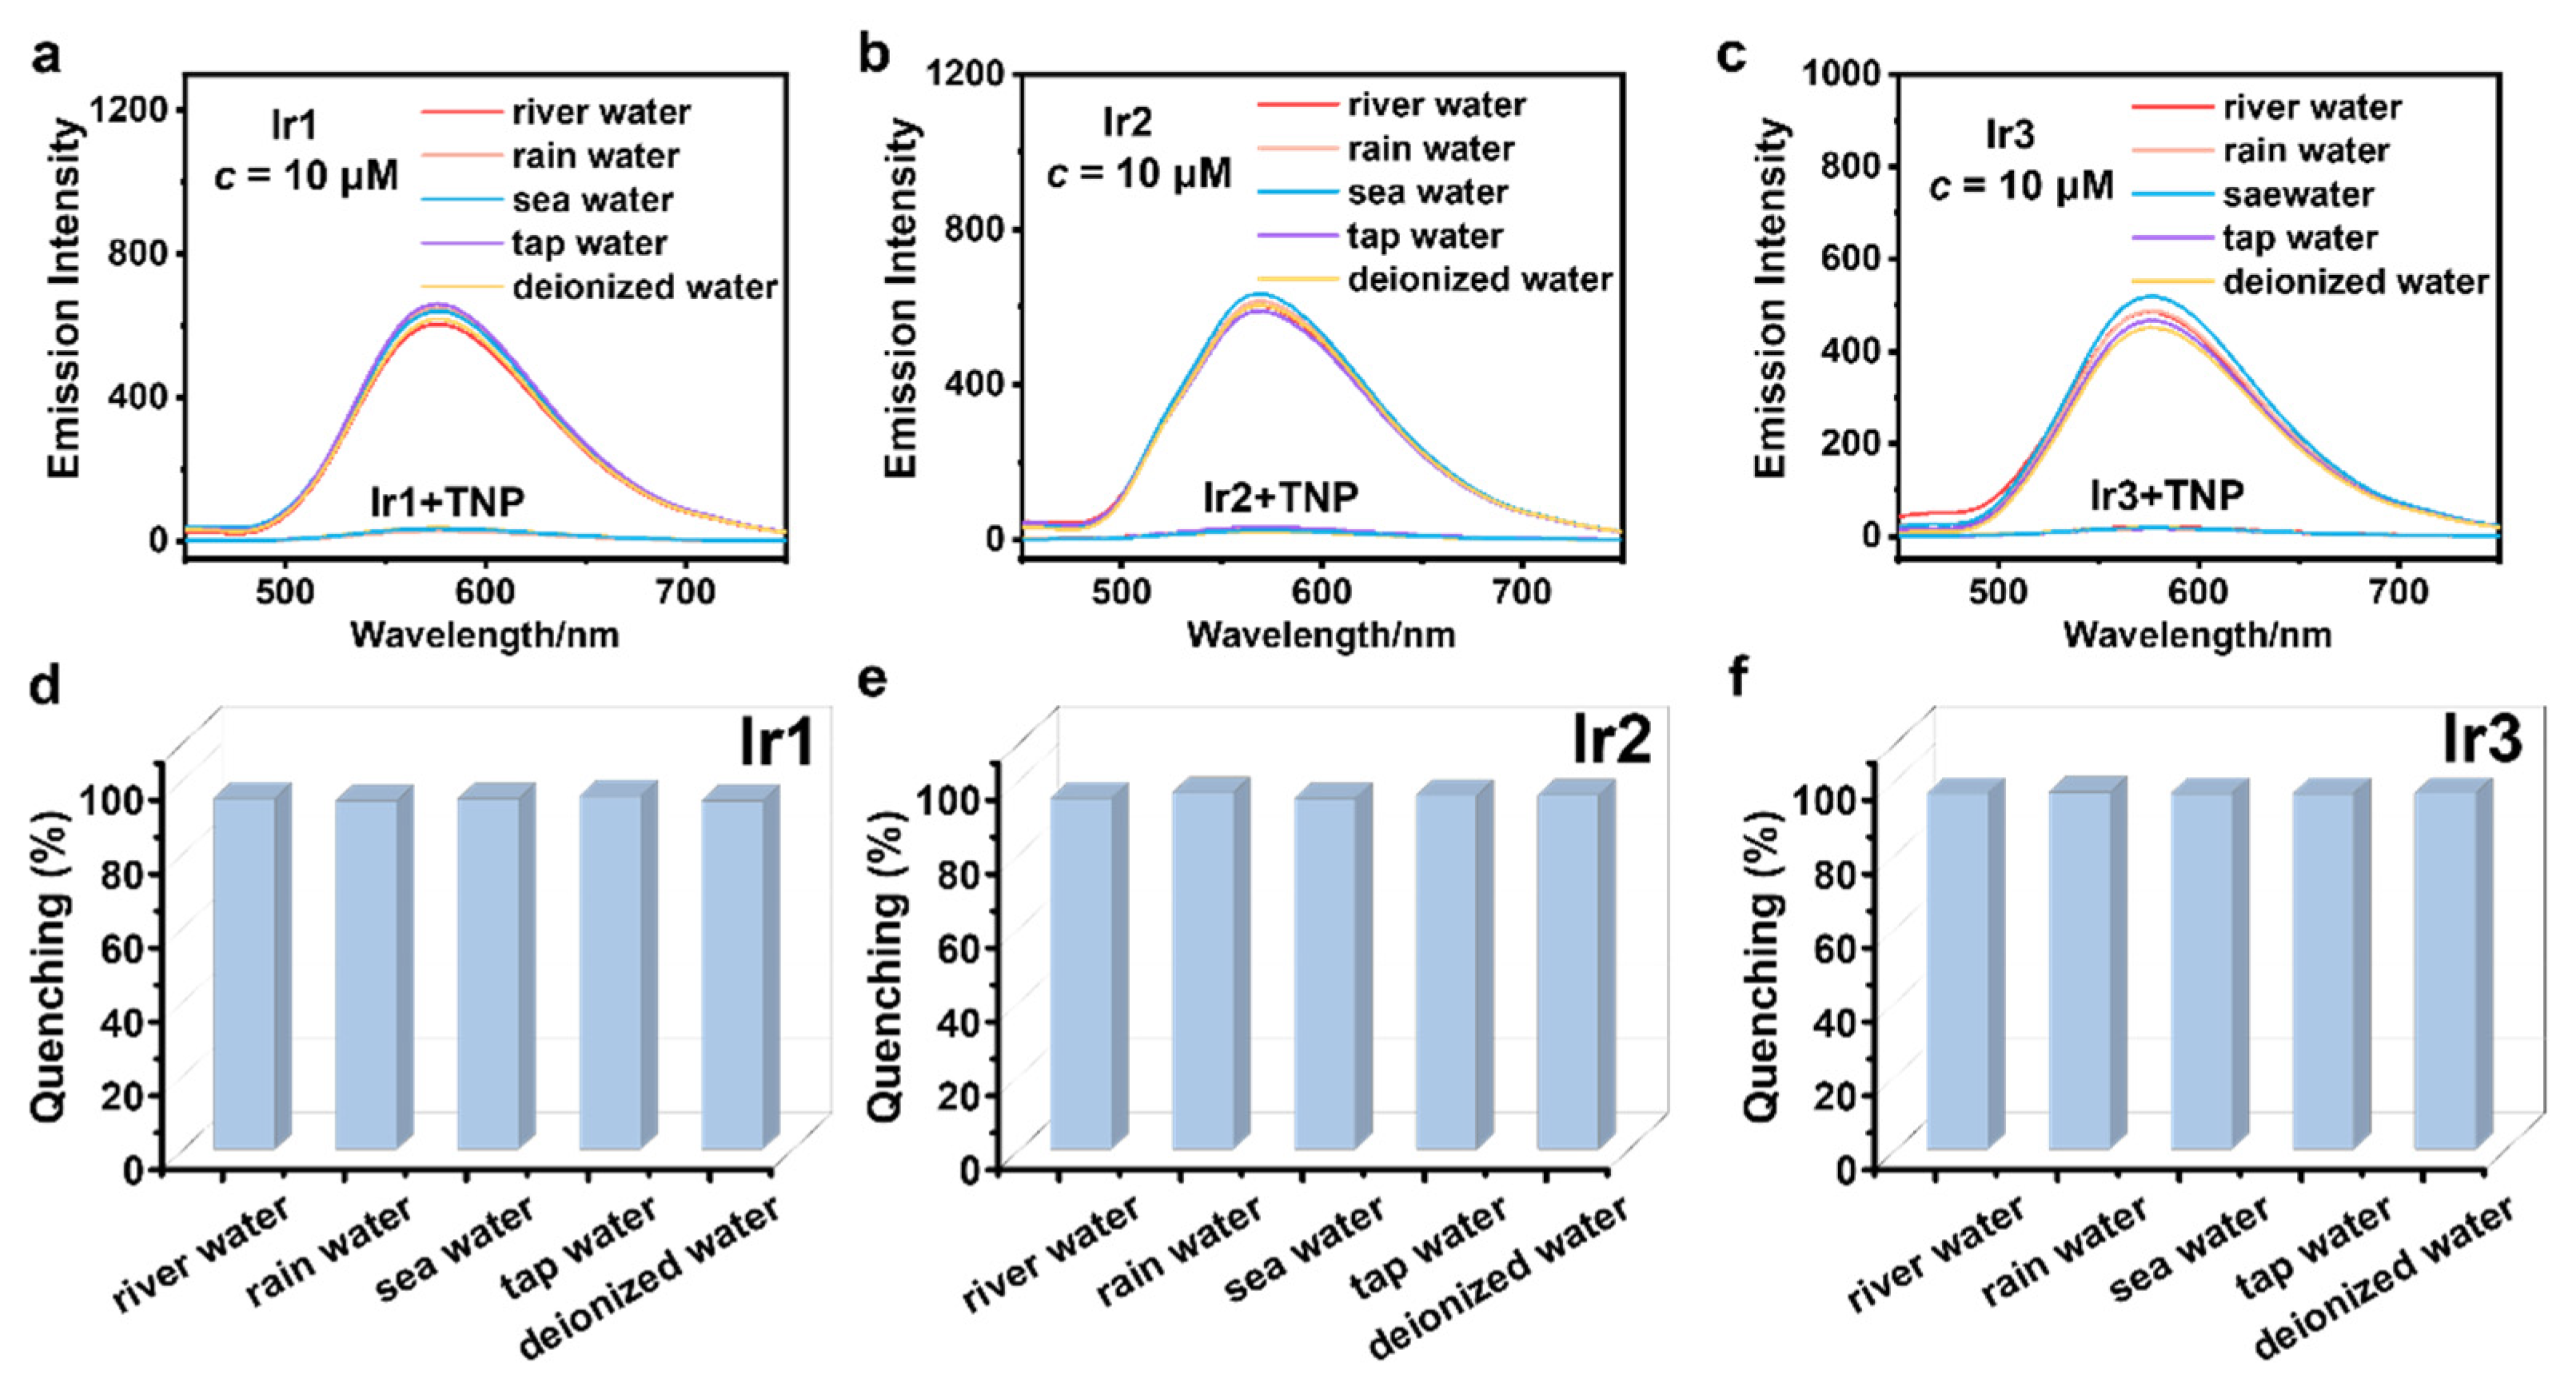
Figure 9.
(a) The UV-Vis absorption spectra of Ir1 upon the addition of TNP with different concentrations; (b) The changes in luminescence lifetime of Ir1 upon the addition of TNP with different concentrations; (c) The normalized UV-Vis absorption spectrum of TNP (red line) and the normalized emission spectrum of Ir1 (blue line).
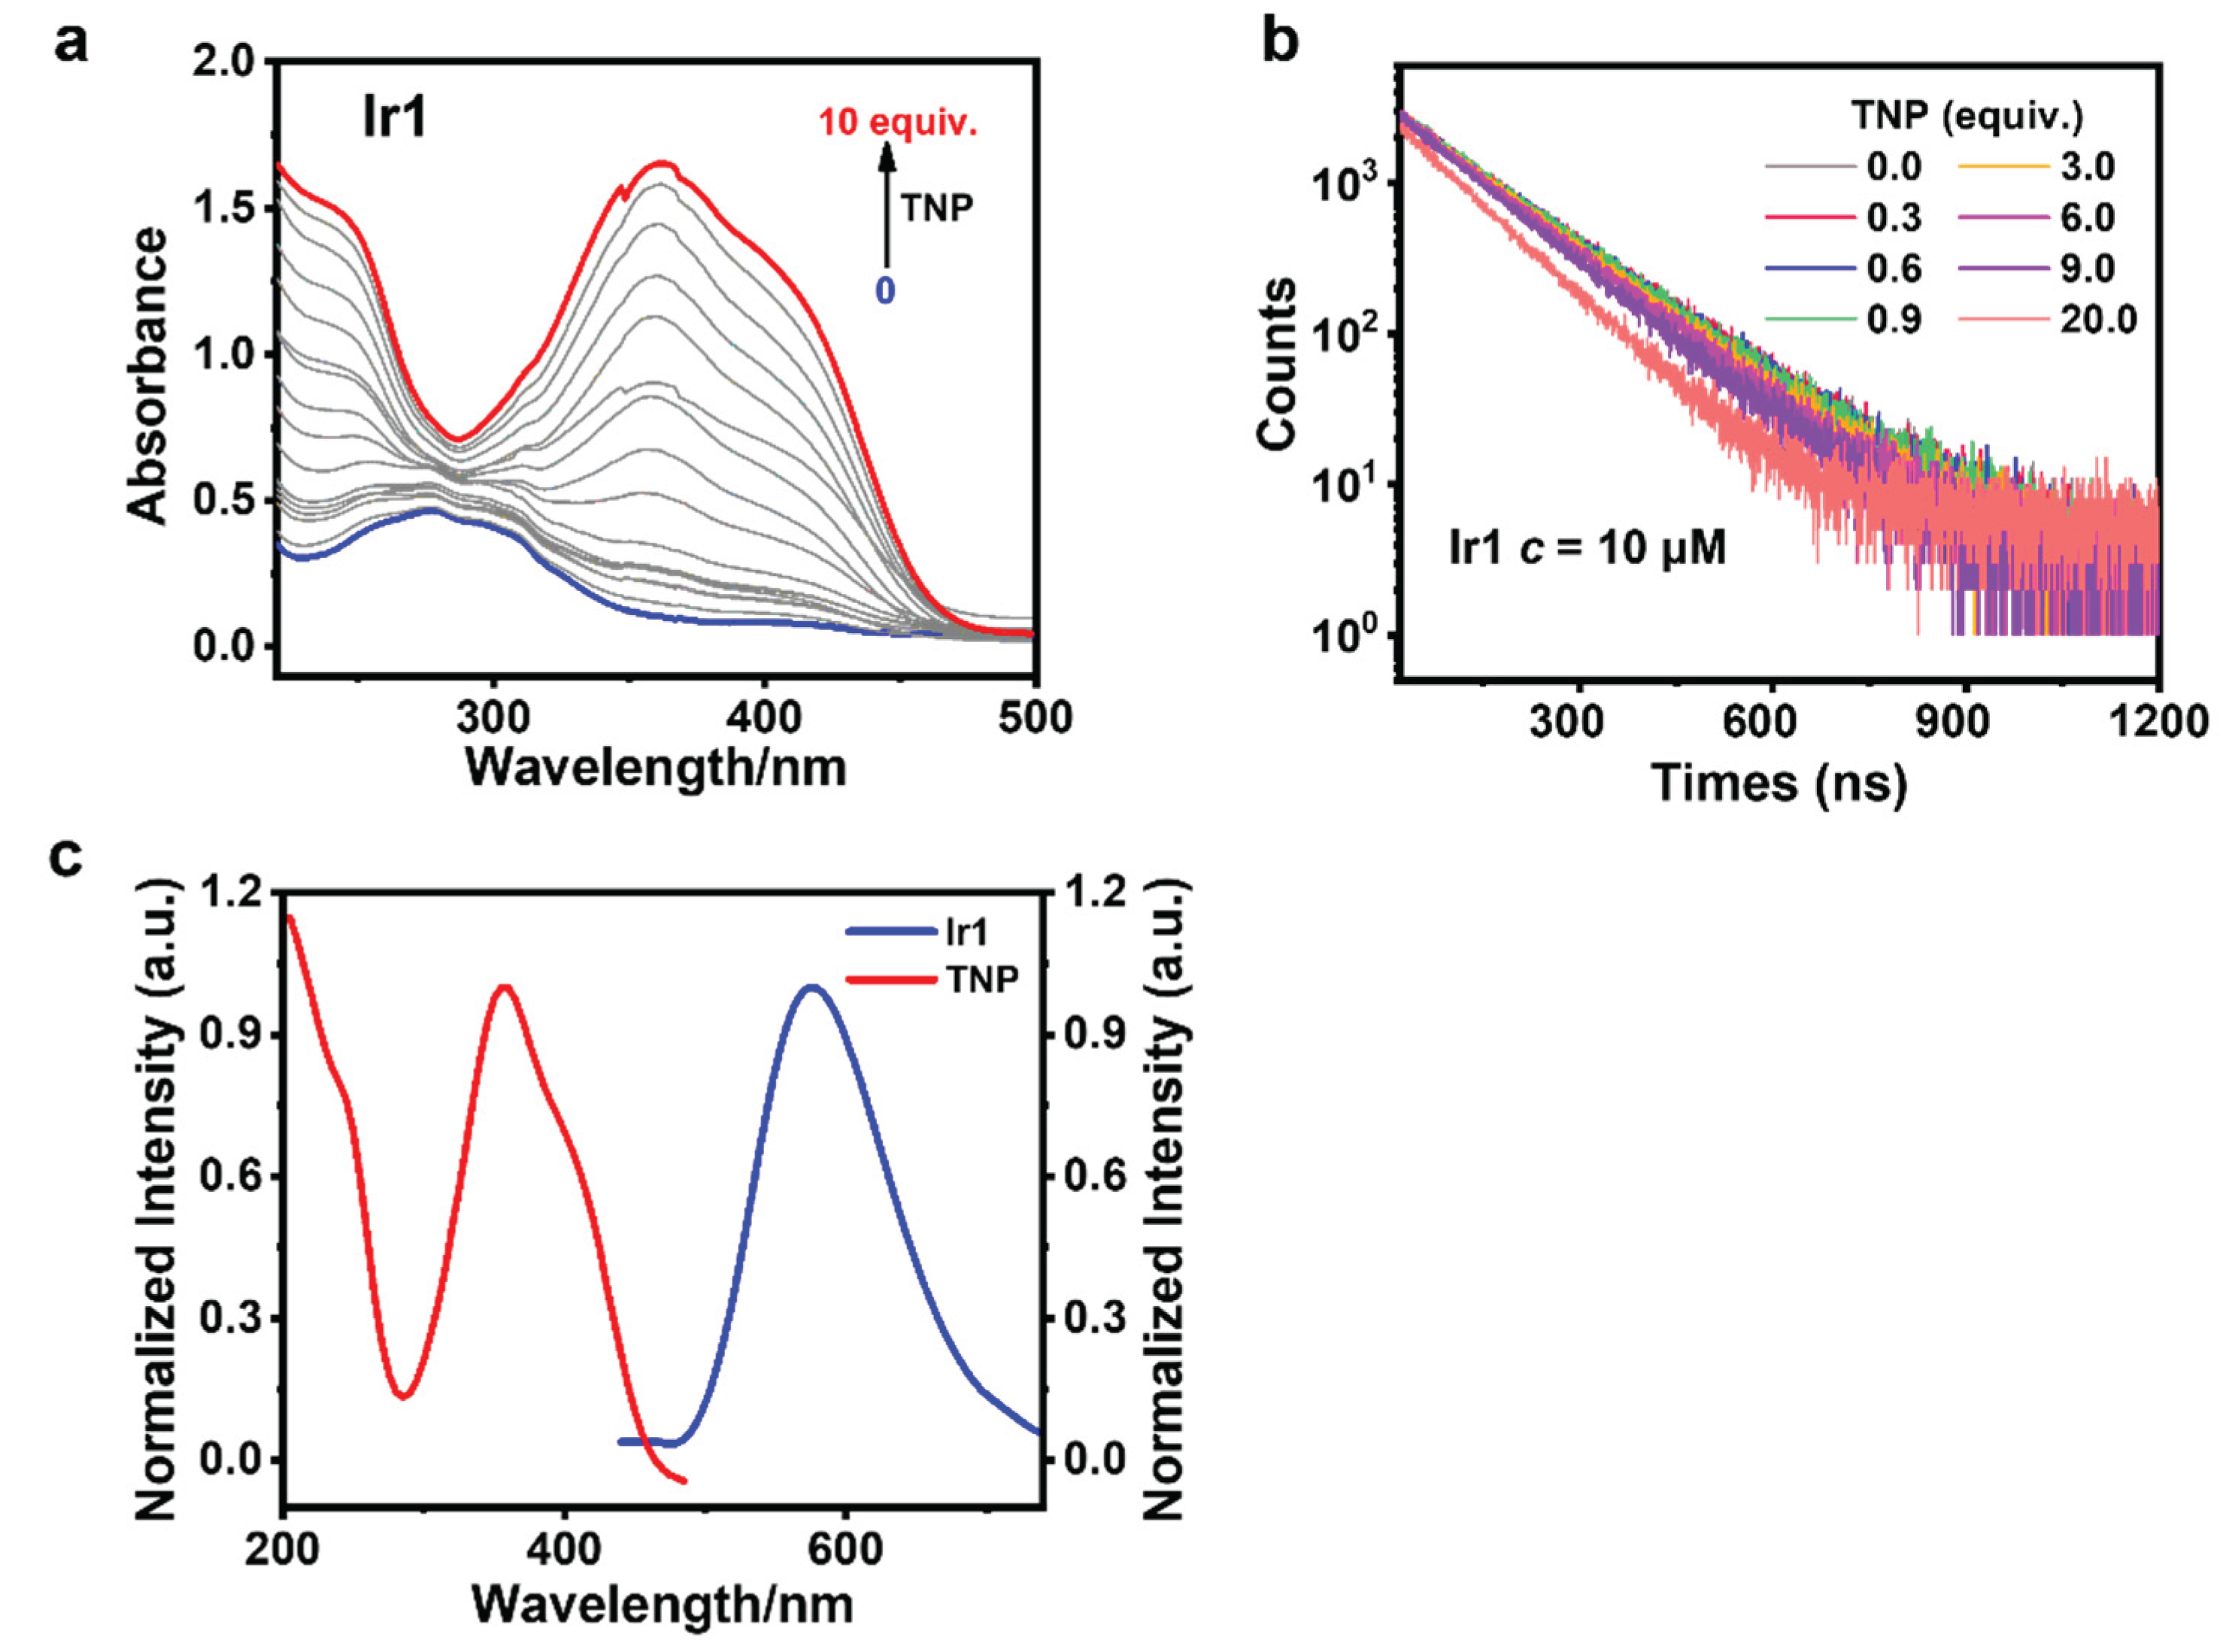

Table 1.
The standard deviations and emission intensities of Ir1-Ir3 at 574 nm, 573 nm, and 578 nm, respectively (Ir1: fw = 60%, Ir2: fw = 70%, Ir3: fw = 70%, excitation wavelength: 400 nm c = 10 μM).
Table 1.
The standard deviations and emission intensities of Ir1-Ir3 at 574 nm, 573 nm, and 578 nm, respectively (Ir1: fw = 60%, Ir2: fw = 70%, Ir3: fw = 70%, excitation wavelength: 400 nm c = 10 μM).
| Complexes | Ir1 | Ir2 | Ir3 |
| λ/nm | 574 | 573 | 578 |
| X1 | 452.1 | 473.1 | 477.0 |
| X2 | 452.4 | 473.5 | 476.6 |
| X3 | 452.4 | 474.6 | 476.7 |
| X4 | 451.9 | 473.6 | 476.4 |
| X5 | 451.2 | 474.4 | 476.8 |
| X6 | 451.4 | 473.9 | 476.7 |
| X7 | 451.3 | 473.4 | 477.0 |
| X8 | 451.2 | 473.2 | 477.6 |
| X9 | 452.1 | 473.9 | 477.5 |
| X10 | 451.9 | 474.0 | 477.4 |
| X11 | 452.3 | 473.5 | 477.8 |
| σ | 0.4558 | 0.4518 | 0.4400 |
Xi (i = 1, 2, 3...., 11) stands for the emission intensity of each sample, i stands for the number of the sample, and σ is the standard deviation.
Disclaimer/Publisher’s Note: The statements, opinions and data contained in all publications are solely those of the individual author(s) and contributor(s) and not of MDPI and/or the editor(s). MDPI and/or the editor(s) disclaim responsibility for any injury to people or property resulting from any ideas, methods, instructions or products referred to in the content. |
© 2025 by the authors. Licensee MDPI, Basel, Switzerland. This article is an open access article distributed under the terms and conditions of the Creative Commons Attribution (CC BY) license (http://creativecommons.org/licenses/by/4.0/).
Copyright: This open access article is published under a Creative Commons CC BY 4.0 license, which permit the free download, distribution, and reuse, provided that the author and preprint are cited in any reuse.


