Preprint
Article

This version is not peer-reviewed.

Effect of the Position of a Phenyl Group on the Luminescent and TNP-Sensing Properties of Cationic Iridium(III) Complexes

A peer-reviewed article of this preprint also exists.

Submitted:

19 December 2024

Posted:

19 December 2024

You are already at the latest version

Abstract

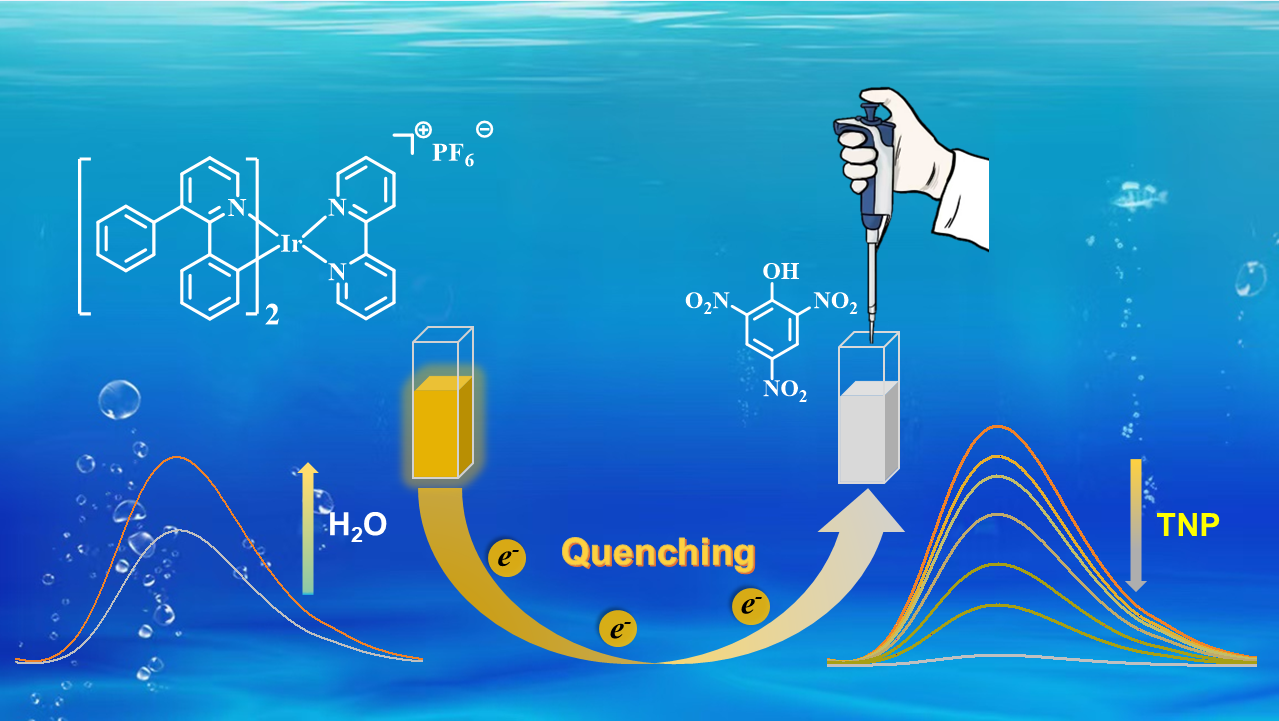
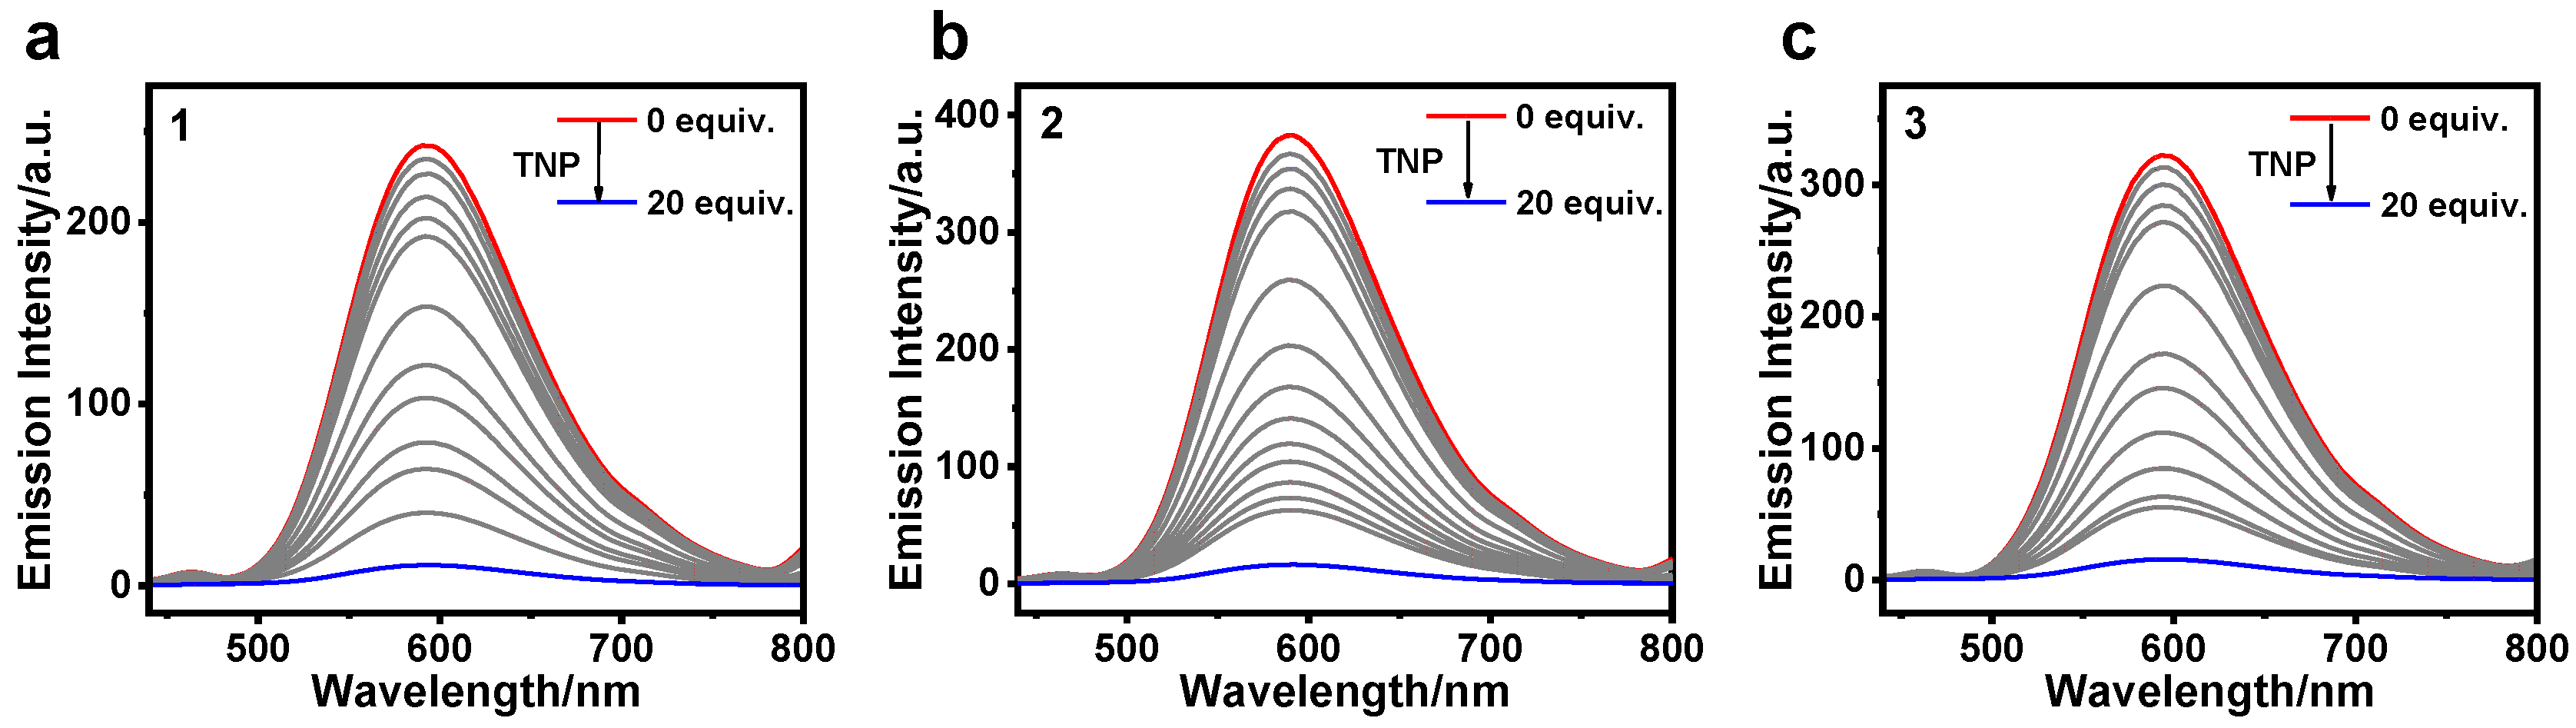
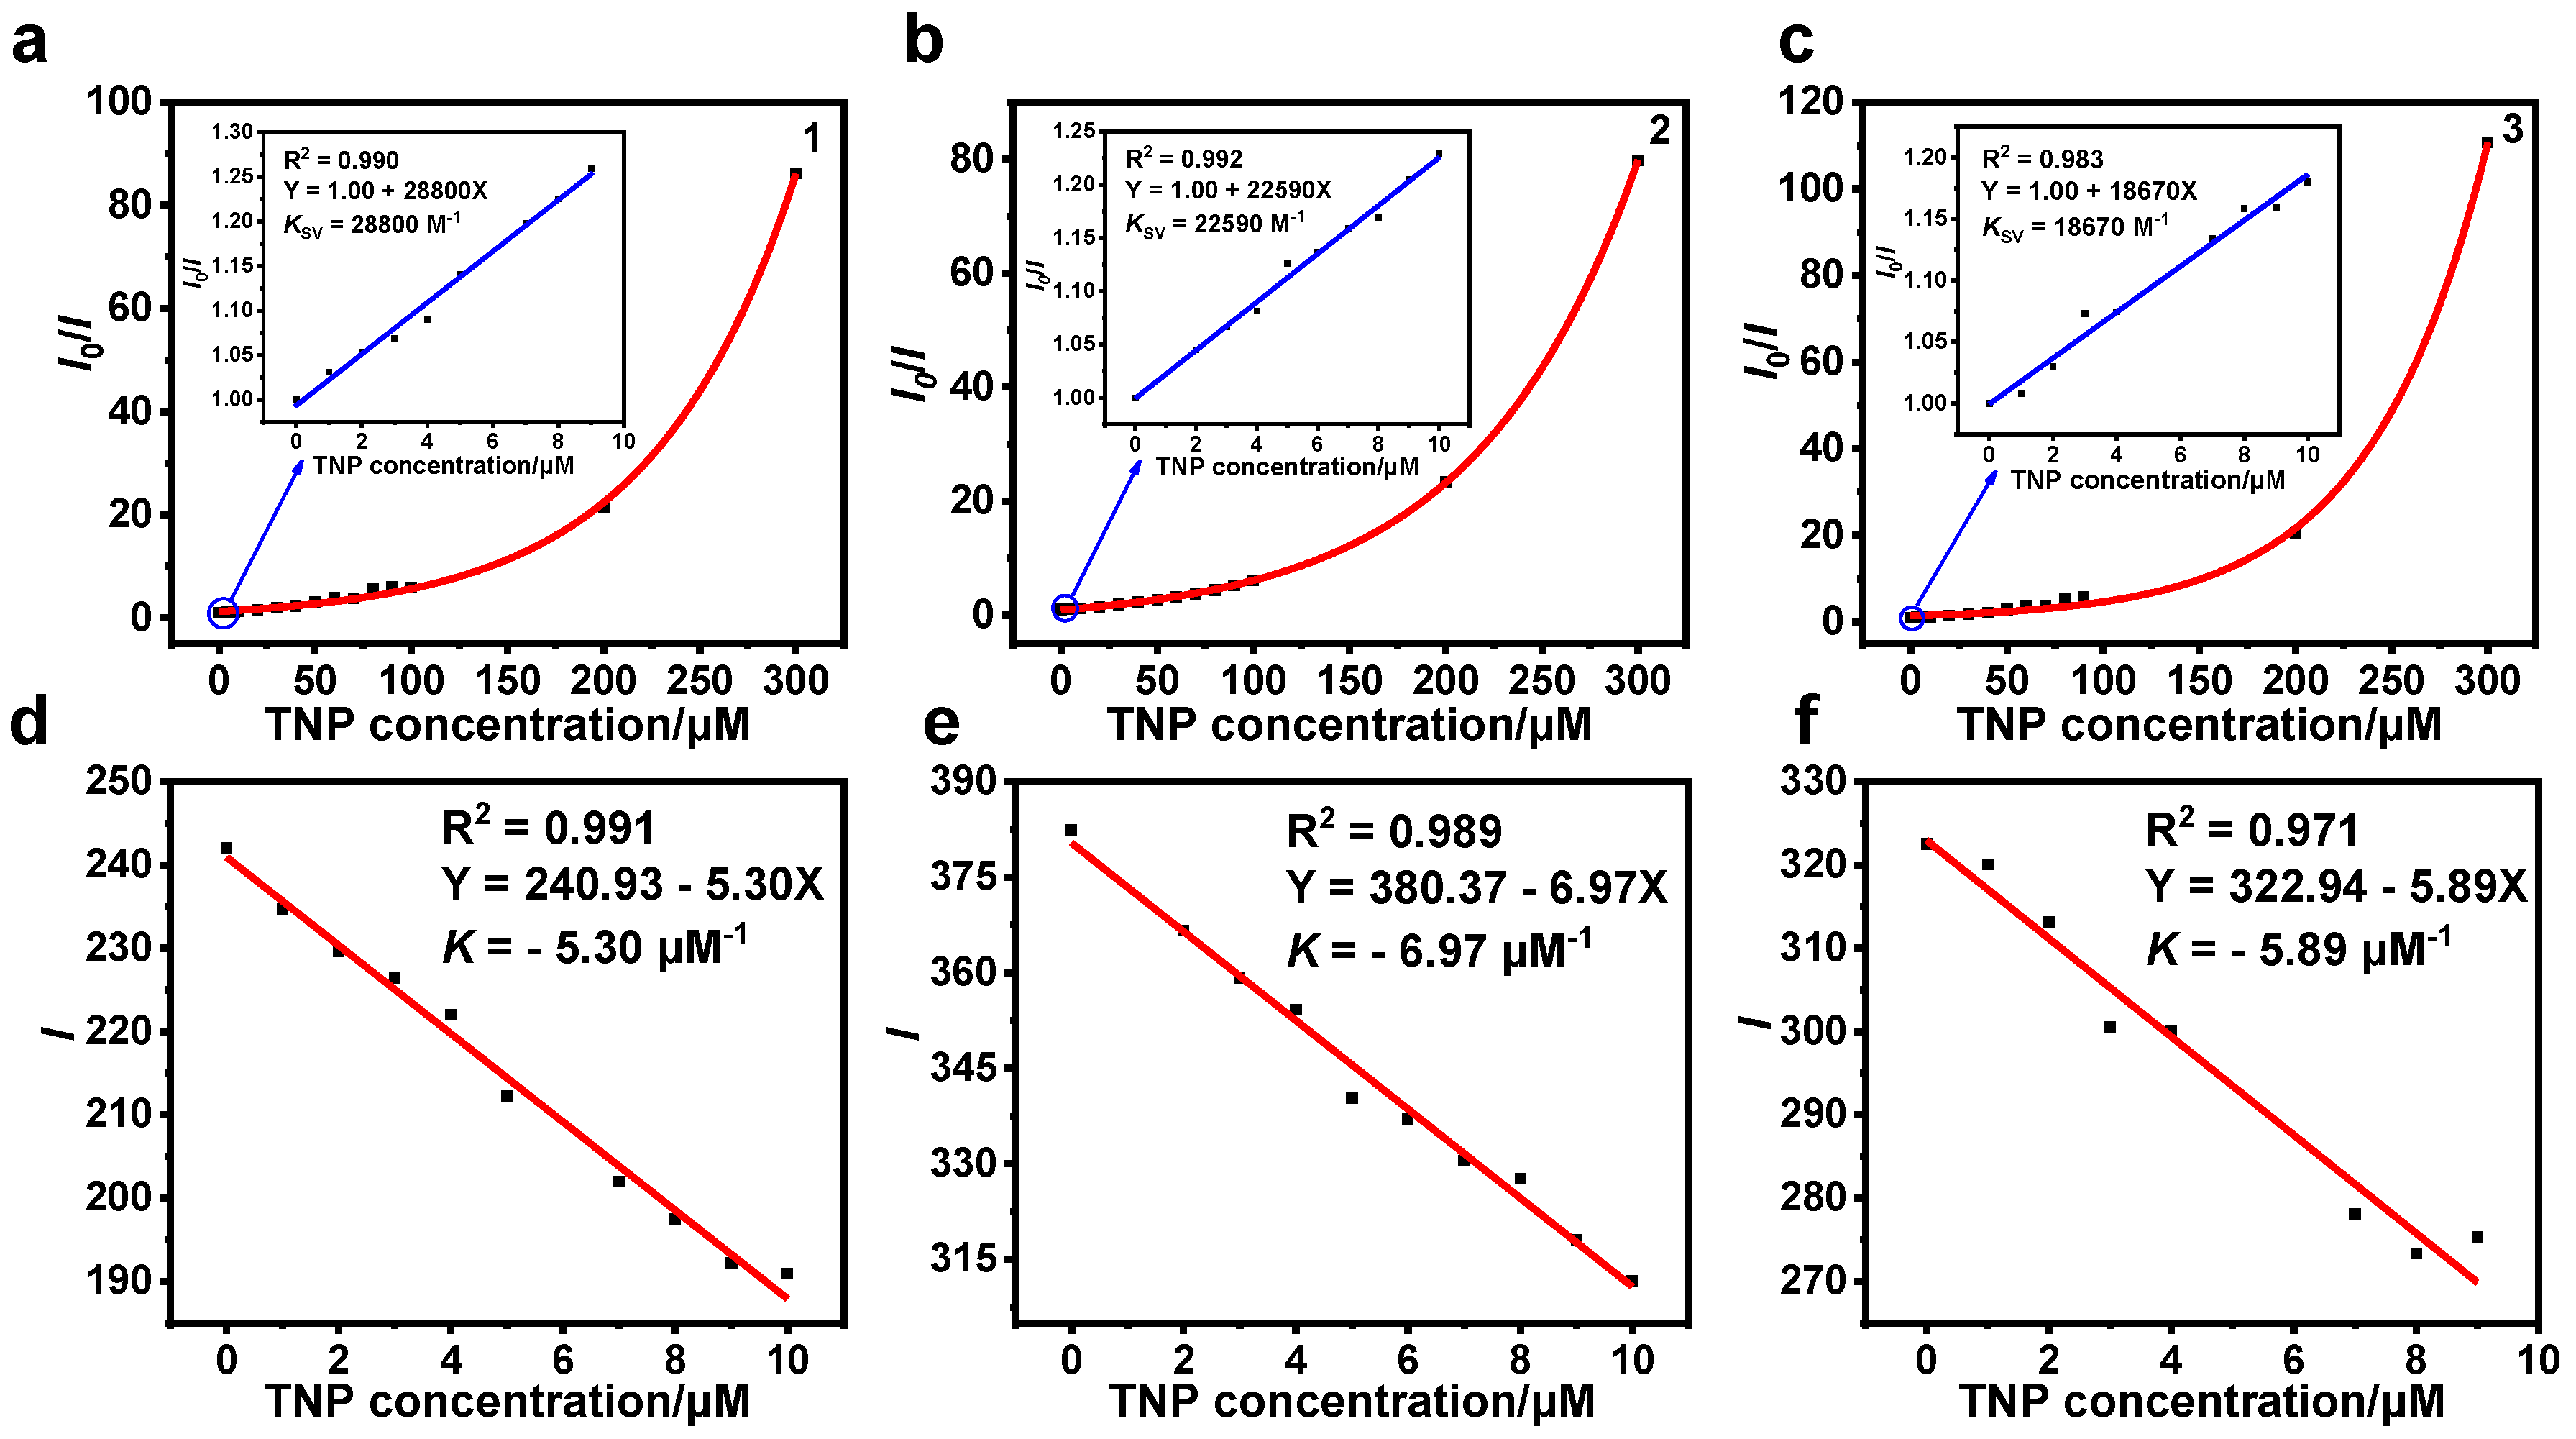
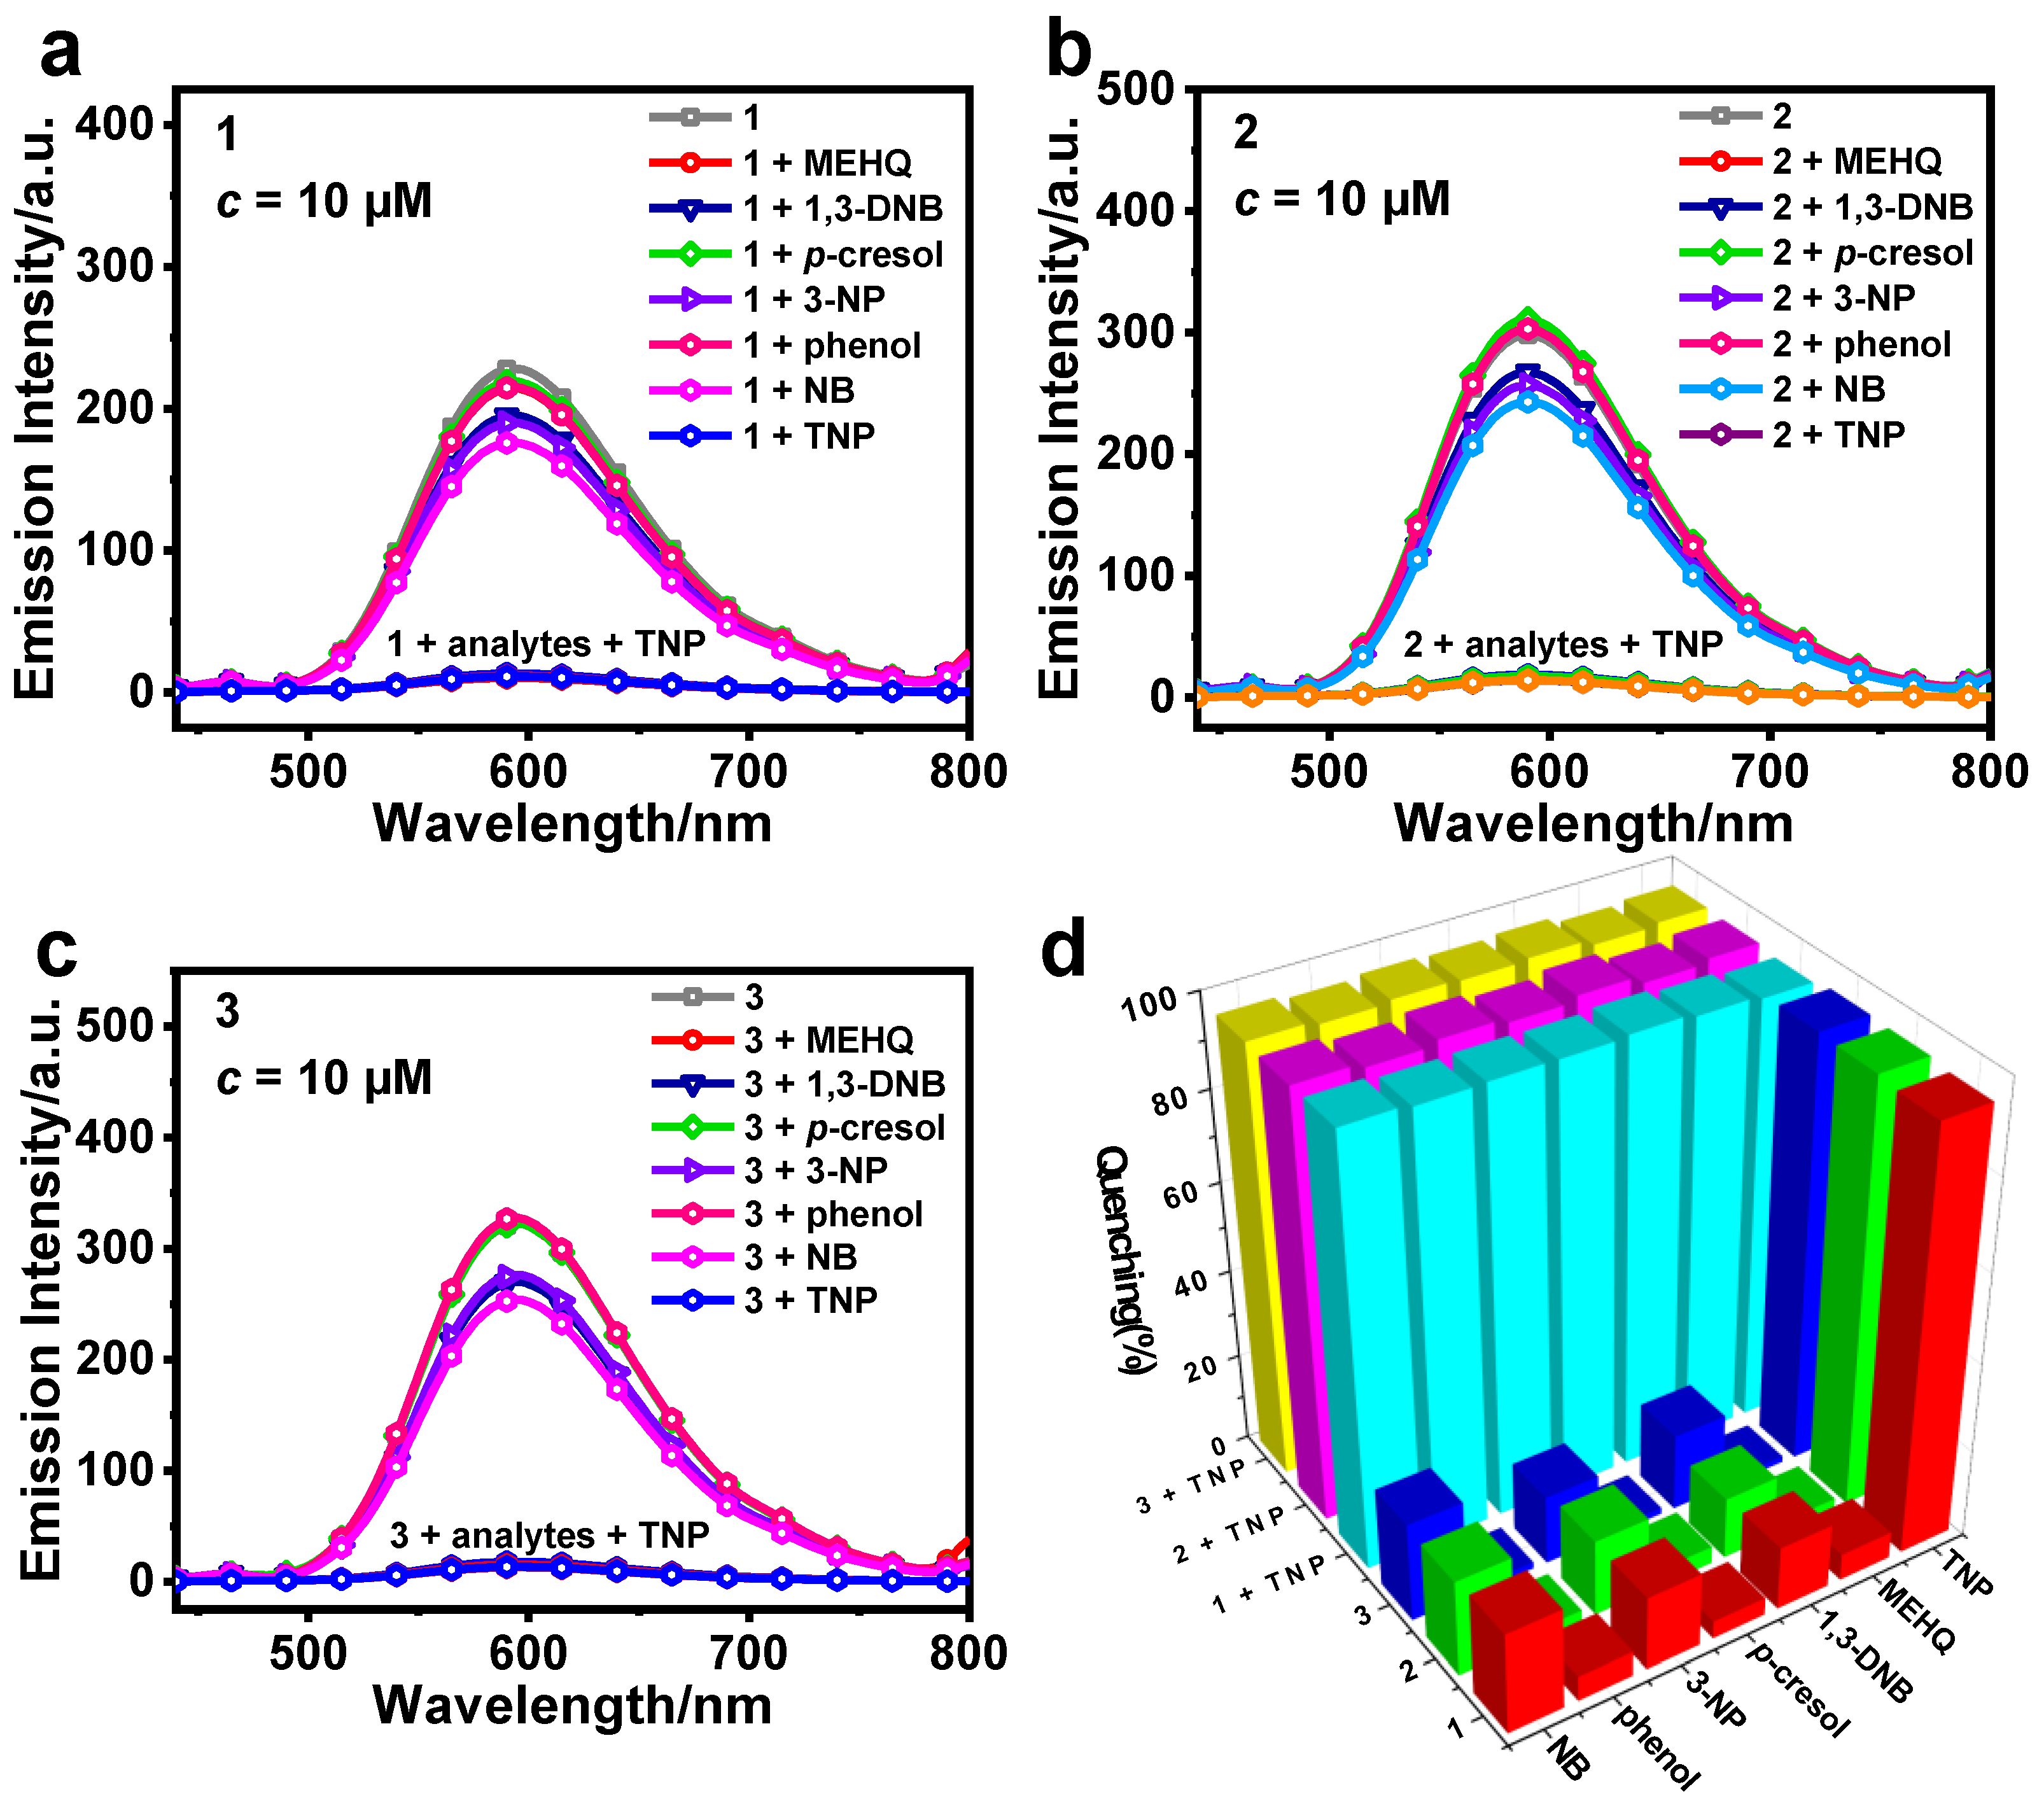
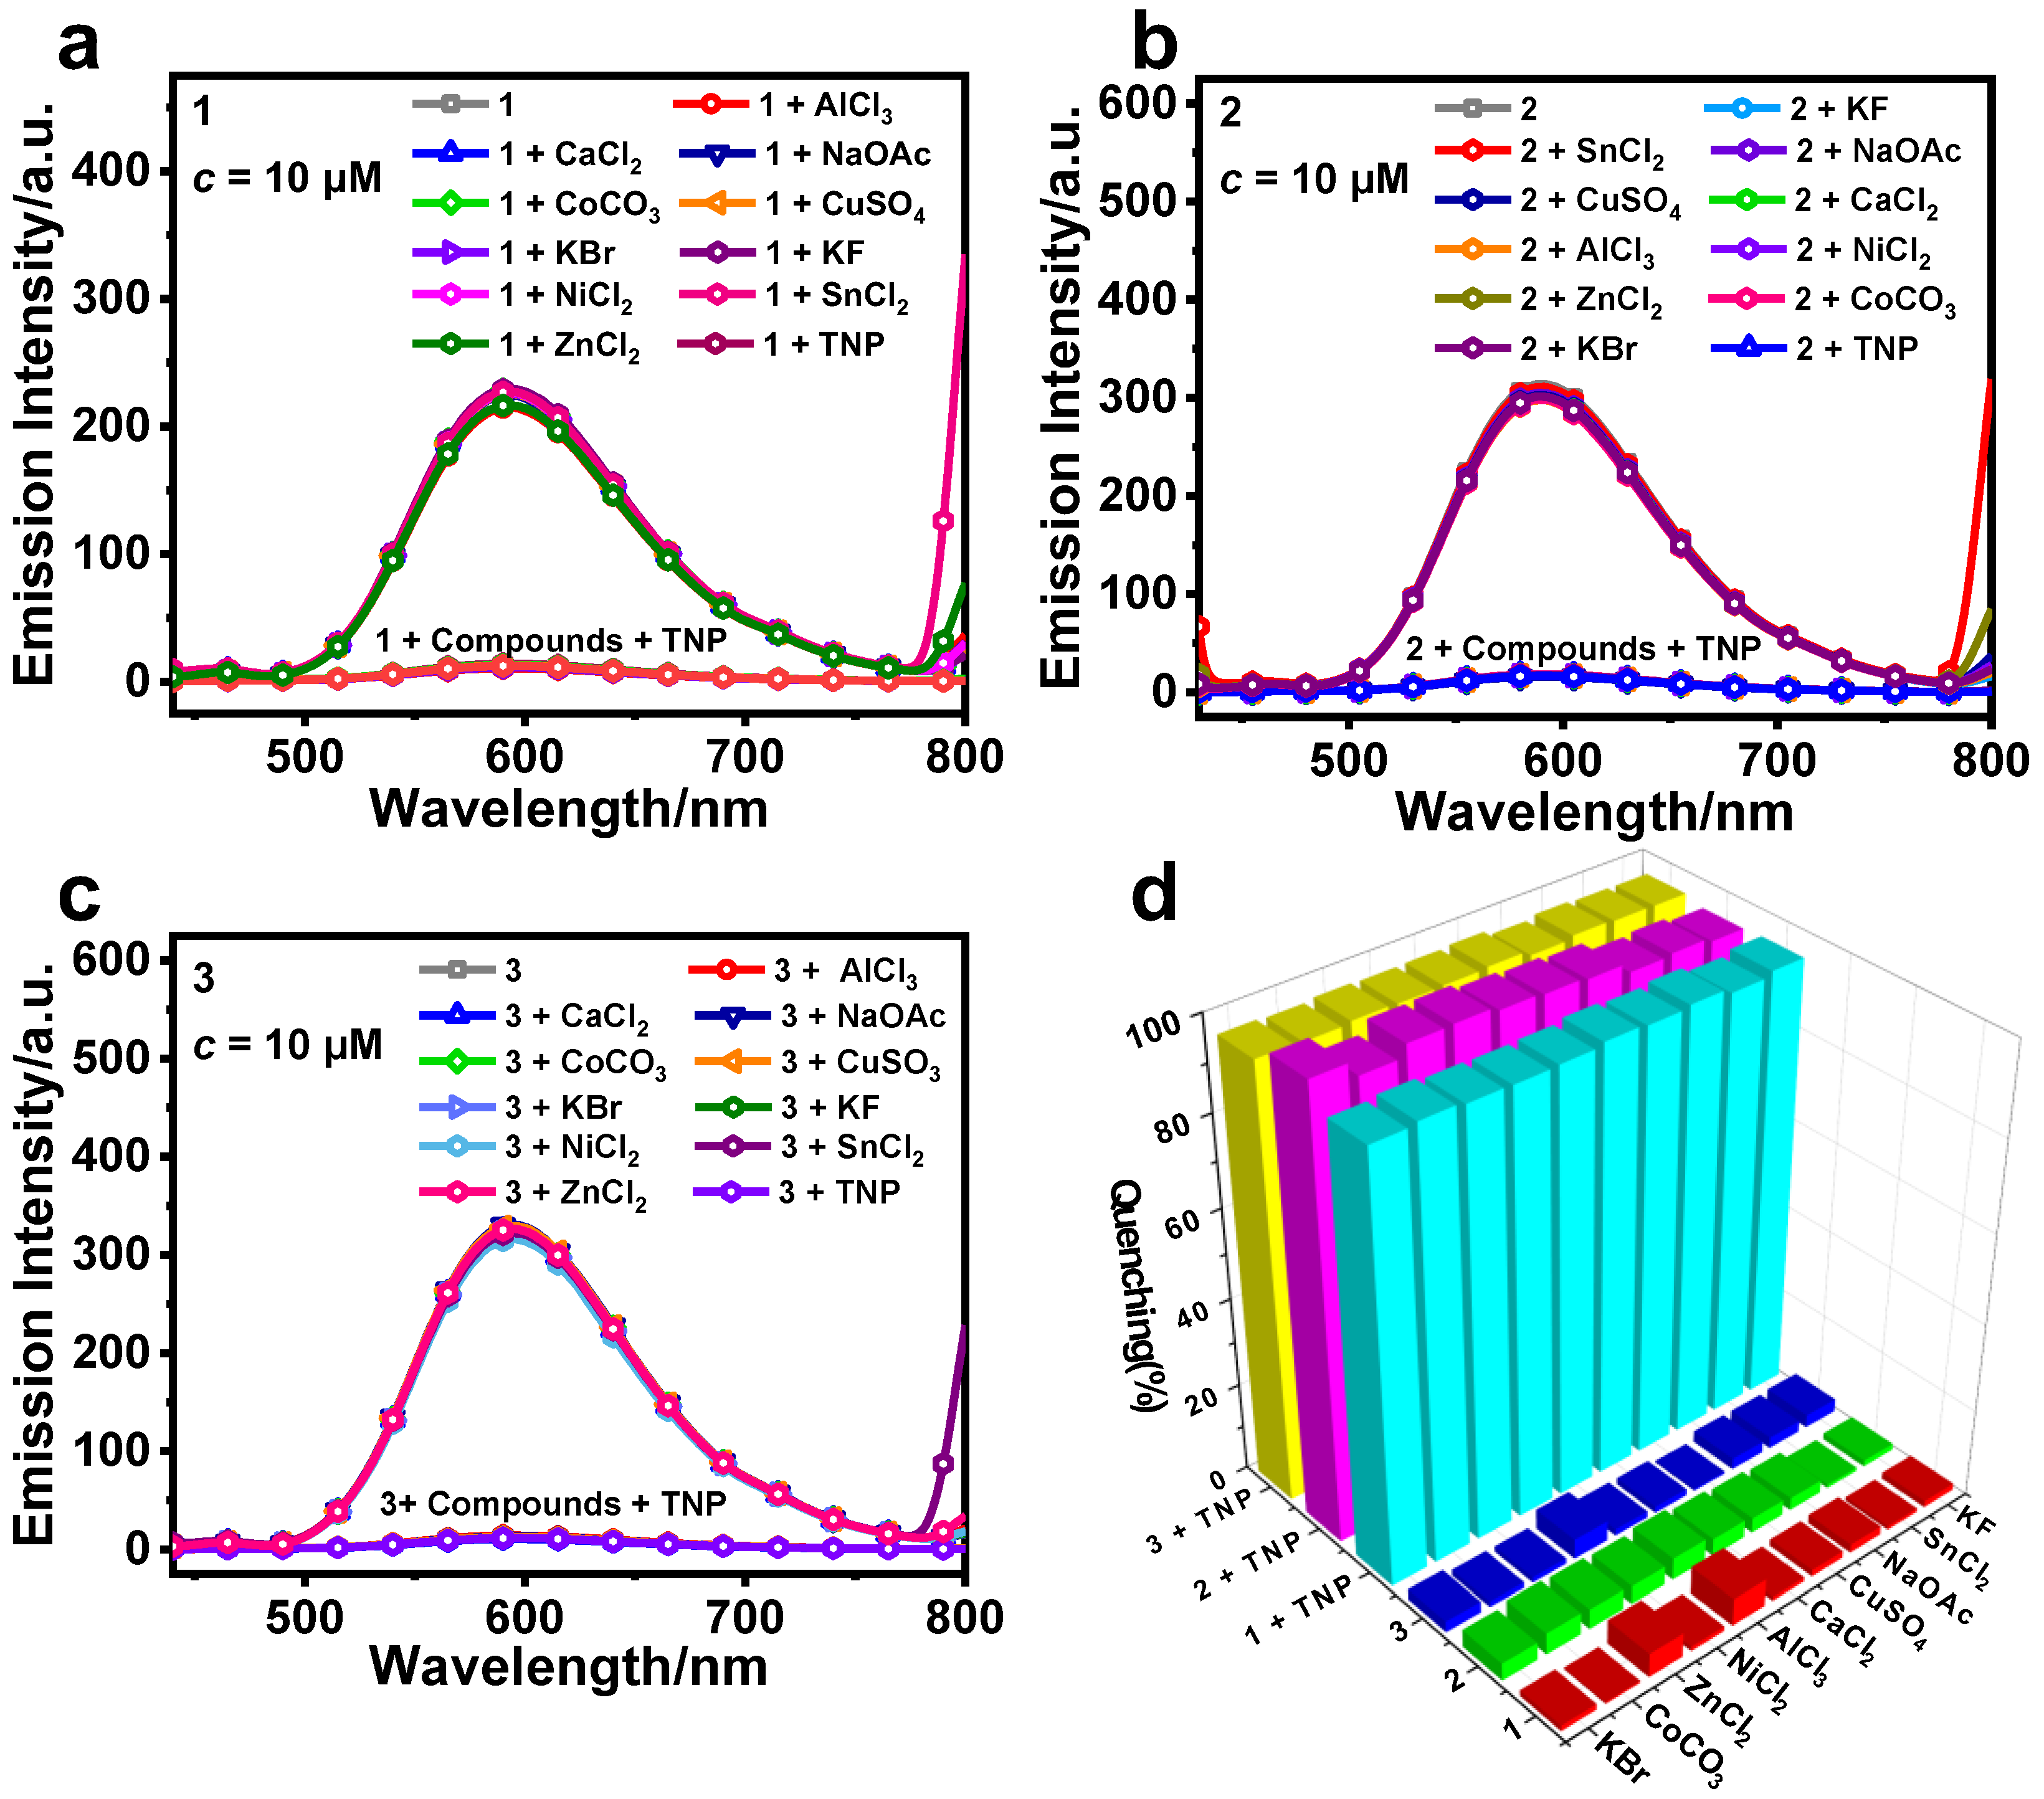
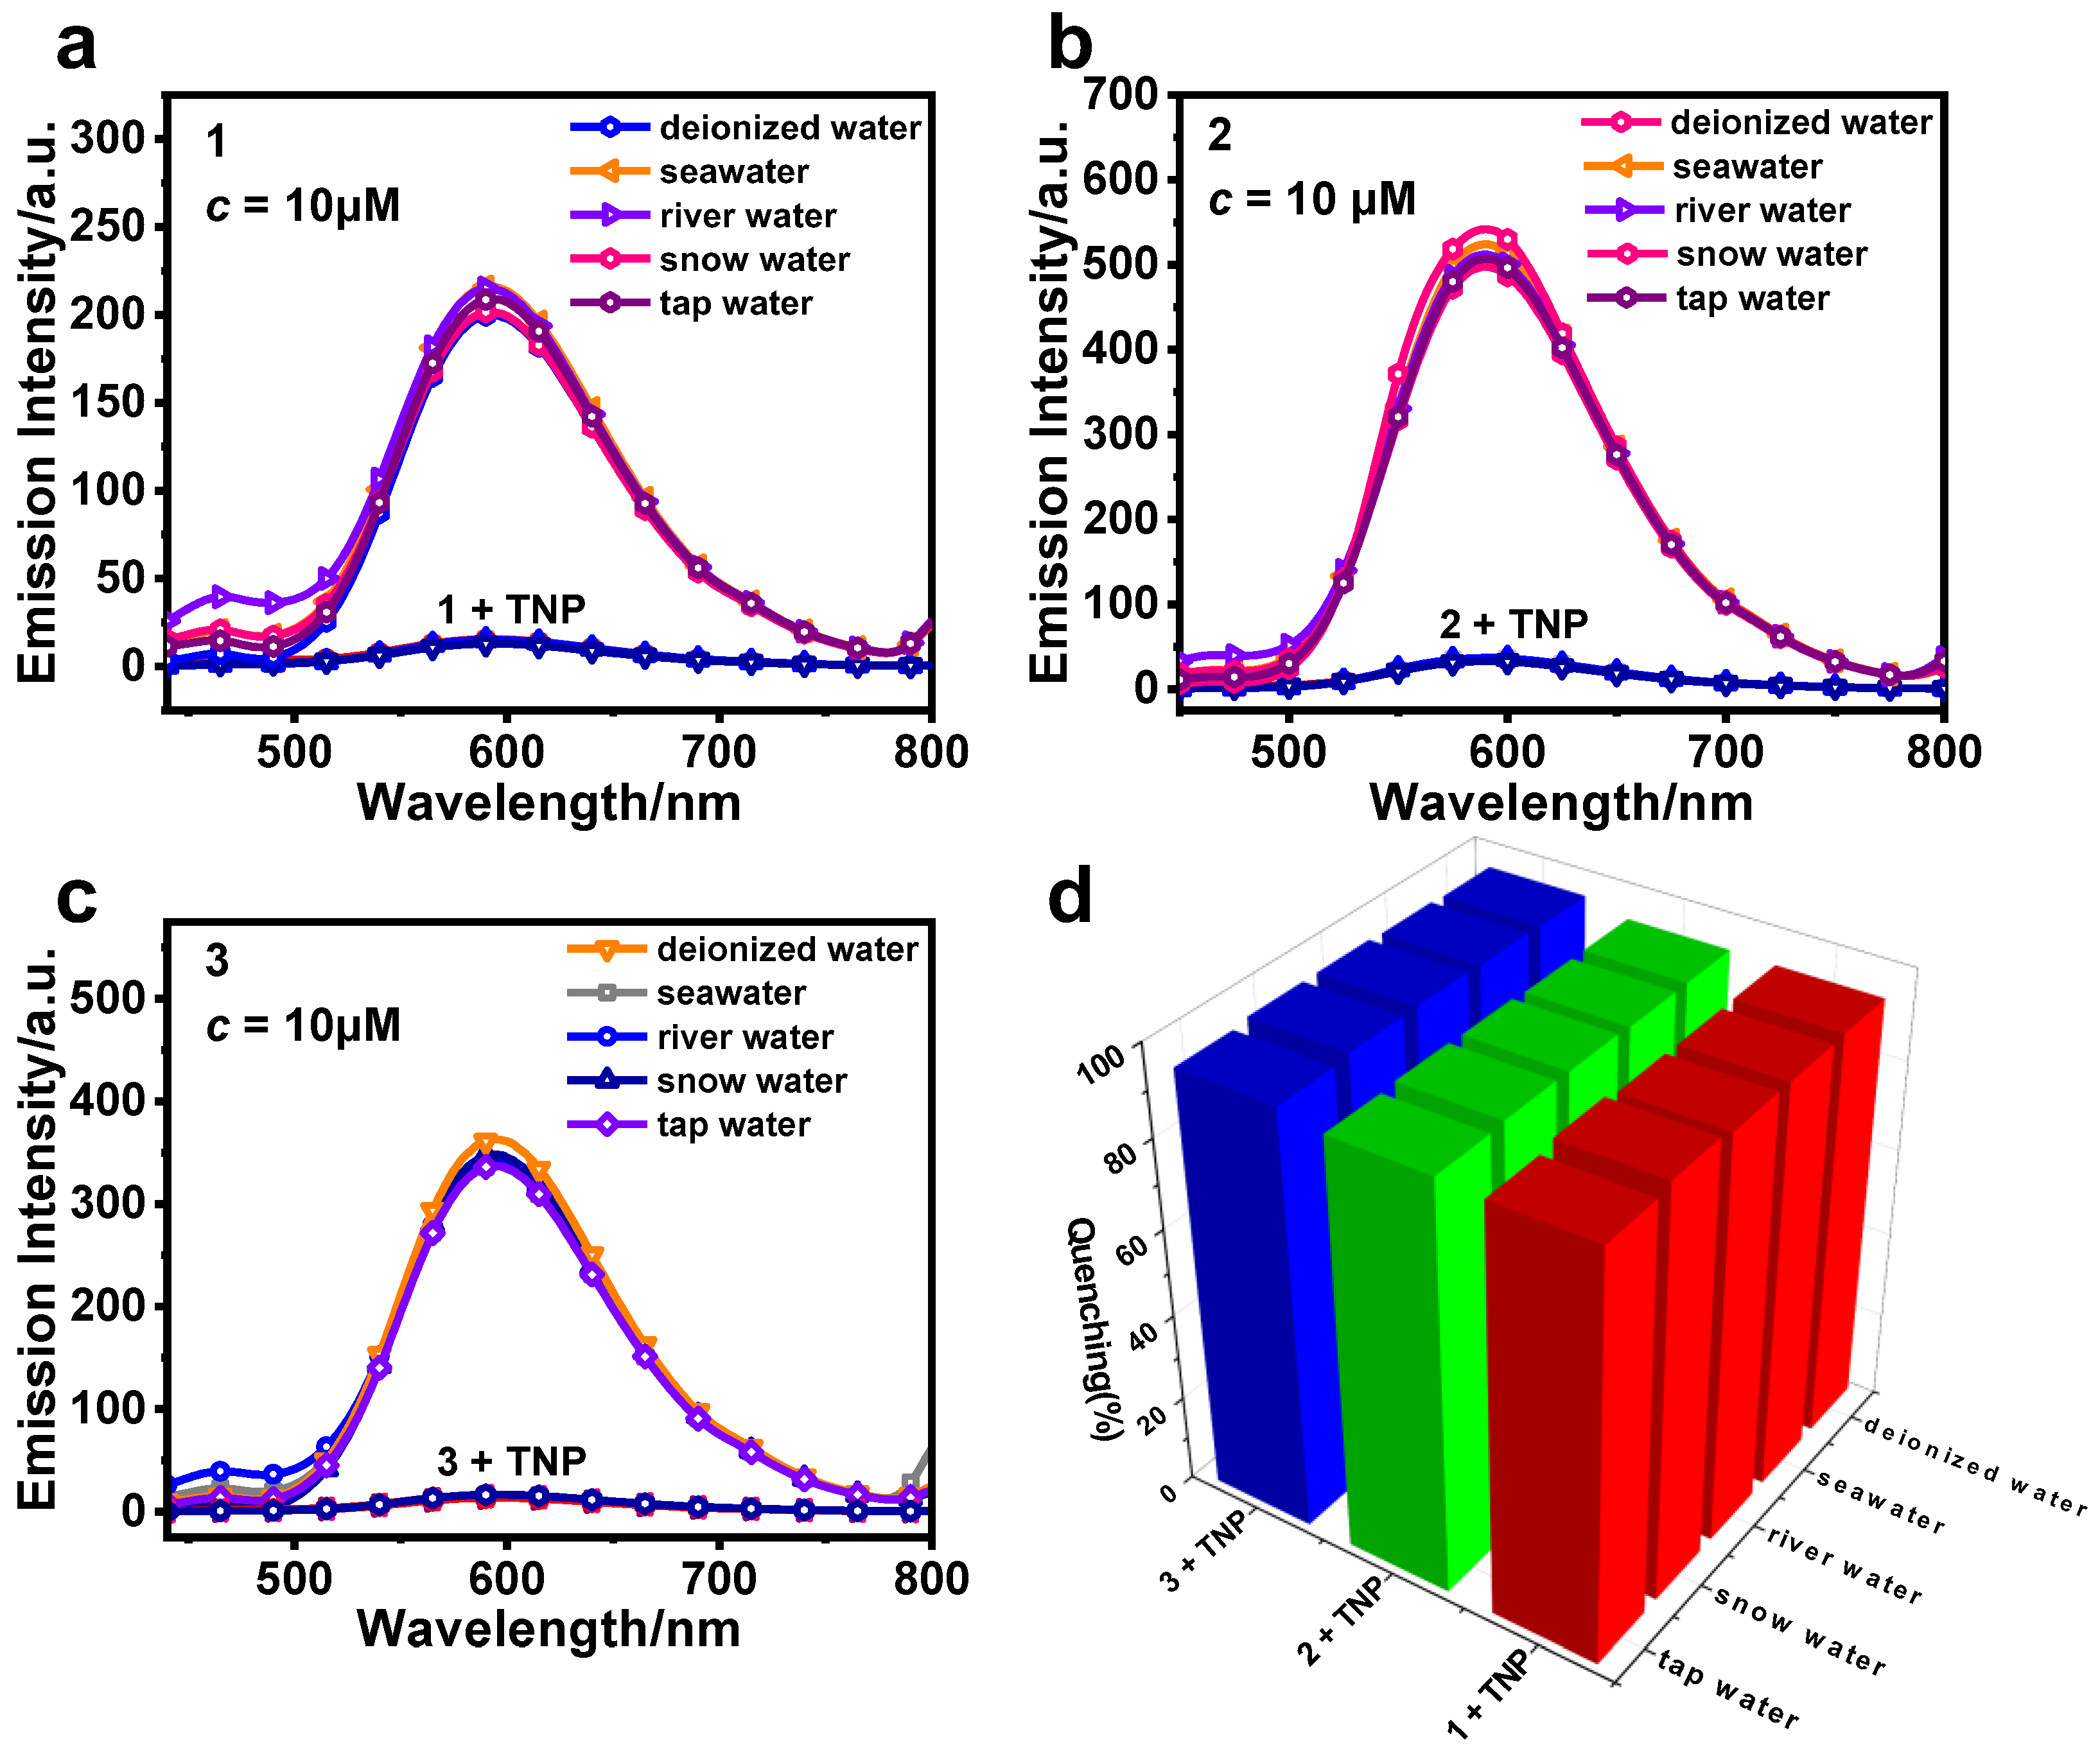
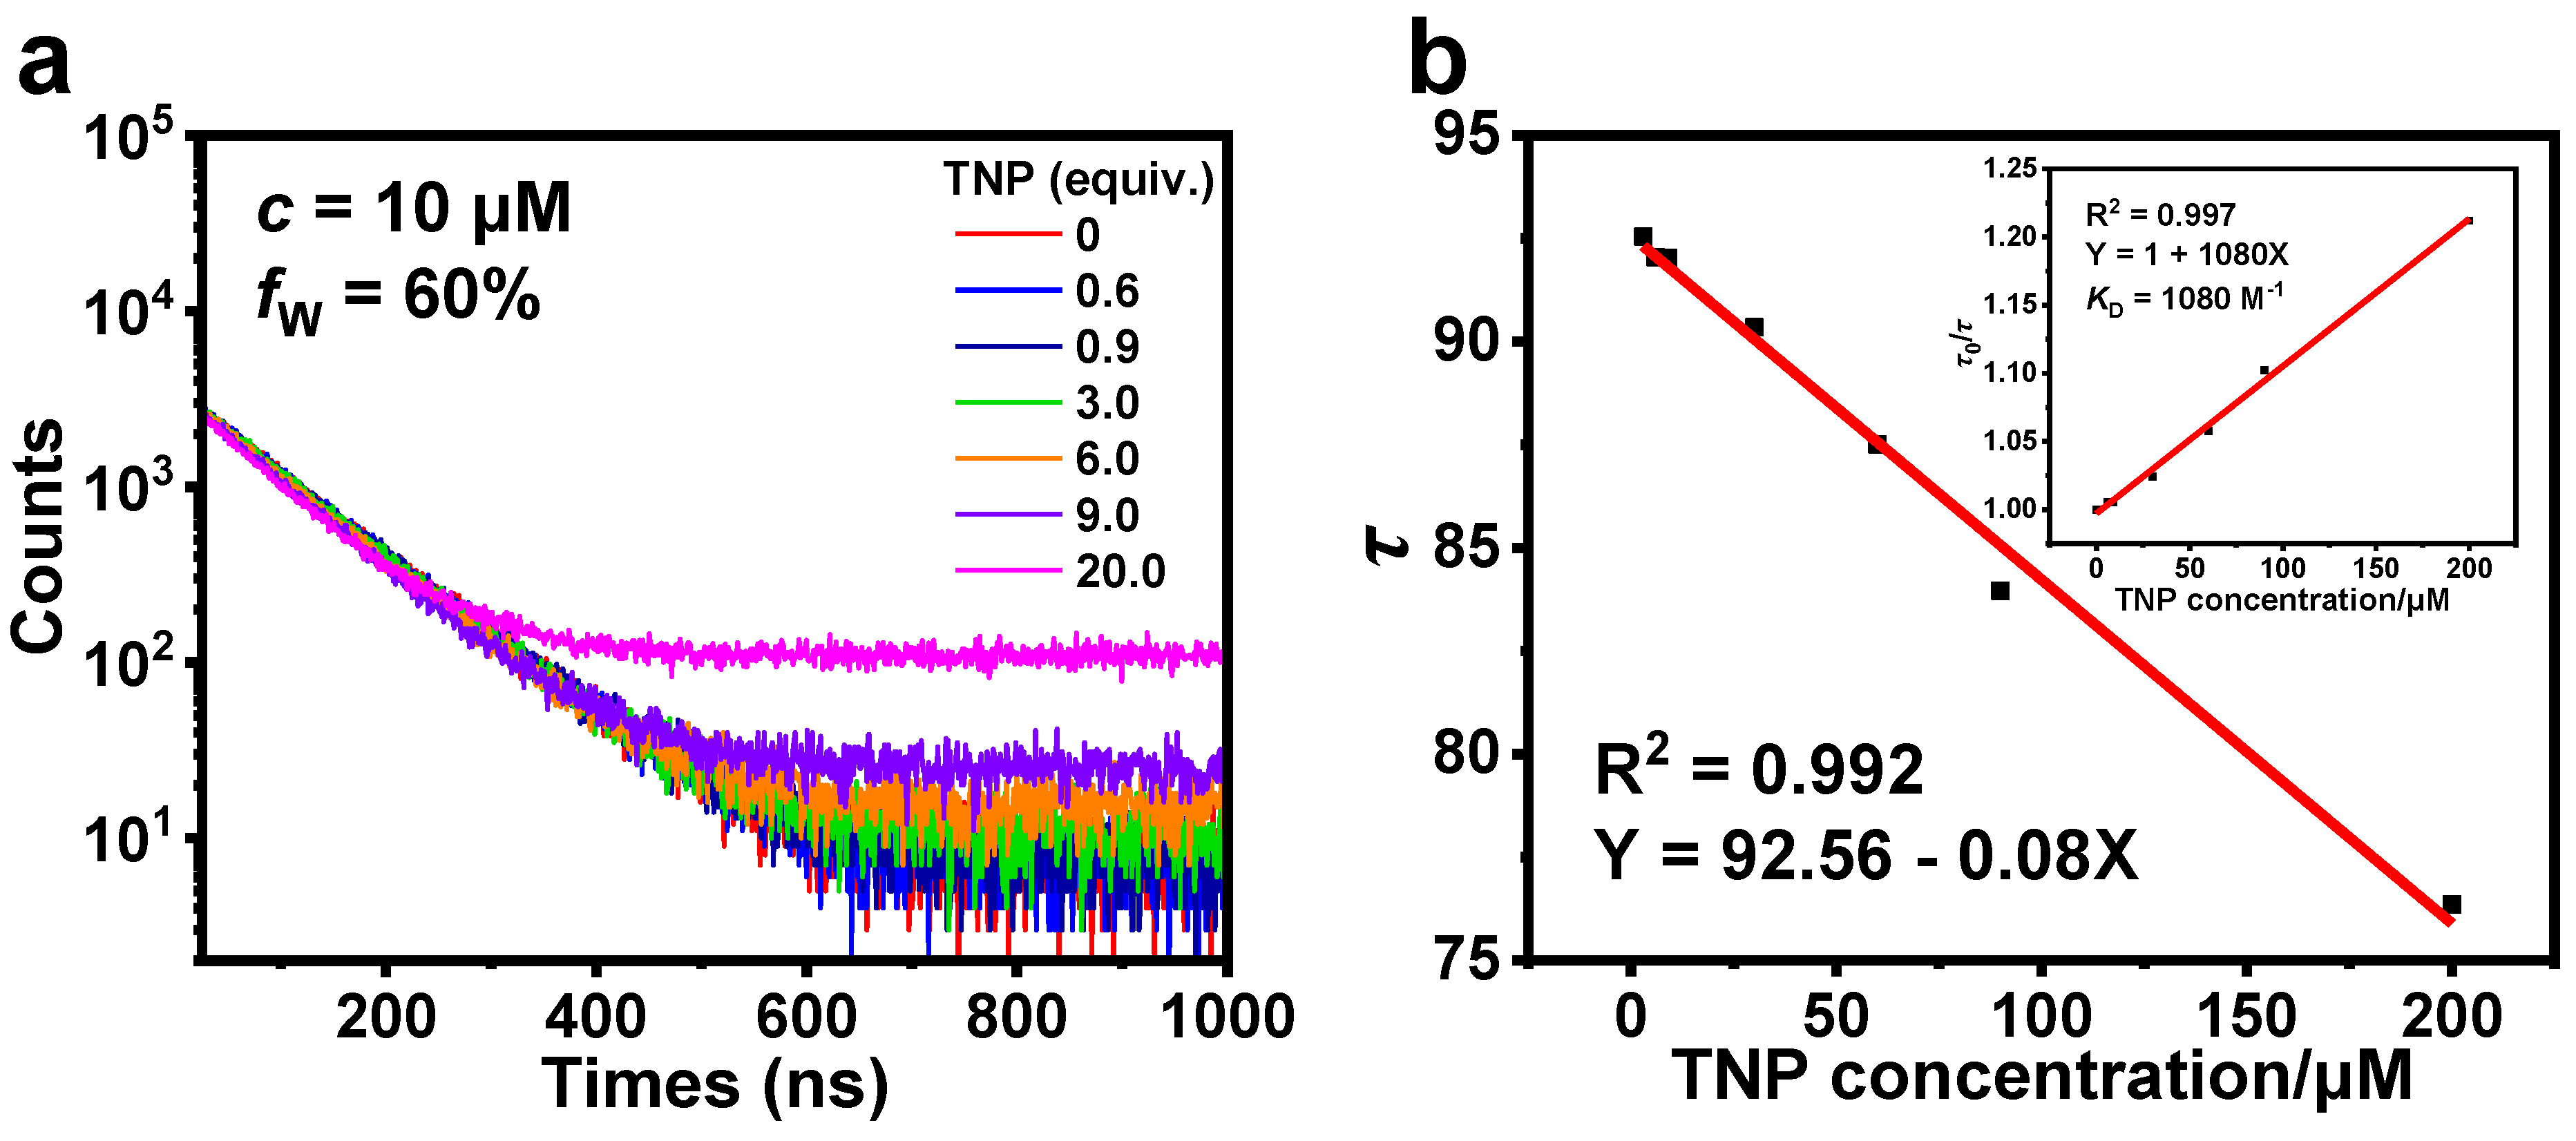
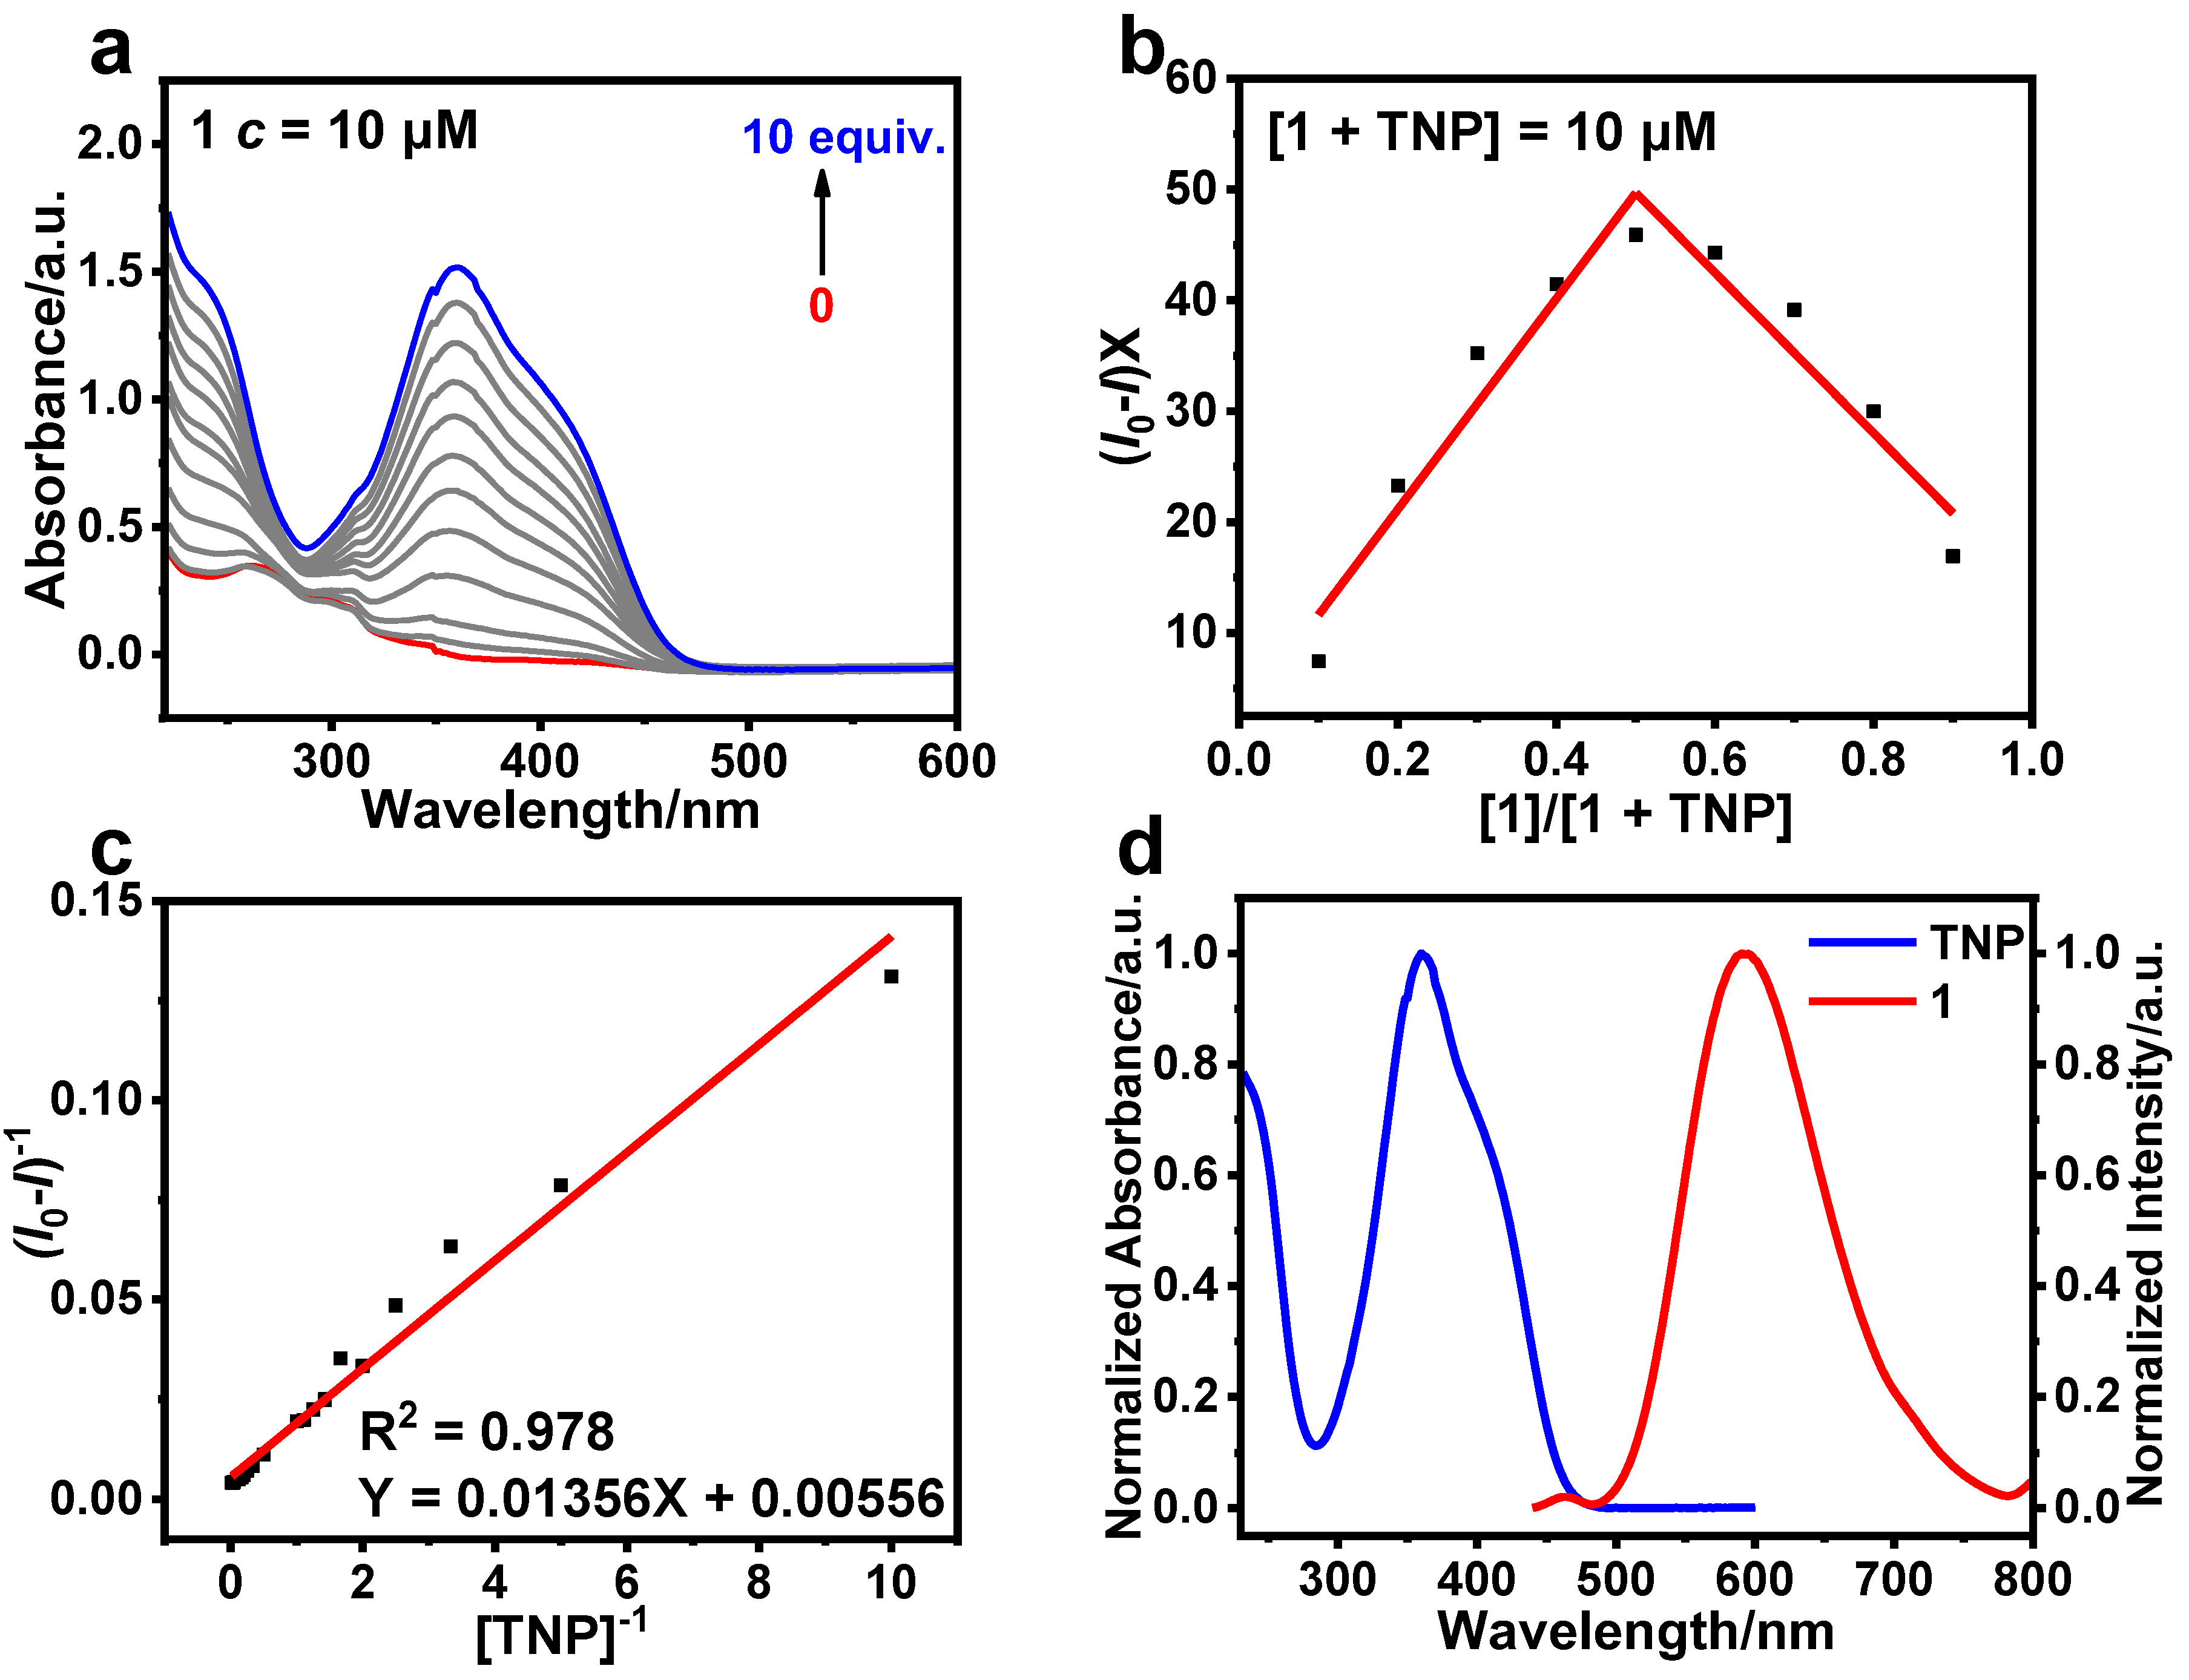
Three cationic Ir(III) complexes 1, 2, and 3 were successfully synthesized and characterized by tuning the position of a phenyl group at the pyridyl moiety in 2-phenylpyridine. All three complexes exhibit typical aggregation-induced phosphorescence emission (AIPE) properties in CH3CN/H2O. The AIPE property was further utilized to achieve highly sensitive detection of 2,4,6-trinitrophenol (TNP) in aqueous media with low limits of detection (LOD) of 164, 176, and 331 nM, respectively. This suggests that the different positions of the phenyl group influence the effectiveness of 1, 2, and 3 in the detection of TNP. In addition, 1, 2, and 3 showed superior selectivity and anti-interference for the detection of TNP and the potential to detect TNP in practical applications. Taking 1 as an example, the changes in the luminescent lifetime and UV-Vis absorption spectra of 1 before and after the addition of TNP, indicate that the quenching process is a combination of static and dynamic quenching. Additionally, the proton nuclear magnetic resonance spectra and spectral studies show that the detection mechanism is photo-induced electron transfer (PET).

Keywords: 
;  ;  ;  ;  ;  

1. Introduction

Nitroaromatic compounds are widely used in explosives, rapid and sensitive detection of nitroaromatic compounds is required for homeland security and national security [1,2]. Among them, 2,4,6-trinitrophenol (TNP) is not only involved in nitro explosives, but also in many industrial operations such as the production of dyes, pyrotechnics, matches, glass, leather, rocket fuel, and batteries [3,4,5]. However, due to the widespread use of TNP, it may be released into the environment during synthesis, transportation, and disposal, where it exists in the form of ions in the air, water, and soil, which can cause serious harm to humans. For example, it causes contact dermatitis, conjunctivitis, and bronchitis, among other conditions [6,7,8]. Therefore, the development of highly sensitive and selective methods for the detection of TNP in aqueous media is of great significance for human health and environmental protection.
Nowadays, several analytical techniques, such as high-performance liquid chromatography [9], Raman spectroscopy [10], X-ray analysis [11], cyclic voltammetry [12], electrochemistry [13], have been used for the detection of nitro explosive compounds, but they are expensive, time-consuming, and bulky. In contrast, photoluminescence has proved to be an ideal analytical tool for trace explosives detection due to its high sensitivity, simplicity of operation, and real-time monitoring capability [14,15,16]. However, common luminescent materials tend to produce weak luminescence due to aggregation-caused quenching (ACQ) when in the solid or aggregated state, which limits the detection of TNP in aqueous media. Notably, the concept of aggregation-induced emission (AIE) first proposed by Tang and coworkers effectively solves the limitation of ACQ phenomenon on the application of luminescent materials [17]. Subsequently, many compounds with AIE properties were designed and synthesized for TNP detection [18,19,20].
To date, the most widely accepted mechanism for the AIE phenomenon is restriction of intramolecular motion (RIM), in which luminescent substances are usually modified with propeller- or rotor-like substituents to activate AIE properties [21]. Shortly after the AIE concept was stated, Manimaran and colleagues reported aggregation-induced phosphorescence emission (AIPE) properties in metal complexes [22]. Recently, several metal complexes have been reported to show excellent AIPE properties [23,24]. Compared with fluorescent light sources, phosphorescent light sources have higher luminescence efficiency and good optical and thermal stability. As phosphorescent light sources, Ir(III) complexes have received increasing attention due to their unique photophysical properties in the fields of photooxidation reduction methods [25], luminescent probes [26], and photodynamic therapy [27]. Therefore, the development of Ir(III) complexes with AIPE properties to detect TNP has become a hot research topic.
2-Phenylpyridine, a unique C^N-type ligand, can be modified to significantly alter the properties of Ir(III) complexes. Phenyl group, as a freely rotatable π-planar group, attempts to change the photophysical properties and application properties of the metal complexes by altering its substitution position on the cyclometalating ligands. Previously, our group used 2-phenylbenzothiazole derivatives as cyclometalating ligands and introduced the phenyl group [28], the AIE properties of Ir(III) complexes were regulated and enhanced. The authors suggest that in dilute solution, the rotatable phenyl group is active and acts as a relaxation channel for excited state inactivation. In the aggregated state, the phenyl group is confined due to physical constraints, which block the nonradiative pathway, thus allowing the exciton to decay radiatively. In 2023, Di and coworkers activated the AIE property of Ir(III) complexes by introducing N-phenylcarbazole groups on the parent Ir(III) complexes (the synergistic effect of phenyl and carbazole significantly improves the rotational properties of the substituent groups), thus improving the luminescence properties in the aggregated state [29]. In 2016, Zhang and coworkers [30] designed and synthesized four additional Ir(III) complexes by introducing phenyl and aldehyde groups to the ligands of the Ir(III) complexes, respectively. Combining the quantum yield and Electroluminescent (EL) performance, the introduction of the phenyl group has better EL performance and larger quantum yield compared with the introduction of electron-withdrawing groups and the results suggest that the introduction of the phenyl group may have improved the performance of the complexes. Therefore, we designed and synthesized Ir(III) complexes 1-3 using phenyl-modified 2-phenylpyridine derivatives as the cyclometalating ligands and 2,2'-bipyridine with flexible conformation as the auxiliary ligand (Figure 1). The luminescent properties of 1-3 in CH3CN/H2O were systematically investigated and the effects of the position of the phenyl group on the sensitivity and selectivity of 1-3 for the detection of TNP in the aqueous media were probed. In addition, the practical application of 1-3 for the detection of TNP in a variety of common water samples was explored.

2. Materials and Methods

The stock solutions of 1, 2, and 3 (100 μM) of CH3CN were firstly prepared. Then, 300 μL of the stock solution was taken into a quartz cuvette, and 3 mL (10 μM) of samples with different water contents were prepared by adding appropriate volumes of CH3CN and deionized water into the stock solution. The fluorescence emission and UV-Vis absorption spectra of these samples were recorded. Samples of 1, 2, and 3 (10 μM) were prepared in 200 mL volumetric flasks with 60% water content, and 3 mL of each sample was withdrawn into a quartz cuvette, and the emission spectra of the 11 blank samples were recorded for calculation of the standard deviation σ (Figure S3). TNP solutions were prepared at concentrations ranging from 0.1 to 50 mM in CH3CN/H2O with 60% water content. The emission spectra were recorded by adding 30 μL of TNP solutions of different concentrations to a cuvette containing 3 mL of the complex sample. In order to perform selectivity and anti-interference experiments for the detection of TNP, we recorded emission spectra after adding 30 μL of different analytes (20 mM, 1,3-dinitrobenzene (1,3-DNB), nitrobenzene (NB), p-cresol, 4-methoxyphenol (MEHQ), phenol, and m-nitrophenol (3-NP)) and different ionic compounds (20 mM, CaCl2, AlCl3, SnCl2, NiCl2, ZnCl2, CoCO3, CuSO4, KF, KBr, and CH3COONa) to 3 mL samples of complexes, respectively. Another 30 μL of TNP solution at a concentration of 20 mM was added to the above samples and the emission spectra were recorded again. In order to investigate the practical application capacity of 1, 2, and 3 for the detection of TNP in a variety of common water samples, different common water samples (tap water from the laboratory of Dalian University of Technology, river water from the Lingshui River, seawater and snow water from Xinghai Bathing Beach, Dalian) instead of deionized water were prepared as samples of 1, 2, and 3, to which the emission spectra were recorded after the addition of TNP solution (30 μL, 20 mM).

3. Results and Discussion

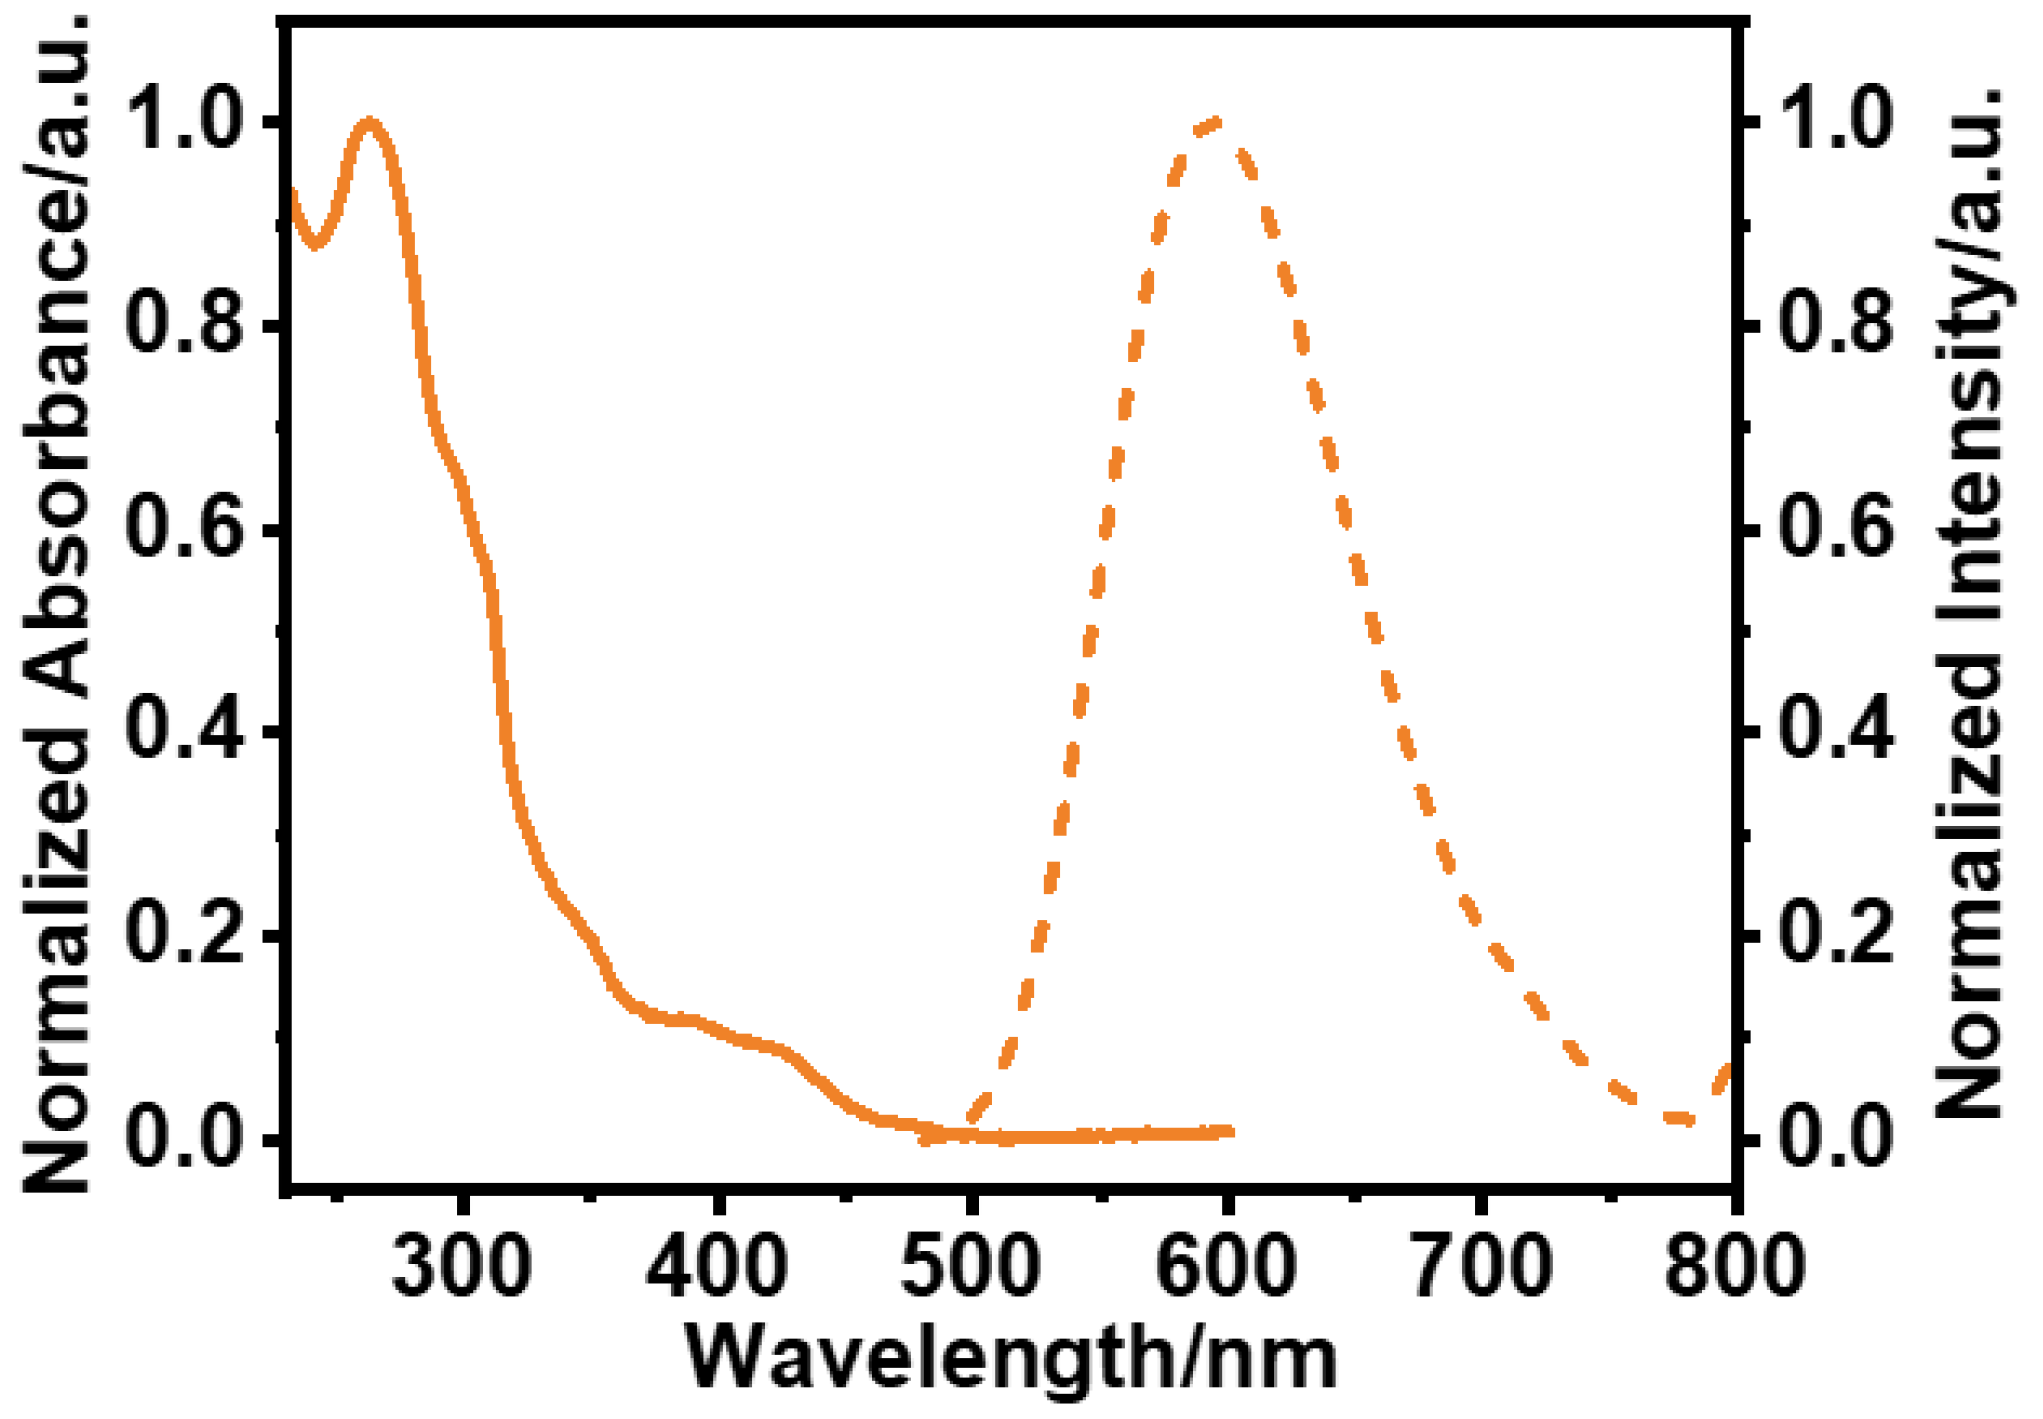
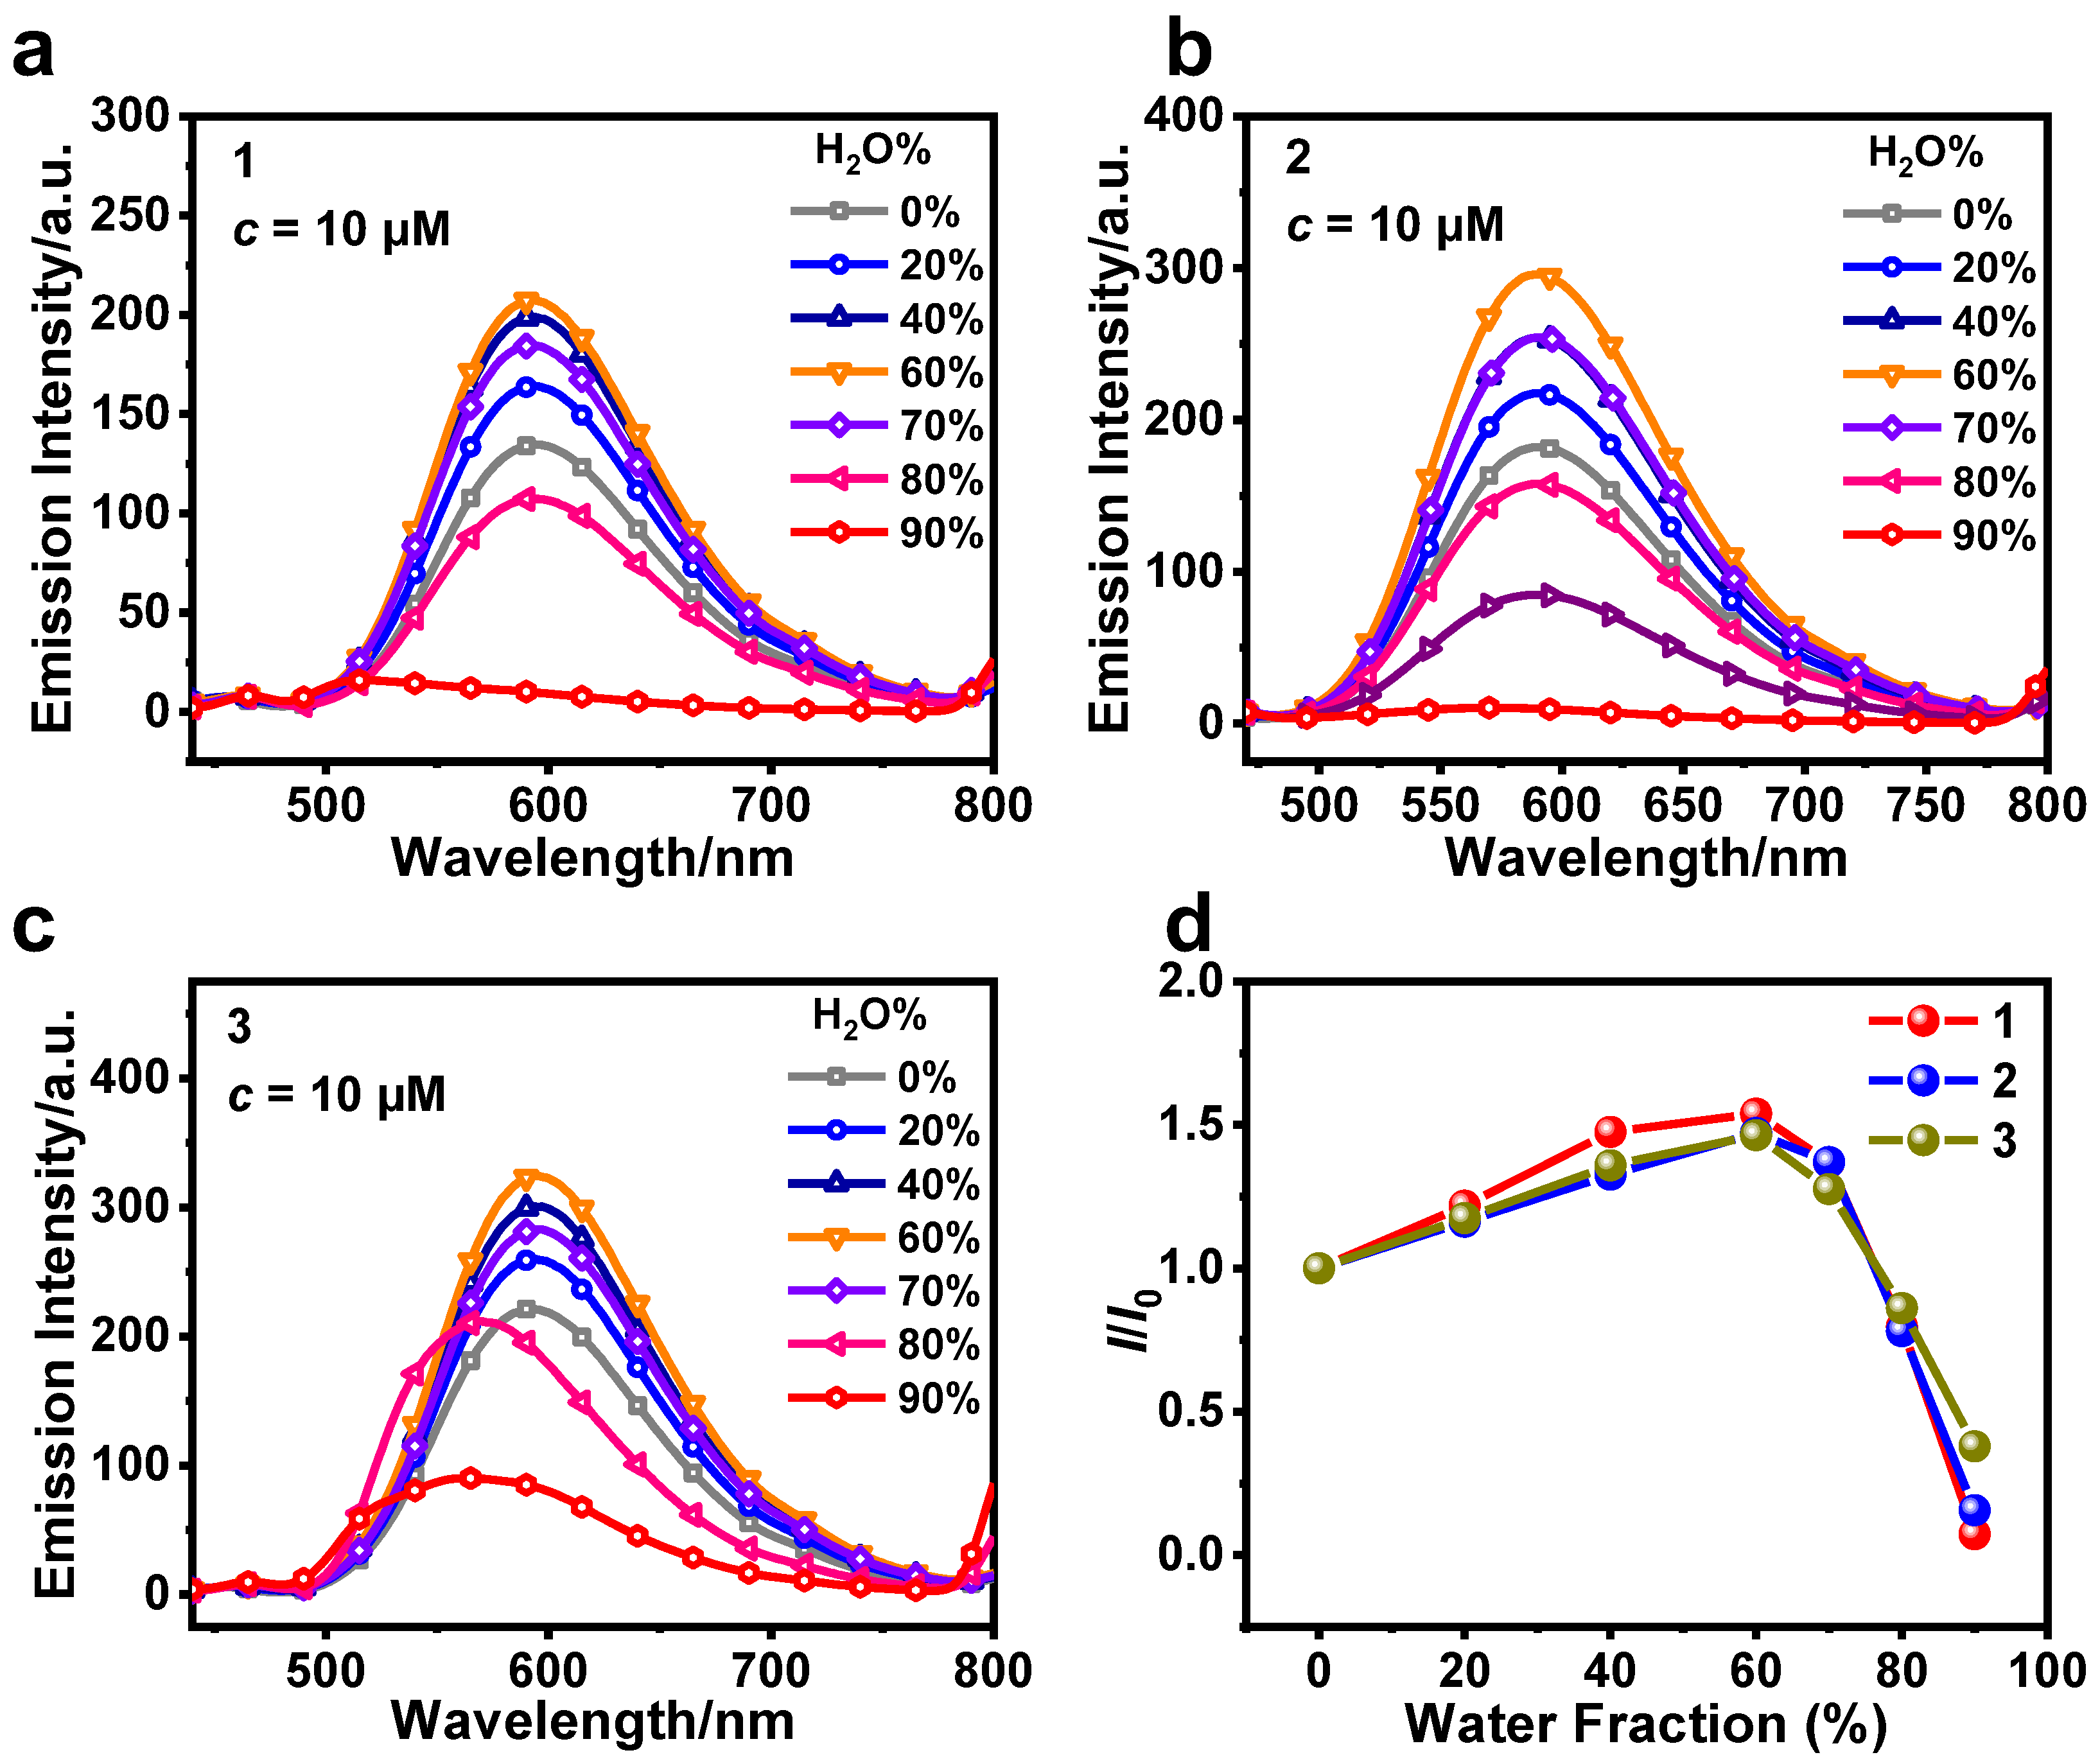
3.1. Photophysical and AIPE Properties

Taking 1 as an example, the UV-Vis absorption and emission spectra of 1 normalized in CH3CN are shown in Figure 2. Similar to other Ir(III) complexes of bipyridine ligands reported in the literature, 1 exhibits a strong absorption band below 350 nm (λ = 262 nm), which belongs to the typical ligand-centered (1π-π*) transitions. The weak absorption between 380-500 nm is attributed to the mixing between metal-to-ligand charge transfer (1MLCT, 3MLCT) and ligand-centered (3π-π*) transitions, which is facilitated by enhanced spin-orbit coupling [31,32,33].
As shown in Figure 3, we tested the emission spectra of 1, 2, and 3 in CH3CN/H2O with different water contents. The emission intensity of the complexes samples gradually increased as the water contents increased from 0% to 60%. The emission intensity of the complexes samples was maximized at 60% water content, exhibiting the typical AIPE phenomenon (Figure 3d). This may be attributed to the aggregation of 1 with increasing water content, resulting in the locking of the rotatable phenyl portion of the ligand and an increase in the emission intensity. This is also evidenced by the dynamic light scattering (DLS) results of 1 at 60% water content (Figure S4).

3.2. Detection of TNP

The AIPE properties exhibited by 1, 2, and 3 in CH3CN/H2O with 60% water content prompted us to use them as phosphorescent materials for the detection of TNP in aqueous media. We further carried out luminescence quenching experiments with different concentrations of TNP for 1, 2, and 3, respectively. The results show that the emission intensity of the complexes samples decreased with the increase in the concentration of added TNP (Figure 4). When the concentration of added TNP was 200 μM, the quenching efficiency of the complexes samples reached about 95% (Figure S5).
The quenching constant (KSV) represents the sensitivity of the probe. We further analyzed the sensitivity of complexes to TNP by the Stern-Volmer equation: I0/I = KSV[Q] + 1. (Where I0 and I represent the emission intensities of the complexes without TNP and after addition of different concentrations of TNP, respectively. [Q] represents the molar concentration of TNP). We fitted the concentration of added TNP to I0/I, which showed good linear and nonlinear relationships (Figure 5a–c). The Stern-Volmer plots showed good linearity when the TNP concentration was in the range of 0-9 μM. The Stern-Volmer plots were nonlinear at TNP concentrations of 0-300 μM. In the range of added TNP concentrations of 0-9 μM, we calculated KSV of 2.88 × 10⁴, 2.26 × 10⁴, and 1.87 × 10⁴ M-1 for 1, 2, and 3 by linear fitting, respectively.
The limits of detection (LOD) is also an important parameter for judging the nature of the probe. In order to calculate the LOD of 1-3, a linear plot of the emission intensity of complexes and the TNP concentration was made. The slope K of the linear equation was obtained by linear fitting (Figure 5d–f). The linear equations for the emission intensity of 1-3 with the concentration of TNP yielded K of 5.30, 6.97, and 5.89 μM-1, respectively. Based on the standard deviation σ calculated from the above experiments (Table S1) and the limit of detection formula LOD = 3σ/K, the LOD for 1-3 were calculated to be 164, 176, and 331 nM, respectively. These results suggest that 1, 2, and 3 can be used as probes for efficient detection of TNP.
In addition to KSV and LOD, selectivity and anti-interference ability are also important indicators to judge the performance of probes. In order to further investigate whether 1, 2, and 3 have good selectivity and anti-interference during TNP detection, we selected several common nitro compounds to be used to investigate whether 1, 2, and 3 have good selectivity, including NB, 1,3-DNB, p-cresol, phenol, MEHQ, and 3-NP. The emission intensity of the samples did not change significantly after adding different nitro compounds (20.0 equiv.), indicating that the different nitro compounds hardly produce a quenching effect on 1, 2, and 3 (Figure 6a–c). On the basis of the addition of various nitro compounds solutions, we continued to add TNP solution (20.0 equiv.), and the quenching efficiencies of the samples of 1, 2, and 3 were significantly improved, all around 95% (Figure 6d). Therefore, 1, 2, and 3 can realize the selective detection of TNP.
We added various ionic compounds to the complexes samples to investigate whether 1, 2, and 3 have good anti-interference properties during TNP detection, including CaCl2, AlCl3, SnCl2, NiCl2, ZnCl2, CoCO3, CuSO4, KF, KBr, and CH3COONa. After adding different ionic compounds (20.0 equiv.) to samples of 1, 2, and 3, the emission intensity of the samples did not change obviously, indicating that the different ionic compounds had almost no quenching effect on 1, 2, and 3 (Figure 7a–c). Based on the addition of various ionic compounds, we continued to add TNP (20.0 equiv.) and found that the various ionic compounds had almost no effect on the luminescence quenching efficiencies of 1, 2, and 3 (Figure 7d). Thus, 1, 2, and 3 show excellent anti-interference properties when used to detect TNP.
In order to further evaluate the ability of 1, 2, and 3 to detect TNP under common water samples and to better promote the practical application of 1, 2, and 3, we selected tap water, river water, seawater and snow water to replace deionized water for studying. The results show that the shape and intensity of the emission spectra of 1, 2, and 3 remained constant in common water samples compared to deionized water (Figure 8). The quenching efficiencies of the complexes samples in different common water samples were more than 95% after the addition of TNP (20.0 equiv.). Therefore, 1, 2, and 3 all have the potential to detect TNP in actual environments.

3.3. Sensing Mechanism

The quenching process is categorized into dynamic and static quenching. During static quenching, the probe interacts with the substance to be measured to form a non-fluorescent ground state complex, which does not affect the fluorescence lifetime of the probe. Whereas dynamic quenching is due to collision of the probe with the molecules of the substance to be measured, with energy or charge transfer, and return of the probe from the excited state to the ground state, resulting in luminescence quenching, which will shorten the emission lifetime of the probe [34,35,36]. From the Stern-Volmer curve in Figure 3, it can be seen that the concentration of added TNP showed a good linear and nonlinear relationship with I0/I. This suggests that the luminescence quenching process of 1, 2, and 3 might be accompanied by both dynamic and static quenching or electrostatic interactions. In order to better understand the quenching mechanism, we recorded the lifetime decay traces of 1 after adding different concentrations of TNP (Figure 8a,b). After the addition of TNP, the lifetime of 1 decreased with the increase of TNP concentration, indicating that there was dynamic quenching during the quenching process. τ0/τ shows a good linear relationship with [Q], which suggests that dynamic quenching exists regardless of the concentration of TNP added in the low or high concentration range (Figure 8b).
In order to better understand the mechanism present in the quenching process, the UV-Vis absorption spectra of 1 after the addition of different concentrations of TNP were investigated (Figure 10a). With the increase of TNP concentration, the absorption peaks of 1 at 263 nm and 310 nm were slightly shifted, and the results indicate that static quenching also occurred during the quenching process [37]. To further understand the interaction of 1 with TNP, the Job's plot was obtained by testing the variation of the molar content of 1 with emission intensity in the mixed system of 1 and TNP (Figure 10b). The inflection point of the Job's plot is 0.5, indicating that the chemical binding ratio of 1 with TNP is 1:1. In addition, the Benesi-Hildebrand plot of 1 with TNP was obtained by fitting (I0-I)-1 to [TNP]-1 (Figure 10c). (I0-I)-1 has a good linear relationship with [TNP]-1, indicating that the chemical binding ratio of 1 with TNP is 1:1, which supports the results of Job's plot [38,39].
In CH3CN/H2O with 60% water content, there is no overlap between the UV-Vis absorption spectrum of TNP and the emission spectrum of 1, suggesting that no Förster resonance energy transfer occurs during the luminescence quenching of 1 [40]. In the 1H NMR spectrum, there is no significant change in the proton signal of 1 after the addition of TNP, indicating that TNP did not lead to the decomposition of 1 (Figure S6). The shift of the proton signal of TNP to the high field proves the existence of electrostatic interactions between 1 and TNP. These results suggest that 1 can achieve highly sensitive detection of TNP mainly attributed to photo-induced electron transfer (PET) [41].

4. Conclusions

In summary, three cationic Ir(III) complexes 1, 2, and 3 have been synthesized by introducing a rotatable phenyl group at different positions of the pyridyl moiety of the cyclometalating ligand. 1, 2, and 3 exhibit typical AIPE properties in CH3CN/H2O. The emission spectra and DLS results of 1 show that the complex molecules aggregate with increasing the water content. We have utilized the AIPE properties of 1, 2, and 3 to achieve highly sensitive and selective detection of TNP in aqueous media, and it was found that 1 with the phenyl group at 3-position of the pyridyl moiety of the cyclometalating ligand has a lower detection limit and higher detection efficiency. The results show that different positions of the phenyl group affected the detection efficiency of 1, 2, and 3 for TNP. The lifetime of 1 gradually decreases with increasing concentration of added TNP, which suggests the existence of dynamic quenching in the quenching process. The absorption peaks of the UV-Vis absorption spectra of 1 were slightly shifted by the addition of different concentrations of TNP, which indicates that there was also static quenching in the quenching process. The detection mechanism was attributed to PET by the proton nuclear magnetic resonance spectra and spectral studies. These findings provide new insights into the design and synthesis of high-performance Ir(III) complexes.

Supplementary Materials

The following supporting information can be downloaded at: www.mdpi.com/xxx/s1, Figure S1. Synthesis route of the cyclometalating ligands L1-L3; Figure S2. Synthesis route of the complexes 1-3; Figure S3. The emission spectra of 1, 2, and 3 in 11 blank samples in CH3CN/H2O (fw = 60%, 10 μM); Figure S4. DLS analysis of 1 at 60% water content (10 μM, CH3CN/H2O); Figure S5. The quenching percentages of 1, 2, and 3 after addition of TNP at various concentrations; Figure S6. 1H NMR spectra of 1, TNP and 1 + TNP; Figure S7. 1H NMR spectrum of 1 in DMSO-d6; Figure S8. The HRMS of cationic portion of 1; Figure S9. 13C NMR spectrum of 1 in DMSO-d6; Figure S10. 1H NMR spectrum of 2 in DMSO-d6; Figure S11. The HRMS of cationic portion of 2; Figure S12. 13C NMR spectrum of 2 in DMSO-d6; Figure S13. 1H NMR spectrum of 3 in DMSO-d6; Figure S14. The HRMS of cationic portion of 3; Figure S15. 13C NMR spectrum of 3 in DMSO-d6; Table S1. The emission intensity of 1, 2, and 3 at λem nm in 11 blank samples in CH3CN/H2O (fw = 60%, 10 µM).

Author Contributions

Investigation, X.Y., J.D., and R.C.; data curation, writing—original draft preparation, X.Y.; writing—review and editing, C.L.; supervision, C.L. All authors have read and agreed to the published version of the manuscript.

Funding

The authors thank the financial support from the National Natural Science Foundation of China (21978042) and the Fundamental Research Funds for the Central Universities (DUT22LAB610).

Institutional Review Board Statement

Not applicable.

Informed Consent Statement

Not applicable.

Data Availability Statement

Data are contained within the article.

Conflicts of Interest

The authors declare no conflicts of interest.

References

  1. Agarwal, A.; Bhatta, R.P.; Kachwal, V.; Laskar, I.R. Controlling the sensitivity and selectivity for the detection of nitro-based explosives by modulating the electronic substituents on the ligand of AIPE-active cyclometalated iridium(<sc>iii</sc>) complexes. Dalton Transactions 2023, 52, 14182–14193. [Google Scholar] [CrossRef]
  2. Zhang, W.; Qiu, L.-G.; Yuan, Y.-P.; Xie, A.-J.; Shen, Y.-H.; Zhu, J.-F. Microwave-assisted synthesis of highly fluorescent nanoparticles of a melamine-based porous covalent organic framework for trace-level detection of nitroaromatic explosives. Journal of Hazardous Materials 2012, 221-222, 147–154. [Google Scholar] [CrossRef] [PubMed]
  3. Wang, H.; Chen, C.; Liu, Y.; Wu, Y.; Yuan, Y.; Zhou, Q. A highly sensitive and selective chemosensor for 2,4,6-trinitrophenol based on L-cysteine-coated cadmium sulfide quantum dots. Talanta 2019, 198, 242–248. [Google Scholar] [CrossRef]
  4. He, G.; Peng, H.N.; Liu, T.H.; Yang, M.N.; Zhang, Y.; Fang, Y. A novel picric acid film sensor <i>via</i> combination of the surface enrichment effect of chitosan films and the aggregation-induced emission effect of siloles. JOURNAL OF MATERIALS CHEMISTRY 2009, 19, 7347–7353. [Google Scholar] [CrossRef]
  5. Burton, D.T.; Cooper, K.R.; Goodfellow, W.L.; Rosenblatt, D.H. Uptake, elimination, and metabolism of14C-picric acid and14C-picramic acid in the American oyster (Crassostrea virginica). Archives of Environmental Contamination and Toxicology 1984, 13, 653–663. [Google Scholar] [CrossRef]
  6. Kayser, E.G.; Burlinson, N.E. Migration of explosives in soil: analysis of rdx, tnt, and tetryl from a 14c lysimeter study. Journal of Energetic Materials 1988, 6, 45–71. [Google Scholar] [CrossRef]
  7. Thorne, P.G.; Jenkins, T.F. A field method for quantifying ammonium picrate and picric acid in soil. Field Analytical Chemistry & Technology 1997, 1, 165–170. [Google Scholar] [CrossRef]
  8. Wyman, J.F.; Serve, M.P.; Hobson, D.W.; Lee, L.H.; Uddin, D.E. Acute toxicity, distribution, and metabolism of 2,4,6-trinitrophenol (picric acid) in Fischer 344 rats. Journal of Toxicology and Environmental Health 1992, 37, 313–327. [Google Scholar] [CrossRef]
  9. Moore, D.S. Instrumentation for trace detection of high explosives. Review of Scientific Instruments 2004, 75, 2499–2512. [Google Scholar] [CrossRef]
  10. Sylvia, J.M.; Janni, J.A.; Klein, J.D.; Spencer, K.M. Surface-Enhanced Raman Detection of 2,4-Dinitrotoluene Impurity Vapor as a Marker To Locate Landmines. Analytical Chemistry 2000, 72, 5834–5840. [Google Scholar] [CrossRef]
  11. Hakonen, A.; Andersson, P.O.; Stenbæk Schmidt, M.; Rindzevicius, T.; Käll, M. Explosive and chemical threat detection by surface-enhanced Raman scattering: A review. Analytica Chimica Acta 2015, 893, 1–13. [Google Scholar] [CrossRef]
  12. Krausa, M.; Schorb, K. Trace detection of 2,4,6-trinitrotoluene in the gaseous phase by cyclic voltammetry1Dedicated to Professor W. Vielstich on the occasion of his 75th birthday.1. Journal of Electroanalytical Chemistry 1999, 461, 10–13. [Google Scholar] [CrossRef]
  13. Li, P.; Li, X.; Chen, W. Recent advances in electrochemical sensors for the detection of 2, 4, 6-trinitrotoluene. Current Opinion in Electrochemistry 2019, 17, 16–22. [Google Scholar] [CrossRef]
  14. Sun, X.; Wang, Y.; Lei, Y. Fluorescence based explosive detection: from mechanisms to sensory materials. Chemical Society Reviews 2015, 44, 8019–8061. [Google Scholar] [CrossRef]
  15. Wu, X.; Hang, H.; Li, H.; Chen, Y.; Tong, H.; Wang, L. Water-dispersible hyperbranched conjugated polymer nanoparticles with sulfonate terminal groups for amplified fluorescence sensing of trace TNT in aqueous solution. Materials Chemistry Frontiers 2017, 1, 1875–1880. [Google Scholar] [CrossRef]
  16. Barata, P.D.; Prata, J.V. Fluorescent Calix[4]arene-Carbazole-Containing Polymers as Sensors for Nitroaromatic Explosives. In Chemosensors, 2020; Vol. 8.
  17. Luo, J.; Xie, Z.; Lam, J.W.; Cheng, L.; Chen, H.; Qiu, C.; Kwok, H.S.; Zhan, X.; Liu, Y.; Zhu, D.; et al. Aggregation-induced emission of 1-methyl-1,2,3,4,5-pentaphenylsilole. Chemical communications (Cambridge, England), 1039. [Google Scholar] [CrossRef]
  18. Miao, C.; Li, D.; Zhang, Y.; Yu, J.; Xu, R. AIE luminogen functionalized mesoporous silica nanoparticles as efficient fluorescent sensor for explosives detection in water. Microporous and Mesoporous Materials 2014, 196, 46–50. [Google Scholar] [CrossRef]
  19. Li, K.; Yu, R.-H.; Shi, C.-M.; Tao, F.-R.; Li, T.-D.; Cui, Y.-Z. Electrospun nanofibrous membrane based on AIE-active compound for detecting picric acid in aqueous solution. Sensors and Actuators B: Chemical 2018, 262, 637–645. [Google Scholar] [CrossRef]
  20. Ma, Y.; Zhang, Y.; Liu, X.; Zhang, Q.; Kong, L.; Tian, Y.; Li, G.; Zhang, X.; Yang, J. AIE-active luminogen for highly sensitive and selective detection of picric acid in water samples: Pyridyl as an effective recognition group. Dyes and Pigments 2019, 163, 1–8. [Google Scholar] [CrossRef]
  21. Mei, J.; Leung, N.L.C.; Kwok, R.T.K.; Lam, J.W.Y.; Tang, B.Z. Aggregation-Induced Emission: Together We Shine, United We Soar! Chemical Reviews 2015, 115, 11718–11940. [Google Scholar] [CrossRef]
  22. Manimaran, B.; Thanasekaran, P.; Rajendran, T.; Lin, R.J.; Chang, I.J.; Lee, G.H.; Peng, S.M.; Rajagopal, S.; Lu, K.L. Luminescence enhancement induced by aggregation of alkoxy-bridged rhenium(I) molecular rectangles. Inorganic Chemistry 2002, 41, 5323–5325. [Google Scholar] [CrossRef] [PubMed]
  23. Xu, J.; Zhang, L.; Shi, Y.; Liu, C. Carbazolyl-Modified Neutral Ir(III) Complexes for Efficient Detection of Picric Acid in Aqueous Media. In Sensors, 2024; Vol. 24.
  24. He, P.; Chen, Y.; Li, X.-N.; Yan, Y.-Y.; Liu, C. Aggregation-Induced Emission-Active Iridium(III) Complexes for Sensing Picric Acid in Water. In Chemosensors, 2023; Vol. 11.
  25. Liang, Y.; Zhang, X.; MacMillan, D.W.C. Decarboxylative sp3 C–N coupling via dual copper and photoredox catalysis. Nature 2018, 559, 83–88. [Google Scholar] [CrossRef] [PubMed]
  26. Wang, W.; Yung, T.-L.; Cheng, S.-S.; Chen, F.; Liu, J.-B.; Leung, C.-H.; Ma, D.-L. A long-lived luminogenic iridium(III) complex for acetylacetone detection in environmental samples. Sensors and Actuators B: Chemical 2020, 321, 128486. [Google Scholar] [CrossRef]
  27. Guo, S.; Han, M.P.; Chen, R.Z.; Zhuang, Y.L.; Zou, L.; Liu, S.J.; Huang, W.; Zhao, Q. Mitochondria-localized iridium(III) complexes with anthraquinone groups as effective photosensitizers for photodynamic therapy under hypoxia. SCIENCE CHINA-CHEMISTRY 2019, 62, 1639–1648. [Google Scholar] [CrossRef]
  28. He, P.; Chen, Y.; Li, X.-N.; Yan, Y.-Y.; Liu, C. AIPE-active cationic Ir(iii) complexes for efficient detection of 2,4,6-trinitrophenol and oxygen. Dalton Transactions 2023, 52, 128–135. [Google Scholar] [CrossRef]
  29. Di, L.; Xing, Y.; Yang, Z.; Qiao, C.; Xia, Z. Photostable aggregation-induced emission of iridium(III) complex realizing robust and high-resolution imaging of latent fingerprints. Sensors and Actuators B: Chemical 2023, 375, 132898. [Google Scholar] [CrossRef]
  30. Zhang, Q.; Li, Y.; Wang, X.; Wang, L.; Zhang, J. The influence of different cyclometalated ligand substituents and ancillary ligand on the phosphorescent properties of iridium(III) complexes. Materials Chemistry and Physics 2016, 177, 179–189. [Google Scholar] [CrossRef]
  31. Jang, J.-H.; Park, H.J.; Park, J.Y.; Kim, H.U.; Hwang, D.-H. Orange phosphorescent Ir(III) complexes consisting of substituted 2-phenylbenzothiazole for solution-processed organic light-emitting diodes. Organic Electronics 2018, 60, 31–37. [Google Scholar] [CrossRef]
  32. Zhou, Y.; Gao, H.; Wang, X.; Qi, H. Electrogenerated Chemiluminescence from Heteroleptic Iridium(III) Complexes with Multicolor Emission. Inorganic Chemistry 2015, 54, 1446–1453. [Google Scholar] [CrossRef]
  33. Dai, J.; Zhou, K.; Li, M.; Sun, H.; Chen, Y.; Su, S.; Pu, X.; Huang, Y.; Lu, Z. Iridium(iii) complexes with enhanced film amorphism as guests for efficient orange solution-processed single-layer PhOLEDs with low efficiency roll-off. Dalton Transactions 2013, 42, 10559–10571. [Google Scholar] [CrossRef] [PubMed]
  34. Iqbal, A.; Tian, Y.; Wang, X.; Gong, D.; Guo, Y.; Iqbal, K.; Wang, Z.; Liu, W.; Qin, W. Carbon dots prepared by solid state method via citric acid and 1,10-phenanthroline for selective and sensing detection of Fe2+ and Fe3+. Sensors and Actuators B: Chemical 2016, 237, 408–415. [Google Scholar] [CrossRef]
  35. Zu, F.; Yan, F.; Bai, Z.; Xu, J.; Wang, Y.; Huang, Y.; Zhou, X. The quenching of the fluorescence of carbon dots: A review on mechanisms and applications. Microchimica Acta 2017, 184, 1899–1914. [Google Scholar] [CrossRef]
  36. Das, D.; Maity, A.; Shyamal, M.; Maity, S.; Mudi, N.; Misra, A. Aggregation induced emission of 9-Anthraldehyde microstructures and its selective sensing behavior towards picric acid. Journal of Molecular Liquids 2018, 261, 446–455. [Google Scholar] [CrossRef]
  37. Shi, Z.; Li, W.; Pi, H.; Liu, H.; Chen, H.; Li, P.; Jiang, X. Trace amounts of mercaptans with key roles in forming an efficient three-component photoinitiation system for holography. Materials Today Chemistry 2022, 26, 100999. [Google Scholar] [CrossRef]
  38. Liu, Y.; Wang, Y.; Chen, L.; Che, G. Diphenyl imidazole-based supramolecular self-assembly system for an efficient fluorometric detection of picric acid. Dyes and Pigments 2022, 203, 110378. [Google Scholar] [CrossRef]
  39. Karuk Elmas, S.N.; Karagoz, A.; Arslan, F.N.; Yilmaz, I. Propylimidazole Functionalized Coumarin Derivative as Dual Responsive Fluorescent Chemoprobe for Picric Acid and Fe3+ Recognition: DFT and Natural Spring Water Applications. Journal of Fluorescence 2022, 32, 1357–1367. [Google Scholar] [CrossRef]
  40. P, K.; Cherian, A.R.; Sirimahachai, U.; Thadathil, D.A.; Varghese, A.; Hegde, G. Detection of picric acid in industrial effluents using multifunctional green fluorescent B/N-carbon quantum dots. Journal of Environmental Chemical Engineering 2022, 10, 107209. [Google Scholar] [CrossRef]
  41. Escudero, D. Revising Intramolecular Photoinduced Electron Transfer (PET) from First-Principles. Accounts of Chemical Research 2016, 49, 1816–1824. [Google Scholar] [CrossRef] [PubMed]
Figure 1. Molecular structure of complexes 1-3.
Preprints 143450 g001
Figure 2. Normalized absorption and emission spectra of 1 in CH3CN (solid line: absorption spectrum; dashed line: emission spectrum; excitation wavelength: 400 nm).
Preprints 143450 g002
Figure 3. (a-c) Emission spectra of 1-3 in CH3CN/H2O with various water contents (0-90%) (c = 10 µM, λex = 400 nm). (d) Line plots of the ratio of the maximum emission intensity (I) of 1-3 in CH3CN/H2O at various water contents to the emission intensity of their monomers (I0).
Preprints 143450 g003
Figure 4. Emission spectra of 1-3 (10 μM) in CH3CN/H2O (fw = 60%) as a function of TNP concentration.
Preprints 143450 g004
Figure 5. (a-c) Stern-Volmer curves for 1-3 detection of TNP, the inset shows the linear part of the Stern-Volmer curves. (d-f) Linear plots of the variation of 1-3 emission intensity with TNP concentration.
Preprints 143450 g005
Figure 6. (a-c) Emission spectra of 1-3 (10 μM) in CH3CN/H2O (fw = 60%) after addition of different nitro compounds (20.0 equiv.). (d) Quenching rate of 1-3 (10 μM, CH3CN/H2O) by different nitro compounds (20.0 equiv.).
Preprints 143450 g006
Figure 7. (a-c) Emission spectra of 1-3 (10 μM) in CH3CN/H2O (fw = 60%) after the addition of different ionic compounds (20.0 equiv.). (d) Quenching rate of 1-3 (10 μM, CH3CN/H2O) by different ionic compounds (20.0 equiv.).
Preprints 143450 g007
Figure 8. (a-c) Emission spectra of 1-3 (10 μM) in CH3CN/H2O (fw = 60%) using common water samples with or without TNP. (d) Quenching rate of 1-3 (10 μM, CH3CN/H2O) by TNP in different water sample detection systems.
Preprints 143450 g008
Figure 9. (a) The lifetime decay traces of 1 after adding different concentrations of TNP in CH3CN/H2O. (b) Changes of lifetime (τ) of 1 after adding different concentrations of TNP in CH3CN/H2O. Inset: Ratio of lifetime (τ0/τ) of 1 before (τ0) and after (τ) addition of different concentrations of TNP.
Preprints 143450 g009
Figure 10. (a) UV-Vis absorption spectra of 1 in CH3CN/H2O (fw = 60%) after addition of different concentrations of TNP. (b) The Job's plot of 1 with TNP ([1] represents the concentration of 1; [1 + TNP] represents the total concentration of 1 and TNP; X represents the molar content of 1 in the mixed system of 1 and TNP; I0 and I represent the emission intensity of 1 before and after the addition of TNP, respectively.). (c) Benesi-Hildebrand plot of 1 with TNP ([TNP] represents the concentration of TNP; I0 and I represent the emission intensity of 1 before and after the addition of different concentrations of TNP, respectively.). (d) Normalized emission spectra of 1 (red) and normalized UV-Vis absorption spectra of TNP (blue).
Preprints 143450 g010
Disclaimer/Publisher’s Note: The statements, opinions and data contained in all publications are solely those of the individual author(s) and contributor(s) and not of MDPI and/or the editor(s). MDPI and/or the editor(s) disclaim responsibility for any injury to people or property resulting from any ideas, methods, instructions or products referred to in the content.
Copyright: This open access article is published under a Creative Commons CC BY 4.0 license, which permit the free download, distribution, and reuse, provided that the author and preprint are cited in any reuse.
Prerpints.org logo

Preprints.org is a free preprint server supported by MDPI in Basel, Switzerland.

Subscribe

Disclaimer

Terms of Use

Privacy Policy

Privacy Settings

© 2025 MDPI (Basel, Switzerland) unless otherwise stated