
Submitted:
02 July 2025
Posted:
04 July 2025
You are already at the latest version
Abstract
Endometrosis is a prevalent fibrotic condition in mares that impairs reproductive efficiency by inducing aberrant transformation of endometrial stromal cells into myofibroblasts, leading to excessive extracellular matrix deposition. To elucidate the molecular mechanisms underlying fibrosis resolution, this study employed comprehensive proteomic techniques, including LC-MS/MS and SILAC, to analyze the interaction between myofibroblasts and mesenchymal stem cells derived from the endometrium (ET-eMSCs) preconditioned with PGE₂. An in vitro co-culture system was used, with samples collected at baseline and after 48 hours. Proteomic analysis identified significant alterations in proteins associated with extracellular matrix (ECM) remodeling, immune regulation, and cellular stress response. Notably, proteins involved in collagen degradation, antioxidant defense, and growth factor signaling pathways were differentially abundant. Network analyses demonstrated robust interactions among these proteins, suggesting coordinated modulatory effects. The data indicates that PGE₂-primed ET-eMSCs induce a shift in myofibroblast secretory profiles, promoting ECM “softening,” tissue reorganization, and activation of resolution pathways. These findings reinforce the therapeutic potential of mesenchymal stem cell-based interventions for fibrotic diseases of the endometrium, opening avenues for regenerative strategies to restore reproductive function in mares.
Keywords:
Endometrosis
; Equine mesenshymal stem cells
; Mare endometrial
; precondition with PGE2
; SILAC
; myofibloblasts - Equine mesenshymal stem cells interaction
1. Introduction
Endometrosis is widely recognized as one of the most critical reproductive disorders affecting mares characterized by the fibrotic transformation of the endometrium. This pathological change reduces the functionality of endometrial tissue and compromises the mare's ability to sustain a pregnancy to term [1,2,3,4,5]. The earliest detectable alterations involve the atypical differentiation of stromal cells, which adopt an elongated and polygonal morphology accompanied by increased metabolic activity, a hallmark of myofibroblast-like activation [6,7].
The activation of myofibroblasts is characterized by the production of contractile proteins, such as α-smooth muscle actin (α-SMA), and a pronounced accumulation of extracellular matrix components, notably collagen types I and III [8,9,10]. Despite the profound impact of endometrosis on reproductive performance, no effective treatment currently exists [11]. Recent approaches have focused on modulating local inflammation and promoting cellular regeneration as novel therapeutic strategies.
In this context, mesenchymal stem cell (MSC) therapies have emerged as a promising alternative due to their antifibrotic properties and their role in maintaining tissue homeostasis [12,13]. These therapeutic effects were attributed to the MSC secretome, which was enriched in lipids, growth factors, microRNAs, and cytokines that were shown to inhibit apoptosis and fibrosis, enhance angiogenesis, drive progenitor cell proliferation and differentiation, and modulate immune responses [14]. Extracellular vesicles were also released into the conditioned medium and recognized as key mediators of intercellular communication [15].
We investigated equine MSCs (eMSCs) and their secretome as potential regenerative therapy for endometrosis and endometritis [16,17,18,19]. In previous assays, myofibroblasts were co-cultured with equine endometrial-derived MSCs (ET-eMSCs) that had been preconditioned with PGE₂ in a Transwell system, and a statistically significant reduction was observed in the relative expression of fibrosis-related genes (α-SMA, COL1A1, COL3A1, MMP-9, and MMP-2), all of which are known to contribute to fibrotic progression. However, no transcriptional changes were detected when the myofibroblasts were exposed solely to the conditioned medium of these cells (Mendez-Pérez et al., submitted).
These observations led us to hypothesize that the interaction between ET-eMSCs and myofibroblasts plays a bidirectional role in modulating the fibrotic response. Specifically, this crosstalk appears to enrich the ET-eMSC secretome with antifibrotic molecules, thereby exerting a “healing” effect on myofibroblasts, while myofibroblasts, in turn, provide stimulatory feedback to the ET-eMSCs via paracrine mechanisms. To explore this hypothesis, we employed label-free quantitative proteomics to identify differentially abundant canonical proteins (DAPs) in the proteome of endometrial myofibroblasts co-cultured with ET-eMSCs that had been preconditioned with PGE2. Based on our previous work, we challenged ET-eMSC with PGE2 as a trigger of antifibrotic activity [18,19]. Next, a quantitative proteomics assay using SILAC was conducted on the co-culture experiment, enabling proteins in the culture supernatant to be traced back to their source cell lines.
By integrating proteomic and functional analyses, this study aims to elucidate the molecular mechanisms underlying the antifibrotic effects mediated by MSC-derived secretome. Our findings are expected to contribute to a better understanding of the therapeutic potential of these cellular therapies in the treatment of endometrosis, advancing the field of regenerative medicine
2. Materials and Methods
The animal study was approved by the Ethics Committee of the Faculty of Veterinary Sciences, University of Concepción, Chile (CEBB 907-2021). Sample collection was carried out during the reproductive season in the Southern Hemisphere (August to January). All procedures complied with local legislation and institutional guidelines.
Endometrial mesenchymal stem cells (ET-eMSCs) positive for CD90/CD44 and negative for CD45/MHCII were isolated in our laboratory (Méndez-Pérez L. et al. (submitted)) from the endometrial tissue of Chilean Thoroughbred mares (n = 6) and characterized according to the protocols described in [20], following the criteria established by [21,22].
An equine endometrial fibroblast line was previously isolated and characterized in our laboratory as described by 18] and further validated following the methodology reported by Méndez-Pérez L. et al. (submitted). All cellular derivation from animal samples was performed under the mentioned permit (CEBB 907-2021; Universidad de Concepción). No commercial cell lines were used in this study.
2.1. Experimental Design
2.1.1. Experiment 1: Proteomic analysis of the interaction of endometrial myofibroblasts with PGE2-conditioned Equine mesenchymal stem cells derived from endometrial tissue (ET-eMSCs) for the study of endometrosis
This experiment evaluated the combined effect of soluble mediators and indirect cell–cell interactions mediated by PGE₂-preconditioned ET-eMSCs on myofibroblast behavior. Myofibroblasts were co-cultured with preconditioned ET-eMSCs using a permeable membrane system, allowing only paracrine signaling. ET-eMSC lines were combined into a single pooled culture and subjected to triplicate experimental replicates
2.1.2. Induction of Myofibroblasts from Endometrial Fibroblasts
The fibroblasts were seeded at a density of 1x10⁵cell/cm2 in 12-well flat-bottom dish in high-glucose DMEM (Sigma-Aldrich™ D6429; Saint Louis, MO, USA) supplemented with 10% Fetal Bovine Serum(FSB) (Sigma-Aldrich™ F2442; Saint Louis, MO, USA) and 1x Antibiotic-Antimycotic Solution (AAM) (Corning™ 30-004-CI; USA). They were incubated for 28 hours at 38°C with 5% CO₂, and after this time, the fibroblasts were washed with 1x PBS and transferred to an induction medium (high-glucose DMEM supplemented with 0.5% FBS and 1x AAM). They were then incubated for an additional 18 hours at 38°C with 5% CO₂. After this period, 10 ng/mL each of TGF-β (code:100-21-10UG), TNF-α(code: 300-01A-50UG), IL-6(code: AF-200-06-20UG), and IL-1β(code: 200-01B-10UG) (all, Gibco™, Thermo Fisher Scientific Inc, USA) were added, and the cells were further incubated for 24 hours at 38°C with 5% CO₂ (-24hours in the Figure 1). This incubation time induces the differentiation into myofibroblasts
2.1.3. Culture to ET-eMSC
ET-eMSCs were seeded in the upper chamber of a Transwell system (0.4 μm pore size; SPLInsert™ Hanging 37012, SPL Life Sciences Co., Ltd, Korea) at a density of 6 × 10⁴ cells/cm² in 2 mL of high-glucose DMEM supplemented with 10% FBS and 1× AAM. The cells were incubated under these culture conditions at 38°C in a humidified atmosphere containing 5% CO₂ for 48 hours.
After 48 hours, ET-eMSCs were transferred to a medium conditioned with 3 μM PGE₂ (high-glucose DMEM supplemented with 1x AAM and 3 μM PGE₂ (Cayman Chemical 14010, Ann Harbor, MI, USA) and incubated for 24 hours (-24 H in Figure 1).
2.1.4. Co-Culture of Myofibroblasts and ET-eMSCs Preconditioned with PGE2
On day 0 (Figure 1), the induction medium was removed from the myofibroblast plates, and the myofibroblasts were washed twice with 1× PBS to eliminate any residual medium. The co-culture of myofibroblasts and ET-eMSCs preconditioned with 3 μM PGE₂ was conducted using a transwell system, which allowed bidirectional exchange between cells seeded in the upper chamber and those in the lower chamber without direct physical contact. For the co-culture, the ET-eMSCs in the upper chamber were transferred to the well where the myofibroblasts were located at the bottom of the plate (lower chamber). One milliliter of PGE₂-conditioned medium from ET-eMSCs was added to both chambers. Myofibroblast samples (obtained 24 hours post-induction with the cytokine cocktail) and culture supernatants from ET-eMSCs (preconditioned for 24 hours with PGE₂) were collected at the start of the co-culture (proteome T0 and secretome T0, respectively) and again after 48 hours (proteome 48 hours and secretome 48 hours, respectively). Each sampling was performed in triplicate.
The culture supernatant samples for secretome analysis were collected, supplemented with a Protease Inhibitor Cocktail (Cell Signaling Technology™ 7012, MA, USA) at a final concentration of 1x, and stored at -80°C until further processing. For the myofibroblast culture samples, the cell monolayer was harvested using cell scrapers, resuspended in 100 µL of commercial 1x PBS (Gibco 10010023, Thermo Fisher Scientific, USA), supplemented with Protease Inhibitor Cocktail at a final concentration of 1x, and stored at -80°C until processing. Figure 1 summarizes the experimental conditions.
2.2. Experiment 2: Canonical Protein Identification and Relative Quantification of the Interaction Between Endometrial Myofibroblasts and PGE₂-Conditioned ET-eMSCs Were Performed Using the SILAC Protein Quantitation Kit (Trypsin)
This assay aimed to determine, within the co-culture supernatant of myofibroblasts and ET-eMSC (similar to the previous experiment), the specific proteins contributed by each cell line type. Using the SILAC Protein Quantitation Kit (Trypsin), two cell populations were cultured in media containing either light or heavy isotopic amino acids [23] (Figure 2).
For this assay, the SILAC Protein Quantitation Kit (Trypsin) – DMEM was used, which includes DMEM/F12 for SILAC; 13C_6 15N_2 L-Lysine-2HCl; L-Lysine-2HCl; 13C_6 15N_4 L-Arginine-HCl; L-Arginine-HCl and Dialyzed Fetal Bovine Serum(code: A33972 SILAC Protein Quantitation Kit (Trypsin) – DMEM; Pierce Biotechnology, Thermo Fisher Scientific Inc., USA). The SILAC medium was supplemented with 10% dialyzed FBS (supplied with the kit), 1x Antibiotic-Antimycotic Solution (AAM) (code: 30-004-CI; Corning™, USA), and the manufacturer's instructions for cell culture and protein labeling were followed. Fibroblasts were labeled with heavy isotopologues of lysine (13C_6 15N_2 L-Lysine-2HCl), and ET-eMSCs were labeled with heavy isotopologues of arginine (13C_6 15N_4 L-Arginine-HCl) (SILAC Protein Quantitation Kit (Trypsin) – DMEM A33972; Pierce Biotechnology, Thermo Fisher Scientific Inc., USA). Passage both cell populations for seven cell doublings by changing medium every 2 days. Maintain density so that cells are actively growing in log phase (90% confluency) in p100 plates.
On day thirteen, ET-eMSCs were seeded in the upper chamber of a Transwell system (0.4 μm pore size; SPLInsert™ Hanging 37012; SPL Life Sciences Co., Ltd, Korea) at a density of 6 × 10⁴ cells/cm² in 2 mL of DMEM/F12 supplemented with 13C_6 15N_4 L-Arginine-HCl; 10% dialyzed FBS, and 1× AAM. The cells were incubated under these culture conditions at 38°C in a humidified atmosphere containing 5% CO₂ for 48 hours.
The fibroblasts were then seeded at 1x10⁵ cells/cm² in 12-well plates (in triplicate) in 1mL of DMEM/F12 supplemented with 13C_6 15N_2 L-Lysine-2HCl; 10% dialyzed FBS, and 1× AAM. The cells were incubated under these culture conditions at 38°C in a humidified atmosphere containing 5% CO₂ for 48 hours.
2.2.1. Induction of Myofibroblasts from Endometrial Fibroblasts
After 24 hours of culture, fibroblasts were washed with 1xPBS and incubated for 18 hours at 38 °C with 5% CO₂ in a pre-induction medium (DMEM/ F12 supplemented with 13C6 15N2 L-Lysine-2HCl; 0.5% dialyzed FBS, and 1× AAM). After this period, 10 ng/mL each of TGF-β (100-21-10UG), TNF-α(300-01A-50UG), IL-6(AF-200-06-20UG), and IL-1β(200-01B-10UG) (all, Gibco™, Thermo Fisher Scientific Inc, USA) (induction cocktail) were added, and the fibroblasts were further incubated for 24 hours at 38 °C with 5% CO₂.
2.2.2. ET-eMSC Pre-Conditioning with PGE2
After 48 hours of culture, ET-eMSCs were washed with 1× PBS and incubated for an additional 24 hours at 38 °C with 5% CO₂ in preconditioning medium (DMEM/F12 supplemented with 13C_6 15N_4 L-Arginine·HCl, 1× AAM, and 3 μM PGE₂; Cayman Chemical 14010, Ann Arbor, MI, USA). For the control group, ET-eMSCs were maintained in medium containing DMEM/F12 supplemented with 13C_6 15N_4 L-Arginine·HCl and 1× AAM, without PGE₂.
2.2.3. Co-Cultures
On Day 19, the induction medium was collected from the myofibroblast cultures (sample T0MYO) and supplemented with a Protease Inhibitor Cocktail (Cell Signaling Technology™ 7012, MA, USA) at a final concentration of 1x, and stored at -80°C until further processing. Myofibroblasts were then rinsed twice with 1× PBS. The Transwell inserts containing the preconditioned ET-eMSCs were placed into the myofibroblast plates, and 1 mL of conditioned medium (supplemented with 13C_6 15N_4 L-Arginine·HCl) was added to both the upper and lower chambers to enable bidirectional molecular exchange. The co-cultures were maintained for 48 hours. As illustrated in Figure 2, at this time, T0MSC culture supernatant samples were taken, following the same procedure as the T0MYO sample.
Co-cultures were maintained for 48 hours. At that time, culture supernatants were collected from the ET-eMSC preconditioned with PGE2 wells following the same protocol used for the T0MYO samples (Sample T0MSC; Figure 2). The culture supernatant samples for secretome analysis were collected, supplemented with a Protease Inhibitor Cocktail (Cell Signaling Technology™ 7012, MA, USA) at a final concentration of 1x, and stored at -80°C until further processing.
The steps of protein extraction for spectrometry analysis, preparation for mass spectrometry (MS), and liquid chromatography-tandem mass spectrometry (LC-MS/MS) were similar to those described above, taking into account the recommendations of Kani (2017) [24].
2.3. Protein Extraction for Spectrometry Analysis
Proteins were extracted using 100 µl of lysis buffer (50 mM HEPES, pH 8, 1% (wt/vol) Triton X 100, 1% (vol/vol) NP-40, 1% (vol/vol) Tween 20, 1% (wt/vol) deoxycholate), 5 mM EDTA, 50 mM NaCl, 1% (vol/vol) glycerol, 1X Complete Protease Inhibitor, and 5 mM DTT). They were then incubated for 30 minutes at 60°C. Samples were homogenized by ultrasound for 2 min with 10-second cycles at 40% intensity, then alkylated using 20 mM iodoacetamide and 25 mM ammonium bicarbonate, and incubated in the dark for 30 min. The protein extract was cleaned using the chloroform/methanol method. 1 volume of the protein extract was incorporated into 5 volumes of 100% methanol, and 1 volume of 100% chloroform (vol/vol) was added. 3 volumes of Milli-Q water were added, and they were centrifuged at 15,000 x g for 5 min, thus observing a protein disk; then, the soluble phase was removed, and the disk was washed with 400 µl of 100% methanol 4 times, finally, they were dried in a rotary concentrator at 2,000 rpm overnight at 40 °C.
2.4. Preparation for Mass Spectrometry
The resulting proteins were precipitated by adding 5 volumes of cold acetone and incubated overnight at -80°C. They were then equilibrated at room temperature for 10 minutes, centrifuged at 16,000 × g for 15 minutes at 4°C, and the supernatant was discarded. The resulting pellet was washed 3 times with 80% cold acetone. The proprotein pellet was then allowed to dry in a rotary concentrator.
Samples were resuspended in 30 µL of 8 M Urea and 25 mM ammonium bicarbonate. They were then reduced with DTT to a final concentration of 20 mM in 25 mM ammonium bicarbonate and incubated for 1 hour at room temperature. They were then alkylated by adding Iodoacetamide to a final concentration of 20 mM in 25 mM ammonium bicarbonate and incubated for 1 hour in the dark at room temperature. Subsequently, the samples were diluted 8-fold with 25 mM ammonium bicarbonate.
Digestion was performed with sequencing grade Trypsin (Promega V5071, Madison, USA) in a 1:50 protease: proprotein ratio (mass/mass) and incubated for 16 h at 37°C. The digestion reaction was stopped by adding 10% formic acid. Then, 200 ng of the peptides were cleaned using Evotips disposable C18 columns (EVOSEP EVO2018, Biosystems, Billedskærervej 15, Denmark) following the supplier's instructions.
2.5. Liquid Chromatography – Tandem Mass Spectrometry
The Evotips columns were deposited on an Evosep One (Evosep Biosystems, Billedskærervej 15, Denmark) coupled to a timsTOF Pro 2 mass spectrometer (“Trapped Ion Mobility Spectrometry – Quadrupole Time of Flight Mass Spectrometer”, Bruker Daltonics) using an EVOSEP Performance column (15 cm x 150 µm, 1.5 µm beads ReproSil-Pur C18, EVOSEP Biosystems, Billedskærervej 15, Denmark). Liquid chromatography was performed using the 30 SPD (“Samples per Day”) mode on all samples. The gradient used was 2% to 35% buffer B (0.1% formic acid in acetonitrile). The results collection was performed using Tims Control 2.0 software (Bruker Daltonics) under 10 PASEF cycles, with a mass range of 100-1,700 m/z, capillary ionization of 1,500 V, and a capillary temperature of 180°C. The TOF frequency was set at 10 kHz with a resolution of 50,000 FWHM.
2.6. Protein Identification and Relative Quantification
The data obtained were analyzed using the MSFragger v4.1 software (Kong et al., 2017) on the Fragpipe v22.0 platform (https://fragpipe.nesvilab.org/) with the “default” workflow, on a data analysis server equipped with 48 cores and 512 GB of RAM. Mass tolerance parameters of precursors from -20 to 20 PPM and mass tolerance of fragments of 40 PPM were used. Within the digestion options, trypsin was used as an enzyme, a specific digestion mode, and a maximum of 2 missed cleavages per peptide. The following post-translational modifications (PTMs) were used: Carbamidomethylation of cysteine, a fixed PTM; methionine oxidation (M); and N-terminal acetylation, as variable PTMs. The database used for identification was the proteome of Equus caballus (UP000002281), which is available at UniProt. The FDR <1% estimation was included using a decoy database. Additionally, a database of common contaminants in mass spectrometry was added for canonical protein identification analysis.
The spectral counts of identified canonical proteins were used to perform differential abundance analysis using the EdgeR R package and the Limma package. Proteins with total spectral counts below 5 counts were excluded, and TMM (Trimmed Mean of M-values) method was used to normalize. Differentially abundant canonical protein analysis was performed by fitting a general linear model with Poisson negative binomial distribution with FDR <0.05. The results were plotted using the Volcano Plot and Heatmap functions in the ggplot2 R package. gProfiler2 R package was used for gene ontology (Biological Process, Cellular Component, Molecular Function and Reactome analysis).
Differentially abundant proteins were analyzed using Gene Ontology (GO) annotation, which included classifications into Biological Process (BP), Cellular Component (CC), and Molecular Function (MF) categories. The KEGG database (http://www.genome.jp/kegg) and the Reactome database (https://reactome.org) were used to categorize the identified proteins into their associated pathways. Additionally, the STRING database was used to examine the protein-protein interaction (PPI) networks, focusing on both physical and functional connections among the selected protein. Additionally, Enrichment Analysis of Fibrosis-Related Protein in Myofibroblasts and Secretome was performed using the FibroAtlas database (http://biokb.ncpsb.org/fibroatlas/).
2.6.1. SILAC-Based Protein Quantification
Protein quantification by SILAC was performed using the IonQuant package (version 1.11.9). Three channels were defined: a “Heavy” channel (K8/R10 for lysine-8 and arginine-10) and a “Light” channel (K0/R0 for unlabeled lysine and arginine). From these isotopic labels, Heavy/Light (H/L) intensity ratios were calculated for each experimental sample, enabling relative quantification of canonical proteins according to their cellular origin.
The quantitative output files generated by FragPipe were imported into R (v4.3.2). We first filtered to retain only proteins annotated to Equus caballus, discarding any duplicates or low-quality samples. Using a custom R script, we extracted the intensities from the Light (K0/R0) and Heavy (K8/R10) channels and computed H/L ratios for every protein in each sample. The resulting data matrix was then reshaped and normalized using quantile normalization via functions in the Limma package (version 3.58.1).
Next, pairwise comparisons between experimental groups were performed by fitting a linear model in Limma and evaluating differential abundance with the eBayes method. Proteins with an adjusted p-value < 0.05 were flagged as differentially abundant. We also produced comprehensive tables listing all quantified canonical proteins, as well as those classified as differentially abundant (adjusted p-value < 0.05).
Finally, information from labeled peptides (modifications: K[+8.0142], R[+10.0083]) was integrated to assign the most likely cellular origin of each signal (eMSC, MYO, or both). This annotation was appended to the final abundance and differential abundance tables.
2.7. Bioinformatics Analysis
The quantified proteins were filtered using the non-parametric Mann–Whitney U-test, corrected for multiple testing using a Benjamini–Hochberg-adjusted p-value ≤ 0.05, and a fold-change (FC) ≥ 0.5 or < -0.5, to further investigate only those statistically significant and altered in fibrosis progression and drug-mediated slowdown. The comparisons made were:
• Secretome at different times: secretome 48 hours (MYO-ET-eMSC+PGE2) vs secretome T0 (ET-eMSC+PGE2).
• Myofibroblast at different times: proteome 48 hours vs proteome T0.
Activities from 2.4 to 2.7 were subcontracted to Melisa Institute, San Pedro de la Paz, Concepción, Chile.
3. Results
3.1. Experiment 1: Analysis of Differential Protein Abundance During Co-Culture of Myofibroblasts with PGE2-Preconditioned ET-eMSC
To investigate the anti-fibrotic response induced in myofibroblasts by interaction with PGE2-preconditioned ET-eMSC, a proteomic analysis was performed using LC-MS/MS. Proteomic profiles were evaluated by collecting samples from the secretomes of ET-eMSC and myofibroblasts at various time points.
For ET-eMSC+PGE2, secretome samples were collected at two time points: at the initial time (secretome 0 hours) and after 48 hours of co-culture with myofibroblasts (secretome 48 hours) (Figure 1). For myofibroblasts, samples were collected before co-culture (proteome 0 hour) and after 48 hours of co-culture with ET-eMSC+PGE2 (proteome 48 hours). This experimental design enabled the analysis and comparison of proteomic changes in both cell populations during interaction using a transwell system.
A total of 4,903 proteins were identified across the four sampling points (n = 3). Protein extraction was performed on the secretome of both ET-eMSC and myofibroblast samples, and the resulting mass spectrometry data were analyzed using the FragPipe computational platform with the MSFragger search engine, employing the Equus caballus reference proteome (UniProt ID: UP000002281) for protein identification.
A Principal Component Analysis (PCA) revealed a clear separation between 0-hour and 48-hour samples in both the secretome of ET-eMSC (Figure 3a) and myofibroblasts (Figure 3b), highlighting distinct biological differences between the two time points.
A total of 3,861 quantifiable proteins were identified in the myofibroblast samples, and 1,410 proteins in the secretome of ET-eMSC samples. In the myofibroblasts, 139 proteins showed significant differential abundance when comparing the proteome at 0 hours and the proteome at 48 hours of co-culture with ET-eMSC. Among these, 79 proteins decreased in abundance (logFC ≤ -0.5, FDR < 0.05), while 60 proteins were increased in abundance (logFC ≥ 0.5, FDR < 0.05), as visualized in the volcano plot diagram in Figure 4a.
For the secretome of ET-eMSC, out of the 1,410 quantifiable proteins, 468 proteins exhibited significant differential abundance after 48 hours of co-culture compared to time zero. Among these, 85 proteins were low abundance (logFC ≤ -0.5, FDR < 0.05), and 383 proteins were increased abundance (logFC ≥ 0.5, FDR < 0.05), as represented in Figure 4b. This analysis highlights the proteomic changes in both myofibroblasts and the secretome of ET-eMSC under co-culture conditions. For total protein counts, proteoforms were included, as some proteoforms are biologically significant. Tables S1 and S2 (Additional Files) provide the lists of differentially abundant proteins.
Additionally, gene functional and physical network reconstruction was performed using STRING to visualize the interactions between low and high abundance proteins in myofibroblasts and the secretome of ET-eMSC under co-culture conditions (Figure 5). The constructed networks for both low and high abundance proteins in myofibroblasts showed significant enrichment of protein-protein interactions compared to random protein sets (p = 1.12 × 10⁻¹¹ and p = 1.33 × 10⁻⁶, respectively). For the secretome of ET-eMSC, the enrichment of low and high abundance proteins was highly significant (p < 10⁻¹⁶).
Differentially abundant proteins were analyzed, revealing that, for low-abundance proteins, 10 significant clusters were identified through protein–protein interaction (PPI) network analysis using MCL clustering. Similarly, 10 significant clusters were also identified among the high-abundance proteins (Table S3, Additional Files). In parallel, analysis of the ET-eMSC secretome revealed 12 clusters among the low-abundance proteins and 78 clusters among the high-abundance proteins (Table S4, Additional Files).
3.1.2. Gene Ontology and Reactome Pathways Enrichment of DAPs in the Secretome of ET-eMSC
To better understand the functions and pathways associated with the DAPs, GO and Reactome pathway enrichment analyses were performed (Figure 6 and Table S5, Additional Files). The study revealed that significantly high-abundance protein were linked to 127 enrichment terms for biological processes (BP). The top 10 most significant GO terms included supramolecular fiber organization, protein folding, actin cytoskeleton organization, extracellular matrix organization, vesicle-mediated transport from the endoplasmic reticulum to the Golgi, cellular detoxification, and regulation of RNA splicing (Figure 6a and Table S5, Additional Files). In contrast, low-abundance proteins were associated with 48 enrichment terms. The top 10 terms were related to the negative regulation of endopeptidase activity, proteolysis, proteins metabolism, catalytic activity, blood coagulation, and supramolecular fiber organization (Figure 6b and Table S5, Additional Files).
In terms of molecular function (MF), the high-abundance proteins were associated with 58 enrichment terms. The top 10 most significant terms included ATP-dependent protein folding chaperones, actin binding, RNA binding, extracellular matrix structural constituents, aminoacyl-tRNA ligase activity, monosaccharide binding, hydrolase activity, actin filament binding, and small molecule binding (Figure 6c and Table S5, Additional Files). Conversely, low-abundance proteins were associated with 13 enrichment terms, which included structural constituents of the skin epidermis, endopeptidase inhibitor activity, peptidase regulator activity, serine-type endopeptidase inhibitor activity, glycosaminoglycan binding, enzyme regulator activity, structural molecule activity, lipid binding, epidermal growth factor receptor activity, and metal ion binding (Figure 6d and Table S5, Additional Files).
For cellular components (CC), high-abundance proteins were enriched in 76 terms, including locations such as the chaperonin-containing T-complex, coated vesicle membranes, vesicle coats, collagen-containing extracellular matrix, basement membrane, endopeptidase complex, actin cytoskeleton, and proteasome accessory complex (Figure 6e and Table S5, Additional Files). In contrast, low-abundance proteins were associated with cellular components such as extracellular space, intermediate filaments, keratin filaments, supramolecular fibers, myofibrils, polymeric cytoskeletal fibers, cornified envelopes, sarcomeres, and the membrane attack complex (Figure 6f and Table S5, Additional Files).
Reactome pathway enrichment analysis revealed that high abundance proteins were involved in 194 enriched terms, which included pathways such as TriC/CCT-mediated protein folding, extracellular matrix organization, neutrophil degranulation, AUF1 (hnRNP D0)-mediated mRNA destabilization, cytosolic tRNA aminoacylation, ER-to-Golgi anterograde transport, regulation of mRNA stability by AU-rich elements, innate immune responses, and cellular stress responses (Figure 6g and Table S5, Additional Files). In contrast, low abundance proteins were associated with 30 enrichment terms, including pathways such as insulin-like growth factor (IGF) transport and uptake by IGFBPs, formation of the cornified envelope, post-translational protein phosphorylation, platelet degranulation, keratinization, fibrin clot formation, platelet activation and aggregation, hemostasis, and regulation of the complement cascade (Figure 6h and Table S5, Additional Files).
All graphics display the top 10 most significant processes or pathways for each analysis, selected based on the lowest FDR values and the highest number of associated proteins (gene count). The size of the circles reflects the number of proteins associated with each term, while the color gradient indicates the level of statistical significance (FDR). These enriched terms highlight biological processes and functional pathways closely linked to cellular interactions during co-culture, facilitating a focused interpretation of the most relevant results.
3.1.2. Gene ontology and Reactome Pathways Enrichment of DAPs in the Myofibroblast
GO analysis comparing myofibroblasts co-cultured for 48 hours with those at 0 hours revealed significant enrichment terms across biological processes, molecular functions, and cellular components (Figure 7 and Table S5, Additional Files). Specifically, 12 significant terms were identified for BP (8 associated with high-abundance proteins and 3 with low-abundance proteins ), 12 for MF (11 linked to high-abundance proteins and 1 to low-abundance proteins ), and 14 for CC (9 related to high-abundance proteins and 5 to low-abundance proteins ).
In BP, the top 10 significant GO terms associated with high-abundance proteins included regulation of multicellular organismal processes, angiogenesis, cell adhesion, cell migration, positive regulation of locomotion, response to organic substances, regulation of cell migration, and positive regulation of cell migration. Conversely, the low-abundance proteins were linked to extracellular matrix organization, circulatory system development, and collagen fibril organization (Figure 7a and b).
For MF, high abundance proteins were associated with glycosaminoglycan binding, heparin-binding, proteoglycan binding, growth factor binding, carbohydrate derivative binding, integrin binding, modified amino acid binding, protein-containing complex binding, signaling receptor binding, syndecan binding, and phosphatidylserine binding. In contrast, the only low-abundance term identified was an extracellular matrix structural constituent.
In CC, high-abundance proteins were enriched in the extracellular region, cell surface, cell periphery, extracellular space, extracellular matrix, plasma membrane, endomembrane system, cytoplasmic vesicle, and nuclear envelope lumen. For the low-abundance proteins, the enriched terms included fibrillar collagen trimer, collagen-containing extracellular matrix, collagen trimer, extracellular matrix, and basement membrane.
Reactome pathway analysis identified 14 enriched pathways for low-abundance proteins, including non-integrin membrane-ECM interactions, assembly of collagen fibrils and other multimeric structures, ECM proteoglycans, collagen degradation, extracellular matrix degradation, collagen chain trimerization, signaling by PDGF, extracellular matrix organization, collagen formation, and integrin cell surface interactions. Notably, no significant Reactome-enriched pathways were identified for proteins with increased abundance (Figure 7g and Table S5, Additional Files).
3.1.3. Enrichment Analysis of Fibrosis-Related Proteins in Myofibroblasts and Secretome of ET-eMSC
Enrichment analysis was conducted using the fibrosis-related gene list from Liu et al, to analyze proteins involved in fibrosis regulation (Liu et al., 2019). Quantifiable proteins were examined in both myofibroblasts and culture supernatant (secretome) of ET-eMSC samples. In the secretome of ET-eMSC, 137 fibrosis-related proteins were identified, with 33 showing increased and 15 exhibiting decreased abundance (Table S, Additional Files). In myofibroblasts, 212 proteins associated with fibrotic processes were identified using the FibroAtlas database, among which 11 were significantly low abundance, and 9 were high abundance (Table S7, Additional Files).
The abundance of identified fibrotic proteins in the secretome of ET-eMSC and myofibroblasts under experimental conditions was analyzed using an assembly algorithm, which revealed two distinct branches: A (high abundance proteins) and B (low abundance proteins) (Figure 8). This algorithm also allowed the visualization of protein abundance changes in response to the interaction between myofibroblasts and ET-eMSC+PGE2 at both myofibroblast and secretome levels.
The heatmap (Figure 8a) depicted the abundance profiles of differentially abundant fibrosis-related proteins in myofibroblast samples at two points: 0 hours (Myo.0H) and 48 hours (Myo.48H) of co-culture with ET-eMSC+PGE2. The color scale highlighted abundance changes, with red indicating high abundance proteins, green representing low abundance proteins, and black showing minimal or no change. Hierarchical clustering revealed two distinct clusters. Cluster 1, in the left panel, consisted of proteins predominantly increased abundance at 48 hours, such as Thrombospondin 1(THBS1), Prostaglandin G/H synthase 2(PTGS2), Platelet-derived growth factor receptor alpha (PDGFRα), Matrix metallopeptidase 14 (MMP14), Clusterin alpha chain (CLU), Plasminogen activator (PLAT), Cellular communication network factor 2 (CCN2/CTGF), and Gap junction protein (GJA1), all associated with pro-fibrotic processes. Conversely, Cluster 2 showed a significant reduction in proteins such as collagen type I alpha1 and 2 (COL1A1, COL1A2), and collagen type III alpha1 (COL3A1) at 48 hours of co-culture, confirming the PCR results. Additionally, significant decreases were observed in Matrix metallopeptidase (MMP1), Prostacyclin synthase (PTGIS), Signal transducer and activator of transcription (STAT3), Forkhead box protein O1(FOXO1), and C-X-C motif chemokine 6 (CXCL6) levels.
The heatmap (Figure 8b) presents the analysis of differentially abundant proteins in secretome samples from ET-eMSC preconditioned with PGE2 (eMSC.0H) and after 48 hours of co-culture with myofibroblasts (eMSC.48H). Hierarchical clustering revealed two distinct clusters, with high-abundance proteins displayed in red and low-abundance proteins in green.
In the eMSC.0H group, proteins involved in complement and coagulation cascade pathways, such as C5, C6, and F5, were highly abundant. However, after 48 hours of co-culture (eMSC.48H), these proteins exhibited a notable decrease in abundance, indicating reduced protein levels. Conversely, proteins such as MMP-9, MMP-1, and MMP-14, involved in collagen catabolic processes, as well as Sarcoglycan alpha (SGCA), Lysyl oxidase homolog (LOXL2), junctional adhesion molecule A (F11R), CCN2, PLAT, Urokinase-type plasminogen activator (PLAU), and Interleukin-8 (CXCL8), related to cell migration, and others like Gelsolin (GSN), FERM domain containing kindlin 2 (FERMT2), and Arp2/3 complex 34 kDa subunit (ARPC2), associated with actin filament organization, were significantly increased in abundance. These findings indicated a dynamic response of the secretome of ET-eMSC during its interaction with myofibroblasts.
3.2. Experiment 2: SILAC Proteomic Analyses of Myofibroblasts Co-Cultured with Equine Endometrial-Derived MSCs (ET-eMSCs) Preconditioned with PGE₂ Reveal Bidirectional Interchange Transfer of Proteins
To investigate the contribution of each cell type to the general secretome, an assay was designed using stable isotope labeling by amino acids in cell culture (SILAC). This assay allowed us to distinguish the origin of proteins in the secretome based on the molecular weight of the light or heavy amino acid used during the growth of each cell culture. For this study, a group of ET-eMSCs that had not been preconditioned with PGE₂ was included (Figure 2).
Fibroblasts were cultured in media containing heavy isotopologues of lysine, and ET-eMSC were cultured in media containing heavy isotopologues of arginine to allow for >98.5% incorporation (Figure S1, Additional Files). Liquid chromatography-tandem mass spectrometry (LC-MS/MS) enabled the identification of heavy-labeled proteins within the secretome of co-cultures and individual secretomes for Myofibroblasts and ET-eMSC. (Figure 9 and Table S8, Additional Files)
In the T0EMSC versus T0MYO comparison, 433 proteins were quantified, of which 26 were found to be significantly high in abundance. For the 48hSPGE₂ versus T0MYO contrast, 415 proteins were quantified, and 77 exhibited significant changes. In the 48hSPGE₂ versus T0EMSC analysis, a total of 689 proteins were quantified, and 75 were significantly regulated. The 48hPGE₂ versus T0MYO contrast yielded 361 quantified proteins, with 76 displaying significant regulation. In the 48hPGE₂ versus T0EMSC comparison, 506 proteins were quantified, and 39 were found to be substantial. Finally, the 48hPGE₂ versus 48hSPGE₂ contrast demonstrated 511 quantified proteins, with 37 showing statistically significant differences.
After identifying the proteins present in the secretomes of the different experimental groups, we conducted a targeted analysis of those proteins that had previously been associated with modulating the fibrotic process. The focus was placed on MMPs, their inhibitors, cytokines, and fibrosis markers, as indicated in Table 1. We also included proteins that, although not differentially abundant in the previous experiment, held significant biological relevance (labeled “equal” in Table 1).
Notably, MMP-1, MMP-2, and MMP-9 were detected across all groups and were traced to both ET eMSCs and myofibroblasts, whereas MMP14 appeared in the 48 h PGE₂ and 48 h sPGE₂ groups and T0MYO, but not in T0MSC. TIMP1 and TIMP2, as well as THBS1 and THBS2, were present in all samples and were attributed to both cell types.
The matrix-remodeling protein MXR5 was detected in the 48 h PGE₂, 48 h sPGE₂, and T0MYO groups from both populations, whereas MXR8 was exclusive to the 48 h PGE₂ and 48 h sPGE₂ groups and originated only from ET eMSCs. The chemokines CXCL6 and CXCL8 were identified in the secretomes of the 48-hour PGE₂ and 48-hour sPGE₂ groups, with CXCL6 also appearing in T0MYO. CXCL6 was secreted solely by myofibroblasts, whereas CXCL8 originated from both ET eMSCs and myofibroblasts.
Finally, fibrosis markers CCN2 and TGF-β1 were detected in the 48-hour sPGE₂ secretome and myofibroblast samples, with both being produced by both cell populations. This SILAC-based approach allowed precise protein attribution and enabled a comprehensive evaluation of the cellular interactions underlying the fibrotic phenotype.
4. Discussion
The present study shows the intricate molecular dialogue between endometrial myofibroblasts and equine endometrium-derived mesenchymal stem cells in an in vitro model. It evaluates the potentialities of ET-eMSC preconditioned with PGE2 and their secretome for the treatment of endometrosis.
Label-free quantitative proteomic analysis revealed significant modulation of fibrosis-associated markers in myofibroblasts upon co-culture with PGE2-preconditioned ET-eMSC, which supports the hypothesis that paracrine interactions mediate a bidirectional regulatory mechanism. This crosstalk not only promoted antifibrotic signaling in myofibroblasts but also reinforced the therapeutic potential of the ET-eMSC secretome, as previously demonstrated by our research group [17,18,25,26]
The functional and physical gene network reconstruction using the STRING tool enables a comprehensive visualization of the interrelationships among proteins whose abundance was altered in response to the interaction between myofibroblasts and ET-eMSCs preconditioned with PGE2 under co-culture conditions. This methodology provides solid evidence of the organization and degree of interconnection between the different protein components involved in the pathogenesis of endometrosis in mares [27].
In the in vitro model for inducing the myofibroblastic phenotype, stimulation with TGF-β, TNF-α, IL-6, and IL-1β was employed. TGF-β, in particular, was found to play a crucial role in inducing the transition from fibroblasts to myofibroblasts via activation of canonical (Smad2/3) and non-canonical (MAPK, PI3K/AKT, Rho/ROCK, YAP/TAZ) pathways, promoting the abundance of α-SMA, collagens, and other extracellular matrix components [28,29,30]. This differentiation toward the myofibroblastic phenotype was associated with excessive deposition of extracellular matrix proteins and the tissue stiffness characteristic of endometrial fibrosis [31,32,33].
When endometrial myofibroblasts were co-cultured with PGE₂-preconditioned ET-eMSCs for 48 hours, an attenuation of fibrosis was observed, which was associated with a significant inhibition of fibrillar matrix proteins (COL1A1, COL1A2, COL3A1, COL5A1, COL2A1, COL7A1) and their scaffolds (fibronectin, versican). This finding was deemed highly relevant because previous studies had associated high extracellular matrix deposition and accumulation in endometrial tissue, particularly surrounding endometrial glands and fibrous nests, with loss of secretory function and exacerbation of the fibrotic process [34,35,36,37,38,39]. In addition, at the myofibroblast level, an increase was observed in enzymes and modulatory proteins responsible for controlled matrix remodeling and degradation (MMP-14, PLAT, CTSK [cathepsin K]) as well as factors that reinforced the antifibrotic signal (COX-2/PTGS2).
Although the role of MMP14 in the development of endometrosis had not been described in detail, it had been reported that MMP-14 not only degraded type I collagen directly but also activated pro-MMP-2 and pro-MMP-9, thereby amplifying the pericellular degradation of the extracellular matrix [34,40]. Meanwhile, PLAT was shown to convert plasminogen into plasmin, a serine protease capable of degrading fibrin and various extracellular matrix components, as well as activating pro-MMPs such as MMP2 and MMP9 [41,42]. In contrast, CTSK (cathepsin K) was found to operate primarily in acidic lysosomal compartments and the acidic pericellular environment, degrading type I and III collagen fibers with high efficiency, particularly in mineralized or pathological tissues [43]. The activation of plasmin by PLAT was thought to facilitate the conversion of pro-MMP14 and other pro-MMPs, thereby enhancing their cooperation at the pericellular cortex. In contrast, CTSK acted on resistant collagen fragments, completing the clearance of residual matrix. In fibrotic tissues, the combined elevation of MMP14 and PLAT was observed to accelerate the dissolution of collagen and fibrin, thereby paving the way for cell migration and regeneration. This process was followed by CTSK, which was responsible for the degradation of persistent collagen fragments [44]. Another important finding was that a significant decrease in MMP1 levels was observed in the myofibroblasts after 48 hours of co-culture with PGE₂-preconditioned ET-eMSCs, which may have been associated with the reduction in collagen concentration values.
Previous work has demonstrated that PGE₂ can reverse TGFβ₁–induced myofibroblast differentiation, resulting in a significant, dose- and time-dependent decrease in collagen I mRNA and protein in lung, skin, and dermal fibroblast systems [45,46]. In dermal fibroblasts treated with TGF-β₁, PGE₂ reduced scar-related collagen synthesis through EP₂–cAMP signaling and by shifting the MMP/TIMP balance. Likewise, in aged skin organ cultures, elevated levels of PGE₂ were correlated with a diminished abundance of procollagen I [47,48]. Similar antifibrotic effects on collagen accumulation have been reported in tendon fibroblasts and fibrotic rat liver slices [49].
Our results revealed that the abundance of profibrotic signaling mediators, specifically STAT3 and FOXO1, decreased. STAT3 is a well-known downstream effector of TGF-β and IL-6 that drives the myofibroblastic phenotype; its transcriptional inhibition contributed to reduced fibrogenic activation [50,51]. These findings support the idea that PGE₂ modulates TGF-β₁ signaling indirectly via second messengers. By attenuating STAT3 activity, PGE₂ interrupted the subsequent transcription of profibrotic and proliferative genes, positioning PGE₂ as a negative feedback regulator within JAK/STAT-driven fibrotic pathways. Consistent with this, Lee et al. reported that PGE₂ directly suppressed STAT3 activity in breast cancer cells and xenograft models [52].
Alternatively, FOXO1 functions as a transcription factor that enhances TGF-β₁–driven profibrotic signaling in fibroblasts; its downregulation further reinforced the blockade of intracellular profibrotic signals. Previous studies have also demonstrated that PGE₂-triggered Akt dephosphorylation events regulate FOXO family members, confirming that PGE₂ represses FOXO1 function via posttranslational modification and thereby reduces FOXO1-driven transcriptional programs [53,54]. In models where FOXO1 was inhibited or genetically deleted in fibroblasts, a marked decrease in extracellular matrix deposition, α-SMA abundance, and tissue stiffness was observed, highlighting FOXO1 as a promising target for antifibrosis [55].
In turn, JAK1 was found to be upregulated, acting as a mediator of profibrotic cytokine signaling (particularly downstream of IL-6 and TGF-β) to activate fibroblasts and promote extracellular matrix deposition [56]. However, within the context of our assay, its activation may have been associated with feedback pathways that modulated the EP receptor–cAMP/PKA antiproliferative axis in fibroblasts, particularly when accompanied by a significant increase in Prostaglandin-endoperoxide synthase 2 (PTGS2/COX-2) production. PTGS2 was identified as the rate-limiting enzyme in PGE₂ synthesis and was responsible for catalyzing prostaglandin production, thereby reinforcing the antifibrotic loop by amplifying the PGE₂ signal [57]. This loop illustrates how the positive regulation of JAK1 and PGE₂ production interacts to fine-tune STAT3 and FOXO1 activities, with potential implications for controlling fibrotic progression through targeted modulation of these signaling nodes.
That's why we hypothesize that upregulation of JAK1 enhances prostaglandin E₂ (PGE₂) synthesis via STAT3-mediated induction of PTGS2, while elevated PGE₂ feeds back to suppress STAT3 signaling and attenuate FOXO1 activity through distinct posttranslational mechanisms. Together, these dynamics established a regulatory loop in which JAK1 was upregulated, driving PGE₂ up, and PGE₂, in turn, downregulated STAT3 and FOXO1.
After 48 hours of coculture, lumican (LUM), thrombospondin-1 (THBS1), CCN1, and CCN2 were markedly overabundant in myofibroblast samples, indicating that the extracellular matrix had been reorganized into a more orderly and less rigid structure. Lumican regulated the diameter and spacing of type I collagen fibrils, thereby preventing their aggregation into thick bundles and maintaining a balanced fibrillar network [58,59]. Thrombospondin-1 activates the latent form of TGF-β and, through its binding to matrix metalloproteases such as MMP-14, enables the focal anchoring of these enzymes within the matrix, thereby promoting controlled, less pathological remodeling [60].
Although CCN1 and CCN2 have been classically associated with profibrotic activity, they were also implicated in matrix degradation and angiogenesis [61]. CCN1 was found to induce MMP-1 abundance, leading to the fragmentation of collagen fibrils and the reconfiguration of the fibrillar network [62]. In a regulated context such as the secretome derived from MSCs preconditioned with PGE₂ this localized effect could effectively dismantle excess collagen and reduce tissue stiffness Meanwhile, CCN2, whose abundance was upregulated by TGF-β, functioned as a cofactor that amplified profibrotic signaling, stimulating myofibroblast activation, cellular proliferation, and collagen deposition, as previously studied [63,64].
It seems plausible that the antifibrotic effect observed in myofibroblast samples co-cultured for 48 hours with ET-eMSCs preconditioned with PGE2 is mediated by molecules secreted into the culture medium, and that there is a bidirectional exchange between the two cell types. Differentially abundant proteins related to fibrotic processes were identified at the secretome level.
In the secretome samples, a decreased abundance was observed for proteins involved in extracellular matrix scaffolding and fibrotic markers (such as periostin and cartilage oligomeric matrix protein [COMP]), as well as proteins associated with cytoskeletal dynamics and cellular stress responses (including gelsolin, heat shock protein β1, and myosin heavy chains). The reduction in Periostin and COMP suggests the dismantling of rigid extracellular matrix (ECM) bridges [65,66,67]. Likewise, lower levels of coagulation factors and complement components may indicate a less inflammatory and less thrombogenic milieu. The downregulation of cytoskeletal and stress-related proteins implied that myofibroblast activation pathways were probably attenuated.
The high abundance protein in the secretome were related to several functional groups: matricellular organizers (Tenascin-C, Fibrillin-1 [two proteoforms ], CCN2/CTGF, Dermatopontin); matrix proteases and their regulators (MMP-1, MMP-9, MMP-14, Urokinase-type plasminogen activator [PLAU], and its Inhibitor PAI-1 [SERPINE1]); collagen-modifying enzymes (Procollagen-lysine 5-dioxygenase, Lysyl oxidase); antioxidant and homeostatic factors (Superoxide dismutase, Catalase, Arachidonate 12-lipoxygenase); cell adhesion and cytoskeletal remodelers (Integrin α3, Kindlin-2, the Arp2/3 complex, JAM-A); growth-factor modulators and chemokines (IGFBP-5, CXCL6, CXCL8, Stanniocalcin-1)
At the secretome level, matrix-associated proteins reshaped the extracellular matrix scaffold to favor elasticity and maintain controlled stiffness. Tenascin-C has been shown to modulate the ECM architecture and mechanotransduction, thereby preventing excessive rigidity by influencing fibroblast behavior in fibrotic contexts [68,69]. Fibrillin assemblies impart elasticity and resilience to connective tissues while sequestering growth factors that regulate ECM remodeling [70]. CCN2 (connective tissue growth factor) functioned as a versatile matricellular factor, regulating adhesion, proliferation, and ECM synthesis in a context-dependent manner and thereby influencing matrix organization without invariably driving uncontrolled stiffening. Dermatopontin regulates collagen and fibronectin fibrillogenesis, promoting balanced fibril formation that supports tissue plasticity rather than pathological stiffening [71].
Our results showed that proteases and their regulators form a finely tuned degradative network that enables localized collagen breakdown in myofibroblasts without excessive matrix loss. Specifically, matrix metalloproteases such as MMP-1, MMP-9, and MMP-14, along with the urokinase-type plasminogen activator system (uPA/PLAU) and its inhibitor, PAI-1 (SERPINE1), play central roles in regulating ECM turnover in fibrotic models. Their coordinated abundance limits pathological collagen accumulation while preventing unchecked degradation. Likewise, the balance between plasminogen activators and PAI-1 maintains tissue homeostasis by regulating plasmin- and MMP-mediated proteolysis, with dysregulation leading to either fibrosis or excessive matrix loss, depending on the context, as reported by other authors [72,73].
The upregulation of chemokines CXCL6 and CXCL8 was observed in the secretome obtained after 48 hours of coculture between Myofibroblasts and ET-eMSc preconditioning with PGE2. CXCL6 had been shown to recruit neutrophils and modulate immune cell trafficking in inflammatory settings, and its neutralization had reduced lung inflammation and fibrosis in experimental models [74]. CXCL8 was implicated in recruiting neutrophils and monocytes to fibrotic lesions and in promoting fibroblast activation via CXCR1/2 signaling. Elevated CXCL8 levels were reported in pulmonary and bone marrow fibrosis and were associated with disease progression [75]. Thus, the observed increase in CXCL6 and CXCL8 supported a modulatory role in the fibrotic process, consistent with prior findings that these chemokines were upregulated in fibrotic microenvironments.
During Experiment 1, a comparative analysis of the proteomic profile of matrix metalloproteinases (MMPs) and the profile detected in the secretome obtained after 48 hours of co-culture of myofibroblasts and ET-eMSCs in a Transwell system was performed. This analysis revealed a differential modulation of MMPs in the secretome compared to the proteome, accompanied by a significant reduction in type I and type III collagen concentrations in myofibroblasts. At the same time, a restructuring of the extracellular matrix (ECM) and alterations in the cytoskeletal organization of the myofibroblasts were observed, indicating that the secretome derived from the co-culture influenced the recovery of tissue homeostasis in the experimental model.
Previous studies in our laboratory have demonstrated that incubating adipose tissue-derived mesenchymal stem cells (AT-eMSCs) with TGF-β1 for 24 hours induces the acquisition of a pro-fibrotic phenotype, associated with a decrease in the production of the anti-fibrotic prostanoid PGE₂ [18]. Based on this background, we aimed to evaluate the effect of ET-eMSCs in a fibrotic context to determine whether these cells had contributed to perpetuating the fibrotic state or, conversely, had exerted an anti-fibrotic modulatory effect upon interacting with equine endometrial myofibroblasts.
The results obtained in the present study demonstrated that ET-eMSCs preconditioned with PGE₂ induced partial reversal of the myofibroblastic phenotype. Specifically, the secretome of PGE₂-preconditioned ET-eMSCs contained soluble factors that attenuated the abundance of pro-fibrotic markers in myofibroblasts and promoted a phenotype characterized by reduced contractile capacity and decreased synthesis of fibrotic extracellular matrix. Reciprocally, the myofibroblasts secreted mediators that enhanced immunomodulatory functions and viability maintenance in PGE₂-preconditioned ET-eMSCs. This bidirectional paracrine modulation mechanism suggests the existence of a dynamic crosstalk that has favored the restoration of endometrial homeostasis in the co-culture model, which has not been described for endometrial fibrosis to date.
The use of SILAC was instrumental in this study, as it enabled the precise differentiation of the cellular origin of secreted proteins within our co-culture model. By metabolically encoding ET-eMSCs and myofibroblasts with distinct light and heavy isotopic amino acids, it was possible to trace and quantify the origin of each protein in the shared secretome. This approach provided superior quantitative accuracy and reproducibility compared to traditional or label-free proteomics techniques. Consequently, SILAC facilitated a rigorous, cell-specific analysis of proteolytic enzymes, inhibitors, cytokines, and matrix remodeling markers -key components of the fibrotic phenotype, thereby significantly enhancing the depth and reliability of our results.
By employing SILAC, it was confirmed that MMP-1, MMP-2, and MMP-9 were produced by both ET eMSCs and myofibroblasts, in agreement with the findings from Experiment 1. This result was particularly significant because it demonstrated that endometrial myofibroblasts secreted MMP-14, highlighting its potential role in activating other MMPs and sustaining tissue homeostasis. Likewise, the metalloproteinase inhibitors TIMP-1 and TIMP-2 were detected under all experimental conditions, reinforcing their essential role in regulating proteolytic activity. The presence of thrombospondins THBS1 and THBS2 across all cell groups further corroborated their classical function in mediating cell–cell and cell–matrix communication [76].
Regarding matrix-remodeling proteins, MXRA5 and MXRA8 displayed distinct abundance patterns: MXRA5 was identified in the 48 h PGE₂, 48 h sPGE₂, and T0MYO groups and was secreted by both cell types, consistent with its documented role in ECM assembly, collagen organization, and anti-inflammatory and anti-fibrotic functions [77,78]. Conversely, MXRA8 was found exclusively in the 48-hour PGE₂ and 48-hour sPGE₂ groups and was produced solely by ET eMSCs, what is in line with its known function in cellular adhesion and ECM remodeling (Ichihara et al., 2022; Xu et al., 2022). Chemokine CXCL6 was observed only in the secretomes of myofibroblasts from the 48 h PGE₂, 48 h sPGE₂, and T0MYO groups, suggesting a specific induction linked to the myofibroblast phenotype, which corroborates previous reports [79,80]. In contrast, CXCL8 was detected in both cell types under the same conditions, supporting its pro-inflammatory role and potential involvement in the activation of myofibroblasts.
The results for CCN2 (CTGF) were inconsistent when compared to those from Experiment 1, as this protein was not detected in the 48-hour PGE₂-conditioned secretome samples during the SILAC-based Experiment 2. Nevertheless, CCN2 was identified in the time-zero myofibroblast secretome and in the 48-hour sPGE₂ secretome, where it was secreted by both cell types. This discrepancy represents a limitation of our study, given that the 48-hour PGE₂-conditioned group was expected to yield results comparable to those obtained in Experiment 1 for the corresponding time point. Finally, TGF β1 was detected only in the 48 h sPGE₂ secretome and not in the T0MYO, 48 h PGE₂, or ET eMSC samples, which supported the anti-fibrotic effect of PGE₂ by inhibiting TGF β1 signaling. Its absence in T0MYO additionally suggested that TGF β1 release occurred in intermittent pulses rather than continuously, consistent with previous observations of its episodic secretion and long-lasting biological impact [81].
5. Conclusions
Together, these observations supported a model in which PGE₂-primed ET-eMSCs in co-culture induced myofibroblasts to adopt a secretory profile that coordinated ECM ¨softening¨ through balanced degradation and deposition, antioxidant protection, cytoskeletal adaptability, and regulated growth factor signaling, thus favoring resolution over the progression of fibrosis.
Supplementary Materials
The following supporting information can be downloaded at the website of this paper posted on Preprints.org, Figure S1: Distribution of the number of proteins quantified; Table S1: DAPs in Myofibroblasts; Table S3 and S4: Cluster; Table S5: Cluster GO; Table S6 and S7: DAP fibrotic; Table S8: Silac complete mapping with intensities
Author Contributions
Lidice Méndez- Pérez: Conceptualization, Data curation, Investigation, Methodology, Writing – original draft. Yat Set Wong: Data curation, Investigation, Methodology Writing, review & editing. Belén O. Ibáñez: Investigation, Methodology. Ioanna Martinez: investigation, Writing, review & editing. Lleretny Rodríguez- Alvarez: Conceptualization, Funding acquisition, Supervision, Writing – review & editing. Fidel O. Castro: Funding acquisition, Methodology, Resources, Supervision, Validation, Writing – review & editing, Conceptualization, Data curation, Formal analysis. All authors have read and agreed to the published version of the manuscript.
Funding
This study was funded by FCYT REGULAR 1210349 and ANID grant No. 21201557
Institutional Review Board Statement
The study was conducted in accordance with the Declaration of Helsinki and approved by the Institutional Ethics Committee) of FACULTY OF VETERINARY SCIENCES, UNIVERSIDAD DE CONCEPCION (protocol code CEBB 907-2021; APRIL 2021).”
Informed Consent Statement
Not applicable
Data Availability Statement
Data available upon direct request to the authors
Conflicts of Interest
The authors declare no conflicts of interest
Abbreviations
The following abbreviations are used in this manuscript:
| 48hPGE₂ | 48 hours with PGE2 (contextual) |
| AAM | Antibiotic-Antimycotic Solution |
| Akt | Proteins Kinase B (PKB) |
| Arg | Arginine |
| ARPC2 | Arp2/3 complex 34 kDa subunit |
| AT-eMSCs | Adipose tissue-derived mesenchymal stem cells |
| AU-rich elements | Elementos ricos en adenina y uracilo |
| AUF1 | AU-rich element RNA-binding factor 1 (hnRNP D0) |
| BP | Biological Process |
| C5 | Complement component 5 |
| C6 | Complement component 6 |
| cAMP | Cyclic adenosine monophosphate |
| CC | Cellular Component |
| CCN1 | Cellular Communication Network Factor 1 |
| CCN2 | Cellular Communication Network Factor 2 |
| CCN2/CTGF | Cellular communication network factor 2 / Connective Tissue Growth Factor |
| CLU | Clusterin alpha chain |
| CO₂ | Dióxido de carbono |
| COL1A1 | Collagen type I alpha 1 |
| COL2A1 | Collagen type II alpha 1 |
| COL3A1 | Collagen type III alpha 1 |
| COL5A1 | Collagen type V alpha 1 |
| COL7A1 | Collagen type VII alpha 1 |
| COMP | Cartilage oligomeric matrix protein |
| COX-2/PTGS2 | Cyclooxygenase-2 / Prostaglandin-endoperoxide synthase 2 |
| CTGF | Connective Tissue Growth Factor |
| CTSK | Cathepsin K |
| CXCL6 | C-X-C motif chemokine 6 |
| CXCL8 | C-X-C motif chemokine 8 |
| DAPs | Differentially Abundant Proteins |
| DMEM | Dulbecco's Modified Eagle Medium |
| DTT | Dithiothreitol |
| ECM | Extracellular Matrix |
| EDTA | Ethylenediaminetetraacetic acid |
| eMSC.0H | ET-eMSC preconditioned with PGE2 (contextual) |
| eMSC.48H | ET-eMSC after 48 hours of co-culture with myofibroblasts (contextual) |
| eMSCs | equine MSCs |
| EP₂ | Prostaglandin E₂ receptor subtype 2 |
| ER-to-Golgi | Endoplasmic Reticulum to Golgi |
| ET-eMSC | Equine endometrium-derived mesenchymal stem cells |
| ET-eMSCs | Equine mesenchymal stem cells derived from endometrial tissue |
| ET-eMSCs | equine endometrial-derived MSCs |
| F11R | Junctional adhesion molecule A |
| F5 | Factor V |
| FBS | Fetal Bovine Serum |
| FC | Fold-Change |
| FDR | False Discovery Rate |
| FDR | False Discovery Rate |
| FERMT2 | FERM domain containing kindlin 2 |
| FOXO1 | Forkhead box protein O1 |
| FWHM | Full Width at Half Maximum |
| GJA1 | Gap junction protein |
| GO | Gene Ontology |
| GSN | Gelsolin |
| h | hour(s) |
| H/L | Heavy/Light (ratio) |
| HEPES | 4-(2-hydroxyethyl)-1-piperazineethanesulfonic acid |
| hnRNP D0 | Heterogeneous Nuclear Ribonucleoprotein D0 |
| HPLC | High-Performance Liquid Chromatography |
| IGF | Insulin-like Growth Factor |
| IGFBPs | IGF Binding Proteins |
| IL-1β | Interleukin-1 beta |
| IL-6 | Interleukin-6 |
| JAK/STAT | Janus Kinase/Signal Transducer and Activator of Transcription |
| JAK1 | Janus Kinase 1 |
| K0/R0 | Unlabeled lysine/arginine (SILAC labels) |
| K8/R10 | Lysine-8/Arginine-10 (SILAC labels) |
| KEGG | Kyoto Encyclopedia of Genes and Genomes |
| LC-MS/MS | Liquid Chromatography Tandem-Mass Spectrometry |
| logFC | Logarithm of Fold Change |
| LOXL2 | Lysyl oxidase homolog 2 |
| LUM | Lumican |
| Lys | Lysine |
| m/z | Masa por carga (mass-to-charge ratio) |
| MAPK | Mitogen-Activated Protein Kinase |
| MCL | Markov Clustering |
| MF | Molecular Function |
| MMP-1 | Matrix metalloproteinase--1 |
| MMP-14 | Matrix metalloproteinase -14 |
| MMP-2 | Matrix metalloproteinase -2 |
| MMP-9 | Matrix metalloproteinase -9 |
| MMP/TIMP | Matrix metalloproteinase /Tissue Inhibitor of metalloproteinases |
| MMPs | Matrix metalloproteinase |
| mRNA | messenger RNA |
| MS | Mass Spectrometry |
| MSCs | Mesenchymal Stem Cells |
| MXR5 | Matrilysin 5 |
| MXR8 | Matrilysin 8 |
| MXRA5 | Matrix Remodeling Associated 5 |
| MXRA8 | Matrix Remodeling Associated 8 |
| MYO-ET-eMSC | Myofibroblasts co-cultured with ET-eMSCs (contextual) |
| Myo.0H | Myofibroblast samples at 0 hours (contextual) |
| Myo.48H | Myofibroblast samples at 48 hours (contextual) |
| NaCl | Cloruro de sodio |
| PAI-1/SERPINE1 | Plasminogen Activator Inhibitor-1 / Serpin Family E Member 1 |
| PBS | Phosphate-Buffered Saline |
| PCA | Principal Component Analysis |
| PCR | Polymerase Chain Reaction |
| PDGF | Platelet-Derived Growth Factor |
| PDGFRα | Platelet-derived growth factor receptor alpha |
| PGE₂ | Prostaglandin E₂ |
| PI3K/AKT | Phosphoinositide 3-kinase/Protein Kinase B |
| PKA | ProteinKinase A |
| PLAT | Plasminogen activator, urokinase-type |
| PLAU | Urokinase-type plasminogen activator |
| PPI | Protein-ProteinInteraction |
| PPM | Parts per million |
| PTGIS | Prostacyclin synthase |
| PTGS2 | Prostaglandin G/H synthase 2 |
| PTM | Post-Translational Modifications |
| Rho/ROCK | Rho-associated protein kinase |
| SGCA | Sarcoglycan alpha |
| SILAC | Stable isotope labeling by amino acids in cell culture |
| SPD | Samples per Day |
| sPGE₂ | Sin PGE₂ (referring to conditioned medium without PGE₂) (contextual) |
| STAT3 | Signal transducer and activator of transcription 3 |
| T0EMSC | ET-eMSCs at time zero (contextual) |
| T0MYO | Myofibroblasts at time zero (contextual) |
| TGF-β | Transforming Growth Factor-beta |
| THBS1 | Thrombospondin-1 |
| THBS2 | Thrombospondin 2 |
| TIMP-1 | Tissue Inhibitor of Metalloproteinase-1 |
| TIMP-2 | Tissue Inhibitor of Metalloproteinase-2 |
| TMM | Trimmed Mean of M-values |
| TNF-α | Tumor Necrosis Factor-alpha |
| TriC/CCT | TCP-1 Ring Complex / Chaperonin Containing TCP-1 |
| uPA | Urokinase-type plasminogen activator |
| YAP/TAZ | Yes-associated protein/Transcriptional coactivator with PDZ-binding motif |
| α-SMA | α-smooth muscle actin |
| µL | microliters |
| μM | micromolar |
References
- Trundell, D.A. Mare Can Teach Us When Dealing. Endometriosis: Recent Advances, New Perspectives and Treatments, 2022; 133. [Google Scholar]
- Buczkowska, J.; Kozdrowski, R.; Nowak, M.; Raś, A.; Mrowiec, J. Endometrosis--Significance for Horse Reproduction, Pathogenesis, Diagnosis, and Proposed Therapeutic Methods. Pol J Vet Sci 2014, 17, 547–554. [Google Scholar] [CrossRef]
- Hanada, M.; Maeda, Y.; Oikawa, M.A. Histopathological Characteristics of Endometrosis in Thoroughbred Mares in Japan: Results from 50 Necropsy Cases. J Equine Sci 2014, 25, 45–52. [Google Scholar] [CrossRef]
- Hoffmann, C.; Ellenberger, C.; Mattos, R.C.; Aupperle, H.; Dhein, S.; Stief, B.; Schoon, H.-A. The Equine Endometrosis: New Insights into the Pathogenesis. Anim Reprod Sci 2009, 111, 261–278. [Google Scholar] [CrossRef]
- Eckes, B.; Zigrino, P.; Kessler, D.; Holtkotter, O.; Shephard, P.; Mauch, C.; Krieg, T. Fibroblast-Matrix Interactions in Wound Healing and Fibrosis. Matrix Biol 2000, 19, 325–332. [Google Scholar] [CrossRef]
- Ferreira-Dias, G.; Rebordão, M.R.; Galvão, A.M.; Roberto-da-Costa, R.; Amaral, A.; Fernandes, C.; Pinto-Bravo, P.; Morazzo, S.; Alexandre-Pires, G.; Lukasik, K. What Goes Wrong from a Mare Healthy Endometrium to Endometrosis?; Springer, 2020; pp. 528–540.
- Rebordao, M.R.; Galvao, A.; Szostek, A.; Amaral, A.; Mateus, L.; Skarzynski, D.J.; Ferreira-Dias, G. Physiopathologic Mechanisms Involved in Mare Endometrosis. Reprod Domest Anim 2014, 49 Suppl 4, 82–87. [Google Scholar] [CrossRef]
- Gerarduzzi, C.; Di Battista, J.A. Myofibroblast Repair Mechanisms Post-Inflammatory Response: A Fibrotic Perspective. Inflamm Res 2017, 66, 451–465. [Google Scholar] [CrossRef]
- Hinz, B.; Phan, S.H.; Thannickal, V.J.; Galli, A.; Bochaton-Piallat, M.L.; Gabbiani, G. The Myofibroblast: One Function, Multiple Origins. Am J Pathol 2007, 170, 1807–1816. [Google Scholar] [CrossRef]
- Shinde, A.V.; Humeres, C.; Frangogiannis, N.G. The Role of Alpha-Smooth Muscle Actin in Fibroblast-Mediated Matrix Contraction and Remodeling. Biochim Biophys Acta Mol Basis Dis 2017, 1863, 298–309. [Google Scholar] [CrossRef]
- Morris, L.H.; McCue, P.M.; Aurich, C. Equine Endometritis: A Review of Challenges and New Approaches. Reproduction 2020, 160, R95–R110. [Google Scholar] [CrossRef]
- Mambelli, L.I.; Mattos, R.C.; Winter, G.H.; Madeiro, D.S.; Morais, B.P.; Malschitzky, E.; Miglino, M.A.; Kerkis, A.; Kerkis, I. Changes in Expression Pattern of Selected Endometrial Proteins Following Mesenchymal Stem Cells Infusion in Mares with Endometrosis. PLoS ONE 2014, 9, e97889. [Google Scholar] [CrossRef]
- Mambelli, L.I.; Winter, G.H.; Kerkis, A.; Malschitzky, E.; Mattos, R.C.; Kerkis, I. A Novel Strategy of Mesenchymal Stem Cells Delivery in the Uterus of Mares with Endometrosis. Theriogenology 2013, 79, 744–750. [Google Scholar] [CrossRef]
- Rezakhani, L.; Kelishadrokhi, A.F.; Soleimanizadeh, A.; Rahmati, S. Mesenchymal Stem Cell (MSC)-Derived Exosomes as a Cell-Free Therapy for Patients Infected with COVID-19: Real Opportunities and Range of Promises. Chemistry and physics of lipids 2021, 234, 105009. [Google Scholar] [CrossRef]
- Perrini, C.; Strillacci, M.G.; Bagnato, A.; Esposti, P.; Marini, M.G.; Corradetti, B.; Bizzaro, D.; Idda, A.; Ledda, S.; Capra, E.; et al. Microvesicles Secreted from Equine Amniotic-Derived Cells and Their Potential Role in Reducing Inflammation in Endometrial Cells in an in-Vitro Model. Stem Cell Res Ther 2016, 7, 169. [Google Scholar] [CrossRef]
- Cabezas, J.; Rojas, D.; Wong, Y.; Telleria, F.; Manriquez, J.; Mancanares, A.C.F.; Rodriguez-Alvarez, L.L.; Castro, F.O. In Vitro Preconditioning of Equine Adipose Mesenchymal Stem Cells with Prostaglandin E(2), Substance P and Their Combination Changes the Cellular protein Secretomics and Improves Their Immunomodulatory Competence without Compromising Stemness. Vet Immunol Immunopathol 2020, 228, 110100. [Google Scholar] [CrossRef]
- Navarrete, F.; Saravia, F.; Cisterna, G.; Rojas, F.; Silva, P.P.; Rodriguez-Alvarez, L.; Rojas, D.; Cabezas, J.; Mancanares, A.C.F.; Castro, F.O. Assessment of the Anti-Inflammatory and Engraftment Potential of Horse Endometrial and Adipose Mesenchymal Stem Cells in an in Vivo Model of Post Breeding Induced Endometritis. Theriogenology 2020, 155, 33–42. [Google Scholar] [CrossRef]
- Wong, Y.S.; Mancanares, A.C.; Navarrete, F.; Poblete, P.; Mendez-Perez, L.; Rodriguez-Alvarez, L.; Castro, F.O. Short Preconditioning with TGFbeta of Equine Adipose Tissue-Derived Mesenchymal Stem Cells Predisposes towards an Anti-Fibrotic Secretory Phenotype: A Possible Tool for Treatment of Endometrosis in Mares. Theriogenology 2024, 225, 119–129. [Google Scholar] [CrossRef]
- Wong, Y.S.; Mancanares, A.C.; Navarrete, F.I.; Poblete, P.M.; Mendez-Perez, L.; Ferreira-Dias, G.M.L.; Rodriguez-Alvarez, L.; Castro, F.O. Mare Stromal Endometrial Cells Differentially Modulate Inflammation Depending on Oestrus Cycle Status: An in Vitro Study. Front Vet Sci 2023, 10, 1271240. [Google Scholar] [CrossRef]
- Cabezas Salazar, J.G. Pre-Condicionamiento in Vitro de Células Madre Mesenquimales Derivadas de Tejido Adiposo Equino, Como Herramienta Para Potenciar La Adquisición de Una Mayor Capacidad Inmunomoduladora. 2018.
- Dominici, M.; Le Blanc, K.; Mueller, I.; Slaper-Cortenbach, I.; Marini, F.; Krause, D.; Deans, R.; Keating, A.; Prockop, D.; Horwitz, E. Minimal Criteria for Defining Multipotent Mesenchymal Stromal Cells. The International Society for Cellular Therapy Position Statement. Cytotherapy 2006, 8, 315–317. [Google Scholar] [CrossRef]
- Ranera, B.; Lyahyai, J.; Romero, A.; Vazquez, F.J.; Remacha, A.R.; Bernal, M.L.; Zaragoza, P.; Rodellar, C.; Martin-Burriel, I. Immunophenotype and Gene Expression Profiles of Cell Surface Markers of Mesenchymal Stem Cells Derived from Equine Bone Marrow and Adipose Tissue. Vet Immunol Immunopathol 2011, 144, 147–154. [Google Scholar] [CrossRef]
- Mann, M. Functional and Quantitative Proteomics Using SILAC. Nat Rev Mol Cell Biol 2006, 7, 952–958. [Google Scholar] [CrossRef]
- Kani, K. Quantitative Proteomics Using SILAC. In Proteomics: Methods and Protocols; Comai, L., Katz, J.E., Mallick, P., Eds.; Springer New York: New York, NY, 2017; pp. 171–184. ISBN 978-1-4939-6747-6. [Google Scholar]
- Cabezas, J.; Rojas, D.; Wong, Y.; Telleria, F.; Manriquez, J.; Mançanares, A.C.F.; Rodriguez-Alvarez, L.L.; Castro, F.O. In Vitro Preconditioning of Equine Adipose Mesenchymal Stem Cells with Prostaglandin E2, Substance P and Their Combination Changes the Cellular Protein Secretomics and Improves Their Immunomodulatory Competence without Compromising Stemness. Vet. Immunol. Immunopathol. 2020, 228, 110100. [Google Scholar] [CrossRef]
- Navarrete, F.; Wong, Y.S.; Cabezas, J.; Riadi, G.; Manriquez, J.; Rojas, D.; Furlanetto Mancanares, A.C.; Rodriguez-Alvarez, L.; Saravia, F.; Castro, F.O. Distinctive Cellular Transcriptomic Signature and MicroRNA Cargo of Extracellular Vesicles of Horse Adipose and Endometrial Mesenchymal Stem Cells from the Same Donors. Cell Reprogram 2020, 22, 311–327. [Google Scholar] [CrossRef] [PubMed]
- Szklarczyk, D.; Kirsch, R.; Koutrouli, M.; Nastou, K.; Mehryary, F.; Hachilif, R.; Gable, A.L.; Fang, T.; Doncheva, N.T.; Pyysalo, S. The STRING Database in 2023: Protein–Protein Association Networks and Functional Enrichment Analyses for Any Sequenced Genome of Interest. Nucleic acids research 2023, 51, D638–D646. [Google Scholar] [CrossRef] [PubMed]
- Biernacka, A.; Dobaczewski, M.; Frangogiannis, N.G. TGF-β Signaling in Fibrosis. Growth Factors 2011, 29, 196–202. [Google Scholar] [CrossRef] [PubMed]
- Frangogiannis, N. Transforming Growth Factor-β in Tissue Fibrosis. J Exp Med 2020, 217, e20190103. [Google Scholar] [CrossRef]
- Gallardo, F.S.; Cruz-Soca, M.; Bock-Pereda, A.; Faundez-Contreras, J.; Gutiérrez-Rojas, C.; Gandin, A.; Torresan, V.; Casar, J.C.; Ravasio, A.; Brandan, E. Role of TGF-β/SMAD/YAP/TAZ Signaling in Skeletal Muscle Fibrosis. American Journal of Physiology-Cell Physiology 2025, 328, C1015–C1028. [Google Scholar] [CrossRef]
- Alpoim-Moreira, J.; Fernandes, C.; Rebordão, M.R.; Costa, A.L.; Bliebernicht, M.; Nunes, T.; Szóstek-Mioduchowska, A.; Skarzynski, D.J.; Ferreira-Dias, G. Collagen Type III as a Possible Blood Biomarker of Fibrosis in Equine Endometrium. Animals 2022, 12, 1854. [Google Scholar] [CrossRef]
- Pohlers, D.; Brenmoehl, J.; Löffler, I.; Müller, C.K.; Leipner, C.; Schultze-Mosgau, S.; Stallmach, A.; Kinne, R.W.; Wolf, G. TGF-β and Fibrosis in Different Organs—Molecular Pathway Imprints. Biochimica et Biophysica Acta (BBA)-Molecular Basis of Disease 2009, 1792, 746–756. [Google Scholar] [CrossRef]
- Vallée, A.; Lecarpentier, Y. TGF-β in Fibrosis by Acting as a Conductor for Contractile Properties of Myofibroblasts. Cell & bioscience 2019, 9, 98. [Google Scholar]
- Aresu, L.; Benali, S.; Giannuzzi, D.; Mantovani, R.; Castagnaro, M.; Falomo, M.E. The Role of Inflammation and Matrix Metalloproteases in Equine Endometriosis. J Vet Sci 2012, 13, 171–177. [Google Scholar] [CrossRef]
- Centeno, L.A.M.; Bastos, H.B.A.; Bueno, V.L.C.; Trentin, J.M.; Fiorenza, M.; Panziera, W.; Winter, G.H.Z.; Kretzmann, N.A.; Fiala-Rechsteiner, S.; Mattos, R.C.; et al. Collagen and Collagenases in Mare’s Endometrium with Endometrosis. Theriogenology 2024, 230, 28–36. [Google Scholar] [CrossRef]
- Giantin, M.; Aresu, L.; Benali, S.; Aricò, A.; Morello, E.M.; Martano, M.; Vascellari, M.; Castagnaro, M.; Lopparelli, R.M.; Zancanella, V.; et al. Expression of matrix metalloproteinases, tissue inhibitors of metalloproteinases and vascular endothelial growth factor in canine mast cell tumours. J Comp Pathol 2012, 147, 419–429. [Google Scholar] [CrossRef]
- Oddsdóttir, C. Development of Endometrial Fibrosis in the Mare: Factors Involved in Tissue Remodelling and Collagen Deposition. 2008.
- Szostek-Mioduchowska, A.Z.; Baclawska, A.; Okuda, K.; Skarzynski, D.J. Effect of Proinflammatory Cytokines on Endometrial Collagen and Metallopeptidase Expression during the Course of Equine Endometrosis. Cytokine 2019, 123, 154767. [Google Scholar] [CrossRef]
- Zeisberg, M.; Kalluri, R. Cellular Mechanisms of Tissue Fibrosis. 1. Common and Organ-Specific Mechanisms Associated with Tissue Fibrosis. American Journal of Physiology-Cell Physiology 2013, 304, C216–C225. [Google Scholar] [CrossRef]
- Rohani, M.G.; Parks, W.C. Matrix Remodeling by MMPs during Wound Repair. Matrix biology 2015, 44, 113–121. [Google Scholar] [CrossRef]
- Jaiswal, R.K.; Varshney, A.K.; Yadava, P.K. Diversity and Functional Evolution of the Plasminogen Activator System. Biomedicine & Pharmacotherapy 2018, 98, 886–898. [Google Scholar] [CrossRef]
- Sillen, M.; Declerck, P.J. A Narrative Review on Plasminogen Activator Inhibitor-1 and Its (Patho) Physiological Role: To Target or Not to Target? Int. J. Mol. Sci. 2021, 22, 2721. [Google Scholar] [CrossRef]
- Diaz Espinosa, A.M.; Link, P.A.; Sicard, D.; Jorba, I.; Tschumperlin, D.J.; Haak, A.J. Dopamine D1 Receptor Stimulates Cathepsin K-Dependent Degradation and Resorption of Collagen I in Lung Fibroblasts. Journal of Cell Science 2020, 133, jcs248278. [Google Scholar] [CrossRef]
- Amar, S.; Smith, L.; Fields, G.B. Matrix Metalloproteases Collagenolysis in Health and Disease. Biochimica et Biophysica Acta (BBA)-Molecular Cell Research 2017, 1864, 1940–1951. [Google Scholar] [CrossRef]
- Garrison, G.; Huang, S.K.; Okunishi, K.; Scott, J.P.; Kumar Penke, L.R.; Scruggs, A.M.; Peters-Golden, M. Reversal of Myofibroblast Differentiation by Prostaglandin E(2). Am J Respir Cell Mol Biol 2013, 48, 550–558. [Google Scholar] [CrossRef]
- Wipff, P.J.; Rifkin, D.B.; Meister, J.J.; Hinz, B. Myofibroblast Contraction Activates Latent TGF-Beta1 from the Extracellular Matrix. J Cell Biol 2007, 179, 1311–1323. [Google Scholar] [CrossRef] [PubMed]
- Li, Y.; Lei, D.; Swindell, W.R.; Xia, W.; Weng, S.; Fu, J.; Worthen, C.A.; Okubo, T.; Johnston, A.; Gudjonsson, J.E.; et al. Age-Associated Increase in Skin Fibroblast–Derived Prostaglandin E2 Contributes to Reduced Collagen Levels in Elderly Human Skin. J Invest Dermatol 2015, 135, 2181–2188. [Google Scholar] [CrossRef]
- Zhao, J.; Shu, B.; Chen, L.; Tang, J.; Zhang, L.; Xie, J.; Liu, X.; Xu, Y.; Qi, S. Prostaglandin E2 Inhibits Collagen Synthesis in Dermal Fibroblasts and Prevents Hypertrophic Scar Formation in Vivo. Exp Dermatol 2016, 25, 604–610. [Google Scholar] [CrossRef] [PubMed]
- Cilli, F.; Khan, M.; Fu, F.; Wang, J.H.-C. Prostaglandin E2 Affects Proliferation and Collagen Synthesis by Human Patellar Tendon Fibroblasts. Clinical journal of sport medicine 2004, 14, 232–236. [Google Scholar] [CrossRef]
- Becerra, A.; Rojas, M.; Vallejos, A.; Villegas, V.; Perez, L.; Cabello-Verrugio, C.; Simon, F. Endothelial Fibrosis Induced by Suppressed STAT3 Expression Mediated by Signaling Involving the TGF-Beta1/ALK5/Smad Pathway. Lab Invest 2017, 97, 1033–1046. [Google Scholar] [CrossRef]
- Zhao, J.; Qi, Y.-F.; Yu, Y.-R. STAT3: A Key Regulator in Liver Fibrosis. Annals of hepatology 2021, 21, 100224. [Google Scholar] [CrossRef] [PubMed]
- Lee, E.J.; Kim, S.-J.; Hahn, Y.-I.; Yoon, H.-J.; Han, B.; Kim, K.; Lee, S.; Kim, K.P.; Suh, Y.G.; Na, H.-K.; et al. 15-Keto Prostaglandin E2 Suppresses STAT3 Signaling and Inhibits Breast Cancer Cell Growth and Progression. Redox Biol 2019, 23, 101175. [Google Scholar] [CrossRef]
- Meng, Z.X.; Sun, J.X.; Ling, J.J.; Lv, J.H.; Zhu, D.Y.; Chen, Q.; Sun, Y.J.; Han, X. Prostaglandin E 2 Regulates Foxo Activity via the Akt Pathway: Implications for Pancreatic Islet Beta Cell Dysfunction. Diabetologia 2006, 49, 2959–2968. [Google Scholar] [CrossRef]
- Naini, S.M.; Choukroun, G.J.; Ryan, J.R.; Hentschel, D.M.; Shah, J.V.; Bonventre, J.V. Cytosolic Phospholipase A2α Regulates G1 Progression through Modulating FOXO1 Activity. FASEB J 2016, 30, 1155–1170. [Google Scholar] [CrossRef]
- Xin, Z.; Ma, Z.; Hu, W.; Jiang, S.; Yang, Z.; Li, T.; Chen, F.; Jia, G.; Yang, Y. FOXO1/3: Potential Suppressors of Fibrosis. Ageing research reviews 2018, 41, 42–52. [Google Scholar] [CrossRef]
- Liu, J.; Wang, F.; Luo, F. The Role of JAK/STAT Pathway in Fibrotic Diseases: Molecular and Cellular Mechanisms. Biomolecules 2023, 13, 119. [Google Scholar] [CrossRef] [PubMed]
- Bozyk, P.D.; Moore, B.B. Prostaglandin E2 and the Pathogenesis of Pulmonary Fibrosis. Am J Respir Cell Mol Biol 2011, 45, 445–452. [Google Scholar] [CrossRef]
- Rixon, C.; Andreassen, K.; Shen, X.; Erusappan, P.M.; Almaas, V.M.; Palmero, S.; Dahl, C.P.; Ueland, T.; Sjaastad, I.; Louch, W.E.; et al. Lumican Accumulates with Fibrillar Collagen in Fibrosis in Hypertrophic Cardiomyopathy. ESC Heart Fail 2023, 10, 858–871. [Google Scholar] [CrossRef] [PubMed]
- Stamov, D.R.; Müller, A.; Wegrowski, Y.; Brezillon, S.; Franz, C.M. Quantitative Analysis of Type I Collagen Fibril Regulation by Lumican and Decorin Using AFM. J Struct Biol 2013, 183, 394–403. [Google Scholar] [CrossRef]
- Sweetwyne, M.T.; Murphy-Ullrich, J.E. Thrombospondin1 in Tissue Repair and Fibrosis: TGF-β-Dependent and Independent Mechanisms. Matrix Biol 2012, 31, 178–186. [Google Scholar] [CrossRef] [PubMed]
- Chaqour, B. Caught between a “Rho” and a Hard Place: Are CCN1/CYR61 and CCN2/CTGF the Arbiters of Microvascular Stiffness? Journal of Cell Communication and Signaling 2020, 14, 21–29. [Google Scholar] [CrossRef]
- Qin, L.; Liu, N.; Bao, C.L.; Yang, D.Z.; Ma, G.X.; Yi, W.H.; Xiao, G.Z.; Cao, H.L. Mesenchymal Stem Cells in Fibrotic Diseases-the Two Sides of the Same Coin. Acta Pharmacol Sin 2023, 44, 268–287. [Google Scholar] [CrossRef]
- Effendi, W.I.; Nagano, T. Connective Tissue Growth Factor in Idiopathic Pulmonary Fibrosis: Breaking the Bridge. Int. J. Mol. Sci. 2022, 23, 6064. [Google Scholar] [CrossRef]
- Kubota, S.; Takigawa, M. Cellular and Molecular Actions of CCN2/CTGF and Its Role under Physiological and Pathological Conditions. Clinical Science 2014, 128, 181–196. [Google Scholar] [CrossRef]
- Posey, K.L.; Coustry, F.; Hecht, J.T. Cartilage Oligomeric Matrix Protein: COMPopathies and Beyond. Matrix biology 2018, 71–72, 161–173. [Google Scholar] [CrossRef]
- Qiao, B.; Liu, X.; Wang, B.; Wei, S. The Role of Periostin in Cardiac Fibrosis. Heart Failure Reviews 2024, 29, 191–206. [Google Scholar] [CrossRef]
- Yamaguchi, Y. Periostin in Skin Tissue and Skin-Related Diseases. Allergology International 2014, 63, 161–170. [Google Scholar] [CrossRef]
- Bhattacharyya, S.; Wang, W.; Morales-Nebreda, L.; Feng, G.; Wu, M.; Zhou, X.; Lafyatis, R.; Lee, J.; Hinchcliff, M.; Feghali-Bostwick, C.; et al. Tenascin-C Drives Persistence of Organ Fibrosis. Nat. Commun. 2016, 7, 11703. [Google Scholar] [CrossRef]
- Imanaka-Yoshida, K.; Aoki, H. Tenascin-C and Mechanotransduction in the Development and Diseases of Cardiovascular System. Front Physiol 2014, 5, 283. [Google Scholar] [CrossRef]
- Rathaur, P.; Rodriguez, J.; Kuchtey, J.; Insignares, S.; Jones, W.B.; Kuchtey, R.W.; Bassnett, S. The Biomechanics of Fibrillin Microfibrils: Lessons from the Ciliary Zonule. Cells 2024, 13, 2097. [Google Scholar] [CrossRef]
- Kato, A.; Okamoto, O.; Wu, W.; Matsuo, N.; Kumai, J.; Yamada, Y.; Katagiri, F.; Nomizu, M.; Fujiwara, S. Identification of Fibronectin Binding Sites in Dermatopontin and Their Biological Function. Journal of Dermatological Science 2014, 76, 51–59. [Google Scholar] [CrossRef]
- Giannandrea, M.; Parks, W.C. Diverse Functions of Matrix Metalloproteases during Fibrosis. Dis Model Mech 2014, 7, 193–203. [Google Scholar] [CrossRef]
- Ghosh, A.K.; Vaughan, D.E. PAI-1 in Tissue Fibrosis. J Cell Physiol 2012, 227, 493–507. [Google Scholar] [CrossRef]
- Dai, C.-L.; Yang, H.-X.; Liu, Q.-P.; Rahman, K.; Zhang, H. CXCL6: A Potential Therapeutic Target for Inflammation and Cancer. Clinical and Experimental Medicine 2023, 23, 4413–4427. [Google Scholar] [CrossRef]
- Dunbar, A.J.; Kim, D.; Lu, M.; Farina, M.; Bowman, R.L.; Yang, J.L.; Park, Y.; Karzai, A.; Xiao, W.; Zaroogian, Z.; et al. CXCL8/CXCR2 Signaling Mediates Bone Marrow Fibrosis and Is a Therapeutic Target in Myelofibrosis. Blood 2023, 141, 2508–2519. [Google Scholar] [CrossRef]
- Lawler, J. The Functions of Thrombospondin-1 and-2. Curr Opin Cell Biol 2000, 12, 634–640. [Google Scholar] [CrossRef]
- Peng, S.; Zhu, X.; Zhao, M.; Zhang, Y.; Wang, A.; Chen, M.; Ye, Z. Identification of Matrix-Remodeling Associated 5 as a Possible Molecular Oncotarget of Pancreatic Cancer. Cell Death & Disease 2023, 14, 157. [Google Scholar] [CrossRef]
- Poveda, J.; Sanz, A.B.; Fernandez-Fernandez, B.; Carrasco, S.; Ruiz-Ortega, M.; Cannata-Ortiz, P.; Ortiz, A.; Sanchez-Niño, M.D. MXRA 5 Is a TGF-β1-regulated Human protein with Anti-inflammatory and Anti-fibrotic Properties. J. Cell. Mol. Med. 2017, 21, 154–164. [Google Scholar] [CrossRef] [PubMed]
- Gharaee-Kermani, M.; Kasina, S.; Moore, B.B.; Thomas, D.; Mehra, R.; Macoska, J.A. CXC-Type Chemokines Promote Myofibroblast Phenoconversion and Prostatic Fibrosis. PLoS ONE 2012, 7, e49278. [Google Scholar] [CrossRef] [PubMed]
- Kebschull, M.; Demmer, R.; Behle, J.H.; Pollreisz, A.; Heidemann, J.; Belusko, P.B.; Celenti, R.; Pavlidis, P.; Papapanou, P.N. Granulocyte Chemotactic Protein 2 (Gcp-2/Cxcl6) Complements Interleukin-8 in Periodontal Disease. Journal of periodontal research 2009, 44, 465–471. [Google Scholar] [CrossRef]
- Tan, A.B.-S.; Kress, S.; Castro, L.; Sheppard, A.; Raghunath, M. Cellular Re- and de-Programming by Microenvironmental Memory: Why Short TGF-Β1 Pulses Can Have Long Effects. Fibrogenesis & Tissue Repair 2013, 6, 12. [Google Scholar] [CrossRef]
Figure 1.
Schematic representation of experimental design for proteomics analysis. Myofibroblasts were induced for 24 hours using a cytokine cocktail (TGF-β1, TNF-α, IL-1β, and IL-6) before co-culture with ET-eMSCs preconditioned with PGE2 (3 μM) in a transwell system. This setup enabled bidirectional exchange of soluble factors without direct cell contact. Samples were collected at two-time points: (i) time zero, including the conditioned medium from ET-eMSCs (secretome T0) and total proteins extracts from myofibroblasts (proteome T0), and (ii) after 48 hours of co-culture, collecting the PGE2-conditioned medium containing myofibroblast secretions (secretome 48 hours) and total protein extracts from myofibroblasts (proteome 48 hours). Each sample was analyzed in triplicate. (Figure created with BioRender.com).
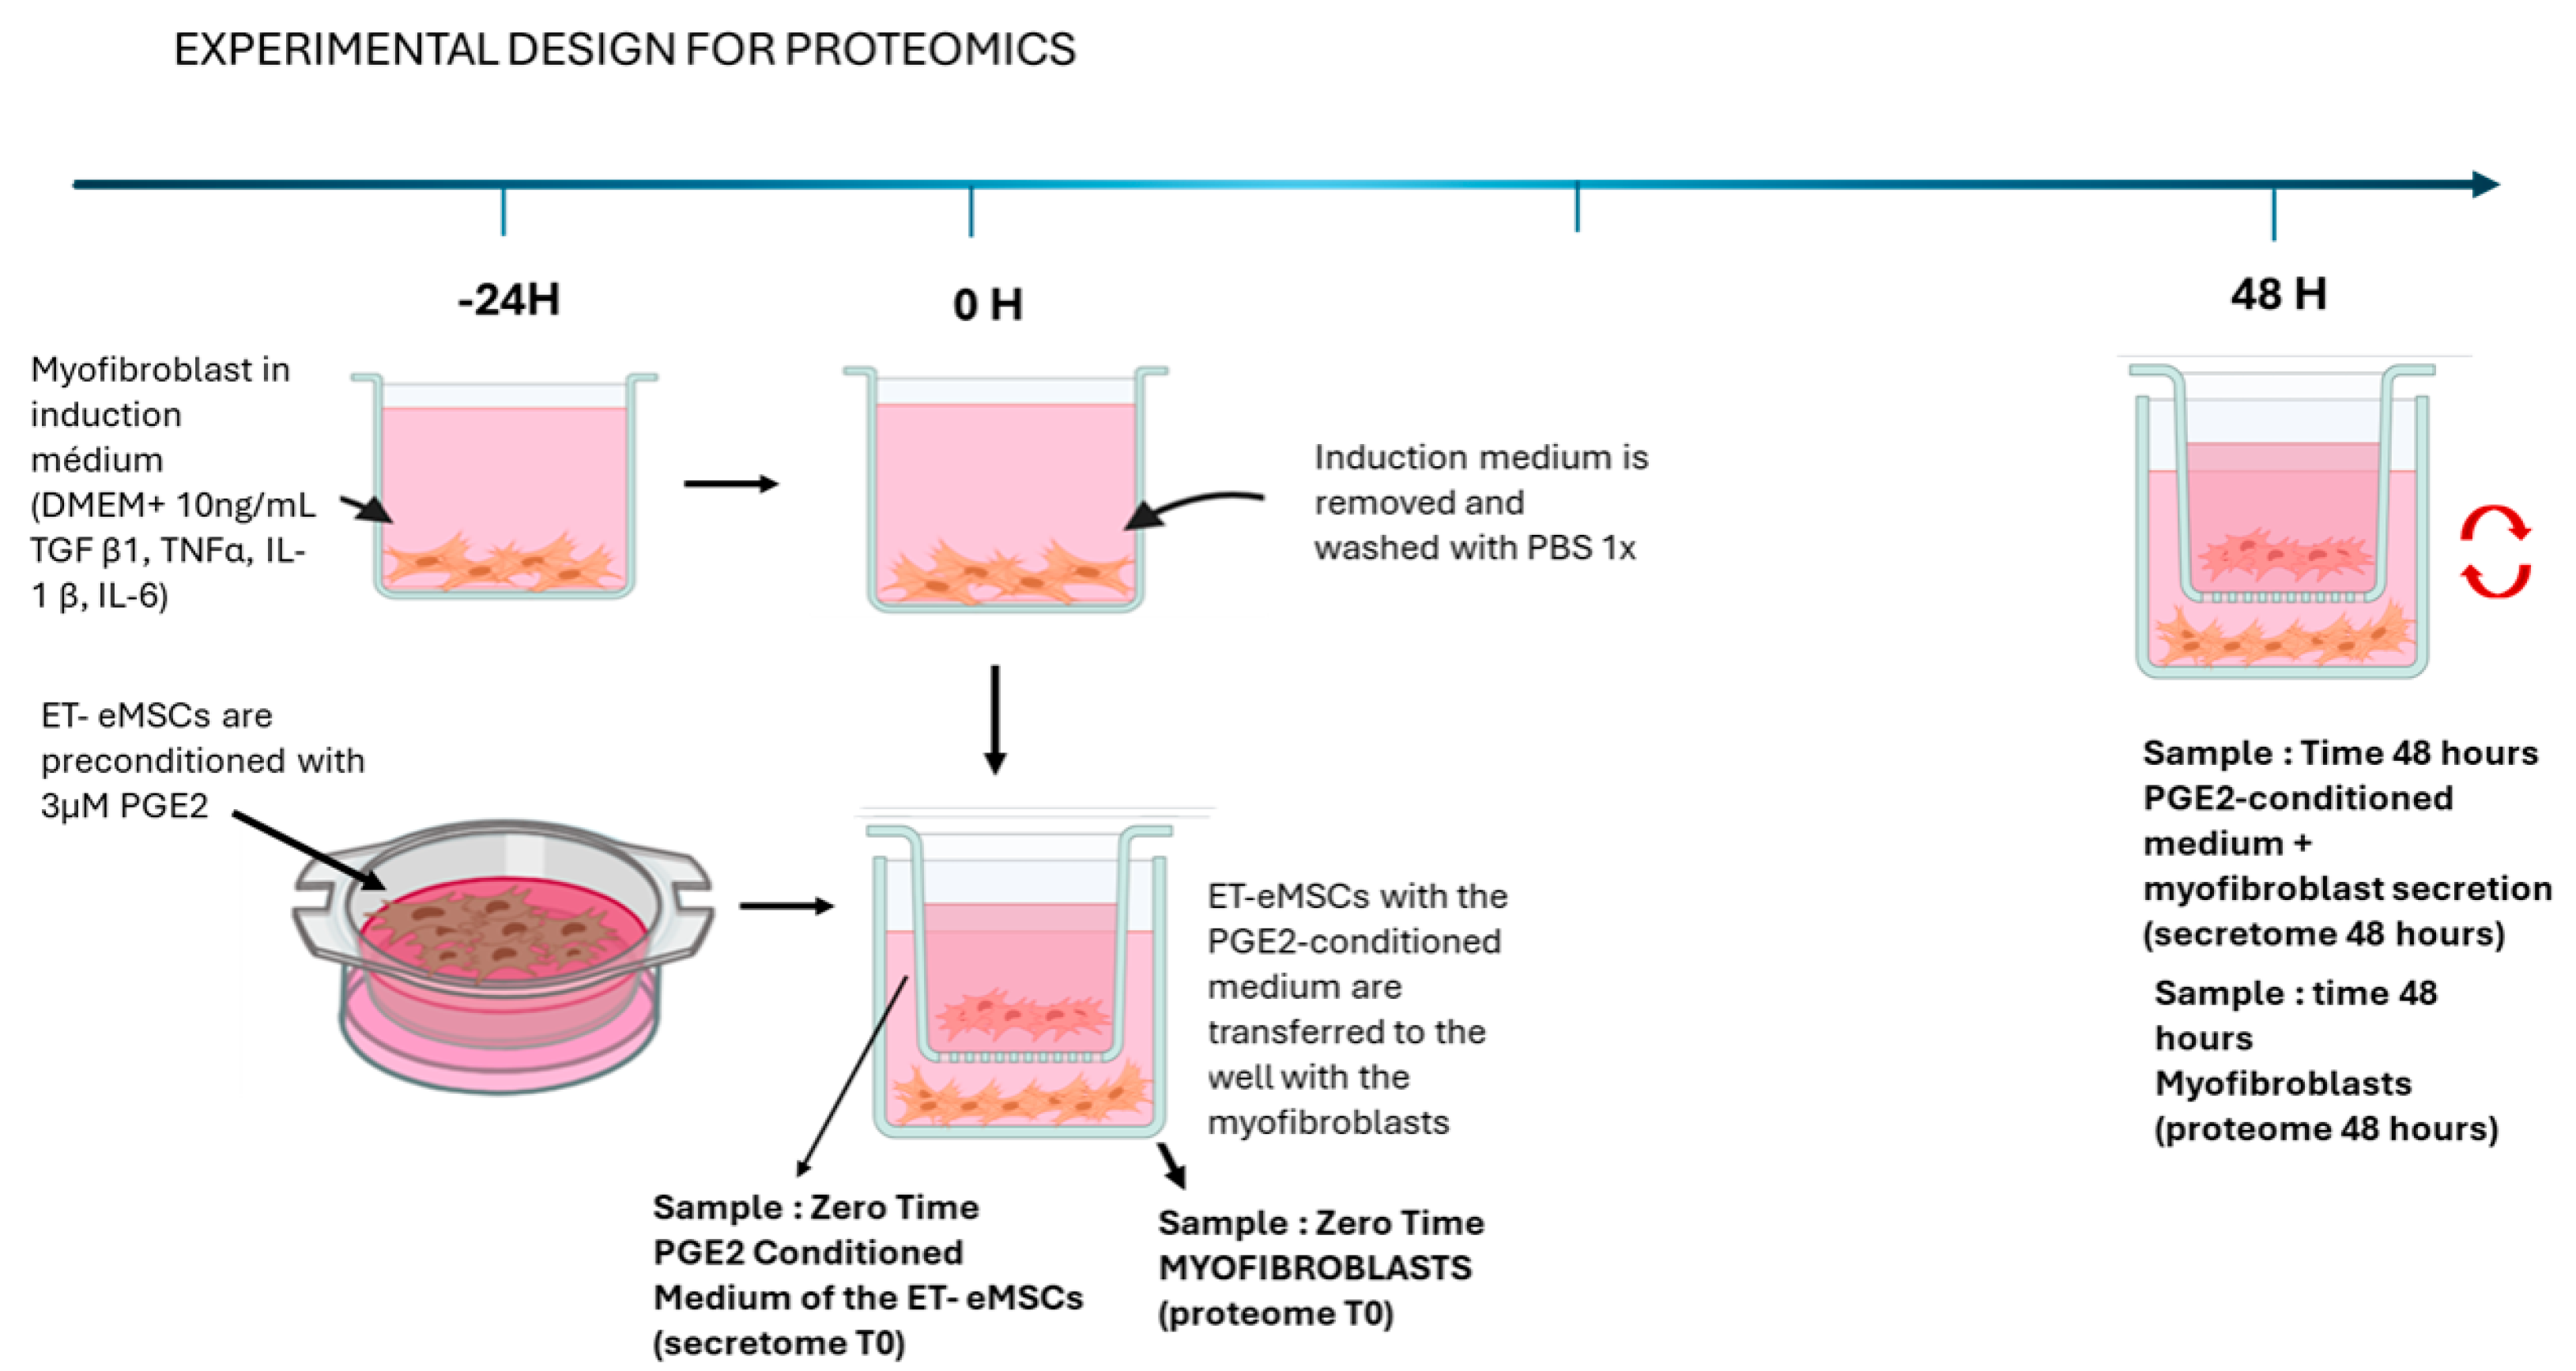
Figure 2.
Schematic representation of experimental design employed SILAC in Co-culture Experiment. Co-cultures were maintained in conditioned SILAC medium until Day 21 to permit bidirectional molecular exchange. Samples were collected at two time points: (i) time zero, including the conditioned medium from ET-eMSCs (T0MSC) and supernatant from myofibroblasts (T0Myo), and (ii) after 48 hours of co-culture, collecting the PGE2-conditioned medium containing myofibroblast and ET-eMSC secretions(48H-PGE2) and control group (48H-SPGE2). Each sample was analyzed in triplicate. (Figure created with BioRender.com).
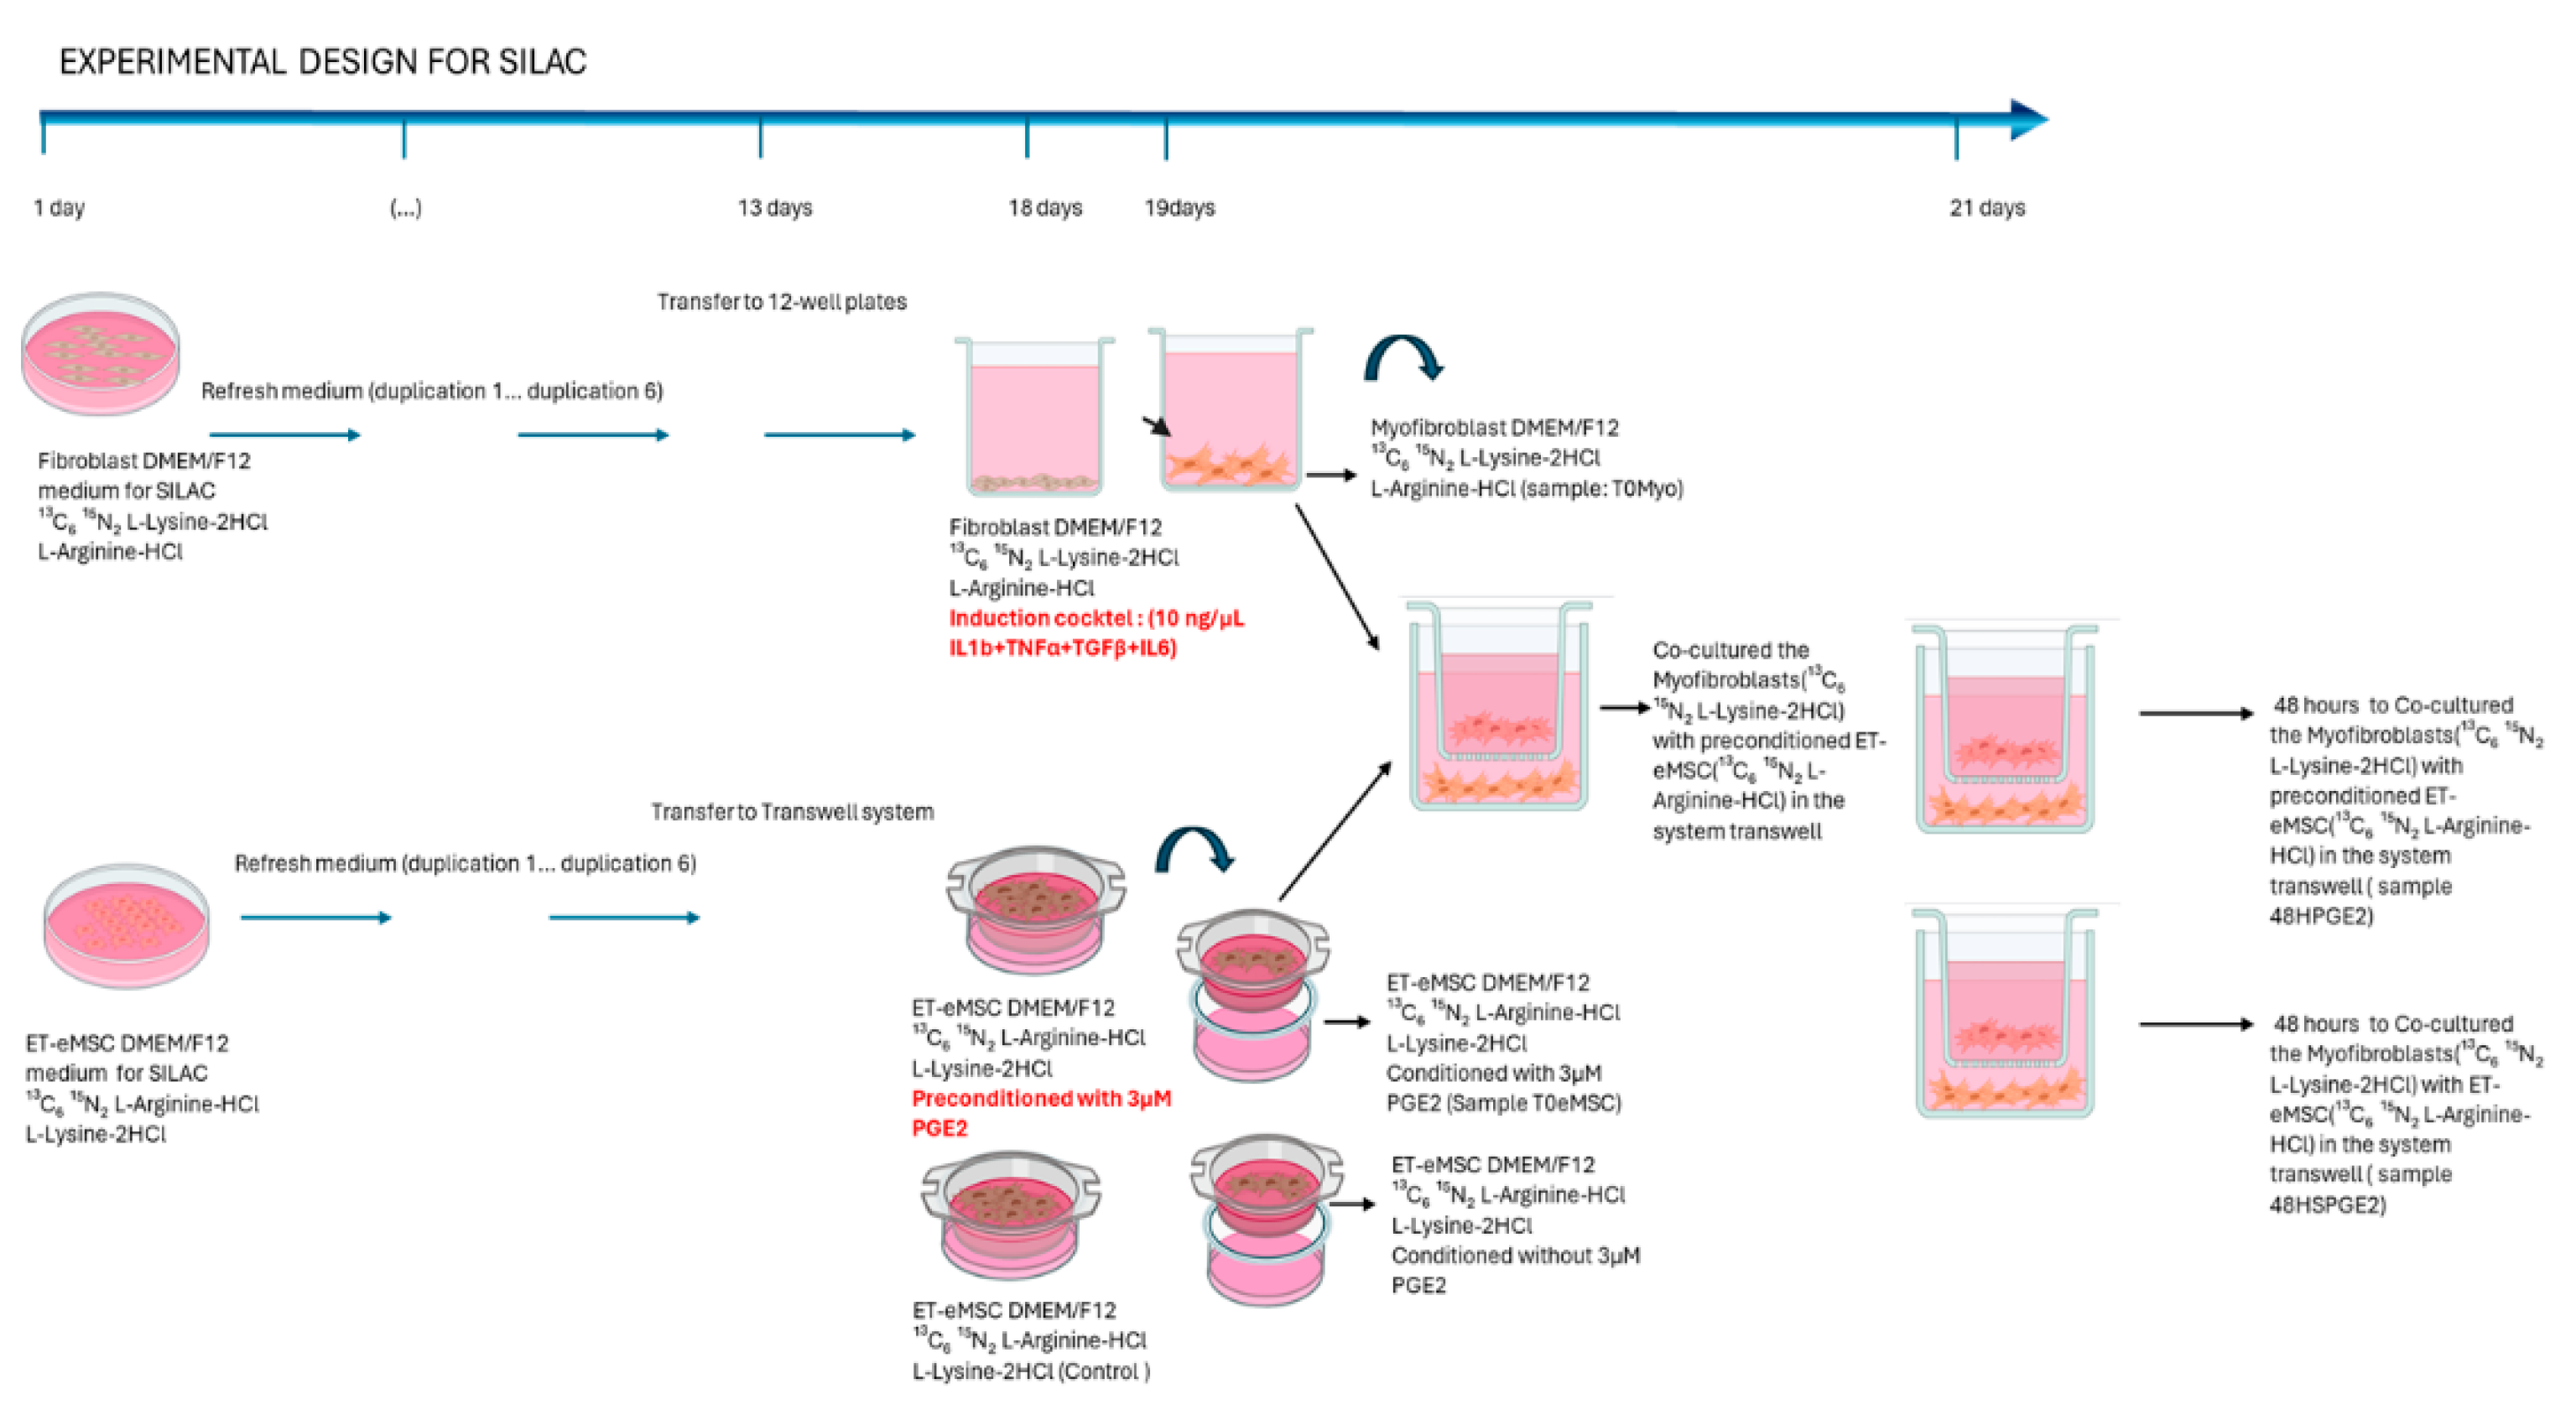
Figure 3.
Principal Component Analysis (PCA) of the proteomic profiles. (a) PCA of the secretome of ET-eMSC samples shows a clear separation between the 0-hour (blue) and 48-hour (red) conditions, highlighting distinct biological differences after preconditioning with PGE2. (b) PCA of the proteome of myofibroblast samples also demonstrates separation between 0-hour (blue) and 48-hour (red) conditions, indicating proteomic changes induced by the co-culture.
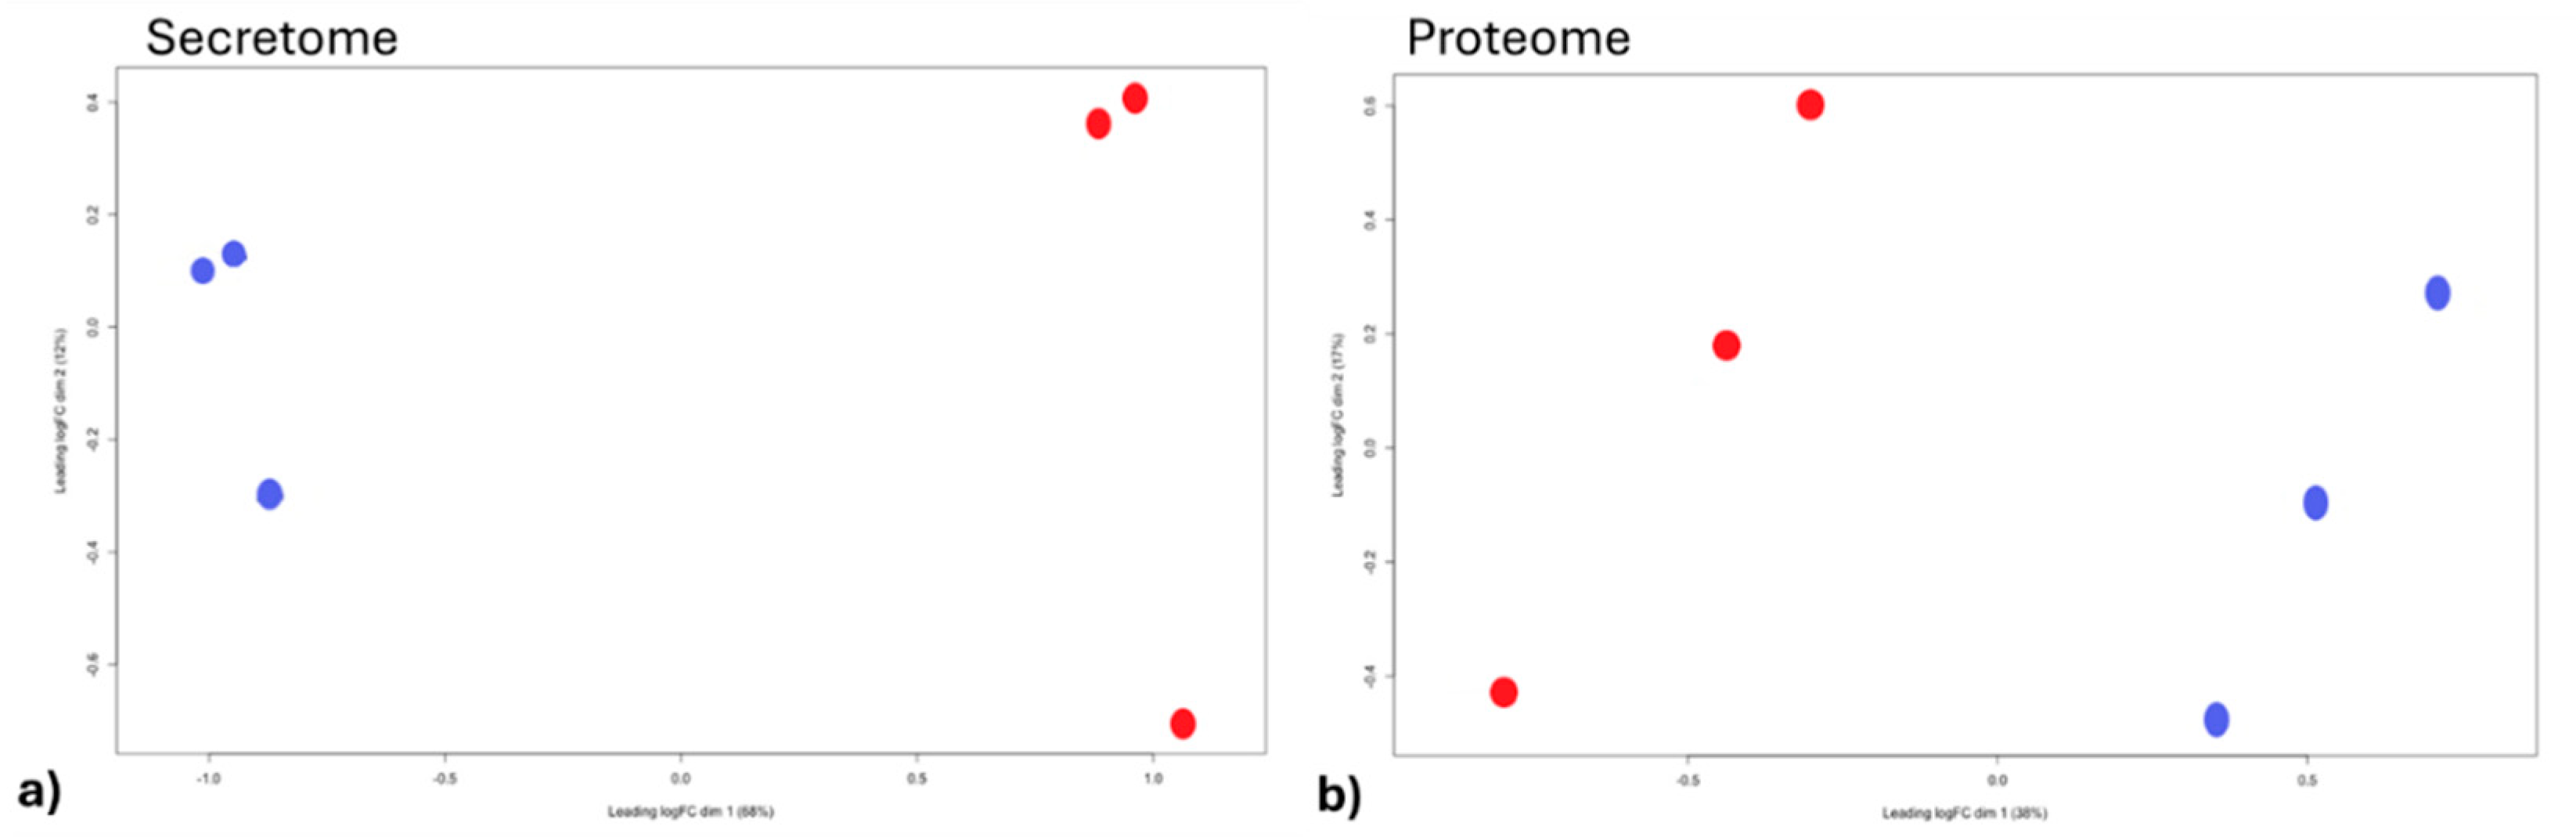
Figure 4.
Volcano plots showing differential protein abundance in myofibroblasts and secretome of ET-eMSC samples after co-culture with ET-eMSC for 48 hours compared to 0 hours. (a) Volcano plot depicting protein abundance changes in myofibroblasts. Key proteins of interest are labeled. (b) Volcano plot for the secretome of ET-eMSC samples. In both graphs, red indicates low-abundance proteins, and green indicates high-abundance proteins. Notable proteins with high fold changes are highlighted. Dashed lines represent significance thresholds (FDR < 0.05 and logFC = ±0.5).
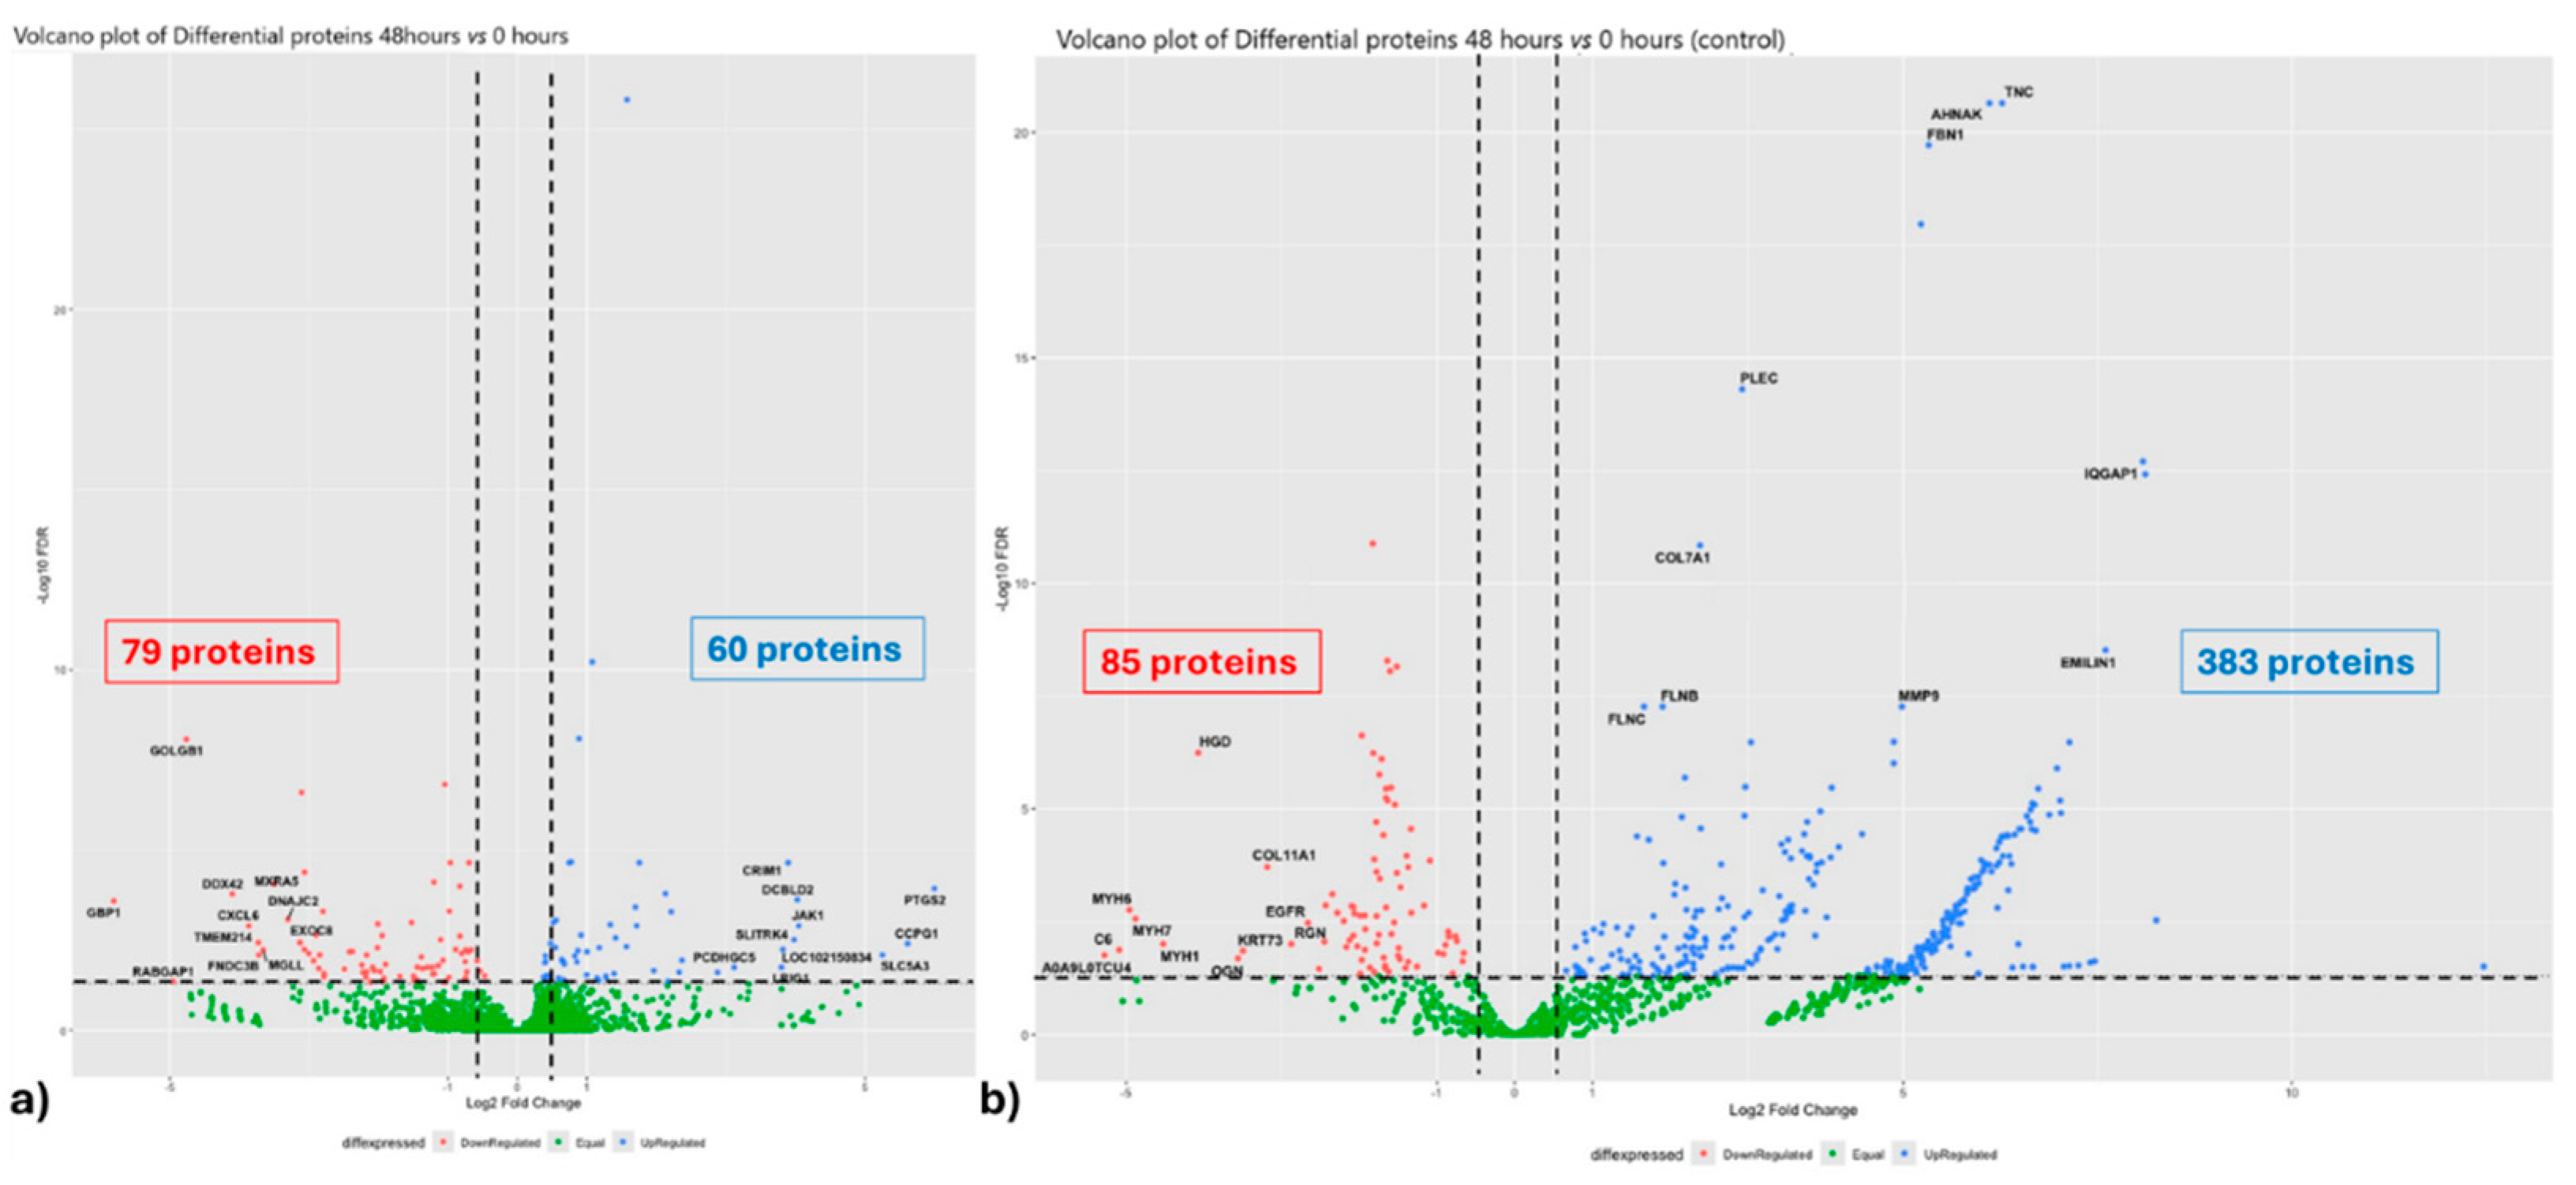
Figure 5.
Protein-protein interaction regulatory network. Differentially abundant protein (DAPs) in myofibroblasts and the secretome of ET-eMSC were used to construct PPI networks with STRING software. Active interaction sources included Text Mining, Experiments, Databases, Abundance, Neighborhood, Gene Fusion, and Co-occurrence, with a minimum interaction confidence score of 0.4 (medium confidence). Panels (a) and (c) represent low-abundance proteins, while panels (b) and (d) represent high-abundance proteins in the proteome and secretome, respectively. The clusters are identified by color; circles of the same color are grouped in the same cluster (Table S3 and S4).
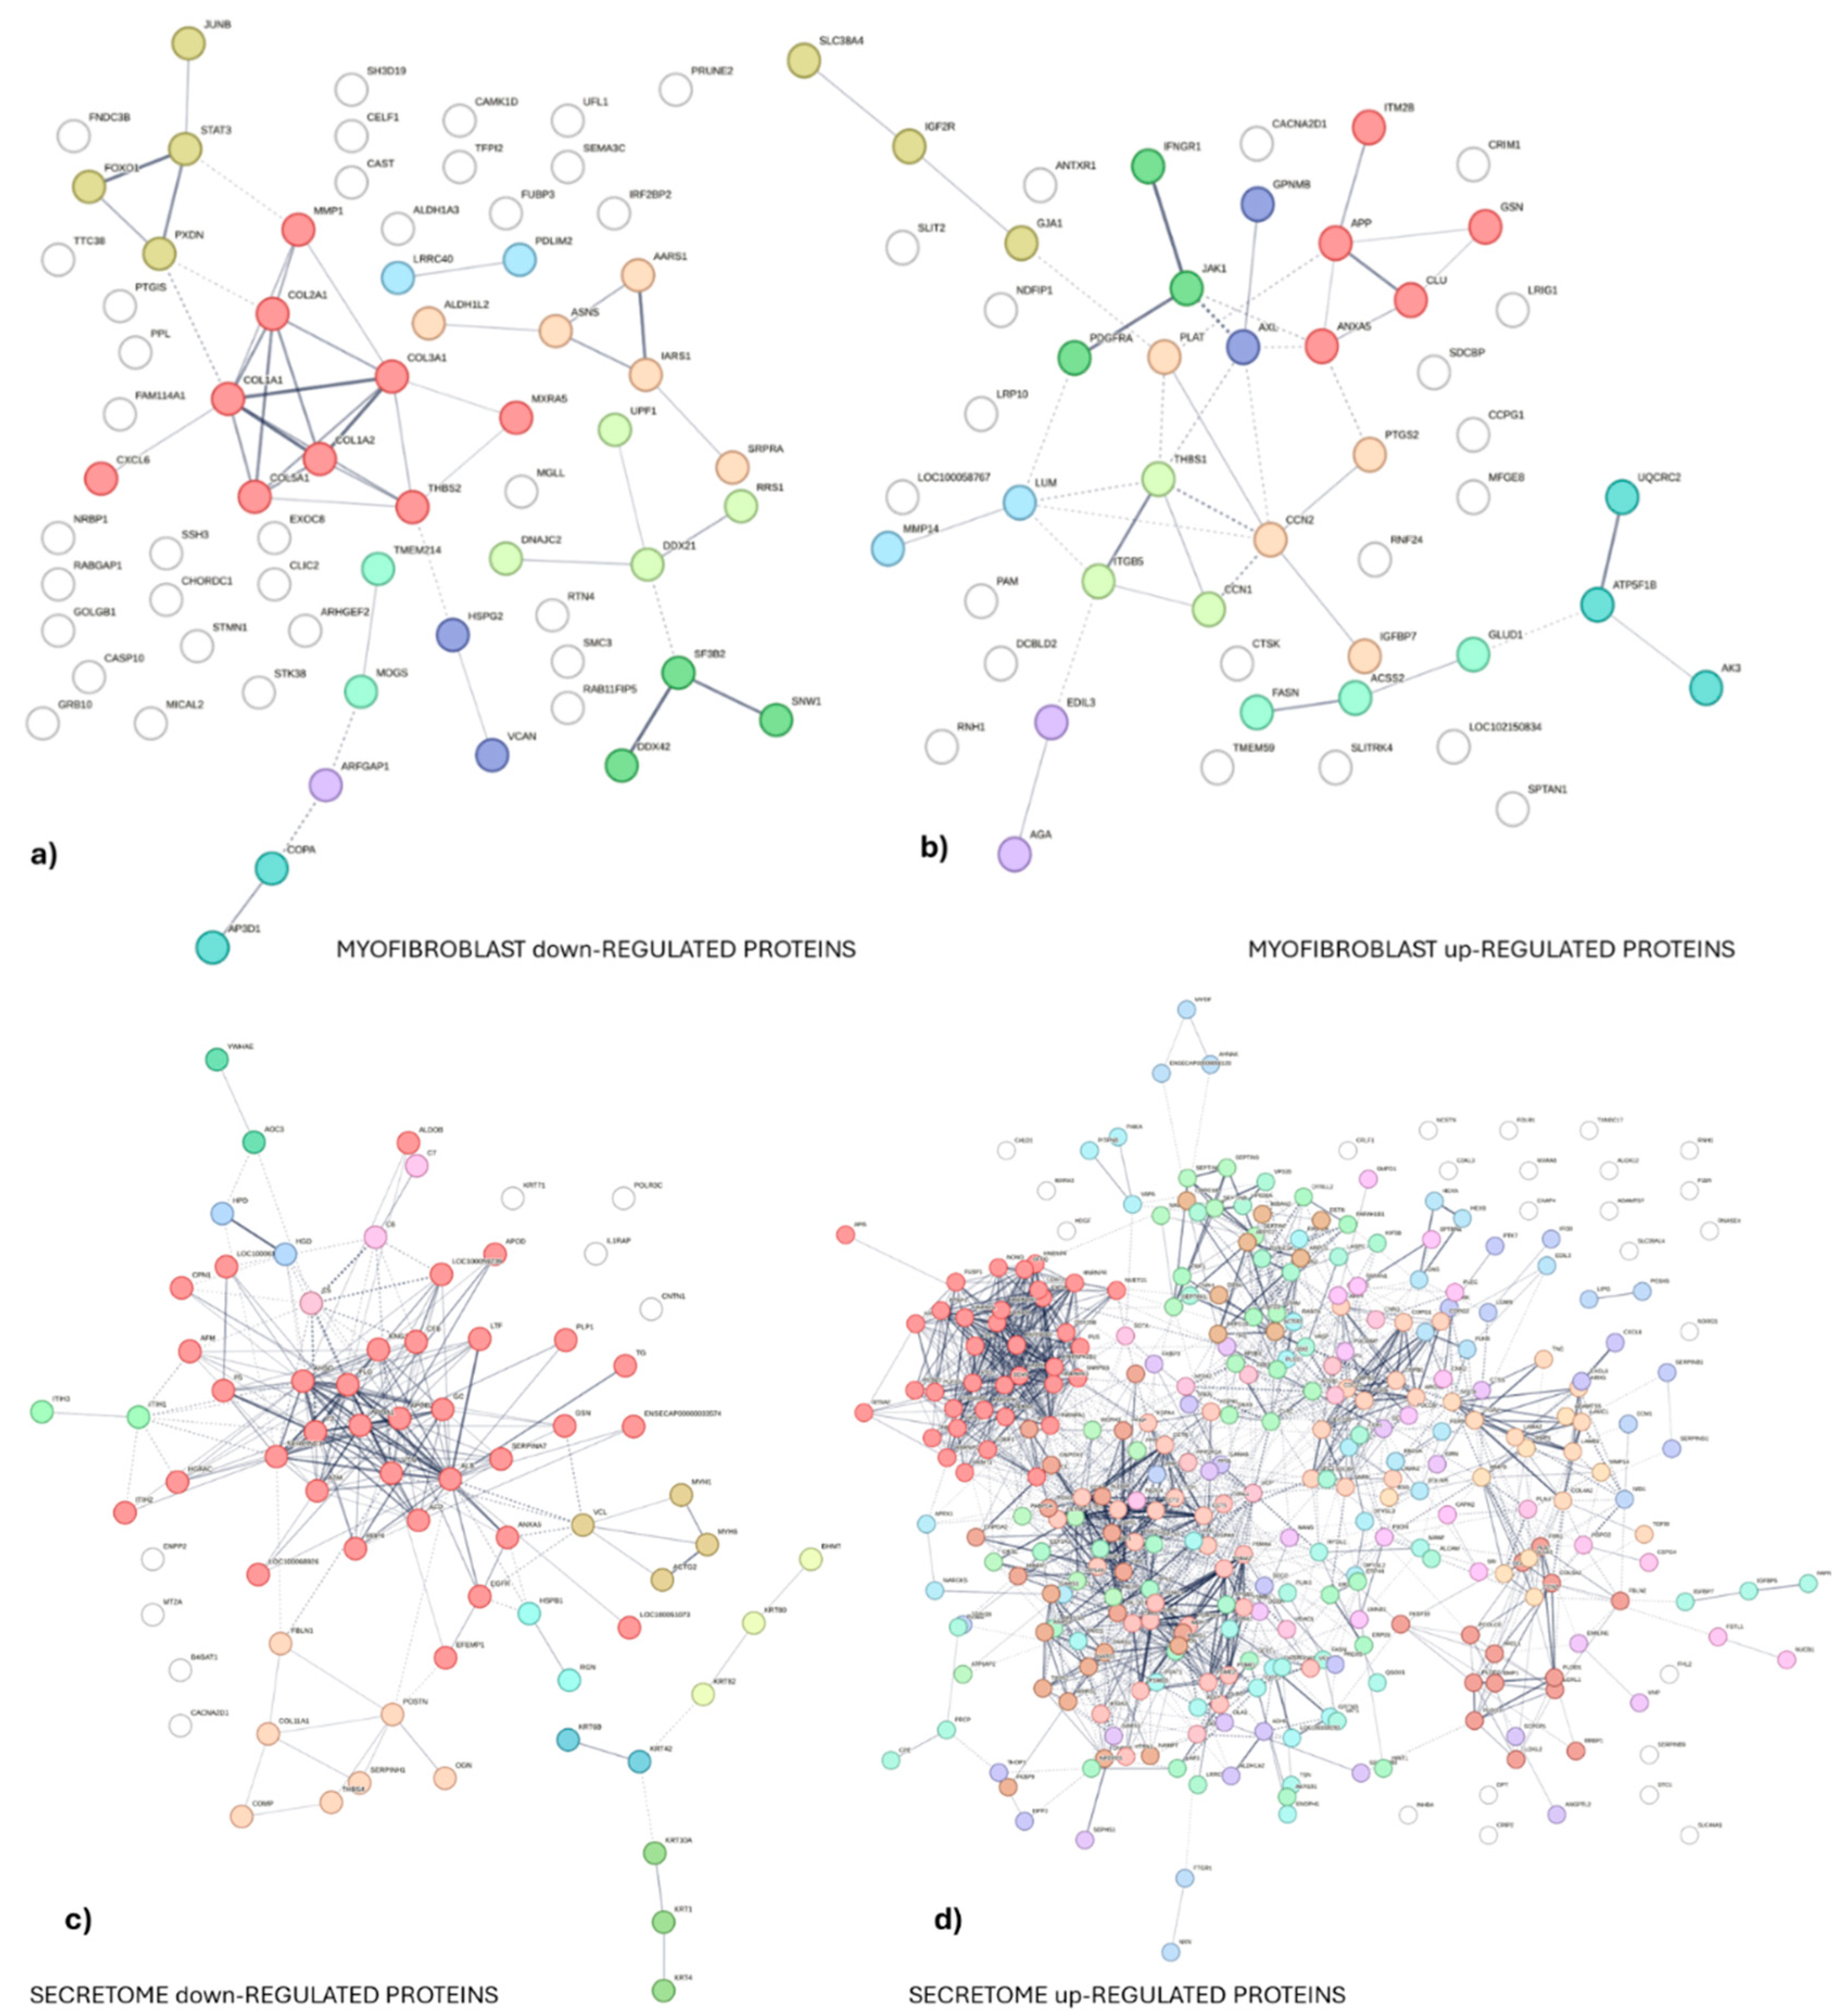
Figure 6.
Gene ontology analysis of 487 DAPs between supernatants from ET-eMSCs (preconditioned for 24 hours with PGE2) and from co-culture ET-eMSCs and myofibroblasts. The top ten biological process categories, cellular component categories and molecular functions are presented. The plots on the left represent the analysis of downregulated genes, while those on the right correspond to upregulated genes. The size of each bubble indicates the number of genes enriched in each category, and the color gradient represents the false discovery rate (FDR) values. The analysis was performed using the STRING v12.0 analysis tool, with an FDR threshold of 0.05 and a minimal signal of 0.01.
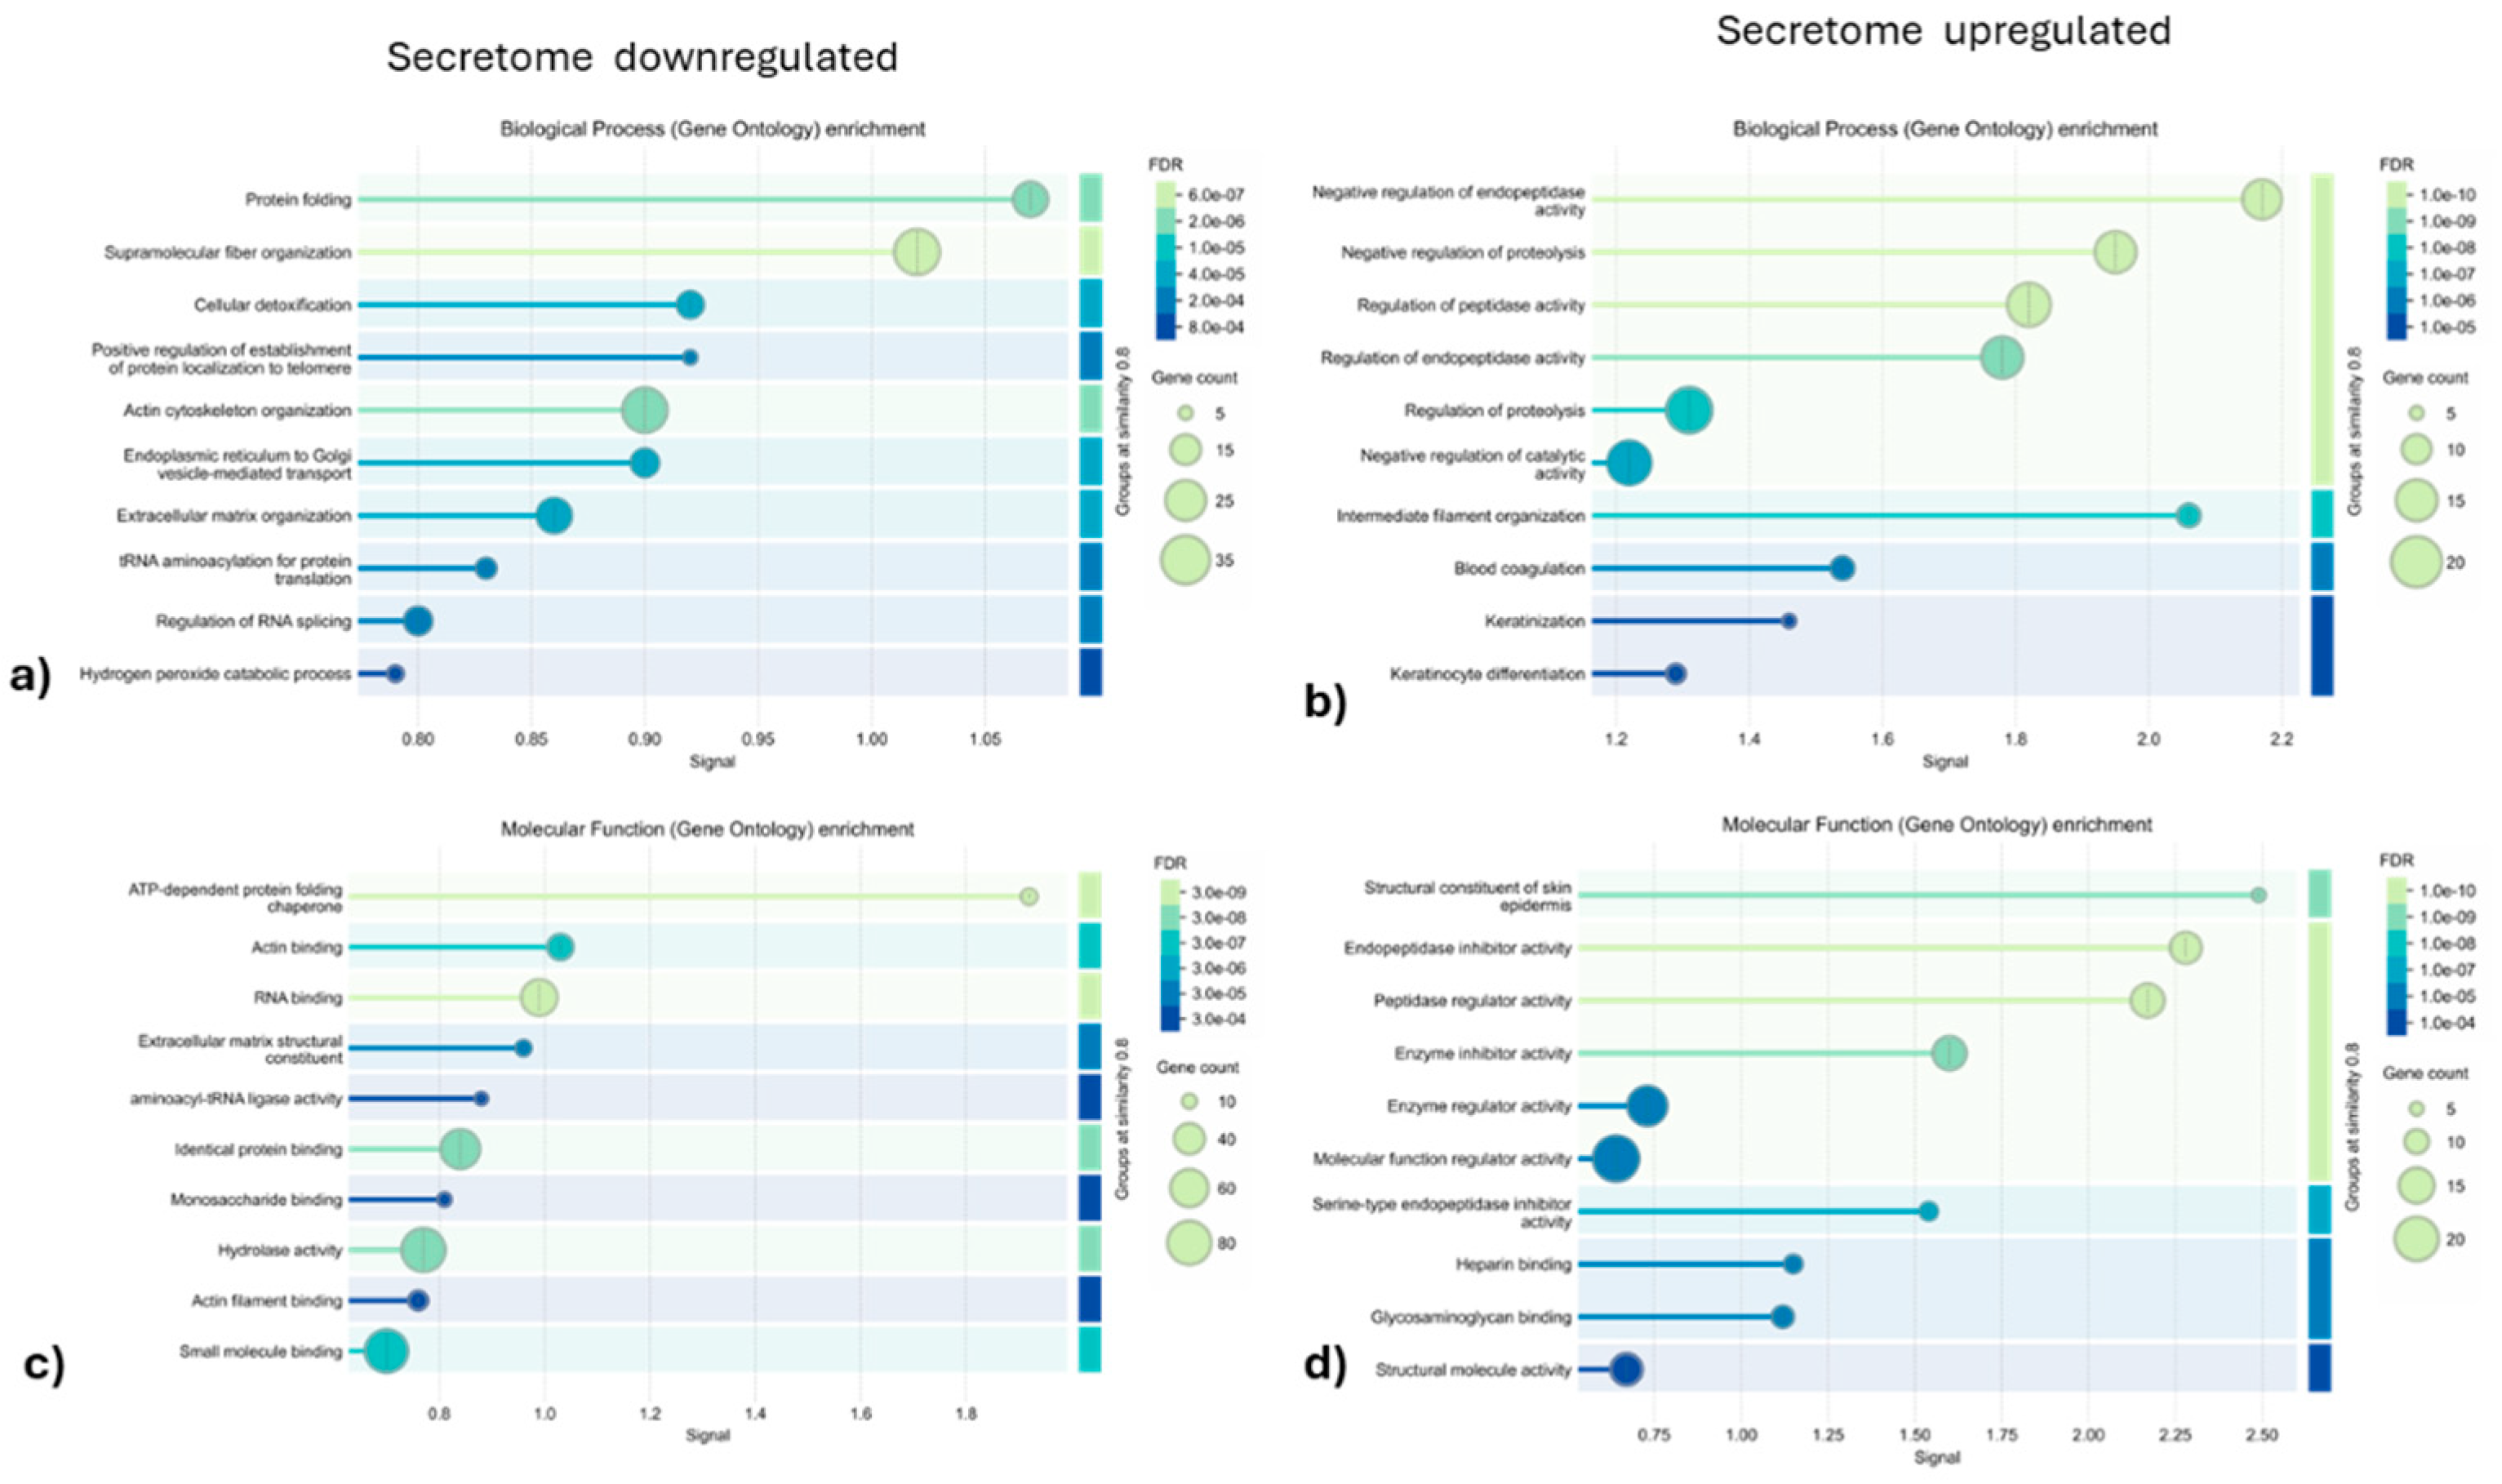
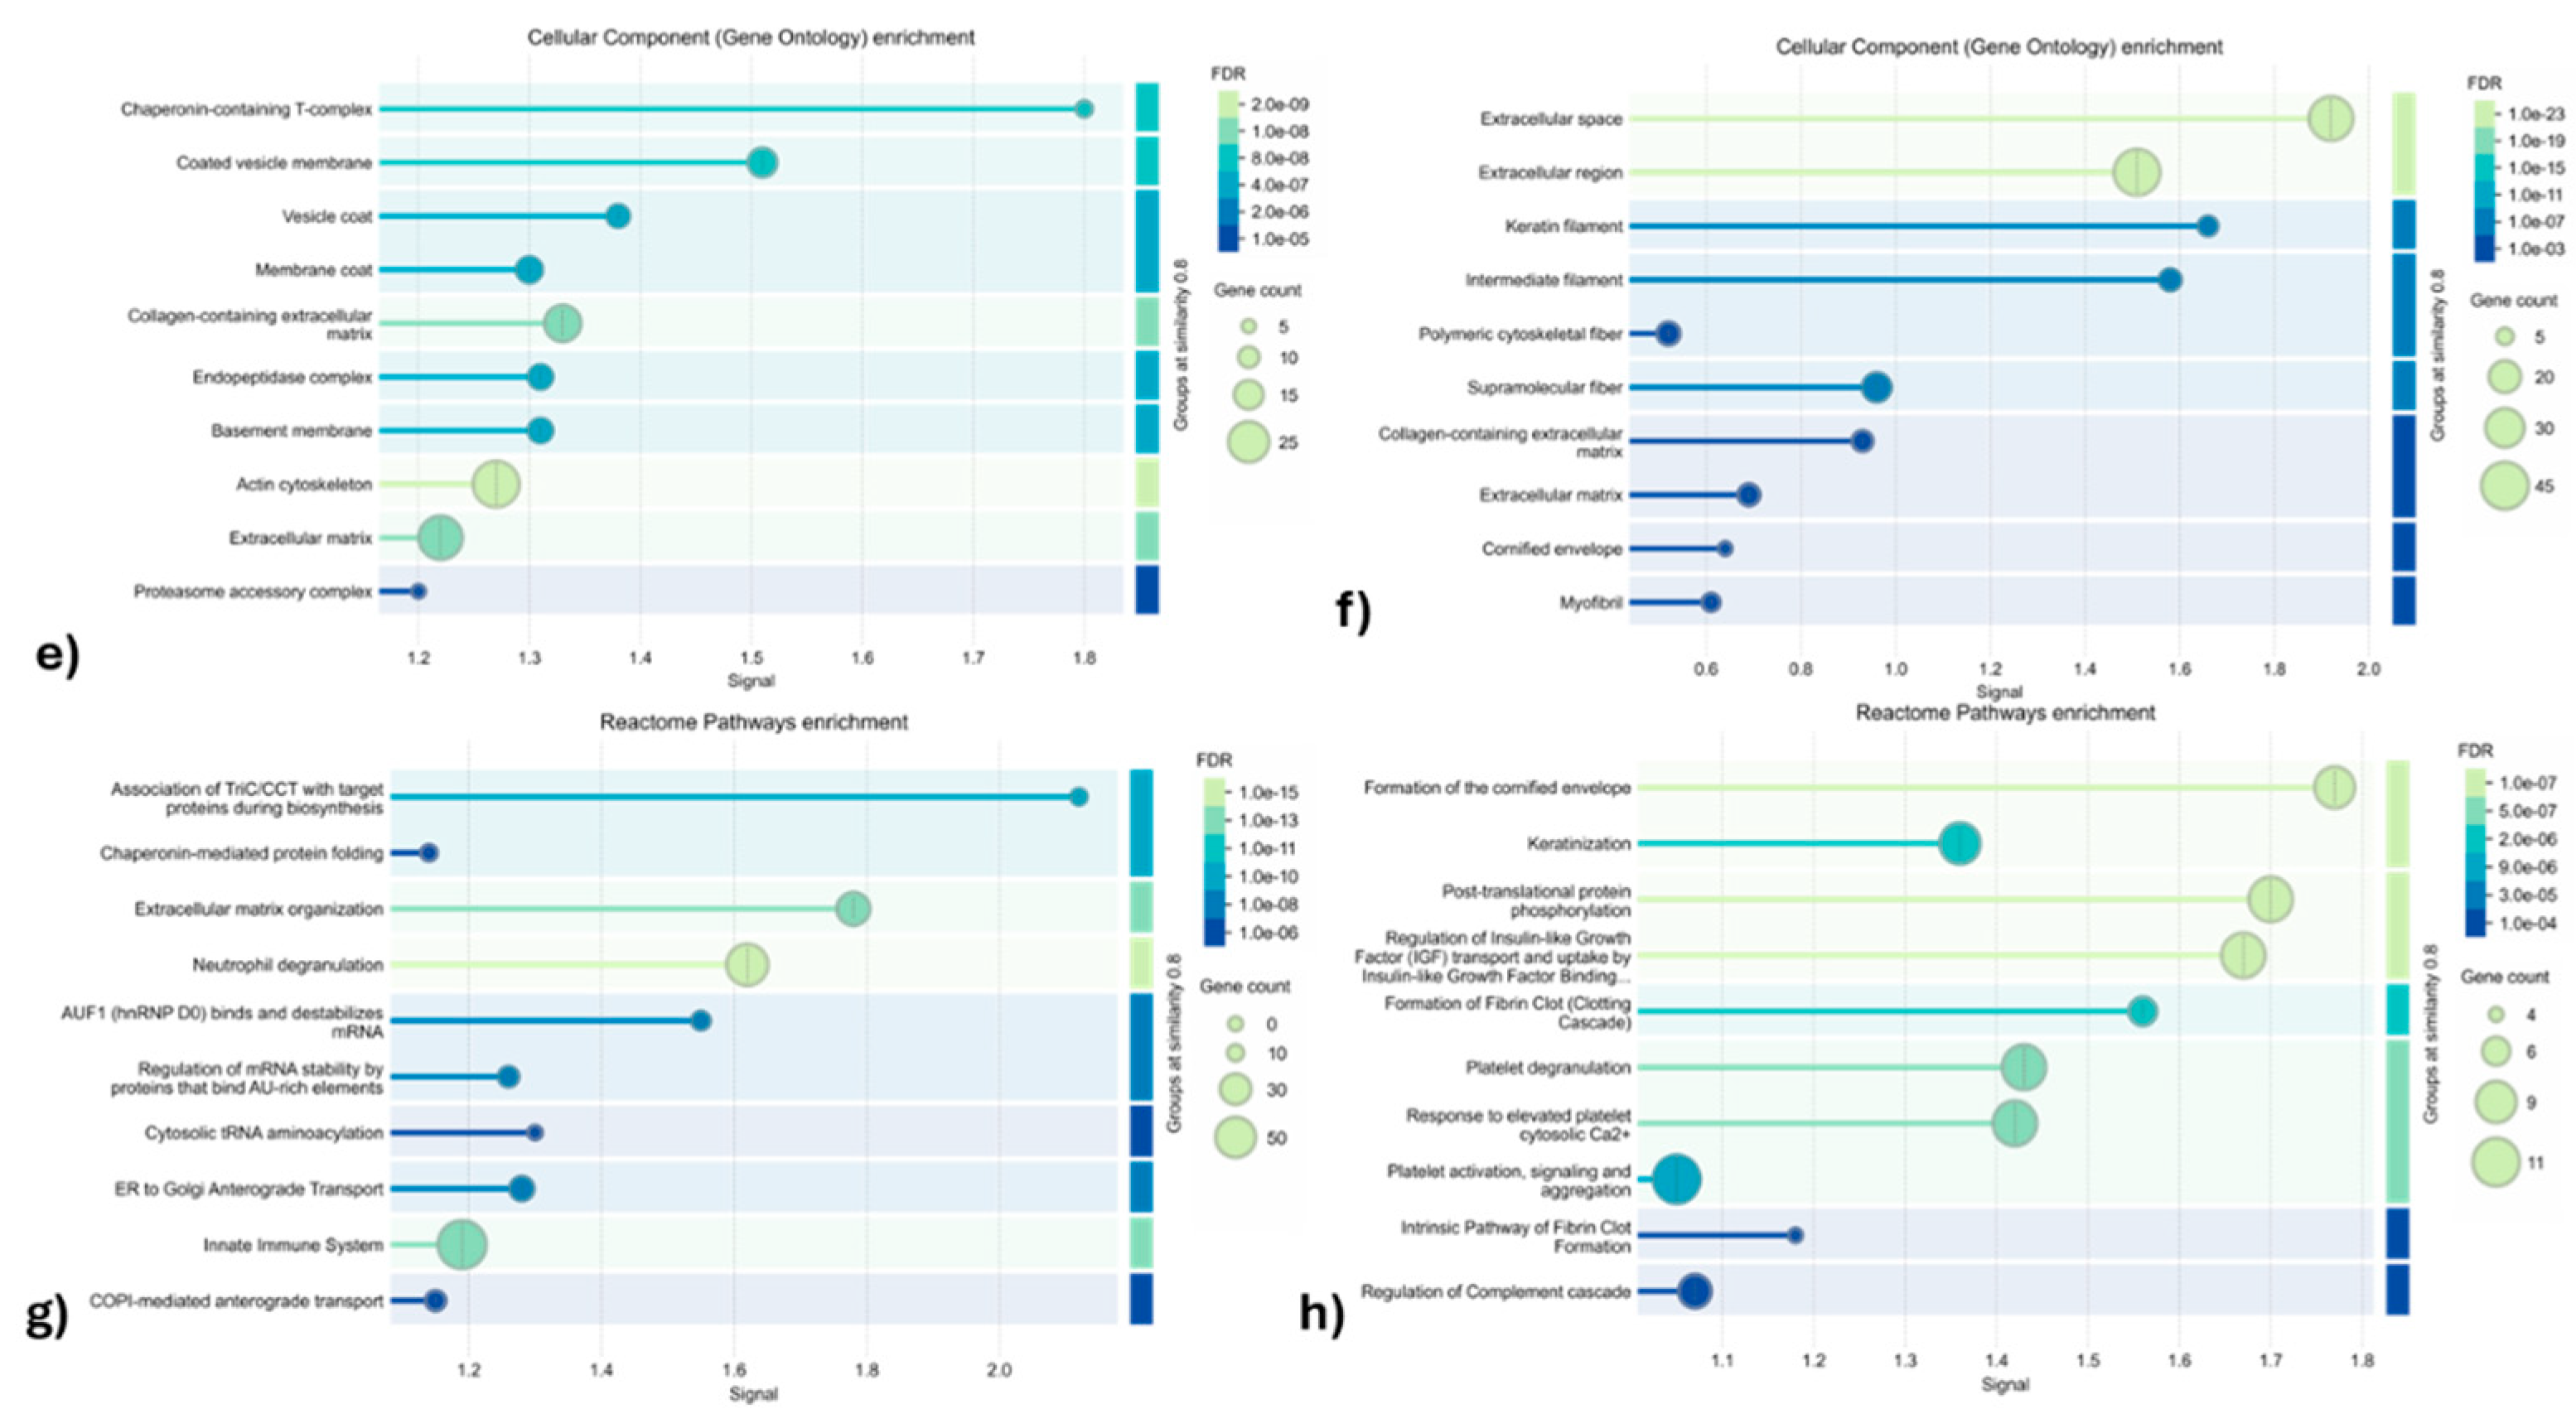
Figure 7.
Gene ontology analysis of 136 DAPs between myofibroblast (0 hour) and myofibroblast co-culture with ET-eMSCs (48 hours). The top ten biological process categories, cellular component categories, and molecular function are presented. The plots on the left represent the analysis of downregulated genes, while those on the right correspond to upregulated genes. The size of each bubble indicates the number of genes enriched in each category, and the color gradient represents the false discovery rate (FDR) values. The analysis was performed using the STRING v12.0 analysis tool, with an FDR threshold of 0.05 and a minimal signal of 0.01.
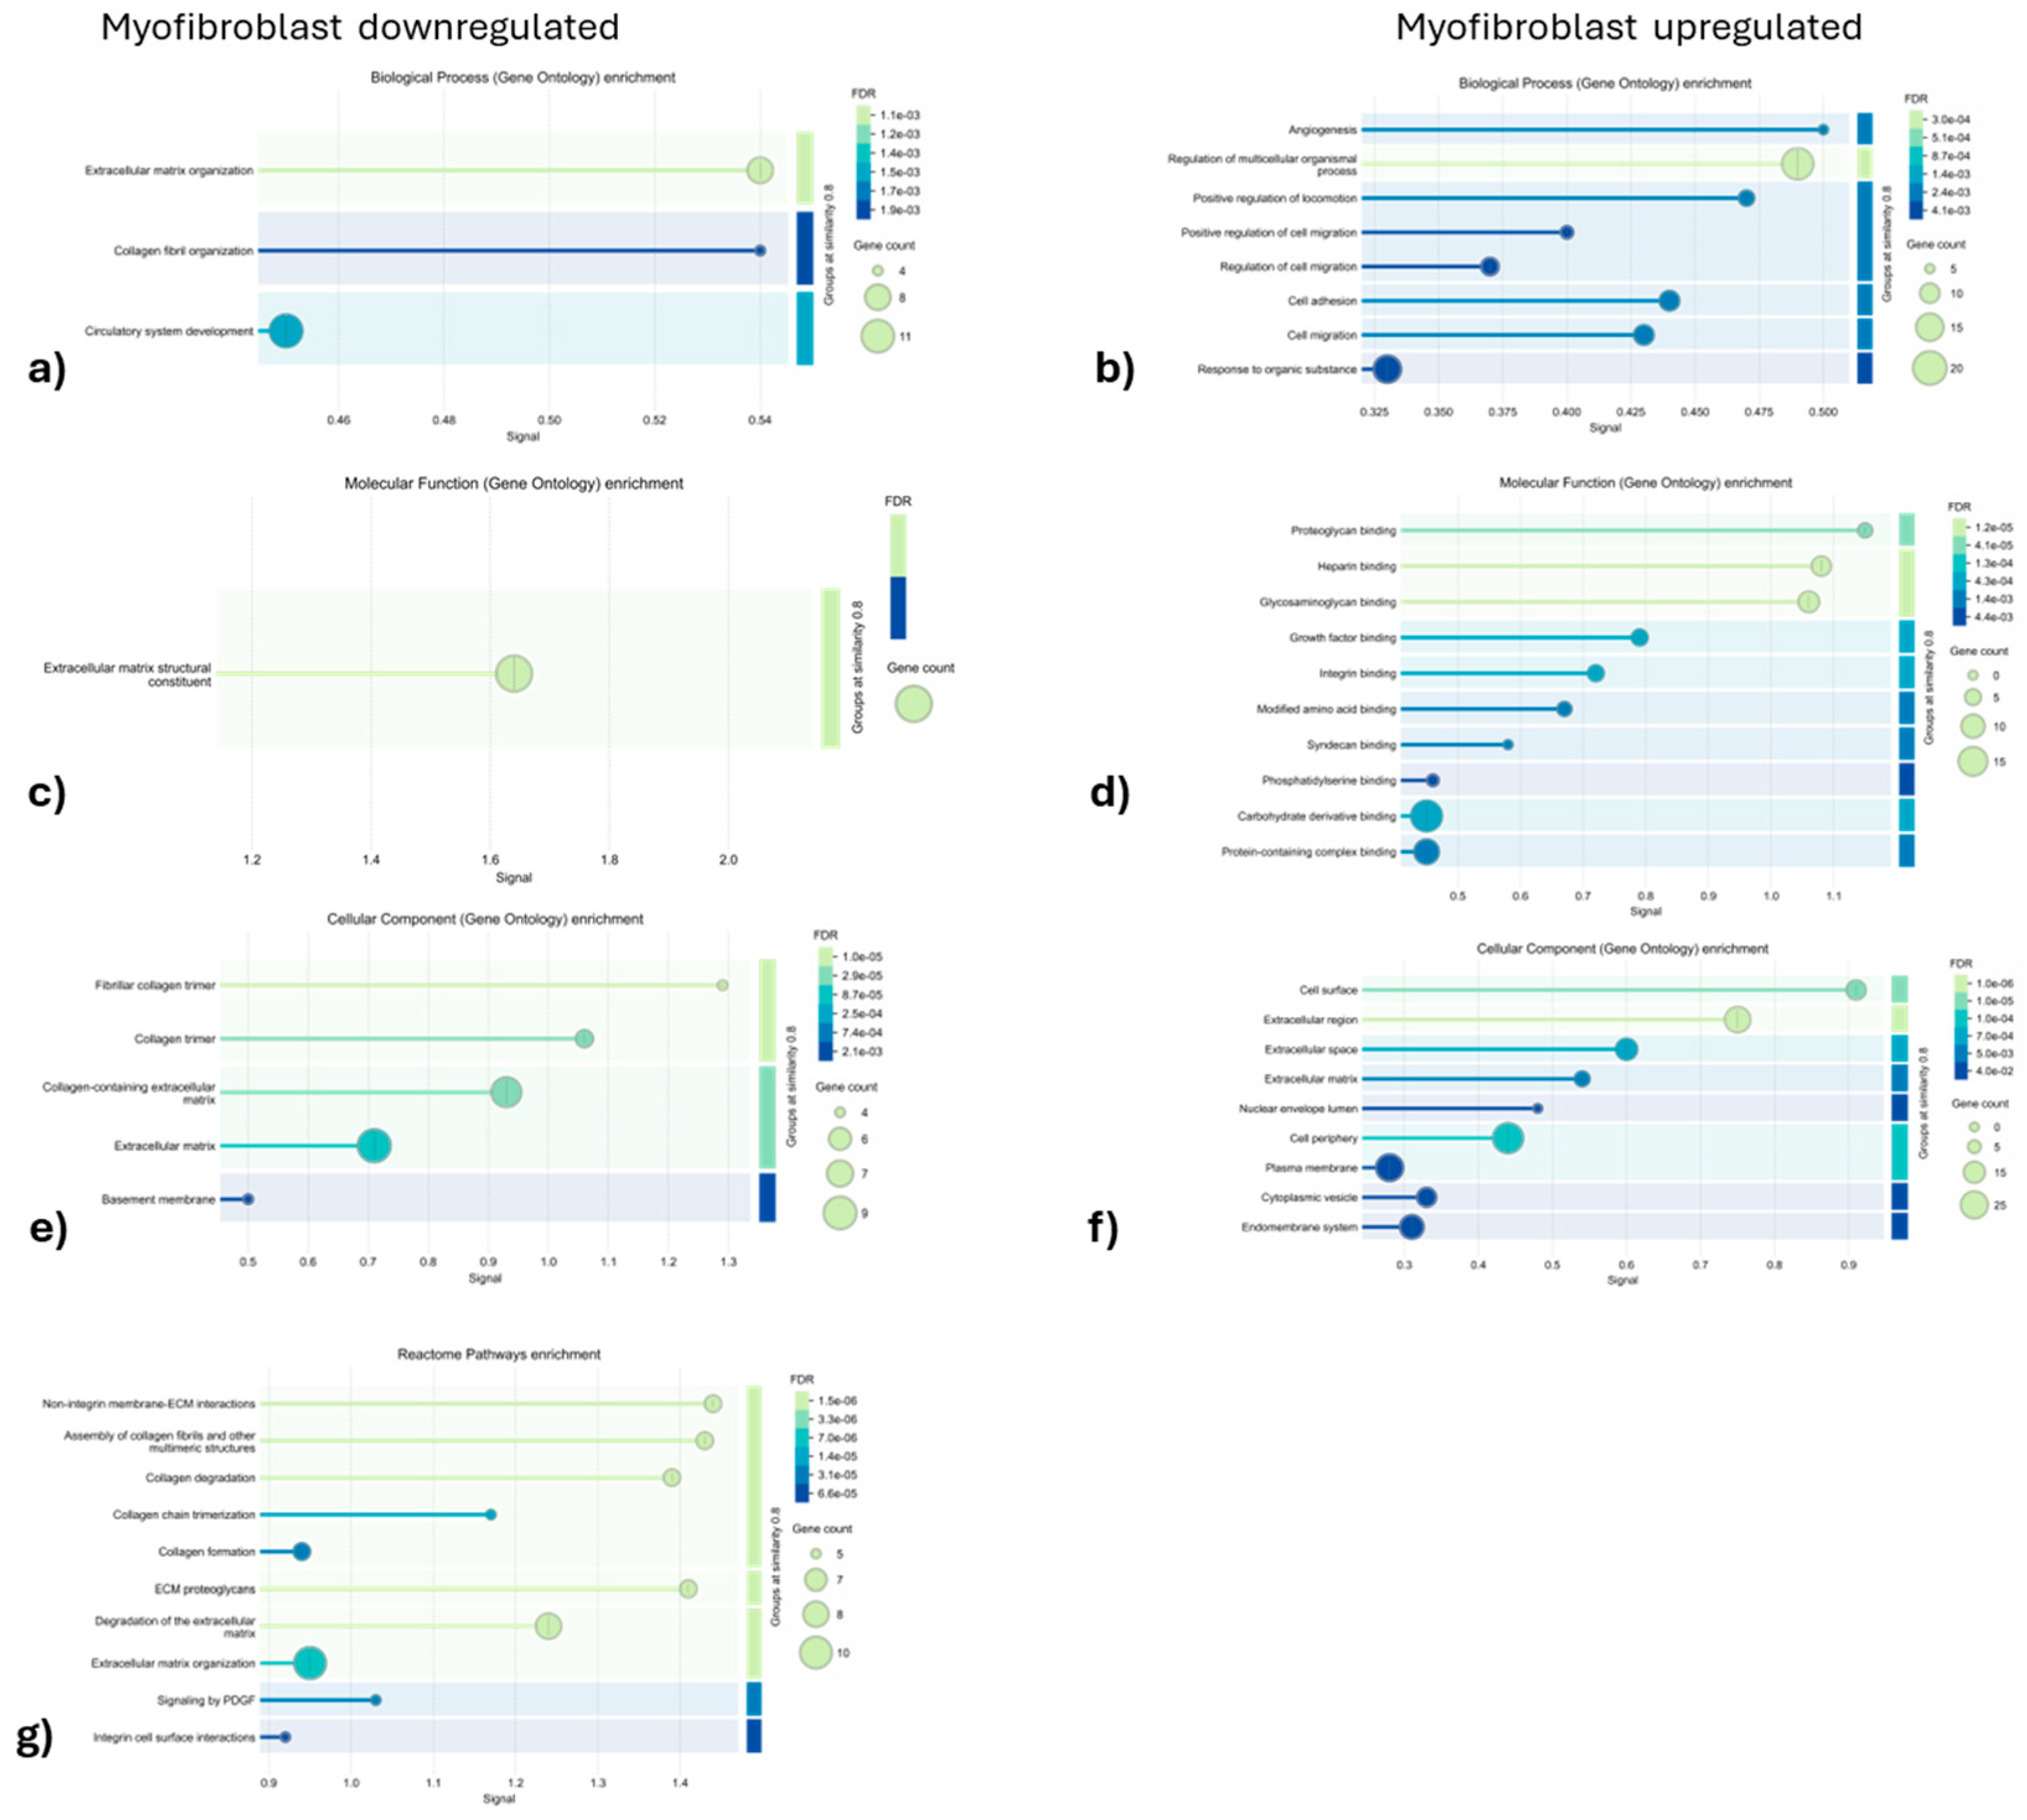
Figure 8.
Differential abundance heatmaps of fibrosis-related proteins in myofibroblasts and the secretome of ET-eMSC samples. (a) The heatmap illustrates the abundance profiles of differentially abundant fibrosis-related proteins in myofibroblast samples co-cultured with ET-eMSC+PGE2 at two time points: 0 hours (Myo.0H) and 48 hours (Myo.48H). (b) The heatmap depicts DAPs in secretome of ET-eMSC samples from ET-eMSC preconditioned with PGE2 (eMSC.0H) and after 48 hours of co-culture with myofibroblasts (eMSC.48H). The color scale represents changes in protein abundance, with red indicating upregulation, green indicating downregulation, and black representing minimal or no change.
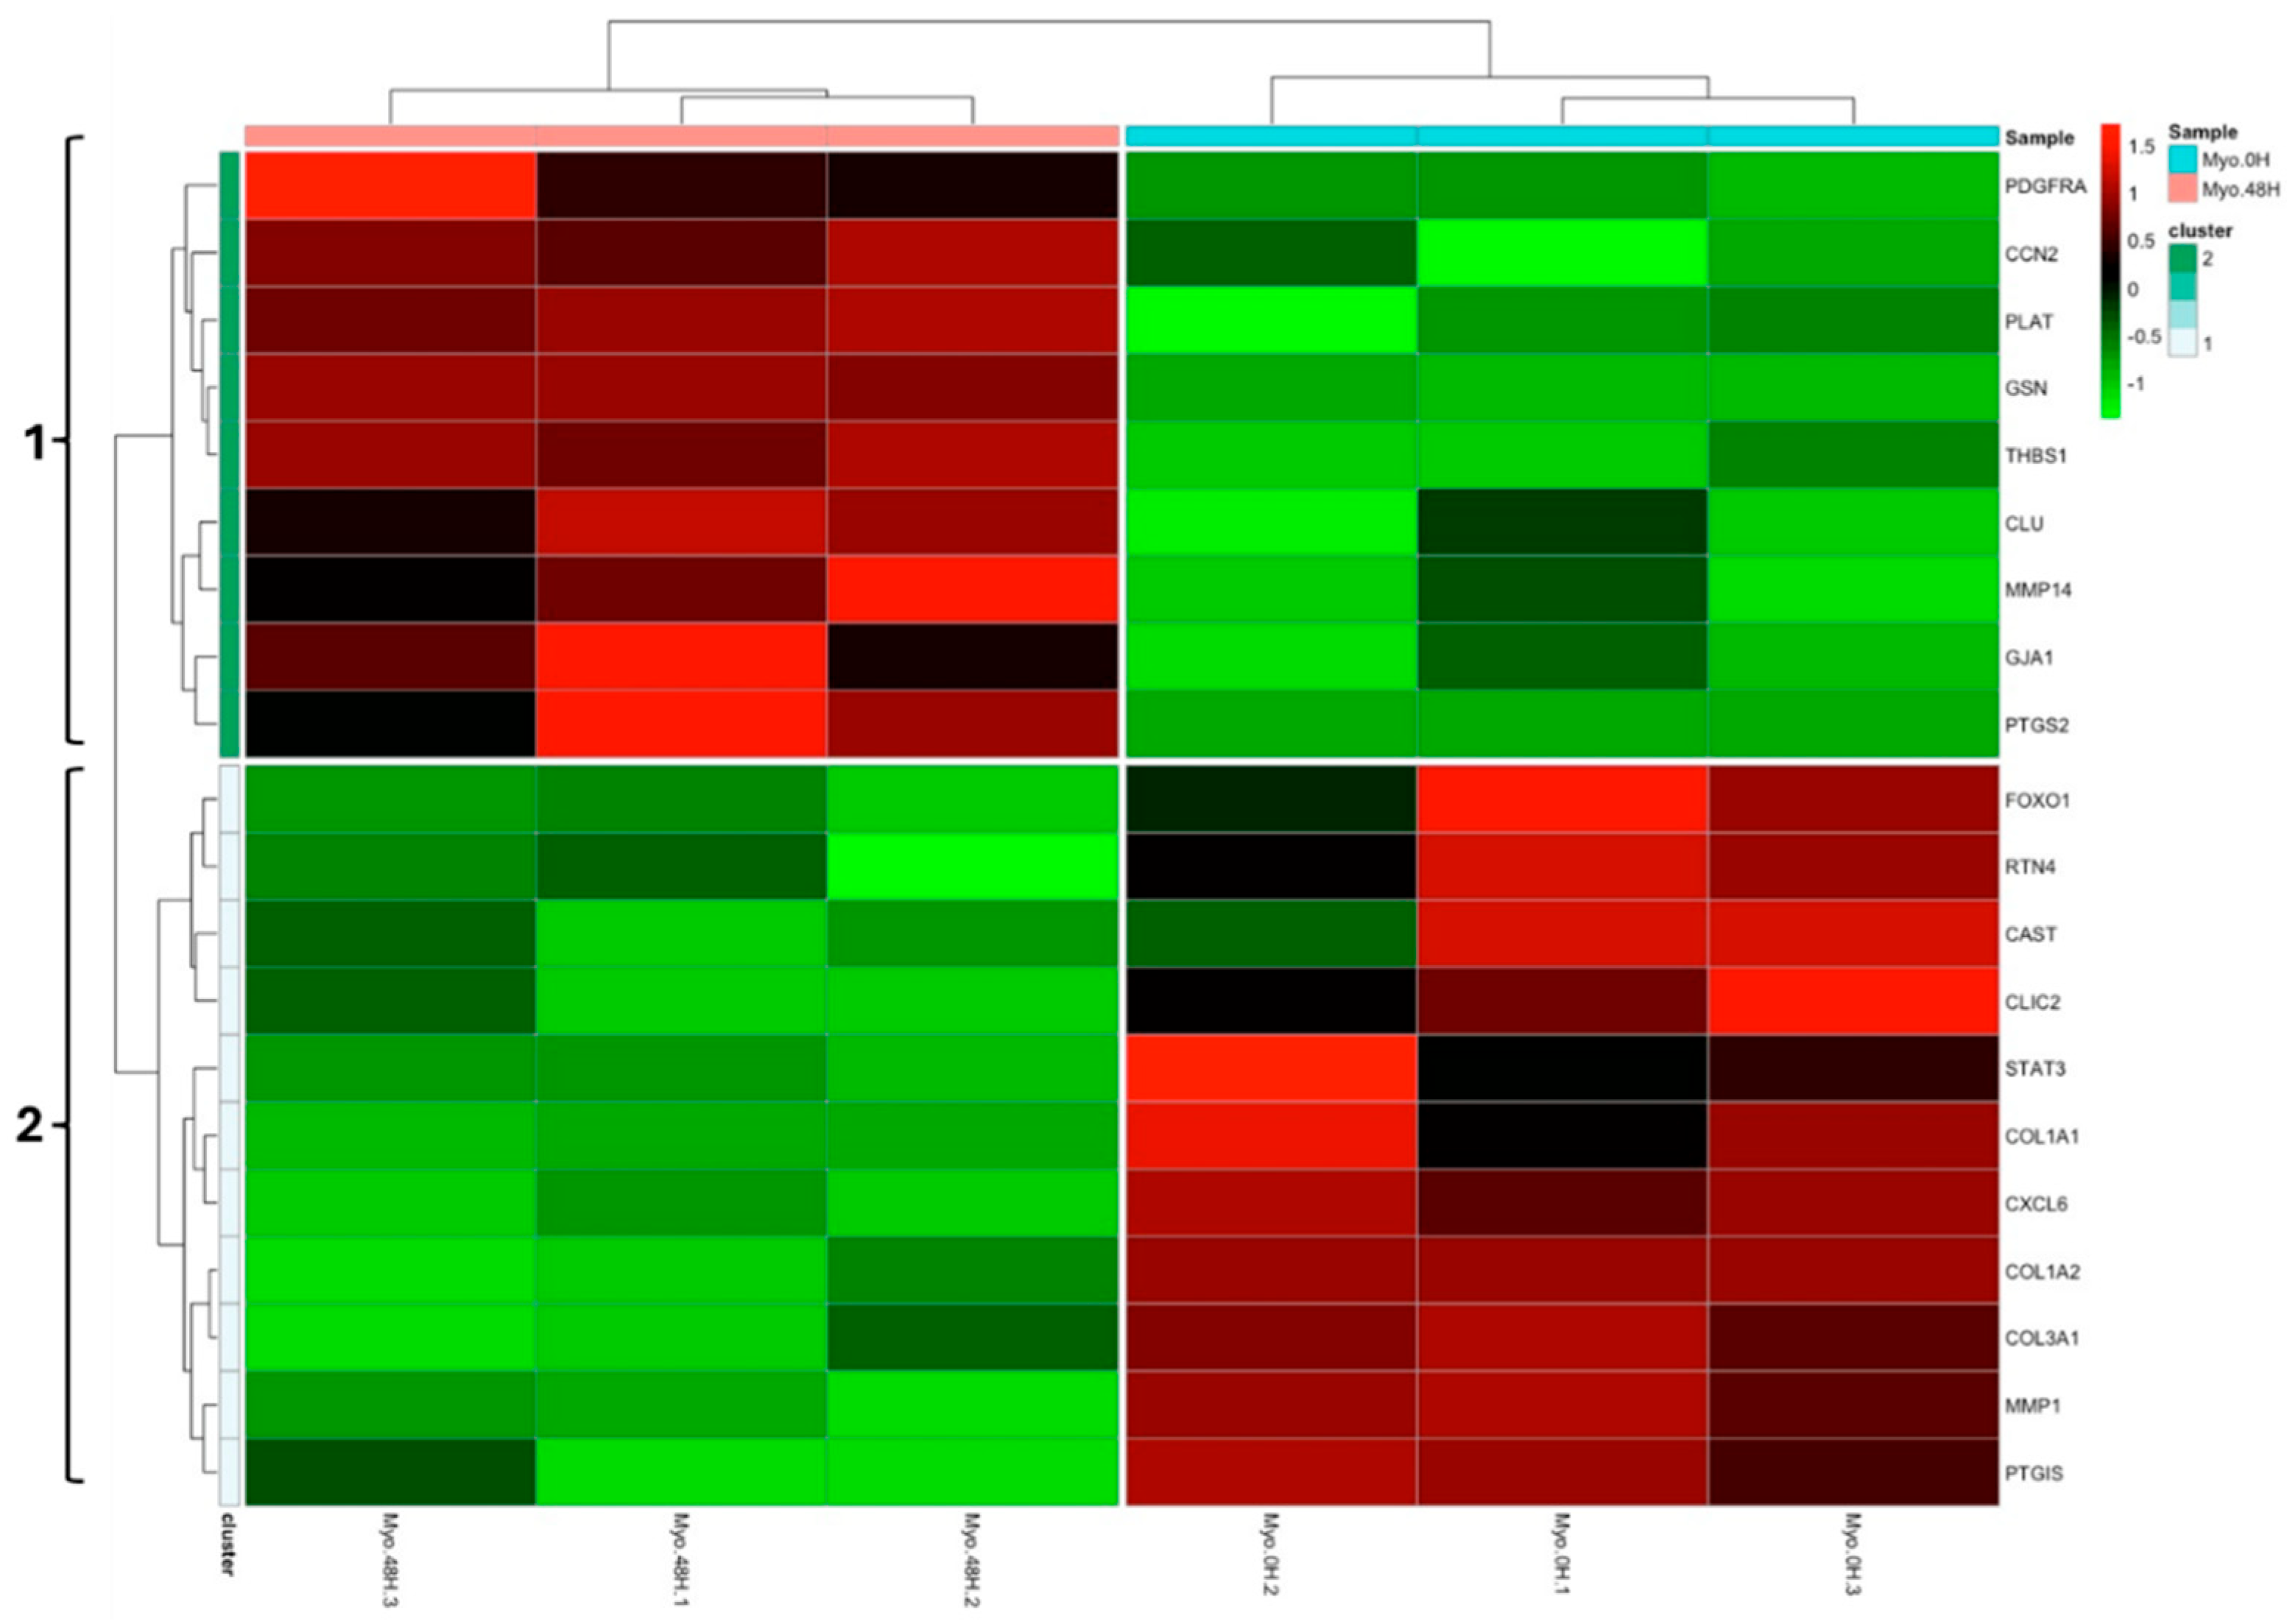
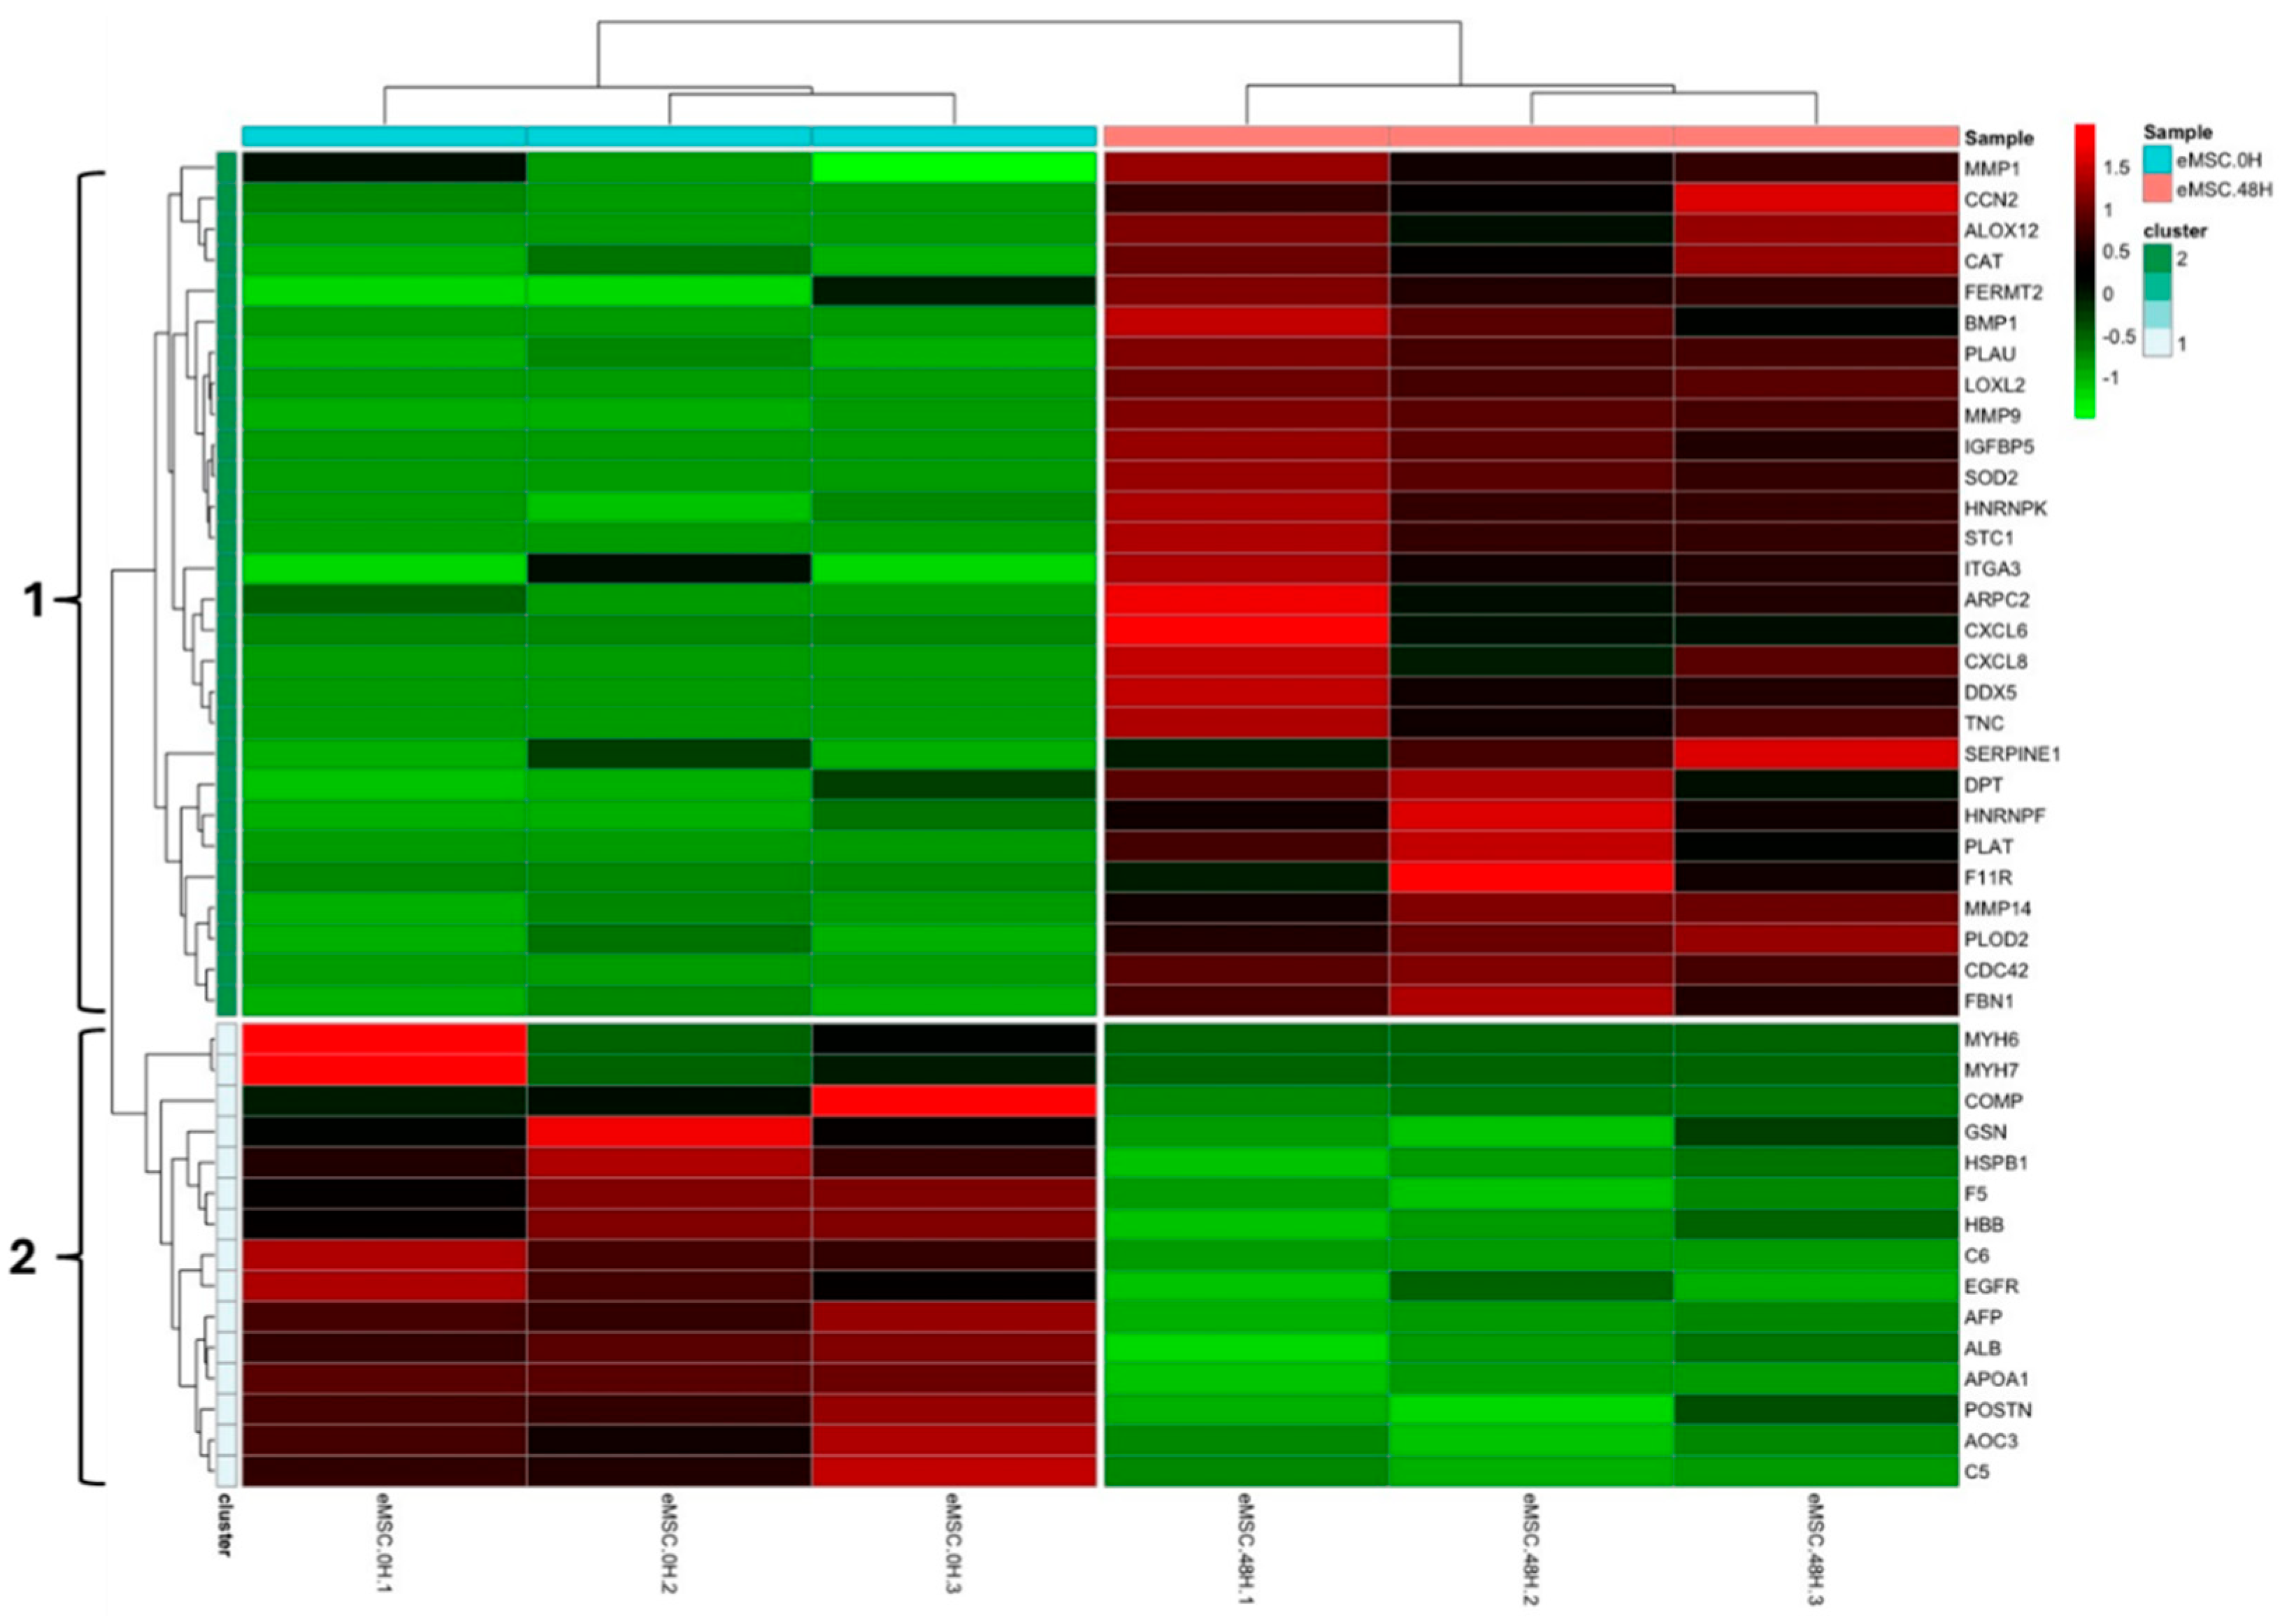
Figure 9.
Comparison of the total number of quantified proteins (yellow bars) and the number of significantly differentially abundant proteins (green bars) for each contrast evaluated using the Heavy/Light (H/L) SILAC ratio. T0EMSC.
Figure 9.
Comparison of the total number of quantified proteins (yellow bars) and the number of significantly differentially abundant proteins (green bars) for each contrast evaluated using the Heavy/Light (H/L) SILAC ratio. T0EMSC.
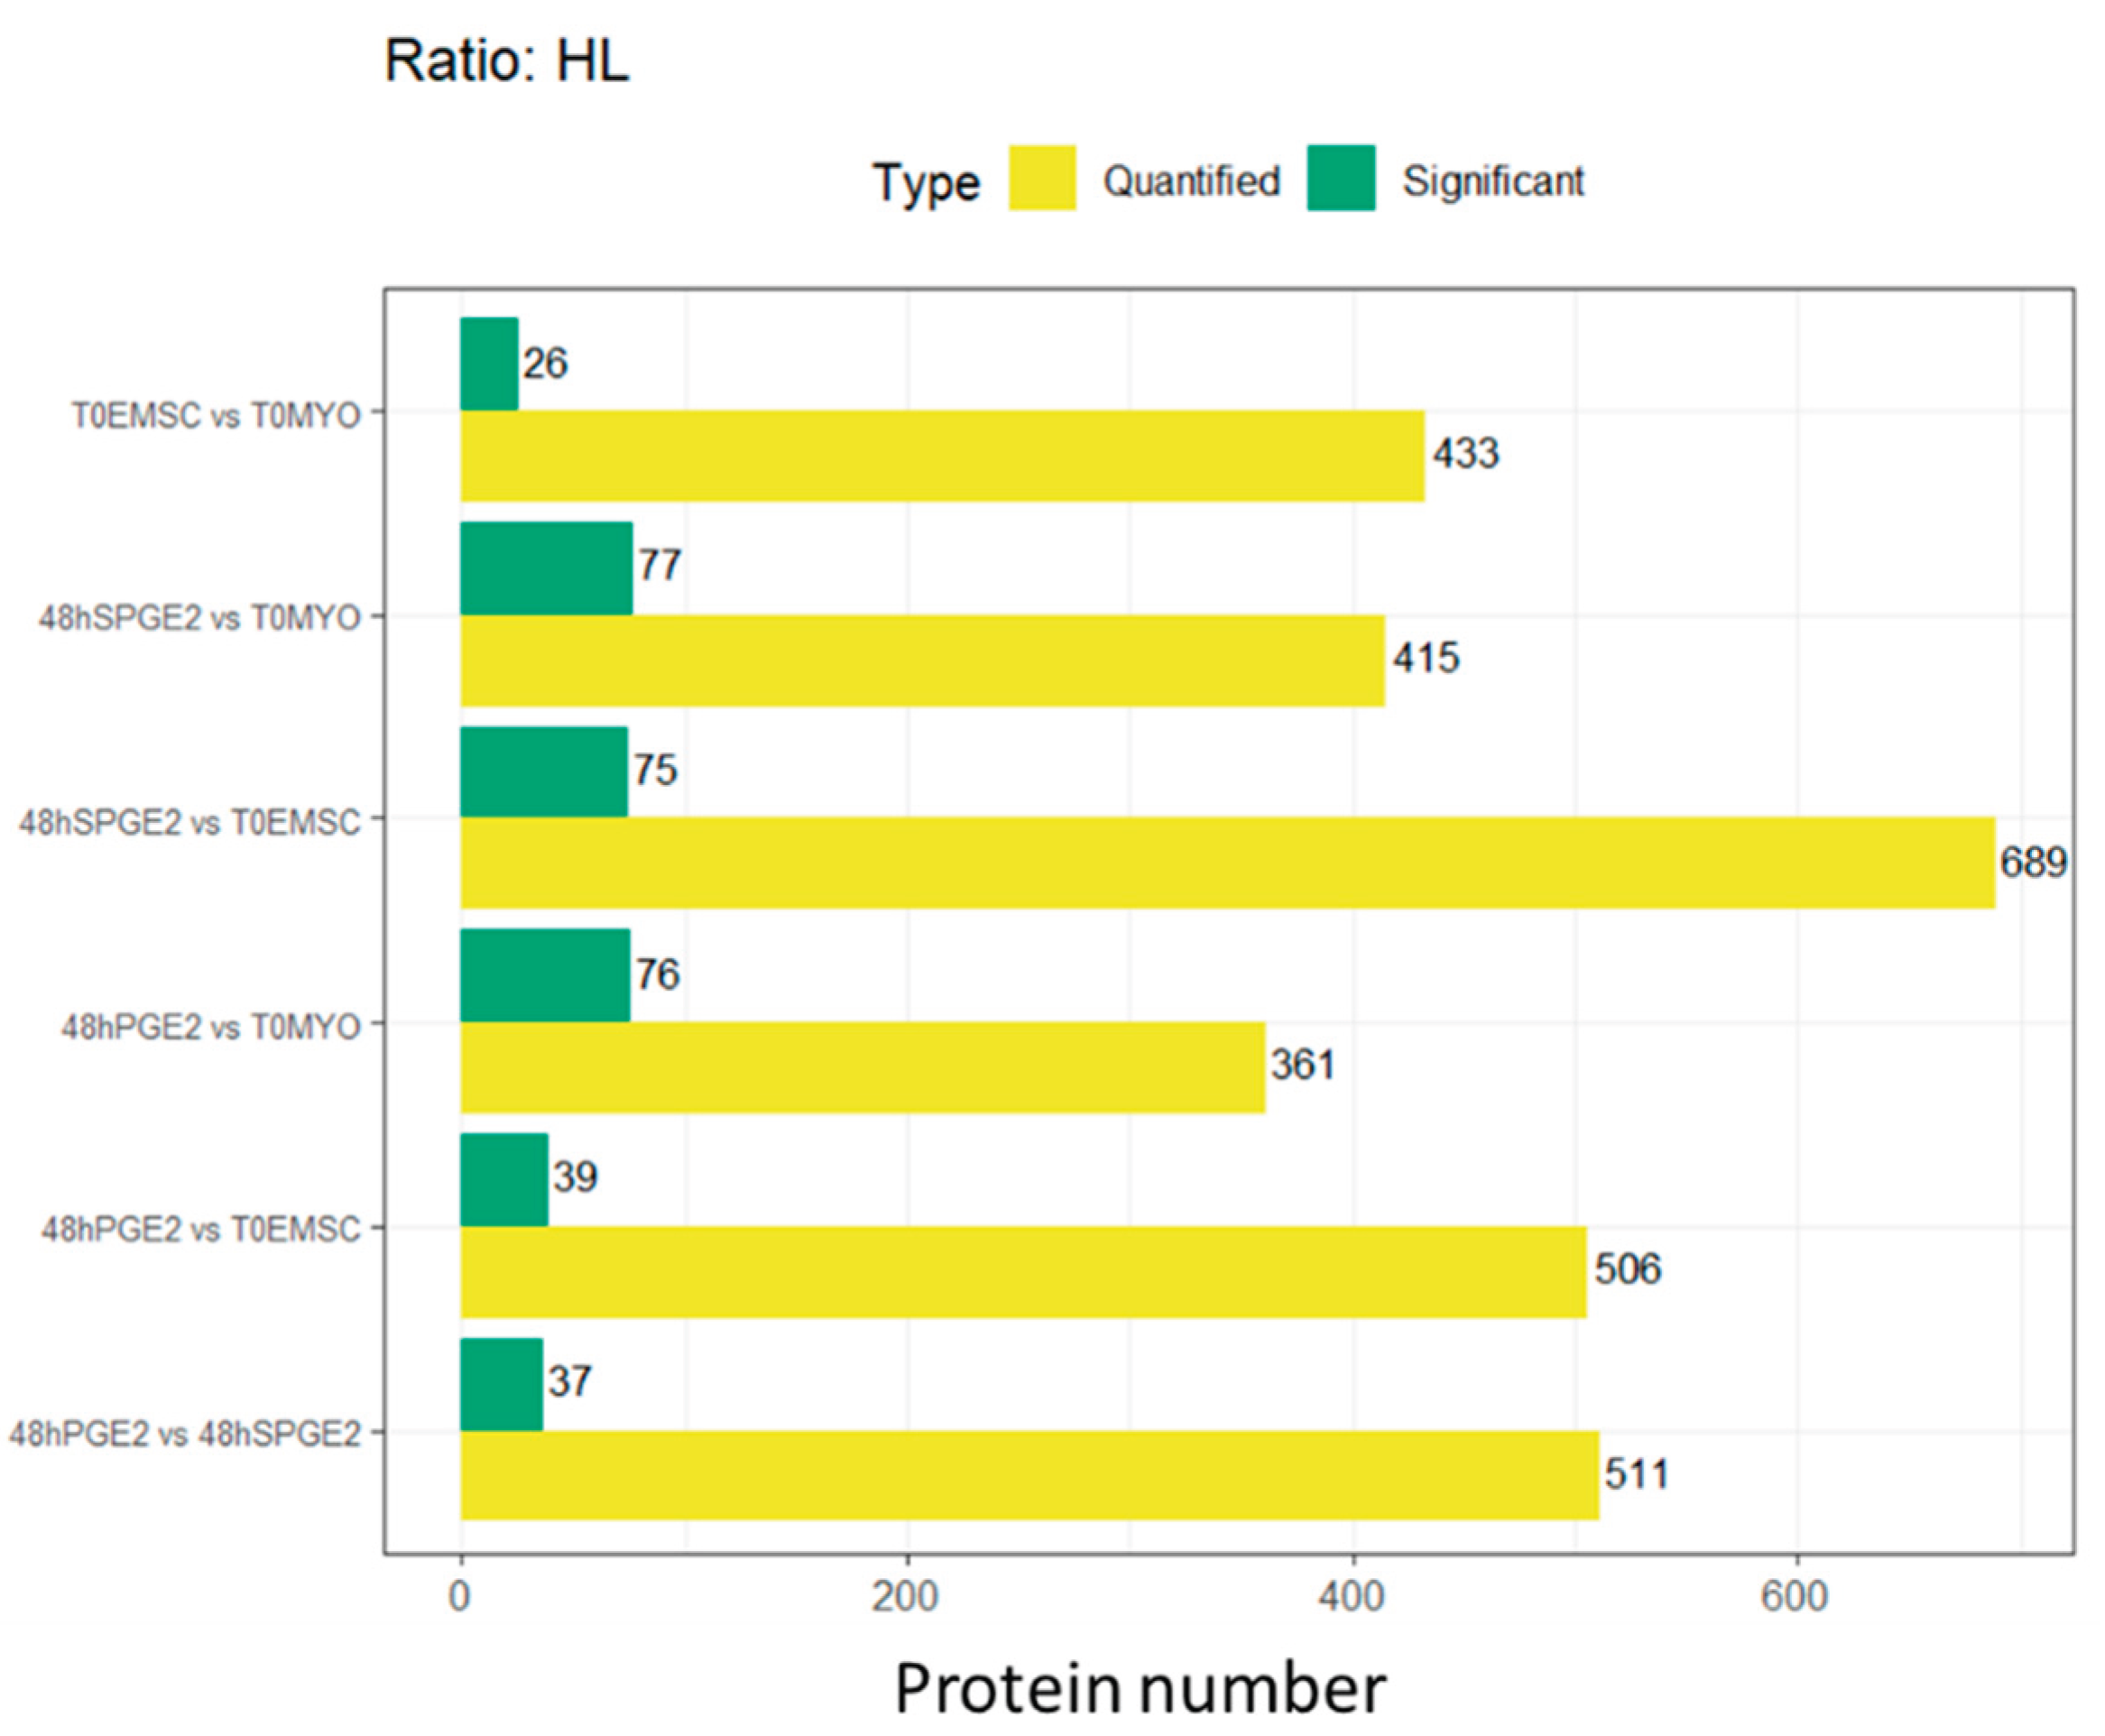

Table 1.
Summary of Key Secreted Proteins Mediating Bidirectional Crosstalk between PGE₂-Preconditioned Mesenchymal Stem Cells and Myofibroblasts: Differential Regulation in Experiment 1 and SILAC-Based Cellular Origin in Experiment 2.
Table 1.
Summary of Key Secreted Proteins Mediating Bidirectional Crosstalk between PGE₂-Preconditioned Mesenchymal Stem Cells and Myofibroblasts: Differential Regulation in Experiment 1 and SILAC-Based Cellular Origin in Experiment 2.
| Secretome Experiment 1 (abundance) | Secretome Experiment 2 (identification in donor samples) | Origen cell | ||||
|---|---|---|---|---|---|---|
| Gene name | Secretome 48 hours vs 0 hours | 48H PGE2 | 48H SPGE2 | T0MSC | T0MYO | |
| MMP1 | high abundance | + | + | + | + | both |
| MMP2 | Equal | + | + | + | + | both |
| MMP9 | high abundance | + | + | + | + | both |
| MMP14 | high abundance | + | + | - | + | both |
| TIMP1 | Equal | + | + | + | + | both |
| TIMP2 | Equal | + | + | + | + | both |
| MXRA5 | high abundance | + | + | - | + | both |
| MXRA8 | high abundance | + | + | - | - | ET-eMSC |
| CXCL6 | high abundance | + | + | - | + | MYO |
| CXCL8 | high abundance | + | + | - | - | both |
| C-C motif chemokine | Equal | + | + | - | + | MYO |
| HMGB1 | Equal | + | + | - | - | both |
| THBS 1 | Equal | + | + | + | + | both |
| THBS 2 | Equal | + | + | + | + | both |
| PLAU | high abundance | + | + | + | + | both |
| SERPINE 1 | high abundance | + | + | + | + | both |
| CCN2/CTGF | high abundance | - | + | - | + | both |
| TGF β1 | Equal | - | + | - | - | both |
| INHBA | high abundance | + | + | - | + | both |
| PCOLCE | high abundance | + | + | + | + | both |
| PCOLCE2 | Equal | + | + | + | + | both |
Both: Presence of labeled peptides with heavy arginine as lysine, denoting proteins produced by ET-eMSC as Myofibroblasts, respectively.ET-eMSC: detection of peptides only labeled with 13C_615N_4 L-Arginine HCl.MYO: detection of peptides only labeled with 13C_6 15N_2 L-Lysine-2HCl. + Represents the detection of the protein m in the sample. - Absence of the detection of the protein in the sample
Disclaimer/Publisher’s Note: The statements, opinions and data contained in all publications are solely those of the individual author(s) and contributor(s) and not of MDPI and/or the editor(s). MDPI and/or the editor(s) disclaim responsibility for any injury to people or property resulting from any ideas, methods, instructions or products referred to in the content. |
© 2025 by the authors. Licensee MDPI, Basel, Switzerland. This article is an open access article distributed under the terms and conditions of the Creative Commons Attribution (CC BY) license (http://creativecommons.org/licenses/by/4.0/).
Copyright: This open access article is published under a Creative Commons CC BY 4.0 license, which permit the free download, distribution, and reuse, provided that the author and preprint are cited in any reuse.


