
Submitted:
25 June 2025
Posted:
25 June 2025
You are already at the latest version
Abstract
Birds are important indicators of ecosystem health and provide a range of benefits to society. It is important, therefore, to understand the impacts of agricultural land use changes on bird populations. The cultivation of energycane (EC) – a sugarcane hybrid – for biofuel production represents one form of agricultural land use change in southern Florida. We used passive acoustic monitoring (PAM) to examine bird community use of experimental EC fields and other agricultural land uses at two study sites in southern Florida. We deployed 16 acoustic recorders in different study plots and identified 30 focal bird species. We found no difference in avian species richness or occurrence rates between EC plots and reference agricultural fields (corn fields, orchards, pastureland) or between time periods (pre-planting, post-planting). Our data supports previous research on some species- and taxonomic-specific responses to sugarcane. Overall, our results suggest that avian communities utilize EC cropping systems similar to other agricultural land uses in southern Florida.
Keywords:
bioenergy
; ecology
; agriculture
; land use change
; sugarcane
; BirdNET
1. Introduction
The United States is projected to be capable of producing up to 1.5 billion tons of biomass annually under a mature future market scenario [1]. This estimated biomass production is expected to come from multiple sources including agricultural and forest residues, dedicated energy crops, algae, and municipal solid waste [1]. High-yielding perennial grasses will likely comprise most of the biomass production coming from dedicated energy crops. Due to the varying eco-physiological conditions on which perennial grasses inherently grow and thrive, the choice of which species or cultivars to grow vary by region to maximize yields. Energycane (Saccharum spp hybridd), a sugarcane hybrid, is considered a top dedicated biomass crop [2], especially for the coastal plains of the U.S. Southeast due to its sub-tropical climate suitability. Past studies showed that energycane (EC) outperformed other important biomass crops (e.g., hybrid poplar, switchgrass, miscanthus, sorghum, etc.) in the sub-tropical and tropical regions [3,4]. For instance, in marginal soils of Florida, EC produced 30-34 Mg/ha dry biomass, outperforming other perennial bioenergy grasses [4,5]. As a deep rooting and high-yielding crop, EC could help provide a sustainable supply of biomass required to produce fuels for the hard to electrify sector of the transportation industry such as aviation, in addition to biomass-based chemicals and materials. EC production at scale could also help revitalize the rural economy particularly the U.S. Southeast citrus industry which is significantly affected by citrus greening [6] by providing an alternative crop production system. There is a need to understand how this proposed EC production system impacts biodiversity, especially local bird populations since large-scale biomass production could drive considerable changes in landscape configuration that have significant implications for bird species [7].
Birds offer a range of benefits to society including provisioning, supporting, regulating, and cultural services. They contribute to provisioning services through products and raw materials that have market value (e.g., eggs and meat, feathers, guano as fertilizer, etc.) [8,9,10,11]. As predators, pollinators, seed dispersers, nutrient recyclers, and biodiversity maintainers, they provide supporting services that are not only critical for maintaining ecosystem balance but also for food security [9,10,11,12,13]. Two of the primary regulating services they provide include scavenging of carcasses which helps maintain ecosystem and public health and controlling agricultural pests which contributes to crop productivity [8,10,11]. Aside from the ecological roles, birds are important because of their aesthetic, recreational, cultural, and spiritual significance, enriching human well-being and culture through birdwatching and by inspiring works of art and folklore [8,9,13].
While bird populations vary in their responses to changes in land use and land cover associated with biomass production [14], nesting birds can be impacted by the loss of suitable habitats from large-scale monocultural corn production for ethanol [15]. A more recent study found that advanced switchgrass cultivars in the marginal croplands of the U.S. Midwest has the potential to contribute to the conservation of grassland birds, which are among the species to experience population declines across the nation, through replacement of lost habitats [16]. Crop management plays an important role in determining the impacts of perennial biomass crop production on bird population and diversity. Harvest timing, for instance, could optimize the tradeoffs between maximizing biomass yield and wildlife habitat, especially for ring-necked pheasants (Phasianus colchicus) [17].
There is a paucity of information about the ecological impacts of EC production for bioenergy. EC production systems may affect bird community structure (i.e., species richness) since it could change seasonal landscape vegetation composition. In this study, we used passive acoustic monitoring (PAM) to examine the avian community use of EC production in southern Florida. Aided by advancements in artificial intelligence (AI) to improve species call recognition (e.g., BirdNET [18]), PAM has become a widely implemented tool for ecologists and natural resource managers to monitor bird communities (e.g., [16,19,20,21]). Recent studies have shown that automated approaches using PAM can sometimes outperform more traditional methods of estimating avian species richness such as point count surveys [21]. We used PAM and BirdNET to determine whether avian species richness and occurrence patterns differed by monitoring location (e.g., EC experimental plots, reference areas) and between time periods (before planting, after planting).
2. Materials and Methods
2.1. Study Site Location and Experiment Plot Layout
This study was conducted at two agricultural research sites in southern Florida, USA. One was located at the Everglades Research and Education Center (EREC), Belle Glade, FL, while the other was located at the Indian River Research and Education Center (IRREC), Fort Pierce, FL (Figure 1). Both EREC and IRREC are owned by the University of Florida.
The EREC site (26.66°N, 80.63°W) is located on the southeastern shore of Lake Okeechobee, which is part of the Everglades Agricultural Area (EAA). It has organic soil (Histosols), the predominant soil type in the EAA. Soil carbon oxidation over the past few decades has caused the soils to become shallow, with most fields having less than one meter of soil above the bedrock. The increased incorporation of lime from the underlying bedrock has raised the soil pH, reducing nutrient availability for crops, which classifies the soils as marginal. The primary agricultural crop grown in the area is sugarcane, which is grown successively or in rotation with sweet corn or another crop. Soil subsidence and nutrient runoff into the Florida Everglades are significant environmental concerns. The IRREC site (27.43°N, 80.41°W) is in central Florida, characterized by a subtropical climate and high rainfall. It has sandy soils, which have low organic matter, limited water retention, and poor nutrient content. Effective water and nutrient management are essential for these marginal soils. Over the past decade, citrus acreage in the area has decreased by 40% primarily due to citrus greening [6], creating a need for alternative cropping systems suited to the region's challenging climatic and soil conditions.
Each study site was divided into multiple experimental plots. The EREC site had an experimental treatment plot of approximately 3 ha (7.6 ac) with a total of 48 subplots comprised of three crops: EC, sugarcane, and sweet corn (Figure 1A). The IRREC site had an experimental treatment plot of approximately 1.6 ha (4 ac) (Figure 1B), which was only planted with EC or left fallow because this pilot site was intended as an EC monoculture production for sandy follow lands that are formerly orange groves. Planting of crops within the experimental treatment plots occurred on 11-12 January, 2023 at EREC and 21-22 December, 2022 at IRREC. EC harvest at both sites occurred in February 2024 after the EC had matured.
2.2. Acoustic Monitoring
Autonomous acoustic recording units (ARUs; Wildlife Acoustics Song Meter Mini, Maynard, MA, USA) were utilized in this study to conduct a near-continuous survey of bird species at the EREC and IRREC sites. A total of 16 acoustic recorders (eight at each site) were deployed from July 2021 to March 2024, attached to metal posts approximately 1.5 m above the ground. The monitoring period was divided into two temporal categories: prior to the planting of EC (“pre-planting” period from January 2021 to December 2022) and after the crops were planted (“post-planting” period from January 2023 to March 2024). At each site the acoustic recorders were divided evenly into treatment and reference groups (Figure 1). At each site, 4 ARUs were deployed in the experimental treatment plots where EC was planted, while 4 ARUs were distributed in reference areas around the experimental plots. The reference areas consisted primarily of corn fields (n=3), former citrus orchards (n=2), and pasture fields (n=3). We were not able to install ARUs in the reference area during the pre-planting period. Reference areas were only monitored during the post-planting period. Given the relatively small sizes of the experimental plots, the ARUs in the treatment areas were spaced approximately 50 m from one another. The ARUs in the reference areas were spaced >200 m apart and were between 250 – 1,000 m away from the treatment areas (Figure 1). Example photographs of site conditions at EREC and IRREC during the pre-planting period and post-planting period are shown in Figure 2. The ARUs were programmed to record 16-bit WAV audio at a sample rate of 24000 Hz for a total of four hours each day: one hour before sunrise to one hour after sunrise, and one hour before sunset to one hour after sunset. The gain setting on the ARUs was set at the default setting (18 dB) and microphones were checked before installation. ARUs were visited approximately every two to four weeks to check batteries and digital memory (SD) cards.
2.3. Acoustic Data Processing
We analyzed the recorded audio files with the BirdNET algorithm [18], a deep neural network capable of identifying over 6,000 bird species based on their vocalizations alone. We used BirdNET Version 2.4, which was configured to make species predictions based on weekly eBird [22] checklists for the geographic area near each survey location. We set the minimum confidence threshold to 0.25 and used default BirdNET parameter settings for sensitivity (1) and overlap (0). We saved all BirdNET results as tab-delimited data tables.
To assess BirdNET performance and select focal bird species for our analyses, we first identified 40 candidate bird species that were known to occur in the region (Supplement Table S1-1). We then randomly selected 100 BirdNET-generated detections for each species, stratified across the following BirdNET confidence intervals: <0.30 (i.e., 0.25 – 0.29), 0.30 – 0.39, 0.40 – 0.49, 0.50 – 0.59; 0.60 – 0.69; 0.70 – 0.79; 0.80 – 0.89; and >= 0.90. There were 13 sample recordings in each confidence interval except for the lowest interval (0.25 – 0.29) which had 9 recordings. All 4,000 sample recordings were manually reviewed by trained biologists to determine BirdNET precision, as follows:
A true positive detection occurred when the observer confirmed that a species was accurately classified by BirdNET. A false positive detection occurred when BirdNET detected a species that was not confirmed by the observer. We then plotted precision estimates by the above BirdNET confidence intervals and determined the species-specific confidence threshold (SSCT) as the confidence level beyond which precision was consistently >= 0.90. If BirdNET failed to reach a consistent precision level >= 0.90, we removed that species from our focal species list. For all remaining focal species, we used the SSCT to filter all BirdNET detections and we assumed these to be valid detections. We used the packages ‘dplyr’ and ‘av’ in R version 4.4.1 [23] to organize, extract, and review BirdNET acoustic detections.
2.4. Analyses
Using the SSCT, we calculated valid daily focal species detections at each ARU. We categorized focal species into three broad taxonomic groups: (1) passerines, including other species such as doves and quail; (2) raptors, and (3) shorebirds and waterfowl. We summed the number of confirmed focal species at each ARU to determine daily species richness for each taxonomic group and total focal species richness (summed across all taxonomic groups). We then organized the data to make comparisons of species richness between treatment groups and temporal period. Our primary goal was to determine whether focal species richness changed in the experimental EC treatment plots after planting compared to other areas.
We focused our analyses on a 3-month period before EC planting (Oct-Dec 2021 and 2022) and the same 3-month period immediately before harvest of the EC (Oct-Dec 2023). This design accounts for seasonal variation in bird communities, allowing us to make direct comparisons between temporal periods. Although we deployed all 16 ARUs concurrently, there were several days in which some ARUs did not record due to technical difficulties or weather. Because unbalanced and inconsistent recordings among ARUs could influence the statistical comparisons of species richness if we were to pool all recordings, we randomly sampled acoustic recordings from each ARU. We randomly selected five days of acoustic recordings from each ARU each month from October to December. A complete day of recordings by an ARU consisted of 4 one-hour recordings (2 at sunrise, 2 at sunset). Thus, our random sampling design resulted in 20 one-hour acoustic files per ARU per month. From these randomly selected recordings, we calculated monthly focal species richness and daily species-specific occurrence proportions (e.g., 0 = species was never detected in any of the 5 randomly selected days; 1.0 = species was detected in all 5 randomly selected days).
We compared focal species richness between treatment groups using a nonparametric Kruskal-Wallis test. Initial analyses using parametric analyses of variance resulted in residuals that were not normally distributed despite several data transformations. We then made pairwise comparisons of species occurrence proportions between treatment groups and temporal periods. Since we were primarily interested in understanding how bird occurrence in the post-planting treatment plots compared to the other treatment groups, we designed paired comparisons (t-tests) between bird occurrences between post-planting treatment plots and the two other groups (pre-planting treatment, post-planting reference). All analyses were performed using R version 4.4.1 [23].
3. Results
3.1. Acoustic Recordings and Focal Species Detections
We collected a total of 19,676 hours of acoustic recordings from the 16 ARUs from July 2021 to March 2024, covering the pre-planting and post-planting periods. 2,308 hours of these recordings came from the pre-planting period (2021-2022) from 8 locations (four treatment plots at EREC; four treatment plots at IRREC), while 17,368 recording hours came from the post-planting period from 16 locations (Figure 1).
BirdNET made 4,694,225 total avian detections from the acoustic recordings, representing 222 different species. We inspected BirdNET precision for 40 of these species known to occur in the region during the fall and winter months (Supplemental Table S1-1). We retained 30 of these species as our focal species for this study (Table 1). The list of focal species included 5 raptors, 5 shorebirds, and 20 passerines or species belonging to other taxonomic groups (doves, bobwhite quail). These 30 species were selected based on our ability to determine a SSCT through evaluation of BirdNET precision (Supplemental 1). We combined some related focal species that had similar calls. For example, we combined Common Grackle and Boat-tailed Grackle into one species (“Grackle”) and we combined American Crow and Fish Crow into one species (“Crow”) (Table 1). Combined, the 30 focal species made up over 67% of all BirdNET detections in this study.
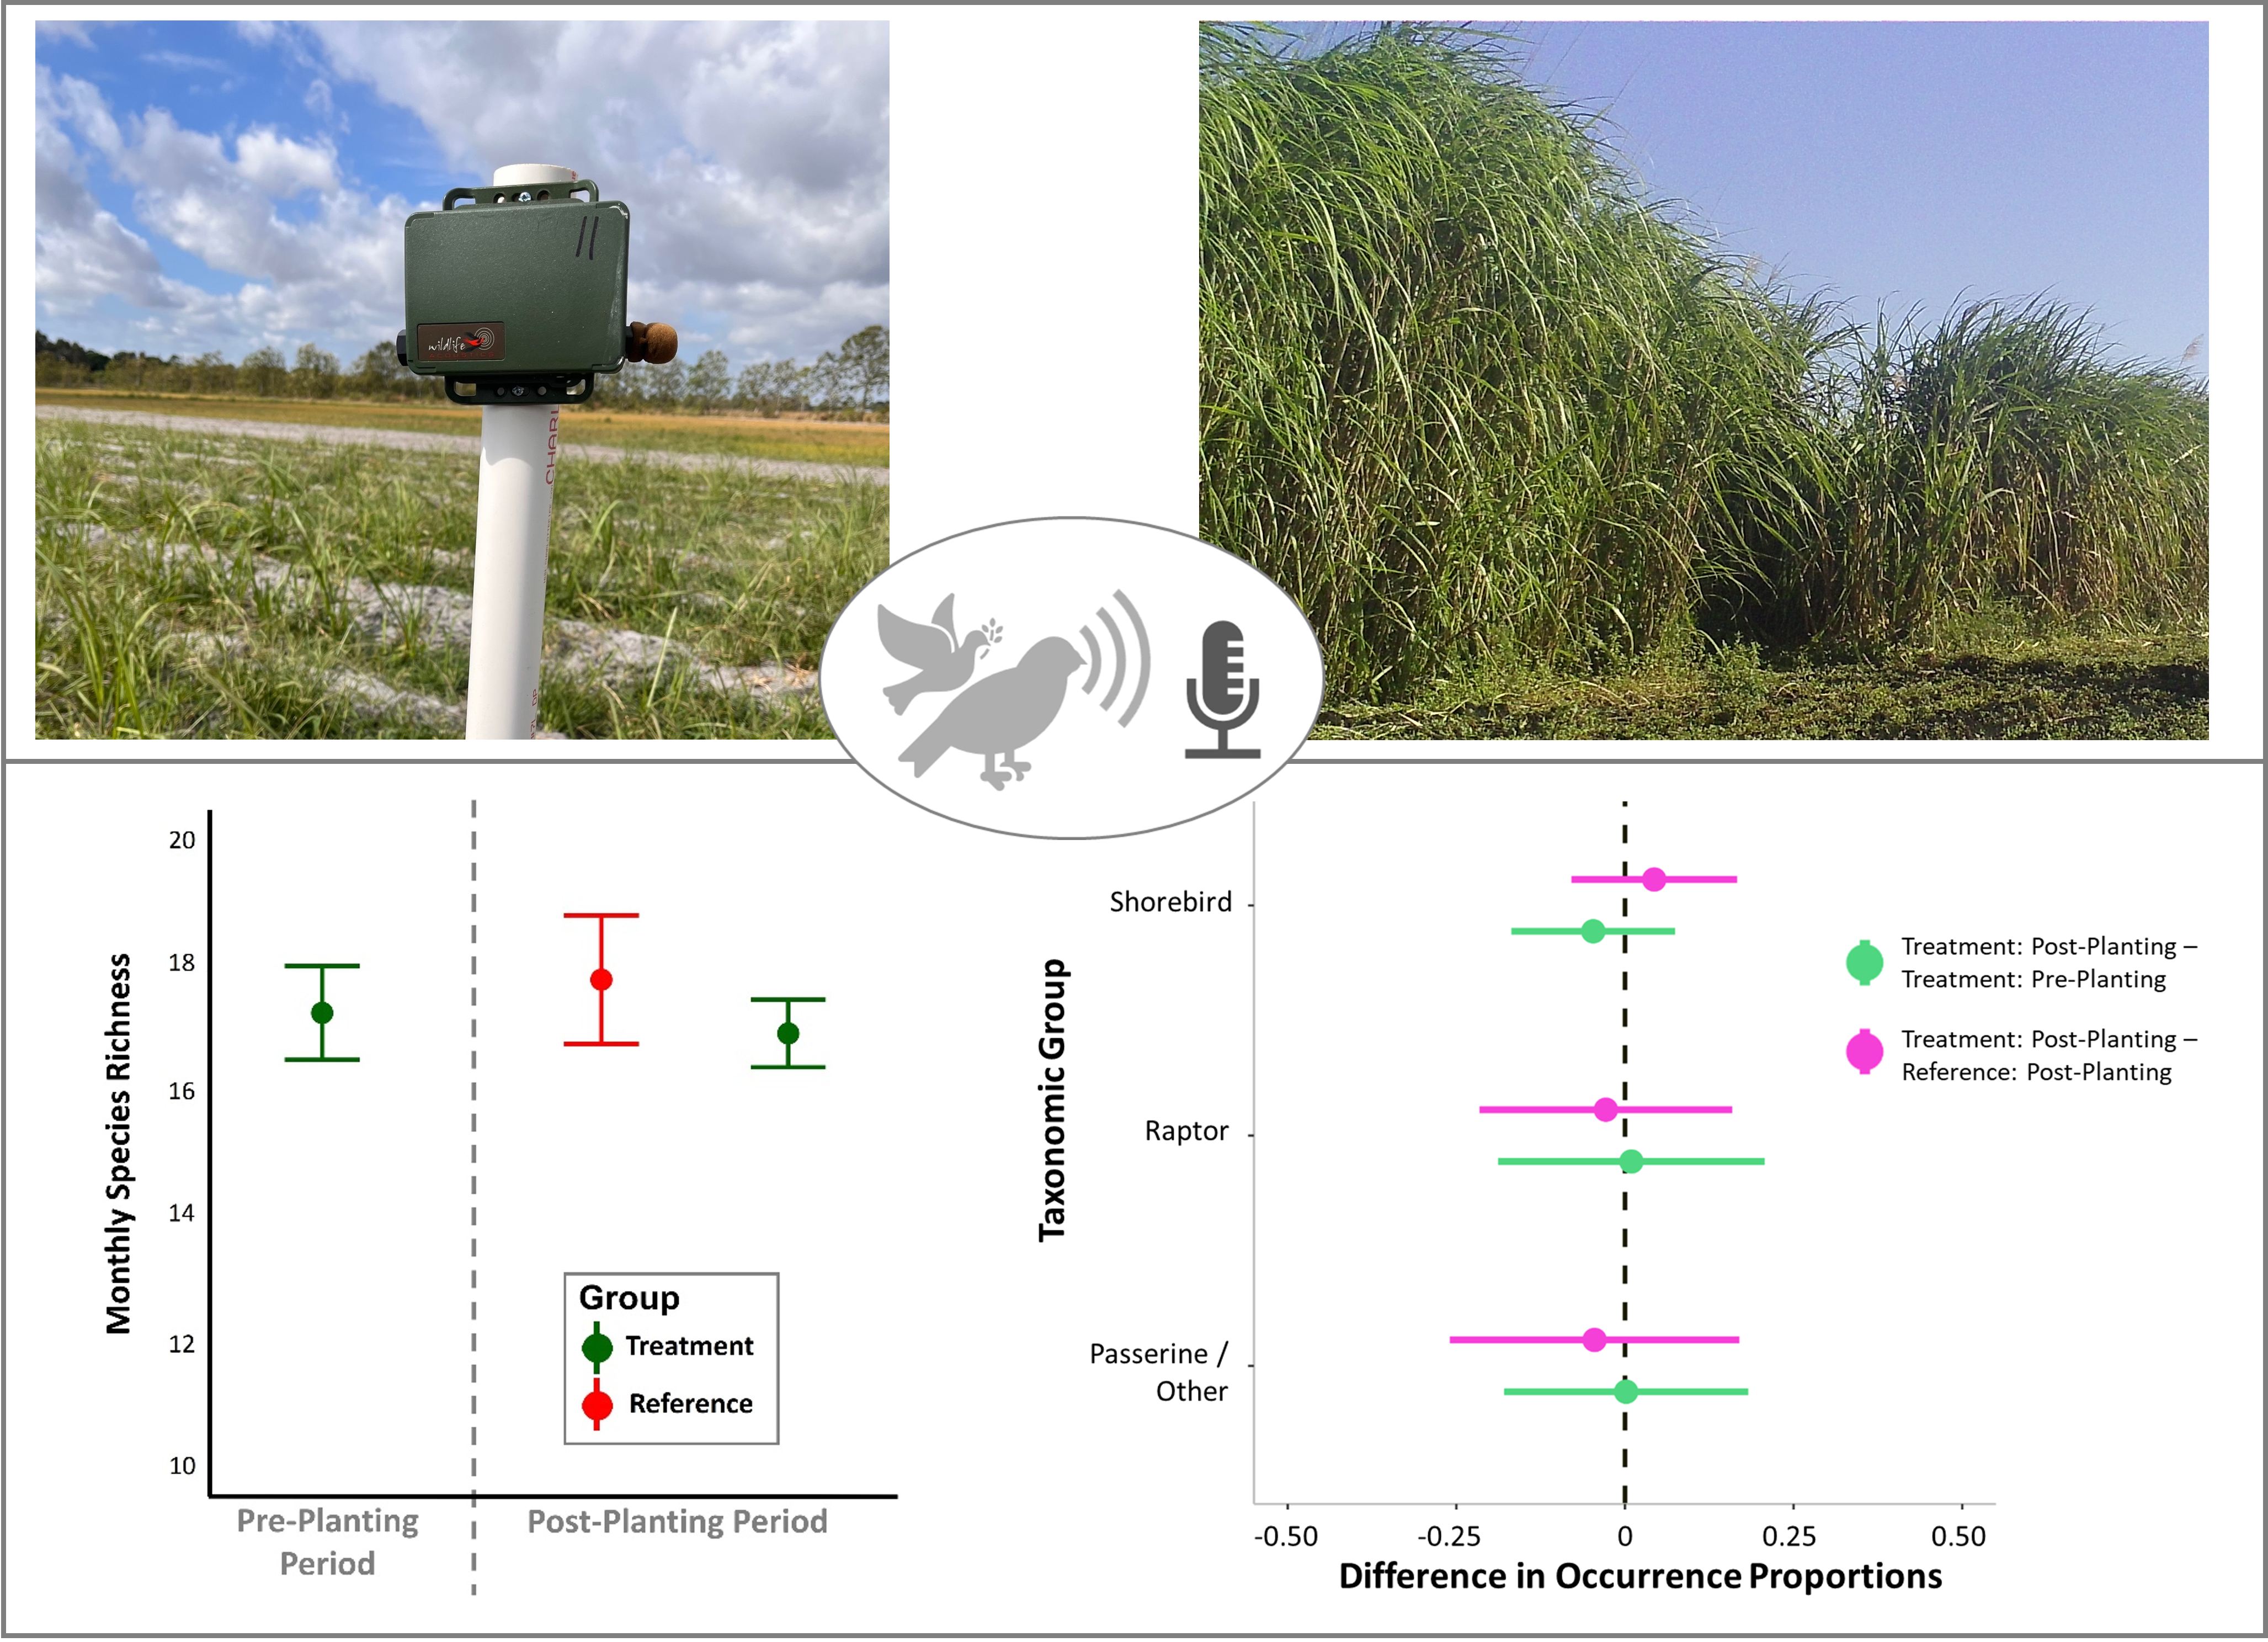
There was no difference in average monthly avian focal species richness between treatment groups and temporal periods (one-way Kruskal-Wallis Test; χ2 = 2.04; p = 0.367; Figure 3). Combined between EREC and IRREC sites, there were no differences in average daily focal species occurrence proportions by taxonomic group (paired t-tests; all p > 0.10). Daily occurrence proportions at experimental treatment plots during the post-planting period were similar to the occurrence proportions measured during pre-planting periods and at reference locations during the post-planting period (Figure 4).
4. Discussion
We examined bird communities in experimental EC plots at the extremities of two growth stages: a pre-planting period when the plots were barren and the soil was being prepared for planting, and a post-planting period approximately 2-4 months prior to harvest when the EC was matured and over 5m tall. Passive acoustic monitoring (PAM) using ARUs and an AI-powered automatic species recognizer (BirdNET), we detected similar species richness and occurrence rates between these two temporal periods and between experimental and reference plots. These results suggest that the resident avian communities at EREC and IRREC may utilize EC plots similar to other agricultural land uses in southern Florida.
Sugarcane is Florida’s top crop by acreage, cultivated on approximately 440,000 acres primarily in the southern one-third of the State [24]. A portion of these acres are used to experimentally cultivate the hybrid Energycane (EC), which has demonstrated potential for cellulosic ethanol production [5]. While there are some botanical and physiological differences between the two [5], sugarcane and EC share similar cultivation and harvesting practices, and are morphologically related compared to other crops grown in the region [25] (e.g., corn, citrus). For this reason, we expected avian responses to EC production to be similar to previously reported responses to sugarcane. Previous research in southern Florida has shown generally positive avian responses to sugarcane during certain times of the year. Pearlstine et al. [26,27] recorded a high degree of avian activity and species richness in sugarcane fields of southern Florida. Some avian species-specific responses fluctuate with the age and structure of sugarcane. For example, Common Yellowthroat (Geothlypis trichas), despite being a year-round resident in the region, is more commonly detected in sugarcane fields during sugarcane growth periods and is less common after harvest when there is less vegetation structure [28]. Other species, such as Cattle Egret (Ardea ibis) and other shorebirds, may be more common after sugarcane has been harvested where they can better forage on prey items in the disturbed soil [28].
Although we did not detect any statistical differences in occurrence rates between plots among Passerines broadly (Figure 4), we noted some species-specific responses that support these previous findings. Common Yellowthroat daily occurrences were approximately two times higher in the EC experimental plots than reference plots across both sites (average daily occurrence proportion in EC plots: 0.253; average daily occurrence proportion in reference plots: 0.125). Shorebird detections were also highest in the EC plots prior to planting when the fields were relatively barren. Shorebird detections were approximately 29% higher and 13% higher in barren experimental EC plots during the pre-planting period than in reference plots and EC plots during the post-planting period, respectively. These observations are consistent with previous findings by Miller et al. [28] reporting increased detections of Common Yellowthroat in sugarcane fields during crop growth and increased detections of shorebirds in open sugarcane fields after harvest.
This study also adds to the growing amount of evidence demonstrating the application of PAM and AI for avian ecology field research. BirdNET performed with a sufficient degree of precision for the most common bird species in southern Florida. We were able to develop SSCTs at 0.50 or lower for nearly half of our focal species (14 out of 30; Table 1), highlighting BirdNET’s ability to consistently and correctly identify some bird species even at low confidence thresholds. However, there are limitations to PAM and AI-based species recognition tools. First, these approaches are inherently biased towards vocal bird species with unique call repertoires, which could under sample less vocal or cryptic species. Second, these approaches allow researchers to understand species presence/absence, but generally do not allow for abundance or density estimates. Despite their limitations, these approaches have been especially useful for community-based studies that focus on metrics such as species richness and diversity [16,21].
4. Conclusions
It is important to investigate the ecological impacts of agricultural land use changes to ensure their long-term sustainability. The results of this study show that avian communities utilize EC cropping systems similar to other agricultural land uses in southern Florida. More research is needed to better understand if utilization of EC cropping systems results in positive or negative effects on avian populations (e.g., foraging habitat quality, predator-prey dynamics, nest success).
Supplementary Materials
The following supporting information can be downloaded at the website of this paper posted on Preprints.org. Figure S1: BirdNET precision graphs for 30 focal species.
Author Contributions
Conceptualization, L.J.W., J.F.C., H.S., and M.C.N.; data collection, L.J.W., R.L.; methodology and analyses, L.J.W., J.F.C.; visualizations, L.J.W.; writing, L.J.W, J.F.C., C.R.Z., B.K., J.F.; project administration, J.F.C., H.S.; funding acquisition, H.S., M.C.N., and J.F.C. All authors have read and agreed to the published version of the manuscript.
Funding
This research was funded by the U.S. Department of Energy, Energy Efficiency and Renewable Energy, Bioenergy Technologies Office, grant number DE-EE0009281. The views expressed in this article do not necessarily represent the views of the DOE or the US Government. This manuscript has been created by UChicago Argonne, LLC, Operator of Argonne National Laboratory (“Argonne”). Argonne, a U.S. Department of Energy (DOE) Office of Science laboratory, is operated under contract no. DE-AC02-06CH11357. The U.S. Government retains for itself, and others acting on its behalf, a paid-up nonexclusive, irrevocable worldwide license in said article to reproduce, prepare derivative works, distribute copies to the public, and perform publicly and display publicly, by or on behalf of the Government.
Institutional Review Board Statement
Not applicable.
Data Availability Statement
Data supporting the analyses in this article will be made available after acceptance.
Acknowledgments
The authors would like to thank Meredith Walston and the University of Florida staff and students who assisted with field work to deploy and maintain equipment throughout this study. We are also grateful for the constructive comments provided by anonymous peer reviewers.
Conflicts of Interest
The authors declare no conflicts of interest.
Abbreviations
The following abbreviations are used in this manuscript:
| AI | Artificial Intelligence |
| ARU | Autonomous Recording Unit |
| EC | Energycane |
| EAA | Everglades Agricultural Area |
| EREC | Everglades Research and Education Center |
| IRREC | Indian River Research and Education Center |
| PAM | Passive Acoustic Monitoring |
References
- Langholtz, M, 2023 Billion-Ton Report. Oak Ridge National Laboratory (ORNL), Oak Ridge, TN, 2024. [CrossRef]
- Lee, D.K.; Aberle, E.; Anderson, E.K.; Anderson, W.; Baldwin, B.S.; Baltensperger, D.; Barrett, M.; Blumenthal, J.; Bonos, S.; Bouton, J.; Bransby, D.I. Biomass production of herbaceous energy crops in the United States: Field trial results and yield potential maps from the multiyear regional feedstock partnership. Global Change Biology Bioenergy 2018, 10, 698-716. [CrossRef]
- U.S. Department of Energy (US DOE). Billion--Ton Update: Biomass supply for a Bioenergy and Bioproducts Industry.(No. ORNL/TM-2011/224). US Department of Energy, Oak Ridge National Laboratory, Oak Ridge, TN. 2011. https://www1.eere.energy.gov/bioenergy/pdfs/billion_ton_update.pdf.
- Fedenko, J.R.; Erickson, J.E.; Woodard, K.R.; Sollenberger, L.E.; Vendramini, J.M.; Gilbert, R.A.; Helsel, Z.R.; Peter, G.F. Biomass production and composition of perennial grasses grown for bioenergy in a subtropical climate across Florida, USA. BioEnergy Research 2013, 6, 1082-1093. [CrossRef]
- Sandhu, H.; Gilbert, R. Production of biofuel crops in Florida: sugarcane/energy cane. The Institute of Food and Agricultural Sciences (IFAS), University of Florida, Gainesville. 2017. Accessed 20 March, 2025. [CrossRef]
- Singerman, A.; Rogers, M. E. The economic challenges of dealing with citrus greening: The case of Florida. Journal of Integrated Pest Management 2020, 11, 1-7. [CrossRef]
- Blank, P.J.; Williams, C.L.; Sample, D.W.; Meehan, T.D.; Turner, M.G. Alternative scenarios of bioenergy crop production in an agricultural landscape and implications for bird communities. Ecological Applications 2016, 26, 42-54. [CrossRef]
- Mahendiran, M.; Azeez, P.A. Ecosystem services of birds: a review of market and non-market values. Entomology, Ornithology & Herpetology: Current Research 2018, 7, 1000209. [CrossRef]
- Wenny, D.G.; Devault, T.L.; Johnson, M.D.; Kelly, D.; Sekercioglu, C.H.; Tomback, D.F.; Whelan, C.J. The need to quantify ecosystem services provided by birds. The Auk 2011, 128, 1-14. [CrossRef]
- Whelan, C.J.; Wenny, D.G.; Marquis, R.J. Ecosystem services provided by birds. Annals of the New York Academy of Sciences 2008, 1134, 25-60. [CrossRef]
- Whelan, C.J.; Wenny, D.G.; Marquis, R.J. Policy implications of ecosystem services provided by birds. Synesis: A Journal of Science, Technology, Ethics & Policy 2010, 1, T11-20.
- Gaston, K.J. Birds and ecosystem services. Current Biology 2022, 32, R1163-R1166.
- Whelan, C.J.; Şekercioğlu, Ç.H.; Wenny, D.G. Why birds matter: from economic ornithology to ecosystem services. Journal of Ornithology 2015, 156, 227-238. https://link.springer.com/article/10.1007/s10336-015-1229-y.
- Beckmann, M.; Gerstner, K.; Akin-Fajiye, M.; Ceaușu, S.; Kambach, S.; Kinlock, N.L.; Phillips, H.R., Verhagen, W., Gurevitch, J., Klotz, S. and Newbold, T. Conventional land-use intensification reduces species richness and increases production: A global meta-analysis. Global Change Biology 2019, 25, 1941-1956. [CrossRef]
- Fargione, J.E.; Cooper, T.R.; Flaspohler, D.J.; Hill, J.; Lehman, C.; Tilman, D.; McCoy, T.; McLeod, S.; Nelson, E.J.; Oberhauser, K.S. Bioenergy and wildlife: threats and opportunities for grassland conservation. BioScience 2009, 59, 767-777. [CrossRef]
- LaGory, K.E.; Cacho, J.F.; Zumpf, C.R.; Lee, D.; Feinstein, J.; Dematties, D.; Walston, L.J.; Namoi, N.; Negri, M.C. Bird species use of bioenergy croplands in Illinois, USA—can advanced switchgrass cultivars provide suitable habitats for breeding grassland birds? Sustainability 2024, 16: 4807. [CrossRef]
- Kreig, J.A.; Lenhart, S.; Ponce, E.; Jager, H.I. Agent-based modeling to evaluate the effects of harvesting biomass and hunting on ring-necked pheasant (Phasianus colchicus) populations. Ecological Modelling 2024, 492, 110705. [CrossRef]
- Kahl, S.; Wood, C.M.; Eibl, M.; Klinck, H. BirdNET: A deep learning solution for avian diversity monitoring. Ecological Informatics 2021, 61, 101236. [CrossRef]
- Bielski, L.; Cansler, C.A.; McGinn, K.; Peery, M.Z.; Wood, C.M. Can the hermit warbler (Setophaga occidentalis) serve as an old-forest indicator species in the Sierra Nevada? Journal of Field Ornithology 2024, 95, 4. [CrossRef]
- Hack, B., Cansler, C.A.; Peery, M.Z., and Wood, C.M. Fine-scale forest structure, not management regime, drives occupancy of a declining songbird, the olive-sided flycatcher, in the core of its range. Ornithological Applications 2024, 126, duad065. [CrossRef]
- Schuster, G.E.; Walston, L.J.; Little, A.R. Evaluation of an autonomous acoustic surveying technique for grassland bird communities in Nebraska. PLoS ONE 2024, 19, e0306580. [CrossRef]
- Wood, C.; Sullivan, B.; Iliff, M.; Fink, D.; Kelling, S. eBird: engaging birders in science and conservation. PLoS Biology 2011, 9, e1001220. [CrossRef]
- R Core Team. R: A Language and Environment for Statistical Computing. 2022 [cited April 30, 2025]. Available from: https://r-project.org/.
- U.S. Department of Agriculture (USDA). 2024 State Agriculture Overview – Florida. 2024. Available at https://www.nass.usda.gov/Quick_Stats/Ag_Overview/stateOverview.php?state=FLORIDA. Accessed 20 March, 2025.
- Matsuoka, S. Energy cane: a revolutionary clean energy crop for the transition to a sustainable energy system. Academia Environmental Sciences and Sustainability 2025, 2. [CrossRef]
- Pearlstine, E.V.; Mazzotti, F.J.; Rice, K.G.; Liner, A. Bird observations in five agricultural field types of the Everglades Agricultural Area in summer and fall. Florida Field Naturalist 2004, 32, 75-127.
- Pearlstine, E.V.; Mazzotti, F.J.; Kelly, M.H. Relative distribution and abundance of wintering raptors in agricultural and wetland landscapes of south Florida. Journal of Raptor Research 2006, 40, 81-85. [CrossRef]
- Miller, M.W.; Pearlstine, E.V.; Dorazio, R.M.; Mazzotti, F.J. Occupancy and abundance of wintering birds in a dynamic agricultural landscape. Journal of Wildlife Management 2011, 75, 836-847. [CrossRef]
Figure 1.
Monitoring locations at (A) EREC and (B) IRREC in this study. The geographic locations of these study sites in the state of Florida are shown in the inset.
Figure 1.
Monitoring locations at (A) EREC and (B) IRREC in this study. The geographic locations of these study sites in the state of Florida are shown in the inset.
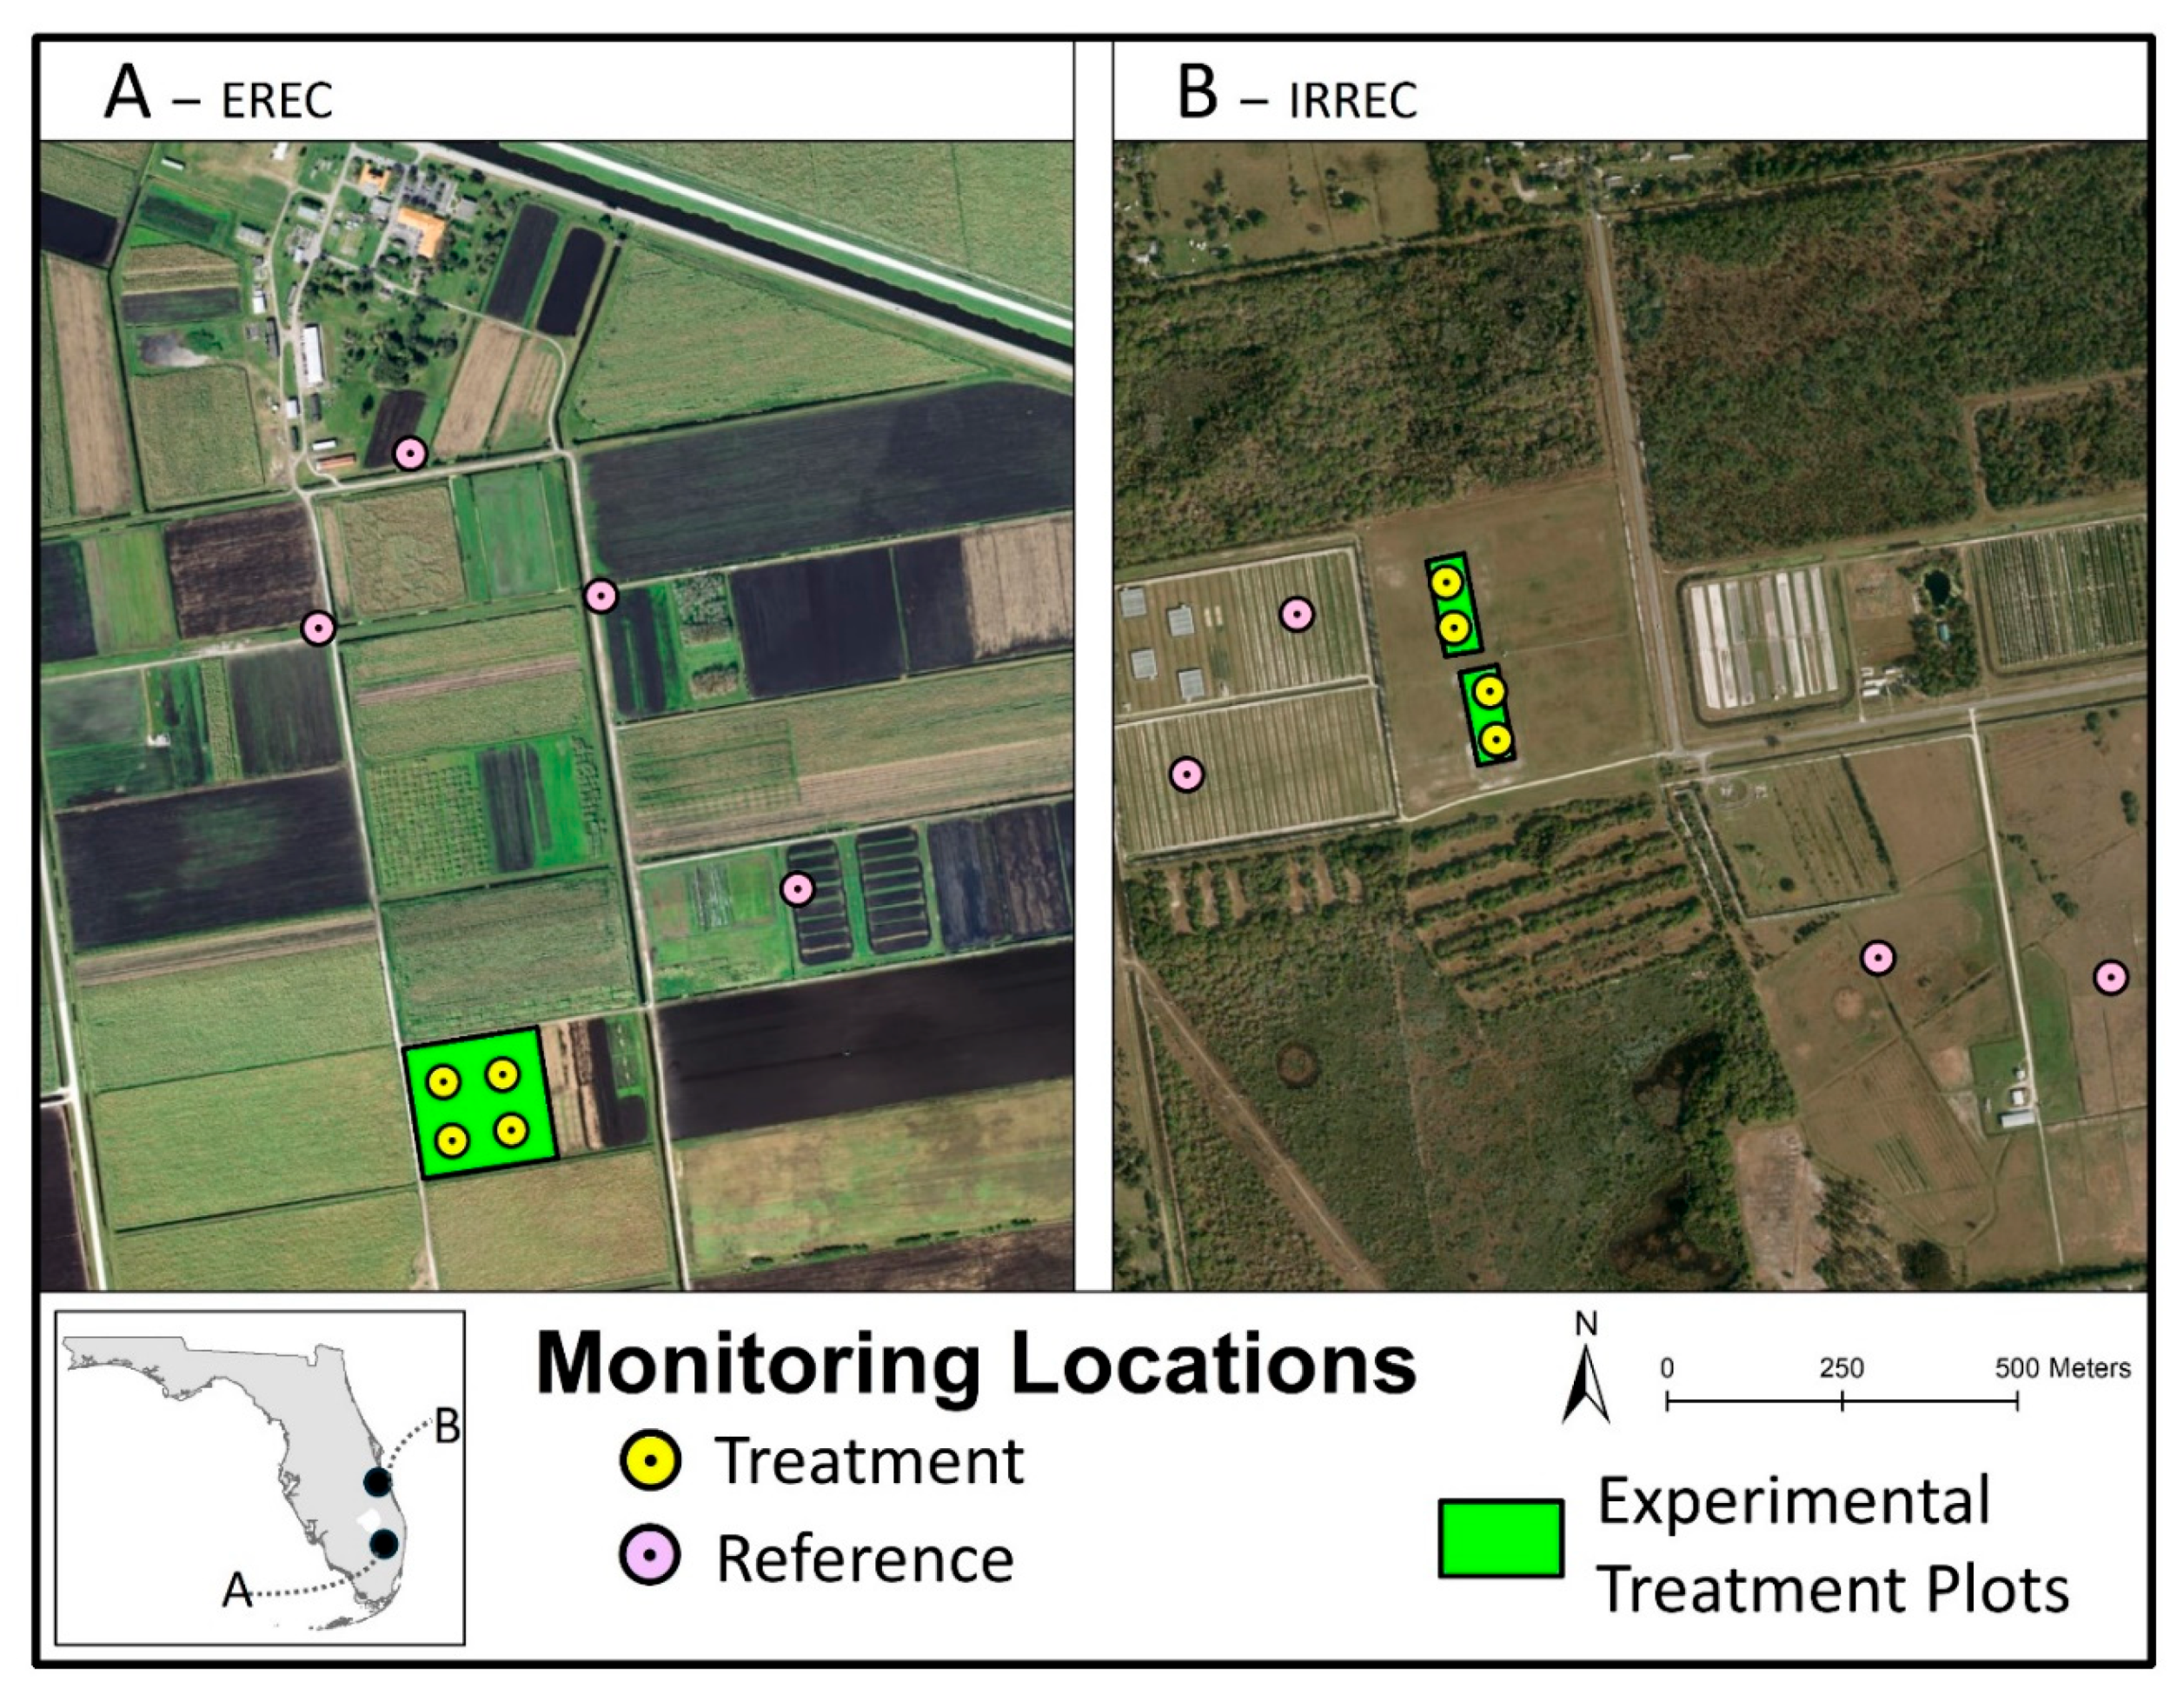
Figure 2.
Example photographs from stationary ARU monitoring locations at (A) EREC during the pre-planting period (29 November, 2021), (B) EREC during the post-planting period prior to harvest (19 December, 2023), (C) IRREC during the pre-planting period (1 December, 2021), and (D) IRREC during the post-planting period prior to harvest (9 December, 2023).
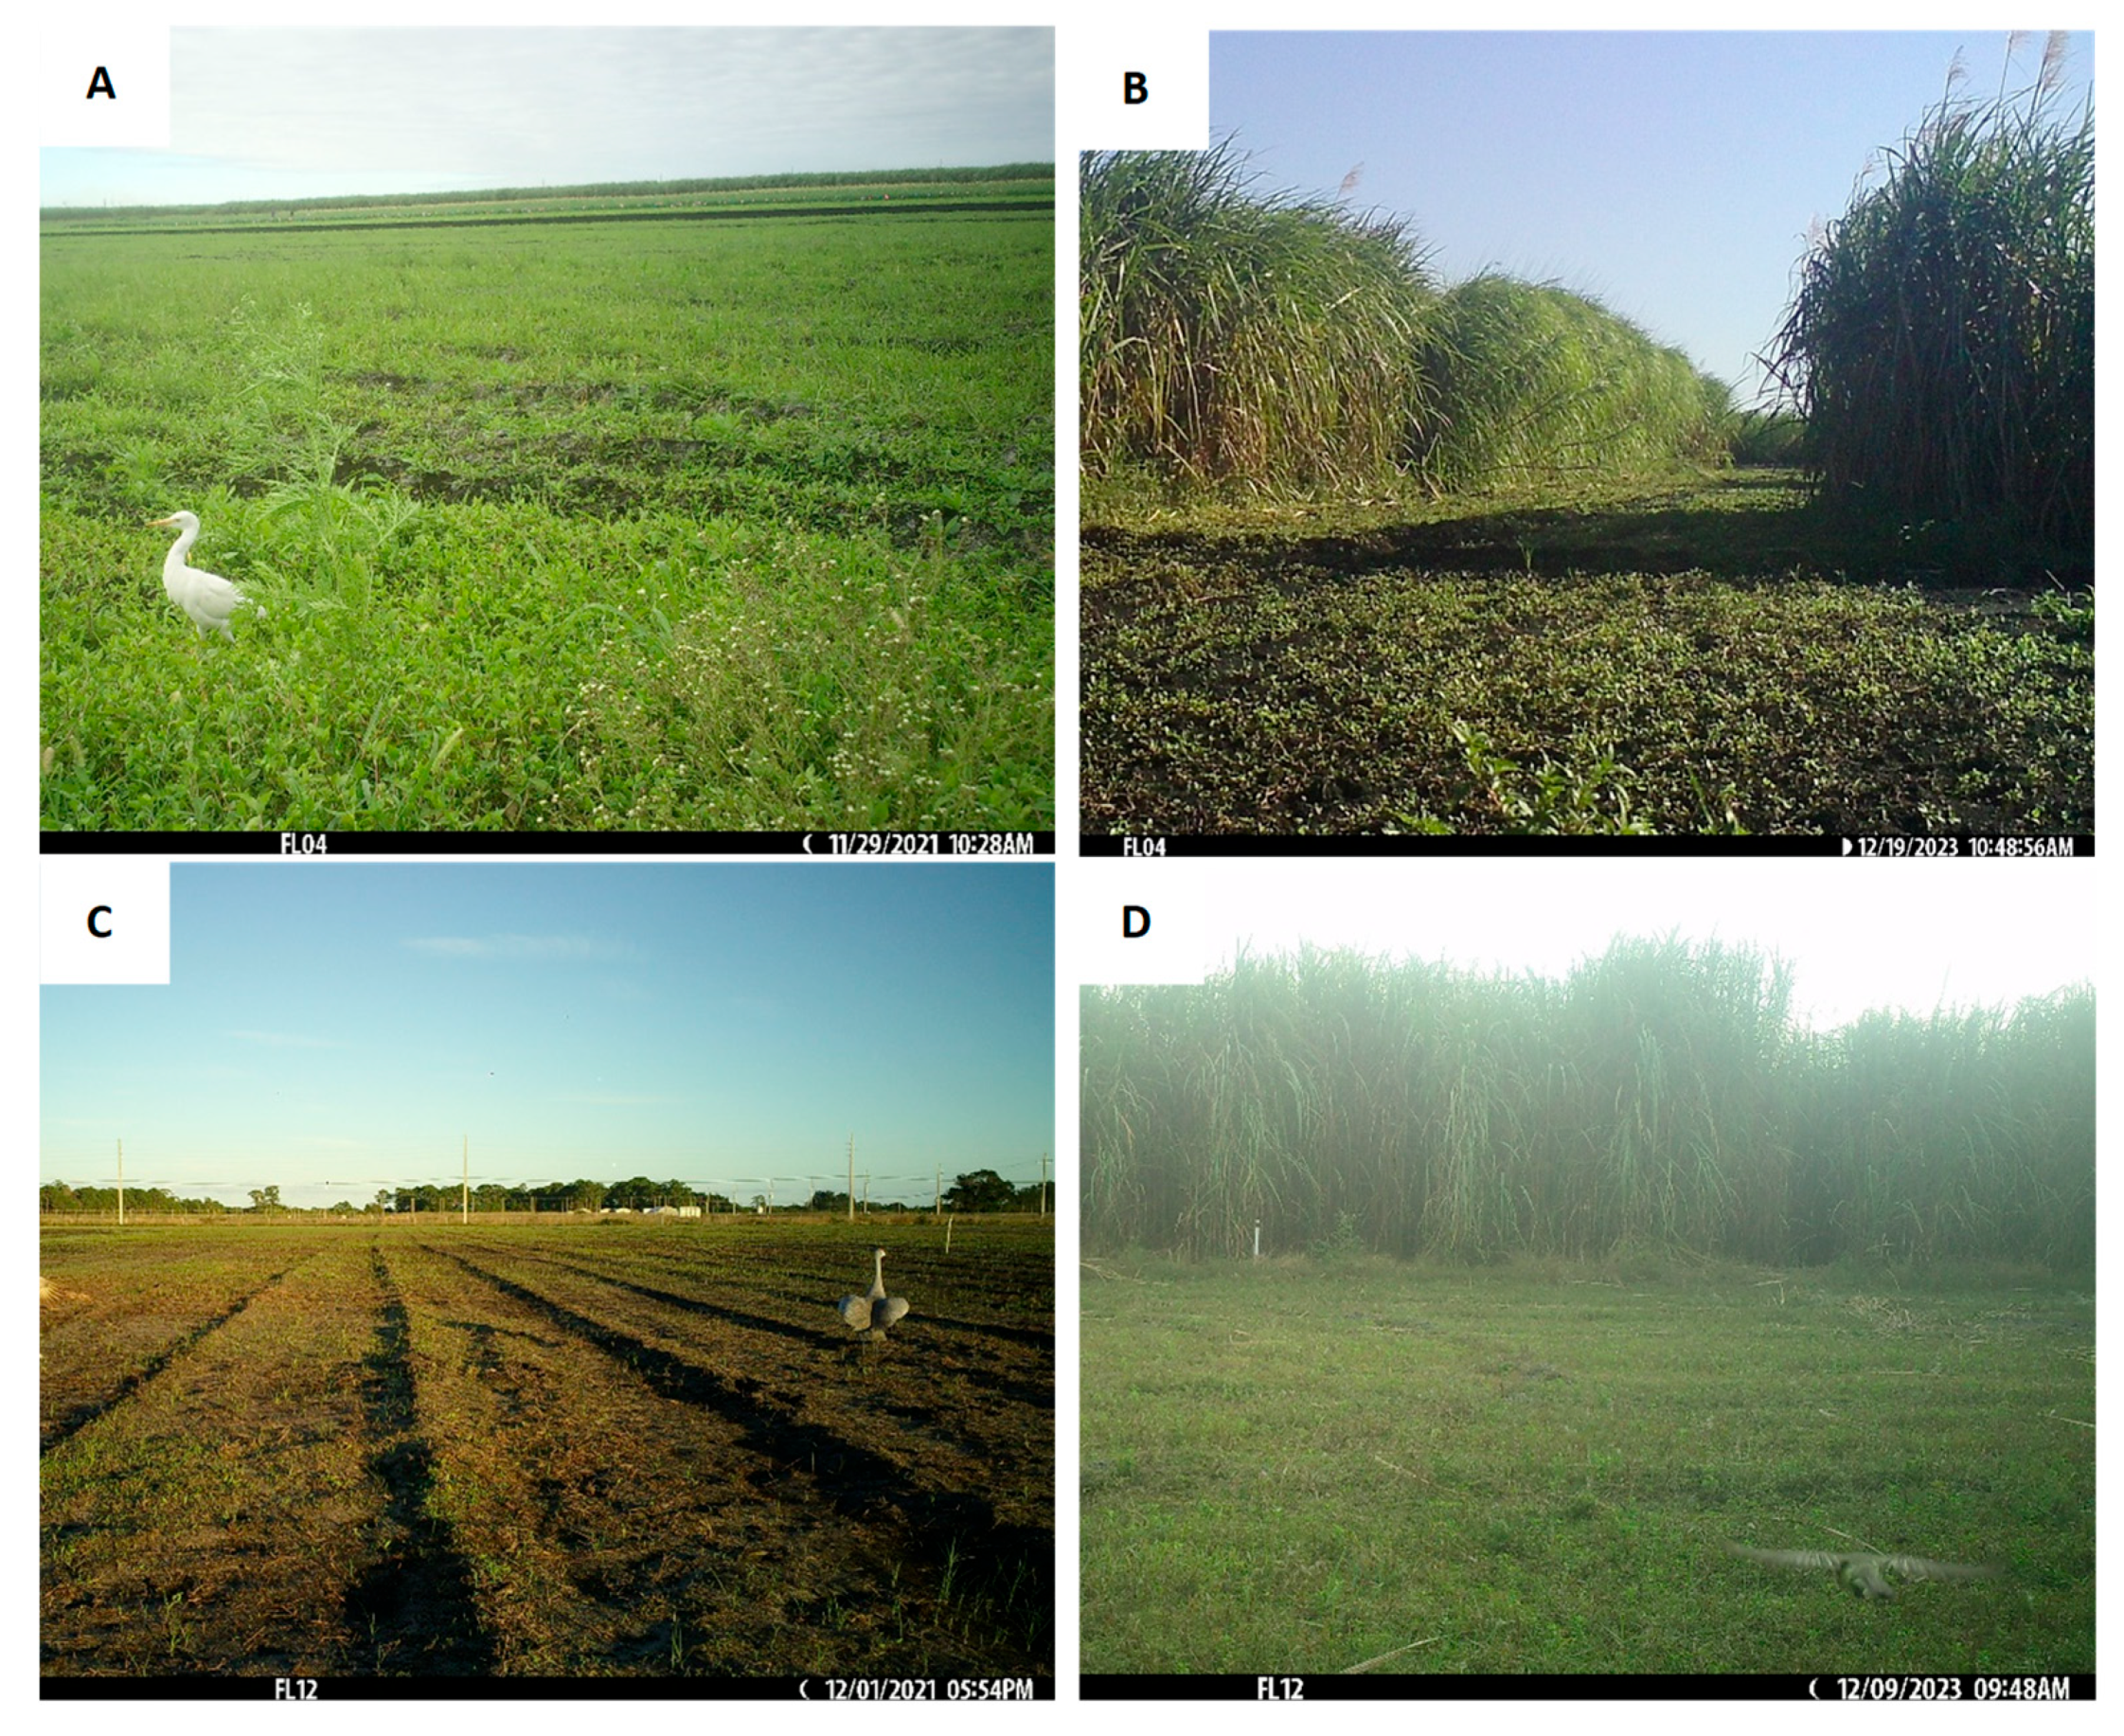
Figure 3.
Monthly focal species richness by treatment plot and time period. Points represent the mean +/- standard error.
Figure 3.
Monthly focal species richness by treatment plot and time period. Points represent the mean +/- standard error.
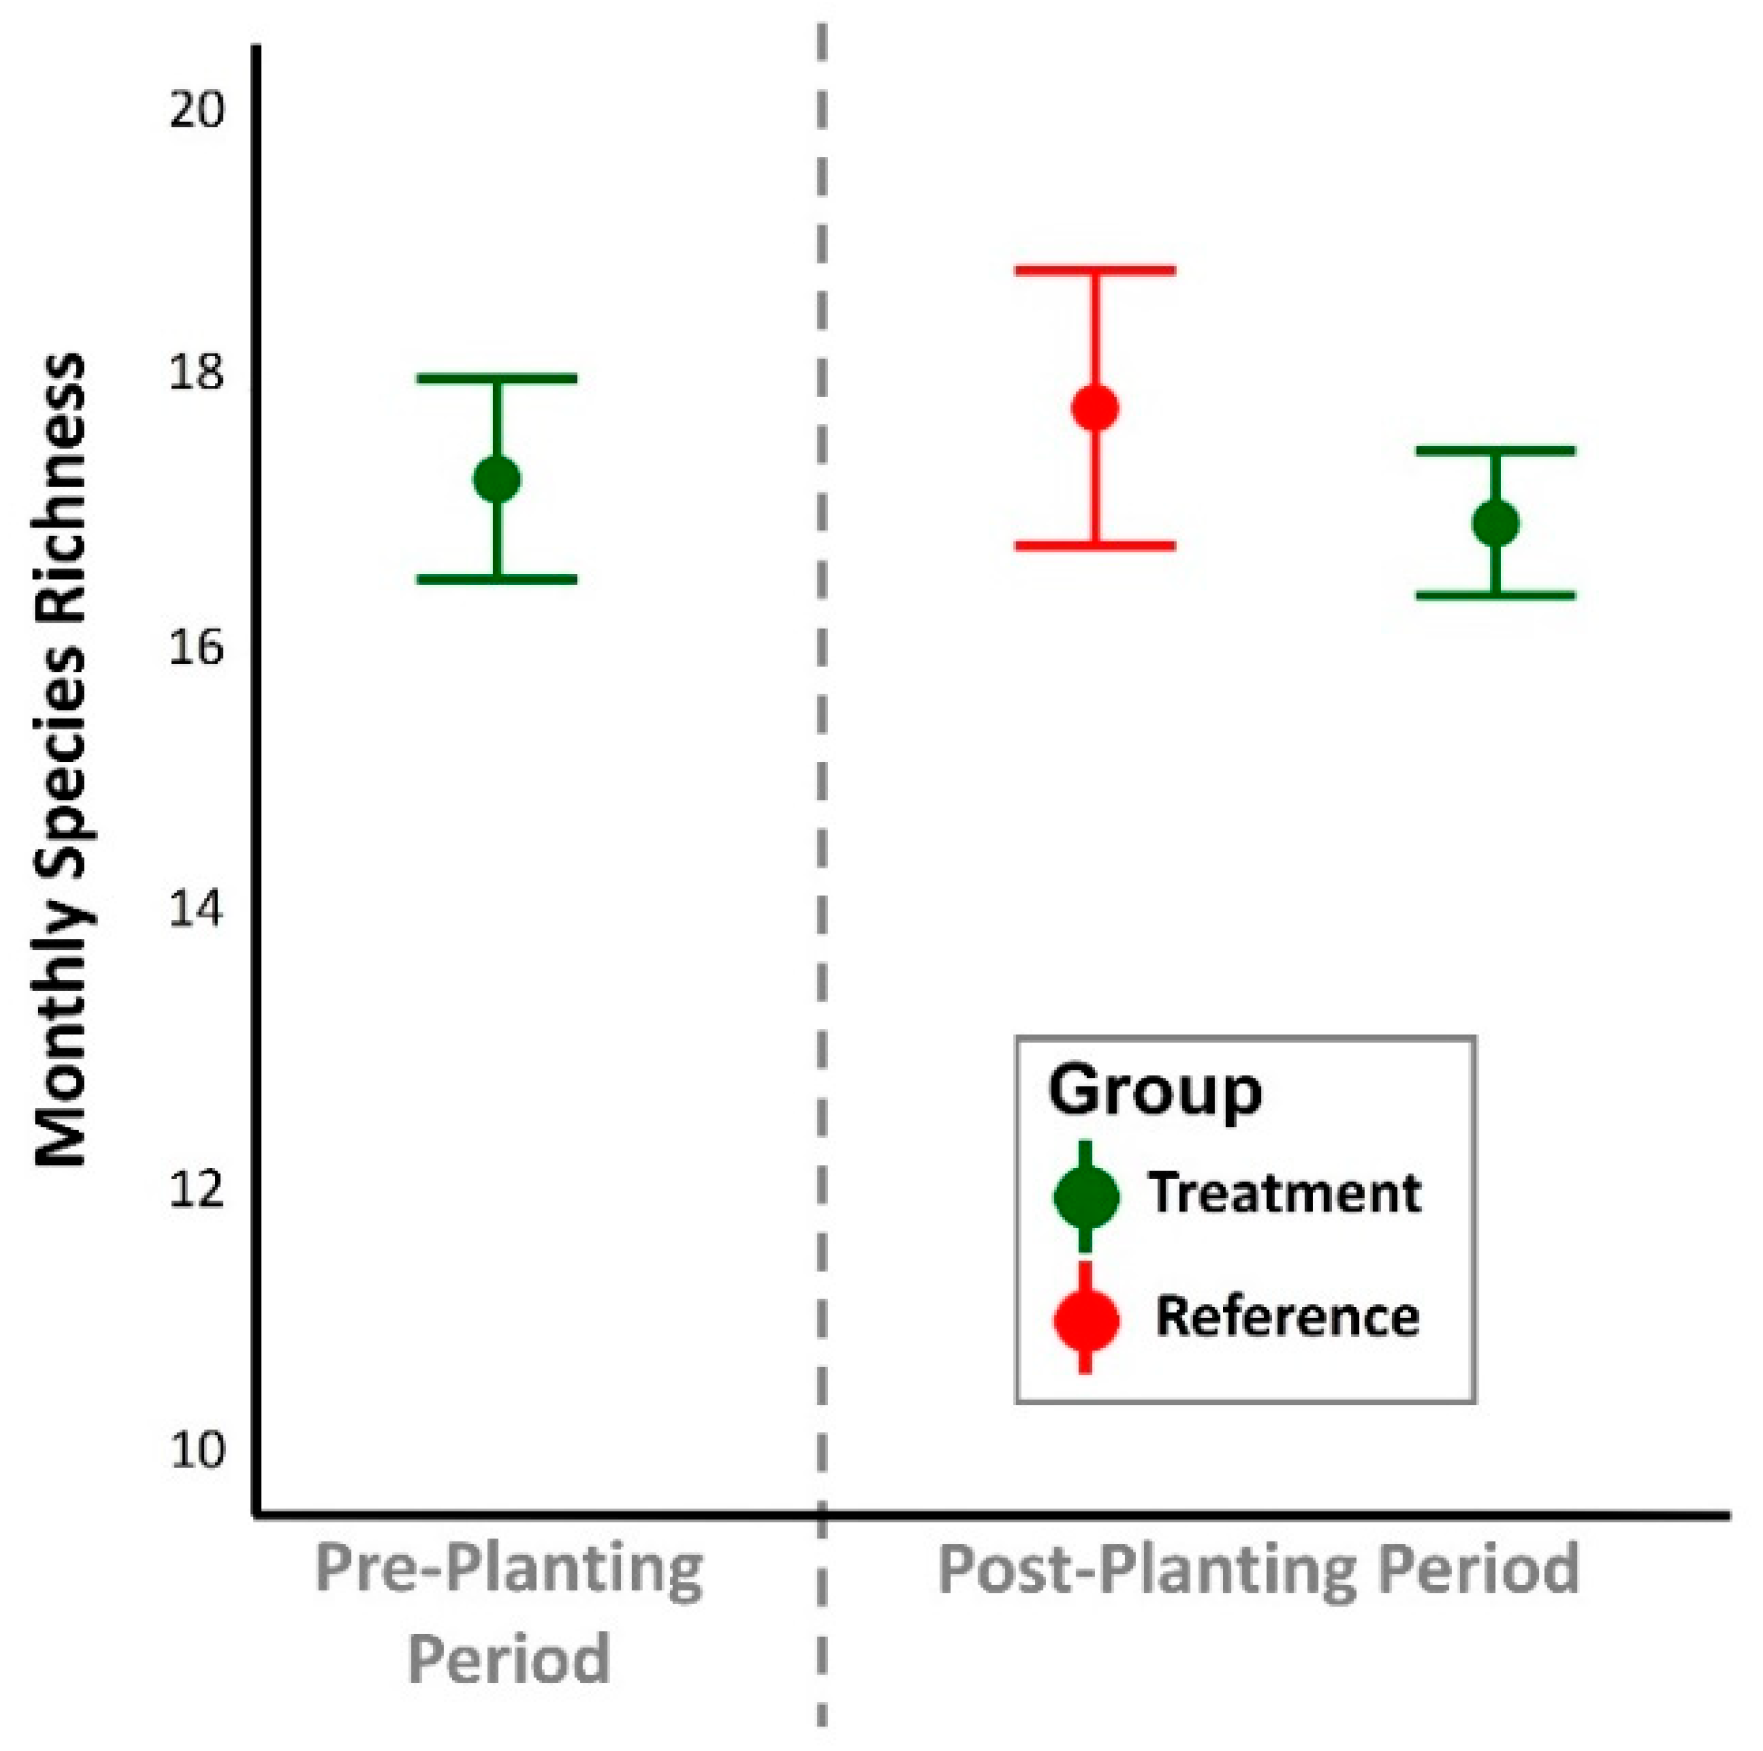
Figure 4.
Difference in average avian focal species occurrence proportions between treatment locations and temporal periods. Positive values indicate greater species occurrence proportions in treatment plots during the post-planting period. Negative values indicate greater occurrence proportions in treatment plots during the pre-planting period (green) and reference plots during the post-planting period (pink). Standard error bars that overlap zero indicate no statistical difference (based on paired t-tests).


Table 1.
Summary of the 30 focal bird species evaluated in this study, in alphabetical order by taxonomic group.
Table 1.
Summary of the 30 focal bird species evaluated in this study, in alphabetical order by taxonomic group.
| Focal Species Name | Taxonomic Group | Total Detections (2021-2023) | Species-specific Confidence Threshold (SSCT)a |
|---|---|---|---|
| Blue Jay | Passerine / Other | 43,792 | 0.25 |
| Chimney Swift | Passerine / Other | 3,978 | 0.80 |
| Common Ground Dove | Passerine / Other | 16,535 | 0.60 |
| Common Yellowthroat | Passerine / Other | 182,155 | 0.80 |
| "Crow" (American and Fish) | Passerine / Other | 83,915 | 0.25 |
| Eastern Bluebird | Passerine / Other | 3,945 | 0.90 |
| Eastern Meadowlark | Passerine / Other | 241,871 | 0.40 |
| Eastern Phoebe | Passerine / Other | 2,847 | 0.60 |
| "Grackle" (Boat-tailed and Common) | Passerine / Other | 17,697 | 0.40 |
| House Wren | Passerine / Other | 14,692 | 0.50 |
| Loggerhead Shrike | Passerine / Other | 43,390 | 0.90 |
| Mourning Dove | Passerine / Other | 10,776 | 0.40 |
| Northern Bobwhite | Passerine / Other | 63,732 | 0.60 |
| Northern Mockingbird | Passerine / Other | 42,879 | 0.50 |
| Palm Warbler | Passerine / Other | 85,562 | 0.50 |
| Purple Martin | Passerine / Other | 47,866 | 0.70 |
| Red-winged Blackbird | Passerine / Other | 63,920 | 0.25 |
| Savannah Sparrow | Passerine / Other | 35,633 | 0.40 |
| Swamp Sparrow | Passerine / Other | 15,204 | 0.70 |
| Yellow-rumped Warbler | Passerine / Other | 1,566 | 0.90 |
| American Kestrel | Raptor | 56,669 | 0.40 |
| Barn Owl | Raptor | 281,798 | 0.70 |
| Common Nighthawk | Raptor | 1,024,982 | 0.30 |
| Northern Harrier | Raptor | 44,168 | 0.80 |
| Red-shouldered Hawk | Raptor | 272,039 | 0.70 |
| Black-crowned Night-heron | Shorebird / Waterfowl | 11,282 | 0.90 |
| Great Blue Heron | Shorebird / Waterfowl | 33,602 | 0.90 |
| Green Heron | Shorebird / Waterfowl | 11,192 | 0.90 |
| Killdeer | Shorebird / Waterfowl | 379,429 | 0.25 |
| Sandhill Crane | Shorebird / Waterfowl | 38,769 | 0.50 |
a Species-specific confidence threshold (SSCT) determined based on BirdNET precision estimates. See Supplemental Materials for species-specific BirdNET precision graphs.
Disclaimer/Publisher’s Note: The statements, opinions and data contained in all publications are solely those of the individual author(s) and contributor(s) and not of MDPI and/or the editor(s). MDPI and/or the editor(s) disclaim responsibility for any injury to people or property resulting from any ideas, methods, instructions or products referred to in the content. |
© 2025 by the authors. Licensee MDPI, Basel, Switzerland. This article is an open access article distributed under the terms and conditions of the Creative Commons Attribution (CC BY) license (http://creativecommons.org/licenses/by/4.0/).
Copyright: This open access article is published under a Creative Commons CC BY 4.0 license, which permit the free download, distribution, and reuse, provided that the author and preprint are cited in any reuse.


