
Submitted:
31 August 2025
Posted:
02 September 2025
You are already at the latest version
Abstract
Agriculture is responsible for nearly one-quarter of global greenhouse gas (GHG) emissions, with livestock and poultry systems contributing significantly through methane (CH₄), nitrous oxide (N₂O), and carbon dioxide (CO₂). Achieving net-zero agriculture demands tools that not only quantify emissions but also guide management decisions and foster behavioral change. The Cool Farm Tool (CFT) - a science-based calculator for farm-level carbon footprints, water use, and biodiversity - has been widely adopted across Europe and parts of the United States. Yet, despite its proven potential, no Canadian studies have tested or adapted CFT, leaving a major gap in the country’s progress toward climate-smart farming. This paper addresses that gap by presenting the first surveys of poultry and dairy producers in Atlantic Canada as a foundation for tailoring and localizing CFT. Our mixed-methods surveys examined farm practices, feed, manure, energy use, waste management, sustainability perceptions, and openness to digital tools. Results revealed limited awareness but moderate interest in emission tracking: dairy farmers, already accustomed to digital systems such as robotic milking and herd software, were receptive and confident about adopting CFT. Poultry farmers, by contrast, voiced greater concerns over cost, complexity, and uncertain benefits, signaling higher adoption barriers in this sector. These findings highlight both the opportunity and the challenge: while dairy farms appear ready for rapid uptake, poultry requires stronger incentives, clearer value demonstration, and sector-specific customization. We conclude that adapting CFT with regionally relevant data, AI-driven decision support, and supportive policy frameworks could make it a cornerstone for achieving net-zero agriculture in Atlantic Canada.
Keywords:
cool farm tool
; green house gas emission
; Atlantic Canada
; sustainability
; dairy
; farm surveys
; CFT adoption
; poultry
1. Introduction
Sustainable agriculture requires reduced greenhouse gas (GHG) emissions, creating the necessity for accurate farm-level emission computation tools. Farmers and producers require scientifically accurate, robust, universal, and user-friendly tools for assessing their day-to-day farming practices. The Cool Farm Tool (CFT) [1] is a web application for farmers and producers that enables carbon footprint calculation for their farms and farming operations. CFT was developed at University of Aberdeen with the help of Unilever during 2008, and since 2012 CFT is maintained by The Cool Farm Alliance made up of stakeholders joining from various academic and industry domains. The main goal of the Cool Farm Alliance is to develop farmer friendly tools basing calculations on Intergovernmental Panel on Climate Change (IPCC) methodologies and recent research. CFT allows farmers to identify high emission sectors and apply modifications to farming practices to decrease negative environmental impacts while allowing them to customize it to their needs. With over 125,000 online assessments, and over 29,000 web application users, CFT currently have more than 160 members worldwide providing a scientifically sound method to quantify their GHG emissions, water usage, and biodiversity effects.
Although CFT is widely popular in Europe, the application of CFT in North America remains noticeably restricted. As part of our long-term goal of achieving net-zero emission in Atlantic Canada’s agriculture, adopting CFT for local farming will be a real step towards Canada’s climate goals. The complete process of adopting CFT to Atlantic Canada (i.e., poultry, dairy, and crop farms) will be achieved in four phases- (i) Phase 1: Data Collection (i.e., data on animal/crop type, animal feed, manure, farm energy usage, etc.); (ii) Phase 2: Customization (i.e., working with farmers, producers, and industry experts to refine CFT for Atlantic Canada); (iii) Phase 3: AI-Integration (i.e., development of AI-based CFT for real time GHG emission tracking and predictive modeling with optimization); and (iv) Phase 4: Pilot and Scale (i.e. trials on small and medium sized farms for evaluation leading broader adoption).
Adopting CFT in local agriculture first requires understanding the current functionalities, scopes, and limitations. Our review of the literature showed that although CFT performs well in the areas of carbon emissions, water, and biodiversity, it still needs to be adjusted to local realities, including both internal and external factors as that are not always reflected in the tool’s default settings [2,3]. Hence, our aim of customizing CFT to Atlantic Canada’s agriculture requires specifying the gaps due to the local environment and farming practices. The potential, originality, and priority of our research is validated by limited CFT usage in a small part of North America (only in the United States until now) and in this paper, we lay the foundation for adapting CFT with AI to equip the farmers and producers with a tool for a decision support system including GHG tracking, hotspots identification, and AI-driven optimization. This paper serves as the starting point for “Phase 1: Data Collection" of CFT adoption for Atlantic Canada with an analysis of two surveys aimed to understand and address local requirements in poultry and dairy farms. Both surveys were generated based on the requirements of CFT inputs, and modified with questions to address local farming practices to gather insights to reflect local realities.
To the best of our knowledge, this is the pioneering approach toward requirement analysis for CFT adoption in Atlantic Canada and development of a complete AI-powered decision support system for low-carbon, high-efficiency farming to optimize feed, manure and energy use. In this paper, we present the initial step for “Phase 1 : Data Collection" from poultry and dairy farmers of Atlantic Canada by– (i) designing two user friendly, customized, comprehensive, and anonymous surveys for poultry farmers and dairy farmers to collect data required for enhanced CFT adoption in Atlantic Canada focusing on general farm information, farming practices, sustainability practices, waste and plastic management, and CFT adoption; (ii) distributing the surveys and interviewing farmers to collect their responses in both on-line and off-line settings, applying data preprocessing, and implementing both qualitative and quantitative analysis for survey response analysis; and (iii) exploring the survey response analysis results for interpreting the local agriculture requirements (focused on feed, manure, and energy usage) for Atlantic Canada for an AI-driven CFT adoption.
In summary, the major contributions and novelty of this research are as follows–
- Established a baseline for poultry and dairy farming practices in Atlantic Canada;
- Highlighted primary challenges for CFT adoption in local agriculture; and
- Outlined priority areas for tailoring CFT modules considering both farming practices and external assistance from government and non-government organizations.
The organization for the rest of the paper is as follows: Section 2 summarizes the basic modules of CFT; Section 3 presents a comprehensive literature review on CFT applications and key findings; Section 4 represents the survey design and methodology; Section 5 shows the survey responses analysis; Section 6 discusses the insights gained from the analysis; Section 7 mentions the limitations of the survey and results; Section 8 lists the possible future research directions; and finally Section 9 concludes the paper.
2. CFT Modules
CFT includes and discusses three major modules for quantifying carbon footprints of a farm- GHSs, biodiversity, and water use. These focus modules were selected with extensive empirical research to create value in the agricultural system as well as to enhance the sustainability practices in agriculture all over the world.
2.1. Greenhouse Gases
The GHG module provides farmers and supply chain partners with an accessible, science-based platform to quantify on-farm GHG emissions and soil carbon sequestration. It is designed to support efforts aligned with the GHG Protocol and Science Based Targets Initiative (SBTi) reporting, ensuring consistency with recognized climate action frameworks. At its core, the tool encourages sustainable, regenerative farming by helping users evaluate how specific management practices—- like adjusting tillage, cover cropping, or fertilizer use—- affect carbon emissions and soil health. Despite the technical nature of carbon accounting, farmers can complete an assessment in as little as 30 minutes. This quick turnaround allows users not only to track emissions regularly, but also to experiment with different management options by testing out different use-case scenarios. The tool strikes a balance between scientific rigor and practical usability, making it a helpful resource for day-to-day decision making as well as long-term planning. GHG assessment for crops requires user inputs, such as harvested yield, land area, fertilizer type and amount, crop protection inputs, and energy use. Data on transportation like mode, distance, and load can also be included if available. For livestock, relevant inputs include herd or flock size, feed composition, manure management practices, and associated energy or transport use. Due to the available options for both crop and livestock systems, CFT offers flexibility across different farm types, making it a useful resource for a wide range of agricultural contexts.
Additionally, CFT’s emissions hotspots identification and visualization support more informed, data-driven action plans tailored to individual fields. As the results are context-specific, each farm’s response to changes is modeled individually, accounting for unique conditions. CFT has earned broad recognition in the food and beverage sector and many major global companies have incorporated it into their sustainability strategies. By using the tool, these companies work closely with their agricultural suppliers to better understand on-farm emissions and identify opportunities for improvement supporting a shared approach in reducing climate impact across the supply chain.
2.2. Water
Given that agriculture accounts for approximately 70% of global freshwater consumption, managing water resources sustainably has become an increasingly important responsibility. CFT’s Water Module helps farmers and supply chain partners assess water use on farms, focusing on practicality and efficiency by tracking water use during crop production. CFT opts for a streamlined setup, making it easier to use in practice without sacrificing too much insight. It compares the amount of fertilizer farmers apply in practice with what the crop actually needs, making it easier to spot problems, reduce waste, and make fine adjustments to increase yields. Additionally, CFT helps users identify measures that can improve efficiency by allowing them to test different management measures, such as changing the type of irrigation or increasing soil organic matter to improve water retention, helping farmers make the most of every drop of water. To get started, users only need to enter basic information like farm location, planting and harvesting dates, soil moisture conditions at planting, irrigation volume, and irrigation distribution during the growing season for CFT to provide practical and optimized suggestions.
2.3. Biodiversity
The biodiversity module converts everyday management decisions into an intuitive score reflecting the potential of the farm to support local ecosystems, offering a simple yet meaningful way to track progress over time. By evaluating the benefits and harms of agricultural practices on biodiversity and habitat conservation, it provides insight into which species groups—- pollinators, birds, or other beneficial organisms—- are most likely to benefit from their current strategies. While grounded in ecological science, the scoring system is designed to award credit for on-farm biodiversity practices such as maintaining flowering strips, leaving hedgerows intact, or selecting pest control options that are less disruptive to beneficial species. It assess inputs like total farm area, management of different parts of the land, extent of any habitats or nearby nature reserves, etc. to estimate a biodiversity score. Currently, the module covers multiple biomes, including temperate forests, Mediterranean, and semi-arid regions, with support for tropical forests making the tool increasingly relevant to a variety of agricultural systems.
Being a user-friendly tool, all these modules require simple inputs from the farmers as answers to some guided questions on environment features, farm information, animal/crop characteristics, and regular farming practices. CFT then computes the corresponding GHG emissions and provides a comprehensive report with scores and visualizations on both general and specific group-wise GHG assessments while identifying GHG hotspots.
3. Literature Review
We conducted an extensive literature review to better understand the effectiveness of CFT and provide a broad overview on how farmers and industry stakeholders are using CFT around the world. Additionally, we explored other tools that have similar features to specify the advantages and limitations of CFT compared to similar tools.
3.1. Article Selection
Most of the publications were found through Google Scholar [4], though several were also retrieved from Springer Nature [5] and Science Direct [6]. The search terms focused on “Cool Farm Tool" and its variants—- such as “CFT”, “Cool Farm Tool livestock”, and combinations with keywords like “greenhouse gases”, “water footprint”, and “biodiversity scoring”. The search was limited to publications from 2021 to 2025, and only a few publications before 2021 were considered due to their relevance. Most of the publications involved case studies, tool validation, or comparisons with other sustainability frameworks whereas a few reported user feedback from farmers or supply chain actors. In total, 40 publications were included in the review to explore the current state of CFT and find the scopes– particularly in the context of Atlantic Canadian agriculture.
3.2. Comparing CFT To Similar Tools
Several of the studies in our literature review compare CFT to other similar tools. In these studies, CFT stood out due to its publicly accessible methodology, visualizations, ease of use, and large number of inputs [7,8,9]. However, it lacked certain features such as output for CO2, CH4, N2O, CO2-eq and mitigation measures, and emissions per source. Other tools assessed included features for EICIs, NH3, scoring, improvement suggestions, and feed consultations [9]. Furthermore, CFT did not include social or economic dimensions, which are included in tools like SAFA [10] and FRST [11,12]. Table 1 provides an overview of the tools used in the aforementioned comparisons. The tools identified as GHG emission calculations were included in the table, and references were only included for tools that have English websites/literature.
3.3. CFT Case Studies
This section will first highlight studies from the literature review that are particularly relevant to Atlantic Canada, as they focus on crops and livestock that are relevant to local agriculture. One such study highlighted corn soybean cover crop cultivation in Illinois [37]. Researchers collected agricultural practices and yields data from a local farmer service program known as PCM, used by over 400 farmers in the state to generate inputs for CFT. Their in-depth analysis showed that despite lower GHG emissions, cover crops had lower returns. They highlighted the importance of understanding the potential trade-off between environmental sustainability and financial burden and concluded that the use of programs providing economic assistance to farmers who use cover crops is necessary to alleviate the financial burden.
Another American study focused on dairy farming in New York using CFT-based emission estimations from six organic dairy farms and compared to COMET-FARM [38]. Their decision mentioned that althugh CFT is closer to a holistic “cradle-to-farm-gate" assessment, while quickly simulating the impact of “what-if" scenarios on overall emissions intensity, with clear and actionable output results, it lacks flexibility in customizing feed inputs and local energy data. In a similar study based in Ecuador, the GHG emissions of 85 rural dairy farms in the Northern Ecuadorian Andes were assessed using CFT [39]. Researchers collected data by conducting 55 minute interviews with the farmers on pasture and livestock management. Additional information was collected from a workshop performed by the National Autonomous Institute for Agricultural Research (INIAP). Soil and climate characteristics were determined using secondary sources and the complete dataset was used as input for CFT to determine enteric digestion as the primary contributor (with 80.96% emissions).
In Southwestern Bangladesh, researchers used CFT to compare conventional cultivation (CT) with zero tillage with rice straw mulching (ZT) for potato cultivation [40]. Experiments during two growing seasons on farmer’s fields where potatoes grown using CT and ZT were harvested at the same time were used for CFT showing ZT produced lower emissions than CT partially due to increased productivity when using ZT and both methods created the most emissions from soil and fertilizer. In Northwestern India, 118 farmers from small, medium and large potato farms were surveyed to collect quantitative data about seeds, diesel fuel, fertilizers, biocides, irrigation, and tuber yield, and suggested further research to determine more user-friendly options for farmers for adopting local sustainability recommendations [41]. By calculating the CO2-eq/tuber yield, the researchers found low compliance with sustainability recommendations among the farmers indicating presence of barriers preventing farmers from complying. CFT was used in maize-wheat cropping systems under different nitrogen fertilizer regimes in eastern India [42]. The results with field-level management data from both direct sources (i.e., fertilizer-induced N2O) and indirect ones (i.e., fertilizer production) suggested that emissions tend to rise with the increment of nitrogen inputs due to the carbon cost of fertilizer production and the nitrogen behavior in the soil, spotting inefficiencies in resources usage.
CFT was used to analyze the impact of COVID-19 on farming practices for French vines in three different countries in Europe in [43] by surveying actors from the value chains. All additional information was collected through press releases and government releases. While lower exports during the pandemic resulted in lower CO2 emissions, no drastic changes were observed in the current systems leading to the decision that the pandemic had no noticeably lasting effects in the long-term agricultural practices. Another survey-based CFT research was discussed in [44] used a questionnaire with queries on cultivation, soil characteristics, fertilization, energy use and water use and collected data from 40 tomato producers in Greece. The CFT results showed the highest source of CO2-eq was machinery and fertilization, guiding them to suggest adopting integrated management strategies while limiting the use of machinery and synthetic mineral fertilizer. In another Greek study by Kakabouki et al. [45], researchers worked on quinoa seed production with 40 Greek growers. Their analysis with CFT reported the main sources of GHG emissions by source: fertilizer production (40.53%), fertilizer application (30.18%), fuel/energy use (25.15%), and residue management (4.14%). This method of breakdown allows researchers to quantitatively assess the emissions and make targeted recommendations for emission reduction, including tillage reduction, efficient fertilizer application, and renewable energy adoption.
Other recent papers focused on crops such as cotton, coffee, sorghum, peanuts, sunflowers, sugarcane, rice, maize, and quinoa in Kenya, Republic of Cote Id’Ivoire, South Africa, India, Greece, South Africa, Pakistan, and the United States [2,46]. These studies used CFT to recommend more sustainable farming practices like improved wastewater systems, limited use of synthetic fertilizers, and improved resource efficiency. Additionally, some studies highlighted the importance of data integrity and understanding the social factors that may affect uptake of tools like CFT [47]. Some other recent studies from Ghana, India, South Africa, and Chile presented CFT applications on variety of different crops and livestock [48,49,50,51,52]. Similar studies compared different farming practices, but were not based on any specific country [3,53]. In one study, CFT was used to determine the effects of COVID-19 on farming in Burkina Faso, France, and Columbia [43], while other studies used CFT to examine the environmental impact of agri-food industry [54,55]. These studies highlight the potential for using CFT carbon footprint estimates to compare the efficiency and sustainability of farming practices.
While the majority of studies focused solely on carbon footprint estimation, few studies used the other modules of CFT. Kayatz et al. [56] examined how the Cool Farm Tool Water (CFTW) helped farmers estimate their water usage and showed that it is still clearly insufficient in absolute value guidance of field irrigation. On the other hand, rather than measuring ecological outcomes directly, the Cool Farm Biodiversity Indicator was used to evaluate biodiversity at farm level in [57] based on science-backed management practices. Researchers in New Zealand used CFT’s biodiversity metric as a conceptual starting point to develop a more locally grounded framework aimed at supporting biodiversity assessments tailored to the conditions of New Zealand farms[58]. Additionally, researchers in Cyprus adapted CFT’s carbon footprint tool to create a vineyard specific carbon footprint calculator known as the Vineyard Carbon tool (VCT) [59].
3.4. Key Takeaways
3.4.1. Farm Type and Location
The vast majority of farms using CFT in recent literature have involved different types of crops and dairy is the only livestock type identified in recent literature as shown in Table 2 and Table 3.
Further quantitative analysis on the CFT case studies are represented in Figure 1, Figure 2, Figure 3 and Figure 4. As shown in Figure 1, majority of the studies were based in Africa or Asia, whereas Figure 2 shows the number of case studies per country with India containing most of the CFT case studies. The split between case studies with the primary focus being crop or livestock is shown in Figure 3 and studies that focused on both crops and livestock were not included in the graph. Finally, Figure 4 shows the frequencies of the distributions of CFT features in recent case studies showing that the GHG estimation tool was the most popular by a wide margin compared to the others.
3.4.2. Data Collection Methods
The case studies used various types fo data collection methods for their analysis. Although most studies preferred collecting data through interviews [39,49,60] and surveys [41,44,50,52,59], data was also partially or entirely sourced from secondary sources [61] like press releases, peer reviewed articles [43], and pre-existing datasets [62] in some of them. Some researchers opted for digital tools such as GeoFarmer APP and DSSAT simulations [45,49] for data collection.
3.4.3. Effectiveness of CFT
CFT is often compared to other tools, with varying strengths and weaknesses and it is identified as a tool with publicly available methodology and this transparency helps building trust for stakeholders from various domains [7]. Additionally, CFT is shown to be user-friendly, with a simple interface with intuitive visualizations [8]. Key features of CFT identified by researchers and other users include detailed input structure [53], low-cost carbon estimates in the absence of advanced measuring equipment [63] and identifying emissions on a per hectare or per unit of yield basis [41]. Moreover, CFT has been identified as a suitable tool for livestock emissions calculations[17].
3.4.4. Barriers Affecting Uptake
When assessing digital tools such as CFT, it is important to consider barriers that may prevent farmers from adapting it to their daily farming operations. These factors include inadequate resources, time, money [48], and social factors [47]. Additionally, there may be factors affecting the adoption of sustainable farming practices. For example many farmers may not be able to adopt ZT practices due to lack of irrigation water and pest infestations [54]. As seen from the comparison between CFT and other similar tools, CFT lacks the same level of scenario analysis, static and data-driven recommendations, and cost benefit analysis. There are also several constraints in CFT-based emission calculations, such as not incorporating CH4 mitigation strategies like cover and flare systems [64]. Furthermore, the limitations include lack of consideration of livestock used in cropping systems [49], social and economic factors [12], and differences in organic production [3].
Notably, our review could not identify any current applications of CFT in Canadian contexts which presents a significant opportunity for researchers in Canadian agriculture. As agriculture in Canada moves toward net-zero targets and sustainability reporting becomes more integrated into supply chain requirements, tools like CFT can serve as bridges between scientific assessments and on-the-ground decision-making. The lack of studies based in Canada indicates a critical gap and opens up the opportunity to test the applicability of CFT for Canadian agriculture and highlight any necessary calibrations by collaborating with local producers, industry actors, and researchers to adapt CFT to the unique conditions of Atlantic Canada.
4. Survey Design and Data Collection
This section outlines our research design and implementation to gather the information necessary for adapting CFT to the realities of poultry and dairy farming in Atlantic Canada. It describes the rationale behind the data collection, the structure and scope of the surveys, and the procedures followed to reach participants across the region.
4.1. Study Context and Objectives
Building on insights from the literature review, we translated themes around digital tool adoption and GHG assessment into a practical field data collection framework. Our objective was to gather detailed operational, environmental, and management data from local poultry and dairy farms to inform CFT customization. By documenting current practices and farmer attitudes toward emission tracking, we sought to identify necessary adaptations that would improve CFT’s usefulness and uptake in the region. Atlantic Canada’s agriculture sector is striving for net-zero GHG emissions, but adoption of carbon footprint tools remains low. As seen in the literature review, region-specific practices (feed types, manure management, energy use) may not be fully addressed by CFT. Hence, our surveys focused on establishing baseline farm data and gauging openness to digital emission tracking. Understanding farmer needs and constraints allows us to pinpoint what CFT modifications or support systems (e.g. decision support, predictive modeling) are required for successful local adoption.
4.2. Survey Design
We developed two survey instruments (for poultry and dairy farms) structured around six key sections: General Information, Current Farm Practices and Operations, GHG Emissions and Sustainability, Plastic and Waste Management, Adoption of the CFT, and Future Communication. These sections were chosen to comprehensively cover farm profile, routine management, environmental practices, openness to new tools, and willingness to engage in follow-up. Each survey consisted of a mix of multiple-choice questions (including check-all-that-apply and 5-point Likert scale ratings) and open-ended questions for elaboration on practices. In designing the surveys, we incorporated relevant questions directly derived from the CFT framework, particularly in the sections on emissions and resource use to align with CFT input requirements. We consulted prior researches on farmer perceptions of new technologies to ensure our approach was in line with proven methodologies as shown in Table 4. Notably, ease-of-use and clarity were prioritized in our questionnaires, since CFT’s eventual adoption may hinge on farmer-friendly interfaces.
The surveys were conducted as unidentified surveys, with no personally identifiable information collected unless voluntarily provided in the “Future Contact" section. Ethical considerations were addressed by ensuring voluntary participation, informed consent, and secure storage of all data. The dedicated “Future Contact” section invited respondents to provide contact information for follow-up research or pilot trials, enabling us to identify participants willing to engage in future phases while preserving the anonymity of all other responses. No pilot testing was conducted prior to deployment. The surveys were reviewed by the research team and subject-matter experts for content relevance, but they were not trialed with farmers before the full rollout. As a result, there was no opportunity to refine question wording, adjust response categories, or gauge completion time based on actual farmer feedback. While the instruments still generated valid responses, the absence of a pilot may have reduced the overall precision and user-friendliness of the questionnaires.
As illustrated in Table 4, the choice of data analysis methods in comparable studies varies widely, from descriptive summaries to advanced regression models and Kano analysis. These decisions typically reflect both study objectives and the scale of available data. Given the exploratory nature of our research and the relatively small sample size, we adopted a descriptive statistical approach summarizing results through counts, proportions, means, and standard deviations. This method was chosen to provide a clear overview of farmer practices and attitudes while avoiding over-interpretation of patterns that cannot be generalized from such a limited dataset. The emphasis, therefore, was on generating preliminary insights and identifying areas for further investigation rather than testing predictive models.
4.3. Data Collection Strategy
Data collection took place in early 2025 using a two-pronged strategy. First, we conducted in-person surveys at a regional industry event to gather initial responses. In February 2025, at the Atlantic Poultry Conference (Wolfville, NS), poultry farmers were interviewed or asked to fill out a paper survey. This yielded responses from 13 poultry farms across the Atlantic provinces. Where possible, interviews were audio-recorded (with consent) and later transcribed to capture details accurately. Following the conference, we expanded our reach with an online survey (Microsoft Forms) distributed to poultry and dairy producers in Atlantic Canada. The poultry online survey link was sent to 23 contacts (regional commodity boards, producer associations, and individual farmers, including those who indicated interest at the conference), and the dairy survey link was sent to 8 contacts including provincial dairy boards and industry contacts. As of August 28, 2025, we had received 20 poultry survey submissions and 3 dairy submissions, for a total of 23 participating farms from our ongoing surveys. The poultry responses predominantly came from the in-person effort (conference) supplemented by 7 online submissions, whereas all dairy responses were obtained via the online survey. The approximate response rates were almost 87% for poultry and 37.5% for dairy. No incentives were provided for participation and missing entries in questionnaires were coded as missing (left blank) with no imputation applied.
4.4. Participant Demographics
Among the 20 poultry and 3 dairy farms participated in this study, the poultry respondents represented all four Atlantic provinces, with 12 farms in Nova Scotia, 3 in New Brunswick, 2 in Newfoundland and Labrador, and 1 in Prince Edward Island. One poultry farms reported operating across the border in Ontario/Quebec in addition to Atlantic Canada, and one respondent did not specify their province. This broad geographic coverage suggests our sample captures a range of regional contexts, although the dairy respondents were all located in New Brunswick (indicating a provincial skew in the dairy sample). Figure 5 illustrates the distribution of poultry farm types among our respondents.
The cohort included broiler (meat chicken) operations (8 farms) and layer (egg) operations (7 farms), as well as a few mixed-production farms (i.e., combined broiler-breeder, broiler-turkey, or layer-pullet setups). In terms of scale, poultry farms ranged from small to large: using categories based on flock size, we had 2 small farms (less than 10,000 birds), 10 medium farms (10,000-50,000 birds), and 8 large farms (greater than 50,000 birds). Most poultry respondents thus operated medium or larger commercial operations, with only a couple of small-scale producers in the sample. The dairy farms were generally moderate-to-large family operations, averaging 433 acres in farm area and managing sizeable herds. On average, the dairy farms reported about 62 milking cows (with additional dry cows, heifers, and calves bringing the total cattle inventory higher). All three dairy farms used robotic milking systems, milking more than twice daily, and reported daily milk production averaging about 39 liters per cow. Notably, all dairy farmers indicated they use farm management software tools for record-keeping or herd management (i.e., DeLaval herd management systems, QuickBooks for farm finances). In contrast, digital record-keeping among poultry farmers was less uniform: only a subset of poultry respondents (mainly those from the online survey) reported using software tools such as Microsoft Excel, SmartBarn, or Google Sheets to manage farm data.
4.5. Data Handling and Preprocessing
All survey responses, whether collected on paper, by interview, or online, were entered into a digital dataset for analysis. We pooled the poultry data from the conference and online surveys, since the two instruments covered largely the same questions. Unless a question was exclusive to one version, results from both poultry surveys were combined and analyzed together to increase sample size and statistical power. Prior to analysis, we performed basic data cleaning such as standardizing units and responses for certain quantitative questions. For example, farmers initially had the option to report electricity usage either in cost (CAD) or in energy (kWh), which complicated comparisons among farms. Hence, in the online version, we refined this by requesting kWh specifically. However, the in-person data contained a mix of formats, and we addressed this by separating those entries from both types of responses. In cases where participants did not answer or provided non-standard answers, we treated those as missing data. Given the descriptive nature of our study, no transformations beyond unit conversion were applied. We computed summary statistics (count, mean, and standard deviation) for numeric responses within each survey section to characterize central tendencies and variability. These are presented for a few key variables in the results and in aggregate form in Table 5.
Given the relatively small sample size, we did not employ dedicated qualitative coding software. Instead, open-ended responses were manually reviewed by two researchers, who independently highlighted recurring themes, categorized notable practices, and compared coding decisions to ensure consistency. Discrepancies were resolved through discussion, resulting in a set of broad descriptive categories (e.g., “energy costs,” “data management challenges,” “interest in renewables”). This qualitative coding process was intended to capture key attitudes and practices rather than to build a formal codebook.
Alongside descriptive statistics, we also performed a limited set of exploratory statistical tests to assess whether interest in adopting the CFT was associated with specific farm characteristics. For this purpose, responses to the adoption question were grouped into three categories: Interested, Unsure, and Not Interested. These were cross-tabulated against selected explanatory variables that were common across survey modes, including (i) farm size, (ii) farm type (broiler, layer, mixed), (iii) province of operation, and (iv) reported participation in an energy audit or sustainability program. Because of the small sample and sparse cell counts, we applied Fisher’s Exact Test [75], which is robust for contingency tables with low expected frequencies. Analyses were conducted in R (v4.3.3) using standard statistical packages. These tests were strictly exploratory: they did not yield statistically significant associations, but they demonstrate the type of analysis that could be expanded with a larger dataset.
5. Survey Responses and Analysis
The key findings from the poultry and dairy farmer surveys conducted to inform the adaptation of the CFT for Atlantic Canada are presented and analyzed in this section. The results are organized to reflect both the general characteristics of respondents and their reported farm management practices, sustainability perceptions, and openness to adopting CFT. Data are drawn from both in-person and online responses, with quantitative measures summarized using counts, means, and standard deviations, and qualitative answers grouped by recurring themes.
5.1. Response Overview
In this paper, we analyzed survey data from 23 farms in Atlantic Canada: 20 poultry and 3 dairy. Among poultry respondents, ~40% were broiler, ~35% layer, and the remainder mixed or dual-purpose flocks (Figure 5). The dairy farms were all year-round indoor operations with herds of about 100 heads, including several dozen lactating cows, and all reported using robotic milking systems, indicating a relatively high level of technology adoption. Poultry results presented below combine on-site and online surveys (n=20), with online-only items noted separately. Dairy responses (n=3) are included for comparison but should be interpreted cautiously given the very small sample.
5.2. Farm Management Practices
5.2.1. Feed and Water Use
Feeding practices varied considerably, especially among poultry farms. Respondents reported a mix of feed types, including mash (8 farms), pellets (2), crumble (2), and specialty formulations such as “lay mash.” A minority sourced part of their feed on-farm (grain production or organic rations). This diversity, with no single dominant feed, suggests that diets are tailored to individual farm preferences or supplier availability. Dairy farms showed greater uniformity: two used partial mixed rations and one a total mixed ration, typically composed of corn silage, dry hay, and concentrates. Reported intake averaged 50.7 kg per cow per day (fresh weight basis), though values varied by farm. None of the dairy farms practiced grazing or pasture feeding.
Groundwater wells were the primary water source across both sectors. Eighteen of 20 poultry farms relied on wells, while one used lake water and another pond water; none reported municipal supply (Figure 6). All dairy farms also depended on on-site wells. However, most respondents did not monitor water consumption: poultry farmers generally lacked usage records, and dairy farmers reported uncertainty about monthly totals. Wastewater management was limited: only one poultry farm stored and field-applied treated wastewater, while all others discharged or spread it without prior treatment.
5.2.2. Animal Housing, Cleaning, and Manure Management
Hygiene routines and manure handling differed markedly between sectors. Poultry farmers reported highly variable cleaning frequencies, ranging from every 6 weeks (2 farms) to every 3 months (1), annually (4), or even 75–80 weeks (1); some gave conditional answers such as “as needed” or annual disinfection with minor interim clean-ups. In contrast, all three dairy farms cleaned and disinfected barns daily, facilitated by alley scrapers or automated removal—practices essential for cow health and characteristic of modern dairy housing.
Manure management in farms also diverged. Among poultry farms, the most common strategies were direct land application (8 farms) and composting (6). Other practices included drying and storing manure on belts (1), using an unspecified technology-based system (1), or selling/giving manure to neighboring farms (3). Only one poultry farm reported lagoon storage, consistent with the solid or semi-solid litter systems typical of poultry production (Figure 7). By contrast, all dairy farms managed manure as liquid or slurry: each used lagoon or pit storage, with one also handling some solids from bedded pack areas. Because none of the dairy herds grazed, all manure was collected indoors. Bedding also reflected sectoral differences: dairy farms primarily used sawdust, with two supplementing straw and one adding sand, while poultry bedding was not directly surveyed but is typically wood shavings or straw.
5.2.3. Farm Energy Use and Equipment
Energy systems on poultry and dairy farms were diverse, with limited adoption of renewables. Among poultry farms, only two had installed solar panels, though six expressed interest in renewables and others reported no interest. None of the dairy farms had renewable systems, but all three indicated future interest (primarily solar).
Conventional energy use in poultry barns was heterogeneous. Gas heating (propane or natural gas) was the most common, cited by at least five farms, with additional mentions of propane “box” heaters (2), L.B. White radiant heaters (1), and general propane use (3). Alternatives included a biomass pellet heater (1), electric heaters (2), a heat exchanger (1), and an oil furnace (1). Cooling relied mainly on ventilation, with isolated reports of evaporative pads, large fans, or unspecified air-cooling systems. In dairy barns, all three relied on electric heating, with one supplementing summer cooling pads and a diesel heater for winter extremes.
Reported fuel and electricity consumption in dairy farms varied widely: two farmers estimated 100 L and 3000 L of diesel per month, and electricity at 1650 kWh and 6300 kWh per month, reflecting differences in herd size and mechanization. Poultry energy data were harder to standardize, as many reported costs rather than kWh, and some admitted not tracking fuel usage, highlighting a broader lack of detailed monitoring across farms.
Open-ended responses on equipment use showed poultry farmers employed a variety of mechanization, including automated augers (2), skid steer loaders (1), dump trucks (1), specialized nest systems (1), automated pan feeders (1), egg packing machines (1), manure conveyor chains (1), and tractors (1). This indicates targeted investment in labor-saving technologies despite reliance on conventional energy sources. Both sectors rely on traditional energy sources with a growing interest in renewable energy options, and both face the challenge of managing waste streams (manure, wastewater, plastics) in sustainable ways, which we detail further below.
5.3. Sustainability Perception and Practices
Few poultry farmers actively track GHG emissions: only 3 of 20 (~15%), including one using the NESTT tool [76]. Most do not monitor emissions—- six responded “not applicable,” five expressed future interest, one was uninterested, and others said “no” (Figure 8). None of the dairy farms currently track GHGs, though all three indicated interest, consistent with their overall enthusiasm for adopting emission-reducing technologies.
Mitigation practices were more common. Among poultry farms, nearly all had implemented at least one measure: energy-efficient lighting and ventilation (6 farms), precision feeding (5), and upgrades such as efficient heating (1), LED lights (2), high-efficiency fans (1), cooling pads (1), enriched feed carts (1), composting mortalities (1), and improved manure storage/treatment (2). Only one poultry farm reported no strategies. Two dairy farms had undertaken similar actions, including efficiency upgrades (2) and improved manure storage (1). None were using feed additives for methane reduction, reflecting a knowledge gap.
Participation in formal programs was limited (Figure 9). In poultry, only 2 of 20 had completed an energy audit, 6 were unsure, and 12 said no. Interest in carbon credit or sustainability programs was moderate (6 interested, 2 participating, 4 unsure, others not interested). Dairy farmers had not yet engaged in audits or programs, though their expressed interest in tracking suggests potential uptake.
General attitudes toward sustainability were moderate. Both poultry and dairy farmers rated its importance at an average of 3.67/5 (Figure 10), indicating it is valued but not a top priority. Poultry farmers cited “industry longevity” (2), lower emissions (1), and lower costs (1) as benefits, while dairy farmers emphasized efficiency (2) and cost savings (3). The latter aligns with their recognition of financial co-benefits from energy efficiency.
Interest in new technologies was also evident. Poultry farmers mentioned solar panels (2) and heat exchangers (1), while dairy farmers highlighted solar and the robotic systems already in use. Overall, most respondents are engaged in sustainability through low-cost measures and curious about advanced options, but participation in structured programs remains low. Sustainability is viewed pragmatically important, but often framed through cost savings and efficiency suggesting that clear incentives and tools like CFT could help convert interest into broader adoption.
5.4. CFT Adoption Willingness
Survey responses revealed distinct differences between poultry and dairy farmers in their openness to adopting the CFT. Among poultry respondents, the most frequently cited barrier was cost (6 of 20), encompassing potential subscription fees, equipment, or time as an economic burden. Other barriers included uncertainty of benefits (4), complexity or data demands (3), lack of time/resources (1), labour constraints (1), farm size concerns (1), government-related issues (1), and lack of incentives (3). This pattern reflects both financial caution and skepticism about the tool’s utility.
In contrast, dairy farmers did not consider cost a barrier. Instead, two of three cited uncertainty of benefits and one noted time requirements. None mentioned complexity or incentives as limiting factors, suggesting higher baseline confidence in their capacity to integrate digital tools.
Interest levels also diverged. In the poultry conference survey (n=13), only 3 farmers (23%) expressed interest, while 6 (46%) were not interested, and 4 were unsure or required more information. In the online poultry survey (n=7), average adoption interest was low (2/5). One farmer already using NESTT rated potential adoption of CFT at 4/5 if it offered additional features, while the others scored 2/5. A cost-free scenario modestly raised average interest to 2.67/5, indicating that removing financial barriers alone would not drive adoption, as time, complexity, and unclear benefits remain limiting. Poultry respondents also did not identify specific incentives that would change their stance.
Dairy respondents, by contrast, showed strong willingness: all three expressed interest, with an average adoption likelihood of 4.33/5 and perceived usefulness rated similarly high. Their interest remained unchanged when cost was removed, suggesting they view CFT as a worthwhile investment. Two cited government incentives (e.g., subsidies, tax credits) and one mentioned grants as supports that would further encourage adoption, not to offset direct costs but to reduce perceived effort or risk through program participation.
5.5. Engagement Willingness
Beyond immediate adoption of CFT, we examined farmers’ willingness to participate in broader sustainability initiatives and future collaborations (Figure 11). At the end of the survey, producers were invited to opt into future contact for follow-up studies or on-farm trials; several provided information, indicating a subset is willing to remain engaged in research and development.
Interest in formal sustainability programs also reflected latent engagement. Six poultry farmers expressed interest in carbon credit or government incentive programs, though only two were currently enrolled. This gap between interest and participation likely reflects external barriers such as program complexity or limited awareness. Similarly, five poultry farmers indicated interest in GHG tracking despite not yet implementing it, while three had already adopted some form of monitoring (e.g., NESTT), with one farmer noting willingness to switch if CFT offered advantages. All three dairy farmers expressed interest in both tracking and adopting emission-reducing technologies, underscoring readiness for climate-focused initiatives.
Engagement was also evident in openness to new technologies. Poultry respondents mentioned solar panels (2), heat exchangers (1), and real-time emission monitoring (4), while dairy respondents highlighted renewables and robotics. Two poultry farmers had undergone energy audits, demonstrating willingness to collaborate with advisors. More broadly, the detailed qualitative responses many farmers provided suggest a reflective and participatory mindset: even skeptics of CFT engaged in discussing sustainability practices, signaling a base level of readiness to be part of ongoing conversations and trials.
6. Discussions
The survey results are interpreted in this section in the context of the study’s objectives and the wider literature on farm management, sustainability, and adoption of decision-support tools like the CFT. It explores what the findings reveal about the current level of digital readiness, the main barriers and motivations for adopting CFT, and the sustainability practices already in place among poultry and dairy farmers in Atlantic Canada. Differences and similarities between the two sectors are highlighted to better understand where customization of the tool may be most needed. The discussion also considers the practical implications of these results for improving CFT’s usability and relevance in this regional context, as well as the limitations of the current study and opportunities for future work.
6.1. Digital Readiness and Tool Usage
The survey results shed light on the digital readiness (Figure 12) of Atlantic Canadian farmers. In general, our findings suggest a moderate level of technological adoption on farms, with significant differences between the dairy and poultry sectors. The universal use of digital tools among dairy respondents signals a high baseline comfort with technology in that group. This environment is conducive to adopting an additional digital tool like CFT; dairy farmers likely have readily available data (milk yields, feed intake, etc.) and the skills to input or extract information, lowering the barrier to using a carbon calculator. Furthermore, the presence of robotic milking systems on all 3 dairy farms indicates that these producers are forward-thinking and have invested in precision technologies, often motivated by labor savings and herd monitoring benefits. Such farmers may more readily see the value in data-driven decision support tools (like CFT), especially if it can integrate with or complement their existing systems. This aligns with observations from other regions – for example, many European dairy farmers have adopted precision technologies partly due to subsidies and industry programs encouraging innovation.
In contrast, digital tool usage among poultry farmers was more uneven. While the survey did not explicitly quantify what percentage of poultry farms keep digital records, only the three online poultry respondents were directly asked about software use, two of those used basic tools like Excel or Google Sheets for record-keeping. It is likely that some of the other poultry farmers (from the conference) also use computers or smartphones for certain tasks (i.e., finances or flock tracking), but we can infer that poultry operations in the sample include some that are less digitized. This disparity suggests that CFT adoption will face a steeper learning curve in the poultry sector, where a portion of farmers may not routinely use data software. These farmers might require more training and support to comfortably use an online GHG calculator. On the other hand, a few poultry respondents did mention fairly advanced equipment (automated feeders, climate controllers, etc.), which implies segments of the poultry industry are technologically advanced. The key will be to align CFT with the existing workflows. For instance, if a poultry farmer already logs feed purchases and flock data in a spreadsheet, CFT could be introduced as a tool that leverages those same records to compute emissions, rather than an entirely separate task. Encouragingly, interest in digital innovation was evident: some farmers were willing to try new technologies like real-time emission tracking or renewable energy systems. This indicates an openness to digital solutions if they address specific needs or bring clear benefits.
Another aspect of digital readiness is internet connectivity and device usage in rural areas. While not directly surveyed, the very fact that 23 farmers responded (3 dairy, 20 poultry) either on paper or online suggests most have at least basic internet access. However, if some farmers did not participate due to lack of connectivity or discomfort with online forms, that itself is a clue: any digital tool deployment must consider access and user interface simplicity. Tools like CFT need to be user-friendly for farmers with varying levels of tech-savvy. Given that many older farmers or those in remote areas might prefer pen-and-paper, an adaptive strategy could involve offering offline data entry options or extension support (i.e., advisors who can input data on behalf of farmers). Our findings also show that data culture on farms is mixed. For example, several farmers did not know their exact fuel or electricity usage, which implies they are not regularly tracking those metrics. To use CFT effectively, users must gather information on inputs, outputs, and practices. Thus, part of improving digital readiness is encouraging better record-keeping. Since many dairy farmers already keep detailed herd and milk records (often required for dairy management), incorporating emissions-related record-keeping might be a smaller leap for them. The challenge is integrating CFT into existing digital ecosystems on the farm. Ideally, CFT could import data from tools farmers already use, minimizing duplicate data entry.
Placing these results in context helps clarify their significance. In European dairy sectors, adoption of digital tools such as CFT has been accelerated by subsidies and cooperative programs. New York dairy studies similarly show that uptake improves when tools are linked to efficiency and profitability rather than only environmental goals. By contrast, the U.S. rice sector demonstrates how adoption lags without clear incentives. Our Atlantic findings follow this pattern: dairy farms appear technologically ready but lack supporting programs, while poultry adoption remains tentative in the absence of tangible benefits.
6.2. Barriers and Perceived Challenges
The study brought to light several barriers and challenges that farmers perceive in relation to new sustainability tools like CFT, as well as general obstacles to implementing sustainable practices. Understanding these barriers is vital in strategizing how to encourage adoption and effective use of the tool. Figure 13 shows that the most frequently reported barriers to adopting CFT were cost and lack of time or resources, followed closely by uncertainty about its benefits. Fewer respondents identified complexity of the tool, government-related issues, or farm size as significant obstacles. This suggests that practical and perceived value considerations may play a greater role in adoption decisions than technical or regulatory factors. The foremost barrier identified by poultry farmers was cost, a concern that using CFT could incur expenses that their farm might not be able to justify. This perception of cost includes not only direct costs (subscription fees if any) but also indirect costs such as time (labor hours) and potential equipment or software upgrades. It is interesting that cost was not echoed by dairy farmers in our sample as a major issue. One explanation could be that the dairy respondents, all of whom had invested in robotic milking, are relatively larger or more capital-intensive operations for whom an additional software tool is a marginal expense. Poultry respondents, with a broader mix of farm sizes, included some who likely run on tighter margins or have less discretionary budget for non-essential tools. Hence, any implementation of CFT must consider economic feasibility and clear return on investment for farmers. Demonstrating how CFT can potentially save money (for instance, by identifying inefficiencies or qualifying farms for eco-certifications that yield price premiums) could mitigate the cost concern.
Another prominent challenge is the uncertainty of benefits. Farmers are hesitant to adopt CFT if they are not convinced it will tangibly benefit their operation. This skepticism is a rational one; farmers are bombarded with new products and programs, and many will take a “prove it” stance before changing their routines. To address this, pilot projects or case studies in Atlantic Canada could be instrumental. For example, showing a real farm where using CFT led to specific improvements (GHG reduction and cost savings, or efficiency gains). In absence of local proof, referencing European or broader Canadian success might help, but local validation is usually more persuasive. Farmers also mentioned lack of time, lack of personnel, and the complexity of tools as reasons they might shy away. If CFT is perceived as an administrative burden (data entry, learning software), adoption will suffer. This emphasizes the need to streamline the user experience by automation and integration. For example, if CFT could pull data from a milking system or feed silo readings automatically, that reduces manual data entry. If governments or supply chain players (processors, retailers) begin to require or reward GHG tracking (through programs, subsidies, or premium pricing), farmers will have a stronger push to adopt tools like CFT. In Atlantic Canada, such incentives are currently limited, which could explain the relatively low participation in carbon programs. This suggests a potential strategy: collaborate with policy-makers to create or publicize incentives for on-farm carbon accounting and reduction.
A further obstacle is infrastructure and logistical barriers that indirectly affect sustainable practice adoption. For instance, in waste management, many farmers (especially dairy) indicated they do not recycle plastics simply because they lack access to recycling facilities. This kind of barrier is outside the scope of CFT, but it reflects the broader context of sustainability challenges. Similarly, none of our participants had done a carbon audit or calculation before apart from one using NESTT, which could mean that the culture of carbon management is still nascent here. The learning curve is a barrier in itself: farmers might not be familiar with concepts like carbon footprint, so part of the challenge is educational. One somewhat surprising find was that dairy farmers did not cite “lack of time” or “complexity” as barriers, even though one did mention time anecdotally. Possibly, dairy farmers in our sample, being already engaged with tech, feel confident they could handle it. Barriers to behavior change were also evident in sustainability practices: for example, although some farmers expressed interest in carbon credit programs, they had not joined them. Barriers there could include bureaucratic complexity or skepticism about the programs’ benefit mirroring barriers to CFT involving adopting something new with unclear outcomes.
It is worth highlighting the difference in mindset between the two groups we studied. Dairy farmers, generally, seemed more solution-oriented, whereas poultry farmers were more cost/benefit cautious. Engaging poultry farmers may require addressing specific concerns: for example, showing how CFT could potentially help optimize feed efficiency (a major cost in poultry) or manage manure better. If they see a direct farm management benefit (beyond just carbon accounting), they may be more inclined. Addressing these will require a multifaceted approach: economic arguments (or subsidies) to tackle cost, demonstrable results and user testimonials to clarify benefits, user-centric design and possibly data entry assistance to tackle time/complexity, and working with industry/government to create a supportive ecosystem that encourages farmers rather than leaving them on their own.
Overall, the barriers identified here: cost, time, and uncertainty of benefits—- mirror the structural and behavioral challenges reported in prior studies of technology adoption. As seen in literature, European livestock producers often cite administrative burden and unclear economic returns as major obstacles, while North American studies point to skepticism and limited incentives as persistent barriers suggesting that Atlantic Canadian farmers face not unique but familiar challenges, and thus similar strategies financial support, clear demonstration of value, and reduced complexity will be critical for overcoming resistance to CFT adoption.
6.3. Sustainability Practice Trends
Our results provide insight into current sustainability practices and trends among Atlantic Canadian poultry and dairy farmers. One clear trend is that many farmers are already taking action to reduce their environmental impact, especially in ways that align with improving efficiency. For example, a majority of both poultry and dairy respondents have implemented energy-efficient lighting and ventilation in their facilities. This is a positive trend as it indicates a win-win scenario: farmers adopt these measures primarily to save on electricity costs or improve animal comfort, and as a co-benefit, they reduce GHG emissions. Such practices are often the “low-hanging fruit” of sustainability relatively simple, cost-effective changes that also cut emissions.
The frequent mention of precision feeding by poultry farmers is another notable trend. Precision feeding techniques (like formulating diets closely to animals’ nutritional needs, phase feeding, etc.) can reduce nitrogen excretion and methane from manure, improving feed conversion ratio which is economically beneficial and several poultry farmers doing this shows a trend towards optimizing feed use, likely driven by cost savings on feed, but it doubles as an emissions mitigation strategy. In dairy, while none mentioned precision feeding by name, the use of robotic feeders by one farm suggests similar efforts to optimize feeding.
Another trend is the interest in renewable energy, even if current adoption is low. The survey responses indicate a growing trend towards exploring on-farm renewable energy generation. The motivators are likely both economic (offsetting power costs in remote areas with high electricity rates) and environmental (aligning with sustainability goals). As technology costs fall and more success stories emerge, we can expect more farms to adopt solar, wind, or biomass energy solutions.
Waste management practices show a trend of partial sustainability uptake. For instance, plastic pesticide or chemical container recycling/take-back programs are utilized by many farmers. This reflects the success of existing programs (often run by industry or government) that facilitate proper disposal of farm plastics. However, when it comes to other plastic waste (i.e., feed bags, baler twine, wrap), the trend is still dominantly landfilling or burning. A sizeable number of farmers do recycle some plastics or reuse them, but landfill was the single most common fate for miscellaneous farm plastics. This trend highlights a gap: farmers will participate in recycling if convenient programs exist (like for chemical jugs), but lacking those, they revert to traditional disposal. As mentioned by all 3 dairy farmers that they lacked access to recycling facilities underscores this structural limitation representing the trend of “improvement where systems exist, stagnation where they do not".
We also see a trend in attitudes: moderate importance given to sustainability, suggesting that while farmers are not dismissive of sustainability, it might not be their top priority unless it connects to farm profitability or compliance. Environmental outcomes like lower emissions were mentioned, but economic resilience seems to be the primary lens through which sustainability is viewed. Another noticeable trend is the low participation in formal sustainability programs (like carbon credit markets or government-funded initiatives). Even though some interest exists, actual participation was minimal suggesting that current programs are either not well-suited or not well-publicized to these farmers. It could also indicate that the programs (if they exist regionally) have barriers to entry.
A final trend to note is a forward-looking one: interest in knowledge and improvement. Many farmers, through opting for follow-up, asking for more information, or expressing interest in tools they are not using yet, demonstrate a willingness to learn and improve. If we continue providing accessible information and showcasing real-world benefits, these interested farmers can become early adopters who then influence others.
Taken together, these trends show that Atlantic farmers are adopting efficiency-driven sustainability measures, but often only where programs, infrastructure, or direct cost savings exist. This aligns with the literature on European and US-based studies. The parallels suggest that Atlantic Canada is not unique in its trajectory—- progress in sustainability practices will depend less on awareness than on creating enabling conditions that make such practices practical and worthwhile.
6.4. Factors Affecting Interest in Adopting CFT
We also explored the factors that may affect the likelihood of farmer adopting CFT by analyzing the results from the questions in the survey where farmers are asked if they would be interested in adopting CFT. We grouped the responses into `Interested’, `Not Interested’, and `Unsure’. Here, we created 4 different contingency tables: each of them used interest in adopting CFT as one variable, along with another variable from the survey– size of poultry farms, participation in an energy audit, province, and poultry farm type. Analysis was performed using R (v4.3.3) [77] and Fisher’s Exact Test [78] was used to determine whether there was a statistically significant relationship (p<0.05) for the two variables. Fisher’s Exact was used as it can support cell values of 0 and less than 5. Although the statistical scores did not provide any specific significance for any features, the results may vary in future with higher amounts of survey responses.
Table 6 shows the interest of poultry and dairy farmers in CFT by their province of operation. With a pvalue of 0.8382, the results show no significant dependencies between province of operation and interest in CFT. Similarly, Table 7 examines whether participating in an energy audit impacts dairy and poultry farmers’ interest in adopting CFT and shows no significance with a p-value of 0.3181.
Table 8 and Table 9 show the interest of poultry farmers in CFT by poultry farm type and number of birds on farm respectively. With p-values of 0.7231 and 0.763, they represent no statistically significant relationships between CFT adoption and farm sizes and/or bird types.
No statistically significant relationships were found between flock size, participation in energy audits, province, or poultry farm type. These results are preliminary, and further testing will be conducted once additional survey data, including responses from crop farmers, are available.
6.5. CFT Customization Implications
The data gathered in this study carry several implications on how CFT should be customized and implemented in Atlantic Canada to maximize its effectiveness and adoption. Firstly, our analysis highlights specific gaps between the tool’s current capabilities and local farming practices. One such gap is in dairy farm management: Atlantic Canadian dairy operations in our sample universally use robotic milking and zero-grazing (no pasture), which might not be the default assumptions in CFT’s dairy module. CFT’s existing algorithms (based on IPCC methods) certainly handle confined dairy systems, but certain nuances may require tuning. For example, dairy herd structure here includes significant numbers of heifers and calves raised on-site, and without explicitly accounting for the emissions from young stock or replacements, CFT may underestimate the farm’s carbon footprint. The farmers reported replacement rates of 23 heifers per month (or ~20% annually); ensuring the inclusion of emissions associated with rearing replacements (i.e., feed for heifers, their manure) is important.
Another gap identified is in dairy feed practices that rely heavily on partial/total mixed rations with components like corn silage and hay, and they do not graze. Hence, CFT’s emission factors or calculations need adjustment to reflect a typical Atlantic dairy diet allowing input of region-specific feed types and feeding methods. Similarly, the poultry manure management practices we recorded suggest a need for customization. CFT currently has modules for manure management with default emission factors (i.e., for stored manure, composting, etc.), but we might need to validate or adjust those factors for land/compost and local conditions (climate, storage duration). The most recent version of CFT (v2.45.0), does not account for the effects of manure management in poultry. Anaerobic digestion has been shown to decrease lifecycle GHG emissions by up to 23% in egg production[79]. Therefore, including more information on manure management practices could provide more accurate results for poultry farmers in Atlantic Canada and elsewhere.
The variety of heating systems in poultry (gas, propane, oil, biomass, etc.) indicates CFT’s energy section should include those options [1]. Custom emission factors for propane or oil combustion might need to reflect Canadian fuel mixes if slightly different. Another implication is the need to incorporate the range of feed types in poultry. Farmers listed everything from commercial mash/pellets to home-grown grain and even organic feed. If CFT’s expects a single “feed” input (i.e., kilograms of a standard broiler feed) for poultry, it might not capture differences in feed composition. The high standard deviation in feed amounts observed (Table 5) underlines that one-size-fits-all assumptions would not work; customization should allow multiple feed entries or an average diet composition input.
One critical implication is the need for CFT to demonstrate value to farmers in tangible terms. As farmers here are skeptical of the benefit, the tool’s output should include metrics or interpretations that farmers care about. For example, beyond carbon footprint in tonnes Carbon dioxide, showing potential cost savings or efficiency gains if they reduce emissions effectively linking sustainability to farm profitability. Kano’s concept of must-have features means the Atlantic Canada CFT should incorporate the features that our farmers deem essential. Based on our findings, a few “must-haves” might be: low time requirement, low (or no) cost to use, the ability to work offline or with limited connectivity, and data security/ownership assurances. The surveys also highlighted areas outside carbon that farmers care about, like plastic waste management and water, and customizing CFT for Atlantic Canada could consider adding or emphasizing modules that reflect local priorities. For example, water was not a stressed issue in responses (most have wells, and water scarcity is not acute in Atlantic Canada), but waste management was a concern (especially lack of recycling).
Given that our study will eventually accumulate more data (including crop farms), we can create regional benchmarks (i.e., average carbon footprint per liter of milk or per dozen eggs in Atlantic Canada). Customizing CFT to show how a farm compares to these benchmarks could be motivating either to see that they are doing well or to identify specific improvement areas. However, care must be taken in how that is communicated to avoid discouraging those who are far from the benchmark. Our findings that no statistical differences were found by province or farm size for adoption interest imply that the customization does not need separate versions for different provinces or for small vs large farms one flexible tool can serve all, as long as it allows inputting farm-specific data and remains relevant for both small and large operations.
6.6. Policy Implications and Support Programs
To practically achieve CFT adoption and net-zero emissions in agriculture, farmers will need supportive programs and policies. Table 10 presents a matrix of relevant government programs (federal and Atlantic provincial) that could facilitate the adoption of digital GHG tools, on-farm audits, renewable energy, and data systems. We compiled a shortlist of programs that fund or encourage sustainable farm practices and technology adoption, emphasizing those available in Atlantic Canada. As shown in the table, there are multiple funding streams that farmers could tap into when implementing changes highlighted by a CFT assessment. For instance, a poultry farmer who uses CFT and identifies that upgrading to high-efficiency heating would cut emissions could apply to the ACT Adoption Stream or NS’s clean tech program for a grant to purchase the new heater. A dairy farmer finding that covered manure storage or a separator would reduce emissions could leverage SCAP-funded environmental BMP programs in NB or PEI to cost-share that investment. The On-Farm Climate Action Fund, while focused on practices like cover crops and N management, provides direct payments that make it easier for farmers to adopt those practices. By integrating CFT usage with such programs, we create a synergy: the tool quantifies benefits that justify the funding, and the funding enables adoption of the tool’s recommendations.
From a policy perspective, the most applicable programs for CFT adoption in our region appear to be those targeting energy and efficiency (ACT, Efficiency NS) and those encouraging beneficial practices (OFCAF, SCAP environmental streams). Notably, programs like ACT and SCAP are already active in Atlantic Canada, so a near-term strategy could be to formally incorporate GHG assessment tools into their delivery. For example, provincial SCAP programs could require or encourage a “carbon assessment” (using CFT) as part of funding an environmental project, familiarizing farmers with the tool in a supported setting. Additionally, educational outreach through Environmental Farm Plan (EFP) programs could introduce CFT as a voluntary add-on to the EFP process, taking advantage of existing extension networks. Although not a government program, if processors or retailers start demanding GHG info, they might offer premiums or preferential contracts for lower-carbon products as part of supply chain incentives (i.e., a major grocery chain eventually asking meat and dairy suppliers for carbon metrics) as seen in some European retailer-led initiatives. Our small sample is not evidence of that happening yet, but being prepared (with tools like CFT available) is wise.
7. Study Limitations
As an initial exploratory study for our four-phase CFT adoption, this paper analyzes the current survey results to establish an informed foundation for our future large-scale pilot project. While this study provides valuable insights, it is important to acknowledge its limitations. First and foremost limitation of this survey analysis is the small sample size, especially on the dairy side. The data is not a large or fully representative sample of the entire Atlantic Canadian farming community. The dairy findings in particular should be interpreted with caution and any averages or trends could be heavily influenced by one outlier. Similarly, the lack of statistically significant patterns observed is likely due to the low statistical power of such a small sample. As preliminary findings of our surveys, this limitation was anticipated and more responses (including from crop farmers) will be collected to strengthen the analysis.
Another limitation is potential sampling bias. The poultry respondents were largely obtained from an industry conference and through outreach to known contacts. Hence, our sample might lean towards farmers that are more engaged or interested in the subject matter. Attendees of a poultry conference, for example, might be more progressive or more connected to industry networks than average poultry farmers. Likewise, those who chose to respond to an online survey (or an on-site interview) may differ from those who ignored, possibly influencing the results.
Geographic bias is also a concern as all of our current dairy samples are from New Brunswick, creating the knowledge gap for Nova Scotia, PEI, or Newfoundland dairy farms. It is possible that dairy farmers in other provinces might face different circumstances (i.e., different milk buyer sustainability programs or provincial policies) that were not captured. Similarly, our poultry sample had strong representation from Nova Scotia and few other provinces, but the one from PEI, for example, indicated no interest in CFT, which might or might not reflect PEI farmers generally.
Another limitation factor is time frame as the surveys capture a snapshot of early-to-mid 2025. Agriculture is a dynamic domain where awareness and interest in climate-related farming tools could be changing rapidly. For instance, if a new federal program were announced mid-2025 to support carbon farming, it could quickly alter attitudes of farmers, and our data might not reflect that. According to the current data collection, the AI-based tool adoption interest was moderate, but it might evolve with external conditions shift like market demands for low-carbon products, new government incentives, etc.
Additionally, our surveys currently focused on poultry and dairy; not accounting for other significant agricultural sectors in Atlantic Canada such as beef, pork, or horticulture. Although the upcoming crop survey will address crops, they are not represented here.
Absence of complex analysis method can also be considered as a limitation. Due to the small sample size, we mostly limited ourselves to descriptive analysis. We applied a few Fisher’s exact tests and found no significance, but more complex analyses (i.e., regression modeling of factors influencing adoption interest) could have been applied with larger dataset. We can highlight correlations qualitatively with the existing data, but can not prove causation or clear predictors.
Finally, the lack of in-depth qualitative data, such as detailed interviews beyond the survey questions, can be considered as another shortcoming. We have short answers but not extensive farmer narratives or reasoning limiting our ability to deeply understand the “why” behind some responses. For instance, knowing 5 farmers are uninterested in carbon credit programs is useful, but knowing “why" they are uninterested would be even more useful, and our study did not capture those nuances.
8. Future Research Directions
Although this study has laid a foundation for adapting CFT to Atlantic Canada, several key avenues remain to be explored for a practical and sustainable deployment: broadening the scope of data collection, applying advanced analytical methods, improving data handling pipelines, tailoring the tool to specific agricultural sectors, and engaging in long-term validation with stakeholders.
8.1. Expansion of Survey Scope and Design
Building on the initial surveys of poultry and dairy producers, future work will expand the survey scope to include crop farmers. Incorporating a crop farmer questionnaire will capture insights from grain, horticulture, and other field-crop operations that are integral to Atlantic Canada’s agricultural emissions profile. This broader coverage is important for designing tools that are truly “fit-for-purpose” across the diverse farm types in the region. In conjunction with expanding the audience, the survey design will be refined for clarity and effectiveness according to the lessons learned from the initial surveys such as which questions yielded unclear answers or lower response rates. Each sector’s survey (poultry, dairy, and crops) can be customized with terminology and examples relevant to that sector, making it easier for respondents to understand and provide accurate information. Selection of target audience and distribution of the surveys will also be enhanced with industry associations and provincial agriculture departments to reach a larger and more representative sample of farmers. These refinements in scope and design are expected to yield higher-quality data and more nuanced insights, strengthening the foundation for subsequent CFT adaptations.
8.2. Advanced Analytical Approaches
With a larger and more diverse dataset, advanced analytical techniques will be employed to uncover deeper insights into technology adoption and user satisfaction. One planned approach is to apply the Kano model to the survey results to identify which features or aspects of CFT drive farmer satisfaction. The Kano model [84] is a product development framework that categorizes features into must-haves, performance attributes, and exciters based on their impact on user satisfaction. It can pinpoint the functionalities that farmers consider essential versus those that might pleasantly surprise them by using feedback gathered about desired tool features and support services. It can highlight factors relating to the absence of features causing dissatisfaction (i.e., poor data integration) and the presence of features that significantly boost satisfaction. This will help ensuring that the pilot system includes all “must-have” features to meet baseline expectations and focuses development effort on features that maximize farmer satisfaction and buy-in.
Additionally, statistical and machine learning (ML) techniques will be explored to find predictors of a farmer’s willingness for CFT adoption. Techniques such as regression analysis or classification trees can be used to identify farm characteristics and perceptions that correlate with high interest in using CFT. For example, data may reveal whether farm size, current use of farm management software, awareness of sustainability programs, or perceived barriers (i.e., cost, complexity) are significant determinants of adoption readiness. By training predictive models on survey responses, we can uncover the combinations of factors best distinguish enthusiastic adopters from reluctant ones. ML could also help detect subtle patterns in the responses, such as grouping farmers by their attitudes toward technology or sustainability. This will be valuable for crafting targeted strategies to increase uptake of the tool. If lack of time or unclear benefits are found to be common barriers, those can be directly addressed in future training and outreach, whereas if certain incentives or supports are strong motivators, they can be discussed and emphasized by government organizations and/or NGOs. Overall, employing advanced analytics will move the project beyond descriptive findings to a more predictive understanding of adoption, which is crucial to achieving widespread implementation of CFT.
8.3. Sector-Specific CFT Adaptations
Perhaps the most significant outcome of these efforts will be the development of sector-specific adaptations in CFT, tailored for poultry, dairy, and crop farming in Atlantic Canada. A top priority is to incorporate local emission factors and activity data to replace generic assumptions in the tool to represent the distinguishable local characteristics compared to European agriculture. For example, the manure management practices reported by dairy farms in the survey or the typical feed types and barn climates in the poultry sector can differ from the defaults. Future work will assemble the best available regional data (from literature and/or field trials) on emission coefficients for local practices, ensuring that CFT calculations reflect Atlantic Canadian realities. Hence, the precision of farm-level emission estimates will improve, giving farmers more confidence in the tool’s output. For instance, if the default methane emission factor for liquid manure storage is based on warmer climates, it will be adjusted to match the cooler, humid conditions typical of this region that influence methane production. Similarly, emission factors for crop residue management or fertilizer use can be tuned to local soil and weather conditions making the recommendations and benchmarks far more relevant to local users.
Additionally, sector-specific operational parameters and modules will be introduced by developing new input categories or management options within CFT mirroring common Atlantic agriculture practices. For the poultry sector, for example, it could be adapted to include typical local barn heating systems and bedding materials, which affect energy use and nitrous oxide emissions. For dairy, it could incorporate features for pasture-based feeding periods (since many farms here allow seasonal grazing) or local feed supplement types aimed at reducing enteric methane. A future crop module would address prominent regional crops such as forage corn, hay, or potatoes including their rotations and cover cropping practices that influence carbon sequestration and emissions. Importantly, these adaptations will be guided by the needs and gaps identified by the farmers themselves. If poultry producers indicated challenges in tracking fuel usage for barn operations, the tool’s poultry module will emphasize energy accounting; if dairy farmers highlighted the difficulty of quantifying manure management improvements, the dairy module will focus on user-friendly manure emission estimations. This sector-by-sector tailoring will ultimately contribute to a more effective context-based overall strategy for agricultural GHG reduction.
9. Conclusion
Due to its scientific foundation and practical design, CFT has been widely used by both researchers and practitioners— not only to estimate GHG emissions and assess water usage efficiency on farms, but also to identify actions that can enhance biodiversity outcomes. However, the tool’s default values may not reflect local realities in terms of energy sources, crop types, fertilizer types, animal types, environment features, or management timing. When tailored with regional information of Atlantic Canada—- such as climate, soil type, or commonly used inputs—- CFT can offer practical insights into both major contributors of GHG emissions and ways to minimize them. As the initial stage of a pioneering approach to adopt a popular carbon footprint calculator like CFT for Atlantic Canada, and by customizing and enhancing the applications with AI-infusion, this study paves the way toward adapting CFT to the unique agricultural context of Atlantic Canada. In this paper, we provided our preliminary analysis of the first phase (i.e., data collection) of a four phase framework for AI-based CFT adoption in Atlantic Canada. This study particularly focuses on designing and distributing two surveys for Atlantic farmers to collect data in both on-line and off-line settings; processing and analyzing the survey responses with quantitative and qualitative methods; and translating the survey responses to user requirements for CFT adoption in Atlantic Canada. This foundational study defined a reference point for Atlantic Canadian poultry and dairy farming practices while identifying primary challenges like implementation cost and lack of clarity on benefits (government and/or NGO incentives), and defining strategic focus points for customizing CFT modules and their functionalities.
By engaging poultry and dairy farmers through our sector-specific surveys, we gathered valuable insights into current farming practices, sustainability awareness, and openness to adopting digital tools for greenhouse gas assessment. Despite of the small sample size of poultry (20 responses) and dairy (3 responses) responses (with almost 87% response rate for poultry, and 37.5% for dairy), our investigations on the responses for pattern recognition from farming operations and farmers’ preferences were able to catch a glimpse on the local realities. The results from farms of different sizes, flock/herd sizes, animal types, feeding variations, manure managements, etc. highlighted both opportunities and barriers, including the need for localized emission factors, informed cost-benefit analysis, incentive opportunities, user-friendly interfaces, and sector-relevant features. Although a considerable number farmers showed their interest in sustainability practices, energy saving techniques, new farming technologies, and CFT or similar emission calculation tools, their responses indicated that none of these are among their top priorities. However, they are receptive to learning about these tools, technologies, and farming practices and potentially adopting them in the future, provided that there is adequate amounts of assistance and incentives.
Our findings underline the importance of tailoring tools like CFT to regional conditions, not only to improve the accuracy of emissions estimates but also to enhance farmer engagement and adoption. The work also demonstrates the value of collaborative approaches, drawing on farmer feedback, industry input, and academic expertise to guide tool customization. While the current dataset provides a base foundation, further data collection, including crop sector participation, will broaden the applicability of our recommendations. Future efforts will focus on advanced analytics, data integration, and pilot testing to validate the adapted tool in real-world farm settings. Ultimately, a regionally adapted CFT has the potential to become a practical decision-support resource that empowers Atlantic Canadian farmers to measure, understand, and reduce their environmental impact, contributing to the broader goal of achieving net-zero emissions in agriculture.
References
- Carbon Footprint Calculator | Measure Greenhouse Gases, Biodiversity, Water Use & Food Loss & Waste. Available online: https://coolfarm.org (accessed on 10 August 2025).
- Moreno-García, B.; Coronel, E.; Reavis, C.W.; Suvočarev, K.; Runkle, B.R. Environmental sustainability assessment of rice management practices using decision support tools. J. Clean. Prod. 2021, 315, 128135. [CrossRef]
- Schipanski, M.E.; McClelland, S.C.; Hughes, H.M.; Jabbour, R.; Malin, D.; Hillier, J.; Paustian, K.; Reaves, E. Improving decision support tools for quantifying ghg emissions from organic production systems. Org. Agr. 2024, 14, 503–512. [CrossRef]
- Google Scholar. Available online: https://scholar.google.ca/ (accessed on 10 August 2025).
- Springer Nature. Available online: https://www.springernature.com/gp (accessed on 10 August 2025).
- Science Direct. Available online: https://sciencedirect.com (accessed on 10 August 2025).
- Bokhoree, C.; Bekaroo, G.; Santokhee, A.; Beeharry, Y.D.; Bissessur, V.K.; Auliar, R. An analysis of farm-based carbon footprint calculators: insights for farmers. In 2021 IST-Africa Conf. (IST-Africa), South Africa, IEEE 2021, pp. 1–10.
- Thumba, D.A.; Lazarova-Molnar, S.; Niloofar, P. Comparative evaluation of data requirements and level of decision support provided by decision support tools for reducing livestock-related greenhouse gas emissions. J. Clean. Prod. 2022, 373, 133886. [CrossRef]
- Alexandropoulos, E.; Anestis, V.; Dragoni, F.; Hansen, A.; Cummins, S.; O’Brien, D.; Amon, B.; Bartzanas, T. Decision support systems based on gaseous emissions and their impact on the sustainability assessment at the livestock farm level: an evaluation from the user’s side. Sustainability 2023, 15, 13041. [CrossRef]
- SAFA (austainability assessment of food and agriculture systems) Guidelines. Available online: https://openknowledge.fao.org/items/84c84661-7172-415c-b66e-7c1eee5db675 (accessed on 10 August 2025).
- FSA. Available online: https://saiplatform.org/fsa/ (accessed on 10 August 2025).
- Rahman, M.R.; Song, J.; An, K.; Choi, Y.E.; Lee, J. Applicability of online sustainability tools for landscape performance assessment in South Korean nursery farm complexes. J. Korean Soc. Env. Restor. Technol. 2024, 27, 153–178. [CrossRef]
- Farm enterprise greenhouse gas emissions calculator. Available online: http://www.n2o.net.au/greenhouse/calculate.jsp?t=26&sc=0.4&p=1500&c=30.
- Global livestock environmental assessment model – interactive GLEAM-i. Available online: https://gleami.apps.fao.org/ (accessed on 10 August 2025).
- Lapidus, D.; Franzen, K.; Milliken, C.; Ovington, T.; Frankel-Reed, J. Informing climate-smart agriculture in low resource settings for practitioners: a review and analysis of interactive tools. Gates Open Res. 2024, 8. [CrossRef]
- Independant farm carbon calculator. Available online: https://www.agrecalc.com/ (accessed on 10 August 2025).
- Sukhoveeva, O.E. Carbon calculators as a tool for assessing greenhouse gas emissions from livestock. Livestock. Dokl. Earth Sci. 2021, 497, 266–271. [CrossRef]
- Mubarak, F.R.F.M.; Nachtmann, M. Data requirement analysis of farm sustainability assessment tools. In 45. GIL-Jahrestag., Digit. Infrastrukturen Nachhalt. Land-, Forst- Ernährungswirtschaft, Ges. Inform. e.V. 2025, pp. 345–350. [CrossRef]
- Farm carbon calculator. Available online: https://calculator.farmcarbontoolkit.org.uk/ (accessed on 10 August 2025).
- Greenhouse accounting frameworks (GAF) for Australian primary industries. Available online: https://www.piccc.org.au/resources/Tools (accessed on 10 August 2025).
- FarmGAS calculator to help farmers understand greenhouse emissions. Available online: https://www.farminstitute.org.au/wp-content/uploads/2020/07/MediaRelease-FarmGASCalculator-240809.pdf (accessed on 10 August 2025).
- Estimate your whole farm and ranch carbon sequestration and greenhouse gas emissions using COMET-Farm. Available online: https://comet-farm.com/home (accessed on 10 August 2025).
- Carbon calculator. Available online: https://agrilink.co.nz/casestudy/carbon-calculator/ (accessed on 10 August 2025).
- Holos. Available online: https://agriculture.canada.ca/en/agricultural-production/holos (accessed on 10 August 2025).
- Dairy gas emissions model. Available online: https://www.ars.usda.gov/northeast-area/up-pa/pswmru/docs/dairy-gas-emissions-model/ (accessed on 10 August 2025).
- Dunkley, C.S.; Fairchild, B.; Worley, J. Practical use and application of the poultry carbon footprint calculation tool. Department of Poultry Science, University of Georgia 2023. Available online: https://secure.caes.uga.edu/extension/publications/files/pdf/B%201443_2.PDF(accessed on 10 August 2025).
- The FarmAC model. Available online: https://www.farmac.dk/ (accessed on 10 August 2025).
- Overseer. Available online: https://www.overseer.org.nz/ (accessed on 10 August 2025).
- Murphy, P.; Crosson, P.; O’Brien, D.; Schulte, R.P.O. The carbon navigator: a decision support tool to reduce greenhouse gas emissions from livestock production systems. Animal 2023, 7, 427–436. [CrossRef]
- Response-inducing sustainability evaluation (RISE). Available online: https://www.bfh.ch/dam/jcr:0540a777-ab97-4555-b7ca-bb71904ae97c/what-is-rise.pdf/ (accessed on 10 August 2025).
- EX-ante carbon-balance tool (EX-ACT). Available online: https://openknowledge.fao.org/items/ba1df12e-93db-4769-b31f-72255ffb1530 (accessed on 10 August 2025).
- SMART farm tool. Available online: https://www.fao.org/fileadmin/templates/nr/sustainability_pathways/docs/sustainability-08-00274.pdf (accessed on 10 August 2025).
- Welcome to dairy farms +. Available online: https://dairyfarmsplus.ca/ (accessed on 10 August 2025).
- Ramos, S.; Larrinaga, L.; Albinarrate, U.; Jungbluth, N.; Ingolfsdottir, G.M.; Yngvadottir, E.; Landquist, B.; Woodhouse, A.; Olafsdottir, G.; Esturo, A.; et al. SENSE tool: easy-to-use web-based tool to calculate food product environmental impact. Int. J. Life Cycle Assess. 2016, 21, 710––721. [CrossRef]
- Carlson, B.R.; Carpenter-Boggs, L.A.; Higgins, S.S.; Nelson, R.; Stöckle, C.O.; Weddell, J. Development of a web application for estimating carbon footprints of organic farms. Comput. Electron. Agric. 2017, 142, 211–223. [CrossRef]
- Field to market. Available online: https://fieldtomarket.org/ (accessed on 10 August 2025).
- Sellars, S.C.; Schnitkey, G.D.; Gentry, L.F. Cover crops on Illinois farms. J. ASFMRA 2023, pp. 96–105: https://www.jstor.org/stable/27339136.
- Olivo, A.J.; Godber, O.F.; Reed, K.F.; Nydam, D.V.; Wattiaux, M.A.; Ketterings, Q.M. Greenhouse gas emissions and nutrient use efficiency assessment of 6 New York organic dairies. J. Dairy Sci. 2024, 107, 9527–9548. [CrossRef]
- Cayambe, J.; Heredia, M.; Torres, B.; Cordero-Ahiman, O.V.; Vanegas, J.; Díaz-Ambrona, C.; Toulkeridis, T. Dairy cattle under grazing systems: An estimate of the carbon footprint in the northern Andes of Ecuador. Proc. 1st Int. Electron. Conf. Agron., 3–17 May 2021, MDPI: Basel, Switzerland 2021. Available online: https://sciforum.net/paper/view/9719.
- Ramírez, D.A.; Hossain, M.M.; Rahaman, E.H.M.S.; Mestanza, C.; Rinza, J.; Ninanya, J.; de Mendiburu, F.; Loayza, H.; Gatto, M.; Kreuze, J.F. Potato production under zero tillage with rice straw mulching as a promissory technology to diversify rice-based systems in southwest coastal Bangladesh. J. Agric. Food Res. 2025, 19, 101603. [CrossRef]
- Kumar, P.; Sharma, J.; Sharma, A.; Singh, M.; Nare, B.; Kumar, M. Identification, management and pecuniary impact of major carbon footprint contributor in potato production system of north-west India. Heliyon 2024, 10, e30376. [CrossRef]
- Kumar, R.; Karmakar, S.; Minz, A.; Singh, J.; Kumar, A.; Kumar, A. Assessment of greenhouse gases emission in maize-wheat cropping system under varied N fertilizer application using cool farm tool. Front. Environ. Sci. 2021, 9, 710108. [CrossRef]
- Andrieu, N.; Hossard, L.; Graveline, N.; Dugue, P.; Guerra, P.; Chirinda, N. Covid-19 management by farmers and policymakers in Burkina Faso, Colombia and France: lessons for climate action. Agric. Syst. 2021, 190, 103092. [CrossRef]
- Roussis, I.; Kakabouki, I.; Stavropoulos, P.; Mavroeidis, A.; Papatheodorou, M.; Vatougios1, D.; Tsela1, A.; Bilalis, D. Carbon footprint analysis of processing tomato cultivation in Greece. Bull. Univ. Agric. Sci. Vet. Med. Cluj-Napoca Hortic. 2023, 80, 76–79. [CrossRef]
- Kakabouki, I.; Roussis, I.; Mavroeidis, A.; Karydogianni, S.; Stavropoulos, P.; Tsopanoglou, A.; Bilalis, D. Evaluation of greenhouse gas emissions of quinoa seed production in Greece. Bull. Univ. Agric. Sci. Vet. Med. Cluj-Napoca Hortic. 2023, 80, 30–35. [CrossRef]
- Awan, Z.A.; Irfan, M.; Ahmad, W.; Nasir, J.; Akhtar, M.; Imran, A.U. Potential impact of climate-smart agriculture (csa) practices on cotton production and reduction in greenhouse gas (ghg) emissions in south Punjab, Pakistan. Int. J. Agric. Nat. Sci. 2023, 16, 120–136: https://ijans.org/index.php/ijans/article/view/681.
- MacLeod, C.J.; Brandt, A.J.; Collins, K.; Moller, H.; Manhire, J. Behavioural insights for improved uptake of agricultural sustainability assessment tools. People Nat. 2022, 4, 428–444. [CrossRef]
- Anuga, S.W.; Fosu-Mensah, B.Y.; Nukpezah, D.; Ahenkan, A.; Gordon, C.; Baye, R.S. Climate-smart agriculture: greenhouse gas mitigation in climate-smart villages of Ghana. Environ. Sustain. 2022, 5, 457–469. [CrossRef]
- Rusere, F.; Dicks, L.V.; Mkuhlani, S.; Crespo, O. Integrating a crop model with a greenhouse gas calculator to identify low carbon agricultural intensification options for smallholder farmers in rural South Africa. Clean Techno. Environ. Policy 2022, 24, 1663–1680. [CrossRef]
- Arivukkumar, N.; Shanmugam, P.M.; Kannan, B.; Sumathi, C.S.; Prahadeeshwaran, M.; Sangeetha, S.P.; Raghavi, G. Assessing the carbon footprint of marginal and smallholders farming systems: a typology driven approach. Plant Sci. Today 2024, 11, 5213: https://10.14719/pst.5213.
- Das, S.K. Investigating cropland’s soil carbon sequestration potential to reduce climate change with the cool farm tool. Water Air Soil Pollut. 2025, 236, 251. [CrossRef]
- Meneses, F.; Montenegro, N.; Schapheer, C.; Perez-Quezada, J.F. Historical changes in agricultural systems and the current greenhouse gas emissions in Southern Chile. Agronomy 2023, 13, 240. [CrossRef]
- Srivastav, A.L.; Dhyani, R.; Ranjan, M.; Madhav, S.; Sillanpää, M. Climate-resilient strategies for sustainable management of water resources and agriculture. Environ. Sci. Pollut. Res. 2021, 28, 41576–41595. [CrossRef]
- Čapla, J.; Zajác, P.; Čurlej, J.; Hanušovský, O. The current state of carbon footprint quantification and tracking in the agri-food industry. Scifood 2025, 19, 110–127. [CrossRef]
- Bellassen, V.; Drut, M.; Antonioli, F.; Brečić, R.; Donati, M.; Ferrer-Pérez, H.; Gauvrit, L.; Hoang, V.; Steinnes, K.K.; Lilavanichakul, A.; et al. The carbon and land footprint of certified food products. J. Agric. Food Ind. Organ. 2021, 19, 113–126. [CrossRef]
- Kayatz, B.; Baroni, G.; Hillier, J.; Lüdtke, S.; Freese, D.; Wattenbach, M. Supporting decision-making in agricultural water management under data scarcity using global datasets–chances, limits and potential improvements. Agric. Water Manag. 2024, 296, 108803. [CrossRef]
- Crowther, L.P.; Luke, S.H.; Arellano, E.C.; McCormack, C.G.; Ferreira, V.; Hillier, J.; Heathcote, R.; Kloen, H.; Muñoz-Sáez, A.; Oliveira-Rebouças, P.; et al. The cool farm biodiversity metric: an evidence-based online tool to report and improve management of biodiversity at farm scale. Ecol. Indic. 2024, 161, 111897. [CrossRef]
- MacLeod, C.J.; Brandt, A.J.; Collins, K.; Dicks, L.V. Giving stakeholders a voice in governance: Biodiversity priorities for New Zealand’s agriculture. People Nat. 2022, 4, 330–350. [CrossRef]
- Litskas, V.; Ledo, A.; Lawrence, P.; Chrysargyris, A.; Giannopoulos, G.; Heathcote, R.; Hastings, A.; Tzortzakis, N.; Stavrinides, M. Use of winery and animal waste as fertilizers to achieve climate neutrality in non-irrigated viticulture. Agronomy 2022, 12, 2375. [CrossRef]
- Maina, J.J.; Mutwiwa, U.N.; Githiru, M.; Kituu, G.M. Evaluation of greenhouse gas emissions from small-scale coffee producers in Kiambu-Kenya based on calculations of the cool farm tool. In Proc. Sustain. Res. Innov. Conf. 2022, pp. 192–195.
- Li, X.; Jia, Q.; Gu, Y.; Bulitia, G.; Tinega, J.N.; Li, F. Reduction of carbon and water footprints in wet coffee processing and optimization of wastewater treatment at the wet mill factory. Clean. Eng. Technol. 2025, 26, 100967. [CrossRef]
- Vervuurt, W.; Slingerland, M.A.; Pronk, A.A.; Bussel, L.G.J.V. Modelling greenhouse gas emissions of cacao production in the Republic of Côte d’Ivoire. Agroforest. Syst. 2022, 96, 417–434. [CrossRef]
- Musafiri, C.M.; Kiboi, M.; Ng’etich, O.K.; Okoti, M.; Kosgei, D.K.; Ngetich, F.K. Carbon footprint of smallholder rain-fed sorghum cropping systems of Kenya: a typology-based approach. Clean. Circ. Bioeconomy 2023, 6, 100060. [CrossRef]
- Godber, O.F.; Czymmek, K.J.; van Amburgh, M.E.; Ketterings, Q.M. Farm-gate greenhouse gas emission intensity for medium to large New York dairy farms. J. Dairy Sci. 2025, 108, 5039–5060. [CrossRef]
- Bianchi, M.C.; Bava, L.; Sandrucci, A.; Tangorra, F.M.; Tamburini, A.; Gislon, G.; Zucali, M. Diffusion of precision livestock farming technologies in dairy cattle farms. Animal 2022, 16, 100650. [CrossRef]
- Lima, E.; Hopkins, T.; Gurney, E.; Shortall, O.; Lovatt, F.; Davies, P.; Williamson, G.; Kaler, J. Drivers for precision livestock technology adoption: a study of factors associated with adoption of electronic identification technology by commercial sheep farmers in England and Wales. Plos One 2018, 13, e0190489. [CrossRef]
- Krampe, C.; Serratosa, J.; Niemi, J.K.; Ingenbleek, P.T.M. Consumer perceptions of precision livestock farming—a qualitative study in three European countries. Animals 2021, 11, 1221. [CrossRef]
- Chelangand, N.C.; Mathenge, M.; Otieno, D.O.; Sassi, M. The determinants of greenhouse gas reduction levels among smallholder farmers: insights from the adoption of climate-smart dairy strategies in Central Kenya. Front. Clim. 2025, 7, 1593584. [CrossRef]
- Mpofua, B.I.; Slayib, M.; Zhoub, L.; Jajaa, I.F. Farmers’ perceptions and awareness of cattle feedlots as a climate-smart approach to enteric methane emissions. Heliyon 2024, 10, e39849. [CrossRef]
- Li, J.; Li, Q.; Liu, L. Carbon emissions from smallholder pig production in China: a precise account based on farmers’ survey. Environ. Sci. Pollut. Res. 2022, 29, 25651–25664. [CrossRef]
- Feliciano, D.; Recha, J.; Ambaw, G.; MacSween, K.; Solomon, D.; Wollenberg, E. Assessment of agricultural emissions, climate change mitigation and adaptation practices in Ethiopia. Clim. Policy 2022, 22, 427–444. [CrossRef]
- Münster, P.; Grabkowsky, B. Analyzing attitudes and satisfaction level of digital on-farm technologies for climate change adaptation and mitigation in poultry farming. XVI European Poult. Conf. 2025.
- Münster, P.; Grabkowsky, B. Kano model analysis of digital on-farm technologies for climate adaptation and mitigation in livestock farming. Sustainability 2024, 16, 268. [CrossRef]
- Palma-Molina, P.; Hennessy, T.; O’Connor, A.H.; Onakuse, S.; O’Leary, N.; Moran, B.; Shalloo, L. Factors associated with intensity of technology adoption and with the adoption of 4 clusters of precision livestock farming technologies in Irish pasture-based dairy systems. J. Dairy Sci. 2023, 106, 2498–2509. [CrossRef]
- Vierra, A.; Razzaq, A.; Andreadis, A. Chapter 28 - Categorical variable analyses: Chi-square, Fisher Exact, and Mantel–Haenszel. In Translational Surgery; Eltorai, A.E.; Bakal, J.A.; Newell, P.C.; Osband, A.J., Eds.; Handbook for Designing and Conducting Clinical and Translational Research, Academic Press, 2023; pp. 171–175. [CrossRef]
- amd Ian Turner, V.A.; Doyon, M.; Li, E.; Pelletier, N. NESTT – Development of an online, life cycle-based sustainability assessment and management platform for Canadian egg farmers. J. Clean, Prod. 2025, 493, 144954. [CrossRef]
- A language and environment for statistical computing. Available online: https://www.R-project.org/ (accessed on 10 August 2025).
- Giannini, E.H. Chapter 6 - Design, measurement, and analuysis of clinical Investigations. In Textbook of Pediatric Rheumatology (Fifth Ed.); Cassidy, J.T.; Laxer, R.E.P.R.M.; Lindsley, C.B., Eds.; W.B. Saunders: Philadelphia, 2005; pp. 142–173.
- Grassauer, F.; Arulnathan, V.; Pelletier, N. Towards a net-zero greenhouse gas emission egg industry: a review of relevant mitigation technologies and strategies, current emission reduction potential, and future research needs. Renew. Sustain. Energy Rev. 2023, 181, 113322. [CrossRef]
- Agricultural Clean Technology Program - Adoption Stream: 1. What this program offers. Available online: https://agriculture.canada.ca/en/programs/agricultural-clean-technology-adoption-stream (accessed on 27 August 2025).
- On-Farm Climate Action Fund. Available online: https://canada-organic.ca/en/what-we-do/market-access/farm-climate-action-fund (accessed on 27 August 2025).
- Advancing Clean Technologies for Nova Scotia Program Guidelines 2025–2026. Available online: https://novascotia.ca/programs/advancing-clean-technologies/act-program-guidelines.pdf (accessed on 27 August 2025).
- New Program to Focus on Greenhouse Gas Emission Reduction and Farm Sustainability. Available online: https://globalrenewablenews.com/article/energy/category/environment/18/1091997/new-program-to-focus-on-greenhouse-gas-emission-reduction-and-farm-sustainability.html (accessed on 27 August 2025).
- Münster, P.; Grabkowsky, B. Kano model analysis of digital on-farm technologies for climate adaptation and mitigation in livestock farming. Sustainability 2024, 16, 268. [CrossRef]
Figure 1.
The distribution of case studies based solely on each continent. Studies that span multiple continents are listed as “multiple countries".
Figure 1.
The distribution of case studies based solely on each continent. Studies that span multiple continents are listed as “multiple countries".
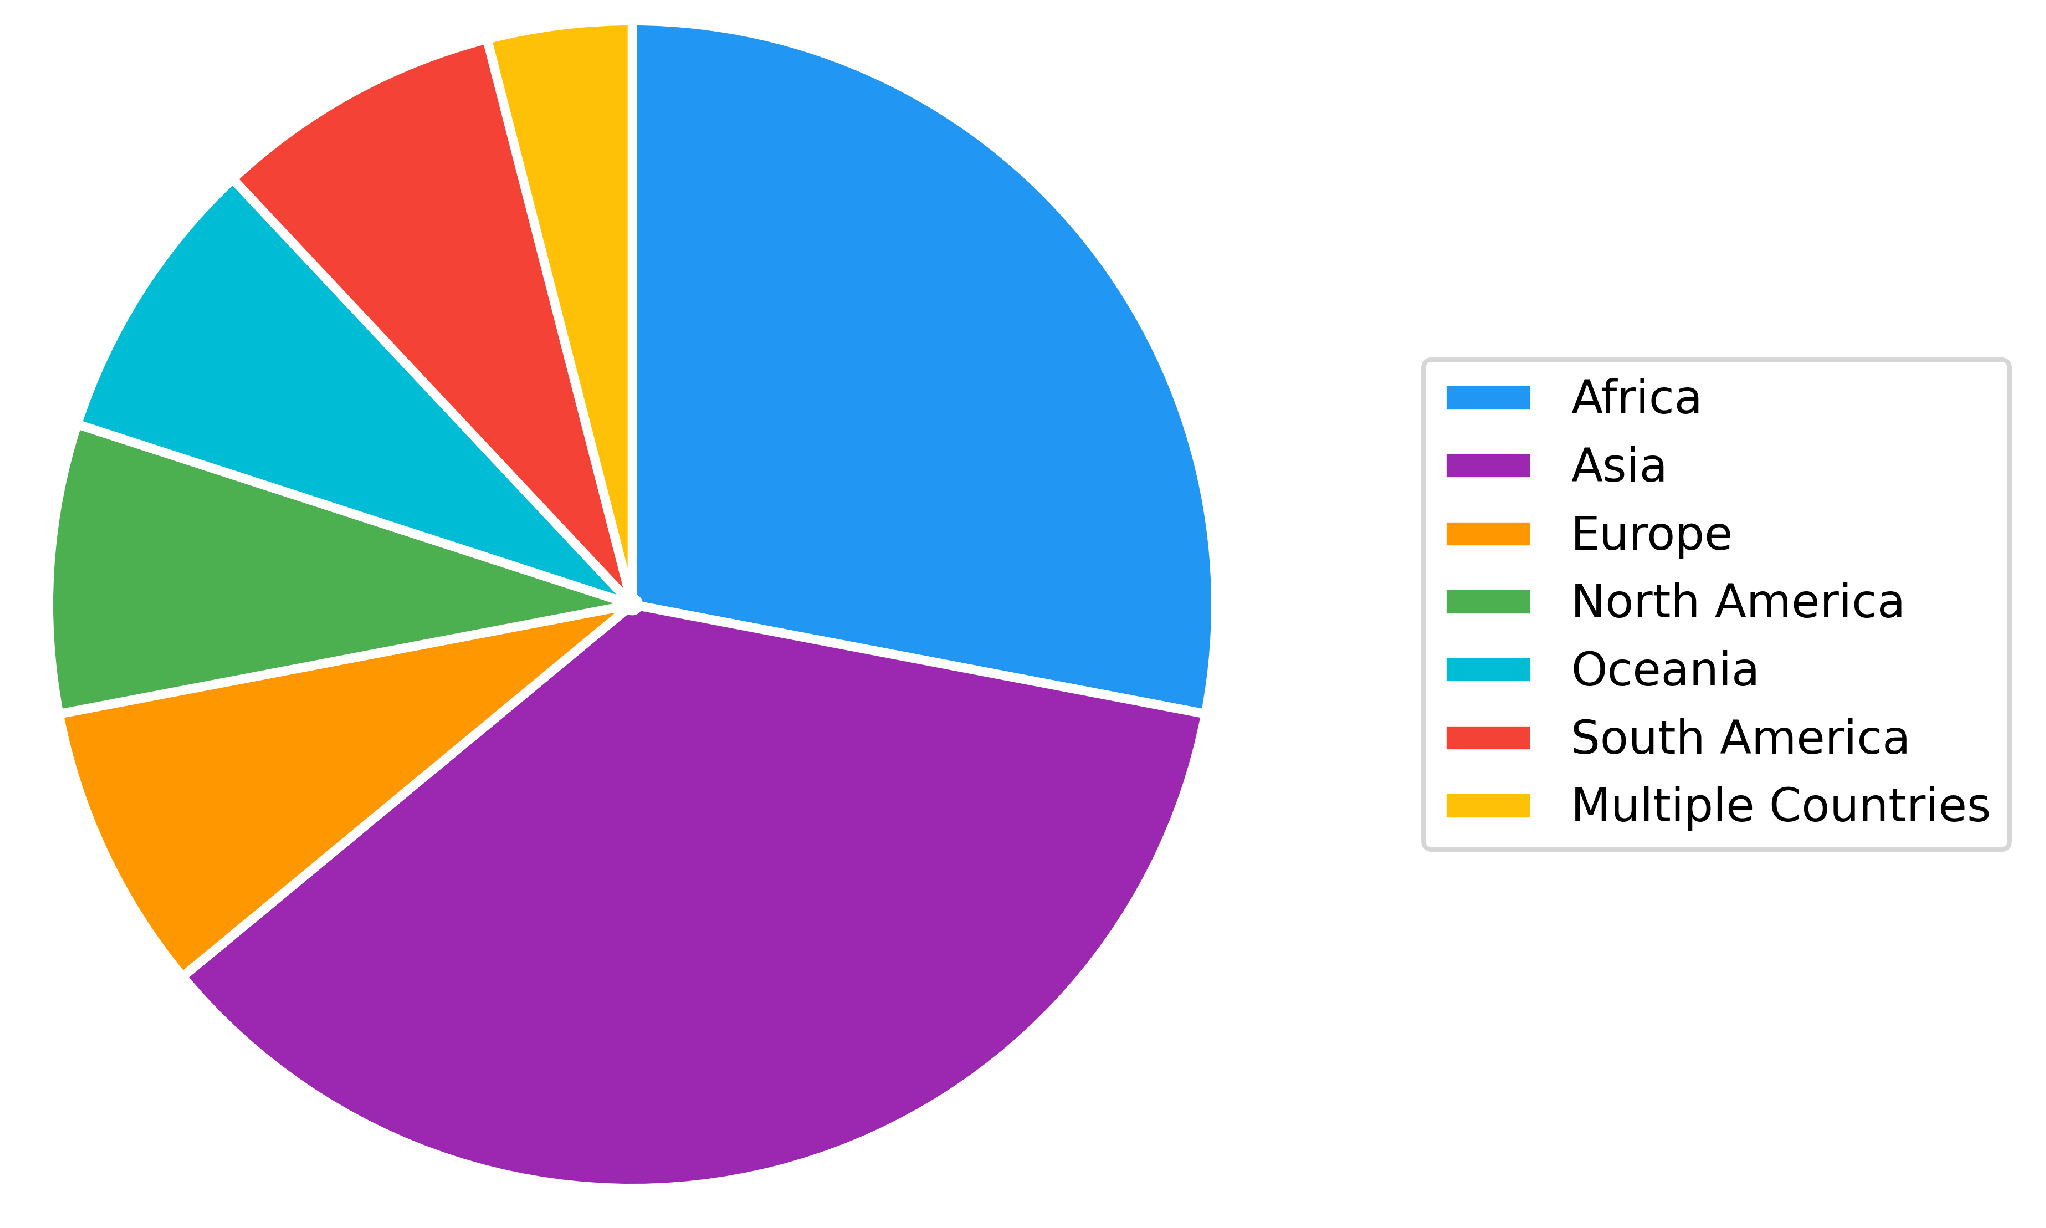
Figure 2.
CFT case studies frequency distributions by country.
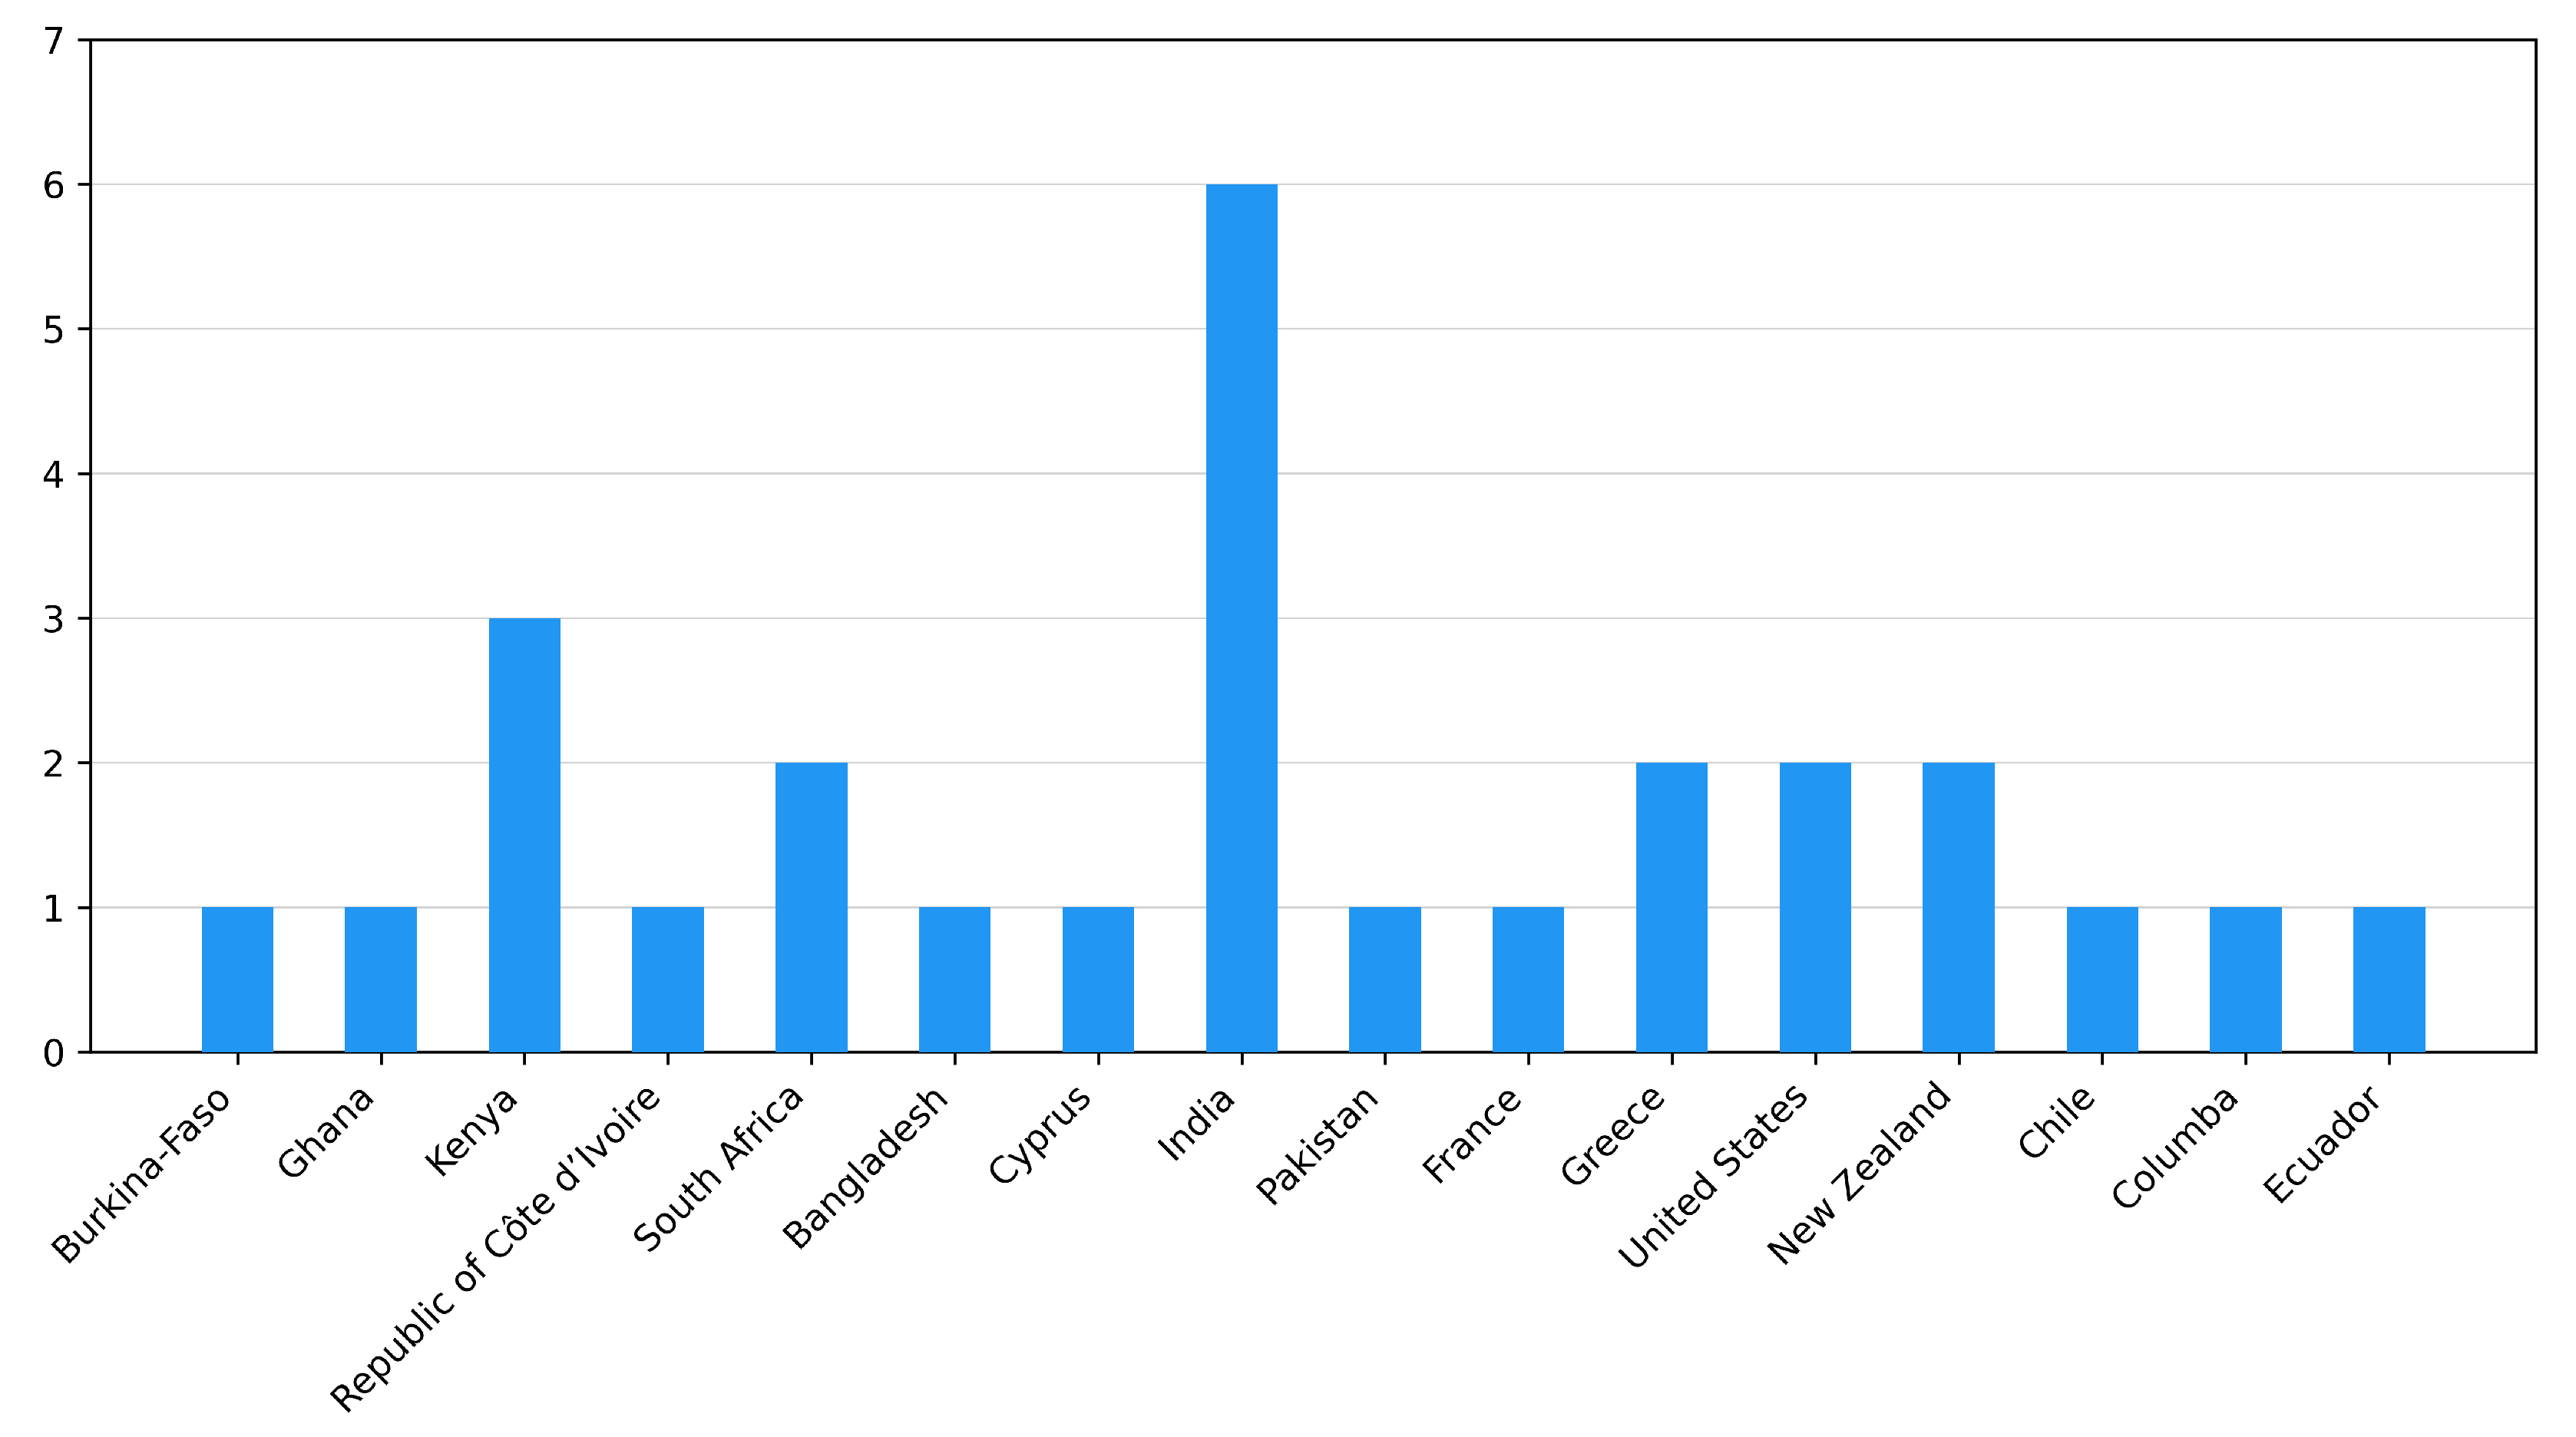
Figure 3.
The ratio of primarily crop and primarily livestock based CFT case studies.
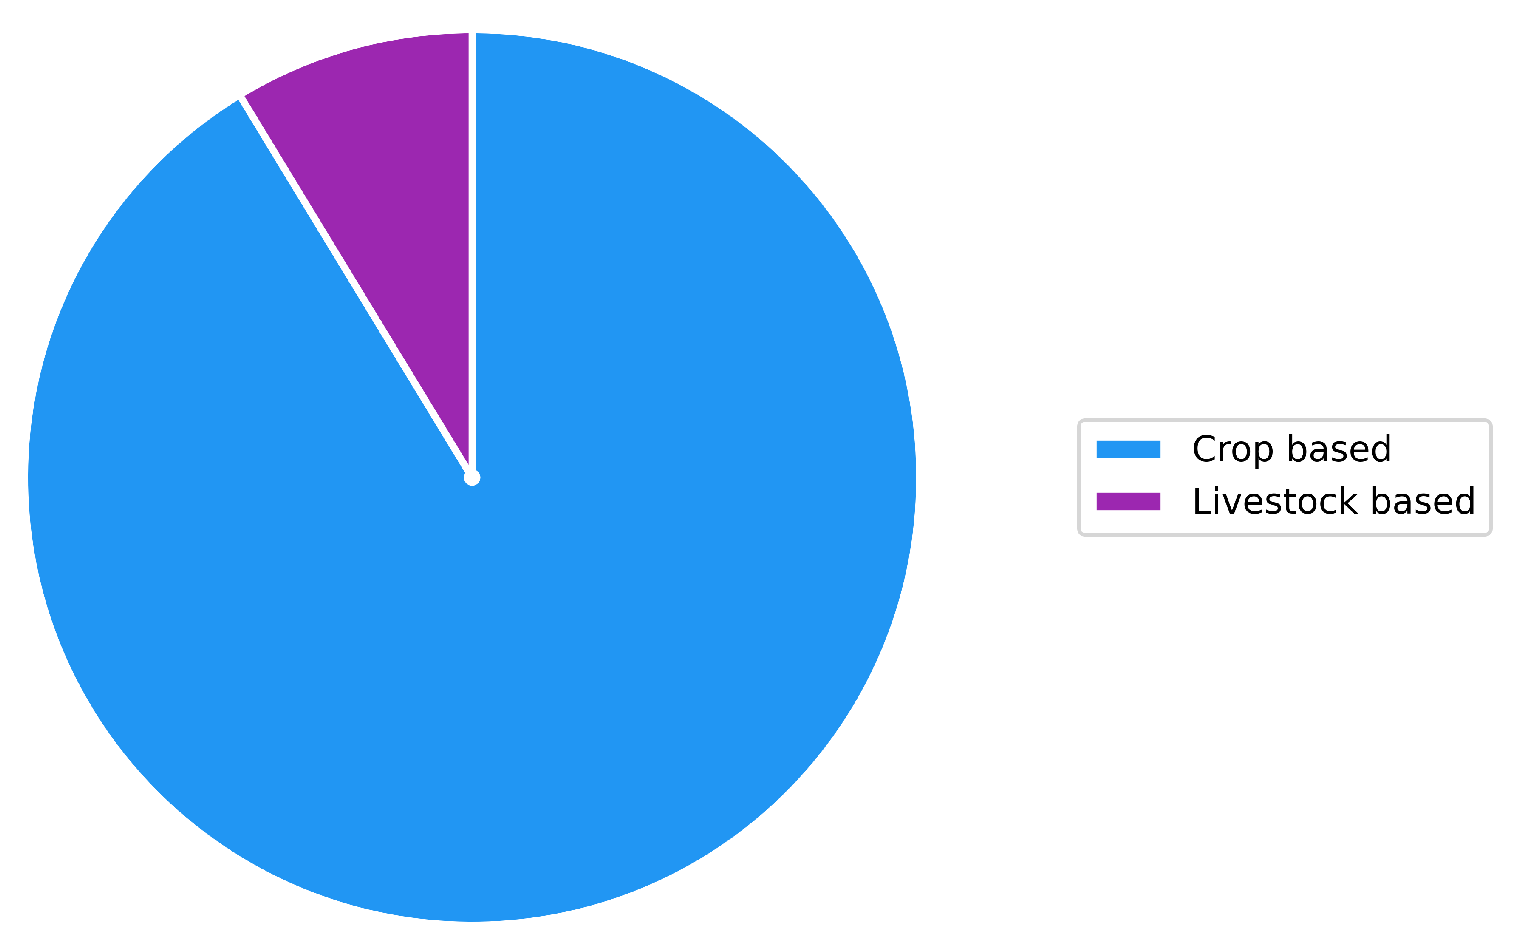
Figure 4.
Types of CFT based tool used in case studies.
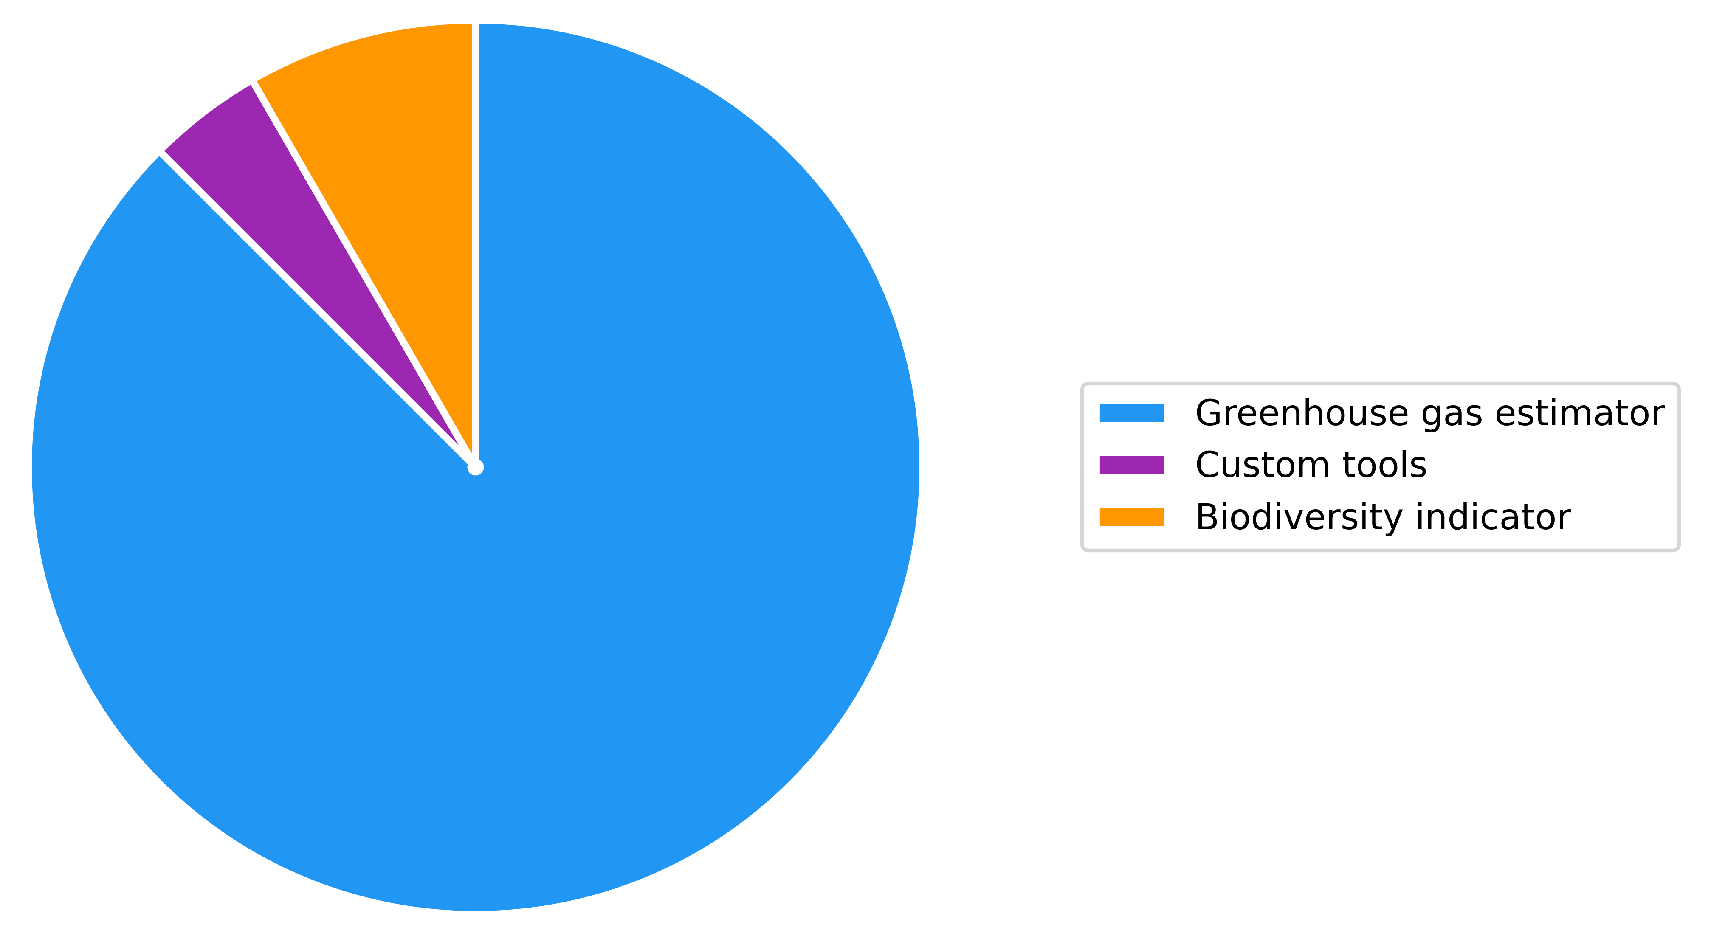
Figure 5.
Different types of farms (according to bird types) in Atlantic Canada represented by the poultry survey respondents.
Figure 5.
Different types of farms (according to bird types) in Atlantic Canada represented by the poultry survey respondents.
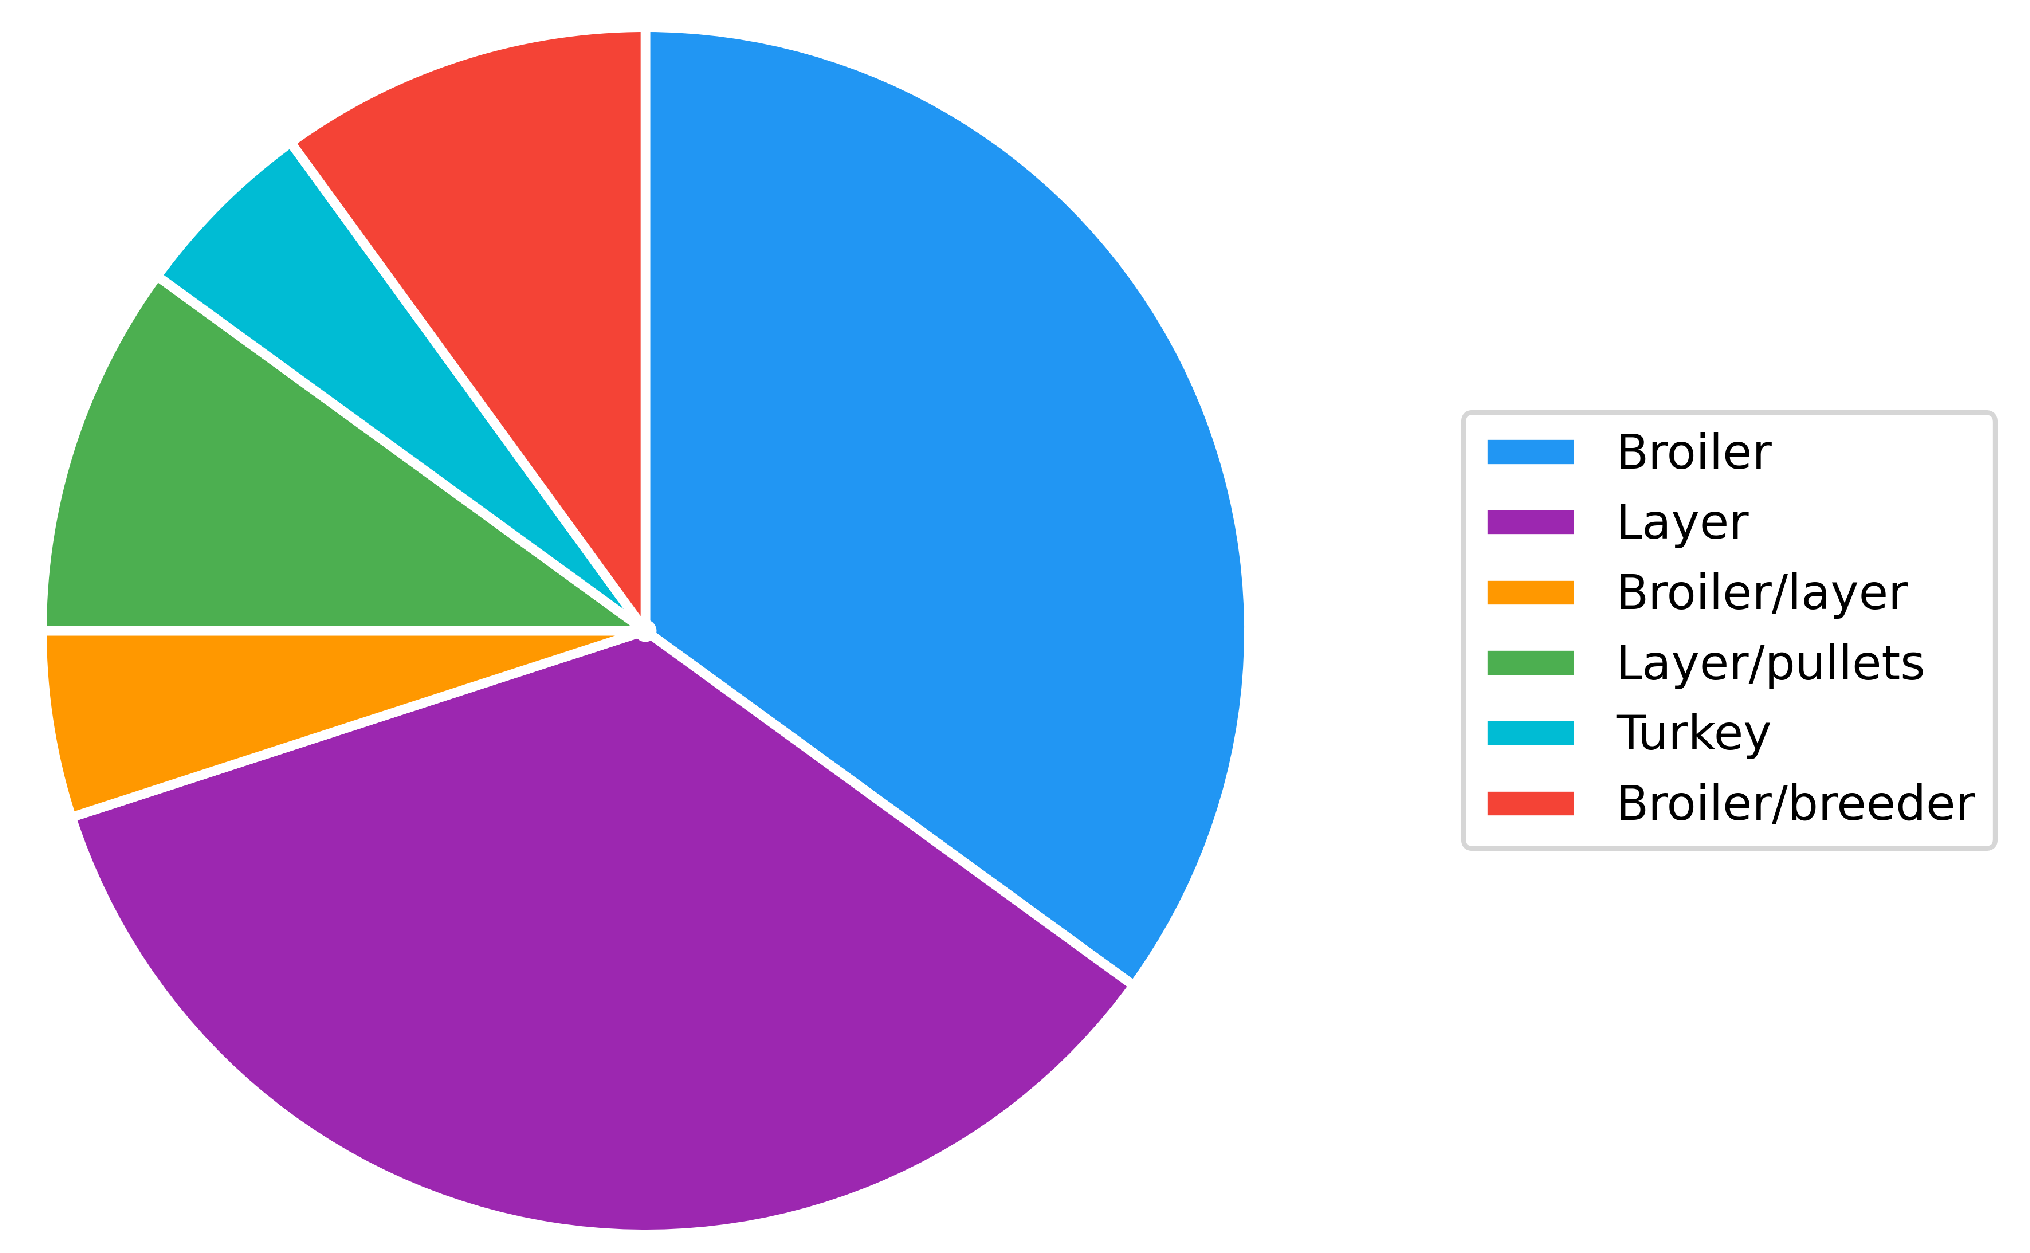
Figure 6.
Types of water sources on poultry farms in Atlantic Canada from our survey responses.
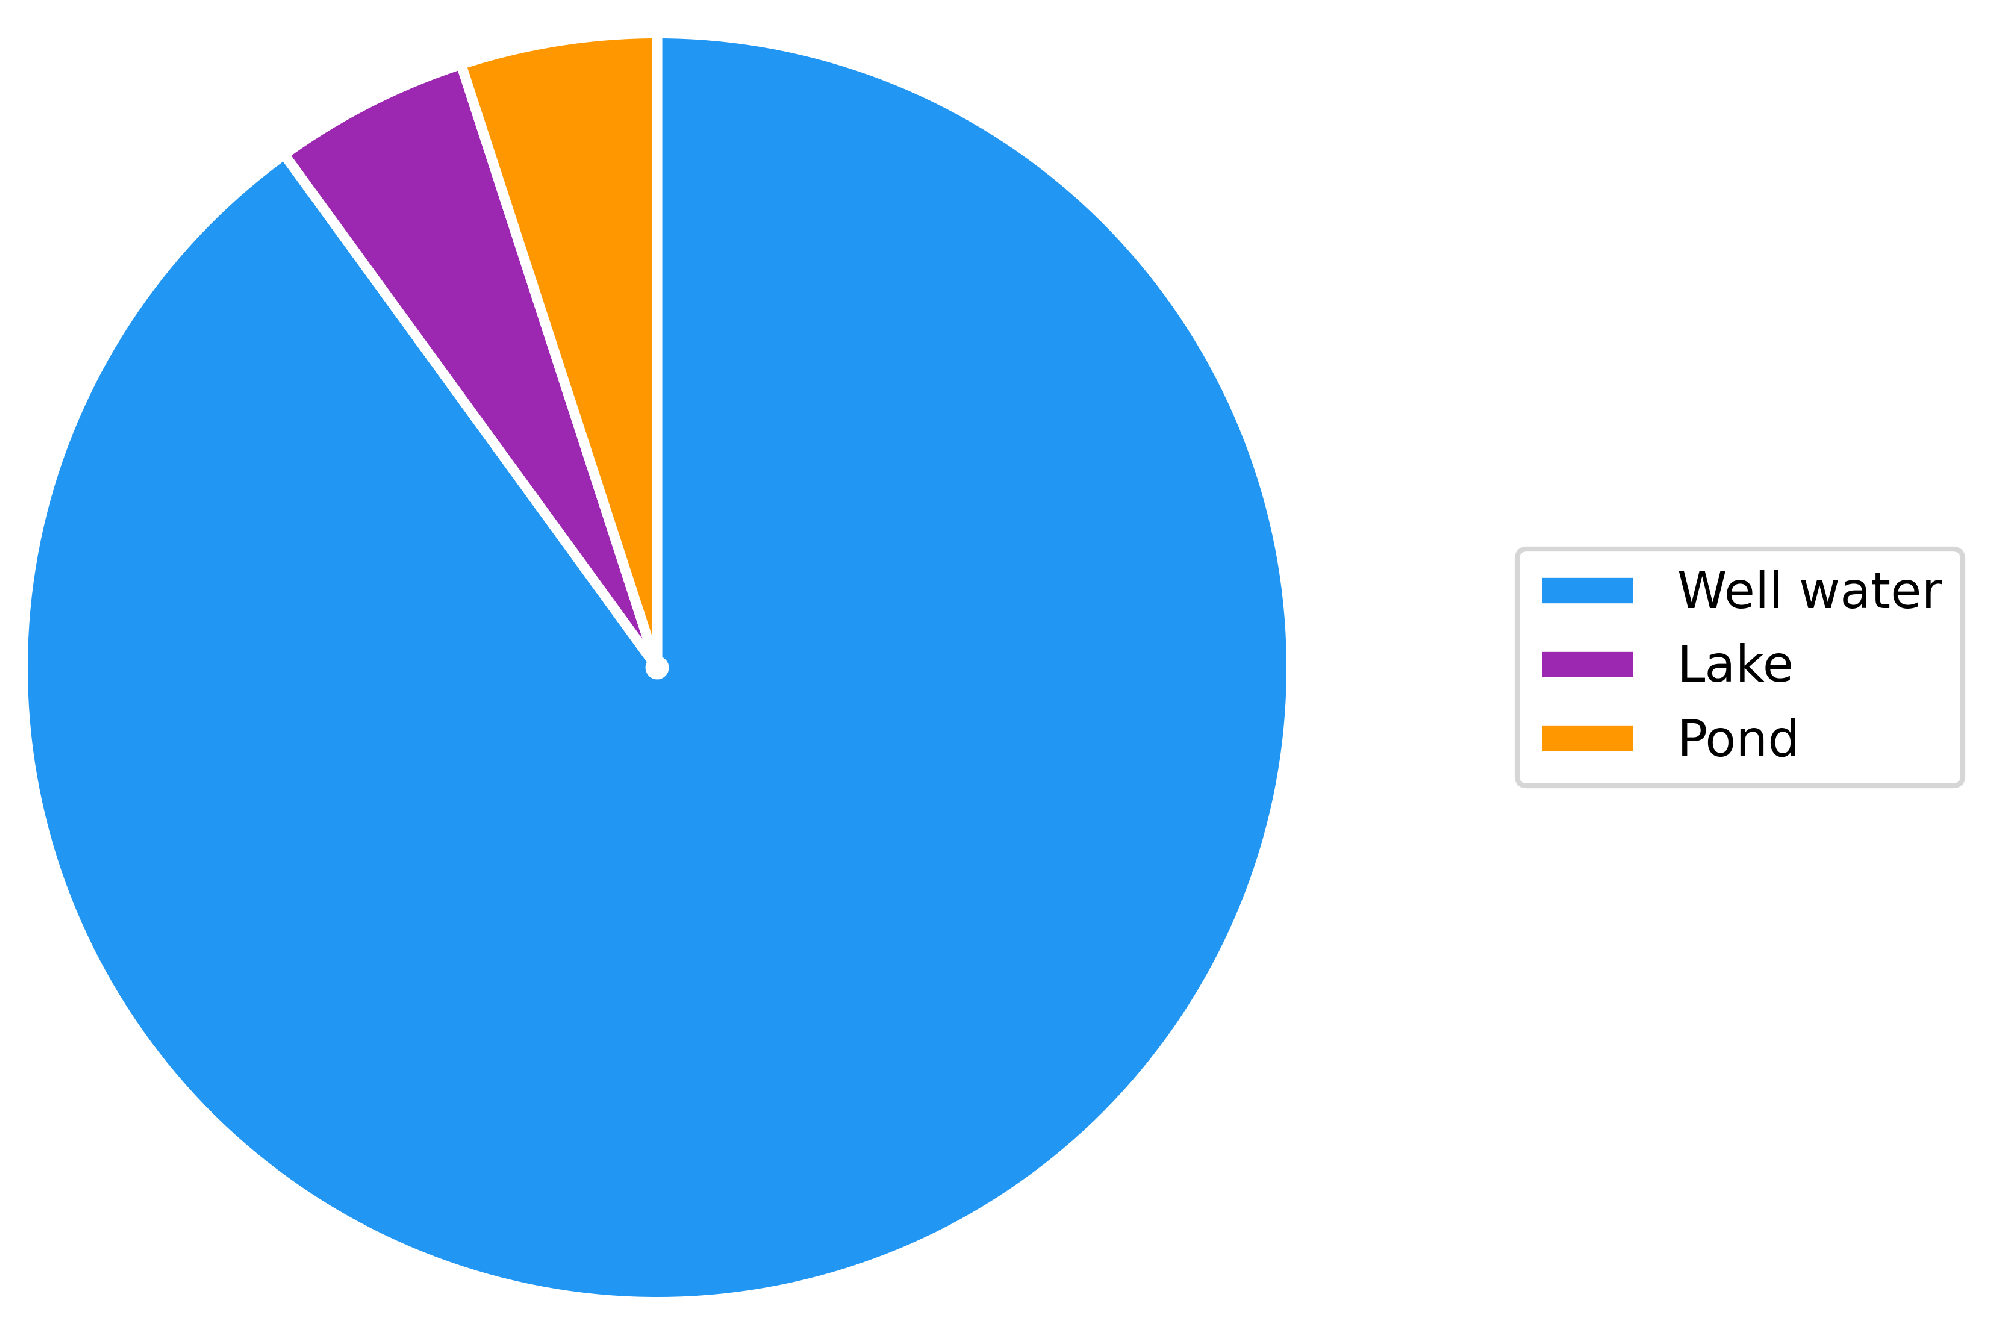
Figure 7.
Various types of manure management systems currently in use on poultry farms in Atlantic Canada from the survey responses.
Figure 7.
Various types of manure management systems currently in use on poultry farms in Atlantic Canada from the survey responses.
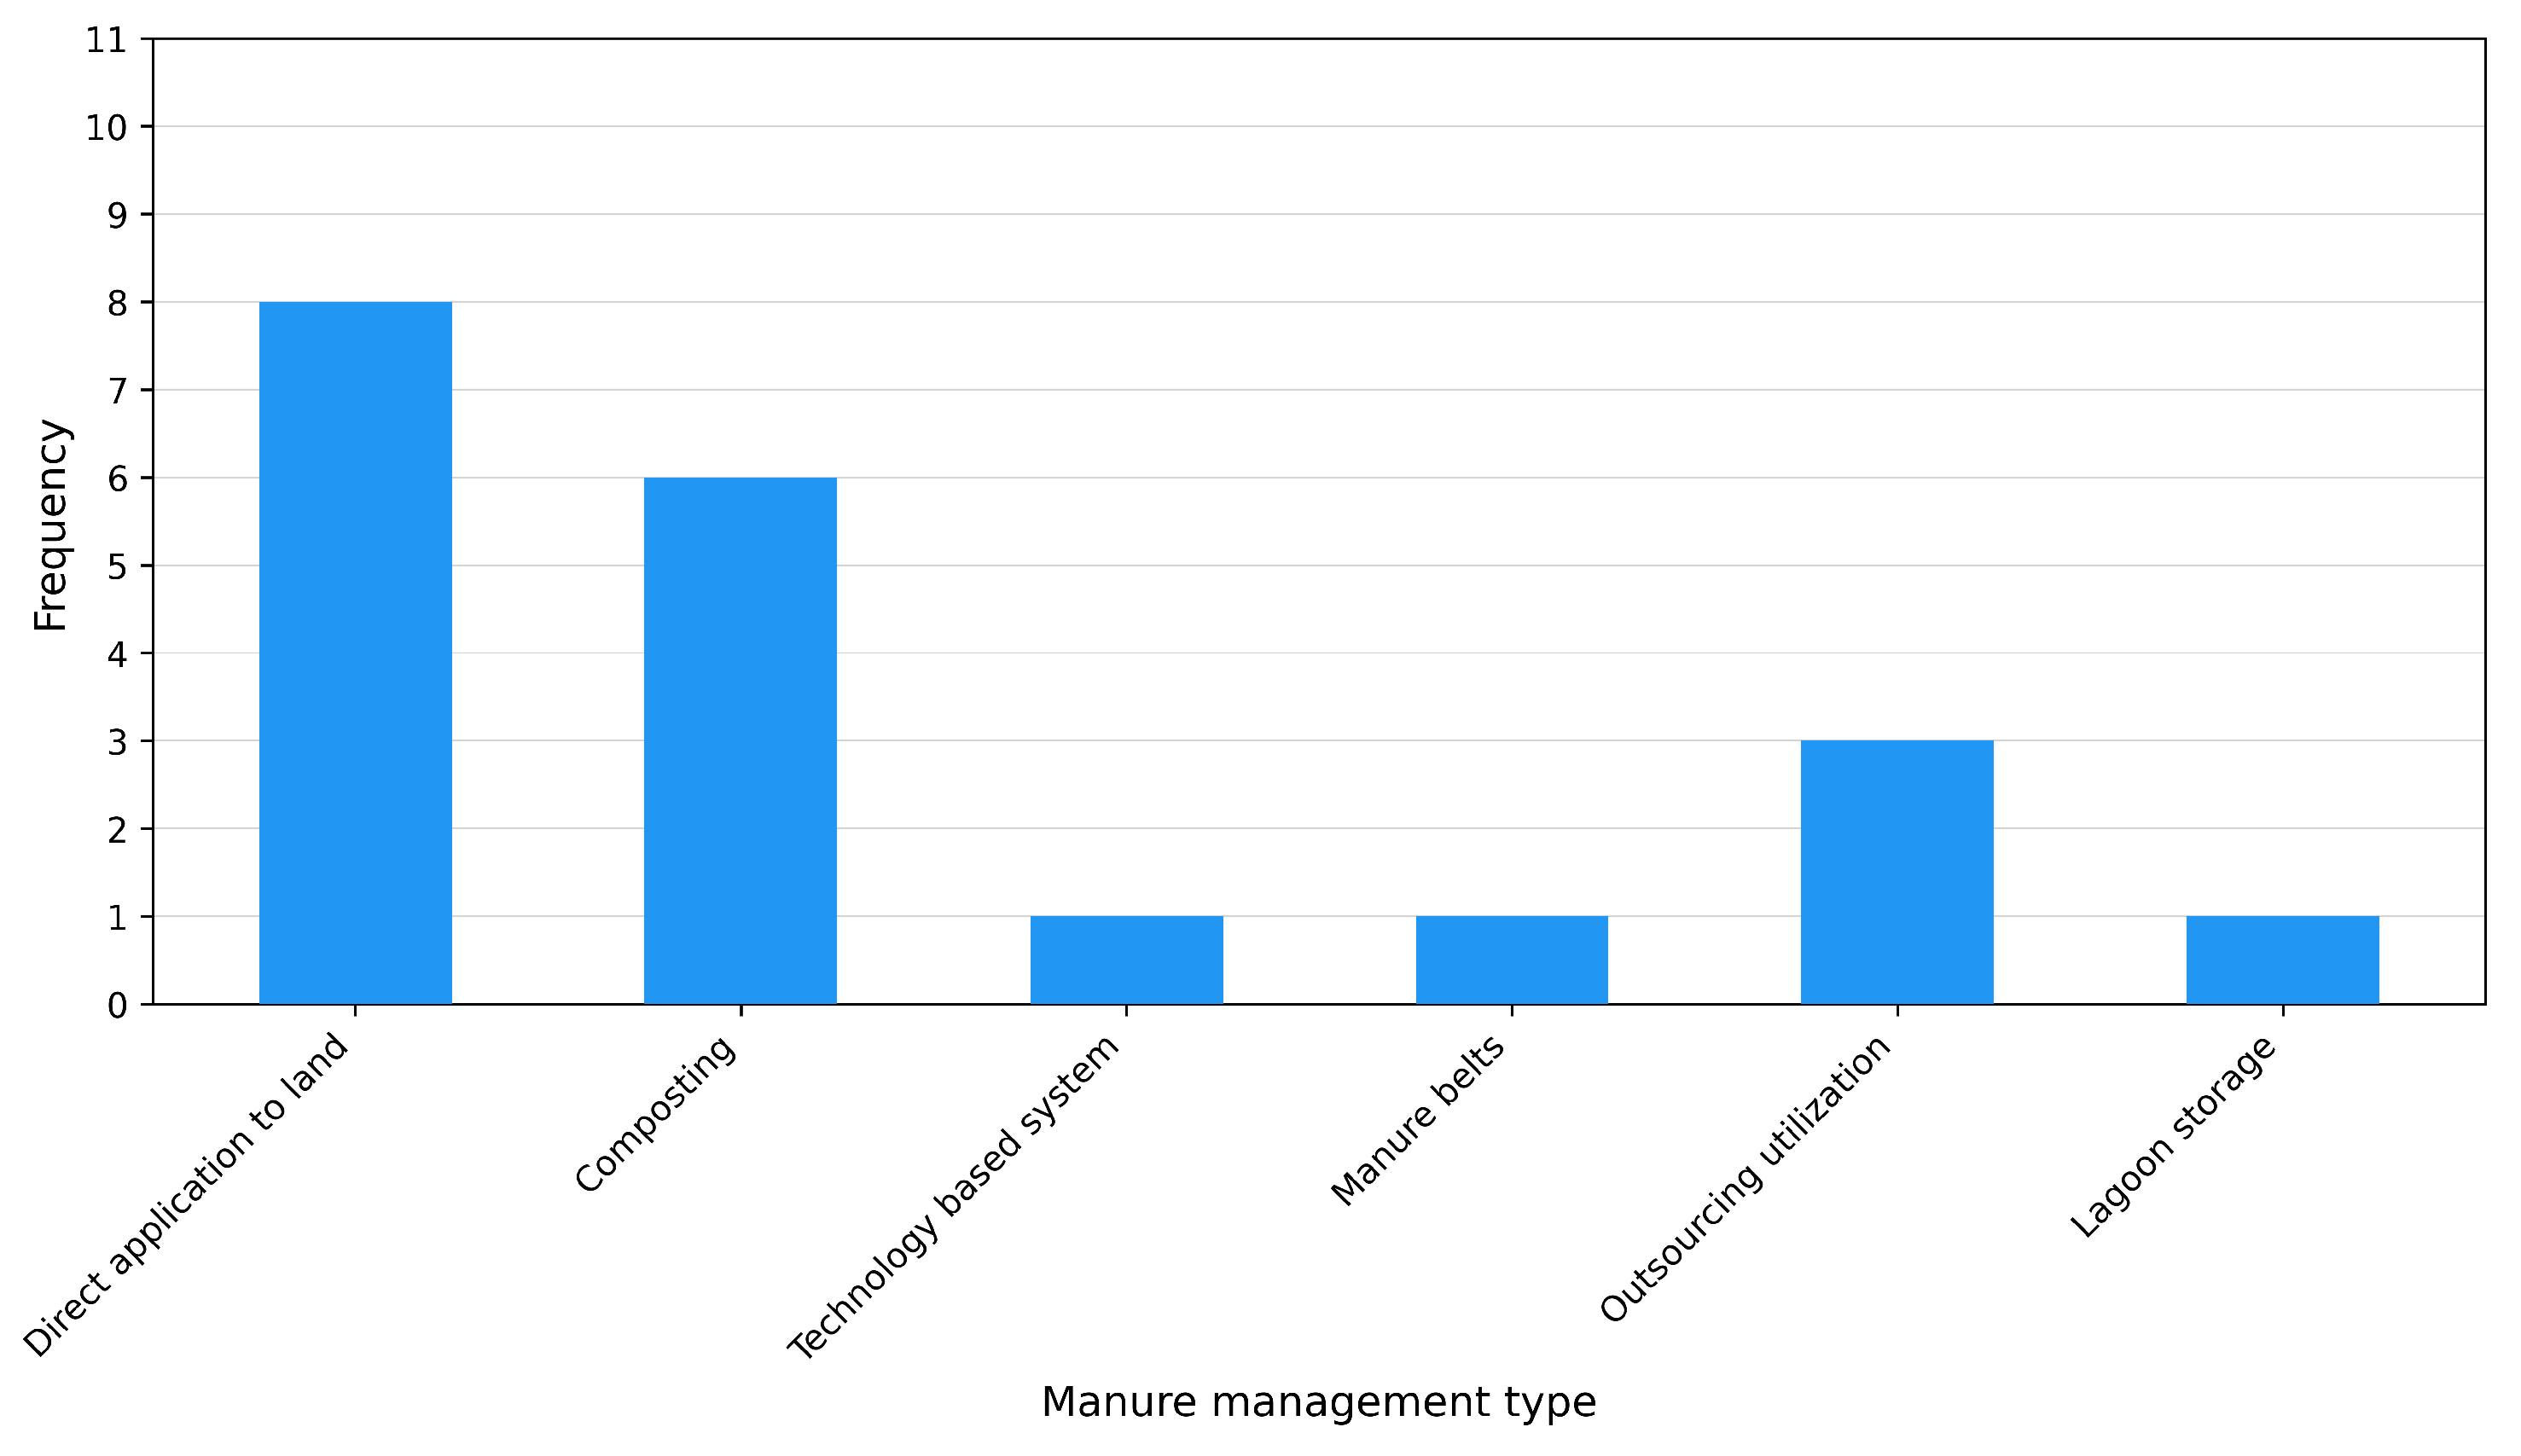
Figure 8.
Proportion of poultry farmers from the survey responses reporting active monitoring of their greenhouse gas emissions versus those not engaged in tracking.
Figure 8.
Proportion of poultry farmers from the survey responses reporting active monitoring of their greenhouse gas emissions versus those not engaged in tracking.
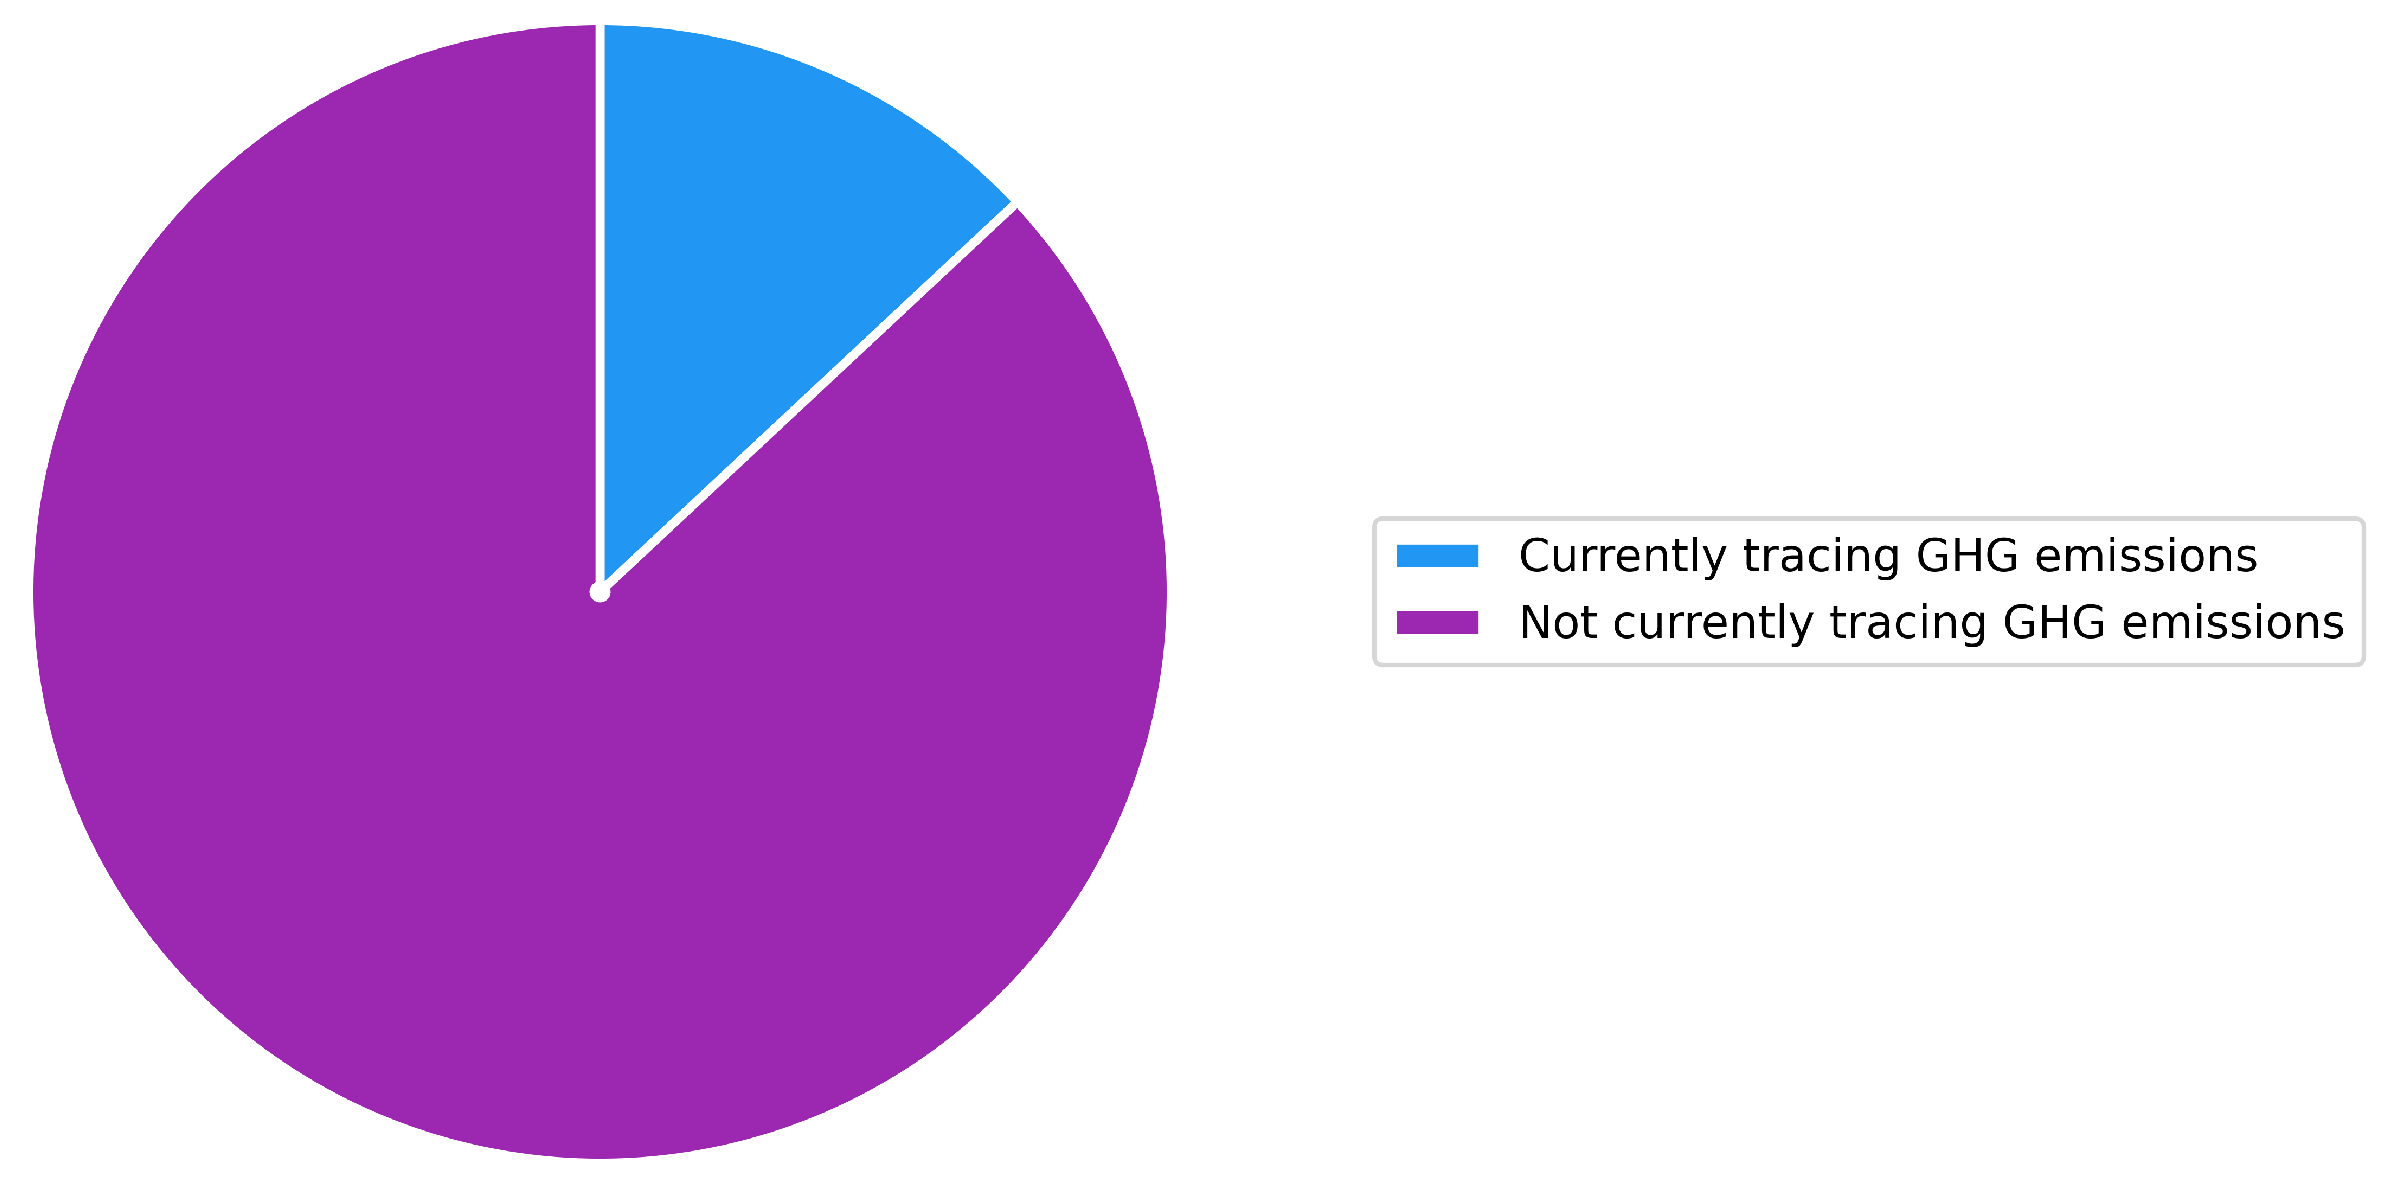
Figure 9.
Distribution of poultry farmer responses from our survey regarding completion of an energy audit in Atlantic Canada.
Figure 9.
Distribution of poultry farmer responses from our survey regarding completion of an energy audit in Atlantic Canada.
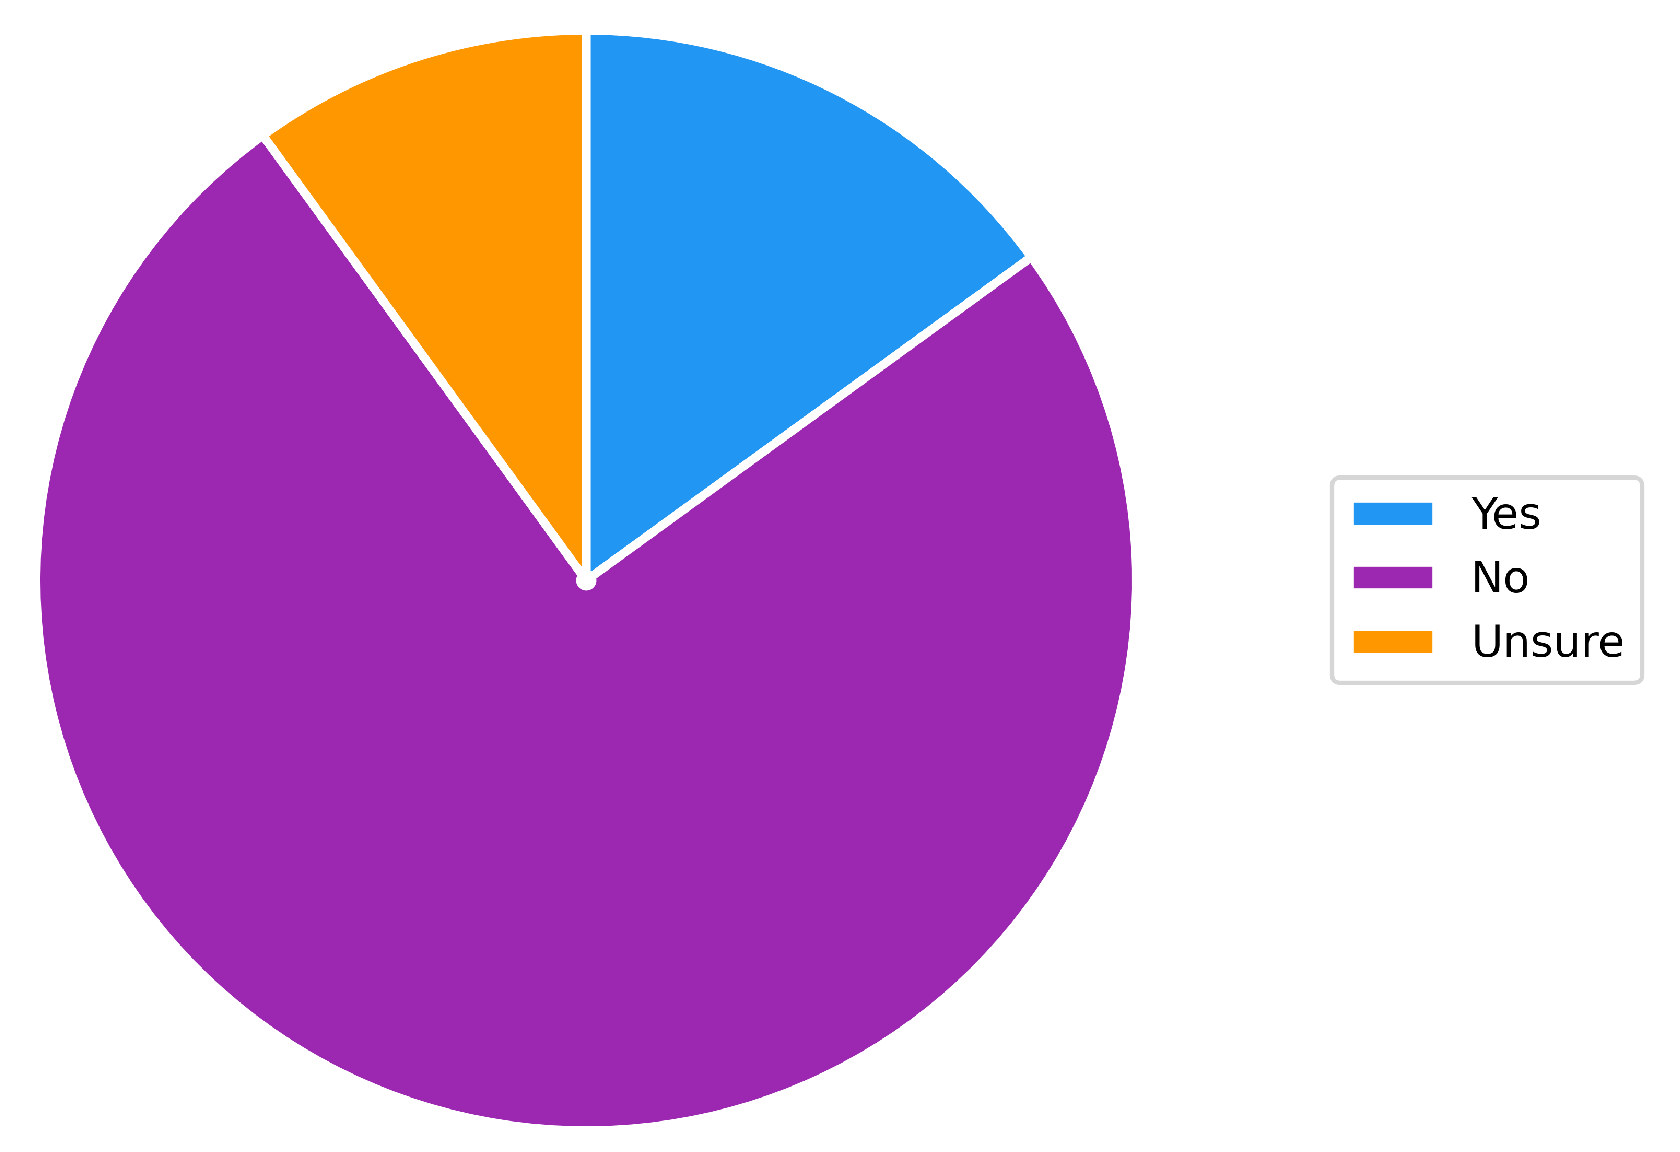
Figure 10.
Farmers’ ratings from both surveys on the importance of sustainability in farming operations for poultry and dairy farms in Atlantic Canada.
Figure 10.
Farmers’ ratings from both surveys on the importance of sustainability in farming operations for poultry and dairy farms in Atlantic Canada.
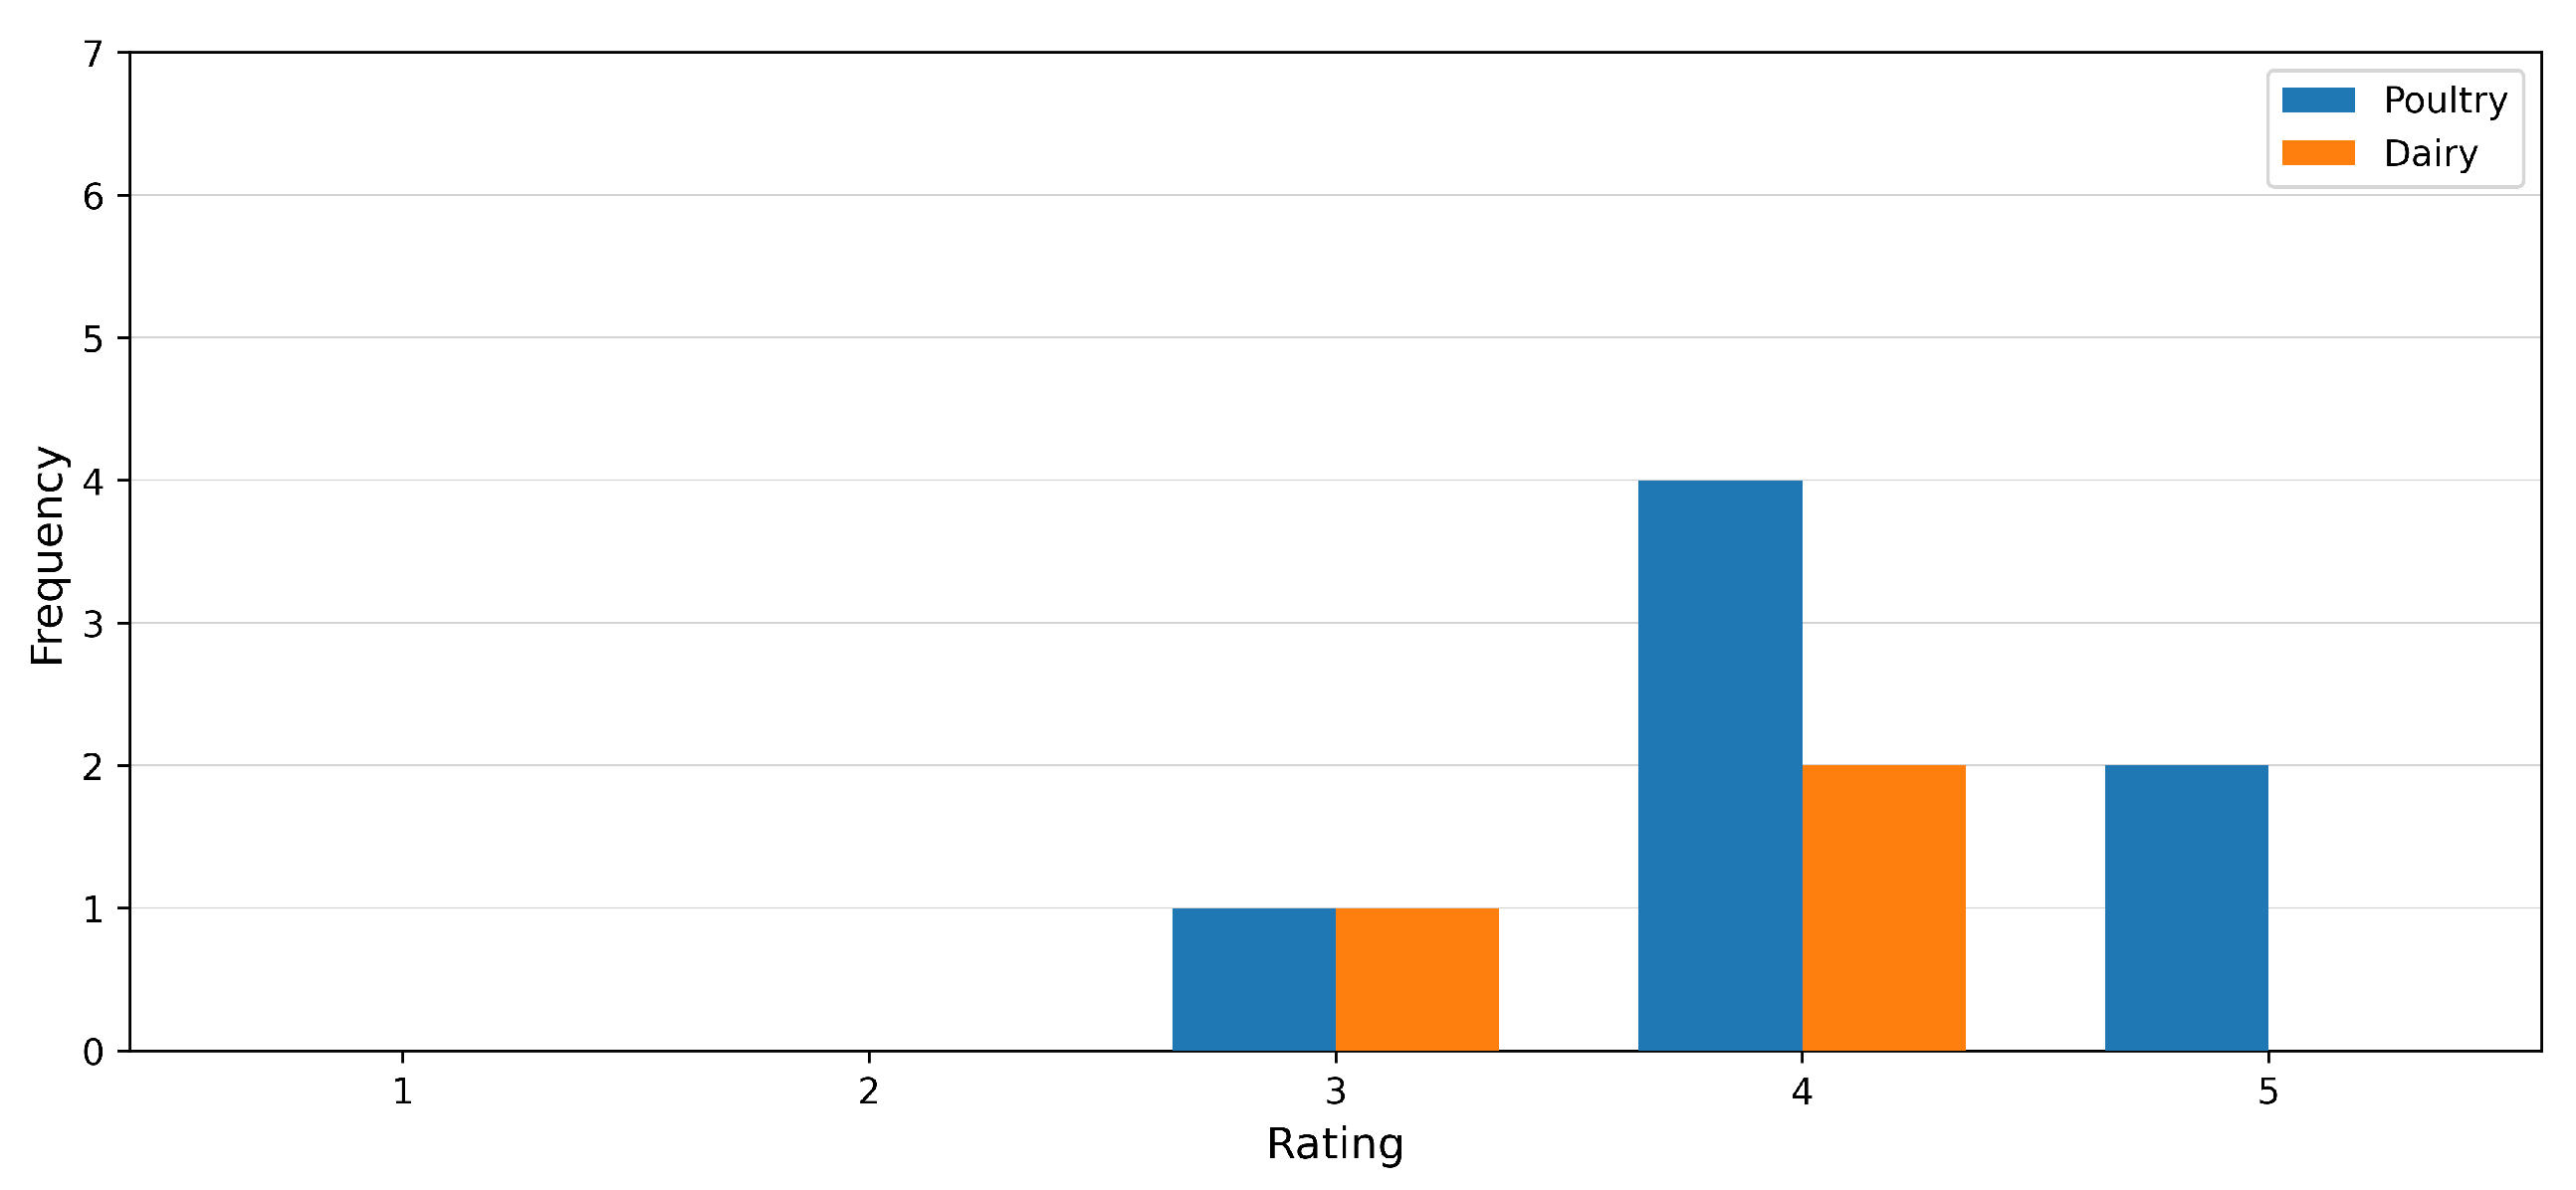
Figure 11.
Proportion of farmers in the survey responses expressing willingness versus unwillingness to engage in future collaborative activities for CFT adoption in Atlantic Canadian agriculture.
Figure 11.
Proportion of farmers in the survey responses expressing willingness versus unwillingness to engage in future collaborative activities for CFT adoption in Atlantic Canadian agriculture.
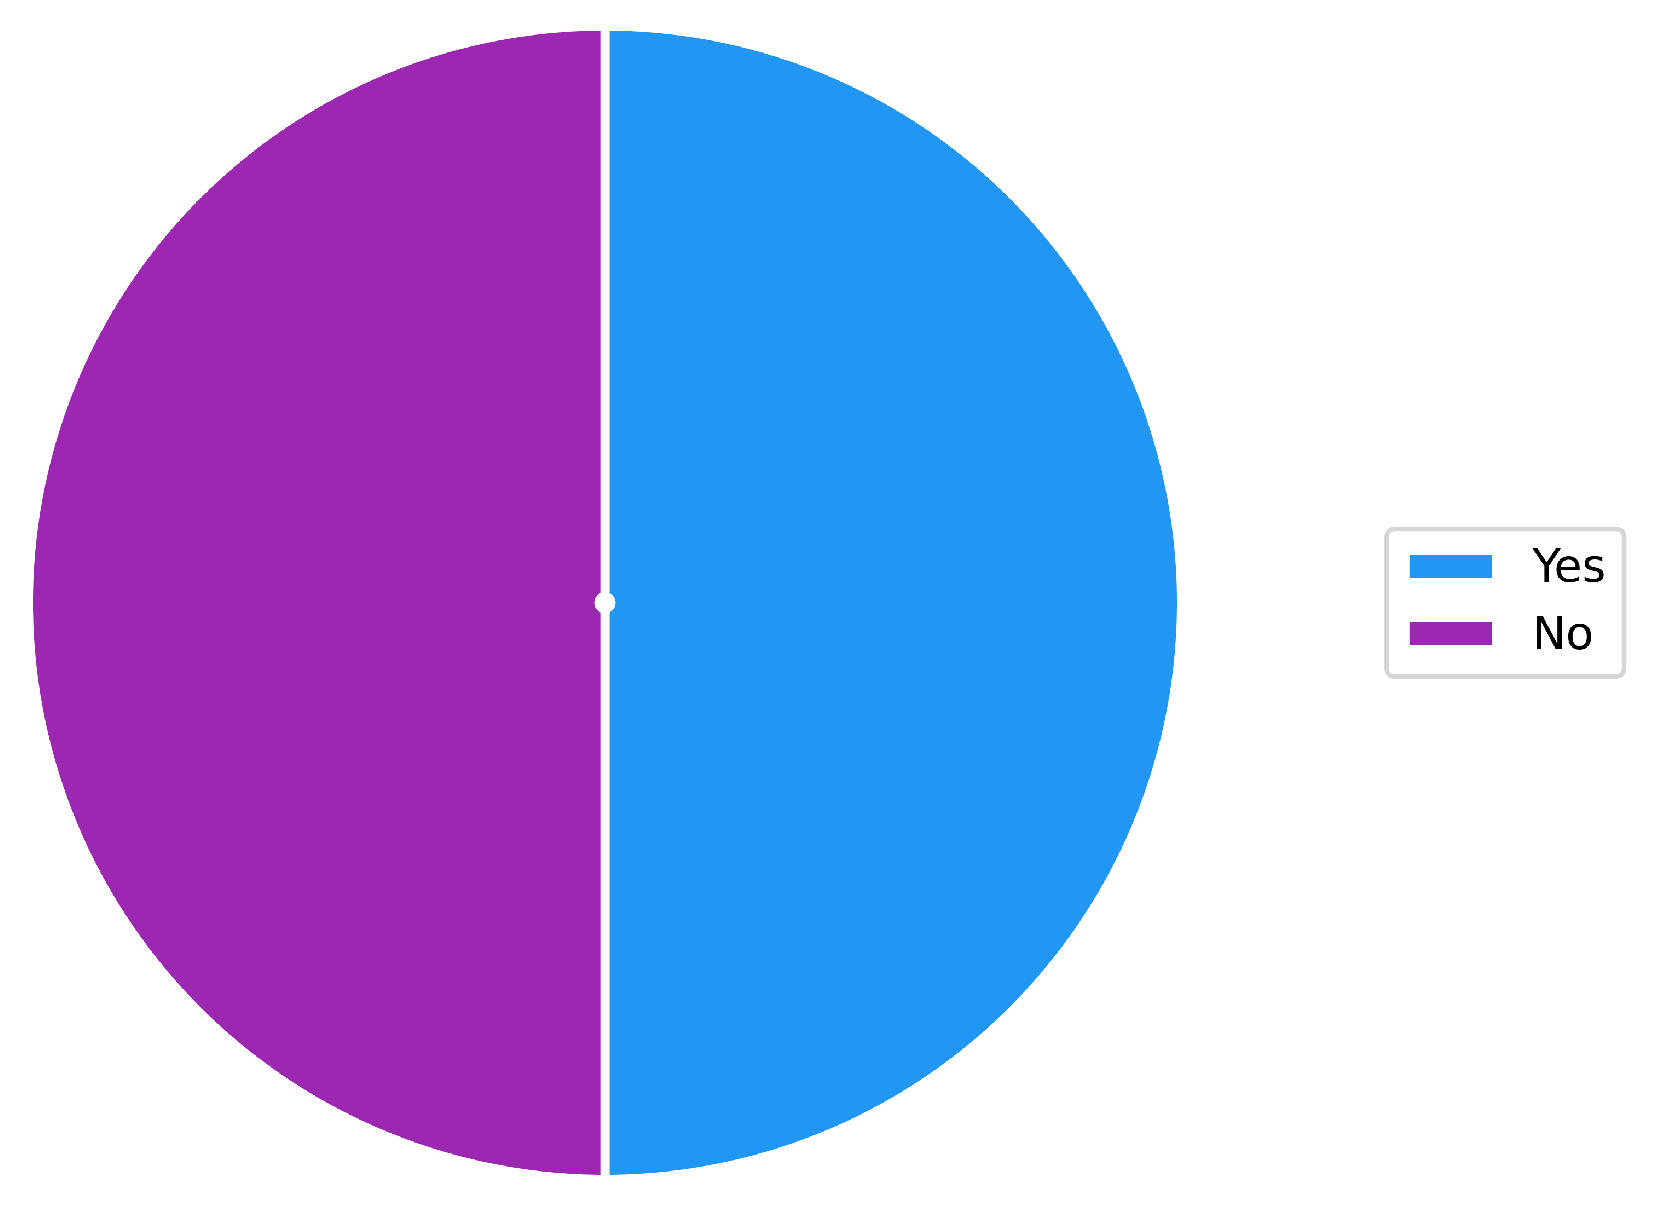
Figure 12.
Farmer-reported levels of interest from our survey responses, on a five-point scale, in adopting any digital tools for monitoring farm emissions from both poultry and dairy farmers of Atlantic Canada.
Figure 12.
Farmer-reported levels of interest from our survey responses, on a five-point scale, in adopting any digital tools for monitoring farm emissions from both poultry and dairy farmers of Atlantic Canada.
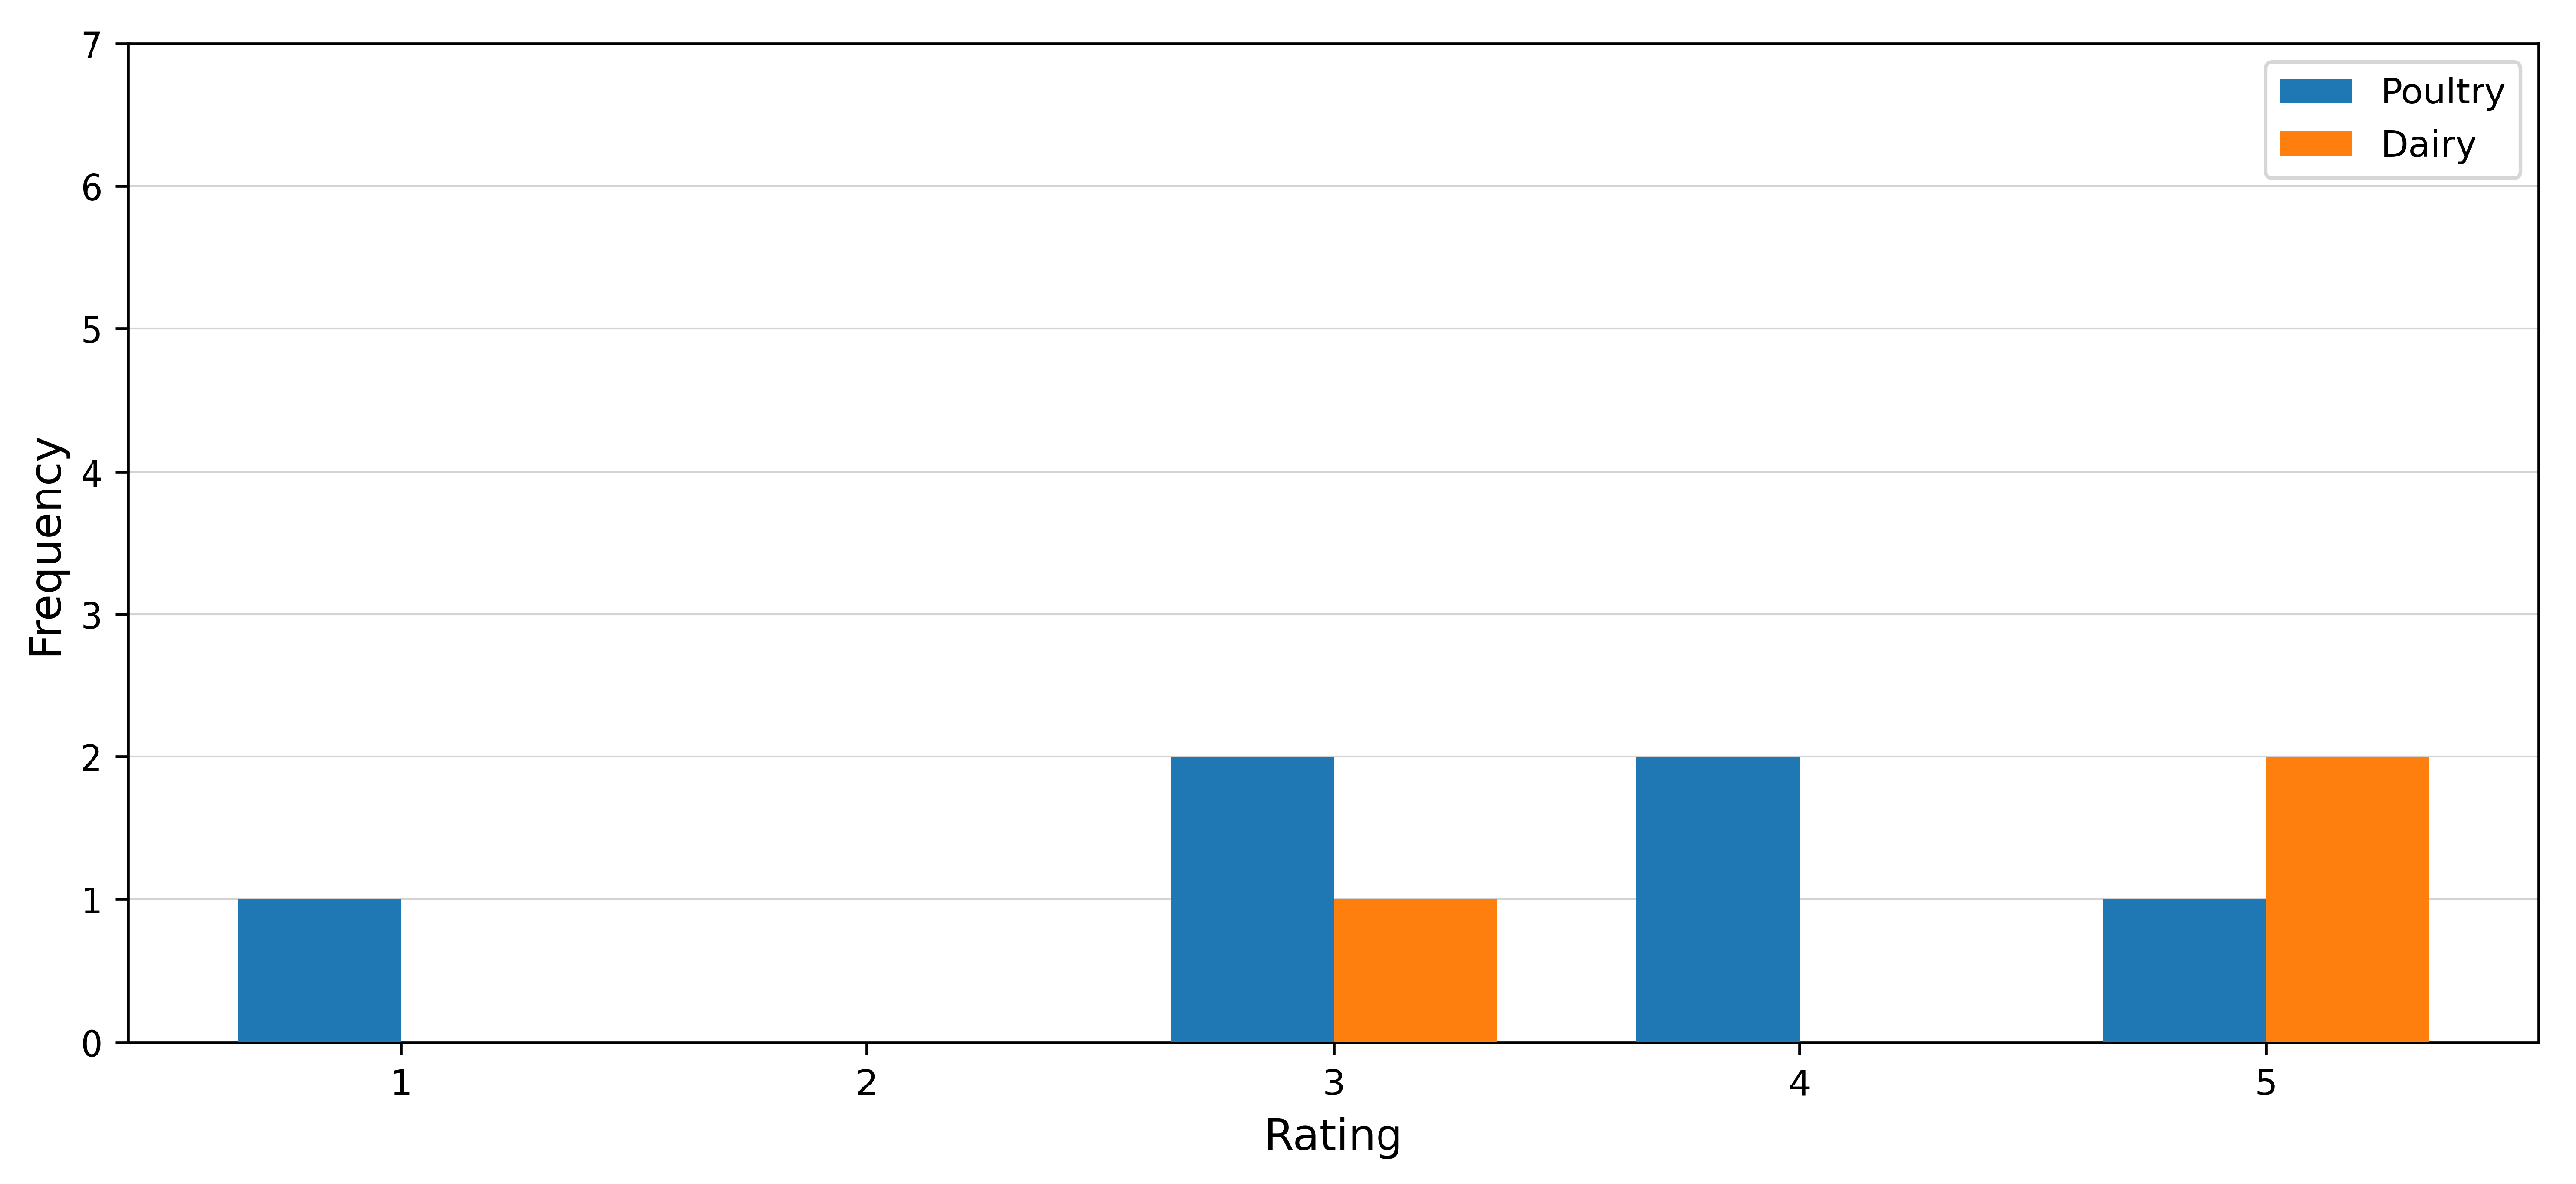
Figure 13.
Distribution of main barriers to adopting the Cool Farm Tool, as reported by surveyed farmers in Atlantic Canada.
Figure 13.
Distribution of main barriers to adopting the Cool Farm Tool, as reported by surveyed farmers in Atlantic Canada.
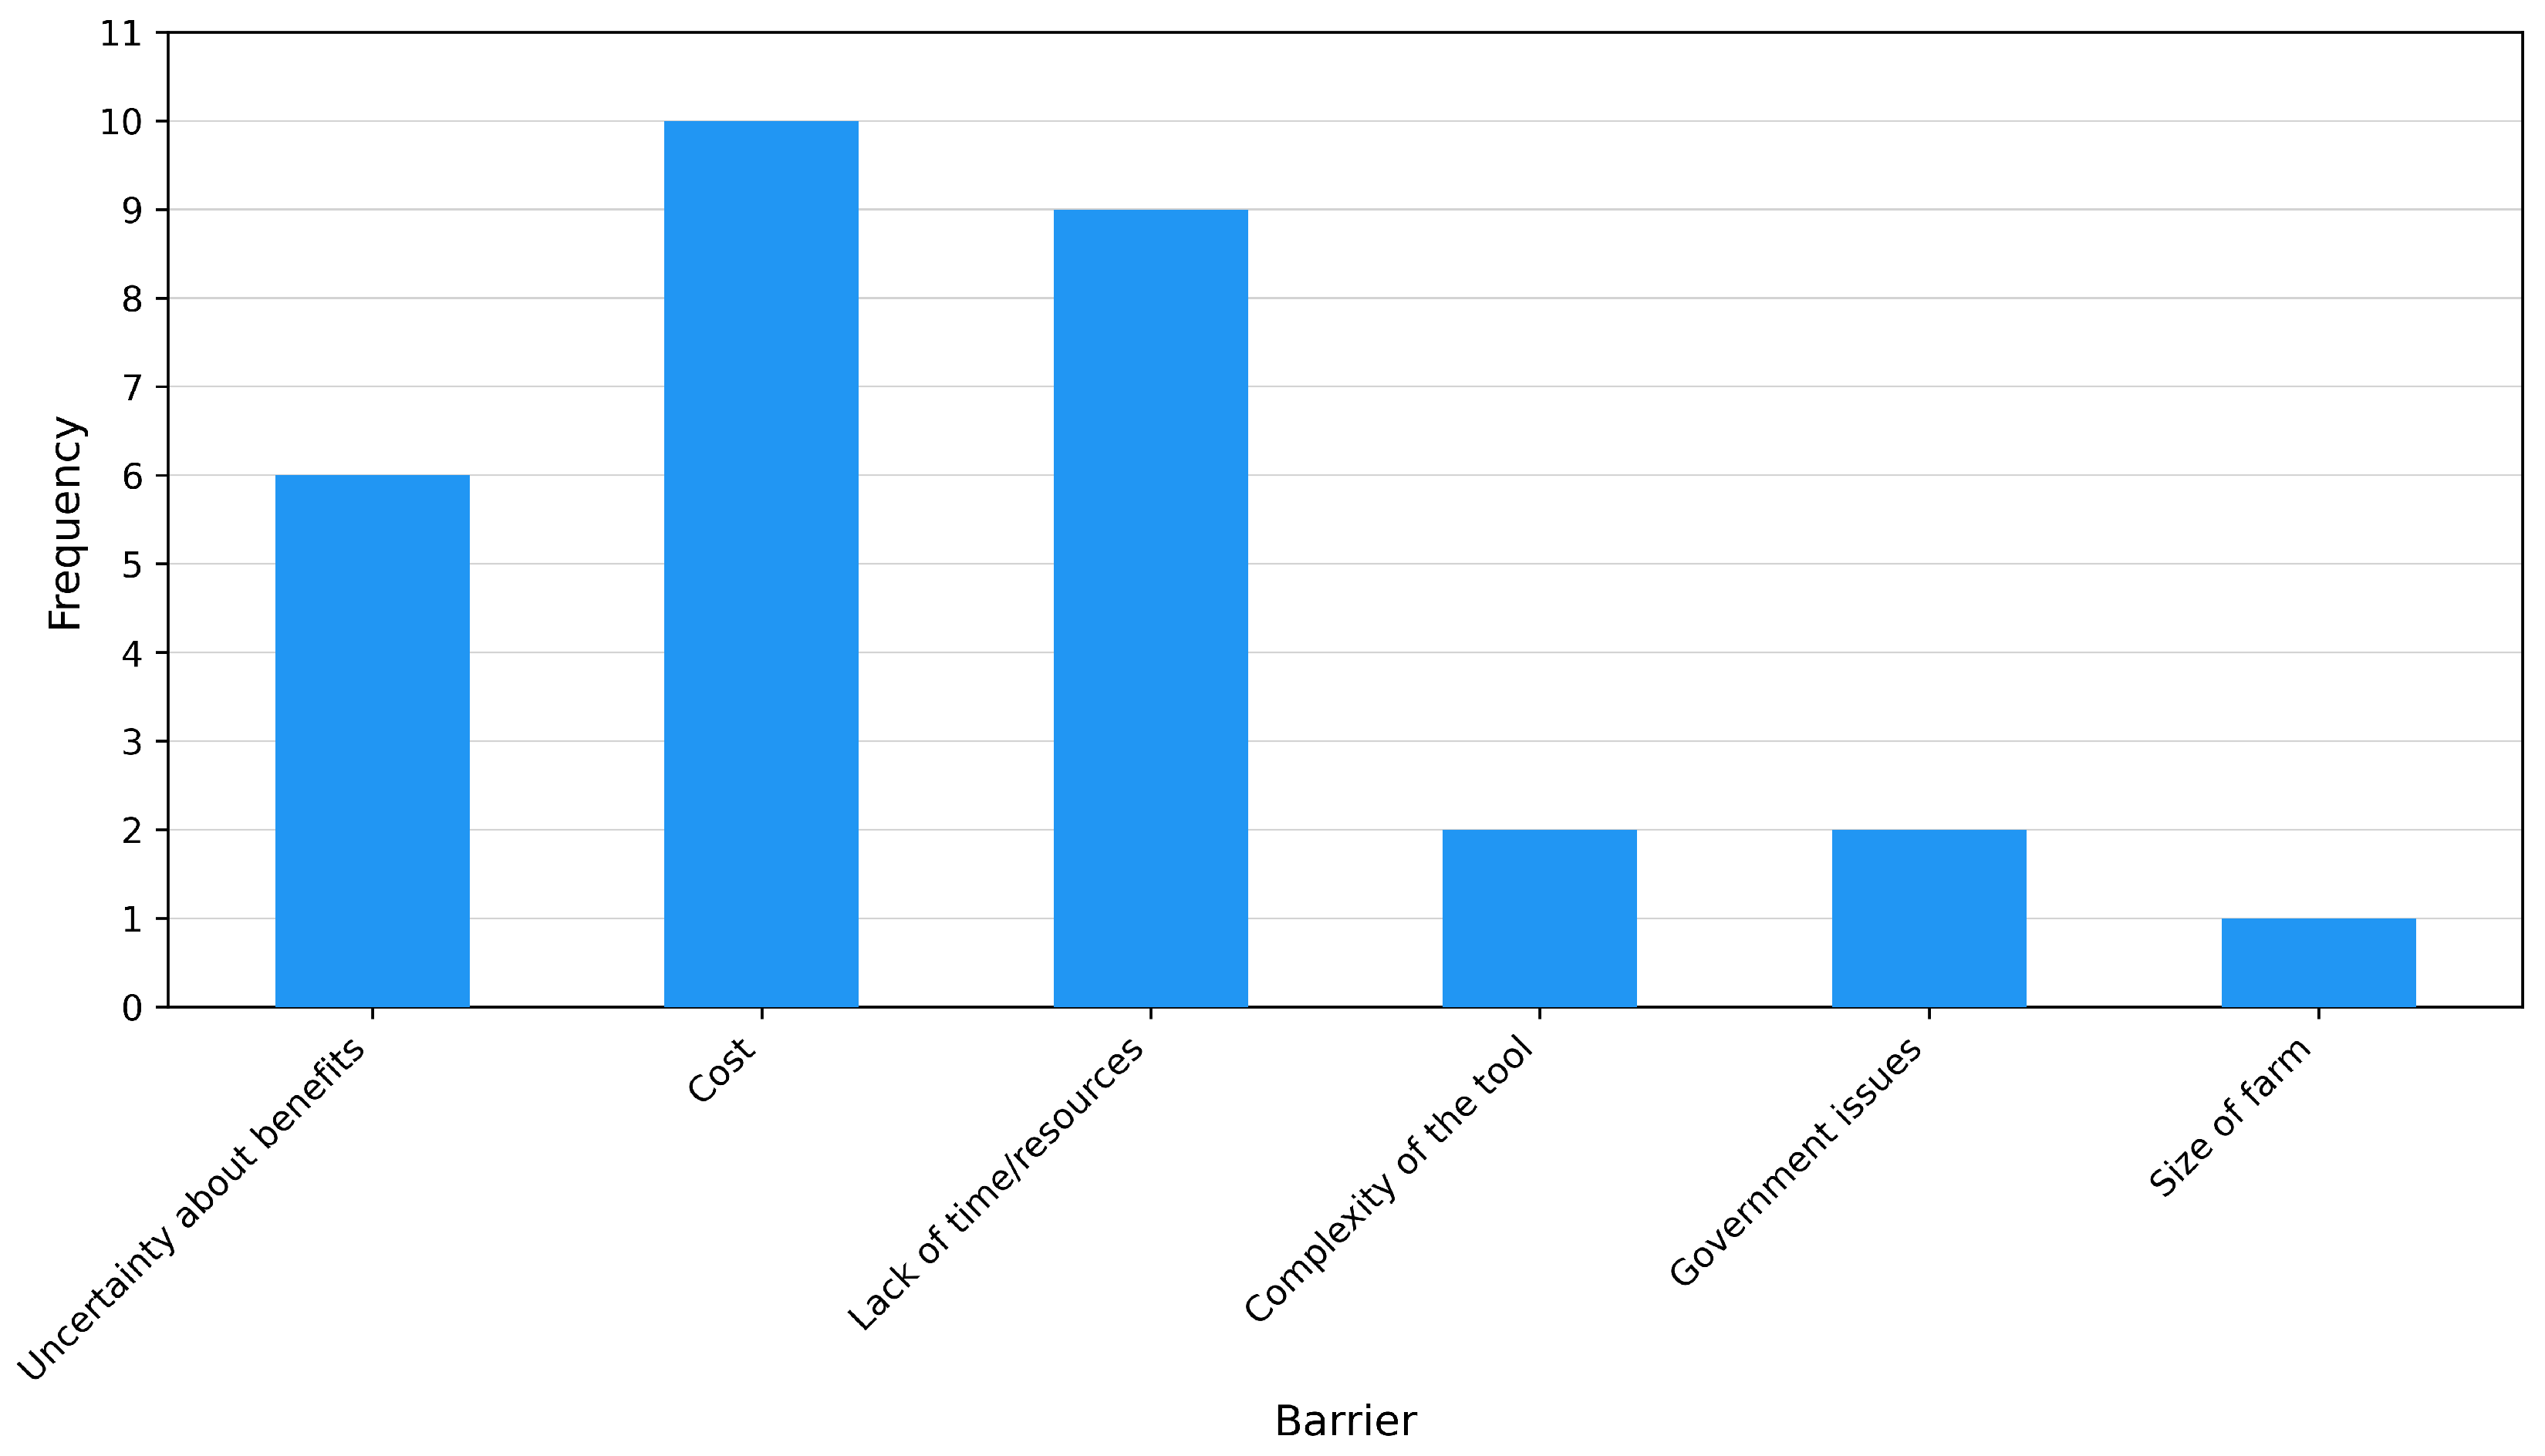

Table 1.
GHG calculation tools from various countries and different farm types.
| Name | Country Mentioned |
Farm Type |
Literature Mentions |
|---|---|---|---|
| Farming Enterprise Greenhouse Gas Emissions Calculator [13] | - | - | [7] |
| GLEAMi [14] | - | - | [8,9,15] |
| AgRECalc [16] | UK | - | [8,17,18] |
| Farm Carbon Calculator [19] | UK | - | [7,8,17,18] |
| Greenhouse Accounting Frameworks [20] | Australia | - | [8] |
| FarmGAS [21] | Australia | - | [8] |
| COMET-FARM [22] | USA | - | [8,12,18] |
| Farm Carbon Footprint Calculator [23] | New Zealand | - | [8] |
| Holos [24] | Canada | - | [8,9,18] |
| DairyGEM [25] | USA | Dairy | [8] |
| Poultry Carbon Footprint Calculation Tool (PCFCT) [26] | USA | Poultry | [8] |
| FarmAC [27] | - | - | [9] |
| Overseer [28] | - | - | [9] |
| Carbon Navigator [29] | - | Dairy, Beef | [9] |
| Kriteriensystem Nachhaltige Landwirtschaft (KSNL) | - | - | [9] |
| Response-Inducing Sustainability Evaluation (RISE) [30] | - | - | [9,12] |
| Berechnungsstandard für einzelbetriebliche Klimabilanzen in der Landwirtschaft (BEK) |
- | - | [9] |
| DLG-Nachhaltigkeitsstandard | - | - | [9] |
| EX-ACT [31] | - | - | [9,15,17] |
| SAFA [10] | - | - | [12] |
| FSA [11] | - | - | [12] |
| SMART Farm Tool [32] | - | - | [12] |
| Dairy Farms + [33] | USA | Dairy | [12] |
| SENSE Tool [34] | - | - | [12] |
| OFoot [35] | - | - | [12] |
| Farm-to-Market [36] | - | - | [18] |
Table 2.
CFT in crops emission assessments by country and continent.
| Continent | Country | Main Crop(s) |
|---|---|---|
| Africa | Burkina Faso | Cotton |
| Kenya | Sorghum | |
| Republic of Côte d’Ivoire | Cacao | |
| South Africa | Peanut, Soybean, Sunflower | |
| Asia | Bangladesh | Potato |
| Cyprus | Vineyards | |
| India | Sugarcane, Maize, Wheat, Rice. Potato | |
| Europe | France | Vines |
| Greece | Tomato, Quinoa | |
| North America | United States | Soybean |
| South America | Columbia | Coffee |
Table 3.
CFT in livestock type emission assessments by continent.
| Continent | Country | Animal(s) |
|---|---|---|
| North America | United States | Dairy cattle |
| South America | Ecuador | Dairy cattle |
Table 4.
Summary of existing surveys used globally to understand farmer’s perceptions of technology.
Table 4.
Summary of existing surveys used globally to understand farmer’s perceptions of technology.
| Technology Type | Region | Survey Size |
Responder Type |
Data Collection Methods |
Data Analysis Methods |
|---|---|---|---|---|---|
| Precision livestock adoption for dairy [65] |
Italy | 52 | Dairy farmers | Online distribution | Descriptive statistics, Pearson’s correlation |
| Precision livestock adoption for sheep [66] |
England, Wales |
439 | Sheep farmers | Postal distribution | Descriptive analysis, Exploratory factor analysis, Multivariable logistic regression |
| Consumer perceptions of precision livestock [67] |
Europe | 56 | Consumers | Group discussions in Finland, Netherlands, Spain |
Descriptive analysis |
| GHG emissions of smallholder dairy farms [68] |
Kenya | 384 | Dairy farmers | Interviews | Fractional response model |
| Cattle feedlots for climate smart farming [69] |
South Africa |
161 | Cattle farmers | Print-outs distribution | Chi-squared test, Cronbach’s Alpha |
| GHG emissions from Smallholder pig farms [70] |
China | 272 | Pig farmers | Questionnaires in 3 towns |
Emission calculation formulae, ANCOVA |
| Climate change mitigation [71] |
Ethiopia | 25 | Farmers | On-site interview | Mitigation Options Tool (MOT) |
| Technology on poultry farms [72] |
Germany | 53 | Poultry farmers | 3rd-party distributions | Kano Model |
| Technology on livestock farms [73] |
Germany | 98 | Livestock farmers | 3rd-party distributions | Kano Model |
| Precision livestock adoption for dairy [74] |
Ireland | 311 | Dairy farmers | 2018 National Farm Survey |
Multinomial logistic regression, Binomial logistic regression |
Table 5.
Number of responses, mean, and standard deviation for results in the “Current Practices" section of poultry surveys. Mean values show the average reported levels for each practice, while standard deviations reflect how much these levels differ between surveyed poultry farms. Larger deviations, such as for flock size and fuel use, indicate substantial differences in scale and resource consumption among respondents, whereas smaller deviations suggest more uniform practices.
| Category | Responses | Mean | Standard Deviation |
|---|---|---|---|
| Number of birds | 19 | 90018.94 | 178127.15 |
| Feed Per Bird (grams) | 5 | 832.9 | 1296.74 |
| Monthly Fuel (litres) | 11 | 1400.41 | 1406.74 |
| Monthly Electricity (Canadian Dollars) | 7 | 2400 | 1648.38 |
| Monthly Electricity (kWh) | 4 | 9715.50 | 8133.47 |
| Monthly Water Usage (litres) | 11 | 178610.18 | 241021.77 |
Table 6.
Interest in CFT with respect to the province of operation in Atlantic Canadian poultry farming.
Table 6.
Interest in CFT with respect to the province of operation in Atlantic Canadian poultry farming.
| Interested | Unsure | Not Interested | |
|---|---|---|---|
| Newfoundland and Labrador | 1 | 0 | 1 |
| New Brunswick | 3 | 2 | 1 |
| Nova Scotia | 3 | 4 | 5 |
| Prince Edward Island | 0 | 0 | 1 |
| Ontario | 1 | 0 | 0 |
Table 7.
Interest in CFT with respect to the participation in an energy audit in poultry farms.
| Interested | Unsure | Not Interested | |
|---|---|---|---|
| Participated In an Energy Audit | 2 | 0 | 1 |
| Unsure About Participation | 0 | 2 | 0 |
| Did Not Participate In an Energy Audit | 7 | 5 | 6 |
Table 8.
Interest in CFT with respect to the type of poultry farm (according to the bird types).
| Interested | Unsure | Not Interested | |
|---|---|---|---|
| Broiler | 3 | 1 | 5 |
| Layer | 1 | 0 | 0 |
| Combination of Broiler and Layer | 4 | 1 | 3 |
Table 9.
Interest in CFT or similar tools with respect to the number of birds in the poultry farms.
| Interested | Unsure | Not Interested | |
|---|---|---|---|
| Small (Less than 10,000 birds) | 0 | 1 | 1 |
| Medium (Between 10,000 and 50,000 birds) | 3 | 3 | 4 |
| Large (More than 50,000 birds) | 4 | 1 | 3 |
Table 10.
Summary of the government programs supporting adoption of GHG-reducing practices in Atlantic Canadian agriculture.
Table 10.
Summary of the government programs supporting adoption of GHG-reducing practices in Atlantic Canadian agriculture.
| Program and Jurisdiction | Mechanism | Funding Range | Relevance to CFT adoption |
|---|---|---|---|
| Agricultural Clean Technology Program – Adoption Stream (Canada, AAFC) | Cost-share grants for clean tech equipment | $25k–$2M per project (non-repayable; AAFC 40–50% cost share) [80] | Can fund equipment or systems that reduce GHGs (e.g., energy-efficient barn systems, solar). Could support hardware/software needed for CFT data collection. |
| On-Farm Climate Action Fund (OFCAF) (Canada, AAFC via provincial partners) | Direct payments for BMP adoption | Up to $75k–$100k per farm over program [81] | Funds practices like improved nutrient management, cover cropping, and rotational grazing that CFT may recommend; makes GHG-reducing practices financially viable. |
| Advancing Clean Technologies Program (Nova Scotia) | Provincial grant (60% cost-share) for climate-smart farm improvements | 60% of costs up to $150k (tiers by farm income) [82] | Supports GHG-reducing tech in NS (energy efficiency, waste management). Can subsidize tools identified via CFT (e.g., efficient heating, manure handling upgrades). |
| Efficiency NS Agriculture BMP Energy Program (Nova Scotia) | Incentives/rebates for on-farm energy efficiency projects | Varies by project (often 50–75% of project cost) [82] | Helps farms conduct energy audits and upgrade equipment (lighting, cooling, etc.). Aligns with CFT energy module; CFT can quantify GHG savings of efficiency measures. |
| Anaerobic Digester Feasibility Program (New Brunswick) | Funding for feasibility studies (streams for farms and communities) | C$1.5M program budget (covers study costs; per-farm support not specified) [83] | Encourages anaerobic digesters to cut manure-related emissions; if pursued, CFT will capture major emission reductions; program lowers feasibility barrier. |
| Sustainable Canadian Agricultural Partnership (SCAP) – Environmental Programs (Atlantic Provinces, fed–prov) | Various cost-shared BMP programs (provincial delivery) | Typically 40–75% cost-share; caps $50k–$100k depending on province | Broad support for environmental improvements (e.g., PEI resiliency, NB stewardship). Can cover nutrient management plans, precision ag, cover crop seed—measures reflected in CFT. Using CFT as a benchmarking tool can encourage adoption and progress tracking. |
Disclaimer/Publisher’s Note: The statements, opinions and data contained in all publications are solely those of the individual author(s) and contributor(s) and not of MDPI and/or the editor(s). MDPI and/or the editor(s) disclaim responsibility for any injury to people or property resulting from any ideas, methods, instructions or products referred to in the content. |
© 2025 by the authors. Licensee MDPI, Basel, Switzerland. This article is an open access article distributed under the terms and conditions of the Creative Commons Attribution (CC BY) license (http://creativecommons.org/licenses/by/4.0/).
Copyright: This open access article is published under a Creative Commons CC BY 4.0 license, which permit the free download, distribution, and reuse, provided that the author and preprint are cited in any reuse.


